Chehalis Basin Strategy - Wa
74
Chehalis Basin Strategy Policy Workshop Water Retention May 22, 2014
Transcript of Chehalis Basin Strategy - Wa
Chehalis Basin Strategy
Policy Workshop Water Retention May 22, 2014
2
Dam Structure Options Selected for further Evaluation
• Flood Retention RCC* Dam (FR-RCC) • Multipurpose RCC Dam (MP-RCC) • Multi-purpose Rockfill Dam (MP-Rockfill)
*Roller Compacted Concrete (RCC)
5/21/2014
Dam Alternatives Overview
4
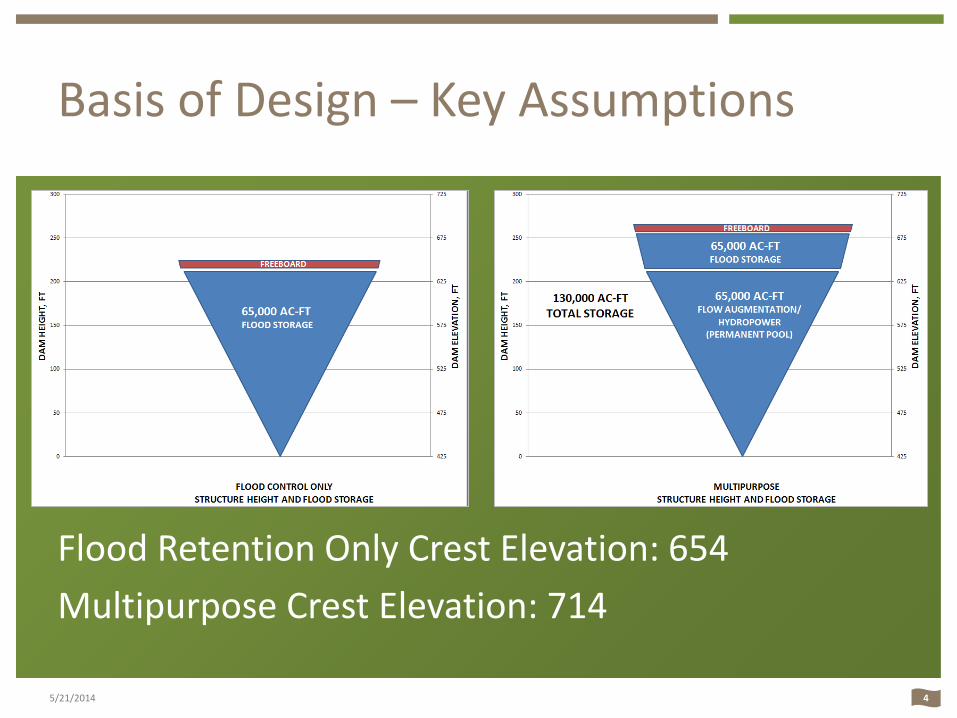
Basis of Design – Key Assumptions
Flood Retention Only Crest Elevation: 654 Multipurpose Crest Elevation: 714
5/21/2014
5
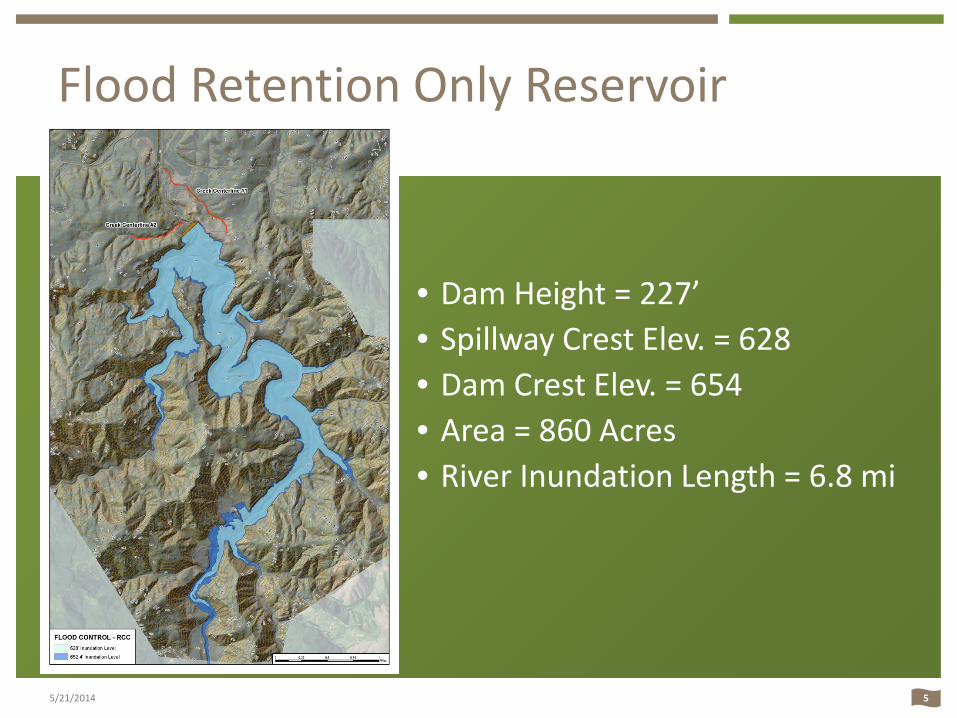
Flood Retention Only Reservoir
5/21/2014
• Dam Height = 227’ • Spillway Crest Elev. = 628 • Dam Crest Elev. = 654 • Area = 860 Acres • River Inundation Length = 6.8 mi
6
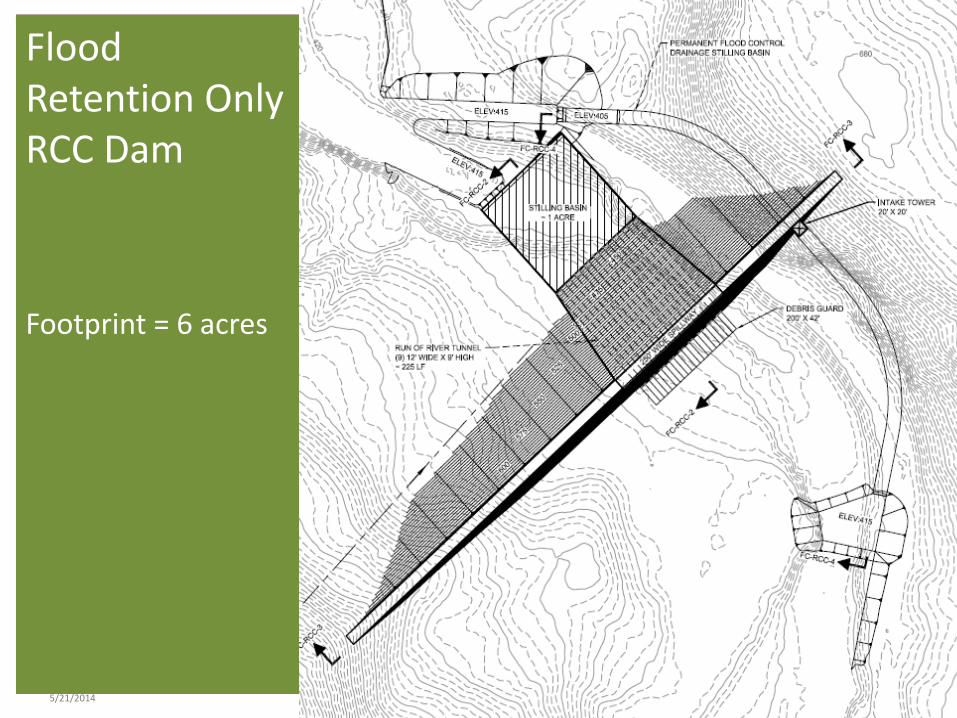
Flood Retention Only RCC Dam Footprint = 6 acres
5/21/2014
7
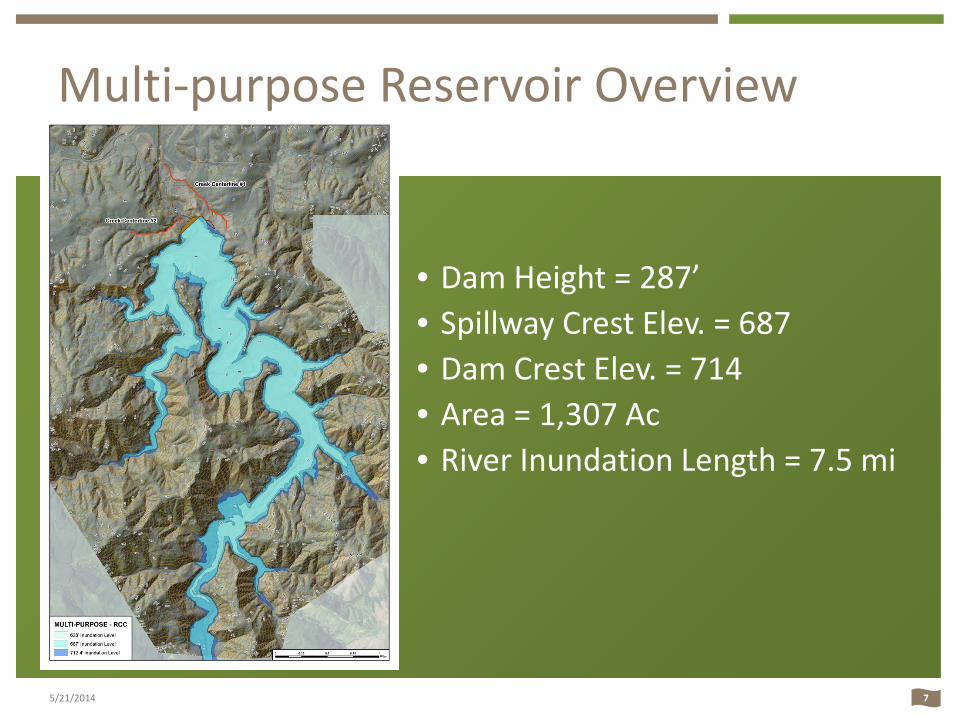
Multi-purpose Reservoir Overview
5/21/2014
• Dam Height = 287’ • Spillway Crest Elev. = 687 • Dam Crest Elev. = 714 • Area = 1,307 Ac • River Inundation Length = 7.5 mi
8
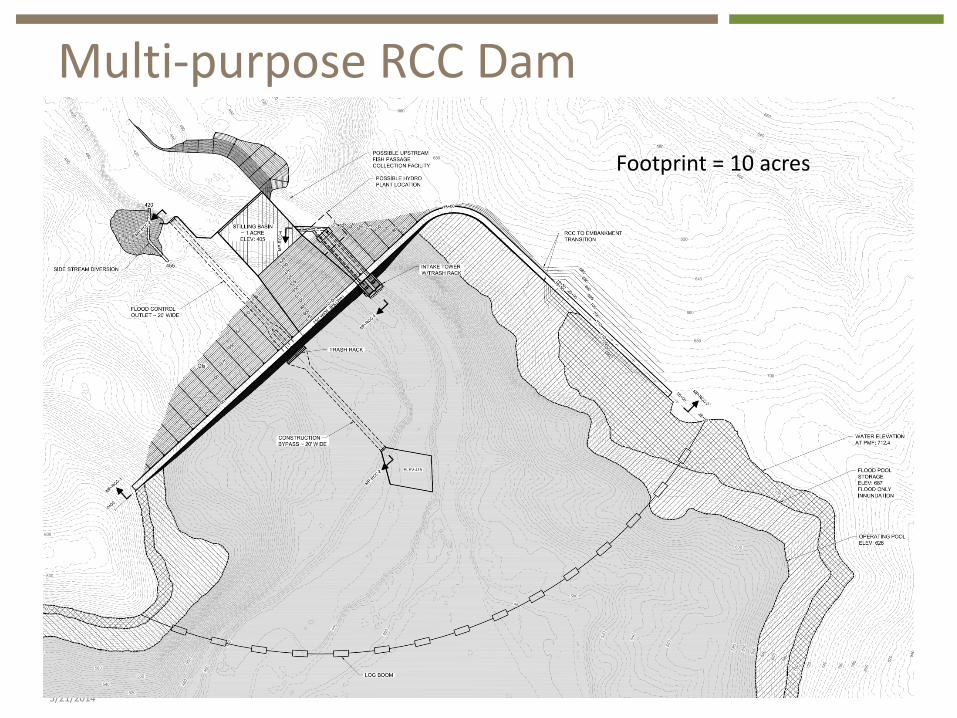
Multi-purpose RCC Dam
5/21/2014
Footprint = 10 acres
9
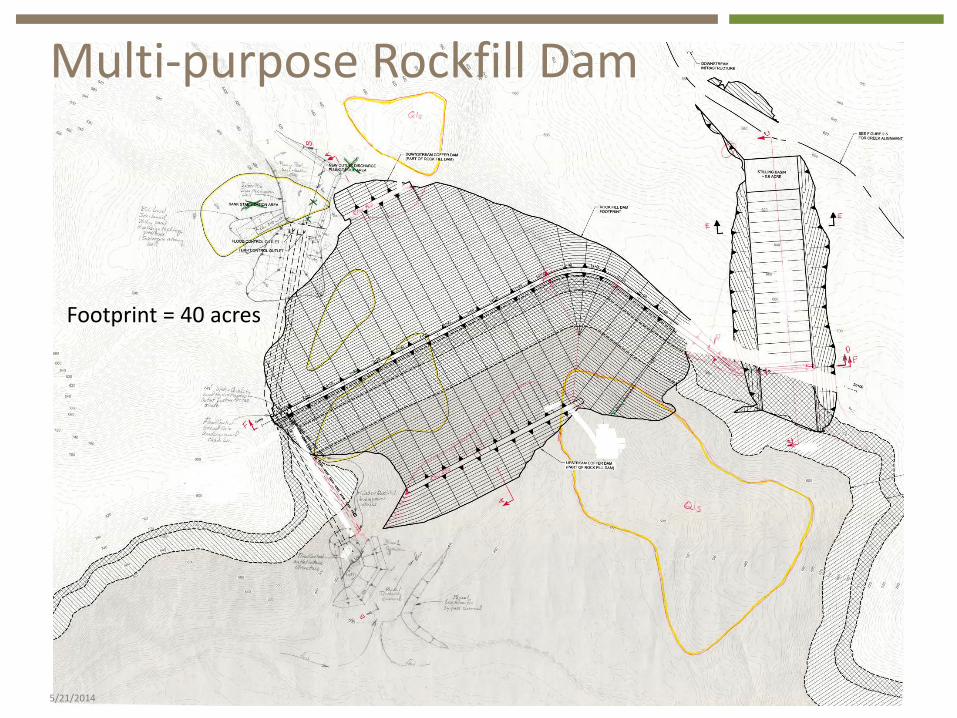
Multi-purpose Rockfill Dam
5/21/2014
Footprint = 40 acres
10
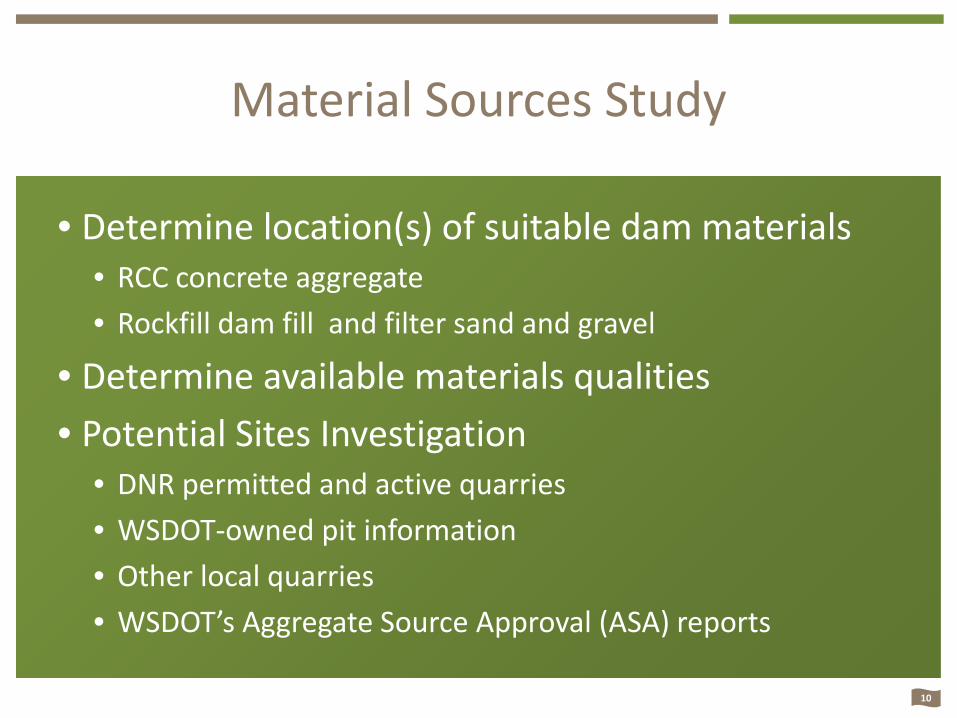
Material Sources Study
• Determine location(s) of suitable dam materials • RCC concrete aggregate • Rockfill dam fill and filter sand and gravel
• Determine available materials qualities • Potential Sites Investigation
• DNR permitted and active quarries • WSDOT-owned pit information • Other local quarries • WSDOT’s Aggregate Source Approval (ASA) reports
Fish Passage Options
5/21/2014
12 5/21/2014
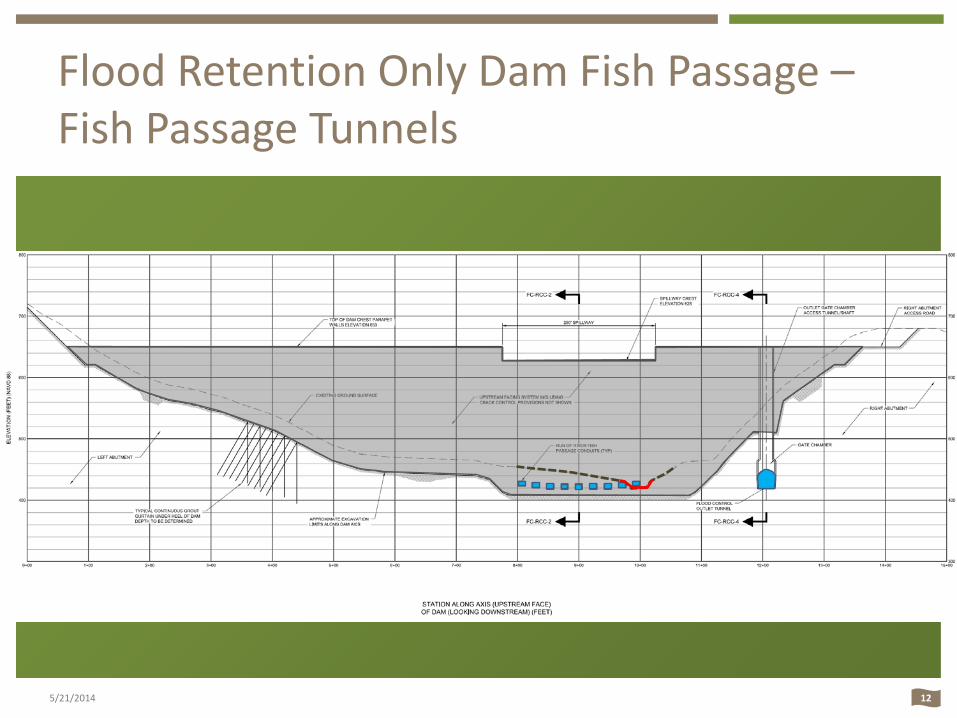
Flood Retention Only Dam Fish Passage – Fish Passage Tunnels
13
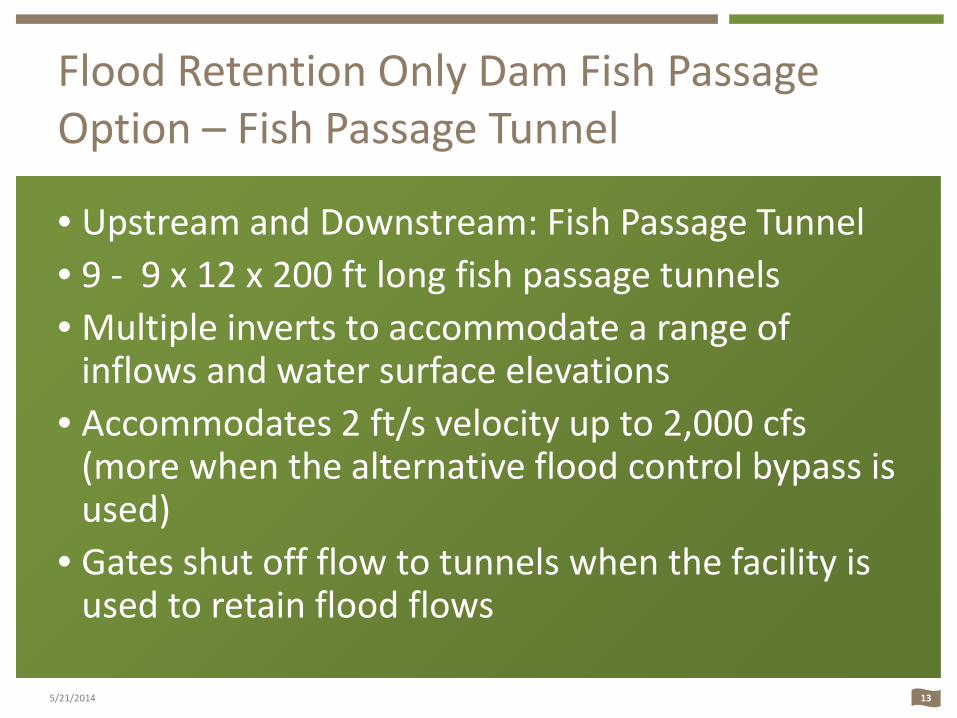
Flood Retention Only Dam Fish Passage Option – Fish Passage Tunnel
• Upstream and Downstream: Fish Passage Tunnel • 9 - 9 x 12 x 200 ft long fish passage tunnels • Multiple inverts to accommodate a range of
inflows and water surface elevations • Accommodates 2 ft/s velocity up to 2,000 cfs
(more when the alternative flood control bypass is used)
• Gates shut off flow to tunnels when the facility is used to retain flood flows
5/21/2014
14
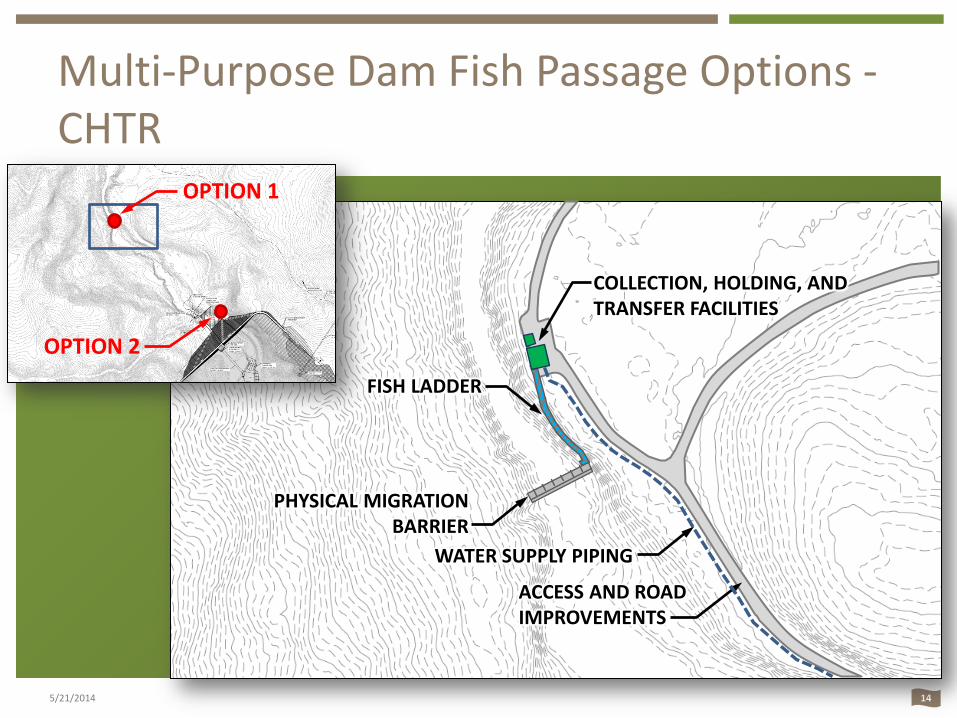
Multi-Purpose Dam Fish Passage Options - CHTR
5/21/2014
OPTION 1
OPTION 2
PHYSICAL MIGRATION BARRIER
FISH LADDER
COLLECTION, HOLDING, AND TRANSFER FACILITIES
ACCESS AND ROAD IMPROVEMENTS
WATER SUPPLY PIPING
15
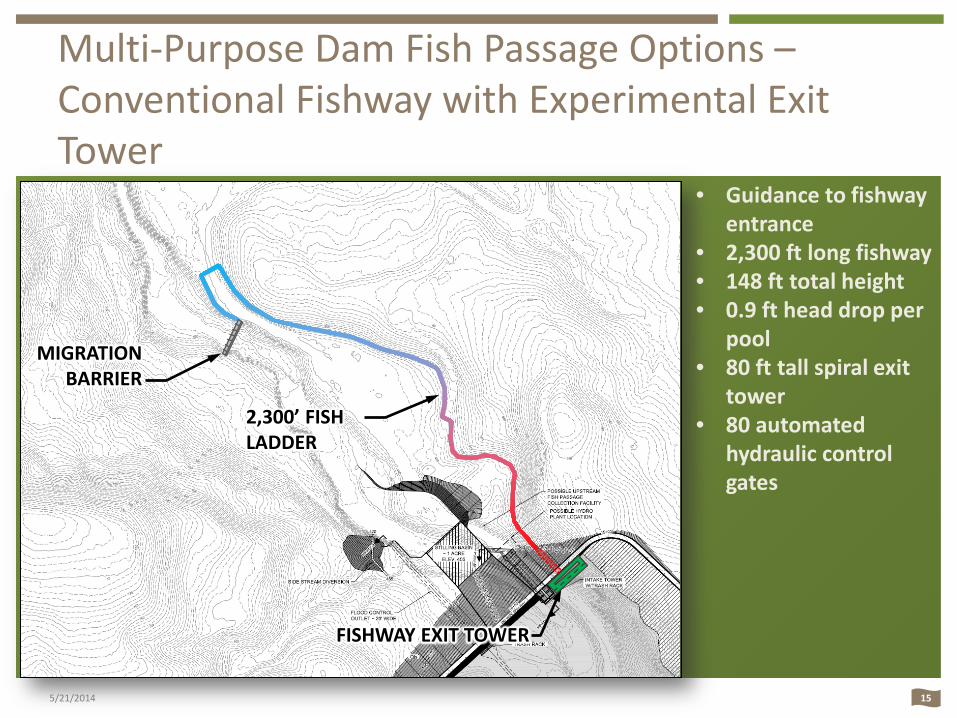
Multi-Purpose Dam Fish Passage Options – Conventional Fishway with Experimental Exit Tower
5/21/2014
2,300’ FISH LADDER
MIGRATION BARRIER
FISHWAY EXIT TOWER
• Guidance to fishway entrance
• 2,300 ft long fishway • 148 ft total height • 0.9 ft head drop per
pool • 80 ft tall spiral exit
tower • 80 automated
hydraulic control gates
16
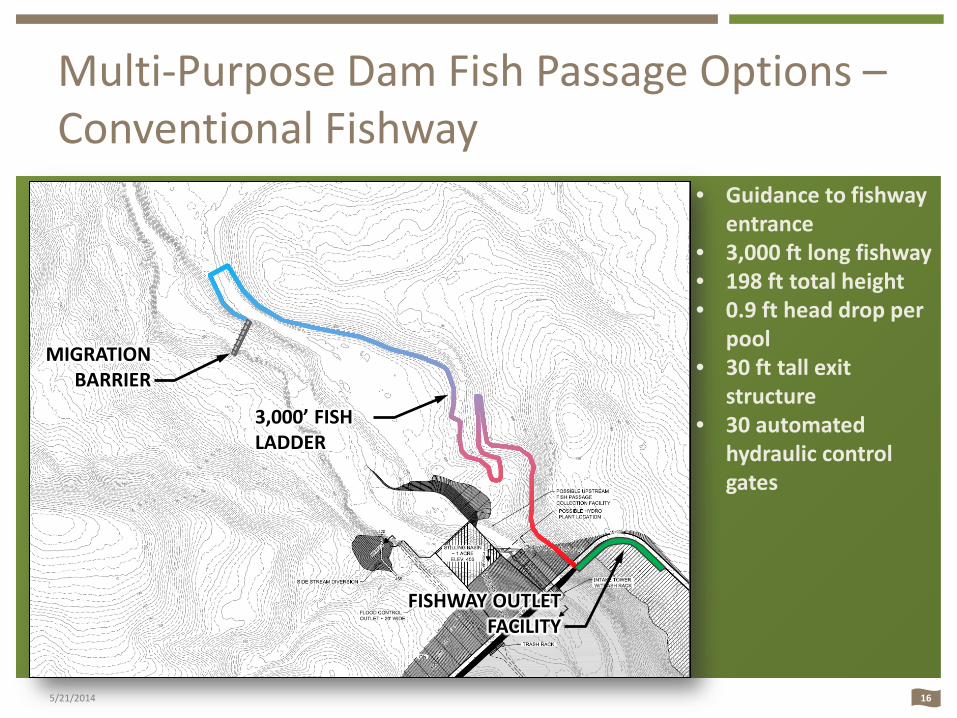
Multi-Purpose Dam Fish Passage Options – Conventional Fishway
5/21/2014
3,000’ FISH LADDER
MIGRATION BARRIER
FISHWAY OUTLET FACILITY
• Guidance to fishway entrance
• 3,000 ft long fishway • 198 ft total height • 0.9 ft head drop per
pool • 30 ft tall exit
structure • 30 automated
hydraulic control gates
17
Multi-Purpose Dam Fish Passage Options – Head of Reservoir Combination Collection Facilities
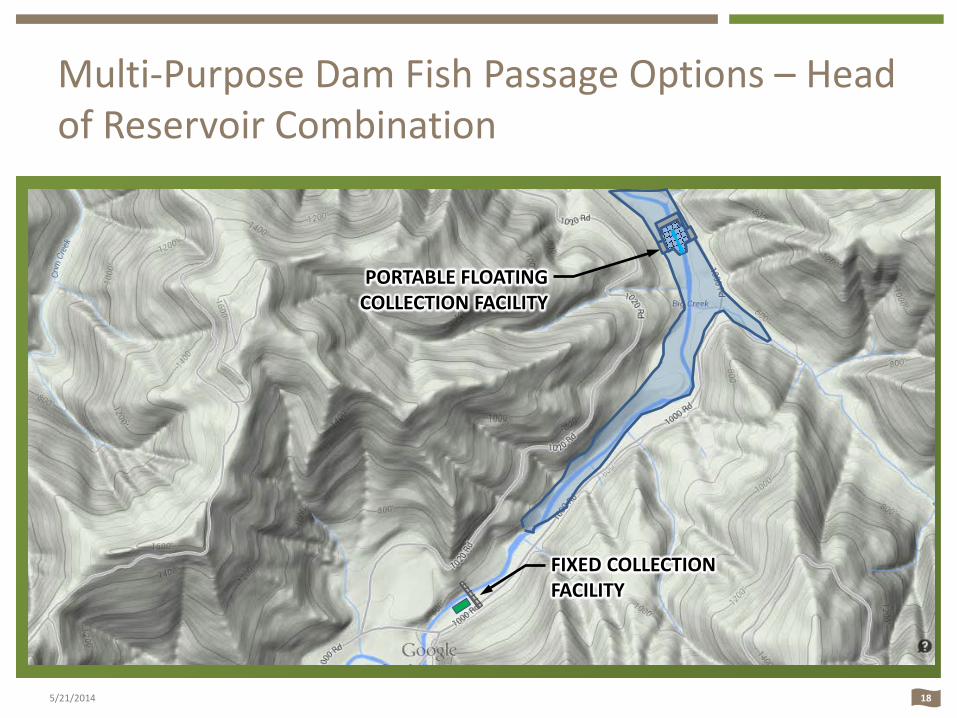
• Downstream 1: Head of Reservoir Floating Collector and Fixed In-Stream Collection Facility
• Small portable floating collector at head of reservoir
• Fixed collection facility on main stem • The combination of collection facilities
accommodates a wider range of species over a wider flow regime
• Access and road improvements
5/21/2014
18
Multi-Purpose Dam Fish Passage Options – Head of Reservoir Combination
5/21/2014
FIXED COLLECTION FACILITY
PORTABLE FLOATING COLLECTION FACILITY
19
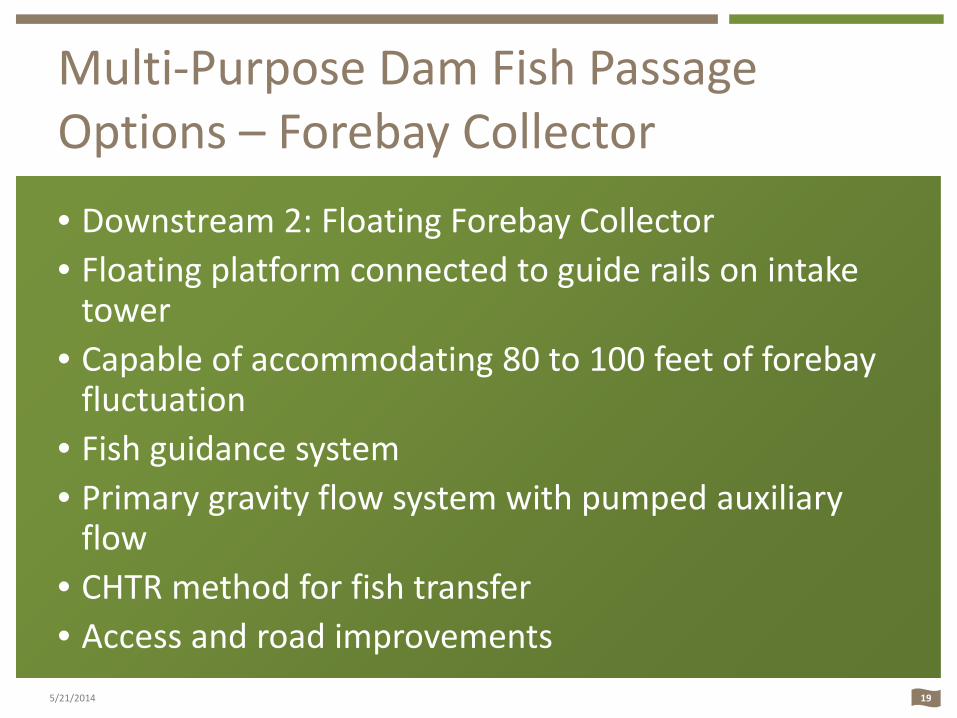
Multi-Purpose Dam Fish Passage Options – Forebay Collector
• Downstream 2: Floating Forebay Collector • Floating platform connected to guide rails on intake
tower • Capable of accommodating 80 to 100 feet of forebay
fluctuation • Fish guidance system • Primary gravity flow system with pumped auxiliary
flow • CHTR method for fish transfer • Access and road improvements
5/21/2014
20
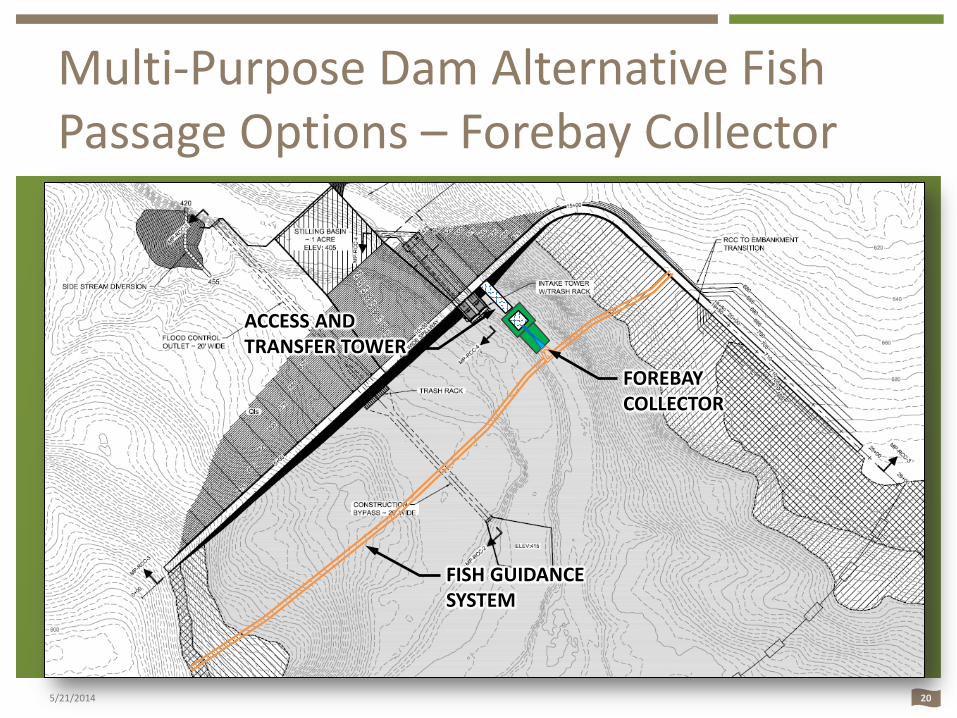
Multi-Purpose Dam Alternative Fish Passage Options – Forebay Collector
5/21/2014
FISH GUIDANCE SYSTEM
FOREBAY COLLECTOR
ACCESS AND TRANSFER TOWER

Operations of Dam
5/21/2014
22
Operational Considerations
• Provide flood reduction in downstream areas • Preserve geomorphic processes downstream • Maintain slope stability in reservoir • Keep rate of change in flows downstream within
accepted limits to minimize fish stranding • Store water during winter and release during
summer for fisheries and water quality enhancement (Multi-purpose Alternative)
5/21/2014
23
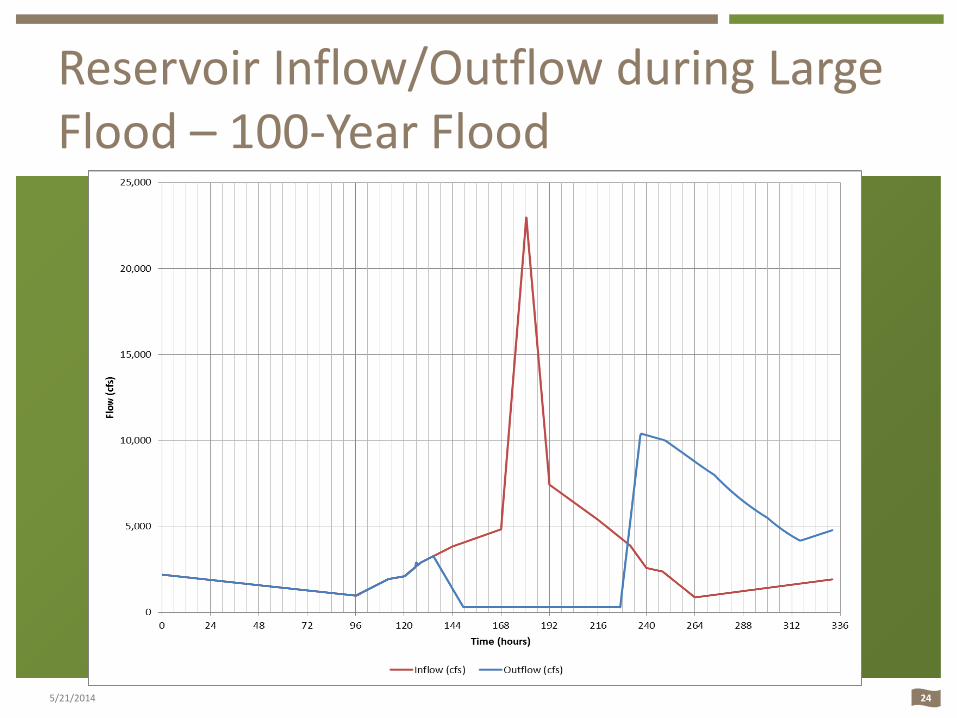
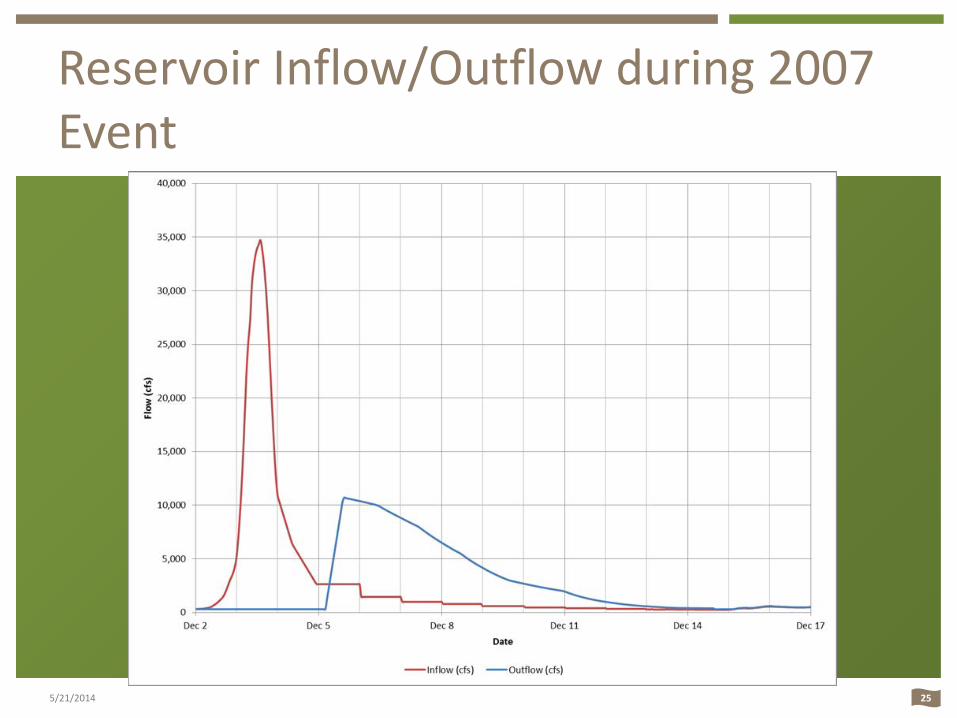
Proposed Operating Rules – Flood Retention Only • Available flood storage capacity = 65,000 acre-feet • Operate the facility without impounding water except during a
potentially damaging flood • Begin storing when Grand Mound flows are predicted to be
above the “Major Flood” (38,800 cfs) within 48 hours • Reduce reservoir outflow at a rate of 200 cfs/hr until reaching
300 cfs • Two days after dropping below flood stage, increase outflow at
a rate of 1,000 cfs per hour, but less than 30 feet per day • Drawdown rate may be reduced to allow for debris removal
5/21/2014
24
Reservoir Inflow/Outflow during Large Flood – 100-Year Flood
5/21/2014
25
Reservoir Inflow/Outflow during 2007 Event
5/21/2014
26
Operating Rules – Multi-purpose
• The Multi-Purpose facility would have a conservation pool of 65,000 acre-feet and a flood storage pool also with 65,000 acre-foot capacity. The conservation pool would be utilized to provide instream flows during period of low flow (typically summer). The flood storage pool would capture high flows to reduce downstream flooding.
5/21/2014
27
Operating Rules – Multi-purpose
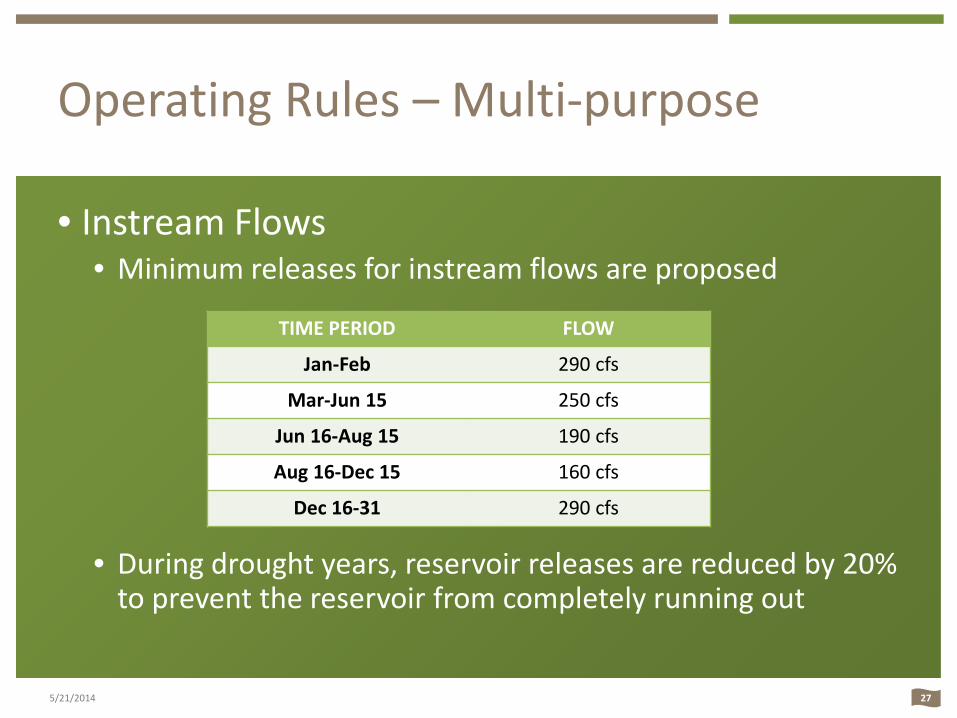
• Instream Flows • Minimum releases for instream flows are proposed
• During drought years, reservoir releases are reduced by 20% to prevent the reservoir from completely running out
5/21/2014
TIME PERIOD FLOW
Jan-Feb 290 cfs
Mar-Jun 15 250 cfs
Jun 16-Aug 15 190 cfs
Aug 16-Dec 15 160 cfs
Dec 16-31 290 cfs
28
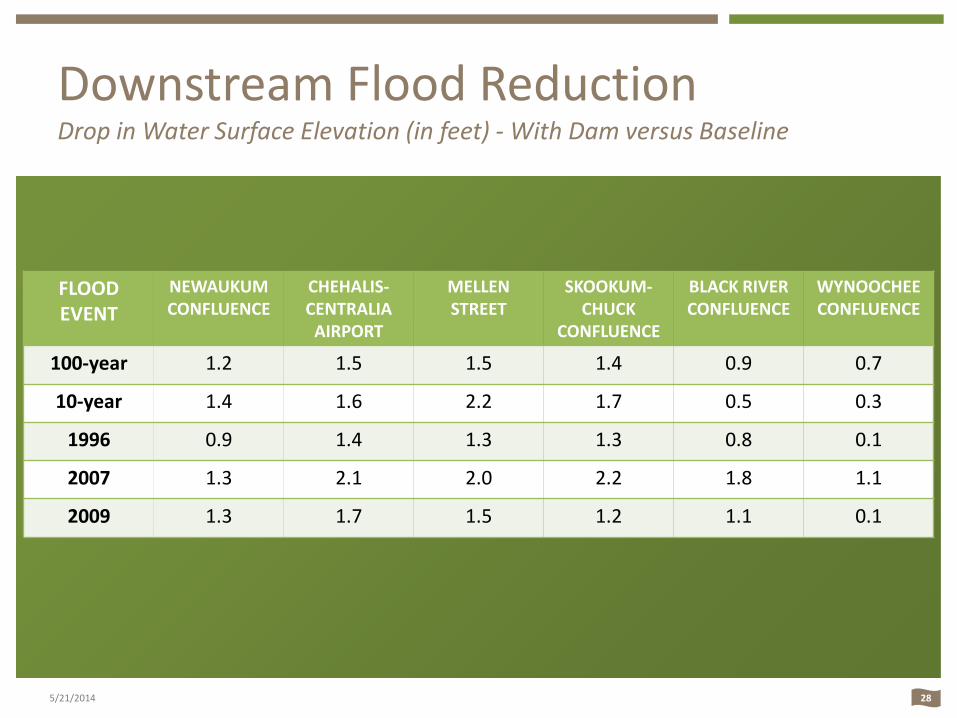
Downstream Flood Reduction Drop in Water Surface Elevation (in feet) - With Dam versus Baseline
FLOOD EVENT
NEWAUKUM CONFLUENCE
CHEHALIS-CENTRALIA
AIRPORT
MELLEN STREET
SKOOKUM-CHUCK
CONFLUENCE
BLACK RIVER CONFLUENCE
WYNOOCHEE CONFLUENCE
100-year 1.2 1.5 1.5 1.4 0.9 0.7
10-year 1.4 1.6 2.2 1.7 0.5 0.3
1996 0.9 1.4 1.3 1.3 0.8 0.1
2007 1.3 2.1 2.0 2.2 1.8 1.1
2009 1.3 1.7 1.5 1.2 1.1 0.1
5/21/2014
29
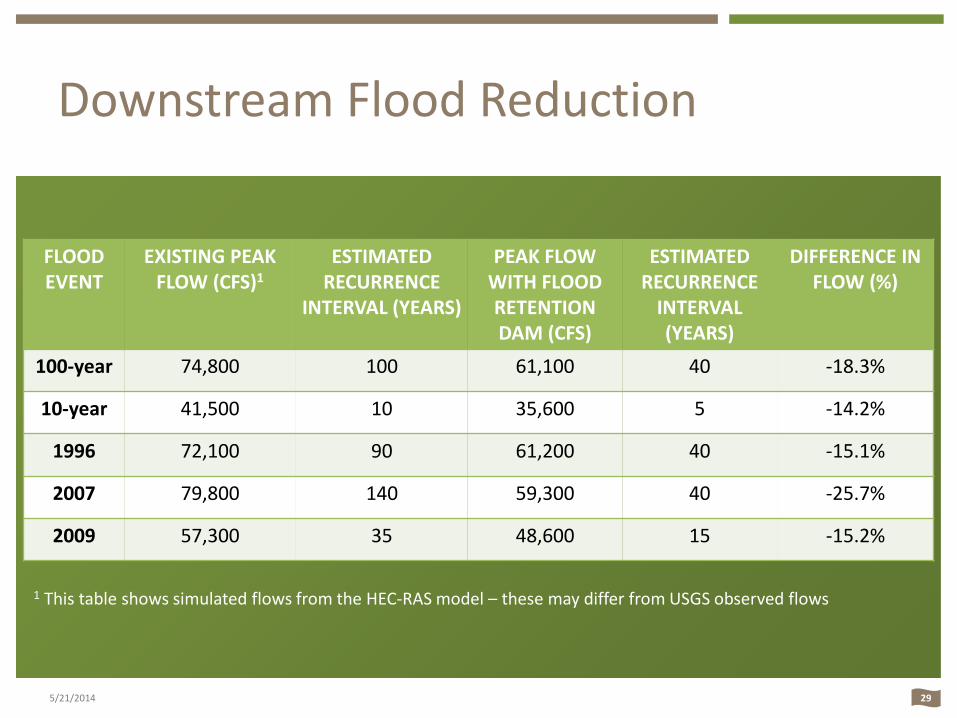
Downstream Flood Reduction
FLOOD EVENT
EXISTING PEAK FLOW (CFS)1
ESTIMATED RECURRENCE
INTERVAL (YEARS)
PEAK FLOW WITH FLOOD RETENTION DAM (CFS)
ESTIMATED RECURRENCE
INTERVAL (YEARS)
DIFFERENCE IN FLOW (%)
100-year 74,800 100 61,100 40 -18.3%
10-year 41,500 10 35,600 5 -14.2%
1996 72,100 90 61,200 40 -15.1%
2007 79,800 140 59,300 40 -25.7%
2009 57,300 35 48,600 15 -15.2%
5/21/2014
1 This table shows simulated flows from the HEC-RAS model – these may differ from USGS observed flows
30
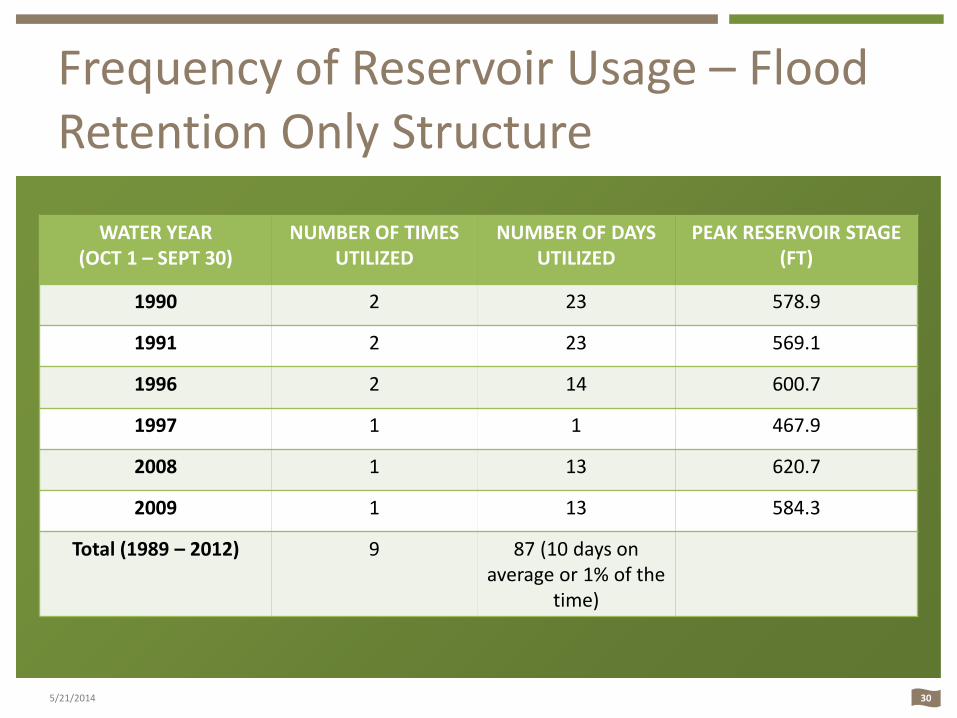
Frequency of Reservoir Usage – Flood Retention Only Structure
WATER YEAR (OCT 1 – SEPT 30)
NUMBER OF TIMES UTILIZED
NUMBER OF DAYS UTILIZED
PEAK RESERVOIR STAGE (FT)
1990 2 23 578.9
1991 2 23 569.1
1996 2 14 600.7
1997 1 1 467.9
2008 1 13 620.7
2009 1 13 584.3
Total (1989 – 2012) 9 87 (10 days on average or 1% of the
time)
5/21/2014
31
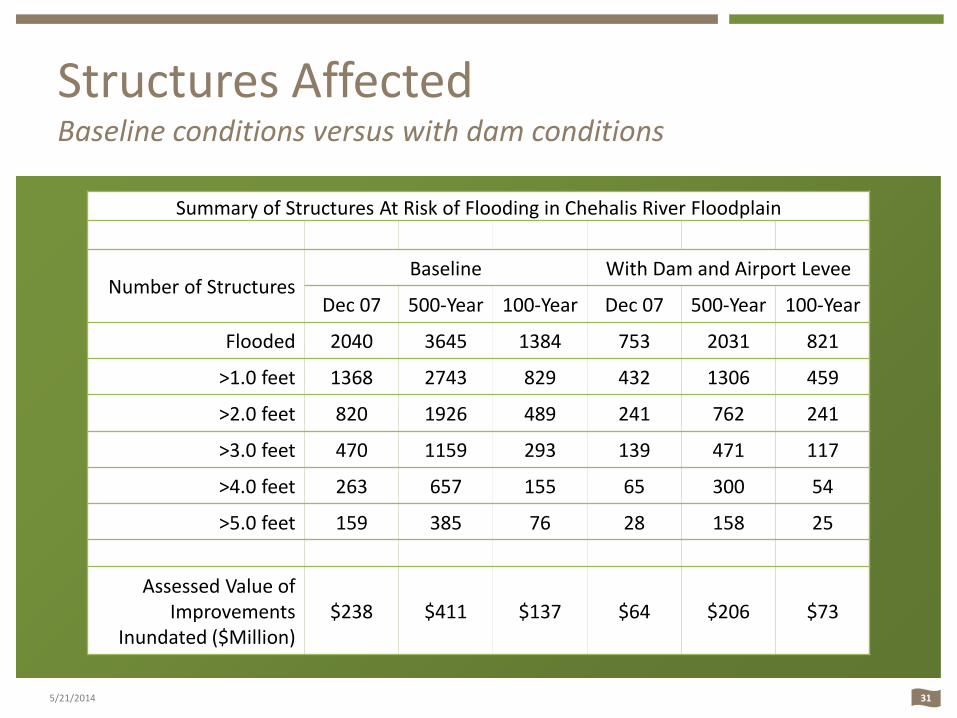
Structures Affected Baseline conditions versus with dam conditions
5/21/2014
Summary of Structures At Risk of Flooding in Chehalis River Floodplain
Number of Structures Baseline With Dam and Airport Levee
Dec 07 500-Year 100-Year Dec 07 500-Year 100-Year
Flooded 2040 3645 1384 753 2031 821
>1.0 feet 1368 2743 829 432 1306 459
>2.0 feet 820 1926 489 241 762 241
>3.0 feet 470 1159 293 139 471 117
>4.0 feet 263 657 155 65 300 54
>5.0 feet 159 385 76 28 158 25
Assessed Value of Improvements
Inundated ($Million) $238 $411 $137 $64 $206 $73
32
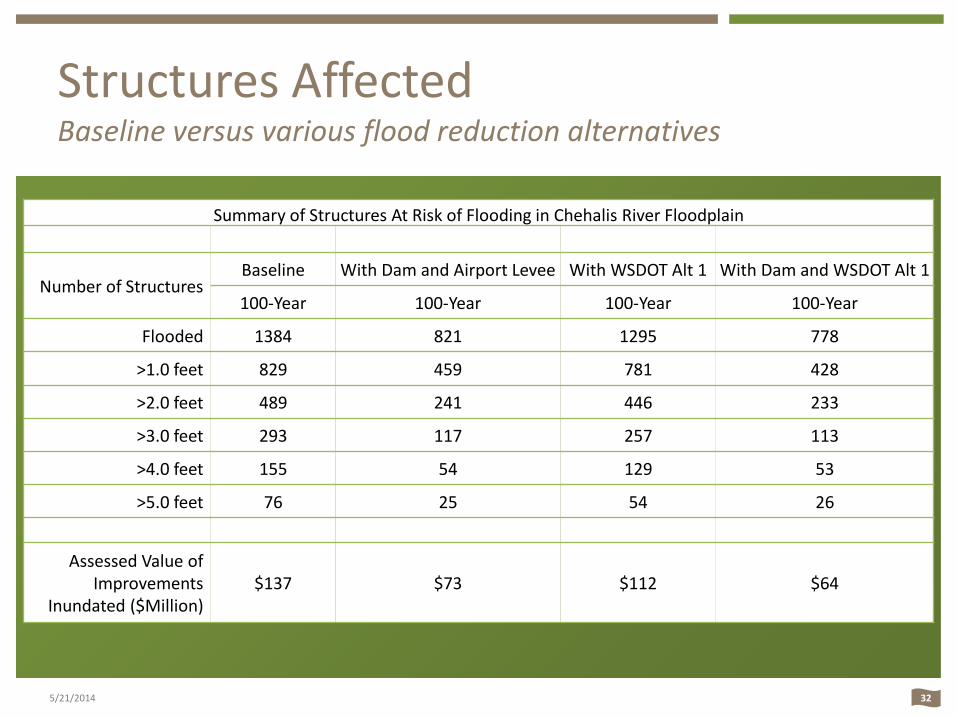
Structures Affected Baseline versus various flood reduction alternatives
5/21/2014
Summary of Structures At Risk of Flooding in Chehalis River Floodplain
Number of Structures Baseline With Dam and Airport Levee With WSDOT Alt 1 With Dam and WSDOT Alt 1
100-Year 100-Year 100-Year 100-Year
Flooded 1384 821 1295 778
>1.0 feet 829 459 781 428
>2.0 feet 489 241 446 233
>3.0 feet 293 117 257 113
>4.0 feet 155 54 129 53
>5.0 feet 76 25 54 26
Assessed Value of Improvements
Inundated ($Million) $137 $73 $112 $64
33
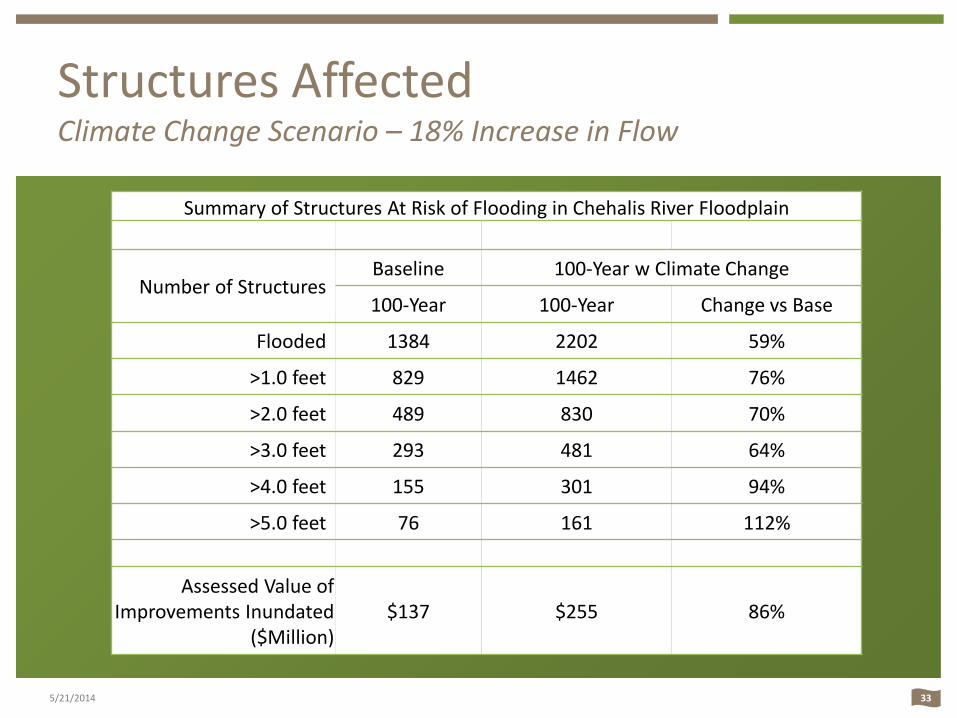
Structures Affected Climate Change Scenario – 18% Increase in Flow
5/21/2014
Summary of Structures At Risk of Flooding in Chehalis River Floodplain
Number of Structures Baseline 100-Year w Climate Change
100-Year 100-Year Change vs Base
Flooded 1384 2202 59%
>1.0 feet 829 1462 76%
>2.0 feet 489 830 70%
>3.0 feet 293 481 64%
>4.0 feet 155 301 94%
>5.0 feet 76 161 112%
Assessed Value of Improvements Inundated
($Million) $137 $255 86%
34
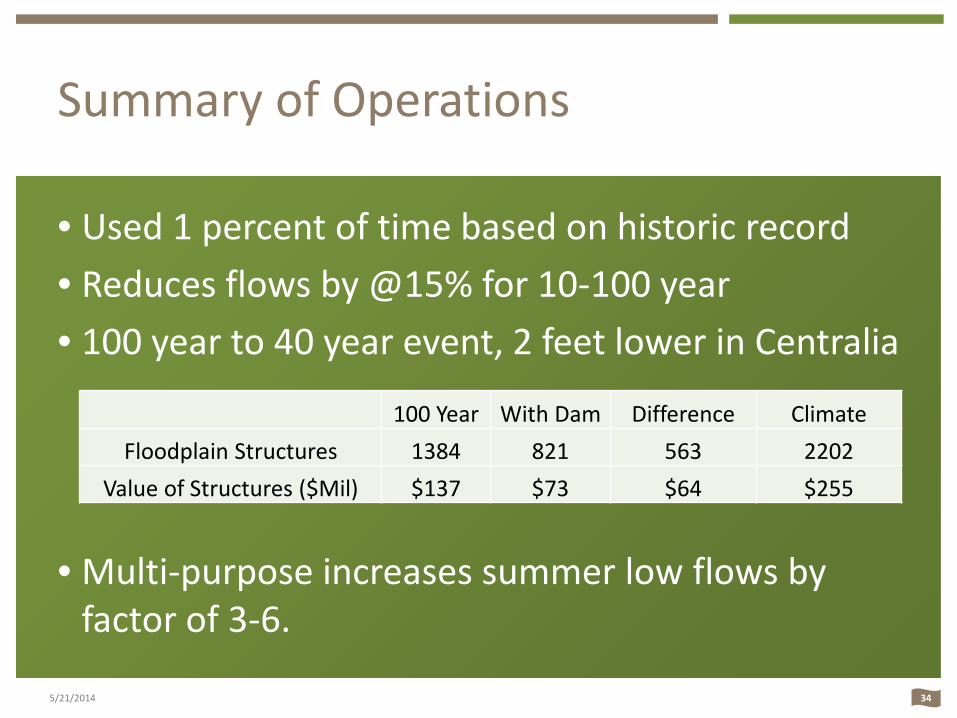
Summary of Operations
• Used 1 percent of time based on historic record • Reduces flows by @15% for 10-100 year • 100 year to 40 year event, 2 feet lower in Centralia
• Multi-purpose increases summer low flows by factor of 3-6.
5/21/2014
100 Year With Dam Difference Climate Floodplain Structures 1384 821 563 2202
Value of Structures ($Mil) $137 $73 $64 $255

35
Highway Flooding Interstate 5, SR 6, US 12
Interstate 5 • Flooded up to 5 days in 100-year event, maximum depth +10 feet • Flooded less than 1 day with dam/airport levee, maximum depth 1 foot • Remaining flooding in 100-year event along Dillenbaugh Creek
Highway 6 • Flooded up to 14 hours at a 10-year recurrence level • With dam, flooding reduced to 10 hours at a 20-year recurrence
Highway 12 • Flooded by Chehalis backwater, one to seven days in 100-year event • With dam flood levels reduced by 0.75 feet, duration of flooding reduced
5/21/2014
Hydropower
37
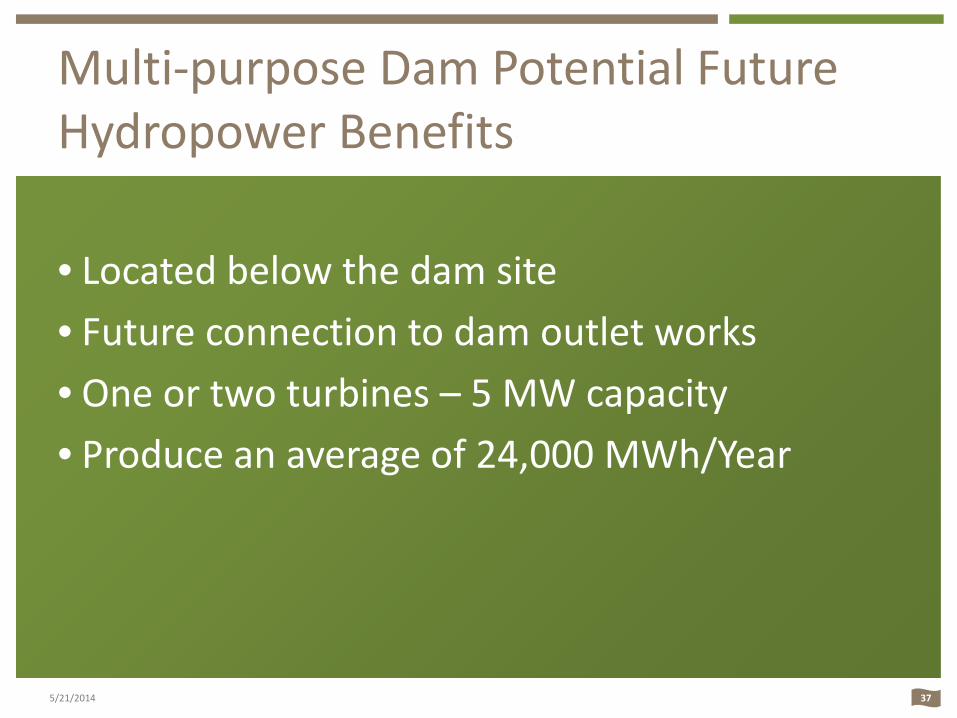
Multi-purpose Dam Potential Future Hydropower Benefits
• Located below the dam site • Future connection to dam outlet works • One or two turbines – 5 MW capacity • Produce an average of 24,000 MWh/Year
5/21/2014
Costs of Water Retention Structures
39
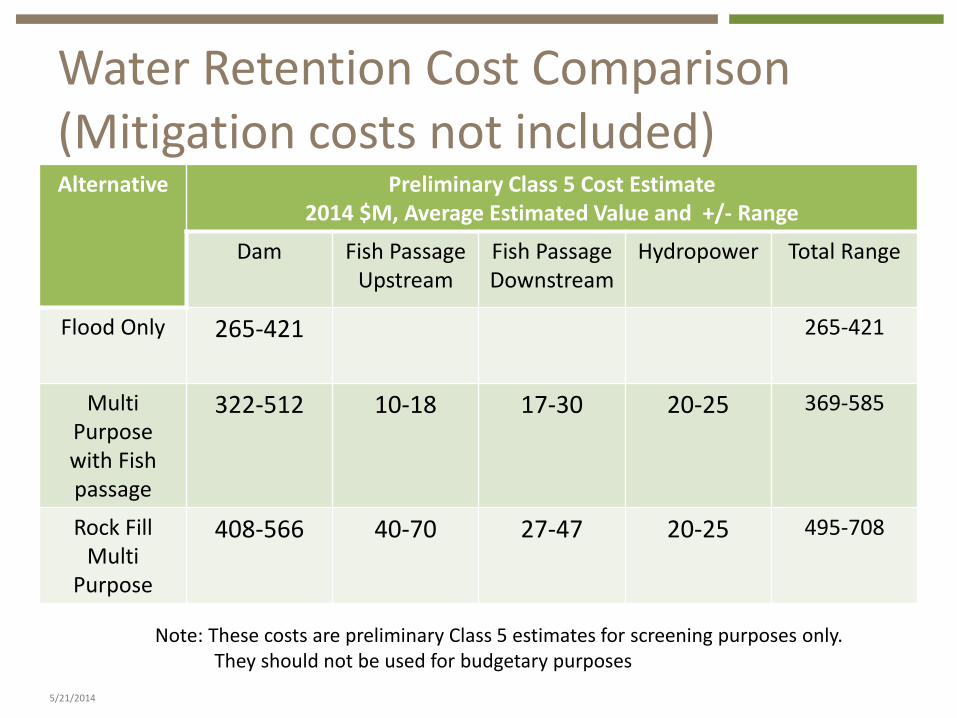
Water Retention Cost Comparison (Mitigation costs not included)
5/21/2014
Alternative Preliminary Class 5 Cost Estimate 2014 $M, Average Estimated Value and +/- Range
Dam Fish Passage Upstream
Fish Passage Downstream
Hydropower Total Range
Flood Only 265-421 265-421
Multi Purpose with Fish passage
322-512 10-18 17-30 20-25 369-585
Rock Fill Multi
Purpose
408-566 40-70 27-47 20-25 495-708
Note: These costs are preliminary Class 5 estimates for screening purposes only. They should not be used for budgetary purposes
Slope Stability and Vegetation and Debris Management
41
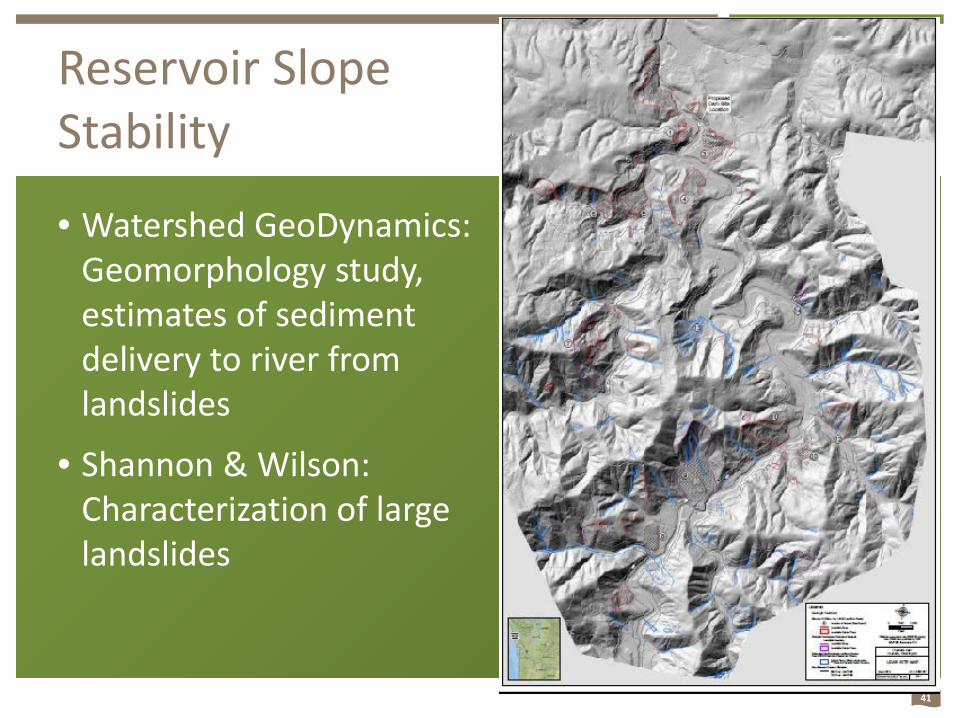
Reservoir Slope Stability
• Watershed GeoDynamics: Geomorphology study, estimates of sediment delivery to river from landslides
• Shannon & Wilson: Characterization of large landslides
42
Mud Mountain Dam – Vegetation Mgt
5/21/2014
43
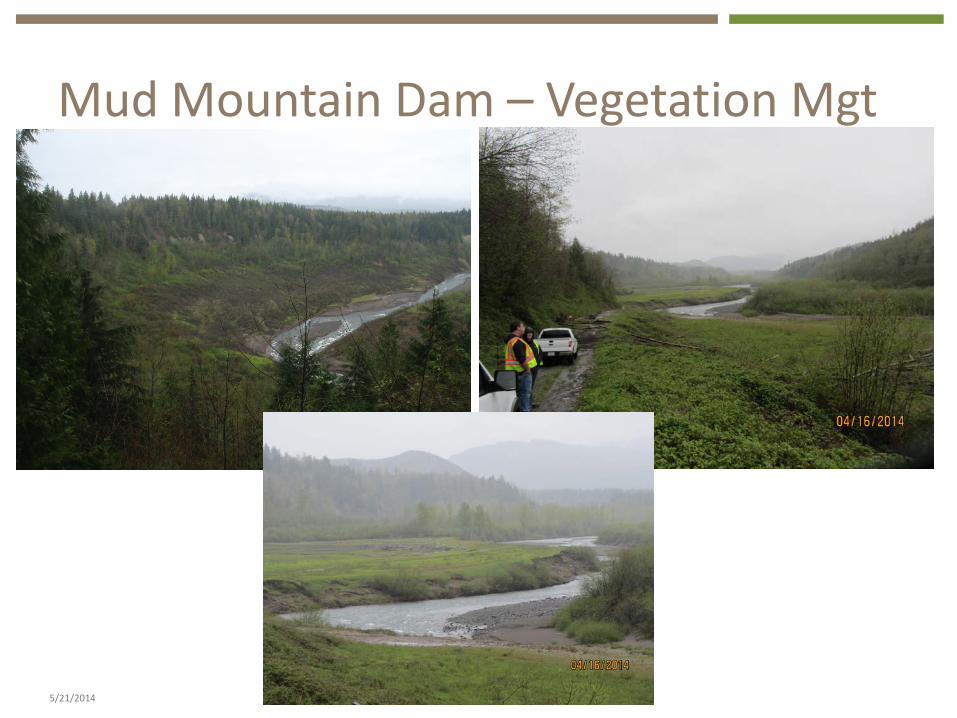
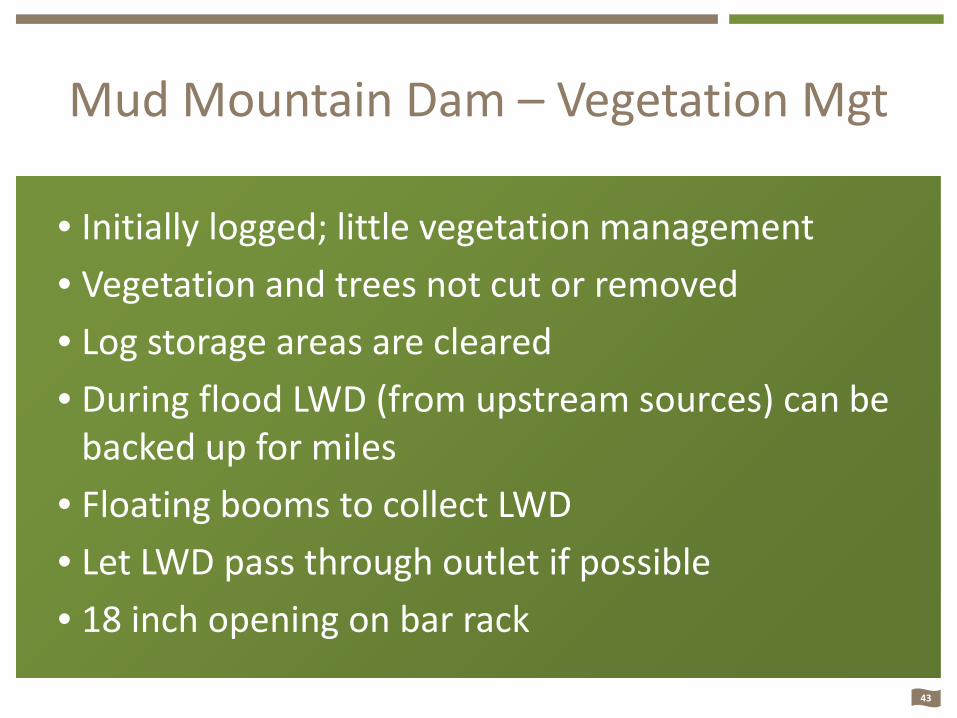
Mud Mountain Dam – Vegetation Mgt
• Initially logged; little vegetation management • Vegetation and trees not cut or removed • Log storage areas are cleared • During flood LWD (from upstream sources) can be
backed up for miles • Floating booms to collect LWD • Let LWD pass through outlet if possible • 18 inch opening on bar rack
44
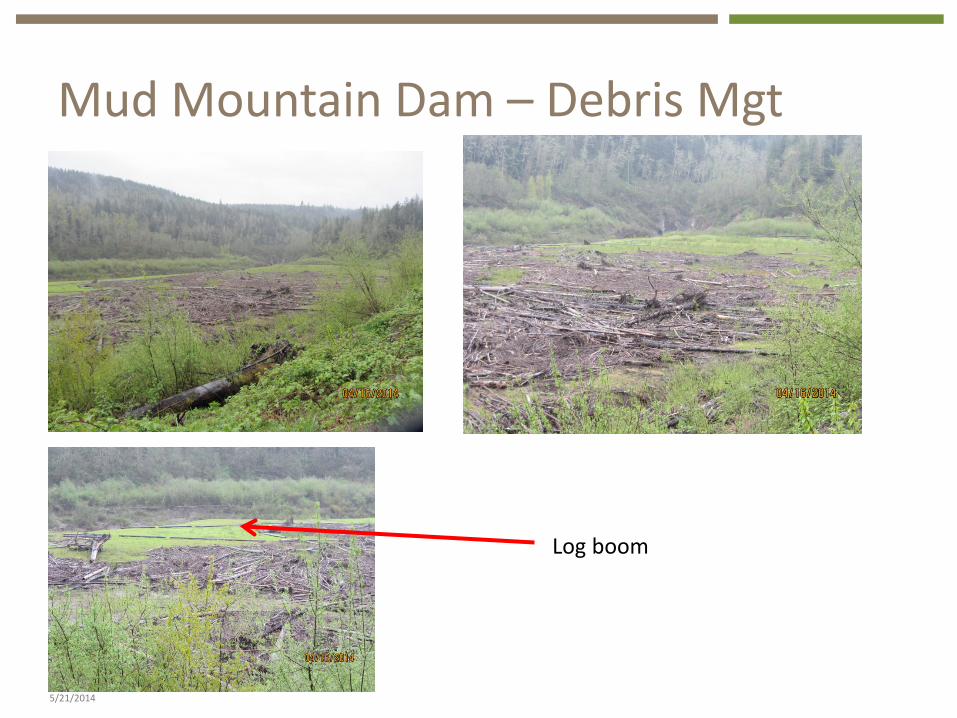
Mud Mountain Dam – Debris Mgt
5/21/2014
Log boom
45
Mud Mountain Dam – Debris Mgt
• Lowering pool may be delayed following flood events that deliver large amounts of LWD
• LWD is made available to various stakeholders • Excess LWD temporarily stored in reservoir • Use boats to gather and haul LWD to storage areas • USACE developing management plan to address
LWD management, including disposal
46
Mud Mountain Dam – Sediment Mgt
47
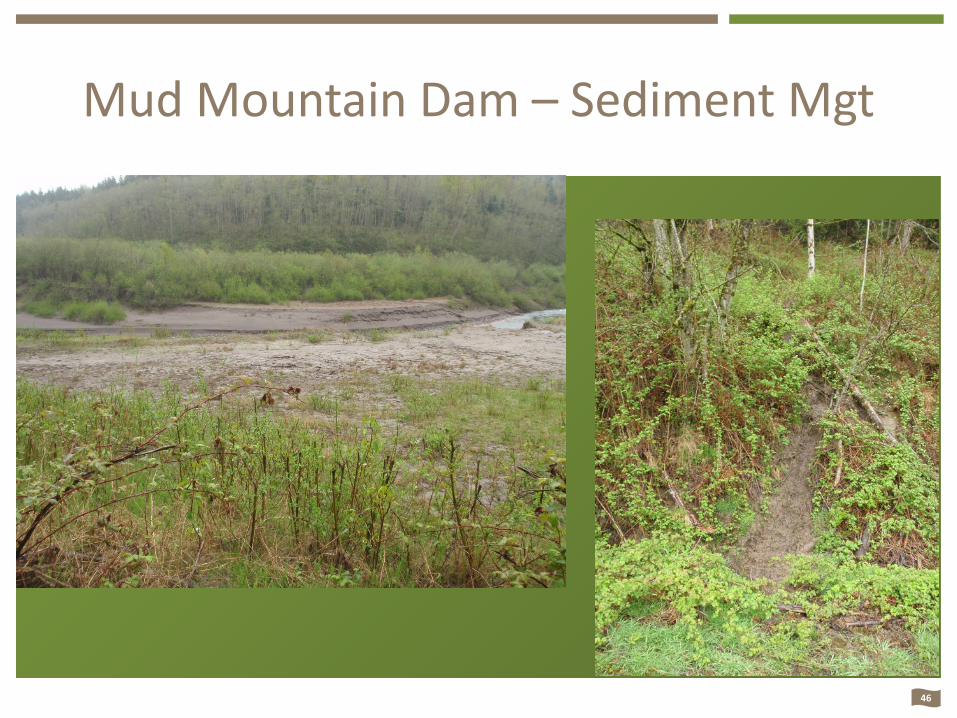
Mud Mountain Dam – Sediment Mgt
• Soil, gravel, cobbles, and boulders flushed through low elevation tunnel through dam
• Recently, USACE passing additional flow through higher tunnel to facilitate downstream fish passage
• Material carried through tunnel damages steel liner
48
Howard Hanson Dam
• Multi-purpose dam • Flood
• Summer stream augmentation
• Ecosystem restoration
• Drinking Water (City of Tacoma)
• Pool increase starting Feb., maintained in summer
• Never overtopped spillway
49
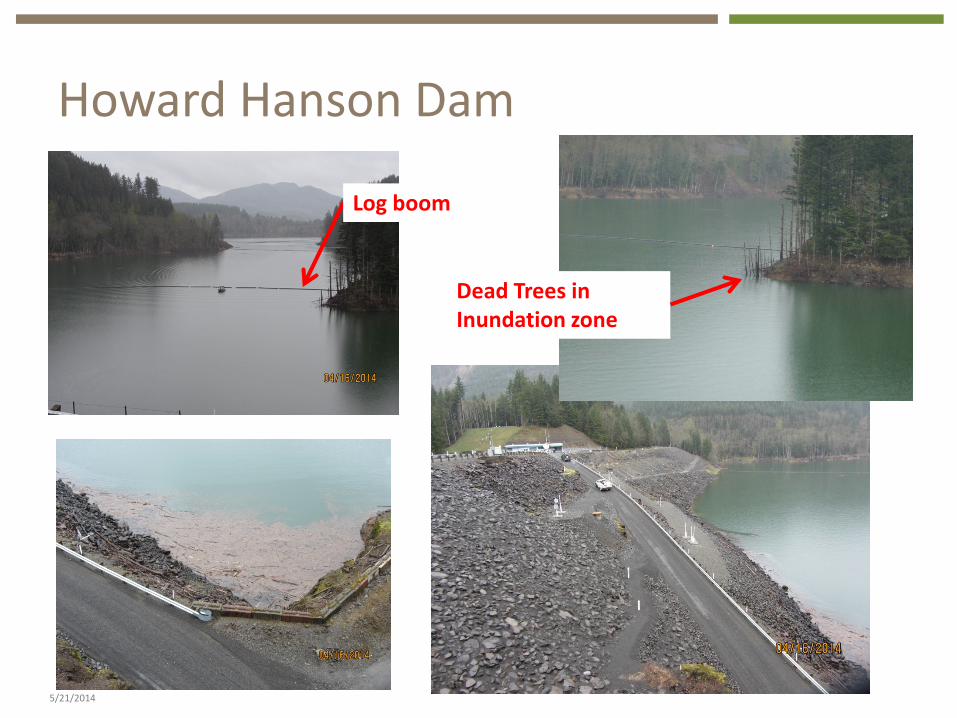
Howard Hanson Dam
5/21/2014
Log boom
Dead Trees in Inundation zone
50
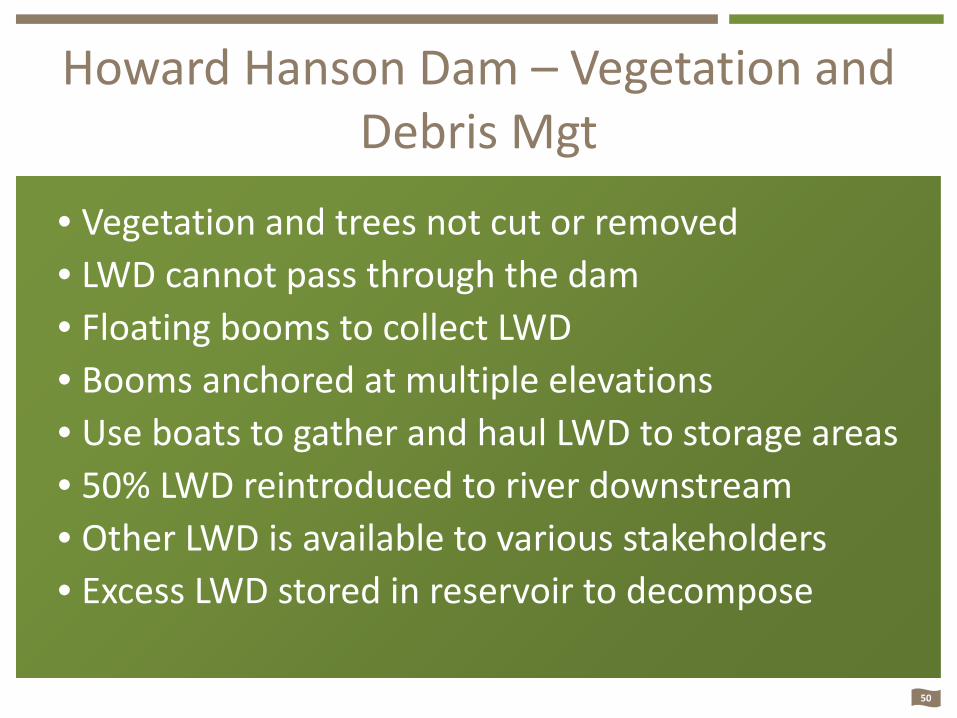
Howard Hanson Dam – Vegetation and Debris Mgt
• Vegetation and trees not cut or removed • LWD cannot pass through the dam • Floating booms to collect LWD • Booms anchored at multiple elevations • Use boats to gather and haul LWD to storage areas • 50% LWD reintroduced to river downstream • Other LWD is available to various stakeholders • Excess LWD stored in reservoir to decompose
Aquatic Species Impacts
5/21/2014
52
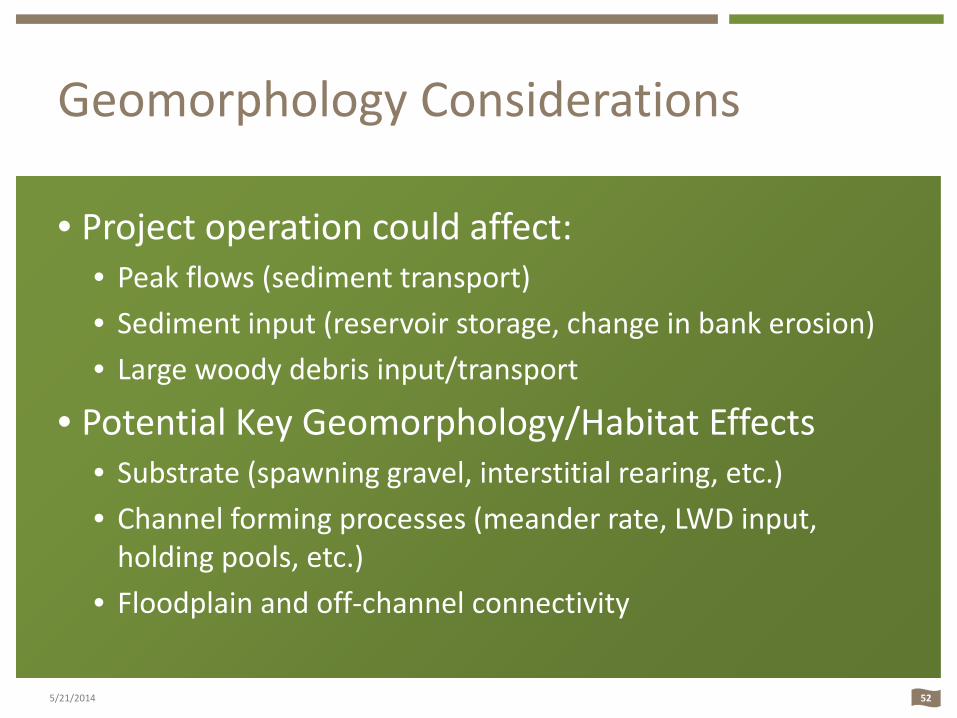
Geomorphology Considerations
• Project operation could affect: • Peak flows (sediment transport) • Sediment input (reservoir storage, change in bank erosion) • Large woody debris input/transport
• Potential Key Geomorphology/Habitat Effects • Substrate (spawning gravel, interstitial rearing, etc.) • Channel forming processes (meander rate, LWD input,
holding pools, etc.) • Floodplain and off-channel connectivity
5/21/2014
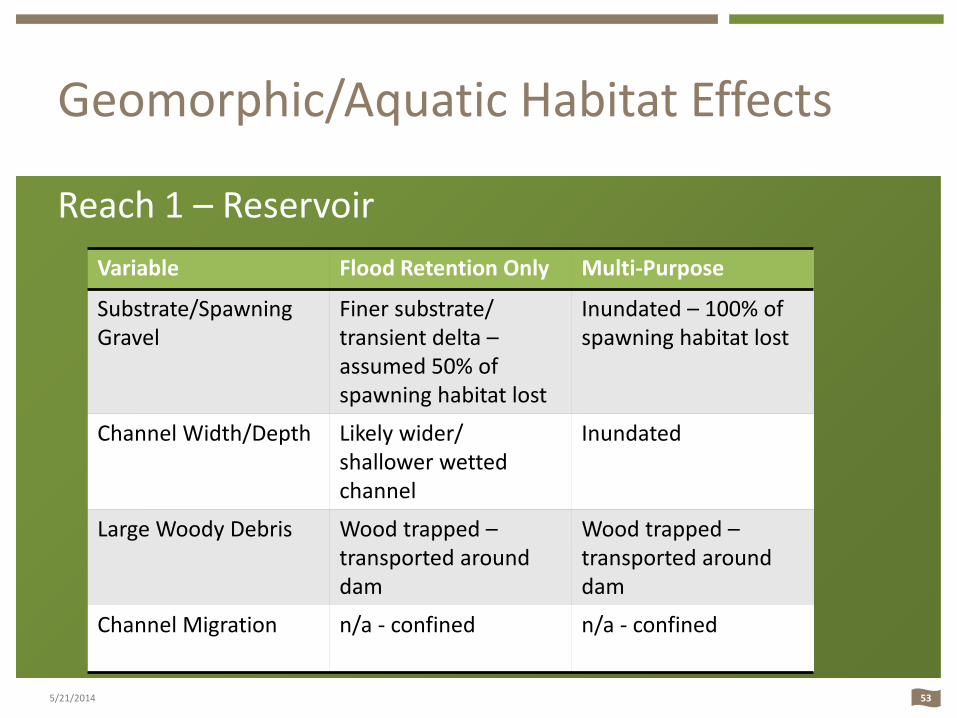
53
Geomorphic/Aquatic Habitat Effects
Reach 1 – Reservoir
5/21/2014
Variable Flood Retention Only Multi-Purpose
Substrate/Spawning Gravel
Finer substrate/ transient delta – assumed 50% of spawning habitat lost
Inundated – 100% of spawning habitat lost
Channel Width/Depth Likely wider/ shallower wetted channel
Inundated
Large Woody Debris Wood trapped – transported around dam
Wood trapped – transported around dam
Channel Migration n/a - confined
n/a - confined
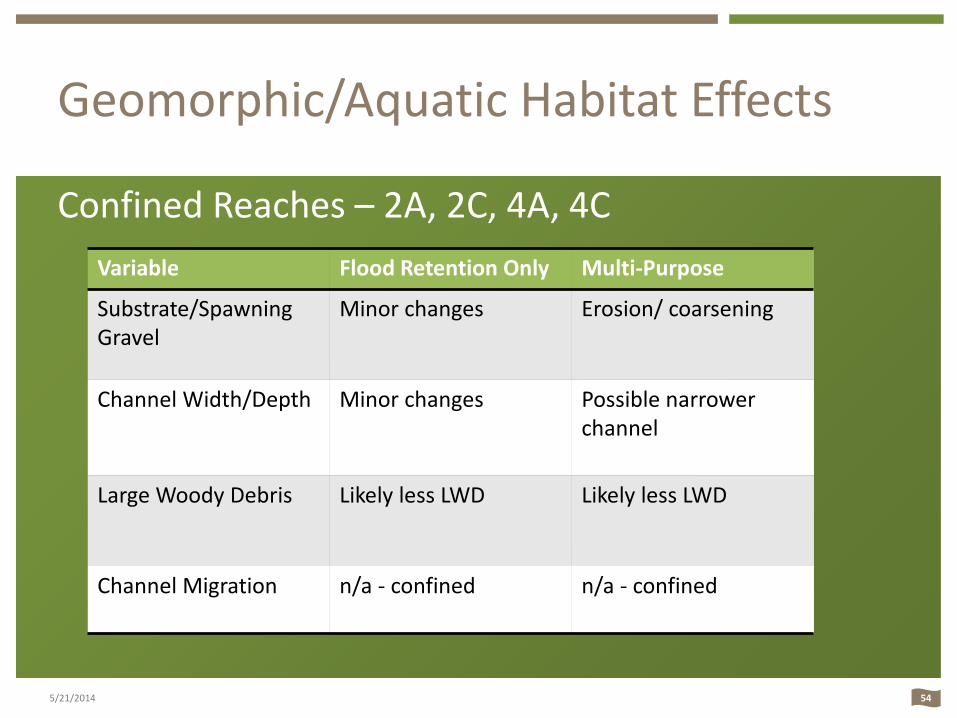
54
Geomorphic/Aquatic Habitat Effects
Confined Reaches – 2A, 2C, 4A, 4C
5/21/2014
Variable Flood Retention Only Multi-Purpose
Substrate/Spawning Gravel
Minor changes Erosion/ coarsening
Channel Width/Depth Minor changes Possible narrower channel
Large Woody Debris Likely less LWD Likely less LWD
Channel Migration n/a - confined
n/a - confined
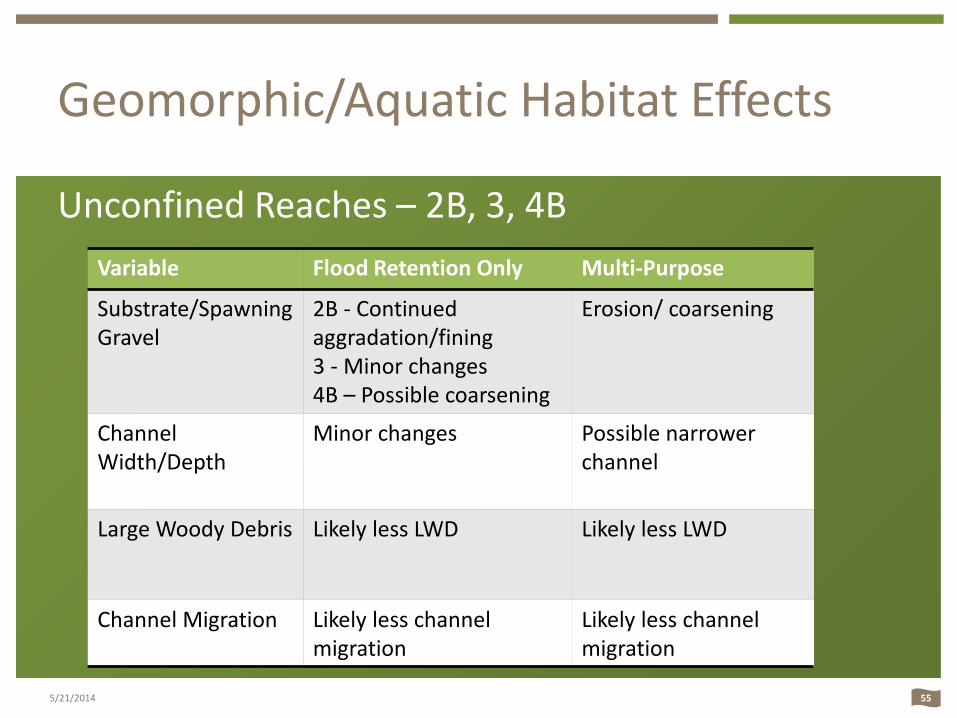
55
Geomorphic/Aquatic Habitat Effects
Unconfined Reaches – 2B, 3, 4B
5/21/2014
Variable Flood Retention Only Multi-Purpose
Substrate/Spawning Gravel
2B - Continued aggradation/fining 3 - Minor changes 4B – Possible coarsening
Erosion/ coarsening
Channel Width/Depth
Minor changes Possible narrower channel
Large Woody Debris Likely less LWD Likely less LWD
Channel Migration Likely less channel migration
Likely less channel migration
56
Geomorphic/Aquatic Habitat Effects
Reaches 5, 6 – Downstream of RM 75 • Limited changes – bedrock control re-sets bedload
transport • Tributary input of water/wood sediment mute
effects of flood control facilities
5/21/2014
57
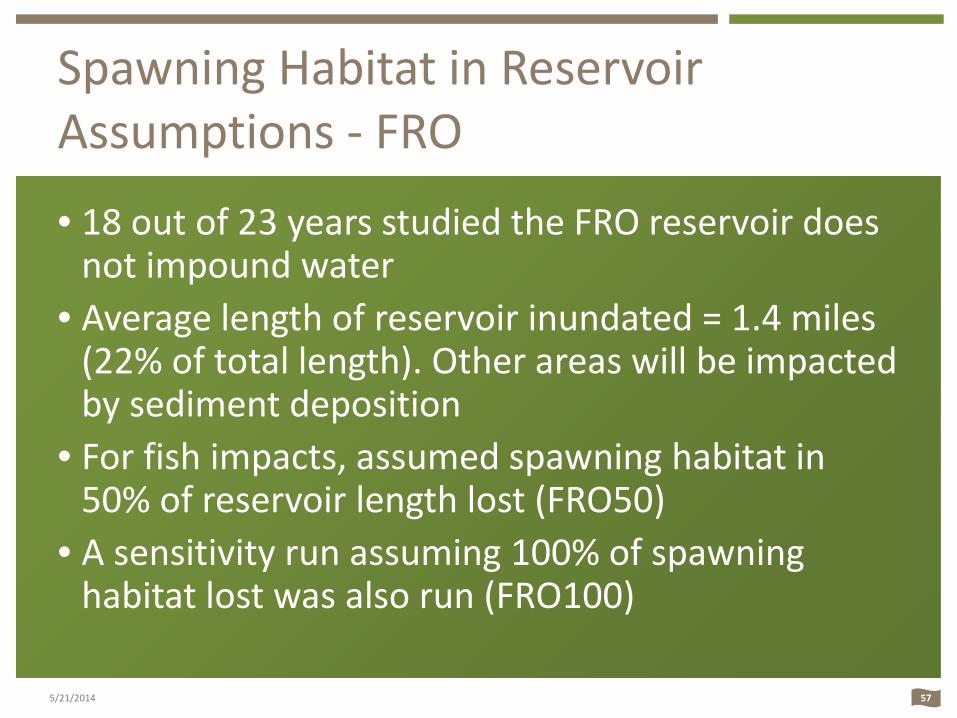
Spawning Habitat in Reservoir Assumptions - FRO
• 18 out of 23 years studied the FRO reservoir does not impound water
• Average length of reservoir inundated = 1.4 miles (22% of total length). Other areas will be impacted by sediment deposition
• For fish impacts, assumed spawning habitat in 50% of reservoir length lost (FRO50)
• A sensitivity run assuming 100% of spawning habitat lost was also run (FRO100)
5/21/2014
58
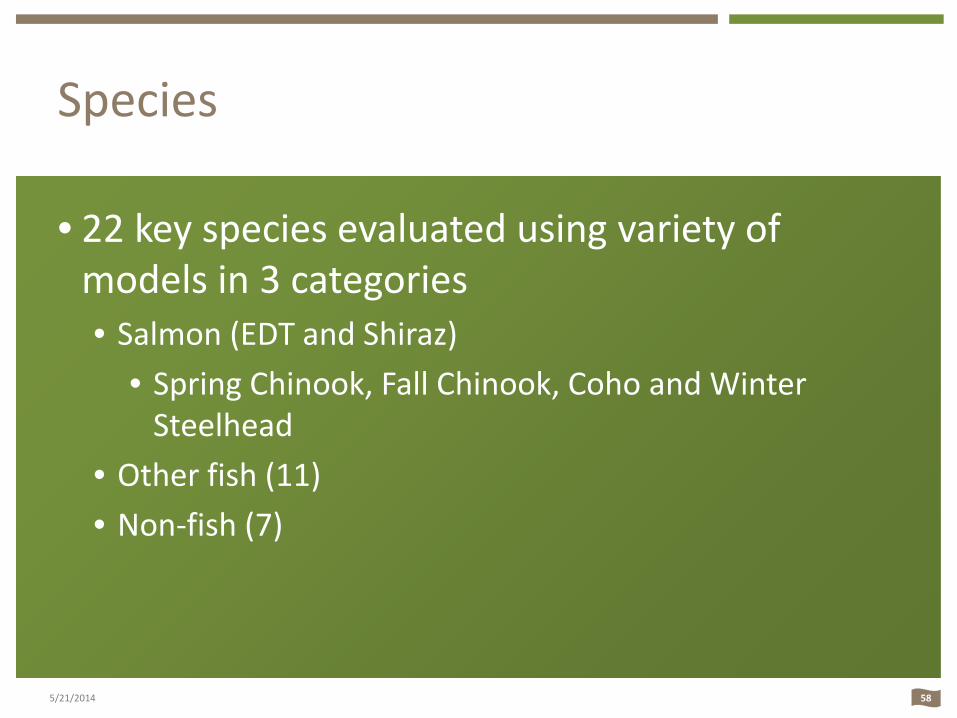
Species
• 22 key species evaluated using variety of models in 3 categories • Salmon (EDT and Shiraz)
• Spring Chinook, Fall Chinook, Coho and Winter Steelhead
• Other fish (11) • Non-fish (7)
5/21/2014
59
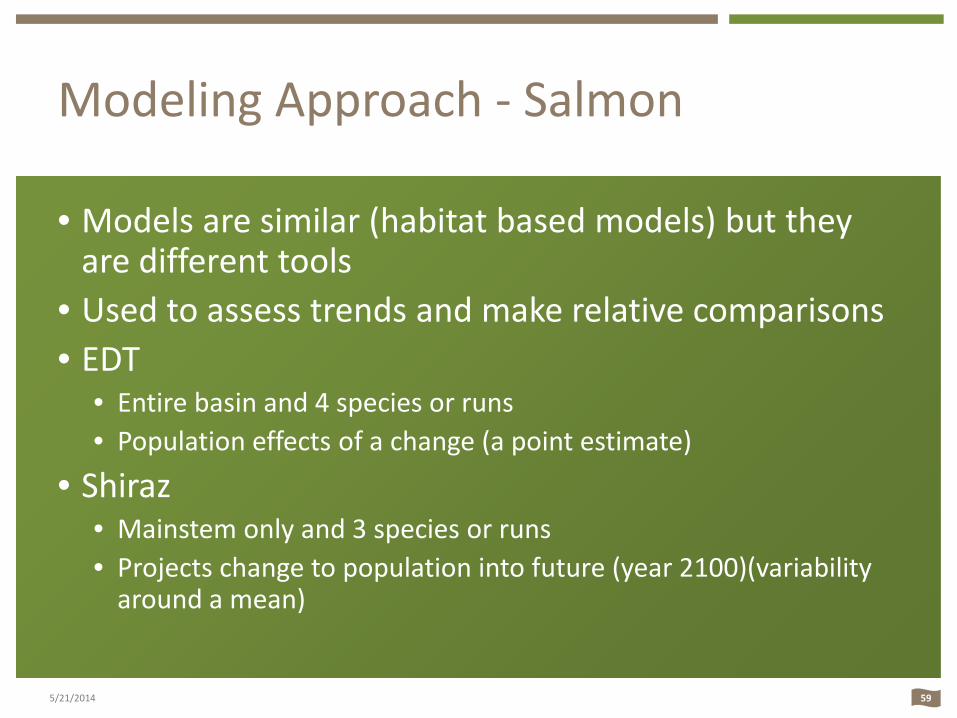
Modeling Approach - Salmon
• Models are similar (habitat based models) but they are different tools
• Used to assess trends and make relative comparisons • EDT
• Entire basin and 4 species or runs • Population effects of a change (a point estimate)
• Shiraz • Mainstem only and 3 species or runs • Projects change to population into future (year 2100)(variability
around a mean)
5/21/2014
60
Effects on Spring Chinook
61
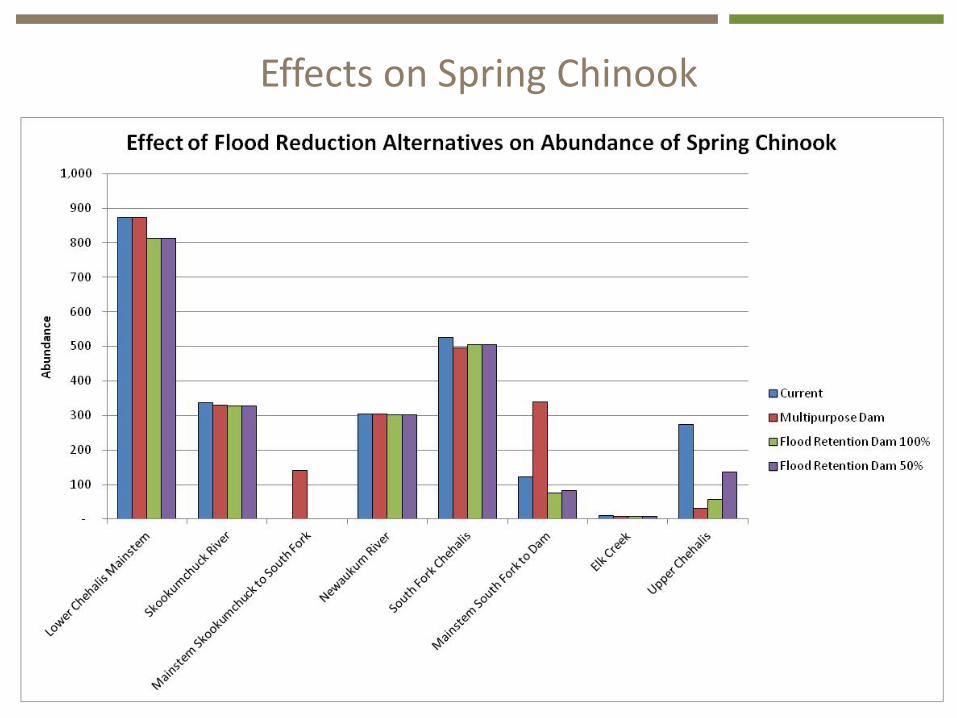
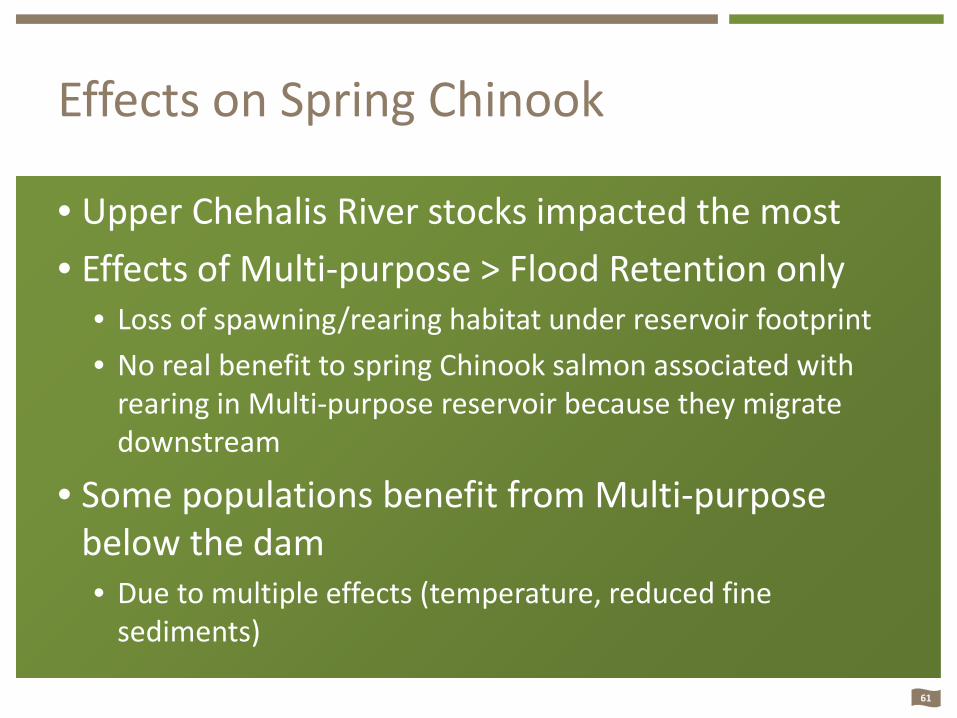
• Upper Chehalis River stocks impacted the most • Effects of Multi-purpose > Flood Retention only
• Loss of spawning/rearing habitat under reservoir footprint • No real benefit to spring Chinook salmon associated with
rearing in Multi-purpose reservoir because they migrate downstream
• Some populations benefit from Multi-purpose below the dam • Due to multiple effects (temperature, reduced fine
sediments)
Effects on Spring Chinook
62
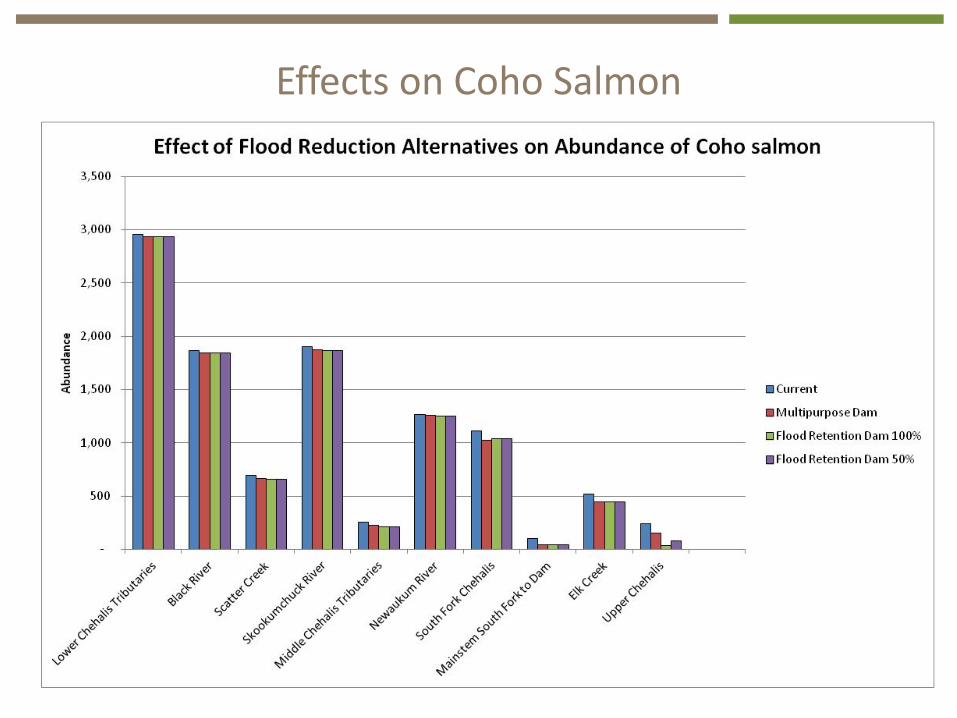
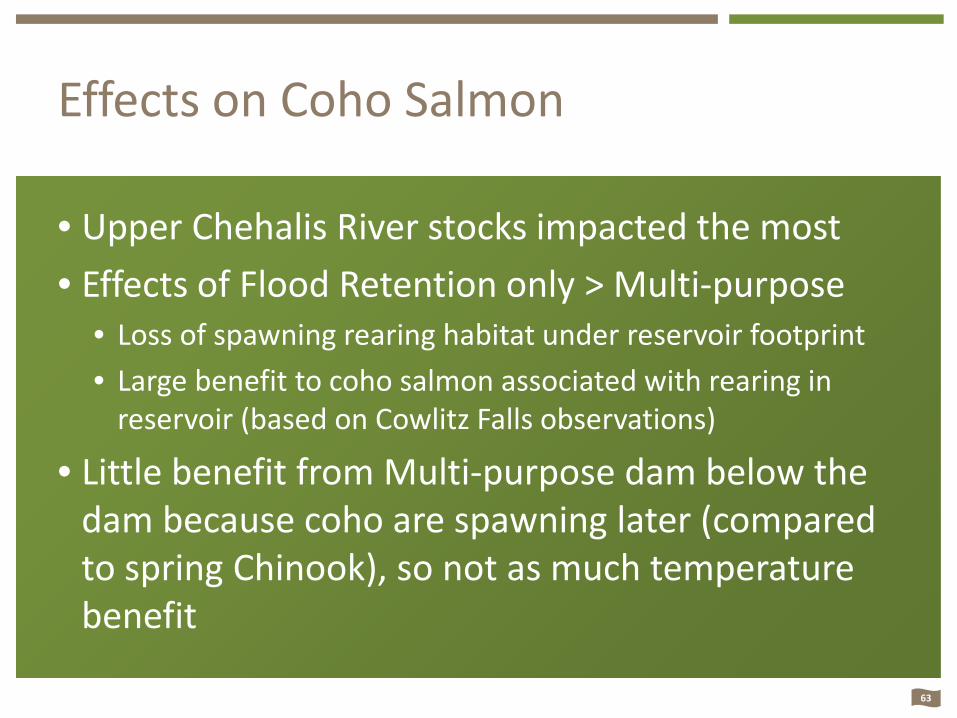
Effects on Coho Salmon
63
• Upper Chehalis River stocks impacted the most • Effects of Flood Retention only > Multi-purpose
• Loss of spawning rearing habitat under reservoir footprint • Large benefit to coho salmon associated with rearing in
reservoir (based on Cowlitz Falls observations)
• Little benefit from Multi-purpose dam below the dam because coho are spawning later (compared to spring Chinook), so not as much temperature benefit
Effects on Coho Salmon
64
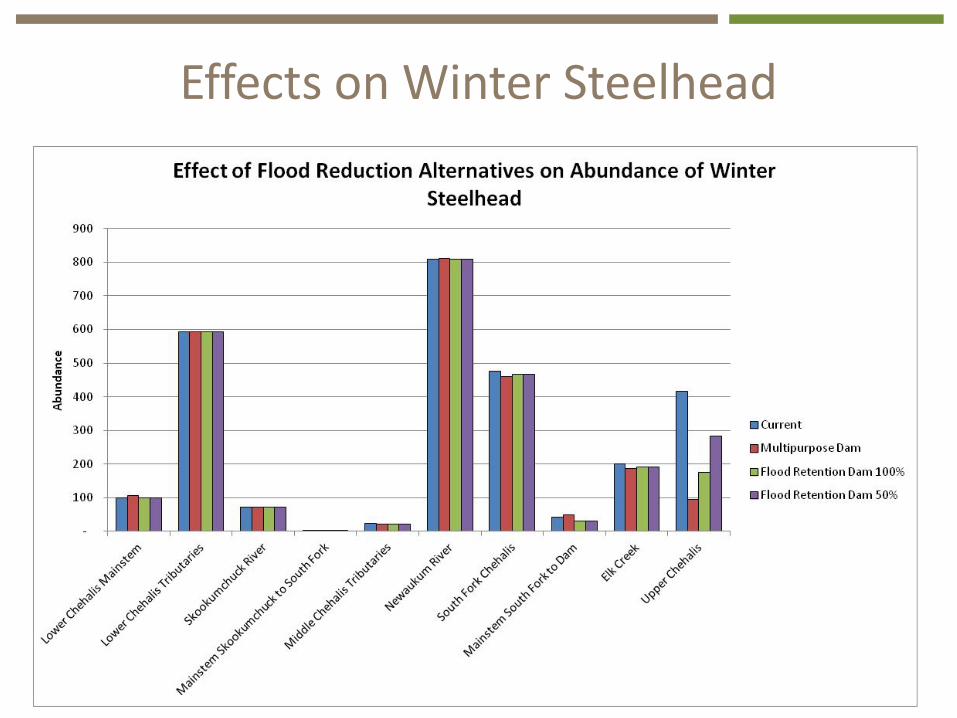
Effects on Winter Steelhead
65
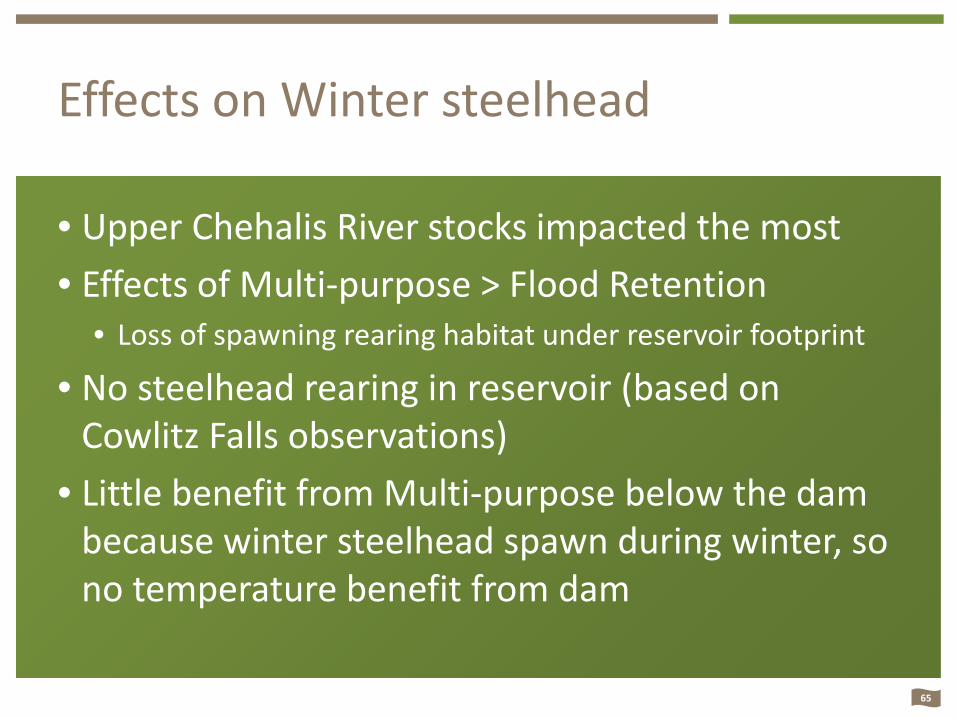
• Upper Chehalis River stocks impacted the most • Effects of Multi-purpose > Flood Retention
• Loss of spawning rearing habitat under reservoir footprint
• No steelhead rearing in reservoir (based on Cowlitz Falls observations)
• Little benefit from Multi-purpose below the dam because winter steelhead spawn during winter, so no temperature benefit from dam
Effects on Winter steelhead
66
Effects on Fall Chinook
67
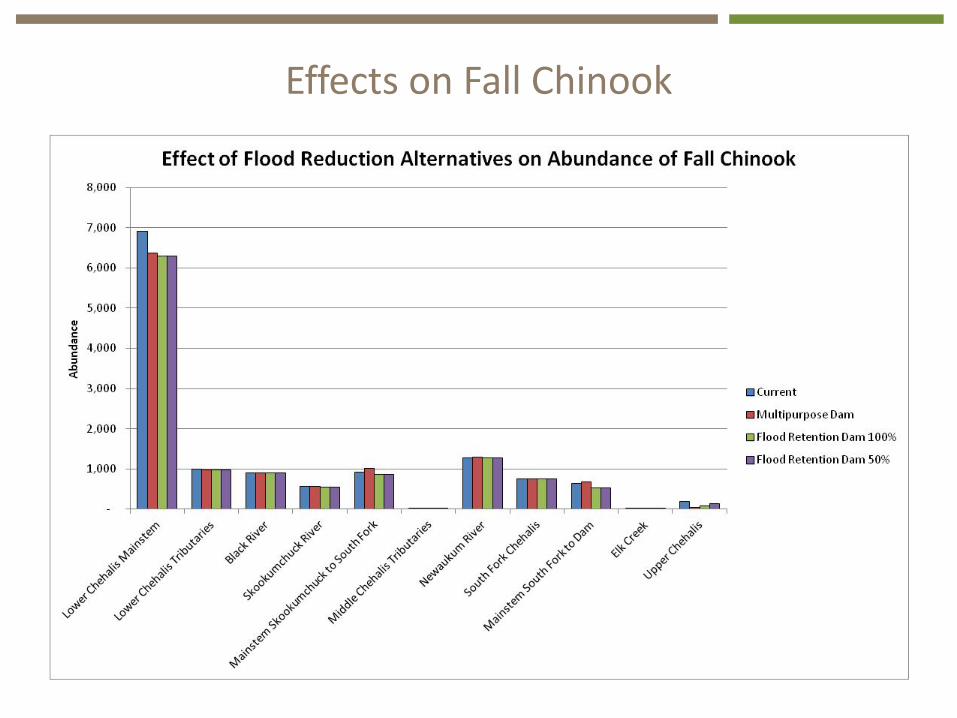
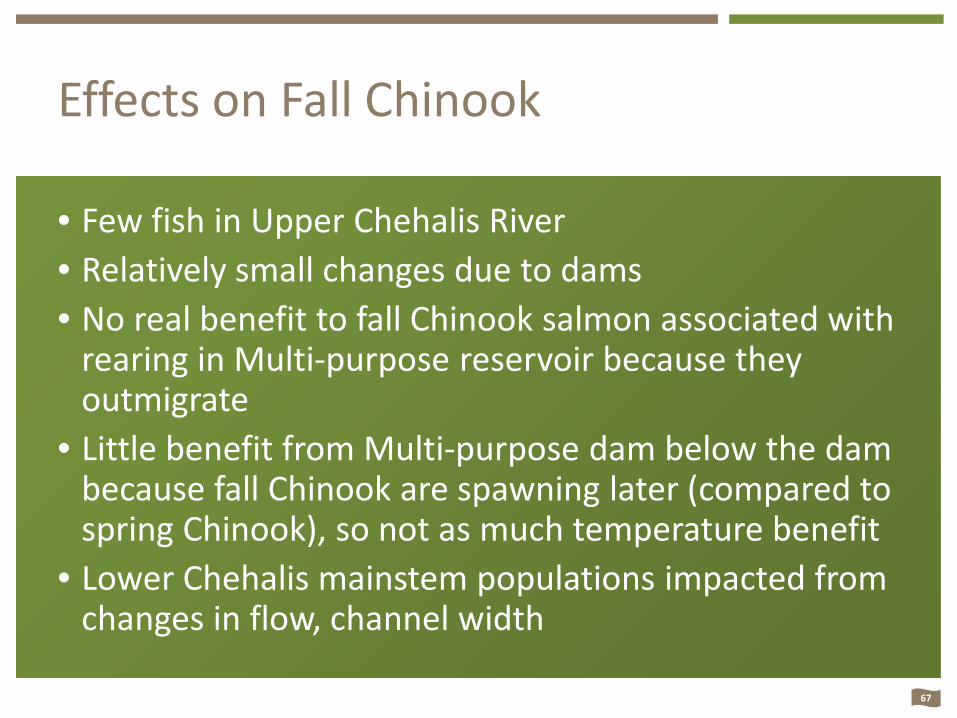
• Few fish in Upper Chehalis River • Relatively small changes due to dams • No real benefit to fall Chinook salmon associated with
rearing in Multi-purpose reservoir because they outmigrate
• Little benefit from Multi-purpose dam below the dam because fall Chinook are spawning later (compared to spring Chinook), so not as much temperature benefit
• Lower Chehalis mainstem populations impacted from changes in flow, channel width
Effects on Fall Chinook
68
Summary at Basin Scale - EDT
69
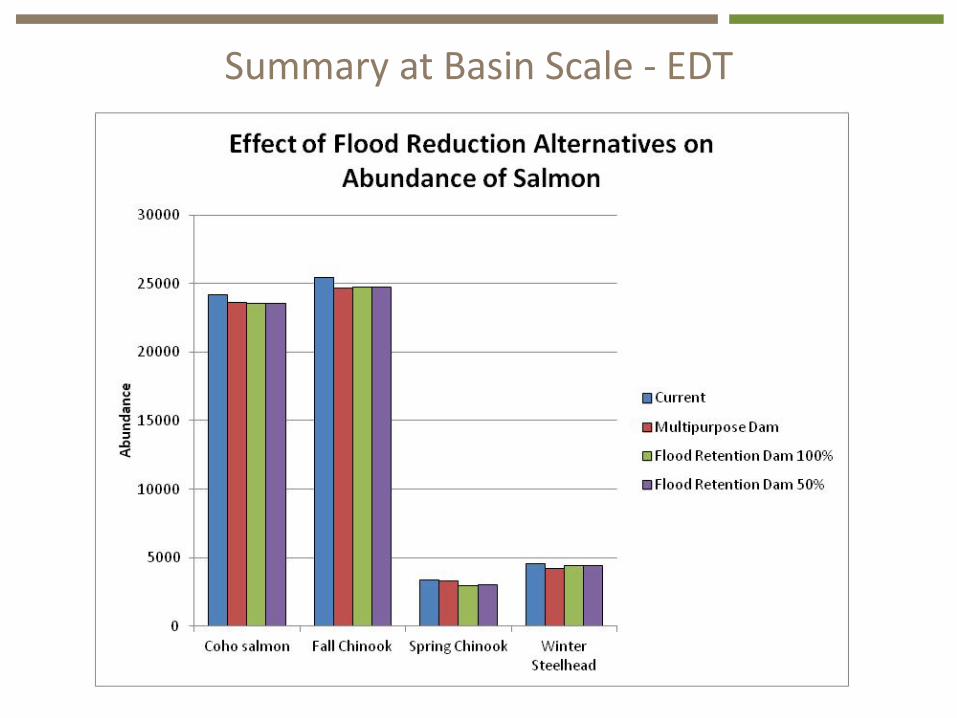
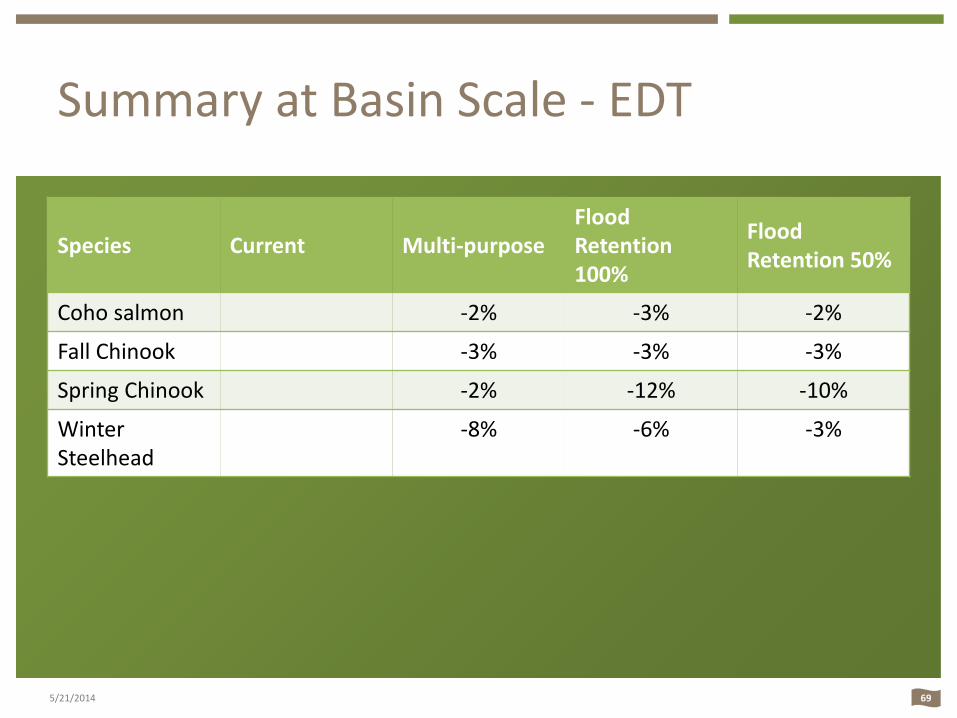
Summary at Basin Scale - EDT
Species Current Multi-purpose Flood Retention 100%
Flood Retention 50%
Coho salmon -2% -3% -2%
Fall Chinook -3% -3% -3%
Spring Chinook -2% -12% -10%
Winter Steelhead
-8% -6% -3%
5/21/2014
70
Shiraz - Spring Chinook Calibrated Model 2014
• Updated information on many model inputs, including: • Juvenile fish rearing distribution in basin • Age of return • Updated flow and temperature information used in habitat
capacity and habitat quality inputs
• Required adjusting the 2012 model calibration • 2014 model calibration period ends with higher
number of fish as the starting point for simulation • During simulation, population trend was generally
flat
71
Summary
• Both flood retention structures would impact salmon and steelhead populations
• Shiraz (mainstem) results consistent with EDT • Potential effects on other fish and non-fish species
can only be described qualitatively at this point • Dams will effect floodplain connectivity, especially closer to
dam
5/21/2014

Using the Results for Economic Analysis
73
Summary of Key Results for Economic Analysis
• Operating rules for different options • Benefits for reducing flood damage • Change in 100 year flood based on climate change • Effects on vegetation and habitat in the reservoir • Effects on downstream geomorphology • Potential impacts and benefits to salmon • Impacts on other aquatic species
5/21/2014

74
Questions
5/21/2014