Charting Outcomes in the Match -...
281
Charting Outcomes in the Match Characteristics of Applicants Who Matched to Their Preferred Specialty in the 2009 Main Residency Match 3rd Edition Prepared by: National Resident Matching Program and Association of American Medical Colleges August 2009 www.aamc.org www.nrmp.org
Transcript of Charting Outcomes in the Match -...
Charting Outcomes in the MatchCharacteristics of Applicants Who Matched to Their Preferred Specialty in the 2009 Main Residency Match
3rd Edition
Prepared by:National Resident Matching Programand Association of American Medical Colleges
August 2009
www.aamc.org www.nrmp.org

Questions about the contents of this publication may be directed to Julia I. Raether, Director of Research, National Resident Matching Program, (202) 778-4773 or [email protected].
Questions about the NRMP should be directed to Mona Signer, Executive Director, National Resident Matching Program, (202) 828-0629 or [email protected].
Questions about the AAMC data collections may be directed to Paul Jolly, Ph.D., Senior Director, Association of American Medical Colleges, (202) 828-0257 or [email protected].
The work of Philip Szenas in the preparation of this report is gratefully acknowledged.
Copyright ©2009 National Resident Matching Program and the Association of American Medical Colleges. All materials subject to this copyright may be
photocopied for the purpose of nonprofit, scientific, or educational advancement.

2009 Table of Contents
Introduction..................................................................................................................................................... ii Tables and Charts for All Specialties Chart 1. Active Applicants in the 2009 Main Residency Match .................................................................2 Table 1. Number of Applicants and Positions in the 2009 Main Residency Match....................................3 Chart 2. Ratio - Applicants Ranking Specialty First / Available Positions .................................................4 Chart 3. Match Rates ...................................................................................................................................5 Table 2. Summary Statistics ........................................................................................................................6 Chart 4. Median Number of Contiguous Ranks ..........................................................................................7 Chart 5. Mean Number of Different Specialties Ranked.............................................................................8 Chart 6. USMLE Step 1 Scores of Matched Applicants .............................................................................9 Chart 7. USMLE Step 2 Scores of Matched Applicants ...........................................................................10 Chart 8. Mean Number of Research Experiences......................................................................................11 Chart 9. Mean Number of Abstracts, Presentations, and Publications......................................................12 Chart 10. Mean Number of Work Experiences .........................................................................................13 Chart 11. Mean Number of Volunteer Experiences ..................................................................................14 Chart 12. Percentage of U.S. Allopathic Seniors Who are Members of AOA..........................................15
Chart 13. Percentage of U.S. Allopathic Seniors Graduating from One of the 40 Medical Schools with the Highest NIH Funding..................................................................................................16
Chart 14. Percentage of Matched U.S. Allopathic Seniors Who Have a Graduate Degree.......................17
Tables and Charts for Individual Specialties Anesthesiology ..........................................................................................................................................18 Dermatology..............................................................................................................................................31 Diagnostic Radiology ................................................................................................................................44 Emergency Medicine.................................................................................................................................57 Family Medicine........................................................................................................................................70 General Surgery.........................................................................................................................................83 Internal Medicine ......................................................................................................................................96 Internal Medicine/Pediatrics....................................................................................................................109 Neurology................................................................................................................................................122 Neurosurgery ...........................................................................................................................................135 Obstetrics and Gynecology .....................................................................................................................148 Orthopaedic Surgery................................................................................................................................161 Otolaryngology........................................................................................................................................174 Pathology-Anatomic and Clinical ...........................................................................................................187 Pediatrics .................................................................................................................................................200 Physical Medicine and Rehabilitation .....................................................................................................213 Plastic Surgery.........................................................................................................................................226 Psychiatry ................................................................................................................................................239 Radiation Oncology.................................................................................................................................252 Transitional Year .....................................................................................................................................265
Copyright ©2009 NRMP and AAMC. Copies may be made for educational or noncommercial uses only.
Charting Outcomes in the Match, 2009i
Copyright ©2009 NRMP and AAMC. Copies may be made for educational or noncommercial uses only.
Charting Outcomes in the Match, 2009
2009 IntroductionThe first edition of Charting Outcomes in the Match was published in August 2006 using data from the 2005 Main Residency Match. The second edition, published in August 2007 and based on the 2007 Match, built on the original report by adding two specialties (Otolaryngology and Neurology), incorporating several additional measures, and conducting regression analyses to predict match success.
The 2009 report is based on the 2009 Match and includes one new specialty (Neurological Surgery) and two new measures (number of work and volunteer experiences). For this edition, the regression analyses have been replaced with two graphs for each specialty showing the relationship between the number of contiguous programs ranked (number of programs in the first-choice specialty before another specialty appears on the rank order list) and USMLE Step 1 scores and the probability of matching to the preferred specialty. These changes should provide more useful information for applicants and advisors as they prepare for the Match.
For the purposes of this report, match success is defined as a match to the specialty of the applicant’s first-ranked program, because that is assumed to be the specialty of choice. Lack of success includes matching to another specialty as well as failure to match at all. No distinction was made based on whether applicants matched to their first, second, third, or last choice.
Combining data from the NRMP, the database of AAMC’s Electronic Residency Application Service (ERAS), USMLE scores made available by the National Board of Medical Examiners (NBME) and the Educational Commission for Foreign Medical Graduates (ECFMG), and other AAMC data sources, we identified twelve applicant characteristics. NBME and ECFMG have granted permission to use USMLE scores, and the National Resident Matching Program and the Association of American Medical Colleges have collaborated to produce this report.
Because graduating seniors from U.S. allopathic medical schools match at higher rates than do other applicant groups, and because some of those groups contain small numbers of applicants, this report distinguishes only two types of applicants: U.S. seniors and independent applicants.1 It should be noted, however, that the independent applicant category is a heterogeneous group. Moreover, because independent applicants match to their preferred specialties at much lower rates than do U.S. seniors, the specialty-specific probability graphs for independent applicants are less predictive of success.
Summary Some general observations apply to all of the specialties in this report. Applicants who are successful in matching to their preferred specialty are more likely to: • Rank more programs within their preferred specialty • Be U.S. seniors • Have higher USMLE Step 1 and Step 2 scores • Be members of AOA
1 Independent appl icants are defined on page 2.
Although some other measures seemed to be related to match success for some specialties, the relationships were not consistent enough to draw broad conclusions across specialties. In addition, the data sources used for Charting Outcomes do not include other important applicant factors such as course evaluations, reference letters, and the Medical School Performance Evaluation.
Despite the fairly strong relationship between USMLE Step scores and match success, the distributions of scores show that program directors consider other qualifications, and a high score is not a guarantee of success. Even in the most competitive specialties a few individuals with higher scores are not successful. Neither is a lower score a bar to success. In the less competitive specialties, U.S. seniors with scores slightly above passing usually match to their preferred specialties.
The data also are reassuring because they indicate that at least some programs do not employ an arbitrary cutoff or decline to consider applicants with less than excellent test performance.
The data in this report support the following straightforward advice one should give to an applicant.
• Rank all of the programs you really want, without regard to your estimate of your chances with those programs.
• Include a mix of both highly competitive and less competitive programs within your preferred specialty.
• Include all of the programs on your list where the program has expressed an interest in you and where you would accept a position.
• If you are applying to a competitive specialty and you would want to have a residency position in the event you are unsuccessful in matching to a program in your preferred specialty, also rank your most preferred programs in an alternate specialty.
• Include all of your qualifications in your application, but know that you do not have to be AOA, to have the highest USMLE scores, to have publications, or to have participated in research projects to match successfully.
Program directors and applicants will find the tables and charts for the specialty of their particular interest later in this report.
For questions, comments or more information, please contact: Julia I. Raether, Director of Research National Resident Matching Program Tel: (202) 778-4773 Email: [email protected]
Or Paul P. Jolly, Ph.D., Senior Director, Special Studies Association of American Medical Colleges Tel: (202) 828-0629 Email: [email protected]
ii

Tables and Charts for All Specialties
Copyright ©2009 NRMP and AAMC. Copies may be made for educational or noncommercial uses only.
Charting Outcomes in the Match, 20091

Copyright ©2009 NRMP and AAMC. Copies may be made for educational or noncommercial uses only.
Charting Outcomes in the Match, 20092
Chart1
Active Applicants in the 2009 Main Residency Matchby Applicant Type
2,013
Students/Graduatesof Osteopathic
Medical Schools
3,390
U.S. CitizenStudents/Graduates ofInternational Medical
Schools
7,484
Non-U.S. CitizenStudents/Graduates
of InternationalMedical Schools
1,222
Previous Graduates ofU.S. Allopathic
Medical Schools
15,638
Seniors of U.S.Allopathic Medical
Schools
35
Students/Graduates ofCanadian Medical
Schools
106
Students/Graduates ofFifth Pathway
Programs
Chart 1 shows the number of active applicants (applicants who submitted rank order lists of programs) by applicant type . U.S. allopathic medical school seniors constitute 52.3 percent of the applicants in this report. The next largest group is non-U.S. citizen students and graduates of international medical schools (25.0%). For the remainder of this report, all applicants who are not U.S. allopathic seniors will be grouped into the "independent applicants" category.
Copyright ©2009 NRMP and AAMC. Copies may be made for educational or noncommercial uses only.
Charting Outcomes in the Match, 20093
Table1
Number of Applicants and Positions in the 2009 Main Residency Matchby Preferred Specialty
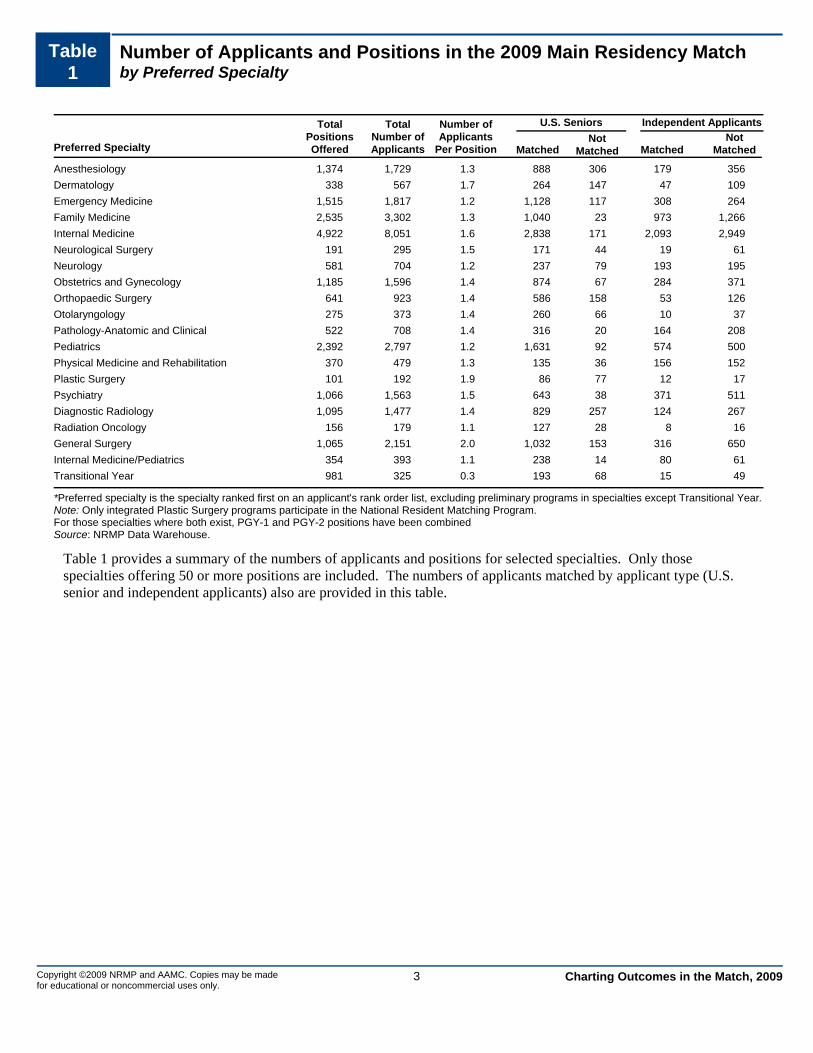
Table 1 provides a summary of the numbers of applicants and positions for selected specialties. Only those specialties offering 50 or more positions are included. The numbers of applicants matched by applicant type (U.S. senior and independent applicants) also are provided in this table.
TotalPositionsOfferedPreferred Specialty
TotalNumber ofApplicants
Number ofApplicants
Per Position Matched MatchedNot
MatchedNot
Matched
U.S. Seniors Independent Applicants
Anesthesiology 1,374 1,729 1.3 888 306 179 356Dermatology 338 567 1.7 264 147 47 109Emergency Medicine 1,515 1,817 1.2 1,128 117 308 264Family Medicine 2,535 3,302 1.3 1,040 23 973 1,266Internal Medicine 4,922 8,051 1.6 2,838 171 2,093 2,949Neurological Surgery 191 295 1.5 171 44 19 61Neurology 581 704 1.2 237 79 193 195Obstetrics and Gynecology 1,185 1,596 1.4 874 67 284 371Orthopaedic Surgery 641 923 1.4 586 158 53 126Otolaryngology 275 373 1.4 260 66 10 37Pathology-Anatomic and Clinical 522 708 1.4 316 20 164 208Pediatrics 2,392 2,797 1.2 1,631 92 574 500Physical Medicine and Rehabilitation 370 479 1.3 135 36 156 152Plastic Surgery 101 192 1.9 86 77 12 17Psychiatry 1,066 1,563 1.5 643 38 371 511Diagnostic Radiology 1,095 1,477 1.4 829 257 124 267Radiation Oncology 156 179 1.1 127 28 8 16General Surgery 1,065 2,151 2.0 1,032 153 316 650Internal Medicine/Pediatrics 354 393 1.1 238 14 80 61Transitional Year 981 325 0.3 193 68 15 49
*Preferred specialty is the specialty ranked first on an applicant's rank order list, excluding preliminary programs in specialties except Transitional Year.Note: Only integrated Plastic Surgery programs participate in the National Resident Matching Program.For those specialties where both exist, PGY-1 and PGY-2 positions have been combinedSource: NRMP Data Warehouse.

Copyright ©2009 NRMP and AAMC. Copies may be made for educational or noncommercial uses only.
Charting Outcomes in the Match, 20094
Chart2
Ratio - Applicants Ranking Specialty First / Available Positionsby Preferred Specialty
Chart 2 shows the ratios of U.S. seniors and independent applicants to available positions in each specialty. All specialties except Dermatology, General Surgery, Neurological Surgery, Orthopaedic Surgery, and Otolaryngology have enough positions to accommodate all U.S. seniors who prefer that specialty. As the number of applicants has increased in recent years, fewer specialties have offered enough positions for all applicants who prefer that specialty.
0.0
0.5
1.0
1.5
2.0
Anesth
esiol
ogy
Dermato
logy
Diagno
stic R
adiol
ogy
Emergen
cy M
edicin
e
Family
Med
icine
Genera
l Surg
ery
Intern
al Med
icine
Intern
al Med
icine
/Ped
iatric
s
Neurol
ogica
l Surg
ery
Neurol
ogy
Obstet
rics a
nd G
ynec
ology
Orthop
aedic
Surg
ery
Otolary
ngolo
gy
Patholo
gy
Pediat
rics
Physic
al Med
icine
Plastic
Surg
ery
Psych
iatry
Radiat
ion O
ncolo
gy
Transit
ional
Year
0.9
1.2
1.0
0.8
0.4
1.1
0.60.7
1.1
0.5
0.8
1.2 1.2
0.60.7
0.5
1.6
0.6
1.0
0.3
0.4
0.5
0.4
0.40.9
0.9
1.0
0.4
0.4
0.7
0.60.3
0.20.7
0.4
0.8
0.3
0.8
0.2
0.1
Independent ApplicantsU.S. Seniors
Source: NRMP Data Warehouse

Copyright ©2009 NRMP and AAMC. Copies may be made for educational or noncommercial uses only.
Charting Outcomes in the Match, 20095
Chart3
Match RatesPercent Matched by Preferred Specialty and Applicant Type
0
20
40
60
80
100
Anesth
esiol
ogy
Dermato
logy
Diagno
stic R
adiol
ogy
Emergen
cy M
edicin
e
Family
Med
icine
Genera
l Surg
ery
Intern
al Med
icine
Intern
al Med
icine/P
ediat
rics
Neurol
ogica
l Surg
ery
Neurol
ogy
Obstet
rics a
nd G
ynec
ology
Orthop
aedic
Surg
ery
Otolary
ngolo
gy
Patholo
gy
Pediat
rics
Physic
al Med
icine
Plastic
Surg
ery
Psych
iatry
Radiat
ion O
ncolo
gy
Transit
ional
Year
74
64
76
9198
8794 94
8075
93
79 80
94 95
79
53
94
8274
34 30 32
54
44
3342
57
24
5043
3021
4453 51
41 4233
23
U.S. Seniors Independent Applicants
Source: NRMP Data Warehouse.
Chart 3 shows the percentages of U.S. seniors and independent applicants who matched to their preferred specialty. Overall, 87.3 percent U.S. seniors matched to their preferred specialty, ranging from a high of 97.8 percent (Family Medicine) to a low of 52.8 percent (Plastic Surgery). For independent applicants, the overall match rate was 42.3 percent, ranging from a high of 56.7 percent (Internal Medicine/Pediatrics) to a low of 21.3 percent (Otolaryngology). In general, independent applicants are less successful in matching to their preferred specialty than are U.S. seniors.

Copyright ©2009 NRMP and AAMC. Copies may be made for educational or noncommercial uses only.
Charting Outcomes in the Match, 20096
Table2
Summary StatisticsAll Specialties Combined
Table 2 provides summary statistics by applicant type and match outcome on the 12 measures presented in this report. Data on each of these measures will be displayed graphically by preferred specialty on the following pages. Of the 12 measures, only the United States Medical Licensing Examination (USMLE) Step 1 and Step 2 scores had significant missing data. Overall, there were Step 1 scores for 92.9 percent of applicants. Almost all of the applicants who did not have Step 1 scores were osteopathic medical school seniors and graduates who either take an alternative examination (the Comprehensive Osteopathic Medical Licensing Examination, or COMLEX-USA) or who take the USMLE exams but whose data are not shared with the AAMC. Step 2 scores were available for 79.0 percent of the applicants. In addition to missing Step 2 scores for the osteopathic applicants, only 73.2 percent of U.S. seniors had Step 2 scores. The missing data for U.S. seniors can be attributed to the fact that few medical schools require students to take and/or pass the Step 2 examination prior to the NRMP's rank order list deadline.
Measure (n=13,516) (n=1,961) (n=5,979) (n=8,165)
U.S. Seniors Independent Applicants
Matched Unmatched Matched Unmatched
1. 9.0 6.9 5.8 2.8Mean number of contiguous ranks2. 1.2 1.5 1.3 1.5Mean number of distinct specialties ranked3. 225 219 217 208Mean USMLE Step 1 score4. 231 220 221 209Mean USMLE Step 2 score5. 2.2 2.3 1.3 1.2Mean number of research experiences6. 2.9 2.8 2.5 2.7Mean number of abstracts, presentations, and
publications7. 2.7 2.6 3.3 3.6Mean number of work experiences8. 6.3 5.5 3.5 2.5Mean number of volunteer experiences9. 15.7 7.8Percentage who are AOA members n/a n/a
10. 35.2 27.5Percentage who graduated from one of the 40 U.S. medical schools with the highest NIH funding
n/a n/a
11. 4.2 3.7Percentage who have Ph.D. degree n/a n/a12. 10.9 12.8Percentage who have another graduate degree n/a n/a
n/a: The measure either does not apply to, applies to only a small percentage of, or no reliable data were available for independent applicants.
Sources. Measures 1, 2, and match outcome are from the NRMP Data Warehouse; measures 3 and 4 are from the AAMC Data Warehouse and from the ECFMG, both by permission of the NBME and ECFMG; measures 5-9 are from the AAMC Data Warehouse; measure 10 is from the NIH website (http://report.nih.gov/award/trends/AggregateDate.cfm Medical Schools Only.xls); and measures 11 and 12 are from the AAMC Data Warehouse.
Note: USMLE Step 1 scores are not available for most osteopathic medical school graduates included in the independent applicant group.
Approximately 30 percent of U.S. allopathic medical school seniors do not take the USMLE Step 2 prior to the Match.

7Copyright ©2009 NRMP and AAMC. Copies may be made for educational or noncommercial uses only.
Charting Outcomes in the Match, 2009
Chart4
Median Number of Contiguous Ranks by Preferred Specialty, Applicant Type, and Match Status
U.S. Seniors
0
2
4
6
8
10
12
14
Anesth
esiol
ogy
Dermato
logy
Diagno
stic R
adiol
ogy
Emergen
cy M
edicin
e
Family
Med
icine
Genera
l Surg
ery
Intern
al Med
icine
Intern
al Med
icine/P
ediat
rics
Neurol
ogica
l Surg
ery
Neurol
ogy
Obstet
rics a
nd G
ynec
ology
Orthop
aedic
Surgery
Otolary
ngolo
gy
Patholo
gy
Pediat
rics
Physic
al Med
icine
Plastic
Surg
ery
Psych
iatry
Radiat
ion O
ncolo
gy
Transit
ional
Year
12
8
12
10
6
98 8
13
910
1211
8 89
87
11
2
10
4
9
65
45
2
109
7
54
2
9 9
3 34
1
Matched Not Matched
Independent Applicants
0
2
4
6
8
10
12
14
Anesth
esiol
ogy
Dermato
logy
Diagno
stic R
adiol
ogy
Emergen
cy M
edicin
e
Family
Med
icine
Genera
l Surg
ery
Intern
al Med
icine
Intern
al Med
icine/P
ediat
rics
Neurol
ogica
l Surg
ery
Neurol
ogy
Obstet
rics a
nd G
ynec
ology
Orthop
aedic
Surgery
Otolary
ngolo
gy
Patholo
gy
Pediat
rics
Physic
al Med
icine
Plastic
Surg
ery
Psych
iatry
Radiat
ion O
ncolo
gy
Transit
ional
Year
6
35
64
2
53
5 56
5
8
5 57
2
6
31
21
2 21 1
21
2 2 2 2 21 1
21
21 1
Matched Not Matched
Source: NRMP Data Warehouse
In general, applicants are more likely to be successful if they rank more programs in their desired specialty. To quantify this aspect of applicant behavior, we tallied the number of programs ranked in the first-choice specialty before a program in another specialty appeared on the applicant's rank order list.
Chart 4 provides the median number of contiguous ranks by preferred specialty for U.S. seniors and independent applicants who matched and did not match. The top panel shows significant variation across the specialties for U.S. seniors. Neurological Surgery had the longest average contiguous rank list for matched U.S. seniors (13) and Family Medicine (6) and Transitional Year (2) had the shortest. In general, U.S. senior applicants who preferred the more competitive specialties submitted longer contiguous lists. For all specialties except Neurology, Pediatrics, and Physical Medicine and Rehabilitation, U.S. seniors who matched to their preferred specialty had median contiguous rank lists that were longer than U.S. seniors who did not match.
A similar pattern can be found for independent applicants, although their lists are shorter than the lists submitted by U.S. seniors. Independent applicants who matched had longer contiguous lists compared with independent applicants who did not match to their preferred specialty.
The principal message of these graphs is that applicants with longer rank order lists are more successful than those with shorter ones. The NRMP has been recommending longer list for many years, but some applicants apparently do not heed the advice. Others may have shorter lists because they found only a few programs willing to entertain their applications or because they could not afford a large number of interview trips.

Copyright ©2009 NRMP and AAMC. Copies may be made for educational or noncommercial uses only.
8 Charting Outcomes in the Match, 2009
Chart5
Mean Number of Different Specialties Rankedby Preferred Specialty, Applicant Type, and Match Status
U.S. Seniors
0.0
0.5
1.0
1.5
2.0
2.5
Anesth
esiol
ogy
Dermato
logy
Diagno
stic R
adiol
ogy
Emergen
cy M
edicin
e
Family
Med
icine
Genera
l Surg
ery
Intern
al Med
icine
Intern
al Med
icine/P
ediat
rics
Neurol
ogica
l Surg
ery
Neurol
ogy
Obstet
rics a
nd G
ynec
ology
Orthop
aedic
Surgery
Otolary
ngolo
gy
Patholo
gy
Pediat
rics
Physic
al Med
icine
Plastic
Surg
ery
Psych
iatry
Radiat
ion O
ncolo
gy
Transit
ional
Year
1.3
2.0
1.6
1.1
1.1
1.0 1.1 1.2
1.0 1.
2
1.0 1.1
1.1
1.0
1.0
1.4 1.
6
1.1
1.6 1.
9
1.5
2.2
1.8
1.4
1.1
1.1 1.
3 1.6
1.3
1.3
1.2 1.
4
1.4
1.1
1.1 1.2
1.8
1.2
1.7 2.
0
Matched Not Matched
Independent Applicants
0.0
0.5
1.0
1.5
2.0
2.5
Anesth
esiol
ogy
Dermato
logy
Diagno
stic R
adiol
ogy
Emergen
cy M
edicin
e
Family
Med
icine
Genera
l Surg
ery
Intern
al Med
icine
Intern
al Med
icine/P
ediat
rics
Neurol
ogica
l Surg
ery
Neurol
ogy
Obstet
rics a
nd G
ynec
ology
Orthop
aedic
Surgery
Otolary
ngolo
gy
Patholo
gy
Pediat
rics
Physic
al Med
icine
Plastic
Surg
ery
Psych
iatry
Radiat
ion O
ncolo
gy
Transit
ional
Year
1.5
1.1
1.6
1.2 1.3
1.2 1.3
1.8
1.4 1.
6
1.2
1.2
1.0 1.
2 1.3 1.4
1.4
1.2
1.6 1.7
1.7
1.4 1.
7
1.4 1.5
1.3 1.
5
2.5
1.6 1.
9
1.5
1.5
1.5
1.5
1.5 1.6 1.
8
1.4 1.
6 1.9
Matched Not Matched
Source: NRMP Data Warehouse
Some applicants are interested in a single specialty while others consider two or more. Chart 5 displays the average number of different specialties ranked by applicant type, preferred specialty, and match outcome.
The top chart shows the data for U.S. seniors. In general, seniors who preferred the more competitive specialties were more likely to rank more than one specialty. For almost all specialties, seniors who did not match to their preferred specialty were more likely to rank more than one specialty compared to seniors who matched.
A similar pattern can be seen for the independent applicants, although on average they were more likely to rank more than one specialty when compared with U.S. seniors.

9Copyright ©2009 NRMP and AAMC. Copies may be made for educational or noncommercial uses only.
Charting Outcomes in the Match, 2009
Chart6
USMLE Step 1 Scores of Matched Applicantsby Preferred Specialty and Applicant Type
U.S. Seniors
180
190
200
210
220
230
240
250
260
Anesth
esiol
ogy
Dermato
logy
Diagno
stic R
adiol
ogy
Emergen
cy M
edici
ne
Family
Med
icine
Genera
l Surg
ery
Intern
al Med
icine
Intern
al Med
icine
/Ped
iatric
s
Neurol
ogica
l Surg
ery
Neurol
ogy
Obstet
rics a
nd G
ynec
ology
Orthop
aedic
Surg
ery
Otolary
ngolo
gy
Patholo
gy
Pediat
rics
Physic
al Med
icine
Plastic
Surg
ery
Psych
iatry
Radiat
ion O
ncolo
gy
Transit
ional
Year
Independent Applicants
180190200210220230240250260
Anesth
esiol
ogy
Dermato
logy
Diagno
stic R
adiol
ogy
Emergen
cy M
edici
ne
Family
Med
icine
Genera
l Surg
ery
Intern
al Med
icine
Intern
al Med
icine
/Ped
iatric
s
Neurol
ogica
l Surg
ery
Neurol
ogy
Obstet
rics a
nd G
ynec
ology
Orthop
aedic
Surg
ery
Otolary
ngolo
gy
Patholo
gy
Pediat
rics
Physic
al Med
icine
Plastic
Surg
ery
Psych
iatry
Radiat
ion O
ncolo
gy
Transit
ional
Year
Sources: NRMP Data Warehouse and AAMC Data Warehouse. USMLE scores by permission of the NBME and ECFMG.
USMLE Step 1 scores are a measure of a student’s understanding of important basic science concepts and the ability to apply that knowledge to the practice of medicine. Although such knowledge is only one facet of applicant qualifications considered by program directors in their selection process, it is the only one that is comparable across applicants, and available during the interview season and prior to the NRMP’s ranking deadline. Overall, U.S. senior applicants have mean USMLE Step 1 scores of 224.3 (s.d. = 19.6) and independent applicants have mean scores of 211.0 (s.d. = 19.7), both well above the minimum passing score of 182.
Chart 6 displays the median Step 1 scores for matched U.S. seniors (top panel) and independent applicants (bottom panel) by specialty. The horizontal bars are the median values for successful applicants and the vertical lines show the interquartile ranges (the range of scores for applicants excluding the top and bottom quarters of the distribution). Scores generally are higher for the more competitive specialties, but there is substantial overlap when specialties are compared.
In general, U.S. seniors who matched to their preferred specialty have median Step 1 scores that are higher than those of independent applicants who matched, but there are a few exceptions. Independent applicants who matched in Radiation Oncology, General Surgery, Internal Medicine, and Neurology had equivalent median Step 1 scores when compared with matched U.S. seniors.
Note: Step 1 scores are not available for the majority of Osteopathic seniors and graduates included within the independent applicant category.Source: NRMP Data Warehouse and AAMC Data Warehouse. USMLE scores by permission of the NBME and ECFMG.

Copyright ©2009 NRMP and AAMC. Copies may be made for educational or noncommercial uses only.
Charting Outcomes in the Match, 200910
Chart7
USMLE Step 2 Scores of Matched Applicantsby Preferred Specialty and Applicant Type
U.S. Seniors
180190200210220230240250260
Anesth
esiol
ogy
Dermato
logy
Diagno
stic R
adiol
ogy
Emergen
cy M
edicin
e
Family
Med
icine
Genera
l Surg
ery
Intern
al Med
icine
Intern
al Med
icine/P
ediat
rics
Neurol
ogica
l Surg
ery
Neurol
ogy
Obstet
rics a
nd G
ynec
ology
Orthop
aedic
Surgery
Otolary
ngolo
gy
Patholo
gy
Pediat
rics
Physic
al Med
icine
Plastic
Surg
ery
Psych
iatry
Radiat
ion O
ncolo
gy
Transit
ional
Year
Independent Applicants
180190200210220230240250260
Anesth
esiol
ogy
Dermato
logy
Diagno
stic R
adiol
ogy
Emergen
cy M
edicin
e
Family
Med
icine
Genera
l Surg
ery
Intern
al Med
icine
Intern
al Med
icine/P
ediat
rics
Neurol
ogica
l Surg
ery
Neurol
ogy
Obstet
rics a
nd G
ynec
ology
Orthop
aedic
Surgery
Otolary
ngolo
gy
Patholo
gy
Pediat
rics
Physic
al Med
icine
Plastic
Surg
ery
Psych
iatry
Radiat
ion O
ncolo
gy
Transit
ional
Year
Sources: NRMP Data Warehouse and AAMC Data Warehouse. USMLE scores by permission of the NBME and ECFMG.
USMLE Step 2 scores are a measure of an applicant's ability to apply the medical knowledge, skills, and understanding of clinical science essential for providing patient care. Overall, U.S. senior applicants had mean USMLE step 2 scores of 229.7 (s.d. = 21.8) and independent applicants had mean scores of 213.4 (s.d. = 21.3), both well above the minimum passing score of 182.
Chart 7 shows the median Step 2 scores for matched U.S. seniors (top panel) and independent applicants (bottom panel) who matched by preferred specialty. The horizontal bars are the median values for successful applicants and the vertical lines show the interquartile ranges. As was the case for the Step 1 scores, the more competitive specialties have higher average Step 2 scores.
For some specialties (e.g., Plastic Surgery, Family Medicine) the differences in median Step 2 scores between matched U.S. seniors and independent applicants are quite dramatic; other specialties (e.g., Neurological Surgery, Radiation Oncology, Anesthesiology) show only minor differences.
Note: Approximately 30 percent of U.S. seniors did not take the Step 2 examination in time to be included in this report. Step 2 scores are not available for the majority of Osteopathic seniors and graduates included within the independent applicant category.Source: NRMP Data Warehouse and AAMC Data Warehouse. USMLE scores by permission of the NBME and ECFMG.

Copyright ©2009 NRMP and AAMC. Copies may be made for educational or noncommercial uses only.
Charting Outcomes in the Match, 200911
Chart8
Mean Number of Research Experiencesby Preferred Specialty, Applicant Type, and Match Status
U.S. Seniors
0.0
1.5
3.0
4.5
Anesth
esiol
ogy
Dermato
logy
Diagno
stic R
adiol
ogy
Emergen
cy M
edicin
e
Family
Med
icine
Genera
l Surg
ery
Intern
al Med
icine
Intern
al Med
icine/P
ediat
rics
Neurol
ogica
l Surg
ery
Neurol
ogy
Obstet
rics a
nd G
ynec
ology
Orthop
aedic
Surgery
Otolary
ngolo
gy
Patholo
gy
Pediat
rics
Physic
al Med
icine
and R
ehab
.
Plastic
Surg
ery
Psych
iatry
Radiat
ion O
ncolo
gy
Transit
ional
Year
1.9
3.6
2.8
1.8
1.3
2.4
2.2
1.7
3.3
2.4
2.1 2.
7
3.4
2.1
1.8 1.9
3.6
1.8
3.7
3.1
1.9
3.1
2.3
1.5 1.
8 1.9 2.1 2.2 2.
8
2.4
2.2 2.
5 2.9
1.9 2.0
1.5
3.1
1.8
3.8
2.7
Matched Not Matched
Independent Applicants
0.0
1.5
3.0
4.5
Anesth
esiol
ogy
Dermato
logy
Diagno
stic R
adiol
ogy
Emergen
cy M
edicin
e
Family
Med
icine
Genera
l Surg
ery
Intern
al Med
icine
Intern
al Med
icine/P
ediat
rics
Neurol
ogica
l Surg
ery
Neurol
ogy
Obstet
rics a
nd G
ynec
ology
Orthop
aedic
Surgery
Otolary
ngolo
gy
Patholo
gy
Pediat
rics
Physic
al Med
icine
and R
ehab
.
Plastic
Surg
ery
Psych
iatry
Radiat
ion O
ncolo
gy
Transit
ional
Year
1.5
4.2
2.1
1.2
1.0 1.
5
1.2
1.2
2.1
1.8
1.3
3.0
2.8
1.5
1.2 1.
5
3.4
1.4 1.
9
1.7
1.4
3.0
1.8
1.1
0.9 1.
5
1.0
1.0
1.8
1.7
1.2
2.0 2.2
1.5
1.2
1.2
2.4
1.2
2.8
1.6
Matched Not Matched
Sources: NRMP Data Warehouse and AAMC Data Warehouse
The ERAS application allows applicants to self-report their participation in research projects. These experiences are not verified or evaluated and may vary greatly. Chart 8 shows the average number of research experiences by applicant type, preferred specialty, and match outcome.
U.S. seniors averaged 2.2 research experiences with 83.6 percent reporting at least one experience. Independent applicants reported, on average, fewer experiences (1.3), and a smaller percentage (58.6%) listed having any research experiences.
The same competitive specialties stand out with the highest average numbers of this added qualification. Matched U.S. seniors (top panel) who preferred Dermatology, General Surgery, Neurological Surgery, Otolaryngology, and Plastic Surgery reported on average, slightly more research experiences when compared to unmatched seniors in these specialties. A similar pattern can be seen for the independent applicants.

Copyright ©2009 NRMP and AAMC. Copies may be made for educational or noncommercial uses only.
Charting Outcomes in the Match, 200912
Chart9
Mean Number of Abstracts, Presentations, and Publicationsby Preferred Specialty, Applicant Type, and Match Status
The ERAS application also permits applicants to list their publications. This information is self-reported and may include peer-reviewed articles, abstracts, poster sessions, and invited national or regional presentations. Some residency programs may independently verify and even review publications for applicants in whom they have an interest, but most probably do not.
Many applicants report abstracts, presentation, or publications, sometimes dozens or even hundreds. In the individual specialty sections, we distinguish between no publications, 1 to 5 publications, and more than 5 publications. Chart 9 shows the average number of publications by applicant type, preferred specialty, and match outcome.
U.S. seniors averaged 2.9 publications with 64.0 percent reporting at least one publication. Independent applicants reported, on average, slightly fewer experiences (2.6); however, a smaller percentage (48.7%) listed any publications.
As one might expect, the averages are higher for the more competitive specialties. And for Dermatology, Neurological Surgery, Plastic Surgery, and Radiation Oncology matched U.S. seniors reported significantly more publications when compared with unmatched seniors. Independent applicants followed a similar pattern.
U.S. Seniors
0.0
3.0
6.0
9.0
12.0
15.0
18.0
Anesth
esiol
ogy
Dermato
logy
Diagno
stic R
adiol
ogy
Emergen
cy M
edicin
e
Family
Med
icine
Genera
l Surg
ery
Intern
al Med
icine
Intern
al Med
icine/P
ediat
rics
Neurol
ogica
l Surg
ery
Neurol
ogy
Obstet
rics a
nd G
ynec
ology
Orthop
aedic
Surgery
Otolary
ngolo
gy
Patholo
gy
Pediat
rics
Physic
al Med
icine
and R
ehab
.
Plastic
Surg
ery
Psych
iatry
Radiat
ion O
ncolo
gy
Transit
ional
Year
2.0
7.4
3.7
2.0
1.4 3.
0
2.8
2.0
7.8
3.7
2.4 4.
1
4.1
4.1
2.1
2.3
8.1
2.4
8.2
4.3
1.7
4.2
2.9
1.9
1.9
2.1 2.9 4.
2 5.5
3.3
2.5
2.7 3.3
2.8
1.9 2.4
5.0
1.3
5.3
4.1
Matched Not Matched
Independent Applicants
0.0
3.0
6.0
9.0
12.0
15.0
18.0
Anesth
esiol
ogy
Dermato
logy
Diagno
stic R
adiol
ogy
Emergen
cy M
edicin
e
Family
Med
icine
Genera
l Surg
ery
Intern
al Med
icine
Intern
al Med
icine/P
ediat
rics
Neurol
ogica
l Surg
ery
Neurol
ogy
Obstet
rics a
nd G
ynec
ology
Orthop
aedic
Surgery
Otolary
ngolo
gy
Patholo
gy
Pediat
rics
Physic
al Med
icine
and R
ehab
.
Plastic
Surg
ery
Psych
iatry
Radiat
ion O
ncolo
gy
Transit
ional
Year
2.7
8.7
4.4
1.7
1.4 3.
7
2.3
1.7
9.4
4.7
1.6
7.3
11.8
6.0
1.9
1.7
16.8
2.4
8.1
4.3
2.5
6.8
4.3
1.8
1.5 4.
0
2.3
1.5
5.5
5.4
2.0 4.
3 5.8 6.2
2.2
2.3
9.4
2.3
6.3
3.5
Matched Not Matched
Sources: NRMP Data Warehouse and AAMC Data Warehouse.

Copyright ©2009 NRMP and AAMC. Copies may be made for educational or noncommercial uses only.
13 Charting Outcomes in the Match, 2009
Chart10
Mean Number of Work Experiencesby Preferred Specialty, Applicant Type, and Match Status
U.S. Seniors
0.0
1.0
2.0
3.0
4.0
5.0
Anesth
esiol
ogy
Dermato
logy
Diagno
stic R
adiol
ogy
Emergen
cy M
edicin
e
Family
Med
icine
Genera
l Surg
ery
Intern
al Med
icine
Intern
al Med
icine/P
ediat
rics
Neurol
ogica
l Surg
ery
Neurol
ogy
Obstet
rics a
nd G
ynec
ology
Orthop
aedic
Surgery
Otolary
ngolo
gy
Patholo
gy
Pediat
rics
Physic
al Med
icine
and R
ehab
.
Plastic
Surg
ery
Psych
iatry
Radiat
ion O
ncolo
gy
Transit
ional
Year
2.7
2.6
2.6 3.
1
3.0
2.6
2.4 2.
7
2.5
2.5 2.
8
2.5 2.6
2.4 2.
7 3.0
2.9
2.8
2.4 2.5
2.3 2.
6 2.7 3.
2
3.1
2.4
2.4
2.3
2.0 2.2 2.
7 2.8
2.8
2.7 2.8 2.9
2.8
2.4
2.0 2.2
Matched Not Matched
Independent Applicants
0.0
1.0
2.0
3.0
4.0
5.0
Anesth
esiol
ogy
Dermato
logy
Diagno
stic R
adiol
ogy
Emergen
cy M
edicin
e
Family
Med
icine
Genera
l Surg
ery
Intern
al Med
icine
Intern
al Med
icine/P
ediat
rics
Neurol
ogica
l Surg
ery
Neurol
ogy
Obstet
rics a
nd G
ynec
ology
Orthop
aedic
Surgery
Otolary
ngolo
gy
Patholo
gy
Pediat
rics
Physic
al Med
icine
and R
ehab
.
Plastic
Surg
ery
Psych
iatry
Radiat
ion O
ncolo
gy
Transit
ional
Year
3.1 3.
4
2.7 3.
4 3.7
3.0 3.2 3.
8
2.7 2.9 3.0 3.2
2.5 2.6 3.
3
3.1 3.
6
3.5 4.
0
3.5
3.1 3.
4
3.1 3.3
4.1
3.2 3.
6 3.8
3.1 3.3 3.
8
3.2
2.5
3.3 3.
8
3.5
2.2
4.2
2.1
2.9
Matched Not Matched
Sources: NRMP Data Warehouse and AAMC Data Warehouse.
Chart 10 shows the average number of work experiences reported on the ERAS application by applicant type, preferred specialty, and match outcome. There is little variation across specialties or within specialties (matched or not matched) for either the U.S. seniors or independent applicants. Across all specialties, however, independent applicants averaged more work experiences than U.S. seniors (3.5 versus 2.7), and a higher proportion of independent applicants (89.0% versus 84.8%) reported at least one work experience.

Copyright ©2009 NRMP and AAMC. Copies may be made for educational or noncommercial uses only.
14 Charting Outcomes in the Match, 2009
Chart11
Mean Number of Volunteer Experiencesby Preferred Specialty, Applicant Type, and Match Status
U.S. Seniors
0.01.02.03.04.05.06.07.08.0
Anesth
esiol
ogy
Dermato
logy
Diagno
stic R
adiol
ogy
Emergen
cy M
edicin
e
Family
Med
icine
Genera
l Surg
ery
Intern
al Med
icine
Intern
al Med
icine/P
ediat
rics
Neurol
ogica
l Surg
ery
Neurol
ogy
Obstet
rics a
nd G
ynec
ology
Orthop
aedic
Surgery
Otolary
ngolo
gy
Patholo
gy
Pediat
rics
Physic
al Med
icine
and R
ehab
.
Plastic
Surg
ery
Psych
iatry
Radiat
ion O
ncolo
gy
Transit
ional
Year
5.9
7.6
5.3 6.
1 6.8
6.1
5.9
7.8
5.0 5.
8
7.2
5.8
6.9
4.4
7.2
6.5 6.8
5.9
5.0
6.4
5.5
7.3
4.9 5.1
6.7
5.0 5.1
4.8
4.7
4.7
6.2
4.9
6.5
4.1
6.9
5.5 6.
1
4.3
4.0
5.6
Matched Not Matched
Independent Applicants
0.01.02.03.04.05.06.07.08.0
Anesth
esiol
ogy
Dermato
logy
Diagno
stic R
adiol
ogy
Emergen
cy M
edicin
e
Family
Med
icine
Genera
l Surg
ery
Intern
al Med
icine
Intern
al Med
icine/P
ediat
rics
Neurol
ogica
l Surg
ery
Neurol
ogy
Obstet
rics a
nd G
ynec
ology
Orthop
aedic
Surgery
Otolary
ngolo
gy
Patholo
gy
Pediat
rics
Physic
al Med
icine
and R
ehab
.
Plastic
Surg
ery
Psych
iatry
Radiat
ion O
ncolo
gy
Transit
ional
Year
3.5
7.5
4.0 5.
0
3.5
3.2
2.8
5.5
2.2 2.
7
4.2 5.
0
3.2
2.7
4.1 5.
2
3.8
3.5
4.8
3.3
3.2
5.0
2.9 3.
5
2.3 2.5
2.0 2.
5
2.0 2.3 2.
8 3.7
3.4
1.8 2.
7 3.4
3.5
2.4
2.2
3.9
Matched Not Matched
Sources: NRMP Data Warehouse and AAMC Data Warehouse.
Chart 11 provides the average number of volunteer experiences reported on the ERAS application by applicant type, preferred specialty, and match outcome. U.S. seniors who matched to Internal Medicine/Pediatrics averaged significantly more volunteer experiences than did unmatched seniors who preferred that specialty (7.8 versus 4.8). Matched U.S. seniors in all specialties averaged more volunteer experiences when compared to unmatched seniors in the same specialties, with several averaging at least one more experience.
A similar pattern can be found for independent applicants. Matched applicants averaged more volunteer experiences when compared to unmatched applicants.
Overall, U.S. seniors averaged twice as many volunteer experiences compared to independent applicants (6.2 versus 2.9), and a higher percentage of U.S. seniors (95.2% versus 72.2%) reported at least one volunteer experience.

Copyright ©2009 NRMP and AAMC. Copies may be made for educational or noncommercial uses only.
15 Charting Outcomes in the Match, 2009
Chart12
Percentage of U.S. Allopathic Seniors Who are Members of AOAby Preferred Specialty and Match Status
U.S. Seniors
0
10
20
30
40
50
60
Anesth
esiol
ogy
Dermato
logy
Diagno
stic R
adiol
ogy
Emergen
cy M
edici
ne
Family
Med
icine
Genera
l Surg
ery
Intern
al Med
icine
Intern
al Med
icine
/Ped
iatric
s
Neurol
ogica
l Surg
ery
Neurol
ogy
Obstet
rics a
nd G
ynec
ology
Orthop
aedic
Surg
ery
Otolary
ngolo
gy
Patholo
gy
Pediat
rics
Physic
al Med
icine
and R
ehab
.
Plastic
Surg
ery
Psych
iatry
Radiat
ion O
ncolo
gy
Transit
ional
Year
12
52
24
11
5
15 15
21
28
11
14
28
37
13 12
5
42
4
34
25
2
27
7
4
0 2
9 7 11
14
1
4
9
0
5
0
14
3
21
16
Matched Not Matched
Per
cent
age
Sources: NRMP Data Warehouse and AAMC Data Warehouse.
Membership in Alpha Omega Alpha (AOA), the national medical honor society, is an honor reserved for students with high academic achievement. AOA membership is limited to students in medical schools that sponsor an AOA chapter. Most, but not all, allopathic schools in the U.S. and Canada participate, and there is one foreign chapter in Beirut. Among the independent applicants, only graduate U.S. physicians, Canadians, and a small number of others could legitimately claim membership. For that reason, AOA status for each specialty in Chart 9 is reported only for U.S. seniors.
Data on AOA membership are self-reported on the ERAS application. Even for U.S. seniors, however, an analysis of its relationship with success in the Match is limited by the relatively small number of applicants who are members, by the fact that some schools do not have AOA chapters, and by the fact that other schools elect AOA members too late in the academic year for it to be considered in the application process. Overall, 14.7 percent of U.S. seniors included in this report claimed AOA membership on their ERAS application. Among applicants who matched to their preferred specialty, 15.7 percent reported AOA membership, compared to 7.8 percent of unmatched applicants.
As with several of the other measures, the most competitive specialties are able to attract the greatest proportion of AOA members. All specialties attract some AOA applicants, but for most specialties AOA members account for fewer than one in five successful applicants.

Copyright ©2009 NRMP and AAMC. Copies may be made for educational or noncommercial uses only.
16 Charting Outcomes in the Match, 2009
Chart13
Percentage of U.S. Allopathic Seniors Graduating from One of the 40 U.S. Medical Schools with the Highest NIH Funding*by Preferred Specialty and Match Status
U.S. Seniors
0
10
20
30
40
50
60
Anesth
esiol
ogy
Dermato
logy
Diagno
stic R
adiol
ogy
Emergen
cy M
edici
ne
Family
Med
icine
Genera
l Surg
ery
Intern
al Med
icine
Intern
al Med
icine
/Ped
iatric
s
Neurol
ogica
l Surg
ery
Neurol
ogy
Obstet
rics a
nd G
ynec
ology
Orthop
aedic
Surg
ery
Otolary
ngolo
gy
Patholo
gy
Pediat
rics
Physic
al Med
icine
and R
ehab
.
Plastic
Surg
ery
Psych
iatry
Radiat
ion O
ncolo
gy
Transit
ional
Year
32
49
36
33
29
34
38
27
50
36
31
37
40
37
33
27
51
36
54
46
28
23 24 23
17 18
36 36
32
29 27
24
21
30
34
25
48
8
46
40
Matched Not Matched
Per
cent
age
Sources: NRMP Data Warehouse, NIH
Some program directors may give preference to applicants with research experience or who graduated from a research-intensive medical school. To test this assumption, we obtained data on the amount of NIH grant awards and identified the 40 schools with the highest NIH funding ($100 million or more). This measure, by definition, is limited to graduates of U.S. medical schools. Overall, 35.2 percent of matched and 27.5 percent of unmatched U.S. seniors were graduates of one of the 40 medical schools with the highest NIH funding.
Chart 13 shows the percentage of U.S. seniors who graduated from those schools by specialty and match outcome. For example, 32 percent of U.S. seniors who matched in Anesthesiology were graduates of one of the 40 medical schools with the highest NIH funding and 28 percent of seniors who did not match in Anesthesiology were graduates of those schools.
Radiation Oncology had the highest percentage of matched U.S. seniors who were graduates of a medical school with the highest NIH funding. Plastic Surgery, Dermatology, Neurological Surgery, and Transition Year also had higher percentages of matched applicants from those schools compared to the other specialties. For all specialties except Internal Medicine/Pediatrics and Pediatrics, smaller percentages of seniors who did not match to their preferred specialty were graduates of a medical school with the highest NIH funding compared to seniors who matched. The average across all specialties and match outcome was 34.3 percent.
*Source: http://report.nih.gov/award/trends/AggregateData.cfm Medical Schools Only.xls. Total awards include both direct and indirect costs. Awards to the 127 U.S. allopathic medical schools ranged from $1.08 to $422 million. The 40 medical schools with the highest NIH funding received $100 million or more.

Copyright ©2009 NRMP and AAMC. Copies may be made for educational or noncommercial uses only.
17 Charting Outcomes in the Match, 2009
Chart 14 shows by preferred specialty the percentage of matched U.S. allopathic seniors who have a graduate degree. Radiation Oncology had the highest percentage (31%) and Transitional Year the lowest (14%). Radiation Oncology, Anatomic and Clinical Pathology, Dermatology, Neurological Surgery, and Neurology had the highest percentages of matched applicants with Ph.D.s and Physical Medicine and Rehabilitation, Internal Medicine/Pediatrics, and Neurological Surgery had the highest percentages with other graduate degrees.
Chart14
Percentage of Matched U.S. Allopathic Seniors Who Have a Graduate Degree
U.S. Seniors
0
5
10
15
20
25
30
35
3
12
52 1 3
52
12 11
2 3 3
16
4 1 25
22
4
11
10
1112 12 9
11 14
14
11
12 10 11
9
9
16
10
12
9
10
Anesth
esiol
ogy
Dermato
logy
Diagno
stic R
adiol
ogy
Emergen
cy M
edici
ne
Family
Med
icine
Genera
l Surg
ery
Intern
al Med
icine
Intern
al Med
icine
/Ped
iatric
s
Neurol
ogica
l Surg
ery
Neurol
ogy
Obstet
rics a
nd G
ynec
ology
Orthop
aedic
Surg
ery
Otolary
ngolo
gy
Patholo
gy
Pediat
rics
Physic
al Med
icine
and R
ehab
.
Plastic
Surg
ery
Psych
iatry
Radiat
ion O
ncolo
gy
Transit
ional
Year
Other Graduate Degree Ph.D.
Per
cent
age
Sources: NRMP Data Warehouse and AAMC Data Warehouse.

AN Anesthesiology
Copyright ©2009 NRMP and AAMC. Copies may be made for educational or noncommercial uses only.
18 Charting Outcomes in the Match, 2009

Table AN-1
Summary StatisticsAnesthesiology
Measure (n=888) (n=306) (n=179) (n=356)
U.S. Seniors Independent Applicants
Matched Unmatched Matched Unmatched
1. 11.7 10.5 6.8 3.8Mean number of contiguous ranks2. 1.3 1.5 1.5 1.7Mean number of distinct specialties ranked3. 225 217 225 214Mean USMLE Step 1 score4. 231 221 230 213Mean USMLE Step 2 score5. 1.9 1.9 1.5 1.4Mean number of research experiences6. 2.0 1.7 2.7 2.5Mean number of abstracts, presentations, and
publications7. 2.7 2.3 3.1 3.1Mean number of work experiences8. 5.9 5.5 3.5 3.2Mean number of volunteer experiences9. 11.7 2.3Percentage who are AOA members n/a n/a
10. 32.4 28.1Percentage who graduated from one of the 40 U.S. medical schools with the highest NIH funding
n/a n/a
11. 2.7 1.0Percentage who have Ph.D. degree n/a n/a12. 11.0 14.1Percentage who have another graduate degree n/a n/a
n/a: The measure either does not apply to, applies to only a small percentage of, or no reliable data were available for independent applicants.
Sources. Measures 1, 2, and match outcome are from the NRMP Data Warehouse; measures 3 and 4 are from the AAMC Data Warehouse and from the ECFMG, both by permission of the NBME and ECFMG; measures 5-9 are from the AAMC Data Warehouse; measure 10 is from the NIH website (http://report.nih.gov/award/trends/AggregateDate.cfm Medical Schools Only.xls); and measures 11 and 12 are from the AAMC Data Warehouse.
Note: USMLE Step 1 scores are not available for most osteopathic medical school graduates included in the independent applicant group.
Approximately 30 percent of U.S. allopathic medical school seniors do not take the USMLE Step 2 prior to the Match.
Copyright ©2009 NRMP and AAMC. Copies may be made for educational or noncommercial uses only.
19 Charting Outcomes in the Match, 2009

0
40
80
120
160
200
240
1 2 3 4 5 6 7 8 9 10 11 12 13 14 15 16 orMore
20 23 20 23 31 3141
59 58 61 63 72 65 57 51
213
13 218 14 15 8
21 18 19 16 24 20 16 14 10
69
Matched Not Matched
Contiguous Ranks
U.S. Seniors
0
40
80
120
160
200
240
1 2 3 4 5 6 7 8 9 10 11 12 13 14 15 16 orMore
25 18 19 14 10 12 13 9 7 13 11 4 4 4 214
131
69
3920 21 15 12 11 7 4 3 7 3 2 0
12
Matched Not Matched
Contiguous RanksSource: NRMP Data Warehouse
Independent Applicants
Copyright ©2009 NRMP and AAMC. Copies may be made for educational or noncommercial uses only.
20 Charting Outcomes in the Match, 2009
Chart AN-1
Number of Contiguous Ranks Within Preferred SpecialtyAnesthesiology

Graph AN-1
Probability of Matching to Preferred Specialty by Number of Contiguous RanksAnesthesiology
0.00
0.10
0.20
0.30
0.40
0.50
0.60
0.70
0.80
0.90
1.00
0 1 2 3 4 5 6 7 8 9 10 11 12 13 14 15 16 17 18 19 20
U.S. SeniorsIndependent Applicants
Number of Contiguous RanksSource: NRMP Data Warehouse. Note: Probabilities
calculated based on 2007-2009 applicants.
Probability of Matching
21Copyright ©2009 NRMP and AAMC. Copies may be made for educational or noncommercial uses only.
Charting Outcomes in the Match, 2009

Chart AN-2
Number of Distinct Specialties RankedAnesthesiology
0
100
200
300
400
500
600
700
800
1 2 3 4 or More
702
11368
5
189
7435 8
Matched Not Matched
Distinct Specialties Ranked
U.S. Seniors
0
100
200
300
400
500
600
700
800
1 2 3 4 or More
11839 19 3
194
10241 19
Matched Not Matched
Distinct Specialties RankedSource: NRMP Data Warehouse
Independent Applicants
Copyright ©2009 NRMP and AAMC. Copies may be made for educational or noncommercial uses only.
Charting Outcomes in the Match, 200922
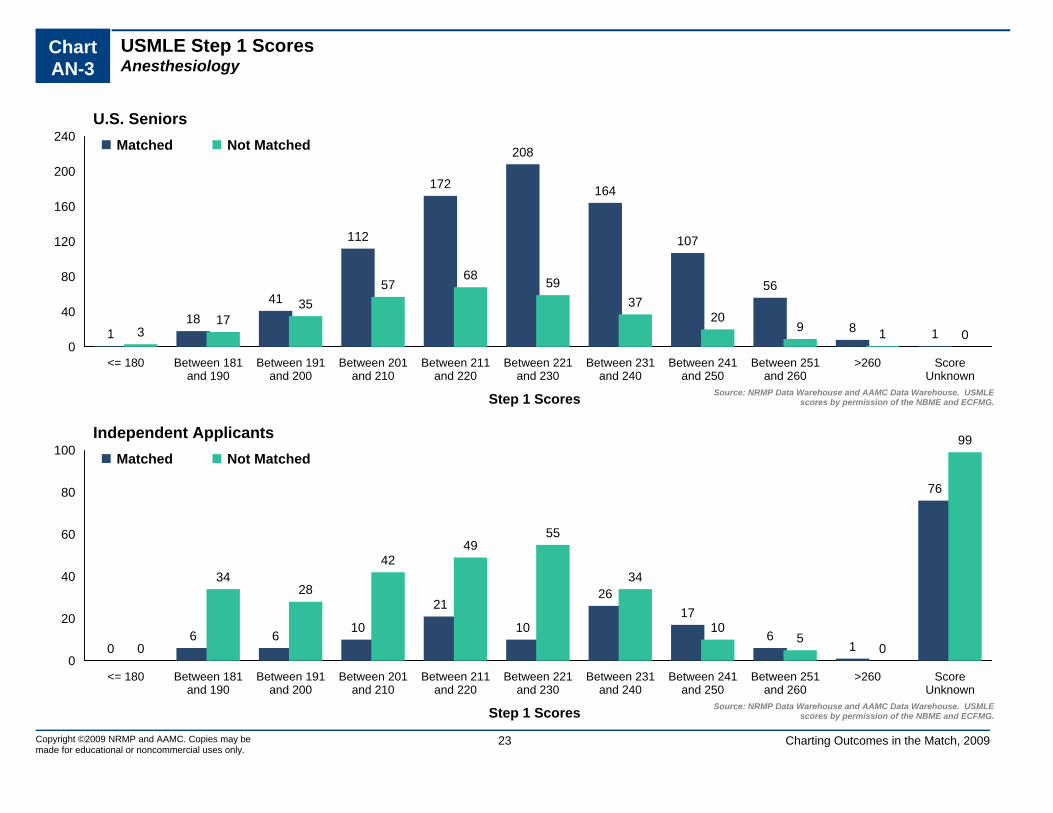
Chart AN-3
USMLE Step 1 ScoresAnesthesiology
0
40
80
120
160
200
240
<= 180 Between 181and 190
Between 191and 200
Between 201and 210
Between 211and 220
Between 221and 230
Between 231and 240
Between 241and 250
Between 251and 260
>260 ScoreUnknown
118
41
112
172
208
164
107
56
8 1317
3557
68 5937
209 1 0
Matched Not Matched
Step 1 Scores Source: NRMP Data Warehouse and AAMC Data Warehouse. USMLEscores by permission of the NBME and ECFMG.
U.S. Seniors
0
20
40
60
80
100
<= 180 Between 181and 190
Between 191and 200
Between 201and 210
Between 211and 220
Between 221and 230
Between 231and 240
Between 241and 250
Between 251and 260
>260 ScoreUnknown
06 6 10
21
10
2617
61
76
0
3428
4249
55
34
105
0
99Matched Not Matched
Step 1 Scores Source: NRMP Data Warehouse and AAMC Data Warehouse. USMLEscores by permission of the NBME and ECFMG.
Independent Applicants
Copyright ©2009 NRMP and AAMC. Copies may be made for educational or noncommercial uses only.
Charting Outcomes in the Match, 200923

Graph AN-2
Probability of Matching to Preferred Specialty by USMLE Step 1 ScoreAnesthesiology
0.00
0.10
0.20
0.30
0.40
0.50
0.60
0.70
0.80
0.90
1.00
160 180 200 220 240 260 280
U.S. SeniorsIndependent Applicants
Step 1 ScoreSource: NRMP Data Warehouse and AAMC Data Warehouse. USMLE
scores by permission of the NBME and ECFMG. Note: Probabilitiescalculated based on 2007-2009 applicants.
Probability of Matching
24Copyright ©2009 NRMP and AAMC. Copies may be made for educational or noncommercial uses only.
Charting Outcomes in the Match, 2009

Chart AN-4
USMLE Step 2 ScoresAnesthesiology
0
40
80
120
160
200
240
<= 180 Between 181and 190
Between 191and 200
Between 201and 210
Between 211and 220
Between 221and 230
Between 231and 240
Between 241and 250
Between 251and 260
>260 ScoreUnknown
9 4
34
6279
132 132
10177
41
217
6 1123
3450 48
30 3019
1
54
Matched Not Matched
Step 2 Scores Source: NRMP Data Warehouse and AAMC Data Warehouse. USMLEscores by permission of the NBME and ECFMG.
U.S. Seniors
0
20
40
60
80
100
<= 180 Between 181and 190
Between 191and 200
Between 201and 210
Between 211and 220
Between 221and 230
Between 231and 240
Between 241and 250
Between 251and 260
>260 ScoreUnknown
0 2 49
14
2720 16
92
76
7
26
45 4641
3529
20
6 2
99Matched Not Matched
Step 2 Scores Source: NRMP Data Warehouse and AAMC Data Warehouse. USMLEscores by permission of the NBME and ECFMG.
Independent Applicants
Copyright ©2009 NRMP and AAMC. Copies may be made for educational or noncommercial uses only.
Charting Outcomes in the Match, 200925

Chart AN-5
Number of Research ProjectsAnesthesiology
0
40
80
120
160
200
240
280
None 1 2 3 4 5 or More
156
242 231
148
56 5560
9266
4326 19
Matched Not Matched
Research Projects
U.S. Seniors
0
40
80
120
160
200
240
280
None 1 2 3 4 5 or More
6247 38
10 10 12
140
93
58
2916 20
Matched Not Matched
Research ProjectsSource: NRMP Data Warehouse and AAMC Data Warehouse
Independent Applicants
Copyright ©2009 NRMP and AAMC. Copies may be made for educational or noncommercial uses only.
Charting Outcomes in the Match, 200926

Chart AN-6
Number of Abstracts, Presentations, and PublicationsAnesthesiology
0
50
100
150
200
250
300
350
400
None 1 2 3 4 5 or More
355
167
120
70 59
117148
4929 30 17
33
Matched Not Matched
Publications
U.S. Seniors
0
50
100
150
200
250
300
350
400
None 1 2 3 4 5 or More
90
26 15 16 428
164
5537 29 15
56
Matched Not Matched
PublicationsSource: NRMP Data Warehouse and AAMC Data Warehouse
Independent Applicants
Copyright ©2009 NRMP and AAMC. Copies may be made for educational or noncommercial uses only.
Charting Outcomes in the Match, 200927

Chart AN-7
Number of Work ExperiencesAnesthesiology
0
40
80
120
160
200
240
None 1 2 3 4 5 or More
132
158
203
129
99
167
5263 68
5032
41
Matched Not Matched
Work Experiences
U.S. Seniors
0
40
80
120
160
200
240
None 1 2 3 4 5 or More
28 2537 33
173944
5972
5746
78
Matched Not Matched
Work ExperiencesSource: NRMP Data Warehouse and AAMC Data Warehouse
Independent Applicants
Copyright ©2009 NRMP and AAMC. Copies may be made for educational or noncommercial uses only.
Charting Outcomes in the Match, 200928

Chart AN-8
Number of Volunteer ExperiencesAnesthesiology
0
20
40
60
80
100
120
140
160
None 1 2 3 4 5 6 7 8 9 10 or More
51 50
73
10797 99
91
66 64
38
152
20 1725
4046
28 3226
12 16
44
Matched Not Matched
Volunteer Experiences
U.S. Seniors
0
20
40
60
80
100
120
140
160
None 1 2 3 4 5 6 7 8 9 10 or More
47
20 22 20 14 9 136 9 5
14
80
51 5546
27 26 2514
2 822
Matched Not Matched
Volunteer ExperiencesSource: NRMP Data Warehouse and AAMC Data Warehouse.
Independent Applicants
Copyright ©2009 NRMP and AAMC. Copies may be made for educational or noncommercial uses only.
Charting Outcomes in the Match, 200929

Chart AN-9
Other Characteristics of U.S. SeniorsAnesthesiology
0
100
200
300
400
500
600
700
800
No Yes
784
104
299
7
Matched Not Matched
AOA Membership
0
100
200
300
400
500
600
No Yes
600
288
220
86
Graduate of One of the 40 U.S. Medical Schoolswith the Highest NIH Funding
0
200
400
600
800
1,000
No Yes
864
24
303
3
Ph.D. Degree
0
100
200
300
400
500
600
700
800
No Yes
790
98
263
43
Other Graduate Degree
Sources. AOA membership from the AAMC Data Warehouse, NIH awards from http://report.nih.gov/award/trends/AggregateData.cfm Medical Schools Only.xls, Ph.D. and other graduate degrees from the AAMC Data Warehouse
Copyright ©2009 NRMP and AAMC. Copies may be made for educational or noncommercial uses only.
Charting Outcomes in the Match, 200930

DM Dermatology
Copyright ©2009 NRMP and AAMC. Copies may be made for educational or noncommercial uses only.
31 Charting Outcomes in the Match, 2009

Table DM-1
Summary StatisticsDermatology
Measure (n=264) (n=147) (n=47) (n=109)
U.S. Seniors Independent Applicants
Matched Unmatched Matched Unmatched
1. 8.6 4.4 3.6 2.2Mean number of contiguous ranks2. 2.0 2.2 1.1 1.4Mean number of distinct specialties ranked3. 242 232 225 218Mean USMLE Step 1 score4. 251 242 231 223Mean USMLE Step 2 score5. 3.6 3.1 4.2 3.0Mean number of research experiences6. 7.4 4.2 8.7 6.8Mean number of abstracts, presentations, and
publications7. 2.6 2.6 3.4 3.4Mean number of work experiences8. 7.6 7.3 7.5 5.0Mean number of volunteer experiences9. 51.5 27.2Percentage who are AOA members n/a n/a
10. 48.9 23.1Percentage who graduated from one of the 40 U.S. medical schools with the highest NIH funding
n/a n/a
11. 11.7 2.0Percentage who have Ph.D. degree n/a n/a12. 9.8 8.2Percentage who have another graduate degree n/a n/a
n/a: The measure either does not apply to, applies to only a small percentage of, or no reliable data were available for independent applicants.
Sources. Measures 1, 2, and match outcome are from the NRMP Data Warehouse; measures 3 and 4 are from the AAMC Data Warehouse and from the ECFMG, both by permission of the NBME and ECFMG; measures 5-9 are from the AAMC Data Warehouse; measure 10 is from the NIH website (http://report.nih.gov/award/trends/AggregateDate.cfm Medical Schools Only.xls); and measures 11 and 12 are from the AAMC Data Warehouse.
Note: USMLE Step 1 scores are not available for most osteopathic medical school graduates included in the independent applicant group.
Approximately 30 percent of U.S. allopathic medical school seniors do not take the USMLE Step 2 prior to the Match.
Copyright ©2009 NRMP and AAMC. Copies may be made for educational or noncommercial uses only.
32 Charting Outcomes in the Match, 2009

0
10
20
30
40
50
60
70
1 2 3 4 5 6 7 8 9 10 11 12 13 14 15 16 orMore
814
1922 22
26
17 1711
14
2117 16
104
2623
2622
1913 14
7 94 3
03 1 0 0
3
Matched Not Matched
Contiguous Ranks
U.S. Seniors
0
10
20
30
40
50
60
70
1 2 3 4 5 6 7 8 9 10 11 12 13 14 15 16 orMore
148 5 5 6
1 3 2 2 0 1 0 0 0 0 0
64
19
8 73 3 1 0 0 3 0 0 0 0 0 1
Matched Not Matched
Contiguous RanksSource: NRMP Data Warehouse
Independent Applicants
Copyright ©2009 NRMP and AAMC. Copies may be made for educational or noncommercial uses only.
33 Charting Outcomes in the Match, 2009
Chart DM-1
Number of Contiguous Ranks Within Preferred SpecialtyDermatology
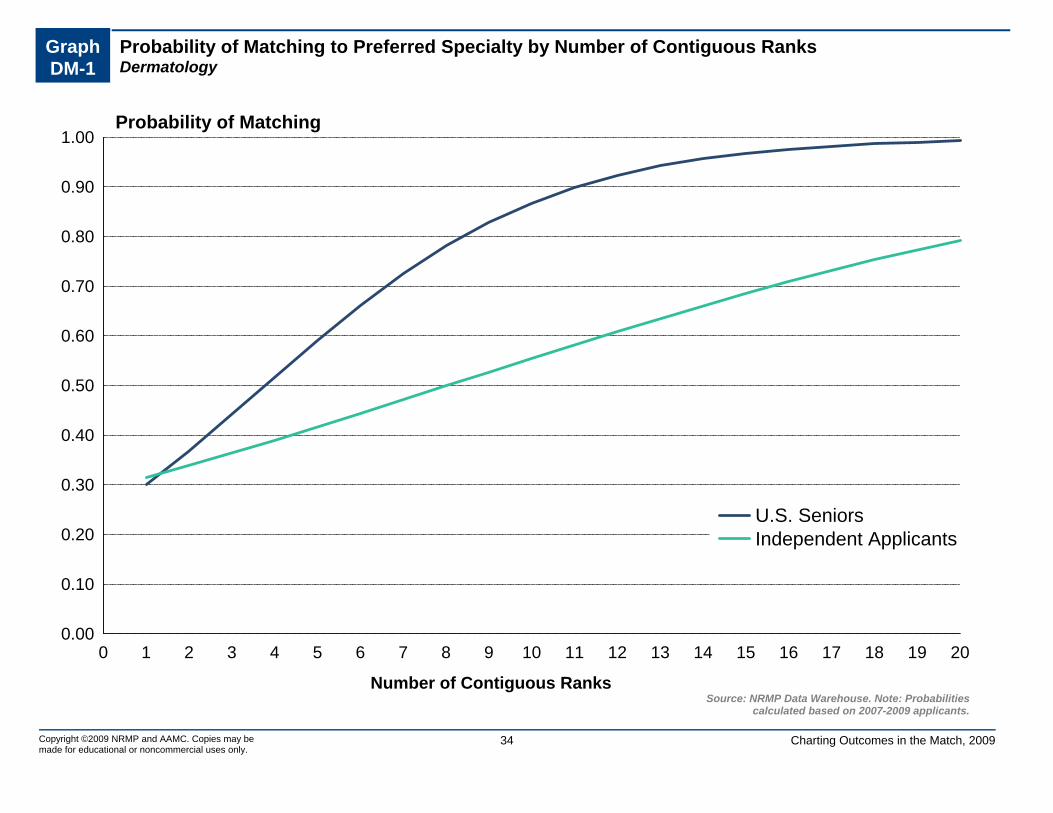
Graph DM-1
Probability of Matching to Preferred Specialty by Number of Contiguous RanksDermatology
0.00
0.10
0.20
0.30
0.40
0.50
0.60
0.70
0.80
0.90
1.00
0 1 2 3 4 5 6 7 8 9 10 11 12 13 14 15 16 17 18 19 20
U.S. SeniorsIndependent Applicants
Number of Contiguous RanksSource: NRMP Data Warehouse. Note: Probabilities
calculated based on 2007-2009 applicants.
Probability of Matching
34Copyright ©2009 NRMP and AAMC. Copies may be made for educational or noncommercial uses only.
Charting Outcomes in the Match, 2009

Chart DM-2
Number of Distinct Specialties RankedDermatology
0
20
40
60
80
100
120
140
1 2 3 4 or More
68
125
65
6
28
75
37
7
Matched Not Matched
Distinct Specialties Ranked
U.S. Seniors
0
20
40
60
80
100
120
140
1 2 3 4 or More
42
3 2 0
85
133 8
Matched Not Matched
Distinct Specialties RankedSource: NRMP Data Warehouse
Independent Applicants
Copyright ©2009 NRMP and AAMC. Copies may be made for educational or noncommercial uses only.
Charting Outcomes in the Match, 200935

Chart DM-3
USMLE Step 1 ScoresDermatology
0
10
20
30
40
50
60
70
80
<= 180 Between 181and 190
Between 191and 200
Between 201and 210
Between 211and 220
Between 221and 230
Between 231and 240
Between 241and 250
Between 251and 260
>260 ScoreUnknown
0 1 05
13
31
59
75
64
16
00 2 411
15
3038
22 19
4 2
Matched Not Matched
Step 1 Scores Source: NRMP Data Warehouse and AAMC Data Warehouse. USMLEscores by permission of the NBME and ECFMG.
U.S. Seniors
0
4
8
12
16
20
<= 180 Between 181and 190
Between 191and 200
Between 201and 210
Between 211and 220
Between 221and 230
Between 231and 240
Between 241and 250
Between 251and 260
>260 ScoreUnknown
0
35
4
76
8 8
32
10
5
1719
7
12
18
12
01
18Matched Not Matched
Step 1 Scores Source: NRMP Data Warehouse and AAMC Data Warehouse. USMLEscores by permission of the NBME and ECFMG.
Independent Applicants
Copyright ©2009 NRMP and AAMC. Copies may be made for educational or noncommercial uses only.
Charting Outcomes in the Match, 200936

Graph DM-2
Probability of Matching to Preferred Specialty by USMLE Step 1 ScoreDermatology
0.00
0.10
0.20
0.30
0.40
0.50
0.60
0.70
0.80
0.90
1.00
160 180 200 220 240 260 280
Independent ApplicantsU.S. Seniors
Step 1 ScoreSource: NRMP Data Warehouse and AAMC Data Warehouse. USMLE
scores by permission of the NBME and ECFMG. Note: Probabilitiescalculated based on 2007-2009 applicants.
Probability of Matching
37Copyright ©2009 NRMP and AAMC. Copies may be made for educational or noncommercial uses only.
Charting Outcomes in the Match, 2009

Chart DM-4
USMLE Step 2 ScoresDermatology
0
20
40
60
80
100
120
<= 180 Between 181and 190
Between 191and 200
Between 201and 210
Between 211and 220
Between 221and 230
Between 231and 240
Between 241and 250
Between 251and 260
>260 ScoreUnknown
0 0 0 0 39
26 30 3244
120
0 1 27 6 10 13
2918 20
41
Matched Not Matched
Step 2 Scores Source: NRMP Data Warehouse and AAMC Data Warehouse. USMLEscores by permission of the NBME and ECFMG.
U.S. Seniors
0
4
8
12
16
20
<= 180 Between 181and 190
Between 191and 200
Between 201and 210
Between 211and 220
Between 221and 230
Between 231and 240
Between 241and 250
Between 251and 260
>260 ScoreUnknown
2 20
57
2
10
68
4
10
5
10
1413
1213
7
14
2
19Matched Not Matched
Step 2 Scores Source: NRMP Data Warehouse and AAMC Data Warehouse. USMLEscores by permission of the NBME and ECFMG.
Independent Applicants
Copyright ©2009 NRMP and AAMC. Copies may be made for educational or noncommercial uses only.
Charting Outcomes in the Match, 200938

Chart DM-5
Number of Research ProjectsDermatology
0
10
20
30
40
50
60
70
None 1 2 3 4 5 or More
7
18
54
6258
65
9
2226
41
25 24
Matched Not Matched
Research Projects
U.S. Seniors
0
10
20
30
40
50
60
70
None 1 2 3 4 5 or More
4 47 5
9
1824
1419
12 11
29
Matched Not Matched
Research ProjectsSource: NRMP Data Warehouse and AAMC Data Warehouse
Independent Applicants
Copyright ©2009 NRMP and AAMC. Copies may be made for educational or noncommercial uses only.
Charting Outcomes in the Match, 200939

Chart DM-6
Number of Abstracts, Presentations, and PublicationsDermatology
0
20
40
60
80
100
120
140
160
None 1 2 3 4 5 or More
22 2718 21
32
144
26 31
15 13 14
48
Matched Not Matched
Publications
U.S. Seniors
0
20
40
60
80
100
120
140
160
None 1 2 3 4 5 or More
3 7 4 1 4
282314
4 8 3
57
Matched Not Matched
PublicationsSource: NRMP Data Warehouse and AAMC Data Warehouse
Independent Applicants
Copyright ©2009 NRMP and AAMC. Copies may be made for educational or noncommercial uses only.
Charting Outcomes in the Match, 200940

Chart DM-7
Number of Work ExperiencesDermatology
0
10
20
30
40
50
60
70
None 1 2 3 4 5 or More
42 44
67
46
23
42
22 2430
2622 23
Matched Not Matched
Work Experiences
U.S. Seniors
0
10
20
30
40
50
60
70
None 1 2 3 4 5 or More
4 511 11
610
14 1521
1814
27
Matched Not Matched
Work ExperiencesSource: NRMP Data Warehouse and AAMC Data Warehouse
Independent Applicants
Copyright ©2009 NRMP and AAMC. Copies may be made for educational or noncommercial uses only.
Charting Outcomes in the Match, 200941

Chart DM-8
Number of Volunteer ExperiencesDermatology
0
10
20
30
40
50
60
70
80
None 1 2 3 4 5 6 7 8 9 10 or More
6 7 9
2520
34
2428
17 16
78
3 3 5
21
8
17 15 1410 11
40
Matched Not Matched
Volunteer Experiences
U.S. Seniors
0
10
20
30
40
50
60
70
80
None 1 2 3 4 5 6 7 8 9 10 or More
1 4 3 1 4 7 73 5
1
1118
7 815 13
9 115 6 4
13
Matched Not Matched
Volunteer ExperiencesSource: NRMP Data Warehouse and AAMC Data Warehouse.
Independent Applicants
Copyright ©2009 NRMP and AAMC. Copies may be made for educational or noncommercial uses only.
Charting Outcomes in the Match, 200942

Chart DM-9
Other Characteristics of U.S. SeniorsDermatology
0
20
40
60
80
100
120
140
No Yes
128136
107
40
Matched Not MatchedAOA Membership
0
20
40
60
80
100
120
140
No Yes
135129
113
34
Graduate of One of the 40 U.S. Medical Schoolswith the Highest NIH Funding
0
40
80
120
160
200
240
No Yes
233
31
144
3
Ph.D. Degree
0
40
80
120
160
200
240
No Yes
238
26
135
12
Other Graduate Degree
Sources. AOA membership from the AAMC Data Warehouse, NIH awards from http://report.nih.gov/award/trends/AggregateData.cfm Medical Schools Only.xls, Ph.D. and other graduate degrees from the AAMC Data Warehouse
Copyright ©2009 NRMP and AAMC. Copies may be made for educational or noncommercial uses only.
Charting Outcomes in the Match, 200943
DR Diagnostic Radiology
Copyright ©2009 NRMP and AAMC. Copies may be made for educational or noncommercial uses only.
44 Charting Outcomes in the Match, 2009
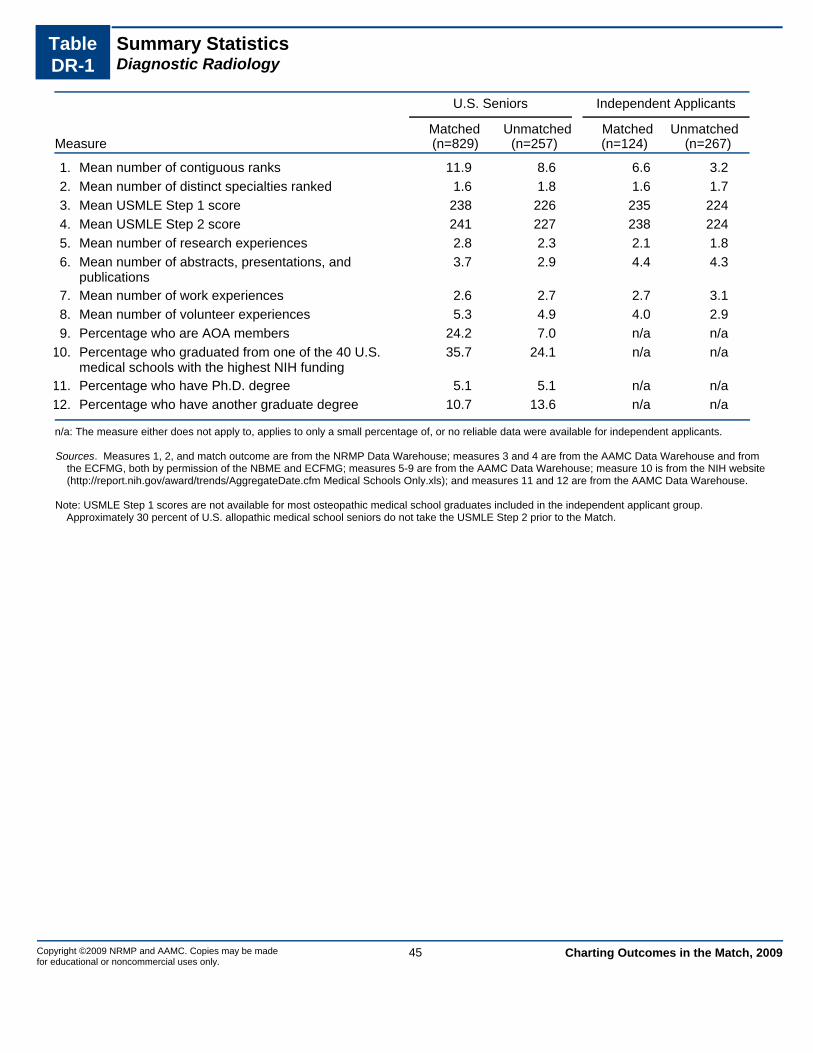
Table DR-1
Summary StatisticsDiagnostic Radiology
Measure (n=829) (n=257) (n=124) (n=267)
U.S. Seniors Independent Applicants
Matched Unmatched Matched Unmatched
1. 11.9 8.6 6.6 3.2Mean number of contiguous ranks2. 1.6 1.8 1.6 1.7Mean number of distinct specialties ranked3. 238 226 235 224Mean USMLE Step 1 score4. 241 227 238 224Mean USMLE Step 2 score5. 2.8 2.3 2.1 1.8Mean number of research experiences6. 3.7 2.9 4.4 4.3Mean number of abstracts, presentations, and
publications7. 2.6 2.7 2.7 3.1Mean number of work experiences8. 5.3 4.9 4.0 2.9Mean number of volunteer experiences9. 24.2 7.0Percentage who are AOA members n/a n/a
10. 35.7 24.1Percentage who graduated from one of the 40 U.S. medical schools with the highest NIH funding
n/a n/a
11. 5.1 5.1Percentage who have Ph.D. degree n/a n/a12. 10.7 13.6Percentage who have another graduate degree n/a n/a
n/a: The measure either does not apply to, applies to only a small percentage of, or no reliable data were available for independent applicants.
Sources. Measures 1, 2, and match outcome are from the NRMP Data Warehouse; measures 3 and 4 are from the AAMC Data Warehouse and from the ECFMG, both by permission of the NBME and ECFMG; measures 5-9 are from the AAMC Data Warehouse; measure 10 is from the NIH website (http://report.nih.gov/award/trends/AggregateDate.cfm Medical Schools Only.xls); and measures 11 and 12 are from the AAMC Data Warehouse.
Note: USMLE Step 1 scores are not available for most osteopathic medical school graduates included in the independent applicant group.
Approximately 30 percent of U.S. allopathic medical school seniors do not take the USMLE Step 2 prior to the Match.
Copyright ©2009 NRMP and AAMC. Copies may be made for educational or noncommercial uses only.
45 Charting Outcomes in the Match, 2009
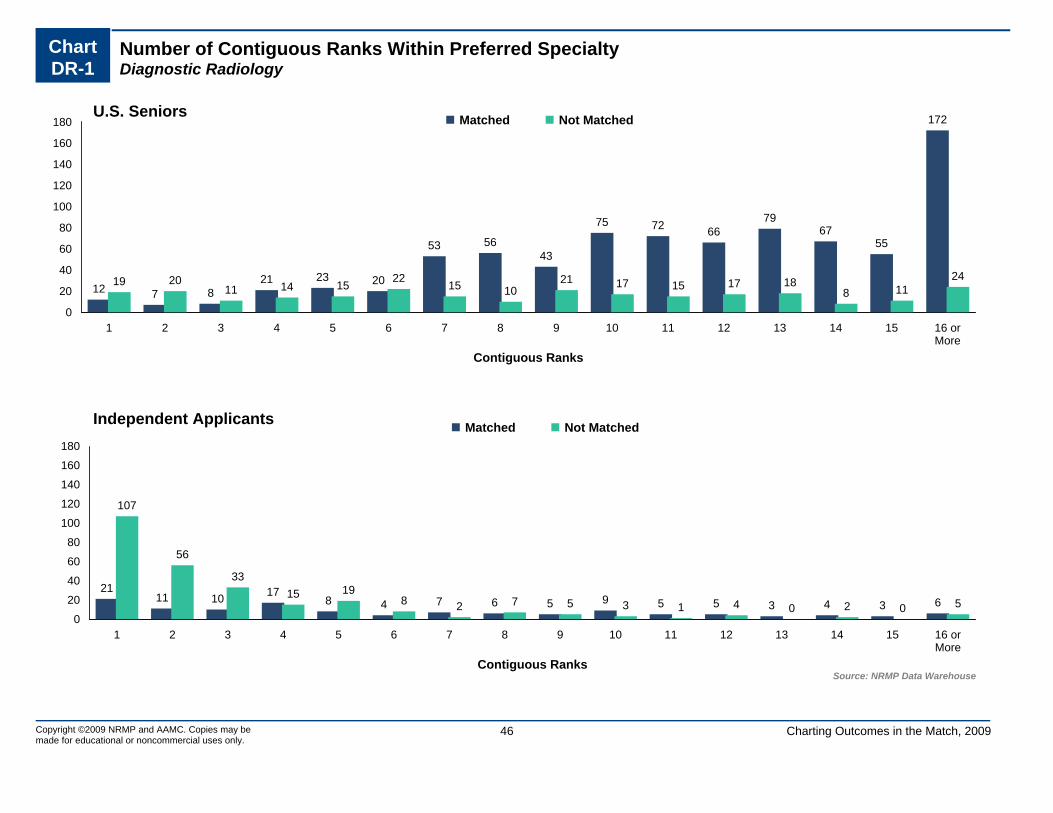
0
20
40
60
80
100
120
140
160
180
1 2 3 4 5 6 7 8 9 10 11 12 13 14 15 16 orMore
12 7 821 23 20
53 5643
75 72 6679
6755
172
19 2011 14 15 22 15 10
21 17 15 17 188 11
24
Matched Not Matched
Contiguous Ranks
U.S. Seniors
0
20
40
60
80
100
120
140
160
180
1 2 3 4 5 6 7 8 9 10 11 12 13 14 15 16 orMore
2111 10 17
8 4 7 6 5 9 5 5 3 4 3 6
107
56
3315 19
8 2 7 5 3 1 4 0 2 0 5
Matched Not Matched
Contiguous RanksSource: NRMP Data Warehouse
Independent Applicants
Copyright ©2009 NRMP and AAMC. Copies may be made for educational or noncommercial uses only.
46 Charting Outcomes in the Match, 2009
Chart DR-1
Number of Contiguous Ranks Within Preferred SpecialtyDiagnostic Radiology
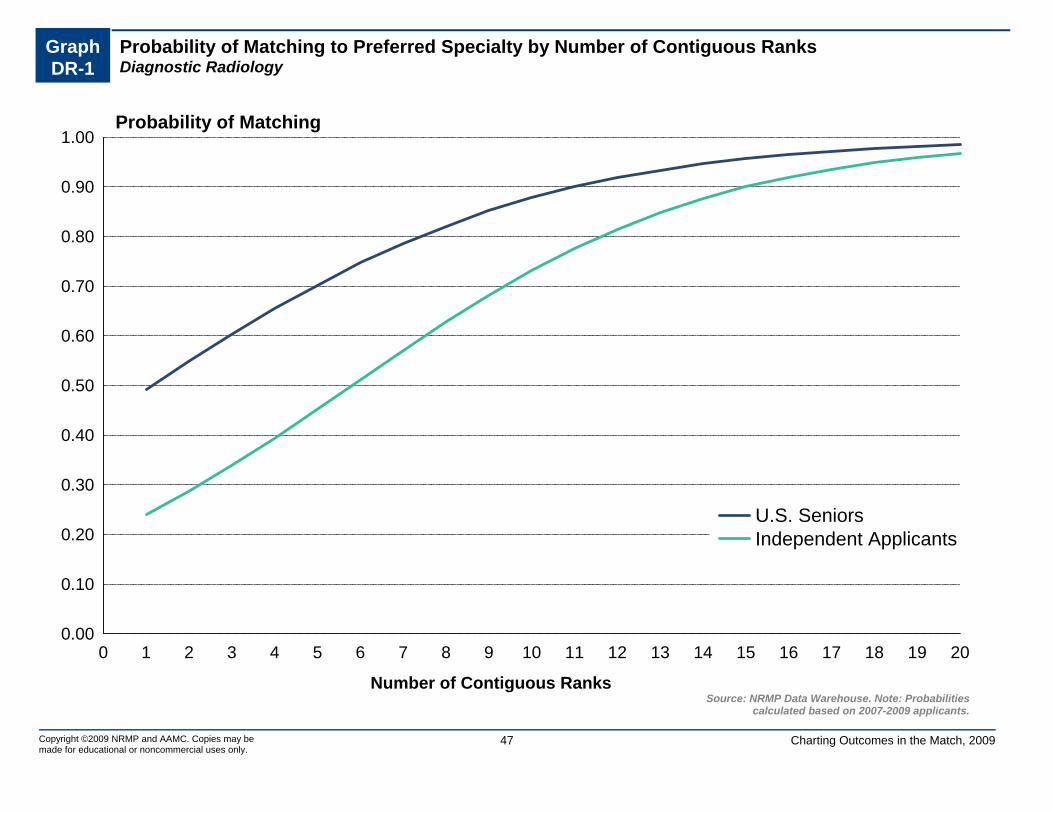
Graph DR-1
Probability of Matching to Preferred Specialty by Number of Contiguous RanksDiagnostic Radiology
0.00
0.10
0.20
0.30
0.40
0.50
0.60
0.70
0.80
0.90
1.00
0 1 2 3 4 5 6 7 8 9 10 11 12 13 14 15 16 17 18 19 20
U.S. SeniorsIndependent Applicants
Number of Contiguous RanksSource: NRMP Data Warehouse. Note: Probabilities
calculated based on 2007-2009 applicants.
Probability of Matching
47Copyright ©2009 NRMP and AAMC. Copies may be made for educational or noncommercial uses only.
Charting Outcomes in the Match, 2009

Chart DR-2
Number of Distinct Specialties RankedDiagnostic Radiology
0
100
200
300
400
500 490
195
133
11
124
68 59
6
1 2 3 4 or More
Matched Not Matched
Distinct Specialties Ranked
U.S. Seniors
0
100
200
300
400
500
1 2 3 4 or More
7626 17 5
146
63 4711
Matched Not Matched
Distinct Specialties RankedSource: NRMP Data Warehouse
Independent Applicants
Copyright ©2009 NRMP and AAMC. Copies may be made for educational or noncommercial uses only.
Charting Outcomes in the Match, 200948

Chart DR-3
USMLE Step 1 ScoresDiagnostic Radiology
0
40
80
120
160
200
240
<= 180 Between 181and 190
Between 191and 200
Between 201and 210
Between 211and 220
Between 221and 230
Between 231and 240
Between 241and 250
Between 251and 260
>260 ScoreUnknown
0 415
30
59
107
223 216
133
36
61 518
3040 44 49 45
184 3
Matched Not Matched
Step 1 Scores Source: NRMP Data Warehouse and AAMC Data Warehouse. USMLEscores by permission of the NBME and ECFMG.
U.S. Seniors
0
10
20
30
40
50
60
70
<= 180 Between 181and 190
Between 191and 200
Between 201and 210
Between 211and 220
Between 221and 230
Between 231and 240
Between 241and 250
Between 251and 260
>260 ScoreUnknown
0 14 5 4
14
2522
7 5
37
0
1722
18
26
4136
2319
2
63Matched Not Matched
Step 1 Scores Source: NRMP Data Warehouse and AAMC Data Warehouse. USMLEscores by permission of the NBME and ECFMG.
Independent Applicants
Copyright ©2009 NRMP and AAMC. Copies may be made for educational or noncommercial uses only.
Charting Outcomes in the Match, 200949

Graph DR-2
Probability of Matching to Preferred Specialty by USMLE Step 1 ScoreDiagnostic Radiology
0.00
0.10
0.20
0.30
0.40
0.50
0.60
0.70
0.80
0.90
1.00
160 180 200 220 240 260 280
Independent ApplicantsU.S. Seniors
Step 1 ScoreSource: NRMP Data Warehouse and AAMC Data Warehouse. USMLE
scores by permission of the NBME and ECFMG. Note: Probabilitiescalculated based on 2007-2009 applicants.
Probability of Matching
50Copyright ©2009 NRMP and AAMC. Copies may be made for educational or noncommercial uses only.
Charting Outcomes in the Match, 2009

Chart DR-4
USMLE Step 2 ScoresDiagnostic Radiology
0
50
100
150
200
250
300
350
400
<= 180 Between 181and 190
Between 191and 200
Between 201and 210
Between 211and 220
Between 221and 230
Between 231and 240
Between 241and 250
Between 251and 260
>260 ScoreUnknown
0 3 3 1537
6482
11693
56
360
3 8 11 24 27 28 30 31 18 11
66
Matched Not Matched
Step 2 Scores Source: NRMP Data Warehouse and AAMC Data Warehouse. USMLEscores by permission of the NBME and ECFMG.
U.S. Seniors
0
10
20
30
40
50
60
70
<= 180 Between 181and 190
Between 191and 200
Between 201and 210
Between 211and 220
Between 221and 230
Between 231and 240
Between 241and 250
Between 251and 260
>260 ScoreUnknown
0 0 1 310
1520
1612
9
38
3
16 16
37
19
30 3023 23
9
61Matched Not Matched
Step 2 Scores Source: NRMP Data Warehouse and AAMC Data Warehouse. USMLEscores by permission of the NBME and ECFMG.
Independent Applicants
Copyright ©2009 NRMP and AAMC. Copies may be made for educational or noncommercial uses only.
Charting Outcomes in the Match, 200951

Chart DR-5
Number of Research ProjectsDiagnostic Radiology
0
30
60
90
120
150
180
None 1 2 3 4 5 or More
78
138
179169
134 131
29
7252 44
33 27
Matched Not Matched
Research Projects
U.S. Seniors
0
30
60
90
120
150
180
None 1 2 3 4 5 or More
29 26 2713 16 13
90
64
44
20 22 27
Matched Not Matched
Research ProjectsSource: NRMP Data Warehouse and AAMC Data Warehouse
Independent Applicants
Copyright ©2009 NRMP and AAMC. Copies may be made for educational or noncommercial uses only.
Charting Outcomes in the Match, 200952

Chart DR-6
Number of Abstracts, Presentations, and PublicationsDiagnostic Radiology
0
40
80
120
160
200
240
None 1 2 3 4 5 or More
231
132
95 95
57
219
89
55
3119 16
47
Matched Not Matched
Publications
U.S. Seniors
0
40
80
120
160
200
240
None 1 2 3 4 5 or More
52
14 7 12 4
35
100
3721 16 21
72
Matched Not Matched
PublicationsSource: NRMP Data Warehouse and AAMC Data Warehouse
Independent Applicants
Copyright ©2009 NRMP and AAMC. Copies may be made for educational or noncommercial uses only.
Charting Outcomes in the Match, 200953

Chart DR-7
Number of Work ExperiencesDiagnostic Radiology
0
25
50
75
100
125
150
175
200
None 1 2 3 4 5 or More
113
153
200
145
93
125
4151 51
34 3347
Matched Not Matched
Work Experiences
U.S. Seniors
0
25
50
75
100
125
150
175
200
None 1 2 3 4 5 or More
1528 27 21
13 2038
49 4637 30
67
Matched Not Matched
Work ExperiencesSource: NRMP Data Warehouse and AAMC Data Warehouse
Independent Applicants
Copyright ©2009 NRMP and AAMC. Copies may be made for educational or noncommercial uses only.
Charting Outcomes in the Match, 200954

Chart DR-8
Number of Volunteer ExperiencesDiagnostic Radiology
0
20
40
60
80
100
120
140
160
None 1 2 3 4 5 6 7 8 9 10 or More
4148
74
107
144
8876 80
37 42
92
19 20 25
4329 30 25
179 11
29
Matched Not Matched
Volunteer Experiences
U.S. Seniors
0
20
40
60
80
100
120
140
160
None 1 2 3 4 5 6 7 8 9 10 or More
20 14 17 18 14 10 9 5 5 4 8
80
39 42
24 2415 15
7 5 214
Matched Not Matched
Volunteer ExperiencesSource: NRMP Data Warehouse and AAMC Data Warehouse.
Independent Applicants
Copyright ©2009 NRMP and AAMC. Copies may be made for educational or noncommercial uses only.
Charting Outcomes in the Match, 200955

Chart DR-9
Other Characteristics of U.S. SeniorsDiagnostic Radiology
0
100
200
300
400
500
600
700
No Yes
628
201239
18
Matched Not Matched
AOA Membership
0
100
200
300
400
500
600
No Yes
533
296
195
62
Graduate of One of the 40 U.S. Medical Schoolswith the Highest NIH Funding
0
100
200
300
400
500
600
700
800
No Yes
787
42
244
13
Ph.D. Degree
0
100
200
300
400
500
600
700
800
No Yes
740
89
222
35
Other Graduate Degree
Sources. AOA membership from the AAMC Data Warehouse, NIH awards from http://report.nih.gov/award/trends/AggregateData.cfm Medical Schools Only.xls, Ph.D. and other graduate degrees from the AAMC Data Warehouse
Copyright ©2009 NRMP and AAMC. Copies may be made for educational or noncommercial uses only.
Charting Outcomes in the Match, 200956

EM Emergency Medicine
Copyright ©2009 NRMP and AAMC. Copies may be made for educational or noncommercial uses only.
57 Charting Outcomes in the Match, 2009

Table EM-1
Summary StatisticsEmergency Medicine
Measure (n=1,128) (n=117) (n=308) (n=264)
U.S. Seniors Independent Applicants
Matched Unmatched Matched Unmatched
1. 9.9 6.1 6.3 3.1Mean number of contiguous ranks2. 1.1 1.4 1.2 1.4Mean number of distinct specialties ranked3. 222 207 219 206Mean USMLE Step 1 score4. 230 209 226 208Mean USMLE Step 2 score5. 1.8 1.5 1.2 1.1Mean number of research experiences6. 2.0 1.9 1.7 1.8Mean number of abstracts, presentations, and
publications7. 3.1 3.2 3.4 3.3Mean number of work experiences8. 6.1 5.1 5.0 3.5Mean number of volunteer experiences9. 11.0 4.3Percentage who are AOA members n/a n/a
10. 32.6 23.1Percentage who graduated from one of the 40 U.S. medical schools with the highest NIH funding
n/a n/a
11. 1.6 1.7Percentage who have Ph.D. degree n/a n/a12. 12.2 15.4Percentage who have another graduate degree n/a n/a
n/a: The measure either does not apply to, applies to only a small percentage of, or no reliable data were available for independent applicants.
Sources. Measures 1, 2, and match outcome are from the NRMP Data Warehouse; measures 3 and 4 are from the AAMC Data Warehouse and from the ECFMG, both by permission of the NBME and ECFMG; measures 5-9 are from the AAMC Data Warehouse; measure 10 is from the NIH website (http://report.nih.gov/award/trends/AggregateDate.cfm Medical Schools Only.xls); and measures 11 and 12 are from the AAMC Data Warehouse.
Note: USMLE Step 1 scores are not available for most osteopathic medical school graduates included in the independent applicant group.
Approximately 30 percent of U.S. allopathic medical school seniors do not take the USMLE Step 2 prior to the Match.
Copyright ©2009 NRMP and AAMC. Copies may be made for educational or noncommercial uses only.
58 Charting Outcomes in the Match, 2009

0
20
40
60
80
100
120
140
160
180
1 2 3 4 5 6 7 8 9 10 11 12 13 14 15 16 orMore
15 16 2230
3848
76
112122
171
129
111
70 71
29
68
12 16 12 8 9 9 10 9 11 5 5 1 3 3 2 2
Matched Not Matched
Contiguous Ranks
U.S. Seniors
0
20
40
60
80
100
120
140
160
180
1 2 3 4 5 6 7 8 9 10 11 12 13 14 15 16 orMore
49
22 2030
20 2039
19 18 18 13 11 144 4 7
113
52
2718 19
7 3 4 5 7 1 1 1 1 1 4
Matched Not Matched
Contiguous RanksSource: NRMP Data Warehouse
Independent Applicants
Copyright ©2009 NRMP and AAMC. Copies may be made for educational or noncommercial uses only.
59 Charting Outcomes in the Match, 2009
Chart EM-1
Number of Contiguous Ranks Within Preferred SpecialtyEmergency Medicine

Graph EM-1
Probability of Matching to Preferred Specialty by Number of Contiguous RanksEmergency Medicine
0.00
0.10
0.20
0.30
0.40
0.50
0.60
0.70
0.80
0.90
1.00
0 1 2 3 4 5 6 7 8 9 10 11 12 13 14 15 16 17 18 19 20
U.S. SeniorsIndependent Applicants
Number of Contiguous RanksSource: NRMP Data Warehouse. Note: Probabilities
calculated based on 2007-2009 applicants.
Probability of Matching
60Copyright ©2009 NRMP and AAMC. Copies may be made for educational or noncommercial uses only.
Charting Outcomes in the Match, 2009

Chart EM-2
Number of Distinct Specialties RankedEmergency Medicine
0
200
400
600
800
1,000
1,200
1 2 3 4 or More
1,049
6710 2
8032 3 2
Matched Not Matched
Distinct Specialties Ranked
U.S. Seniors
0
200
400
600
800
1,000
1,200
1 2 3 4 or More
260
41 4 3
17469 18 3
Matched Not Matched
Distinct Specialties RankedSource: NRMP Data Warehouse
Independent Applicants
Copyright ©2009 NRMP and AAMC. Copies may be made for educational or noncommercial uses only.
Charting Outcomes in the Match, 200961

Chart EM-3
USMLE Step 1 ScoresEmergency Medicine
0
40
80
120
160
200
240
<= 180 Between 181and 190
Between 191and 200
Between 201and 210
Between 211and 220
Between 221and 230
Between 231and 240
Between 241and 250
Between 251and 260
>260 ScoreUnknown
3
34
85
172
220233
197
119
53
1203
17 23 3119 10 11
1 2 0 0
Matched Not Matched
Step 1 Scores Source: NRMP Data Warehouse and AAMC Data Warehouse. USMLEscores by permission of the NBME and ECFMG.
U.S. Seniors
0
20
40
60
80
100
120
140
160
180
<= 180 Between 181and 190
Between 191and 200
Between 201and 210
Between 211and 220
Between 221and 230
Between 231and 240
Between 241and 250
Between 251and 260
>260 ScoreUnknown
014 15
25 21 21 2310 9 3
167
1
3147 43
21 26
6 7 2 0
80
Matched Not Matched
Step 1 Scores Source: NRMP Data Warehouse and AAMC Data Warehouse. USMLEscores by permission of the NBME and ECFMG.
Independent Applicants
Copyright ©2009 NRMP and AAMC. Copies may be made for educational or noncommercial uses only.
Charting Outcomes in the Match, 200962

Graph EM-2
Probability of Matching to Preferred Specialty by USMLE Step 1 ScoreEmergency Medicine
0.00
0.10
0.20
0.30
0.40
0.50
0.60
0.70
0.80
0.90
1.00
160 180 200 220 240 260 280
U.S. SeniorsIndependent Applicants
Step 1 ScoreSource: NRMP Data Warehouse and AAMC Data Warehouse. USMLE
scores by permission of the NBME and ECFMG. Note: Probabilitiescalculated based on 2007-2009 applicants.
Probability of Matching
63Copyright ©2009 NRMP and AAMC. Copies may be made for educational or noncommercial uses only.
Charting Outcomes in the Match, 2009

Chart EM-4
USMLE Step 2 ScoresEmergency Medicine
0
40
80
120
160
200
240
280
<= 180 Between 181and 190
Between 191and 200
Between 201and 210
Between 211and 220
Between 221and 230
Between 231and 240
Between 241and 250
Between 251and 260
>260 ScoreUnknown
5 9
47
91116
137
176155
79
40
273
11 10 12 16 15 6 5 6 2 430
Matched Not Matched
Step 2 Scores Source: NRMP Data Warehouse and AAMC Data Warehouse. USMLEscores by permission of the NBME and ECFMG.
U.S. Seniors
0
20
40
60
80
100
120
140
160
180
<= 180 Between 181and 190
Between 191and 200
Between 201and 210
Between 211and 220
Between 221and 230
Between 231and 240
Between 241and 250
Between 251and 260
>260 ScoreUnknown
3 6 1019 17 24 22 19 16
6
166
3
3242 35 29
17 12 10 3 1
80
Matched Not Matched
Step 2 Scores Source: NRMP Data Warehouse and AAMC Data Warehouse. USMLEscores by permission of the NBME and ECFMG.
Independent Applicants
Copyright ©2009 NRMP and AAMC. Copies may be made for educational or noncommercial uses only.
Charting Outcomes in the Match, 200964

Chart EM-5
Number of Research ProjectsEmergency Medicine
0
50
100
150
200
250
300
350
None 1 2 3 4 5 or More
231
331
282
147
74 6331 33 28 16 4 5
Matched Not Matched
Research Projects
U.S. Seniors
0
50
100
150
200
250
300
350
None 1 2 3 4 5 or More
123
8552
22 12 14
123
6743
16 6 9
Matched Not Matched
Research ProjectsSource: NRMP Data Warehouse and AAMC Data Warehouse
Independent Applicants
Copyright ©2009 NRMP and AAMC. Copies may be made for educational or noncommercial uses only.
Charting Outcomes in the Match, 200965

Chart EM-6
Number of Abstracts, Presentations, and PublicationsEmergency Medicine
0
100
200
300
400
500
None 1 2 3 4 5 or More
493
213
138
8362
139
5321 15 6 7 15
Matched Not Matched
Publications
U.S. Seniors
0
100
200
300
400
500
None 1 2 3 4 5 or More
186
37 21 20 638
162
35 16 12 10 29
Matched Not Matched
PublicationsSource: NRMP Data Warehouse and AAMC Data Warehouse
Independent Applicants
Copyright ©2009 NRMP and AAMC. Copies may be made for educational or noncommercial uses only.
Charting Outcomes in the Match, 200966

Chart EM-7
Number of Work ExperiencesEmergency Medicine
0
40
80
120
160
200
240
280
None 1 2 3 4 5 or More
145
173
221
184
149
256
9 1729 25
1126
Matched Not Matched
Work Experiences
U.S. Seniors
0
40
80
120
160
200
240
280
None 1 2 3 4 5 or More
2651 54 59
40
78
42 33 44 36 39
70
Matched Not Matched
Work ExperiencesSource: NRMP Data Warehouse and AAMC Data Warehouse
Independent Applicants
Copyright ©2009 NRMP and AAMC. Copies may be made for educational or noncommercial uses only.
Charting Outcomes in the Match, 200967

Chart EM-8
Number of Volunteer ExperiencesEmergency Medicine
0
40
80
120
160
200
None 1 2 3 4 5 6 7 8 9 10 or More
38
56
82
125136 132
119107
83
65
185
8 9 11 16 12 12 179 7 4
12
Matched Not Matched
Volunteer Experiences
U.S. Seniors
0
40
80
120
160
200
None 1 2 3 4 5 6 7 8 9 10 or More
4330 28 26 33 38
2516 17 11
4153
4049
23 21 18 15 167 5
17
Matched Not Matched
Volunteer ExperiencesSource: NRMP Data Warehouse and AAMC Data Warehouse.
Independent Applicants
Copyright ©2009 NRMP and AAMC. Copies may be made for educational or noncommercial uses only.
Charting Outcomes in the Match, 200968

Chart EM-9
Other Characteristics of U.S. SeniorsEmergency Medicine
0
200
400
600
800
1,000
1,200
No Yes
1,004
1241125
Matched Not Matched
AOA Membership
0
100
200
300
400
500
600
700
800
No Yes
760
368
9027
Graduate of One of the 40 U.S. Medical Schoolswith the Highest NIH Funding
0
200
400
600
800
1,000
1,200
No Yes
1,110
18115
2
Ph.D. Degree
0
200
400
600
800
1,000
No Yes
990
13899
18
Other Graduate Degree
Sources. AOA membership from the AAMC Data Warehouse, NIH awards from http://report.nih.gov/award/trends/AggregateData.cfm Medical Schools Only.xls, Ph.D. and other graduate degrees from the AAMC Data Warehouse
Copyright ©2009 NRMP and AAMC. Copies may be made for educational or noncommercial uses only.
Charting Outcomes in the Match, 200969

FM Family Medicine
Copyright ©2009 NRMP and AAMC. Copies may be made for educational or noncommercial uses only.
70 Charting Outcomes in the Match, 2009

Table FM-1
Summary StatisticsFamily Medicine
Measure (n=1,040) (n=23) (n=973) (n=1,266)
U.S. Seniors Independent Applicants
Matched Unmatched Matched Unmatched
1. 6.8 5.2 4.6 2.5Mean number of contiguous ranks2. 1.1 1.1 1.3 1.5Mean number of distinct specialties ranked3. 214 196 201 197Mean USMLE Step 1 score4. 223 180 205 199Mean USMLE Step 2 score5. 1.3 1.8 1.0 0.9Mean number of research experiences6. 1.4 1.9 1.4 1.5Mean number of abstracts, presentations, and
publications7. 3.0 3.1 3.7 4.1Mean number of work experiences8. 6.8 6.7 3.5 2.3Mean number of volunteer experiences9. 5.5 0.0Percentage who are AOA members n/a n/a
10. 28.9 17.4Percentage who graduated from one of the 40 U.S. medical schools with the highest NIH funding
n/a n/a
11. 1.0 0.0Percentage who have Ph.D. degree n/a n/a12. 12.1 21.7Percentage who have another graduate degree n/a n/a
n/a: The measure either does not apply to, applies to only a small percentage of, or no reliable data were available for independent applicants.
Sources. Measures 1, 2, and match outcome are from the NRMP Data Warehouse; measures 3 and 4 are from the AAMC Data Warehouse and from the ECFMG, both by permission of the NBME and ECFMG; measures 5-9 are from the AAMC Data Warehouse; measure 10 is from the NIH website (http://report.nih.gov/award/trends/AggregateDate.cfm Medical Schools Only.xls); and measures 11 and 12 are from the AAMC Data Warehouse.
Note: USMLE Step 1 scores are not available for most osteopathic medical school graduates included in the independent applicant group.
Approximately 30 percent of U.S. allopathic medical school seniors do not take the USMLE Step 2 prior to the Match.
Copyright ©2009 NRMP and AAMC. Copies may be made for educational or noncommercial uses only.
71 Charting Outcomes in the Match, 2009
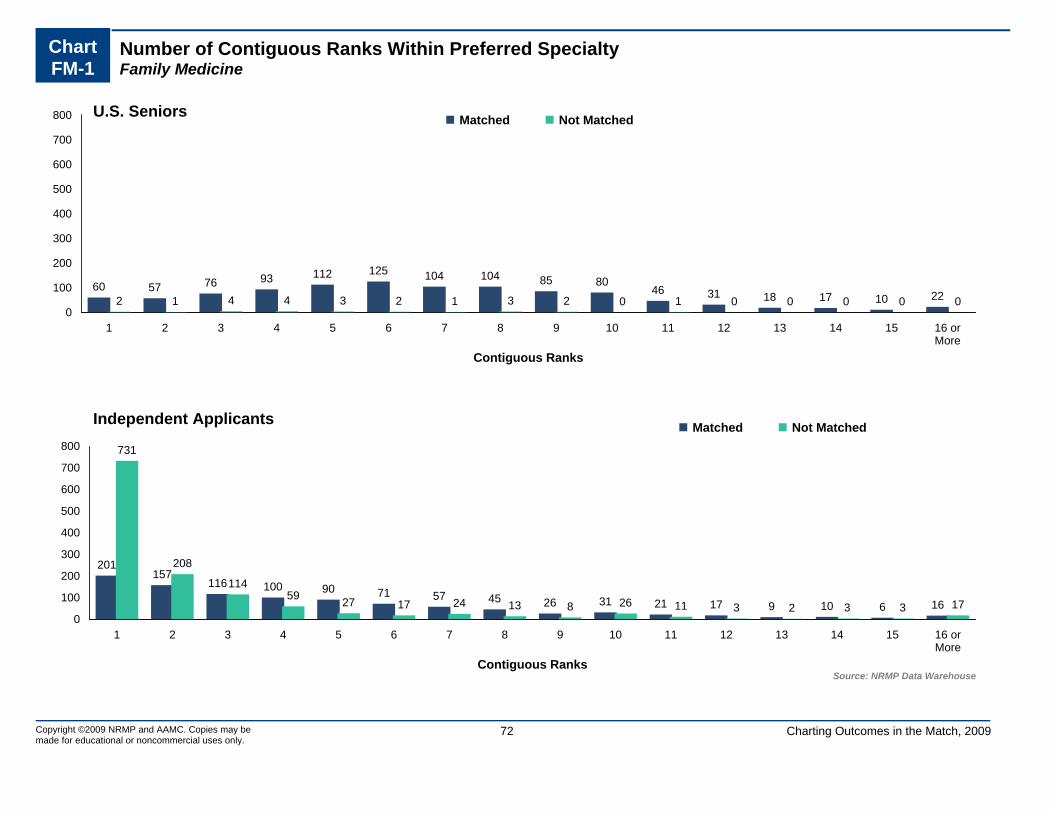
0
100
200
300
400
500
600
700
800
1 2 3 4 5 6 7 8 9 10 11 12 13 14 15 16 orMore
60 57 76 93 112 125 104 104 85 8046 31 18 17 10 222 1 4 4 3 2 1 3 2 0 1 0 0 0 0 0
Matched Not Matched
Contiguous Ranks
U.S. Seniors
0
100
200
300
400
500
600
700
800
1 2 3 4 5 6 7 8 9 10 11 12 13 14 15 16 orMore
201157
116 100 90 71 57 45 26 31 21 17 9 10 6 16
731
208
11459 27 17 24 13 8 26 11 3 2 3 3 17
Matched Not Matched
Contiguous RanksSource: NRMP Data Warehouse
Independent Applicants
Copyright ©2009 NRMP and AAMC. Copies may be made for educational or noncommercial uses only.
72 Charting Outcomes in the Match, 2009
Chart FM-1
Number of Contiguous Ranks Within Preferred SpecialtyFamily Medicine

Graph FM-1
Probability of Matching to Preferred Specialty by Number of Contiguous RanksFamily Medicine
0.00
0.10
0.20
0.30
0.40
0.50
0.60
0.70
0.80
0.90
1.00
0 1 2 3 4 5 6 7 8 9 10 11 12 13 14 15 16 17 18 19 20
U.S. SeniorsIndependent Applicants
Number of Contiguous RanksSource: NRMP Data Warehouse. Note: Probabilities
calculated based on 2007-2009 applicants.
Probability of Matching
73Copyright ©2009 NRMP and AAMC. Copies may be made for educational or noncommercial uses only.
Charting Outcomes in the Match, 2009

Chart FM-2
Number of Distinct Specialties RankedFamily Medicine
0
200
400
600
800
1,000 964
695 222 0 1 0
1 2 3 4 or More
Matched Not Matched
Distinct Specialties Ranked
U.S. Seniors
0
200
400
600
800
1,000
1 2 3 4 or More
707
210
46 10
760
377
9237
Matched Not Matched
Distinct Specialties RankedSource: NRMP Data Warehouse
Independent Applicants
Copyright ©2009 NRMP and AAMC. Copies may be made for educational or noncommercial uses only.
Charting Outcomes in the Match, 200974

Chart FM-3
USMLE Step 1 ScoresFamily Medicine
0
40
80
120
160
200
240
<= 180 Between 181and 190
Between 191and 200
Between 201and 210
Between 211and 220
Between 221and 230
Between 231and 240
Between 241and 250
Between 251and 260
>260 ScoreUnknown
13
87
168184
207
157
129
70
213 11 9 7 3 2 1 0 0 0 0 0
Matched Not Matched
Step 1 Scores Source: NRMP Data Warehouse and AAMC Data Warehouse. USMLEscores by permission of the NBME and ECFMG.
U.S. Seniors
0
50
100
150
200
250
300
350
400
450
<= 180 Between 181and 190
Between 191and 200
Between 201and 210
Between 211and 220
Between 221and 230
Between 231and 240
Between 241and 250
Between 251and 260
>260 ScoreUnknown
0
201 219
152
8447
245 4 0
237
19
421389
216
101
4918 7 2 0
44
Matched Not Matched
Step 1 Scores Source: NRMP Data Warehouse and AAMC Data Warehouse. USMLEscores by permission of the NBME and ECFMG.
Independent Applicants
Copyright ©2009 NRMP and AAMC. Copies may be made for educational or noncommercial uses only.
Charting Outcomes in the Match, 200975

Graph FM-2
Probability of Matching to Preferred Specialty by USMLE Step 1 ScoreFamily Medicine
0.00
0.10
0.20
0.30
0.40
0.50
0.60
0.70
0.80
0.90
1.00
160 180 200 220 240 260 280
U.S. SeniorsIndependent Applicants
Step 1 ScoreSource: NRMP Data Warehouse and AAMC Data Warehouse. USMLE
scores by permission of the NBME and ECFMG. Note: Probabilitiescalculated based on 2007-2009 applicants.
Probability of Matching
76Copyright ©2009 NRMP and AAMC. Copies may be made for educational or noncommercial uses only.
Charting Outcomes in the Match, 2009

Chart FM-4
USMLE Step 2 ScoresFamily Medicine
0
20
40
60
80
100
120
140
160
<= 180 Between 181and 190
Between 191and 200
Between 201and 210
Between 211and 220
Between 221and 230
Between 231and 240
Between 241and 250
Between 251and 260
>260 ScoreUnknown
20
45
92
114129
157144
90
68
34
147
122 2 1 1 1 0 0 0 0 4
Matched Not Matched
Step 2 Scores Source: NRMP Data Warehouse and AAMC Data Warehouse. USMLEscores by permission of the NBME and ECFMG.
U.S. Seniors
0
50
100
150
200
250
300
350
400
<= 180 Between 181and 190
Between 191and 200
Between 201and 210
Between 211and 220
Between 221and 230
Between 231and 240
Between 241and 250
Between 251and 260
>260 ScoreUnknown
7
138
190 178
115
6424 12 8 1
236
50
328356
260
131
5728
9 3 0
44
Matched Not Matched
Step 2 Scores Source: NRMP Data Warehouse and AAMC Data Warehouse. USMLEscores by permission of the NBME and ECFMG.
Independent Applicants
Copyright ©2009 NRMP and AAMC. Copies may be made for educational or noncommercial uses only.
Charting Outcomes in the Match, 200977

Chart FM-5
Number of Research ProjectsFamily Medicine
0
100
200
300
400
500
600
700
None 1 2 3 4 5 or More
338 323
198
10546 306 7 5 2 0 3
Matched Not Matched
Research Projects
U.S. Seniors
0
100
200
300
400
500
600
700
None 1 2 3 4 5 or More
496
226
136
6529 21
627
371
152
6525 26
Matched Not Matched
Research ProjectsSource: NRMP Data Warehouse and AAMC Data Warehouse
Independent Applicants
Copyright ©2009 NRMP and AAMC. Copies may be made for educational or noncommercial uses only.
Charting Outcomes in the Match, 200978

Chart FM-6
Number of Abstracts, Presentations, and PublicationsFamily Medicine
0
100
200
300
400
500
600
700
800
None 1 2 3 4 5 or More
540
198
12157 45
7912 2 2 2 2 3
Matched Not Matched
Publications
U.S. Seniors
0
100
200
300
400
500
600
700
800
None 1 2 3 4 5 or More
628
12674
41 1985
788
170
81 60 46121
Matched Not Matched
PublicationsSource: NRMP Data Warehouse and AAMC Data Warehouse
Independent Applicants
Copyright ©2009 NRMP and AAMC. Copies may be made for educational or noncommercial uses only.
Charting Outcomes in the Match, 200979
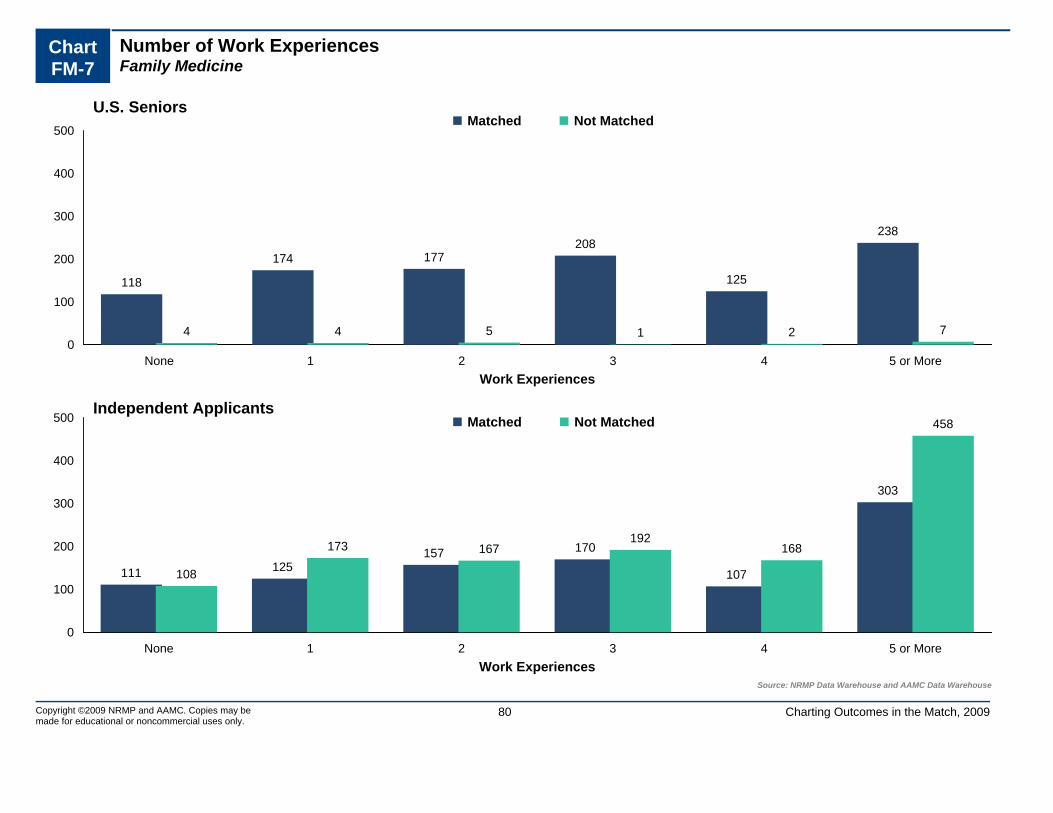
Chart FM-7
Number of Work ExperiencesFamily Medicine
0
100
200
300
400
500
None 1 2 3 4 5 or More
118
174 177208
125
238
4 4 5 1 2 7
Matched Not Matched
Work Experiences
U.S. Seniors
0
100
200
300
400
500
None 1 2 3 4 5 or More
111 125157 170
107
303
108
173 167192
168
458Matched Not Matched
Work ExperiencesSource: NRMP Data Warehouse and AAMC Data Warehouse
Independent Applicants
Copyright ©2009 NRMP and AAMC. Copies may be made for educational or noncommercial uses only.
Charting Outcomes in the Match, 200980

Chart FM-8
Number of Volunteer ExperiencesFamily Medicine
0
50
100
150
200
250
300
350
None 1 2 3 4 5 6 7 8 9 10 or More
44 47 5882
104118
102 91 8959
246
1 0 2 2 3 2 3 3 3 0 4
Matched Not Matched
Volunteer Experiences
U.S. Seniors
0
50
100
150
200
250
300
350
None 1 2 3 4 5 6 7 8 9 10 or More
164 161147 134
9672
45 3924 23
68
339
270
209
149
112
73
36 25 16 928
Matched Not Matched
Volunteer ExperiencesSource: NRMP Data Warehouse and AAMC Data Warehouse.
Independent Applicants
Copyright ©2009 NRMP and AAMC. Copies may be made for educational or noncommercial uses only.
Charting Outcomes in the Match, 200981

Chart FM-9
Other Characteristics of U.S. SeniorsFamily Medicine
0
200
400
600
800
1,000
No Yes
983
5723 0
Matched Not Matched
AOA Membership
0
100
200
300
400
500
600
700
800
No Yes
739
301
19 4
Graduate of One of the 40 U.S. Medical Schoolswith the Highest NIH Funding
0
200
400
600
800
1,000
1,200
No Yes
1,030
1023 0
Ph.D. Degree
0
200
400
600
800
1,000
No Yes
914
126
18 5
Other Graduate Degree
Sources. AOA membership from the AAMC Data Warehouse, NIH awards from http://report.nih.gov/award/trends/AggregateData.cfm Medical Schools Only.xls, Ph.D. and other graduate degrees from the AAMC Data Warehouse
Copyright ©2009 NRMP and AAMC. Copies may be made for educational or noncommercial uses only.
Charting Outcomes in the Match, 200982

GS General Surgery
Copyright ©2009 NRMP and AAMC. Copies may be made for educational or noncommercial uses only.
83 Charting Outcomes in the Match, 2009

Table GS-1
Summary StatisticsGeneral Surgery
Measure (n=1,032) (n=153) (n=316) (n=650)
U.S. Seniors Independent Applicants
Matched Unmatched Matched Unmatched
1. 8.2 5.2 4.5 2.3Mean number of contiguous ranks2. 1.0 1.1 1.2 1.3Mean number of distinct specialties ranked3. 226 208 222 214Mean USMLE Step 1 score4. 232 208 224 215Mean USMLE Step 2 score5. 2.4 1.9 1.5 1.5Mean number of research experiences6. 3.0 2.1 3.7 4.0Mean number of abstracts, presentations, and
publications7. 2.6 2.4 3.0 3.2Mean number of work experiences8. 6.1 5.0 3.2 2.5Mean number of volunteer experiences9. 15.0 2.0Percentage who are AOA members n/a n/a
10. 34.4 18.3Percentage who graduated from one of the 40 U.S. medical schools with the highest NIH funding
n/a n/a
11. 2.7 2.0Percentage who have Ph.D. degree n/a n/a12. 8.9 9.2Percentage who have another graduate degree n/a n/a
n/a: The measure either does not apply to, applies to only a small percentage of, or no reliable data were available for independent applicants.
Sources. Measures 1, 2, and match outcome are from the NRMP Data Warehouse; measures 3 and 4 are from the AAMC Data Warehouse and from the ECFMG, both by permission of the NBME and ECFMG; measures 5-9 are from the AAMC Data Warehouse; measure 10 is from the NIH website (http://report.nih.gov/award/trends/AggregateDate.cfm Medical Schools Only.xls); and measures 11 and 12 are from the AAMC Data Warehouse.
Note: USMLE Step 1 scores are not available for most osteopathic medical school graduates included in the independent applicant group.
Approximately 30 percent of U.S. allopathic medical school seniors do not take the USMLE Step 2 prior to the Match.
Copyright ©2009 NRMP and AAMC. Copies may be made for educational or noncommercial uses only.
84 Charting Outcomes in the Match, 2009

0
100
200
300
400
280
14 12 1533 26 34 50
75 89 78 8854 59 46
7938
19 11 10 9 15 8 10 11 6 5 4 1 1 0 5
1 2 3 4 5 6 7 8 9 10 11 12 13 14 15 16 orMore
Matched Not Matched
Contiguous Ranks
U.S. Seniors
0
100
200
300
400
1 2 3 4 5 6 7 8 9 10 11 12 13 14 15 16 orMore
123
41 3312 16 13 11 12 12 7 5 7 3 3 4 14
376
115
5527 23 20 7 5 7 5 2 0 1 1 2 4
Matched Not Matched
Contiguous RanksSource: NRMP Data Warehouse
Independent Applicants
Copyright ©2009 NRMP and AAMC. Copies may be made for educational or noncommercial uses only.
85 Charting Outcomes in the Match, 2009
Chart GS-1
Number of Contiguous Ranks Within Preferred SpecialtyGeneral Surgery

Graph GS-1
Probability of Matching to Preferred Specialty by Number of Contiguous RanksGeneral Surgery
0.00
0.10
0.20
0.30
0.40
0.50
0.60
0.70
0.80
0.90
1.00
0 1 2 3 4 5 6 7 8 9 10 11 12 13 14 15 16 17 18 19 20
U.S. SeniorsIndependent Applicants
Number of Contiguous RanksSource: NRMP Data Warehouse. Note: Probabilities
calculated based on 2007-2009 applicants.
Probability of Matching
86Copyright ©2009 NRMP and AAMC. Copies may be made for educational or noncommercial uses only.
Charting Outcomes in the Match, 2009

Chart GS-2
Number of Distinct Specialties RankedGeneral Surgery
0
200
400
600
800
1,000 993
32 6 1
140
12 1 0
1 2 3 4 or More
Matched Not Matched
Distinct Specialties Ranked
U.S. Seniors
0
200
400
600
800
1,000
1 2 3 4 or More
277
29 9 1
485
12335 7
Matched Not Matched
Distinct Specialties RankedSource: NRMP Data Warehouse
Independent Applicants
Copyright ©2009 NRMP and AAMC. Copies may be made for educational or noncommercial uses only.
Charting Outcomes in the Match, 200987

Chart GS-3
USMLE Step 1 ScoresGeneral Surgery
0
40
80
120
160
200
240
<= 180 Between 181and 190
Between 191and 200
Between 201and 210
Between 211and 220
Between 221and 230
Between 231and 240
Between 241and 250
Between 251and 260
>260 ScoreUnknown
120
78
118
168
206194
151
71
2325
25 25 2538
199 5 2 0 0
Matched Not Matched
Step 1 Scores Source: NRMP Data Warehouse and AAMC Data Warehouse. USMLEscores by permission of the NBME and ECFMG.
U.S. Seniors
0
20
40
60
80
100
<= 180 Between 181and 190
Between 191and 200
Between 201and 210
Between 211and 220
Between 221and 230
Between 231and 240
Between 241and 250
Between 251and 260
>260 ScoreUnknown
0
19 23
4047
54 52
2317
2
39
2
81
100 10095
85
68
53
18
2
46
Matched Not Matched
Step 1 Scores Source: NRMP Data Warehouse and AAMC Data Warehouse. USMLEscores by permission of the NBME and ECFMG.
Independent Applicants
Copyright ©2009 NRMP and AAMC. Copies may be made for educational or noncommercial uses only.
Charting Outcomes in the Match, 200988
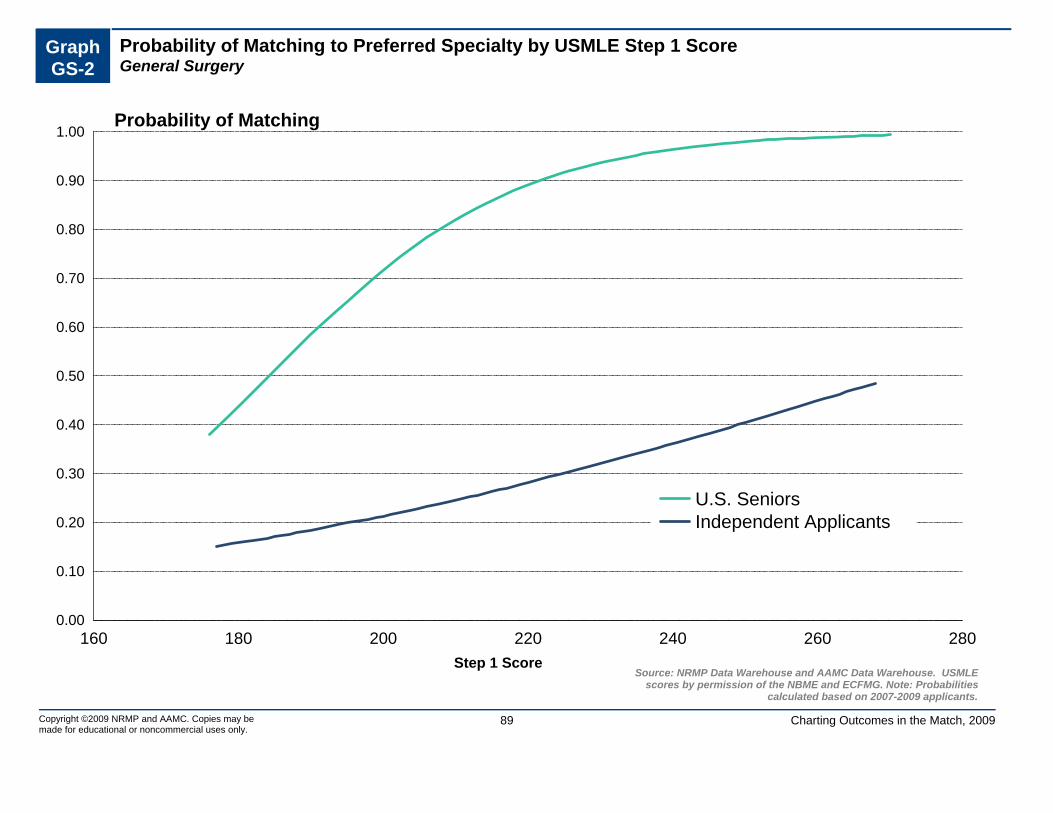
Graph GS-2
Probability of Matching to Preferred Specialty by USMLE Step 1 ScoreGeneral Surgery
0.00
0.10
0.20
0.30
0.40
0.50
0.60
0.70
0.80
0.90
1.00
160 180 200 220 240 260 280
U.S. SeniorsIndependent Applicants
Step 1 ScoreSource: NRMP Data Warehouse and AAMC Data Warehouse. USMLE
scores by permission of the NBME and ECFMG. Note: Probabilitiescalculated based on 2007-2009 applicants.
Probability of Matching
89Copyright ©2009 NRMP and AAMC. Copies may be made for educational or noncommercial uses only.
Charting Outcomes in the Match, 2009

Chart GS-4
USMLE Step 2 ScoresGeneral Surgery
0
40
80
120
160
200
240
280
320
<= 180 Between 181and 190
Between 191and 200
Between 201and 210
Between 211and 220
Between 221and 230
Between 231and 240
Between 241and 250
Between 251and 260
>260 ScoreUnknown
2 1327
6595
136158
123
80
47
286
10 1023 22 25 18 12 0 2 0
31
Matched Not Matched
Step 2 Scores Source: NRMP Data Warehouse and AAMC Data Warehouse. USMLEscores by permission of the NBME and ECFMG.
U.S. Seniors
0
20
40
60
80
100
120
<= 180 Between 181and 190
Between 191and 200
Between 201and 210
Between 211and 220
Between 221and 230
Between 231and 240
Between 241and 250
Between 251and 260
>260 ScoreUnknown
2
19 17
33
5343 43 41
15 12
38
13
60
99107
81 85
70
50
28
10
47
Matched Not Matched
Step 2 Scores Source: NRMP Data Warehouse and AAMC Data Warehouse. USMLEscores by permission of the NBME and ECFMG.
Independent Applicants
Copyright ©2009 NRMP and AAMC. Copies may be made for educational or noncommercial uses only.
Charting Outcomes in the Match, 200990

Chart GS-5
Number of Research ProjectsGeneral Surgery
0
40
80
120
160
200
240
None 1 2 3 4 5 or More
129
217238
188
135125
3143 36
20 16 7
Matched Not Matched
Research Projects
U.S. Seniors
0
40
80
120
160
200
240
None 1 2 3 4 5 or More
97 94
56
3322 14
219
161
118
77
33 42
Matched Not Matched
Research ProjectsSource: NRMP Data Warehouse and AAMC Data Warehouse
Independent Applicants
Copyright ©2009 NRMP and AAMC. Copies may be made for educational or noncommercial uses only.
Charting Outcomes in the Match, 200991

Chart GS-6
Number of Abstracts, Presentations, and PublicationsGeneral Surgery
0
50
100
150
200
250
300
350
None 1 2 3 4 5 or More
342
162133
100
59
236
66
27 18 12 822
Matched Not Matched
Publications
U.S. Seniors
0
50
100
150
200
250
300
350
None 1 2 3 4 5 or More
124
5332
15 14
78
246
8266
4832
176
Matched Not Matched
PublicationsSource: NRMP Data Warehouse and AAMC Data Warehouse
Independent Applicants
Copyright ©2009 NRMP and AAMC. Copies may be made for educational or noncommercial uses only.
Charting Outcomes in the Match, 200992
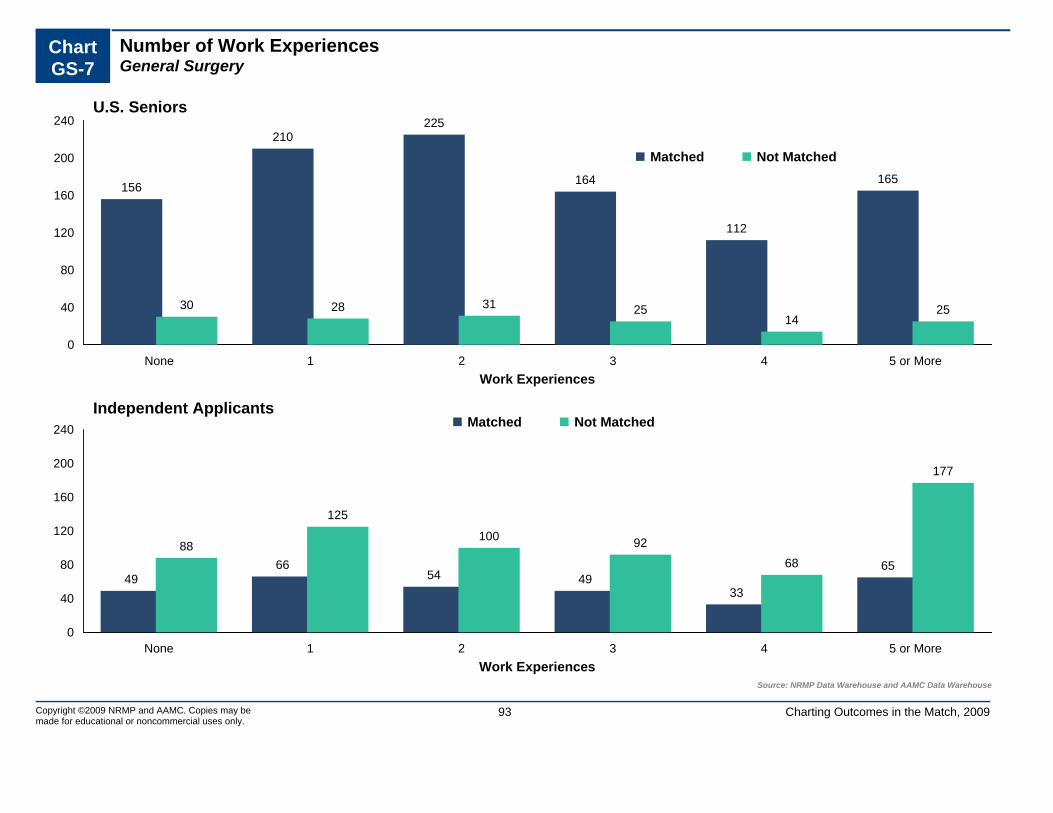
Chart GS-7
Number of Work ExperiencesGeneral Surgery
0
40
80
120
160
200
240
None 1 2 3 4 5 or More
156
210225
164
112
165
30 28 31 2514
25
Matched Not Matched
Work Experiences
U.S. Seniors
0
40
80
120
160
200
240
None 1 2 3 4 5 or More
4966
54 4933
6588
125
100 9268
177
Matched Not Matched
Work ExperiencesSource: NRMP Data Warehouse and AAMC Data Warehouse
Independent Applicants
Copyright ©2009 NRMP and AAMC. Copies may be made for educational or noncommercial uses only.
Charting Outcomes in the Match, 200993
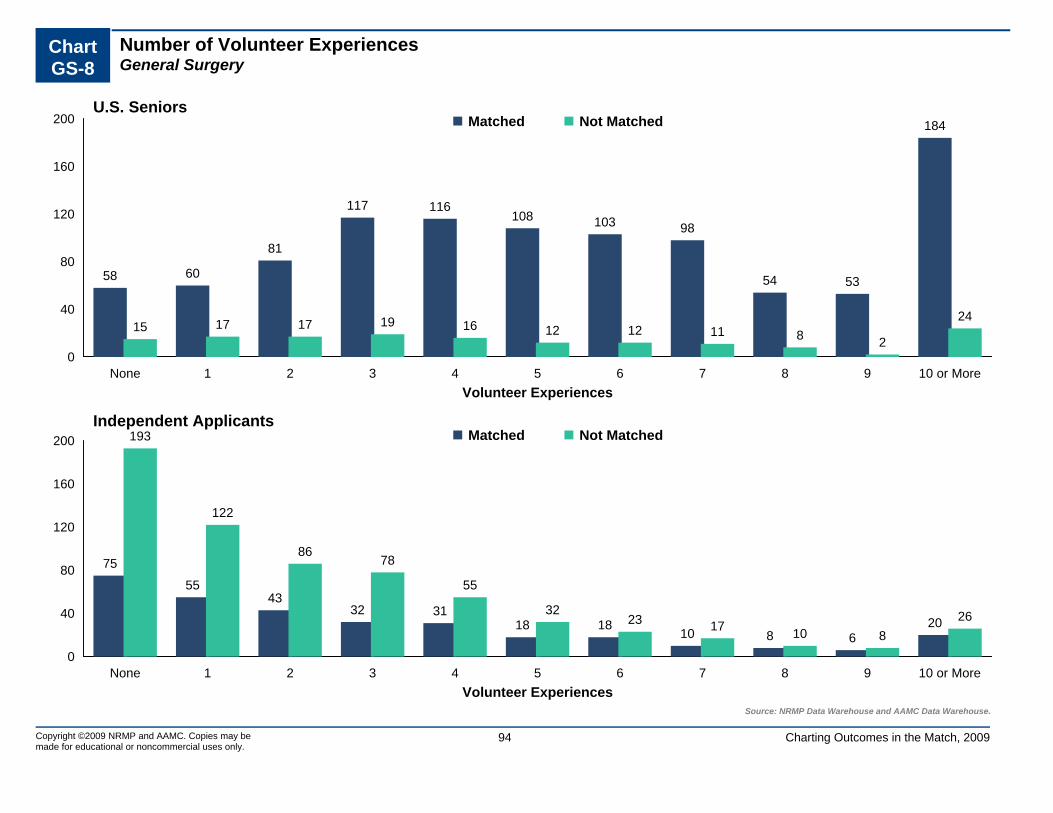
Chart GS-8
Number of Volunteer ExperiencesGeneral Surgery
0
40
80
120
160
200
None 1 2 3 4 5 6 7 8 9 10 or More
58 60
81
117 116108 103 98
54 53
184
15 17 17 19 16 12 12 11 8 2
24
Matched Not Matched
Volunteer Experiences
U.S. Seniors
0
40
80
120
160
200
None 1 2 3 4 5 6 7 8 9 10 or More
75
5543
32 3118 18
10 8 620
193
122
8678
55
3223 17 10 8
26
Matched Not Matched
Volunteer ExperiencesSource: NRMP Data Warehouse and AAMC Data Warehouse.
Independent Applicants
Copyright ©2009 NRMP and AAMC. Copies may be made for educational or noncommercial uses only.
Charting Outcomes in the Match, 200994

Chart GS-9
Other Characteristics of U.S. SeniorsGeneral Surgery
0
200
400
600
800
1,000
No Yes
877
155150
3
Matched Not Matched
AOA Membership
0
100
200
300
400
500
600
700
No Yes
677
355
125
28
Graduate of One of the 40 U.S. Medical Schoolswith the Highest NIH Funding
0
200
400
600
800
1,000
1,200
No Yes
1,004
28
150
3
Ph.D. Degree
0
200
400
600
800
1,000
No Yes
940
92139
14
Other Graduate Degree
Sources. AOA membership from the AAMC Data Warehouse, NIH awards from http://report.nih.gov/award/trends/AggregateData.cfm Medical Schools Only.xls, Ph.D. and other graduate degrees from the AAMC Data Warehouse
Copyright ©2009 NRMP and AAMC. Copies may be made for educational or noncommercial uses only.
Charting Outcomes in the Match, 200995

IM Internal Medicine
Copyright ©2009 NRMP and AAMC. Copies may be made for educational or noncommercial uses only.
96 Charting Outcomes in the Match, 2009

Table IM-1
Summary StatisticsInternal Medicine
Measure (n=2,838) (n=171) (n=2,093) (n=2,949)
U.S. Seniors Independent Applicants
Matched Unmatched Matched Unmatched
1. 8.2 6.5 6.1 2.7Mean number of contiguous ranks2. 1.1 1.3 1.3 1.5Mean number of distinct specialties ranked3. 225 215 222 209Mean USMLE Step 1 score4. 232 216 226 211Mean USMLE Step 2 score5. 2.2 2.1 1.2 1.0Mean number of research experiences6. 2.8 2.9 2.3 2.3Mean number of abstracts, presentations, and
publications7. 2.4 2.4 3.2 3.6Mean number of work experiences8. 5.9 5.1 2.8 2.0Mean number of volunteer experiences9. 15.3 9.4Percentage who are AOA members n/a n/a
10. 37.6 35.7Percentage who graduated from one of the 40 U.S. medical schools with the highest NIH funding
n/a n/a
11. 4.9 4.7Percentage who have Ph.D. degree n/a n/a12. 10.7 14.0Percentage who have another graduate degree n/a n/a
n/a: The measure either does not apply to, applies to only a small percentage of, or no reliable data were available for independent applicants.
Sources. Measures 1, 2, and match outcome are from the NRMP Data Warehouse; measures 3 and 4 are from the AAMC Data Warehouse and from the ECFMG, both by permission of the NBME and ECFMG; measures 5-9 are from the AAMC Data Warehouse; measure 10 is from the NIH website (http://report.nih.gov/award/trends/AggregateDate.cfm Medical Schools Only.xls); and measures 11 and 12 are from the AAMC Data Warehouse.
Note: USMLE Step 1 scores are not available for most osteopathic medical school graduates included in the independent applicant group.
Approximately 30 percent of U.S. allopathic medical school seniors do not take the USMLE Step 2 prior to the Match.
Copyright ©2009 NRMP and AAMC. Copies may be made for educational or noncommercial uses only.
97 Charting Outcomes in the Match, 2009

0
200
400
600
800
1,000
1,200
1,400
1,600
1 2 3 4 5 6 7 8 9 10 11 12 13 14 15 16 orMore
277
58 104 113 168 217 261 308 290 286 222140 105 86 62
14151 18 12 4 7 6 5 9 5 15 3 4 6 6 5 15
Matched Not Matched
Contiguous Ranks
U.S. Seniors
0
200
400
600
800
1,000
1,200
1,400
1,600
1 2 3 4 5 6 7 8 9 10 11 12 13 14 15 16 orMore
348213 209 170 181 144 153 107 128 95 79 53 44 29 40 100
1,419
597
305173 124 75 60 41 27 38 18 13 11 5 3 40
Matched Not Matched
Contiguous RanksSource: NRMP Data Warehouse
Independent Applicants
Copyright ©2009 NRMP and AAMC. Copies may be made for educational or noncommercial uses only.
98 Charting Outcomes in the Match, 2009
Chart IM-1
Number of Contiguous Ranks Within Preferred SpecialtyInternal Medicine

Graph IM-1
Probability of Matching to Preferred Specialty by Number of Contiguous RanksInternal Medicine
0.00
0.10
0.20
0.30
0.40
0.50
0.60
0.70
0.80
0.90
1.00
0 1 2 3 4 5 6 7 8 9 10 11 12 13 14 15 16 17 18 19 20
U.S. SeniorsIndependent Applicants
Number of Contiguous RanksSource: NRMP Data Warehouse. Note: Probabilities
calculated based on 2007-2009 applicants.
Probability of Matching
99Copyright ©2009 NRMP and AAMC. Copies may be made for educational or noncommercial uses only.
Charting Outcomes in the Match, 2009

Chart IM-2
Number of Distinct Specialties RankedInternal Medicine
0
400
800
1,200
1,600
2,000
2,400
2,800 2,637
18416 1
127 38 6 0
1 2 3 4 or More
Matched Not Matched
Distinct Specialties Ranked
U.S. Seniors
0
400
800
1,200
1,600
2,000
2,400
2,800
1 2 3 4 or More
1,644
34284 23
1,853
791
22877
Matched Not Matched
Distinct Specialties RankedSource: NRMP Data Warehouse
Independent Applicants
Copyright ©2009 NRMP and AAMC. Copies may be made for educational or noncommercial uses only.
Charting Outcomes in the Match, 2009100

Chart IM-3
USMLE Step 1 ScoresInternal Medicine
0
100
200
300
400
500
600
<= 180 Between 181and 190
Between 191and 200
Between 201and 210
Between 211and 220
Between 221and 230
Between 231and 240
Between 241and 250
Between 251and 260
>260 ScoreUnknown
11
95
238
332
461508 507
378
243
6053 19 25 32 24 18 24 16 7 2 1
Matched Not Matched
Step 1 Scores Source: NRMP Data Warehouse and AAMC Data Warehouse. USMLEscores by permission of the NBME and ECFMG.
U.S. Seniors
0
100
200
300
400
500
600
<= 180 Between 181and 190
Between 191and 200
Between 201and 210
Between 211and 220
Between 221and 230
Between 231and 240
Between 241and 250
Between 251and 260
>260 ScoreUnknown
3
83
200249
306 300 322
192
106
25
307
16
504548 538
484
366
285
10041
958
Matched Not Matched
Step 1 Scores Source: NRMP Data Warehouse and AAMC Data Warehouse. USMLEscores by permission of the NBME and ECFMG.
Independent Applicants
Copyright ©2009 NRMP and AAMC. Copies may be made for educational or noncommercial uses only.
Charting Outcomes in the Match, 2009101

Graph IM-2
Probability of Matching to Preferred Specialty by USMLE Step 1 ScoreInternal Medicine
0.00
0.10
0.20
0.30
0.40
0.50
0.60
0.70
0.80
0.90
1.00
160 180 200 220 240 260 280
U.S. SeniorsIndependent Applicants
Step 1 ScoreSource: NRMP Data Warehouse and AAMC Data Warehouse. USMLE
scores by permission of the NBME and ECFMG. Note: Probabilitiescalculated based on 2007-2009 applicants.
Probability of Matching
102Copyright ©2009 NRMP and AAMC. Copies may be made for educational or noncommercial uses only.
Charting Outcomes in the Match, 2009

Chart IM-4
USMLE Step 2 ScoresInternal Medicine
0
100
200
300
400
500
600
700
800
<= 180 Between 181and 190
Between 191and 200
Between 201and 210
Between 211and 220
Between 221and 230
Between 231and 240
Between 241and 250
Between 251and 260
>260 ScoreUnknown
2559
103164
222
335400
363
240182
745
12 7 11 17 16 15 16 13 8 155
Matched Not Matched
Step 2 Scores Source: NRMP Data Warehouse and AAMC Data Warehouse. USMLEscores by permission of the NBME and ECFMG.
U.S. Seniors
0
100
200
300
400
500
600
<= 180 Between 181and 190
Between 191and 200
Between 201and 210
Between 211and 220
Between 221and 230
Between 231and 240
Between 241and 250
Between 251and 260
>260 ScoreUnknown
554
172207
254303 321
239
163
66
309
64
369
524 542
468425
293
11760
2364
Matched Not Matched
Step 2 Scores Source: NRMP Data Warehouse and AAMC Data Warehouse. USMLEscores by permission of the NBME and ECFMG.
Independent Applicants
Copyright ©2009 NRMP and AAMC. Copies may be made for educational or noncommercial uses only.
Charting Outcomes in the Match, 2009103

Chart IM-5
Number of Research ProjectsInternal Medicine
0
200
400
600
800
1,000
1,200
1,400
1,600
None 1 2 3 4 5 or More
398
644 701
545
289 261
40 35 42 20 17 17
Matched Not Matched
Research Projects
U.S. Seniors
0
200
400
600
800
1,000
1,200
1,400
1,600
None 1 2 3 4 5 or More
847
570
320195
88 73
1,426
773
370
19793 90
Matched Not Matched
Research ProjectsSource: NRMP Data Warehouse and AAMC Data Warehouse
Independent Applicants
Copyright ©2009 NRMP and AAMC. Copies may be made for educational or noncommercial uses only.
Charting Outcomes in the Match, 2009104
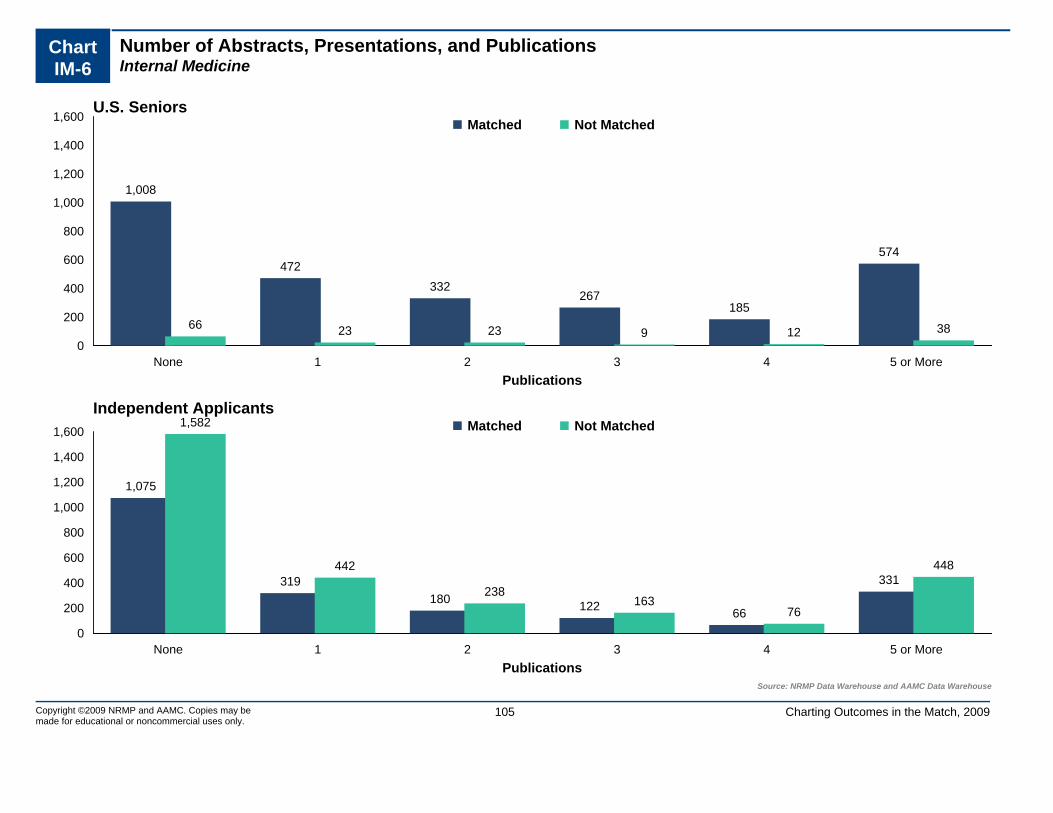
Chart IM-6
Number of Abstracts, Presentations, and PublicationsInternal Medicine
0
200
400
600
800
1,000
1,200
1,400
1,600
None 1 2 3 4 5 or More
1,008
472332
267185
574
66 23 23 9 12 38
Matched Not Matched
Publications
U.S. Seniors
0
200
400
600
800
1,000
1,200
1,400
1,600
None 1 2 3 4 5 or More
1,075
319180 122 66
331
1,582
442
238163
76
448
Matched Not Matched
PublicationsSource: NRMP Data Warehouse and AAMC Data Warehouse
Independent Applicants
Copyright ©2009 NRMP and AAMC. Copies may be made for educational or noncommercial uses only.
Charting Outcomes in the Match, 2009105

Chart IM-7
Number of Work ExperiencesInternal Medicine
0
200
400
600
800
1,000
None 1 2 3 4 5 or More
509588 574
471
277
419
39 27 36 27 21 21
Matched Not Matched
Work Experiences
U.S. Seniors
0
200
400
600
800
1,000
None 1 2 3 4 5 or More
250332
395 372
256
488
269
448493
436 399
904Matched Not Matched
Work ExperiencesSource: NRMP Data Warehouse and AAMC Data Warehouse
Independent Applicants
Copyright ©2009 NRMP and AAMC. Copies may be made for educational or noncommercial uses only.
Charting Outcomes in the Match, 2009106

Chart IM-8
Number of Volunteer ExperiencesInternal Medicine
0
200
400
600
800
1,000
None 1 2 3 4 5 6 7 8 9 10 or More
132 153242
299346 329
289244
191 157
456
16 8 23 18 23 17 11 13 13 5 24
Matched Not Matched
Volunteer Experiences
U.S. Seniors
0
200
400
600
800
1,000
None 1 2 3 4 5 6 7 8 9 10 or More
453407
338280
187133
94 63 47 28 63
894
618
522
305243
13887 56 26 25 35
Matched Not Matched
Volunteer ExperiencesSource: NRMP Data Warehouse and AAMC Data Warehouse.
Independent Applicants
Copyright ©2009 NRMP and AAMC. Copies may be made for educational or noncommercial uses only.
Charting Outcomes in the Match, 2009107
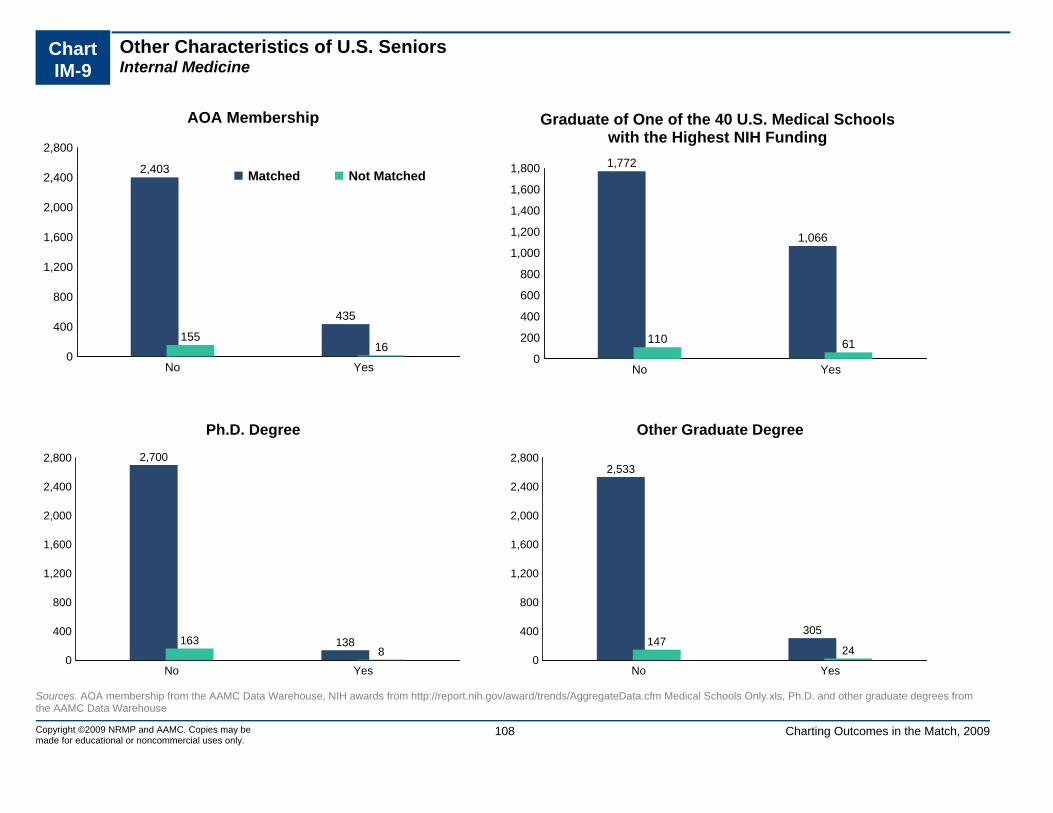
Chart IM-9
Other Characteristics of U.S. SeniorsInternal Medicine
0
400
800
1,200
1,600
2,000
2,400
2,800
No Yes
2,403
435
15516
Matched Not Matched
AOA Membership
0
200
400
600
800
1,000
1,200
1,400
1,600
1,800
No Yes
1,772
1,066
110 61
Graduate of One of the 40 U.S. Medical Schoolswith the Highest NIH Funding
0
400
800
1,200
1,600
2,000
2,400
2,800
No Yes
2,700
1381638
Ph.D. Degree
0
400
800
1,200
1,600
2,000
2,400
2,800
No Yes
2,533
305147
24
Other Graduate Degree
Sources. AOA membership from the AAMC Data Warehouse, NIH awards from http://report.nih.gov/award/trends/AggregateData.cfm Medical Schools Only.xls, Ph.D. and other graduate degrees from the AAMC Data Warehouse
Copyright ©2009 NRMP and AAMC. Copies may be made for educational or noncommercial uses only.
Charting Outcomes in the Match, 2009108

IP Internal Medicine/Pediatrics
Copyright ©2009 NRMP and AAMC. Copies may be made for educational or noncommercial uses only.
109 Charting Outcomes in the Match, 2009

Table IP-1
Summary StatisticsInternal Medicine/Pediatrics
Measure (n=238) (n=14) (n=80) (n=61)
U.S. Seniors Independent Applicants
Matched Unmatched Matched Unmatched
1. 7.4 3.8 4.8 1.3Mean number of contiguous ranks2. 1.2 1.6 1.8 2.5Mean number of distinct specialties ranked3. 225 211 215 217Mean USMLE Step 1 score4. 235 218 218 213Mean USMLE Step 2 score5. 1.7 2.2 1.2 1.0Mean number of research experiences6. 2.0 4.2 1.7 1.5Mean number of abstracts, presentations, and
publications7. 2.7 2.3 3.8 3.8Mean number of work experiences8. 7.8 4.8 5.5 2.5Mean number of volunteer experiences9. 21.0 7.1Percentage who are AOA members n/a n/a
10. 27.3 35.7Percentage who graduated from one of the 40 U.S. medical schools with the highest NIH funding
n/a n/a
11. 1.7 7.1Percentage who have Ph.D. degree n/a n/a12. 13.9 14.3Percentage who have another graduate degree n/a n/a
n/a: The measure either does not apply to, applies to only a small percentage of, or no reliable data were available for independent applicants.
Sources. Measures 1, 2, and match outcome are from the NRMP Data Warehouse; measures 3 and 4 are from the AAMC Data Warehouse and from the ECFMG, both by permission of the NBME and ECFMG; measures 5-9 are from the AAMC Data Warehouse; measure 10 is from the NIH website (http://report.nih.gov/award/trends/AggregateDate.cfm Medical Schools Only.xls); and measures 11 and 12 are from the AAMC Data Warehouse.
Note: USMLE Step 1 scores are not available for most osteopathic medical school graduates included in the independent applicant group.
Approximately 30 percent of U.S. allopathic medical school seniors do not take the USMLE Step 2 prior to the Match.
Copyright ©2009 NRMP and AAMC. Copies may be made for educational or noncommercial uses only.
110 Charting Outcomes in the Match, 2009
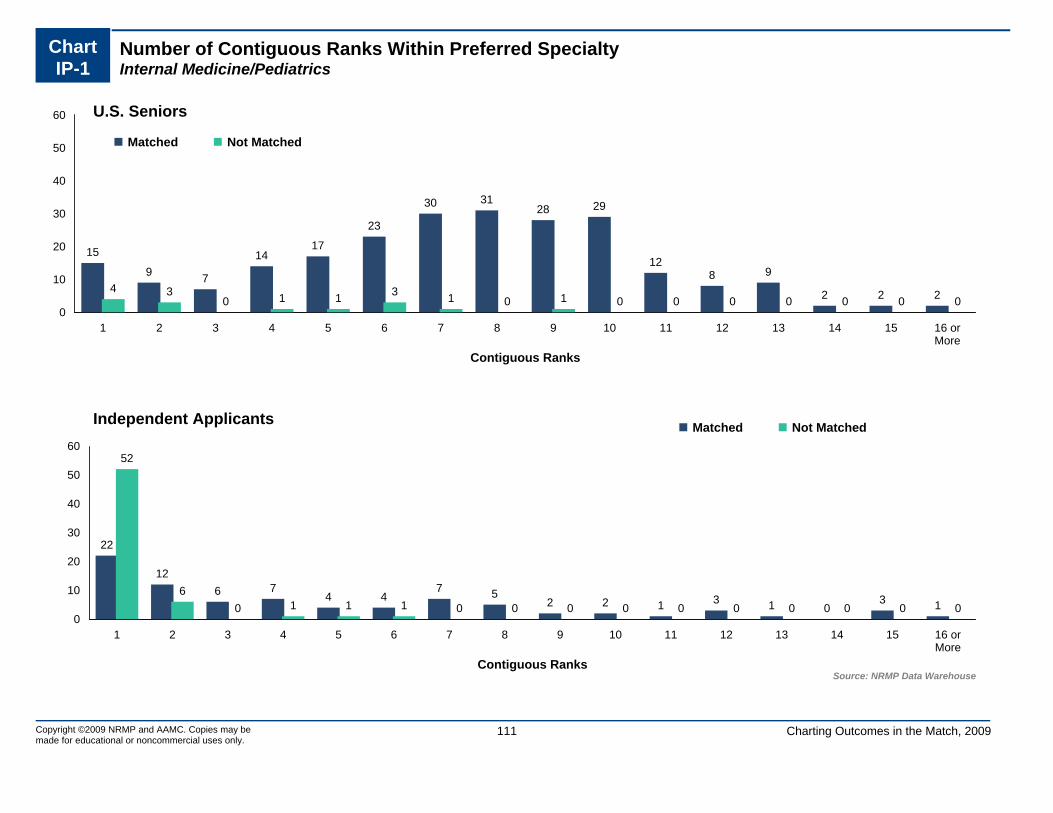
0
10
20
30
40
50
60
1 2 3 4 5 6 7 8 9 10 11 12 13 14 15 16 orMore
15
9 7
1417
23
30 3128 29
128 9
2 2 24 30 1 1 3 1 0 1 0 0 0 0 0 0 0
Matched Not Matched
Contiguous Ranks
U.S. Seniors
0
10
20
30
40
50
60
1 2 3 4 5 6 7 8 9 10 11 12 13 14 15 16 orMore
22
126 7
4 47 5
2 2 1 3 1 03 1
52
60 1 1 1 0 0 0 0 0 0 0 0 0 0
Matched Not Matched
Contiguous RanksSource: NRMP Data Warehouse
Independent Applicants
Copyright ©2009 NRMP and AAMC. Copies may be made for educational or noncommercial uses only.
111 Charting Outcomes in the Match, 2009
Chart IP-1
Number of Contiguous Ranks Within Preferred SpecialtyInternal Medicine/Pediatrics

Graph IP-1
Probability of Matching to Preferred Specialty by Number of Contiguous RanksInternal Medicine/Pediatrics
0.00
0.10
0.20
0.30
0.40
0.50
0.60
0.70
0.80
0.90
1.00
0 1 2 3 4 5 6 7 8 9 10 11 12 13 14 15 16 17 18 19 20
U.S. SeniorsIndependent Applicants
Number of Contiguous RanksSource: NRMP Data Warehouse. Note: Probabilities
calculated based on 2007-2009 applicants.
Probability of Matching
112Copyright ©2009 NRMP and AAMC. Copies may be made for educational or noncommercial uses only.
Charting Outcomes in the Match, 2009

Chart IP-2
Number of Distinct Specialties RankedInternal Medicine/Pediatrics
0
40
80
120
160
200 195
39
4 05 90 0
1 2 3 4 or More
Matched Not Matched
Distinct Specialties Ranked
U.S. Seniors
0
40
80
120
160
200
1 2 3 4 or More
35 3012 34
3018 9
Matched Not Matched
Distinct Specialties RankedSource: NRMP Data Warehouse
Independent Applicants
Copyright ©2009 NRMP and AAMC. Copies may be made for educational or noncommercial uses only.
Charting Outcomes in the Match, 2009113
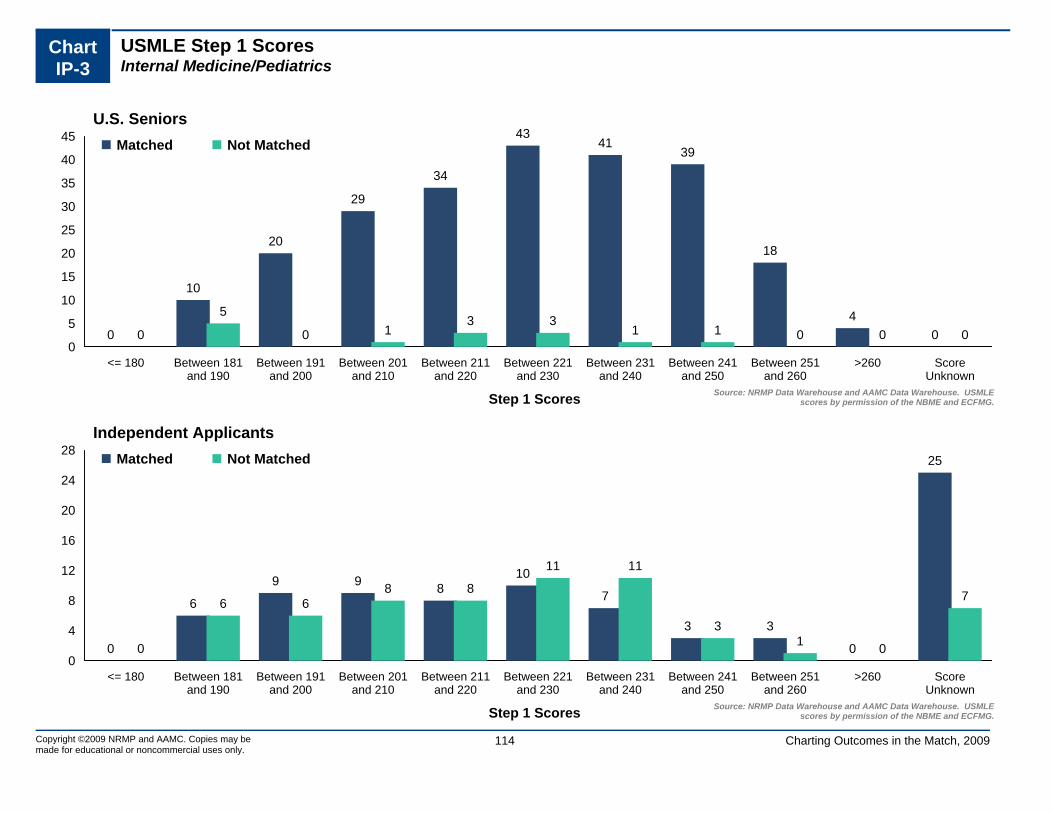
Chart IP-3
USMLE Step 1 ScoresInternal Medicine/Pediatrics
0
5
10
15
20
25
30
35
40
45
<= 180 Between 181and 190
Between 191and 200
Between 201and 210
Between 211and 220
Between 221and 230
Between 231and 240
Between 241and 250
Between 251and 260
>260 ScoreUnknown
0
10
20
29
34
4341
39
18
400
5
0 13 3
1 1 0 0 0
Matched Not Matched
Step 1 Scores Source: NRMP Data Warehouse and AAMC Data Warehouse. USMLEscores by permission of the NBME and ECFMG.
U.S. Seniors
0
4
8
12
16
20
24
28
<= 180 Between 181and 190
Between 191and 200
Between 201and 210
Between 211and 220
Between 221and 230
Between 231and 240
Between 241and 250
Between 251and 260
>260 ScoreUnknown
0
6
9 9 810
7
3 3
0
25
0
6 68 8
11 11
31 0
7
Matched Not Matched
Step 1 Scores Source: NRMP Data Warehouse and AAMC Data Warehouse. USMLEscores by permission of the NBME and ECFMG.
Independent Applicants
Copyright ©2009 NRMP and AAMC. Copies may be made for educational or noncommercial uses only.
Charting Outcomes in the Match, 2009114

Graph IP-2
Probability of Matching to Preferred Specialty by USMLE Step 1 ScoreInternal Medicine/Pediatrics
0.00
0.10
0.20
0.30
0.40
0.50
0.60
0.70
0.80
0.90
1.00
160 180 200 220 240 260 280
Independent ApplicantsU.S. Seniors
Step 1 ScoreSource: NRMP Data Warehouse and AAMC Data Warehouse. USMLE
scores by permission of the NBME and ECFMG. Note: Probabilitiescalculated based on 2007-2009 applicants.
Probability of Matching
115Copyright ©2009 NRMP and AAMC. Copies may be made for educational or noncommercial uses only.
Charting Outcomes in the Match, 2009

Chart IP-4
USMLE Step 2 ScoresInternal Medicine/Pediatrics
0
10
20
30
40
50
<= 180 Between 181and 190
Between 191and 200
Between 201and 210
Between 211and 220
Between 221and 230
Between 231and 240
Between 241and 250
Between 251and 260
>260 ScoreUnknown
2 1
8
15
2529
2528
35
21
49
1 1 1 1 2 14
0 1 0 2
Matched Not Matched
Step 2 Scores Source: NRMP Data Warehouse and AAMC Data Warehouse. USMLEscores by permission of the NBME and ECFMG.
U.S. Seniors
0
4
8
12
16
20
24
28
<= 180 Between 181and 190
Between 191and 200
Between 201and 210
Between 211and 220
Between 221and 230
Between 231and 240
Between 241and 250
Between 251and 260
>260 ScoreUnknown
0
9
3
9 810
7 8
1 0
25
1
7 7 79
14
2
5
1 0
8
Matched Not Matched
Step 2 Scores Source: NRMP Data Warehouse and AAMC Data Warehouse. USMLEscores by permission of the NBME and ECFMG.
Independent Applicants
Copyright ©2009 NRMP and AAMC. Copies may be made for educational or noncommercial uses only.
Charting Outcomes in the Match, 2009116

Chart IP-5
Number of Research ProjectsInternal Medicine/Pediatrics
0
10
20
30
40
50
60
70
None 1 2 3 4 5 or More
63
5258
35
19
11
3 3 2 2 2 2
Matched Not Matched
Research Projects
U.S. Seniors
0
10
20
30
40
50
60
70
None 1 2 3 4 5 or More
2926
14
71 3
32
17
52 1
4
Matched Not Matched
Research ProjectsSource: NRMP Data Warehouse and AAMC Data Warehouse
Independent Applicants
Copyright ©2009 NRMP and AAMC. Copies may be made for educational or noncommercial uses only.
Charting Outcomes in the Match, 2009117

Chart IP-6
Number of Abstracts, Presentations, and PublicationsInternal Medicine/Pediatrics
0
20
40
60
80
100
None 1 2 3 4 5 or More
98
3830 28
1925
51 2 1 1 4
Matched Not Matched
Publications
U.S. Seniors
0
20
40
60
80
100
None 1 2 3 4 5 or More
49
10 6 2 211
33
13
2 3 4 6
Matched Not Matched
PublicationsSource: NRMP Data Warehouse and AAMC Data Warehouse
Independent Applicants
Copyright ©2009 NRMP and AAMC. Copies may be made for educational or noncommercial uses only.
Charting Outcomes in the Match, 2009118

Chart IP-7
Number of Work ExperiencesInternal Medicine/Pediatrics
0
10
20
30
40
50
None 1 2 3 4 5 or More
32
46 47
35 35
43
2 15
3 30
Matched Not Matched
Work Experiences
U.S. Seniors
0
10
20
30
40
50
None 1 2 3 4 5 or More
96
15 16
8
26
6 68
1311
17
Matched Not Matched
Work ExperiencesSource: NRMP Data Warehouse and AAMC Data Warehouse
Independent Applicants
Copyright ©2009 NRMP and AAMC. Copies may be made for educational or noncommercial uses only.
Charting Outcomes in the Match, 2009119

Chart IP-8
Number of Volunteer ExperiencesInternal Medicine/Pediatrics
0
20
40
60
80
100
None 1 2 3 4 5 6 7 8 9 10 or More
7 8 1115
2517 17
2117 17
83
1 1 2 3 0 1 2 1 1 0 2
Matched Not Matched
Volunteer Experiences
U.S. Seniors
0
20
40
60
80
100
None 1 2 3 4 5 6 7 8 9 10 or More
138 7 6 7 6 4 6 7
2
14169 12 11
4 2 1 2 2 0 2
Matched Not Matched
Volunteer ExperiencesSource: NRMP Data Warehouse and AAMC Data Warehouse.
Independent Applicants
Copyright ©2009 NRMP and AAMC. Copies may be made for educational or noncommercial uses only.
Charting Outcomes in the Match, 2009120

Chart IP-9
Other Characteristics of U.S. SeniorsInternal Medicine/Pediatrics
0
40
80
120
160
200
No Yes
188
50
131
Matched Not Matched
AOA Membership
0
20
40
60
80
100
120
140
160
180
No Yes
173
65
9 5
Graduate of One of the 40 U.S. Medical Schoolswith the Highest NIH Funding
0
40
80
120
160
200
240
No Yes
234
413
1
Ph.D. Degree
0
40
80
120
160
200
240
No Yes
205
3312
2
Other Graduate Degree
Sources. AOA membership from the AAMC Data Warehouse, NIH awards from http://report.nih.gov/award/trends/AggregateData.cfm Medical Schools Only.xls, Ph.D. and other graduate degrees from the AAMC Data Warehouse
Copyright ©2009 NRMP and AAMC. Copies may be made for educational or noncommercial uses only.
Charting Outcomes in the Match, 2009121

NS Neurological Surgery
Copyright ©2009 NRMP and AAMC. Copies may be made for educational or noncommercial uses only.
122 Charting Outcomes in the Match, 2009

Table NS-1
Summary StatisticsNeurological Surgery
Measure (n=171) (n=44) (n=19) (n=61)
U.S. Seniors Independent Applicants
Matched Unmatched Matched Unmatched
1. 13.5 9.9 6.4 4.1Mean number of contiguous ranks2. 1.0 1.3 1.4 1.6Mean number of distinct specialties ranked3. 239 224 234 223Mean USMLE Step 1 score4. 237 214 238 225Mean USMLE Step 2 score5. 3.3 2.8 2.1 1.8Mean number of research experiences6. 7.8 5.5 9.4 5.5Mean number of abstracts, presentations, and
publications7. 2.5 2.0 2.7 3.1Mean number of work experiences8. 5.0 4.7 2.2 2.0Mean number of volunteer experiences9. 28.1 11.4Percentage who are AOA members n/a n/a
10. 50.3 31.8Percentage who graduated from one of the 40 U.S. medical schools with the highest NIH funding
n/a n/a
11. 11.7 9.1Percentage who have Ph.D. degree n/a n/a12. 14.0 18.2Percentage who have another graduate degree n/a n/a
n/a: The measure either does not apply to, applies to only a small percentage of, or no reliable data were available for independent applicants.
Sources. Measures 1, 2, and match outcome are from the NRMP Data Warehouse; measures 3 and 4 are from the AAMC Data Warehouse and from the ECFMG, both by permission of the NBME and ECFMG; measures 5-9 are from the AAMC Data Warehouse; measure 10 is from the NIH website (http://report.nih.gov/award/trends/AggregateDate.cfm Medical Schools Only.xls); and measures 11 and 12 are from the AAMC Data Warehouse.
Note: USMLE Step 1 scores are not available for most osteopathic medical school graduates included in the independent applicant group.
Approximately 30 percent of U.S. allopathic medical school seniors do not take the USMLE Step 2 prior to the Match.
Copyright ©2009 NRMP and AAMC. Copies may be made for educational or noncommercial uses only.
123 Charting Outcomes in the Match, 2009

0
10
20
30
40
50
60
1 2 3 4 5 6 7 8 9 10 11 12 13 14 15 16 orMore
2 0 1 14 3 5 4
8 7
17 1619
15 17
52
14 3 1 0 2 3 1 1
6 5 4 4 41
4
Matched Not Matched
Contiguous Ranks
U.S. Seniors
0
10
20
30
40
50
60
1 2 3 4 5 6 7 8 9 10 11 12 13 14 15 16 orMore
3 2 1 3 1 1 1 04
0 0 0 1 1 0 1
25
9 73 3 5
0 0 1 2 1 0 0 1 1 3
Matched Not Matched
Contiguous RanksSource: NRMP Data Warehouse
Independent Applicants
Copyright ©2009 NRMP and AAMC. Copies may be made for educational or noncommercial uses only.
124 Charting Outcomes in the Match, 2009
Chart NS-1
Number of Contiguous Ranks Within Preferred SpecialtyNeurological Surgery
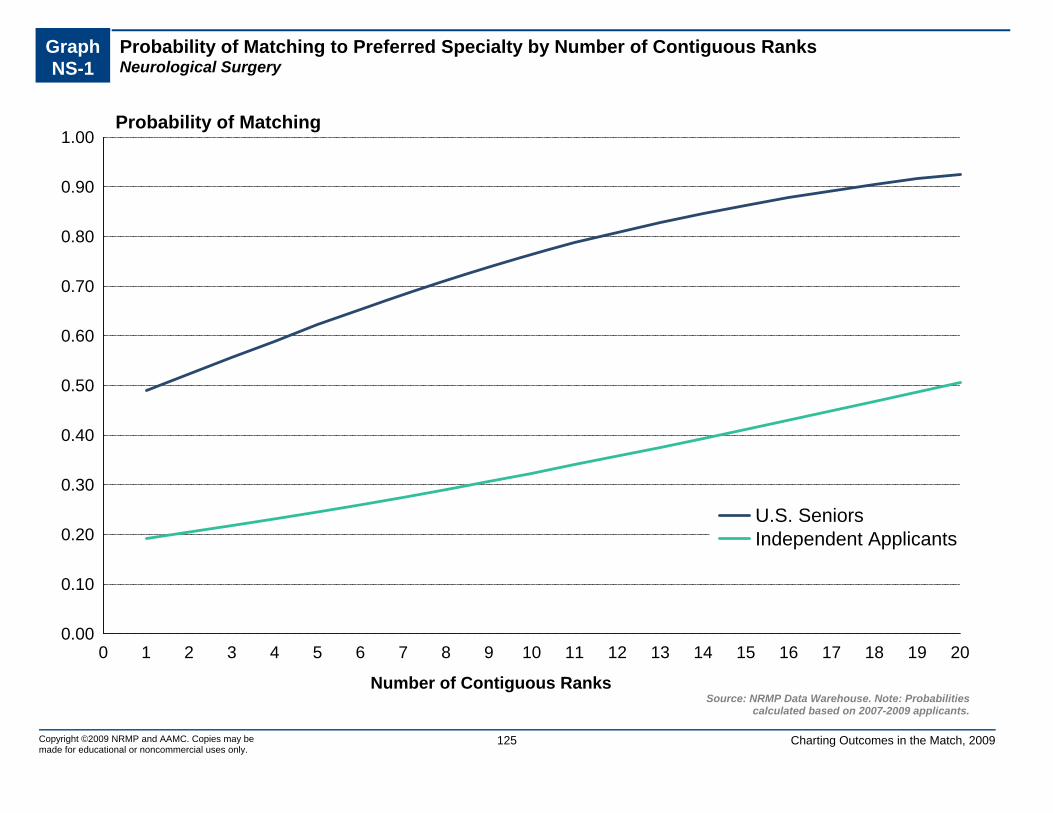
Graph NS-1
Probability of Matching to Preferred Specialty by Number of Contiguous RanksNeurological Surgery
0.00
0.10
0.20
0.30
0.40
0.50
0.60
0.70
0.80
0.90
1.00
0 1 2 3 4 5 6 7 8 9 10 11 12 13 14 15 16 17 18 19 20
U.S. SeniorsIndependent Applicants
Number of Contiguous RanksSource: NRMP Data Warehouse. Note: Probabilities
calculated based on 2007-2009 applicants.
Probability of Matching
125Copyright ©2009 NRMP and AAMC. Copies may be made for educational or noncommercial uses only.
Charting Outcomes in the Match, 2009

Chart NS-2
Number of Distinct Specialties RankedNeurological Surgery
0
20
40
60
80
100
120
140
160
180165
6 0 0
35
80 1
1 2 3 4 or More
Matched Not Matched
Distinct Specialties Ranked
U.S. Seniors
020406080
100120140160180
1 2 3 4 or More
12 6 1 0
3620
2 3
Matched Not Matched
Distinct Specialties RankedSource: NRMP Data Warehouse
Independent Applicants
Copyright ©2009 NRMP and AAMC. Copies may be made for educational or noncommercial uses only.
Charting Outcomes in the Match, 2009126
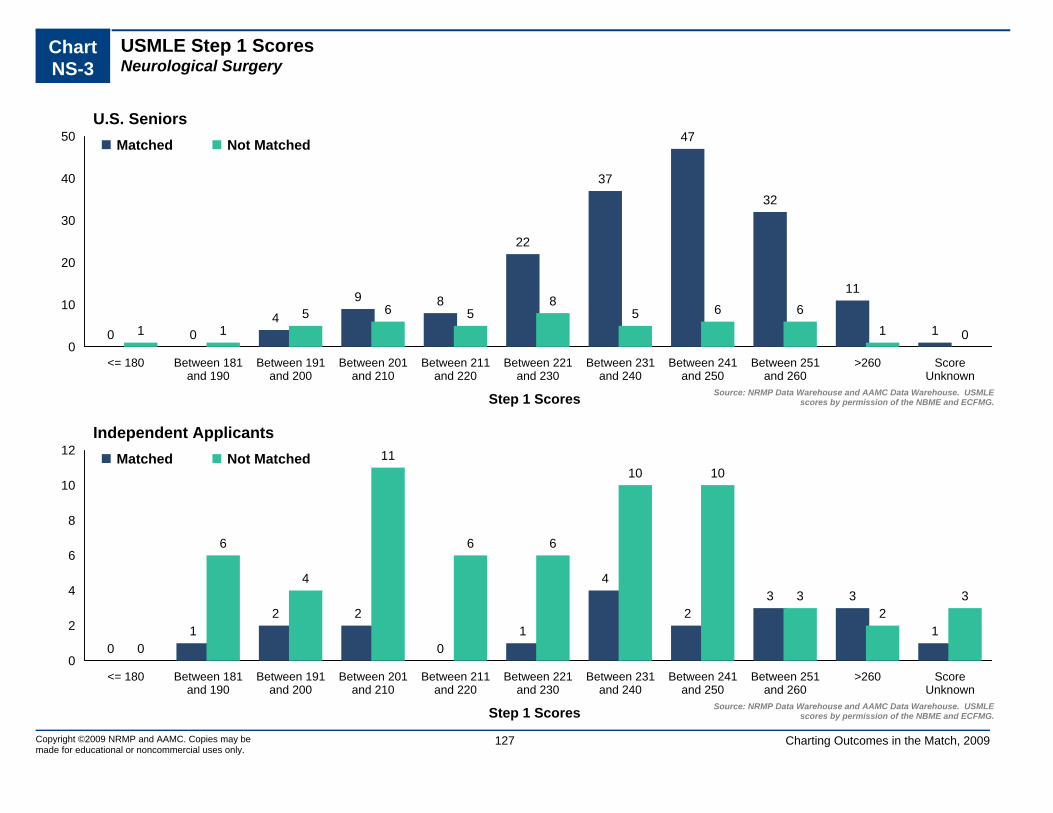
Chart NS-3
USMLE Step 1 ScoresNeurological Surgery
0
10
20
30
40
50
<= 180 Between 181and 190
Between 191and 200
Between 201and 210
Between 211and 220
Between 221and 230
Between 231and 240
Between 241and 250
Between 251and 260
>260 ScoreUnknown
0 04
9 8
22
37
47
32
11
11 15 6 5
85 6 6
1 0
Matched Not Matched
Step 1 Scores Source: NRMP Data Warehouse and AAMC Data Warehouse. USMLEscores by permission of the NBME and ECFMG.
U.S. Seniors
0
2
4
6
8
10
12
<= 180 Between 181and 190
Between 191and 200
Between 201and 210
Between 211and 220
Between 221and 230
Between 231and 240
Between 241and 250
Between 251and 260
>260 ScoreUnknown
01
2 2
01
4
23 3
10
6
4
11
6 6
10 10
32
3
Matched Not Matched
Step 1 Scores Source: NRMP Data Warehouse and AAMC Data Warehouse. USMLEscores by permission of the NBME and ECFMG.
Independent Applicants
Copyright ©2009 NRMP and AAMC. Copies may be made for educational or noncommercial uses only.
Charting Outcomes in the Match, 2009127

Graph NS-2
Probability of Matching to Preferred Specialty by USMLE Step 1 ScoreNeurological Surgery
0.00
0.10
0.20
0.30
0.40
0.50
0.60
0.70
0.80
0.90
1.00
160 180 200 220 240 260 280
U.S. SeniorsIndependent Applicants
Step 1 ScoreSource: NRMP Data Warehouse and AAMC Data Warehouse. USMLE
scores by permission of the NBME and ECFMG. Note: Probabilitiescalculated based on 2007-2009 applicants.
Probability of Matching
128Copyright ©2009 NRMP and AAMC. Copies may be made for educational or noncommercial uses only.
Charting Outcomes in the Match, 2009
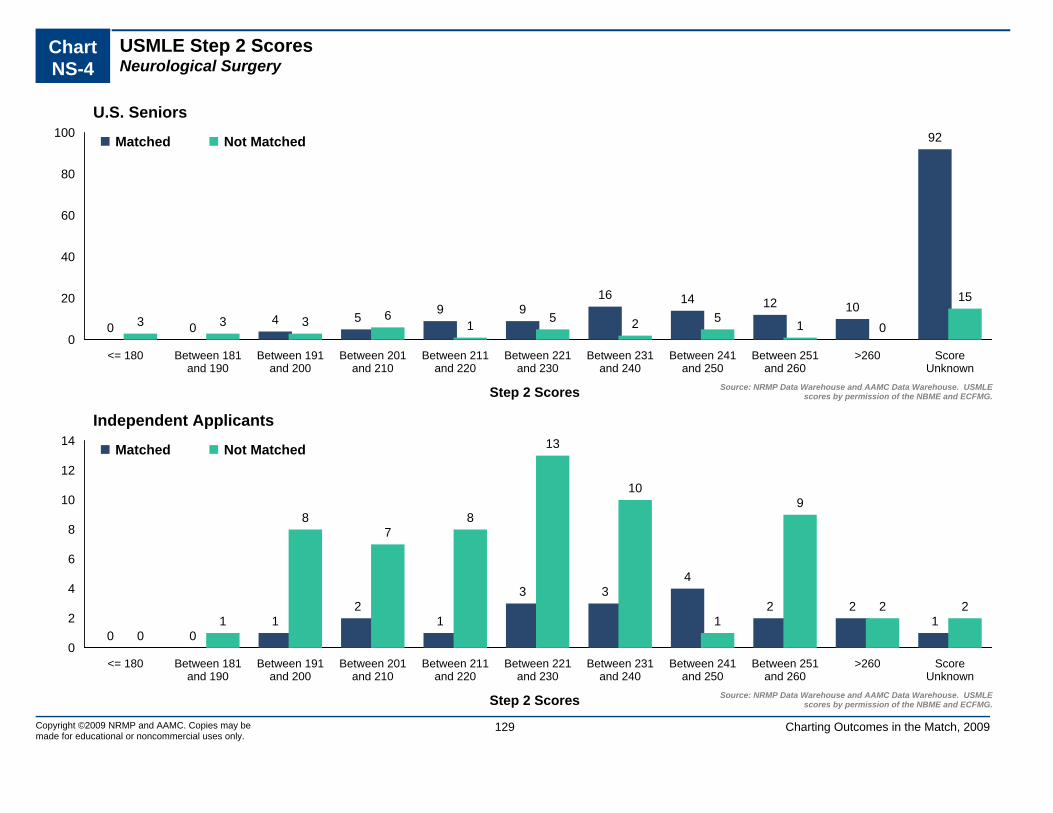
Chart NS-4
USMLE Step 2 ScoresNeurological Surgery
0
20
40
60
80
100
<= 180 Between 181and 190
Between 191and 200
Between 201and 210
Between 211and 220
Between 221and 230
Between 231and 240
Between 241and 250
Between 251and 260
>260 ScoreUnknown
0 0 4 5 9 916 14 12 10
92
3 3 3 61 5 2 5 1 0
15
Matched Not Matched
Step 2 Scores Source: NRMP Data Warehouse and AAMC Data Warehouse. USMLEscores by permission of the NBME and ECFMG.
U.S. Seniors
0
2
4
6
8
10
12
14
<= 180 Between 181and 190
Between 191and 200
Between 201and 210
Between 211and 220
Between 221and 230
Between 231and 240
Between 241and 250
Between 251and 260
>260 ScoreUnknown
0 01
21
3 34
2 21
01
87
8
13
10
1
9
2 2
Matched Not Matched
Step 2 Scores Source: NRMP Data Warehouse and AAMC Data Warehouse. USMLEscores by permission of the NBME and ECFMG.
Independent Applicants
Copyright ©2009 NRMP and AAMC. Copies may be made for educational or noncommercial uses only.
Charting Outcomes in the Match, 2009129

Chart NS-5
Number of Research ProjectsNeurological Surgery
0
5
10
15
20
25
30
35
40
45
None 1 2 3 4 5 or More
8
22
40
35
23
43
3
911 10
3
8
Matched Not Matched
Research Projects
U.S. Seniors
0
5
10
15
20
25
30
35
40
45
None 1 2 3 4 5 or More
5 42
51 2
14
21
13
62
5
Matched Not Matched
Research ProjectsSource: NRMP Data Warehouse and AAMC Data Warehouse
Independent Applicants
Copyright ©2009 NRMP and AAMC. Copies may be made for educational or noncommercial uses only.
Charting Outcomes in the Match, 2009130

Chart NS-6
Number of Abstracts, Presentations, and PublicationsNeurological Surgery
0
20
40
60
80
100
None 1 2 3 4 5 or More
1915 18
12 12
95
27 9
5 5
16
Matched Not Matched
Publications
U.S. Seniors
0
20
40
60
80
100
None 1 2 3 4 5 or More
40 0 2 1
12158
48
3
23
Matched Not Matched
PublicationsSource: NRMP Data Warehouse and AAMC Data Warehouse
Independent Applicants
Copyright ©2009 NRMP and AAMC. Copies may be made for educational or noncommercial uses only.
Charting Outcomes in the Match, 2009131

Chart NS-7
Number of Work ExperiencesNeurological Surgery
0
5
10
15
20
25
30
35
None 1 2 3 4 5 or More
3234
32
20
26 27
811
97 7
2
Matched Not Matched
Work Experiences
U.S. Seniors
0
5
10
15
20
25
30
35
None 1 2 3 4 5 or More
53 4 3 2 2
11 11 118
5
15
Matched Not Matched
Work ExperiencesSource: NRMP Data Warehouse and AAMC Data Warehouse
Independent Applicants
Copyright ©2009 NRMP and AAMC. Copies may be made for educational or noncommercial uses only.
Charting Outcomes in the Match, 2009132

Chart NS-8
Number of Volunteer ExperiencesNeurological Surgery
0
4
8
12
16
20
24
28
None 1 2 3 4 5 6 7 8 9 10 or More
22
7
24
15
22 21
9
13
9 9
20
4 4
10
35 4 4
1 0
4 5
Matched Not Matched
Volunteer Experiences
U.S. Seniors
0
4
8
12
16
20
24
28
None 1 2 3 4 5 6 7 8 9 10 or More
9
2 1 0
4
1 0 0 1 1 0
26
13
5 53
1 1 0
31
3
Matched Not Matched
Volunteer ExperiencesSource: NRMP Data Warehouse and AAMC Data Warehouse.
Independent Applicants
Copyright ©2009 NRMP and AAMC. Copies may be made for educational or noncommercial uses only.
Charting Outcomes in the Match, 2009133

Chart NS-9
Other Characteristics of U.S. SeniorsNeurological Surgery
0
20
40
60
80
100
120
140
No Yes
123
4839
5
Matched Not Matched
AOA Membership
10
20
30
40
50
60
70
80
90
No Yes
85 86
30
14
Graduate of One of the 40 U.S. Medical Schoolswith the Highest NIH Funding
0
20
40
60
80
100
120
140
160
No Yes
151
20
40
4
Ph.D. Degree
0
20
40
60
80
100
120
140
160
No Yes
147
2436
8
Other Graduate Degree
Sources. AOA membership from the AAMC Data Warehouse, NIH awards from http://report.nih.gov/award/trends/AggregateData.cfm Medical Schools Only.xls, Ph.D. and other graduate degrees from the AAMC Data Warehouse
Copyright ©2009 NRMP and AAMC. Copies may be made for educational or noncommercial uses only.
Charting Outcomes in the Match, 2009134

N Neurology
Copyright ©2009 NRMP and AAMC. Copies may be made for educational or noncommercial uses only.
135 Charting Outcomes in the Match, 2009

Table N-1
Summary StatisticsNeurology
Measure (n=237) (n=79) (n=193) (n=195)
U.S. Seniors Independent Applicants
Matched Unmatched Matched Unmatched
1. 8.7 9.3 5.2 3.0Mean number of contiguous ranks2. 1.2 1.3 1.6 1.9Mean number of distinct specialties ranked3. 225 222 224 214Mean USMLE Step 1 score4. 231 226 225 213Mean USMLE Step 2 score5. 2.4 2.4 1.8 1.7Mean number of research experiences6. 3.7 3.3 4.7 5.4Mean number of abstracts, presentations, and
publications7. 2.5 2.2 2.9 3.3Mean number of work experiences8. 5.8 4.7 2.7 2.3Mean number of volunteer experiences9. 11.4 13.9Percentage who are AOA members n/a n/a
10. 35.9 29.1Percentage who graduated from one of the 40 U.S. medical schools with the highest NIH funding
n/a n/a
11. 11.0 8.9Percentage who have Ph.D. degree n/a n/a12. 11.0 6.3Percentage who have another graduate degree n/a n/a
n/a: The measure either does not apply to, applies to only a small percentage of, or no reliable data were available for independent applicants.
Sources. Measures 1, 2, and match outcome are from the NRMP Data Warehouse; measures 3 and 4 are from the AAMC Data Warehouse and from the ECFMG, both by permission of the NBME and ECFMG; measures 5-9 are from the AAMC Data Warehouse; measure 10 is from the NIH website (http://report.nih.gov/award/trends/AggregateDate.cfm Medical Schools Only.xls); and measures 11 and 12 are from the AAMC Data Warehouse.
Note: USMLE Step 1 scores are not available for most osteopathic medical school graduates included in the independent applicant group.
Approximately 30 percent of U.S. allopathic medical school seniors do not take the USMLE Step 2 prior to the Match.
Copyright ©2009 NRMP and AAMC. Copies may be made for educational or noncommercial uses only.
136 Charting Outcomes in the Match, 2009

0
20
40
60
80
100
1 2 3 4 5 6 7 8 9 10 11 12 13 14 15 16 orMore
84 6
10 12
23 25 22
3224
19 1913
7 49
3 15 4 2 5
9 8 82
95 5 2 2
9
Matched Not Matched
Contiguous Ranks
U.S. Seniors
0
20
40
60
80
100
1 2 3 4 5 6 7 8 9 10 11 12 13 14 15 16 orMore
42
24 20
817 14 12
1711 10
4 61 2 1 4
94
3124
13 122 2 0 3 2 3 3 1 1 1 3
Matched Not Matched
Contiguous RanksSource: NRMP Data Warehouse
Independent Applicants
Copyright ©2009 NRMP and AAMC. Copies may be made for educational or noncommercial uses only.
137 Charting Outcomes in the Match, 2009
Chart N-1
Number of Contiguous Ranks Within Preferred SpecialtyNeurology

Graph N-1
Probability of Matching to Preferred Specialty by Number of Contiguous RanksNeurology
0.00
0.10
0.20
0.30
0.40
0.50
0.60
0.70
0.80
0.90
1.00
0 1 2 3 4 5 6 7 8 9 10 11 12 13 14 15 16 17 18 19 20
U.S. SeniorsIndependent Applicants
Number of Contiguous RanksSource: NRMP Data Warehouse. Note: Probabilities
calculated based on 2007-2009 applicants.
Probability of Matching
138Copyright ©2009 NRMP and AAMC. Copies may be made for educational or noncommercial uses only.
Charting Outcomes in the Match, 2009

Chart N-2
Number of Distinct Specialties RankedNeurology
0
40
80
120
160
200 193
34
7 3
58
183 0
1 2 3 4 or More
Matched Not Matched
Distinct Specialties Ranked
U.S. Seniors
0
40
80
120
160
200
1 2 3 4 or More
104
66
194
8468
2914
Matched Not Matched
Distinct Specialties RankedSource: NRMP Data Warehouse
Independent Applicants
Copyright ©2009 NRMP and AAMC. Copies may be made for educational or noncommercial uses only.
Charting Outcomes in the Match, 2009139

Chart N-3
USMLE Step 1 ScoresNeurology
0
10
20
30
40
50
60
<= 180 Between 181and 190
Between 191and 200
Between 201and 210
Between 211and 220
Between 221and 230
Between 231and 240
Between 241and 250
Between 251and 260
>260 ScoreUnknown
17
14
3439
51
42
27
17
410
37
17
7
15 1610
3 1 0
Matched Not Matched
Step 1 Scores Source: NRMP Data Warehouse and AAMC Data Warehouse. USMLEscores by permission of the NBME and ECFMG.
U.S. Seniors
0
5
10
15
20
25
30
35
40
<= 180 Between 181and 190
Between 191and 200
Between 201and 210
Between 211and 220
Between 221and 230
Between 231and 240
Between 241and 250
Between 251and 260
>260 ScoreUnknown
0
6
16 16
3229
27
16
11
4
36
2
20
2630
32
2724
13
1 1
19
Matched Not Matched
Step 1 Scores Source: NRMP Data Warehouse and AAMC Data Warehouse. USMLEscores by permission of the NBME and ECFMG.
Independent Applicants
Copyright ©2009 NRMP and AAMC. Copies may be made for educational or noncommercial uses only.
Charting Outcomes in the Match, 2009140
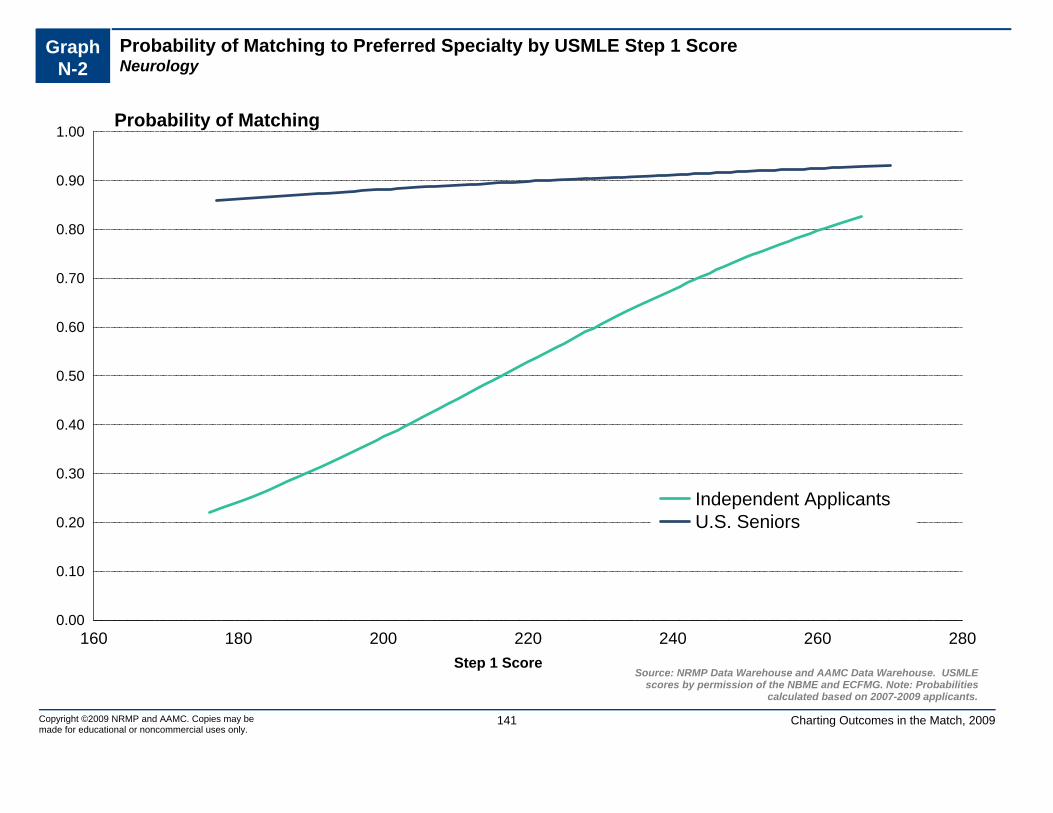
Graph N-2
Probability of Matching to Preferred Specialty by USMLE Step 1 ScoreNeurology
0.00
0.10
0.20
0.30
0.40
0.50
0.60
0.70
0.80
0.90
1.00
160 180 200 220 240 260 280
Independent ApplicantsU.S. Seniors
Step 1 ScoreSource: NRMP Data Warehouse and AAMC Data Warehouse. USMLE
scores by permission of the NBME and ECFMG. Note: Probabilitiescalculated based on 2007-2009 applicants.
Probability of Matching
141Copyright ©2009 NRMP and AAMC. Copies may be made for educational or noncommercial uses only.
Charting Outcomes in the Match, 2009

Chart N-4
USMLE Step 2 ScoresNeurology
0
10
20
30
40
50
60
70
80
<= 180 Between 181and 190
Between 191and 200
Between 201and 210
Between 211and 220
Between 221and 230
Between 231and 240
Between 241and 250
Between 251and 260
>260 ScoreUnknown
16 4
15 17
35 35
22 23
7
72
1 15 8 8
49
13
4 1
25
Matched Not Matched
Step 2 Scores Source: NRMP Data Warehouse and AAMC Data Warehouse. USMLEscores by permission of the NBME and ECFMG.
U.S. Seniors
0
5
10
15
20
25
30
35
40
<= 180 Between 181and 190
Between 191and 200
Between 201and 210
Between 211and 220
Between 221and 230
Between 231and 240
Between 241and 250
Between 251and 260
>260 ScoreUnknown
1
913 14
28 2724
15
1012
40
5
23
3026
28
22 23
11
62
19
Matched Not Matched
Step 2 Scores Source: NRMP Data Warehouse and AAMC Data Warehouse. USMLEscores by permission of the NBME and ECFMG.
Independent Applicants
Copyright ©2009 NRMP and AAMC. Copies may be made for educational or noncommercial uses only.
Charting Outcomes in the Match, 2009142

Chart N-5
Number of Research ProjectsNeurology
0
10
20
30
40
50
60
70
None 1 2 3 4 5 or More
32
39
69
43
2430
15 1417
12 10 11
Matched Not Matched
Research Projects
U.S. Seniors
0
10
20
30
40
50
60
70
None 1 2 3 4 5 or More
53 54
41
1511
19
55
4642
27
18
7
Matched Not Matched
Research ProjectsSource: NRMP Data Warehouse and AAMC Data Warehouse
Independent Applicants
Copyright ©2009 NRMP and AAMC. Copies may be made for educational or noncommercial uses only.
Charting Outcomes in the Match, 2009143

Chart N-6
Number of Abstracts, Presentations, and PublicationsNeurology
0
10
20
30
40
50
60
70
80
None 1 2 3 4 5 or More
64
34 3326
19
61
32
129 8
3
15
Matched Not Matched
Publications
U.S. Seniors
0
10
20
30
40
50
60
70
80 79
17 17 15
5
6067
33
1510 7
63
None 1 2 3 4 5 or More
Matched Not Matched
PublicationsSource: NRMP Data Warehouse and AAMC Data Warehouse
Independent Applicants
Copyright ©2009 NRMP and AAMC. Copies may be made for educational or noncommercial uses only.
Charting Outcomes in the Match, 2009144
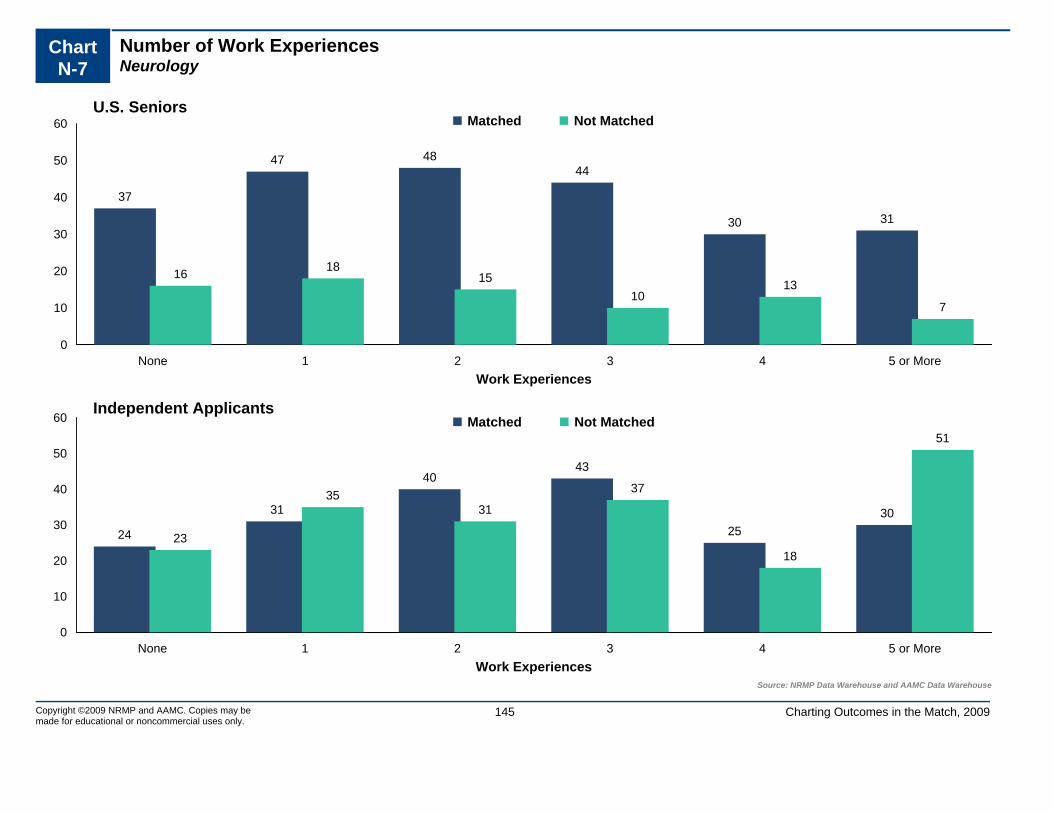
Chart N-7
Number of Work ExperiencesNeurology
0
10
20
30
40
50
60
None 1 2 3 4 5 or More
37
47 4844
30 31
16 1815
1013
7
Matched Not Matched
Work Experiences
U.S. Seniors
0
10
20
30
40
50
60
None 1 2 3 4 5 or More
24
31
4043
2530
23
3531
37
18
51Matched Not Matched
Work ExperiencesSource: NRMP Data Warehouse and AAMC Data Warehouse
Independent Applicants
Copyright ©2009 NRMP and AAMC. Copies may be made for educational or noncommercial uses only.
Charting Outcomes in the Match, 2009145

Chart N-8
Number of Volunteer ExperiencesNeurology
0
10
20
30
40
50
60
None 1 2 3 4 5 6 7 8 9 10 or More
10 9
23
36
2327
15
28
19
10
37
7 8 10 118
5 74
73
9
Matched Not Matched
Volunteer Experiences
U.S. Seniors
0
10
20
30
40
50
60
None 1 2 3 4 5 6 7 8 9 10 or More
43
34 35
28
12 11 9 10
2 4 5
56
34 36
2318
11
5 41 2
5
Matched Not Matched
Volunteer ExperiencesSource: NRMP Data Warehouse and AAMC Data Warehouse.
Independent Applicants
Copyright ©2009 NRMP and AAMC. Copies may be made for educational or noncommercial uses only.
Charting Outcomes in the Match, 2009146

Chart N-9
Other Characteristics of U.S. SeniorsNeurology
0
40
80
120
160
200
240
No Yes
210
27
68
11
Matched Not Matched
AOA Membership
20
40
60
80
100
120
140
160
No Yes
152
85
56
23
Graduate of One of the 40 U.S. Medical Schoolswith the Highest NIH Funding
0
40
80
120
160
200
240
No Yes
211
26
72
7
Ph.D. Degree
0
40
80
120
160
200
240
No Yes
211
26
74
5
Other Graduate Degree
Sources. AOA membership from the AAMC Data Warehouse, NIH awards from http://report.nih.gov/award/trends/AggregateData.cfm Medical Schools Only.xls, Ph.D. and other graduate degrees from the AAMC Data Warehouse
Copyright ©2009 NRMP and AAMC. Copies may be made for educational or noncommercial uses only.
Charting Outcomes in the Match, 2009147

OB Obstetrics and Gynecology
Copyright ©2009 NRMP and AAMC. Copies may be made for educational or noncommercial uses only.
148 Charting Outcomes in the Match, 2009

Table OB-1
Summary StatisticsObstetrics and Gynecology
Measure (n=874) (n=67) (n=284) (n=371)
U.S. Seniors Independent Applicants
Matched Unmatched Matched Unmatched
1. 9.7 6.2 6.7 3.4Mean number of contiguous ranks2. 1.0 1.2 1.2 1.5Mean number of distinct specialties ranked3. 219 208 212 205Mean USMLE Step 1 score4. 229 210 219 208Mean USMLE Step 2 score5. 2.1 2.2 1.3 1.2Mean number of research experiences6. 2.4 2.5 1.6 2.0Mean number of abstracts, presentations, and
publications7. 2.8 2.7 3.0 3.8Mean number of work experiences8. 7.2 6.2 4.2 2.8Mean number of volunteer experiences9. 13.8 1.5Percentage who are AOA members n/a n/a
10. 31.0 26.9Percentage who graduated from one of the 40 U.S. medical schools with the highest NIH funding
n/a n/a
11. 2.2 7.5Percentage who have Ph.D. degree n/a n/a12. 11.7 13.4Percentage who have another graduate degree n/a n/a
n/a: The measure either does not apply to, applies to only a small percentage of, or no reliable data were available for independent applicants.
Sources. Measures 1, 2, and match outcome are from the NRMP Data Warehouse; measures 3 and 4 are from the AAMC Data Warehouse and from the ECFMG, both by permission of the NBME and ECFMG; measures 5-9 are from the AAMC Data Warehouse; measure 10 is from the NIH website (http://report.nih.gov/award/trends/AggregateDate.cfm Medical Schools Only.xls); and measures 11 and 12 are from the AAMC Data Warehouse.
Note: USMLE Step 1 scores are not available for most osteopathic medical school graduates included in the independent applicant group.
Approximately 30 percent of U.S. allopathic medical school seniors do not take the USMLE Step 2 prior to the Match.
Copyright ©2009 NRMP and AAMC. Copies may be made for educational or noncommercial uses only.
149 Charting Outcomes in the Match, 2009

0
30
60
90
120
150
180
1 2 3 4 5 6 7 8 9 10 11 12 13 14 15 16 orMore
11 13 17 2032
54
7588
99117
8876
5847
3445
11 7 2 4 6 311 7 2 2 6 2 0 1 3 0
Matched Not Matched
Contiguous Ranks
U.S. Seniors
0
30
60
90
120
150
180
1 2 3 4 5 6 7 8 9 10 11 12 13 14 15 16 orMore
2819 24 19
32 28 29 2513 14 16 10 9 5 4 9
163
64
36 31
10 15 11 9 4 8 3 2 1 3 011
Matched Not Matched
Contiguous RanksSource: NRMP Data Warehouse
Independent Applicants
Copyright ©2009 NRMP and AAMC. Copies may be made for educational or noncommercial uses only.
150 Charting Outcomes in the Match, 2009
Chart OB-1
Number of Contiguous Ranks Within Preferred SpecialtyObstetrics and Gynecology

Graph OB-1
Probability of Matching to Preferred Specialty by Number of Contiguous RanksObstetrics and Gynecology
0.00
0.10
0.20
0.30
0.40
0.50
0.60
0.70
0.80
0.90
1.00
0 1 2 3 4 5 6 7 8 9 10 11 12 13 14 15 16 17 18 19 20
U.S. SeniorsIndependent Applicants
Number of Contiguous RanksSource: NRMP Data Warehouse. Note: Probabilities
calculated based on 2007-2009 applicants.
Probability of Matching
151Copyright ©2009 NRMP and AAMC. Copies may be made for educational or noncommercial uses only.
Charting Outcomes in the Match, 2009

Chart OB-2
Number of Distinct Specialties RankedObstetrics and Gynecology
0
200
400
600
800
1,000
1 2 3 4 or More
857
17 0 055
11 1 0
Matched Not Matched
Distinct Specialties Ranked
U.S. Seniors
0
200
400
600
800
1,000
1 2 3 4 or More
238
36 9 1
244
80 38 9
Matched Not Matched
Distinct Specialties RankedSource: NRMP Data Warehouse
Independent Applicants
Copyright ©2009 NRMP and AAMC. Copies may be made for educational or noncommercial uses only.
Charting Outcomes in the Match, 2009152

Chart OB-3
USMLE Step 1 ScoresObstetrics and Gynecology
0
20
40
60
80
100
120
140
160
180
<= 180 Between 181and 190
Between 191and 200
Between 201and 210
Between 211and 220
Between 221and 230
Between 231and 240
Between 241and 250
Between 251and 260
>260 ScoreUnknown
6
52
97
139
158
178
121
78
38
7 0013 12
207 8 4 2 0 1 0
Matched Not Matched
Step 1 Scores Source: NRMP Data Warehouse and AAMC Data Warehouse. USMLEscores by permission of the NBME and ECFMG.
U.S. Seniors
0
20
40
60
80
100
120
<= 180 Between 181and 190
Between 191and 200
Between 201and 210
Between 211and 220
Between 221and 230
Between 231and 240
Between 241and 250
Between 251and 260
>260 ScoreUnknown
1
2335 31 33
2514
93 2
108
4
6876
67
41 42
17
4 3 2
47
Matched Not Matched
Step 1 Scores Source: NRMP Data Warehouse and AAMC Data Warehouse. USMLEscores by permission of the NBME and ECFMG.
Independent Applicants
Copyright ©2009 NRMP and AAMC. Copies may be made for educational or noncommercial uses only.
Charting Outcomes in the Match, 2009153

Graph OB-2
Probability of Matching to Preferred Specialty by USMLE Step 1 ScoreObstetrics and Gynecology
0.00
0.10
0.20
0.30
0.40
0.50
0.60
0.70
0.80
0.90
1.00
160 180 200 220 240 260 280
U.S. SeniorsIndependent Applicants
Step 1 ScoreSource: NRMP Data Warehouse and AAMC Data Warehouse. USMLE
scores by permission of the NBME and ECFMG. Note: Probabilitiescalculated based on 2007-2009 applicants.
Probability of Matching
154Copyright ©2009 NRMP and AAMC. Copies may be made for educational or noncommercial uses only.
Charting Outcomes in the Match, 2009

Chart OB-4
USMLE Step 2 ScoresObstetrics and Gynecology
0
20
40
60
80
100
120
140
<= 180 Between 181and 190
Between 191and 200
Between 201and 210
Between 211and 220
Between 221and 230
Between 231and 240
Between 241and 250
Between 251and 260
>260 ScoreUnknown
518
37
82
113120
136
117
72
46
128
7 5 8 8 9 4 8 3 1 113
Matched Not Matched
Step 2 Scores Source: NRMP Data Warehouse and AAMC Data Warehouse. USMLEscores by permission of the NBME and ECFMG.
U.S. Seniors
0
20
40
60
80
100
120
<= 180 Between 181and 190
Between 191and 200
Between 201and 210
Between 211and 220
Between 221and 230
Between 231and 240
Between 241and 250
Between 251and 260
>260 ScoreUnknown
1
1520
2535
2429
167 3
109
10
66 6453
41 43
2212 11
1
48
Matched Not Matched
Step 2 Scores Source: NRMP Data Warehouse and AAMC Data Warehouse. USMLEscores by permission of the NBME and ECFMG.
Independent Applicants
Copyright ©2009 NRMP and AAMC. Copies may be made for educational or noncommercial uses only.
Charting Outcomes in the Match, 2009155

Chart OB-5
Number of Research ProjectsObstetrics and Gynecology
0
40
80
120
160
200
240
None 1 2 3 4 5 or More
141
207227
144
96
59
14 12 13 176 5
Matched Not Matched
Research Projects
U.S. Seniors
0
40
80
120
160
200
240
None 1 2 3 4 5 or More
10078
59
2612 9
158
107
52
2513 16
Matched Not Matched
Research ProjectsSource: NRMP Data Warehouse and AAMC Data Warehouse
Independent Applicants
Copyright ©2009 NRMP and AAMC. Copies may be made for educational or noncommercial uses only.
Charting Outcomes in the Match, 2009156

Chart OB-6
Number of Abstracts, Presentations, and PublicationsObstetrics and Gynecology
0
50
100
150
200
250
300
350
None 1 2 3 4 5 or More
326
163
114
73 61
137
268 8 9 4 12
Matched Not Matched
Publications
U.S. Seniors
0
50
100
150
200
250
300
350
None 1 2 3 4 5 or More
151
54
20 16 1330
184
6435
21 12
55
Matched Not Matched
PublicationsSource: NRMP Data Warehouse and AAMC Data Warehouse
Independent Applicants
Copyright ©2009 NRMP and AAMC. Copies may be made for educational or noncommercial uses only.
Charting Outcomes in the Match, 2009157

Chart OB-7
Number of Work ExperiencesObstetrics and Gynecology
0
30
60
90
120
150
180
None 1 2 3 4 5 or More
122
146
168 163
114
161
10 16 11 8 10 12
Matched Not Matched
Work Experiences
U.S. Seniors
0
30
60
90
120
150
180
None 1 2 3 4 5 or More
3946
5542 39
63
3845
62 63
36
127
Matched Not Matched
Work ExperiencesSource: NRMP Data Warehouse and AAMC Data Warehouse
Independent Applicants
Copyright ©2009 NRMP and AAMC. Copies may be made for educational or noncommercial uses only.
Charting Outcomes in the Match, 2009158

Chart OB-8
Number of Volunteer ExperiencesObstetrics and Gynecology
0
40
80
120
160
200
240
None 1 2 3 4 5 6 7 8 9 10 or More
2539 44
6888
7695
78 7961
221
8 4 5 5 3 6 7 6 5 315
Matched Not Matched
Volunteer Experiences
U.S. Seniors
0
40
80
120
160
200
240
None 1 2 3 4 5 6 7 8 9 10 or More
4229 38
2744
23 21 17 10 1023
8668
5848
30 25 16 14 5 7 14
Matched Not Matched
Volunteer ExperiencesSource: NRMP Data Warehouse and AAMC Data Warehouse.
Independent Applicants
Copyright ©2009 NRMP and AAMC. Copies may be made for educational or noncommercial uses only.
Charting Outcomes in the Match, 2009159

Chart OB-9
Other Characteristics of U.S. SeniorsObstetrics and Gynecology
0
100
200
300
400
500
600
700
800
No Yes
753
12166
1
Matched Not Matched
AOA Membership
0
100
200
300
400
500
600
700
No Yes
603
271
4918
Graduate of One of the 40 U.S. Medical Schoolswith the Highest NIH Funding
0
200
400
600
800
1,000
No Yes
855
1962
5
Ph.D. Degree
0
100
200
300
400
500
600
700
800
No Yes
772
10258
9
Other Graduate Degree
Sources. AOA membership from the AAMC Data Warehouse, NIH awards from http://report.nih.gov/award/trends/AggregateData.cfm Medical Schools Only.xls, Ph.D. and other graduate degrees from the AAMC Data Warehouse
Copyright ©2009 NRMP and AAMC. Copies may be made for educational or noncommercial uses only.
Charting Outcomes in the Match, 2009160

ORS Orthopaedic Surgery
Copyright ©2009 NRMP and AAMC. Copies may be made for educational or noncommercial uses only.
161 Charting Outcomes in the Match, 2009

Table ORS-1
Summary StatisticsOrthopaedic Surgery
Measure (n=586) (n=158) (n=53) (n=126)
U.S. Seniors Independent Applicants
Matched Unmatched Matched Unmatched
1. 11.5 5.6 6.4 3.7Mean number of contiguous ranks2. 1.1 1.4 1.2 1.5Mean number of distinct specialties ranked3. 238 221 226 217Mean USMLE Step 1 score4. 241 222 228 215Mean USMLE Step 2 score5. 2.7 2.5 3.0 2.0Mean number of research experiences6. 4.1 2.7 7.3 4.3Mean number of abstracts, presentations, and
publications7. 2.5 2.8 3.2 3.2Mean number of work experiences8. 5.8 4.9 5.0 3.7Mean number of volunteer experiences9. 27.8 3.8Percentage who are AOA members n/a n/a
10. 37.0 24.1Percentage who graduated from one of the 40 U.S. medical schools with the highest NIH funding
n/a n/a
11. 2.6 1.3Percentage who have Ph.D. degree n/a n/a12. 10.4 18.4Percentage who have another graduate degree n/a n/a
n/a: The measure either does not apply to, applies to only a small percentage of, or no reliable data were available for independent applicants.
Sources. Measures 1, 2, and match outcome are from the NRMP Data Warehouse; measures 3 and 4 are from the AAMC Data Warehouse and from the ECFMG, both by permission of the NBME and ECFMG; measures 5-9 are from the AAMC Data Warehouse; measure 10 is from the NIH website (http://report.nih.gov/award/trends/AggregateDate.cfm Medical Schools Only.xls); and measures 11 and 12 are from the AAMC Data Warehouse.
Note: USMLE Step 1 scores are not available for most osteopathic medical school graduates included in the independent applicant group.
Approximately 30 percent of U.S. allopathic medical school seniors do not take the USMLE Step 2 prior to the Match.
Copyright ©2009 NRMP and AAMC. Copies may be made for educational or noncommercial uses only.
162 Charting Outcomes in the Match, 2009

0
20
40
60
80
100
1 2 3 4 5 6 7 8 9 10 11 12 13 14 15 16 orMore
92
10 10
23 21
3727
4454
4854
70
46
34
97
23 19 16 1321
11 10 116
13
2 61 1 0
5
Matched Not Matched
Contiguous Ranks
U.S. Seniors
0
20
40
60
80
100
1 2 3 4 5 6 7 8 9 10 11 12 13 14 15 16 orMore
115 6 2 3 4 3 5 1 3 2 1 1 1 0
5
61
2214
7 72 1 0 1 1 1 2 0 1 0
6
Matched Not Matched
Contiguous RanksSource: NRMP Data Warehouse
Independent Applicants
Copyright ©2009 NRMP and AAMC. Copies may be made for educational or noncommercial uses only.
163 Charting Outcomes in the Match, 2009
Chart ORS-1
Number of Contiguous Ranks Within Preferred SpecialtyOrthopaedic Surgery

Graph ORS-1
Probability of Matching to Preferred Specialty by Number of Contiguous RanksOrthopaedic Surgery
0.00
0.10
0.20
0.30
0.40
0.50
0.60
0.70
0.80
0.90
1.00
0 1 2 3 4 5 6 7 8 9 10 11 12 13 14 15 16 17 18 19 20
U.S. SeniorsIndependent Applicants
Number of Contiguous RanksSource: NRMP Data Warehouse. Note: Probabilities
calculated based on 2007-2009 applicants.
Probability of Matching
164Copyright ©2009 NRMP and AAMC. Copies may be made for educational or noncommercial uses only.
Charting Outcomes in the Match, 2009

Chart ORS-2
Number of Distinct Specialties RankedOrthopaedic Surgery
0
100
200
300
400
500
600
1 2 3 4 or More
554
274 1
103
486 1
Matched Not Matched
Distinct Specialties Ranked
U.S. Seniors
0
100
200
300
400
500
600
1 2 3 4 or More
438 2 0
7840
5 3
Matched Not Matched
Distinct Specialties RankedSource: NRMP Data Warehouse
Independent Applicants
Copyright ©2009 NRMP and AAMC. Copies may be made for educational or noncommercial uses only.
Charting Outcomes in the Match, 2009165

Chart ORS-3
USMLE Step 1 ScoresOrthopaedic Surgery
0
20
40
60
80
100
120
140
160
<= 180 Between 181and 190
Between 191and 200
Between 201and 210
Between 211and 220
Between 221and 230
Between 231and 240
Between 241and 250
Between 251and 260
>260 ScoreUnknown
0 1 4
22
50
98
156
134
90
29
20 513
3524
32 2712 6 2 2
Matched Not Matched
Step 1 Scores Source: NRMP Data Warehouse and AAMC Data Warehouse. USMLEscores by permission of the NBME and ECFMG.
U.S. Seniors
0
4
8
12
16
20
24
28
<= 180 Between 181and 190
Between 191and 200
Between 201and 210
Between 211and 220
Between 221and 230
Between 231and 240
Between 241and 250
Between 251and 260
>260 ScoreUnknown
0 1 2
6
10 9 9
6 5
0
5
1
9
14 15
27
16
23
53
0
13
Matched Not Matched
Step 1 Scores Source: NRMP Data Warehouse and AAMC Data Warehouse. USMLEscores by permission of the NBME and ECFMG.
Independent Applicants
Copyright ©2009 NRMP and AAMC. Copies may be made for educational or noncommercial uses only.
Charting Outcomes in the Match, 2009166

Graph ORS-2
Probability of Matching to Preferred Specialty by USMLE Step 1 ScoreOrthopaedic Surgery
0.00
0.10
0.20
0.30
0.40
0.50
0.60
0.70
0.80
0.90
1.00
160 180 200 220 240 260 280
Independent ApplicantsU.S. Seniors
Step 1 ScoreSource: NRMP Data Warehouse and AAMC Data Warehouse. USMLE
scores by permission of the NBME and ECFMG. Note: Probabilitiescalculated based on 2007-2009 applicants.
Probability of Matching
167Copyright ©2009 NRMP and AAMC. Copies may be made for educational or noncommercial uses only.
Charting Outcomes in the Match, 2009

Chart ORS-4
USMLE Step 2 ScoresOrthopaedic Surgery
0
40
80
120
160
200
240
280
<= 180 Between 181and 190
Between 191and 200
Between 201and 210
Between 211and 220
Between 221and 230
Between 231and 240
Between 241and 250
Between 251and 260
>260 ScoreUnknown
0 2 012
2847
74 7660
43
244
3 5 10 15 25 22 15 13 7 5
38
Matched Not Matched
Step 2 Scores Source: NRMP Data Warehouse and AAMC Data Warehouse. USMLEscores by permission of the NBME and ECFMG.
U.S. Seniors
0
4
8
12
16
20
24
<= 180 Between 181and 190
Between 191and 200
Between 201and 210
Between 211and 220
Between 221and 230
Between 231and 240
Between 241and 250
Between 251and 260
>260 ScoreUnknown
02
3 3
87
13
5 5
2
5
9
14
9 9
2423
13
8
5
0
12
Matched Not Matched
Step 2 Scores Source: NRMP Data Warehouse and AAMC Data Warehouse. USMLEscores by permission of the NBME and ECFMG.
Independent Applicants
Copyright ©2009 NRMP and AAMC. Copies may be made for educational or noncommercial uses only.
Charting Outcomes in the Match, 2009168

Chart ORS-5
Number of Research ProjectsOrthopaedic Surgery
0
20
40
60
80
100
120
140
160
None 1 2 3 4 5 or More
31
121
154
117
81 82
14
36 3831
21 18
Matched Not Matched
Research Projects
U.S. Seniors
0
20
40
60
80
100
120
140
160
None 1 2 3 4 5 or More
19
167 7 13
21
4028
15 11 11
Matched Not Matched
Research ProjectsSource: NRMP Data Warehouse and AAMC Data Warehouse
Independent Applicants
Copyright ©2009 NRMP and AAMC. Copies may be made for educational or noncommercial uses only.
Charting Outcomes in the Match, 2009169

Chart ORS-6
Number of Abstracts, Presentations, and PublicationsOrthopaedic Surgery
0
40
80
120
160
200
None 1 2 3 4 5 or More
135
8774
5848
184
47
26 2918
7
31
Matched Not Matched
Publications
U.S. Seniors
0
40
80
120
160
200
None 1 2 3 4 5 or More
11 8 8 2 222
44
188 10 5
41
Matched Not Matched
PublicationsSource: NRMP Data Warehouse and AAMC Data Warehouse
Independent Applicants
Copyright ©2009 NRMP and AAMC. Copies may be made for educational or noncommercial uses only.
Charting Outcomes in the Match, 2009170

Chart ORS-7
Number of Work ExperiencesOrthopaedic Surgery
0
20
40
60
80
100
120
140
None 1 2 3 4 5 or More
96
123 120
96
65
86
28 24 2232
2329
Matched Not Matched
Work Experiences
U.S. Seniors
0
20
40
60
80
100
120
140
None 1 2 3 4 5 or More
10 103
10 713
19 21 2216 14
34
Matched Not Matched
Work ExperiencesSource: NRMP Data Warehouse and AAMC Data Warehouse
Independent Applicants
Copyright ©2009 NRMP and AAMC. Copies may be made for educational or noncommercial uses only.
Charting Outcomes in the Match, 2009171

Chart ORS-8
Number of Volunteer ExperiencesOrthopaedic Surgery
0
20
40
60
80
100
None 1 2 3 4 5 6 7 8 9 10 or More
33 36
49
6269 68 66
40 41
22
100
1317 19 16 14
20
10 10 11 8
20
Matched Not Matched
Volunteer Experiences
U.S. Seniors
0
20
40
60
80
100
None 1 2 3 4 5 6 7 8 9 10 or More
122 1 3 6 5 5 7
2 3 7
28
14 16 13 12 8 9 9 5 4 8
Matched Not Matched
Volunteer ExperiencesSource: NRMP Data Warehouse and AAMC Data Warehouse.
Independent Applicants
Copyright ©2009 NRMP and AAMC. Copies may be made for educational or noncommercial uses only.
Charting Outcomes in the Match, 2009172

Chart ORS-9
Other Characteristics of U.S. SeniorsOrthopaedic Surgery
0
50
100
150
200
250
300
350
400
450
No Yes
423
163152
6
Matched Not Matched
AOA Membership
0
50
100
150
200
250
300
350
400
No Yes
369
217
120
38
Graduate of One of the 40 U.S. Medical Schoolswith the Highest NIH Funding
0
100
200
300
400
500
600
No Yes
571
15
156
2
Ph.D. Degree
0
100
200
300
400
500
600
No Yes
525
61
129
29
Other Graduate Degree
Sources. AOA membership from the AAMC Data Warehouse, NIH awards from http://report.nih.gov/award/trends/AggregateData.cfm Medical Schools Only.xls, Ph.D. and other graduate degrees from the AAMC Data Warehouse
Copyright ©2009 NRMP and AAMC. Copies may be made for educational or noncommercial uses only.
Charting Outcomes in the Match, 2009173

OTO Otolaryngology
Copyright ©2009 NRMP and AAMC. Copies may be made for educational or noncommercial uses only.
174 Charting Outcomes in the Match, 2009

Table OTO-1
Summary StatisticsOtolaryngology
Measure (n=260) (n=66) (n=10) (n=37)
U.S. Seniors Independent Applicants
Matched Unmatched Matched Unmatched
1. 11.2 4.8 9.4 2.9Mean number of contiguous ranks2. 1.1 1.4 1.0 1.5Mean number of distinct specialties ranked3. 240 223 230 216Mean USMLE Step 1 score4. 246 227 232 218Mean USMLE Step 2 score5. 3.4 2.9 2.8 2.2Mean number of research experiences6. 4.1 3.3 11.8 5.8Mean number of abstracts, presentations, and
publications7. 2.6 2.8 2.5 2.5Mean number of work experiences8. 6.9 6.5 3.2 3.4Mean number of volunteer experiences9. 36.9 9.1Percentage who are AOA members n/a n/a
10. 40.0 21.2Percentage who graduated from one of the 40 U.S. medical schools with the highest NIH funding
n/a n/a
11. 2.7 1.5Percentage who have Ph.D. degree n/a n/a12. 11.2 12.1Percentage who have another graduate degree n/a n/a
n/a: The measure either does not apply to, applies to only a small percentage of, or no reliable data were available for independent applicants.
Sources. Measures 1, 2, and match outcome are from the NRMP Data Warehouse; measures 3 and 4 are from the AAMC Data Warehouse and from the ECFMG, both by permission of the NBME and ECFMG; measures 5-9 are from the AAMC Data Warehouse; measure 10 is from the NIH website (http://report.nih.gov/award/trends/AggregateDate.cfm Medical Schools Only.xls); and measures 11 and 12 are from the AAMC Data Warehouse.
Note: USMLE Step 1 scores are not available for most osteopathic medical school graduates included in the independent applicant group.
Approximately 30 percent of U.S. allopathic medical school seniors do not take the USMLE Step 2 prior to the Match.
Copyright ©2009 NRMP and AAMC. Copies may be made for educational or noncommercial uses only.
175 Charting Outcomes in the Match, 2009

0
5
10
15
20
25
30
35
40
1 2 3 4 5 6 7 8 9 10 11 12 13 14 15 16 orMore
2 3
11 117
5
1115 16
32
2422 22 21
18
40
913
9 95
1
63 4
1 2 1 02
0 1
Matched Not Matched
Contiguous Ranks
U.S. Seniors
0
5
10
15
20
25
30
35
40
1 2 3 4 5 6 7 8 9 10 11 12 13 14 15 16 orMore
1 0 0 0 1 02 2
0 0 02
0 0 1 1
16
79
0 1 1 0 0 1 0 0 0 1 0 0 1
Matched Not Matched
Contiguous RanksSource: NRMP Data Warehouse
Independent Applicants
Copyright ©2009 NRMP and AAMC. Copies may be made for educational or noncommercial uses only.
176 Charting Outcomes in the Match, 2009
Chart OTO-1
Number of Contiguous Ranks Within Preferred SpecialtyOtolaryngology

Graph OTO-1
Probability of Matching to Preferred Specialty by Number of Contiguous RanksOtolaryngology
0.00
0.10
0.20
0.30
0.40
0.50
0.60
0.70
0.80
0.90
1.00
0 1 2 3 4 5 6 7 8 9 10 11 12 13 14 15 16 17 18 19 20
U.S. SeniorsIndependent Applicants
Number of Contiguous RanksSource: NRMP Data Warehouse. Note: Probabilities
calculated based on 2007-2009 applicants.
Probability of Matching
177Copyright ©2009 NRMP and AAMC. Copies may be made for educational or noncommercial uses only.
Charting Outcomes in the Match, 2009

Chart OTO-2
Number of Distinct Specialties RankedOtolaryngology
0
40
80
120
160
200
240 229
28
1 2
46
180 2
1 2 3 4 or More
Matched Not Matched
Distinct Specialties Ranked
U.S. Seniors
0
40
80
120
160
200
240
1 2 3 4 or More
10 0 0 021 14
2 0
Matched Not Matched
Distinct Specialties RankedSource: NRMP Data Warehouse
Independent Applicants
Copyright ©2009 NRMP and AAMC. Copies may be made for educational or noncommercial uses only.
Charting Outcomes in the Match, 2009178

Chart OTO-3
USMLE Step 1 ScoresOtolaryngology
0
10
20
30
40
50
60
70
80
<= 180 Between 181and 190
Between 191and 200
Between 201and 210
Between 211and 220
Between 221and 230
Between 231and 240
Between 241and 250
Between 251and 260
>260 ScoreUnknown
0 1 2 3
18
39
60
71
48
18
01 27
3
1216 14
82 0 1
Matched Not Matched
Step 1 Scores Source: NRMP Data Warehouse and AAMC Data Warehouse. USMLEscores by permission of the NBME and ECFMG.
U.S. Seniors
0
1
2
3
4
5
6
<= 180 Between 181and 190
Between 191and 200
Between 201and 210
Between 211and 220
Between 221and 230
Between 231and 240
Between 241and 250
Between 251and 260
>260 ScoreUnknown
0
1
0
1
0
2
3
2
1
0 00
6
4 4
6
5
2
5
2
0
3
Matched Not Matched
Step 1 Scores Source: NRMP Data Warehouse and AAMC Data Warehouse. USMLEscores by permission of the NBME and ECFMG.
Independent Applicants
Copyright ©2009 NRMP and AAMC. Copies may be made for educational or noncommercial uses only.
Charting Outcomes in the Match, 2009179

Graph OTO-2
Probability of Matching to Preferred Specialty by USMLE Step 1 ScoreOtolaryngology
0.00
0.10
0.20
0.30
0.40
0.50
0.60
0.70
0.80
0.90
1.00
180 200 220 240 260 280
Independent ApplicantsU.S. Seniors
Step 1 ScoreSource: NRMP Data Warehouse and AAMC Data Warehouse. USMLE
scores by permission of the NBME and ECFMG. Note: Probabilitiescalculated based on 2007-2009 applicants.
Probability of Matching
180Copyright ©2009 NRMP and AAMC. Copies may be made for educational or noncommercial uses only.
Charting Outcomes in the Match, 2009

Chart OTO-4
USMLE Step 2 ScoresOtolaryngology
0
20
40
60
80
100
120
<= 180 Between 181and 190
Between 191and 200
Between 201and 210
Between 211and 220
Between 221and 230
Between 231and 240
Between 241and 250
Between 251and 260
>260 ScoreUnknown
0 0 2 28 10
3136 35 31
105
1 1 07 9 8
138
1 1
17
Matched Not Matched
Step 2 Scores Source: NRMP Data Warehouse and AAMC Data Warehouse. USMLEscores by permission of the NBME and ECFMG.
U.S. Seniors
0
1
2
3
4
5
6
7
<= 180 Between 181and 190
Between 191and 200
Between 201and 210
Between 211and 220
Between 221and 230
Between 231and 240
Between 241and 250
Between 251and 260
>260 ScoreUnknown
0
1
0
1 1
0
3 3
0
1
0
1
4 4
7
3 3 3 3 3
2
4
Matched Not Matched
Step 2 Scores Source: NRMP Data Warehouse and AAMC Data Warehouse. USMLEscores by permission of the NBME and ECFMG.
Independent Applicants
Copyright ©2009 NRMP and AAMC. Copies may be made for educational or noncommercial uses only.
Charting Outcomes in the Match, 2009181
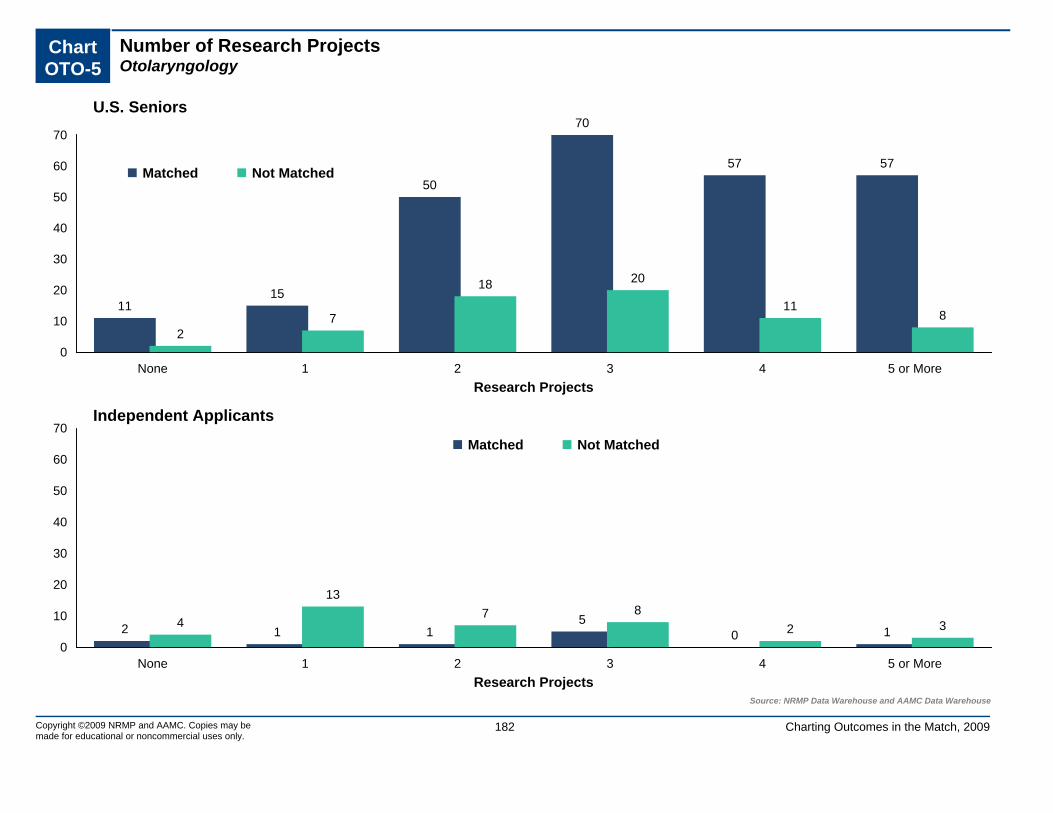
Chart OTO-5
Number of Research ProjectsOtolaryngology
0
10
20
30
40
50
60
70
None 1 2 3 4 5 or More
1115
50
70
57 57
27
18 20
118
Matched Not Matched
Research Projects
U.S. Seniors
0
10
20
30
40
50
60
70
None 1 2 3 4 5 or More
2 1 15
0 14
137 8
2 3
Matched Not Matched
Research ProjectsSource: NRMP Data Warehouse and AAMC Data Warehouse
Independent Applicants
Copyright ©2009 NRMP and AAMC. Copies may be made for educational or noncommercial uses only.
Charting Outcomes in the Match, 2009182

Chart OTO-6
Number of Abstracts, Presentations, and PublicationsOtolaryngology
0
20
40
60
80
100
None 1 2 3 4 5 or More
39 39 3832
24
88
1319
8 72
17
Matched Not Matched
Publications
U.S. Seniors
0
20
40
60
80
100
None 1 2 3 4 5 or More
0 0 0 2 084
9 5 3 2
14
Matched Not Matched
PublicationsSource: NRMP Data Warehouse and AAMC Data Warehouse
Independent Applicants
Copyright ©2009 NRMP and AAMC. Copies may be made for educational or noncommercial uses only.
Charting Outcomes in the Match, 2009183

Chart OTO-7
Number of Work ExperiencesOtolaryngology
0
10
20
30
40
50
60
None 1 2 3 4 5 or More
37
46
59
46
32
40
13 128
118
14
Matched Not Matched
Work Experiences
U.S. Seniors
0
10
20
30
40
50
60
None 1 2 3 4 5 or More
2 30 1 2 2
6 8 10
3 5 5
Matched Not Matched
Work ExperiencesSource: NRMP Data Warehouse and AAMC Data Warehouse
Independent Applicants
Copyright ©2009 NRMP and AAMC. Copies may be made for educational or noncommercial uses only.
Charting Outcomes in the Match, 2009184

Chart OTO-8
Number of Volunteer ExperiencesOtolaryngology
0
10
20
30
40
50
60
70
None 1 2 3 4 5 6 7 8 9 10 or More
3
15
23 24
15
39
2118
23
16
63
1 1
812
85 5 3 5 3
15
Matched Not Matched
Volunteer Experiences
U.S. Seniors
0
10
20
30
40
50
60
70
None 1 2 3 4 5 6 7 8 9 10 or More
3 2 1 1 1 0 0 0 0 1 1
116
2 3 3 41 1 2 0
4
Matched Not Matched
Volunteer ExperiencesSource: NRMP Data Warehouse and AAMC Data Warehouse.
Independent Applicants
Copyright ©2009 NRMP and AAMC. Copies may be made for educational or noncommercial uses only.
Charting Outcomes in the Match, 2009185

Chart OTO-9
Other Characteristics of U.S. SeniorsOtolaryngology
0
20
40
60
80
100
120
140
160
180
No Yes
164
96
60
6
Matched Not Matched
AOA Membership
0
20
40
60
80
100
120
140
160
No Yes
156
104
52
14
Graduate of One of the 40 U.S. Medical Schoolswith the Highest NIH Funding
0
40
80
120
160
200
240
280
No Yes
253
7
65
1
Ph.D. Degree
0
40
80
120
160
200
240
No Yes
231
29
58
8
Other Graduate Degree
Sources. AOA membership from the AAMC Data Warehouse, NIH awards from http://report.nih.gov/award/trends/AggregateData.cfm Medical Schools Only.xls, Ph.D. and other graduate degrees from the AAMC Data Warehouse
Copyright ©2009 NRMP and AAMC. Copies may be made for educational or noncommercial uses only.
Charting Outcomes in the Match, 2009186
PTH Pathology-Anatomic and Clinical
Copyright ©2009 NRMP and AAMC. Copies may be made for educational or noncommercial uses only.
187 Charting Outcomes in the Match, 2009

Table PTH-1
Summary StatisticsPathology-Anatomic and Clinical
Measure (n=316) (n=20) (n=164) (n=208)
U.S. Seniors Independent Applicants
Matched Unmatched Matched Unmatched
1. 8.1 3.7 5.5 2.8Mean number of contiguous ranks2. 1.0 1.1 1.2 1.5Mean number of distinct specialties ranked3. 227 210 223 210Mean USMLE Step 1 score4. 230 209 222 208Mean USMLE Step 2 score5. 2.1 1.9 1.5 1.5Mean number of research experiences6. 4.1 2.8 6.0 6.2Mean number of abstracts, presentations, and
publications7. 2.4 2.7 2.6 3.3Mean number of work experiences8. 4.4 4.1 2.7 1.8Mean number of volunteer experiences9. 13.3 0.0Percentage who are AOA members n/a n/a
10. 36.7 30.0Percentage who graduated from one of the 40 U.S. medical schools with the highest NIH funding
n/a n/a
11. 16.1 5.0Percentage who have Ph.D. degree n/a n/a12. 8.9 10.0Percentage who have another graduate degree n/a n/a
n/a: The measure either does not apply to, applies to only a small percentage of, or no reliable data were available for independent applicants.
Sources. Measures 1, 2, and match outcome are from the NRMP Data Warehouse; measures 3 and 4 are from the AAMC Data Warehouse and from the ECFMG, both by permission of the NBME and ECFMG; measures 5-9 are from the AAMC Data Warehouse; measure 10 is from the NIH website (http://report.nih.gov/award/trends/AggregateDate.cfm Medical Schools Only.xls); and measures 11 and 12 are from the AAMC Data Warehouse.
Note: USMLE Step 1 scores are not available for most osteopathic medical school graduates included in the independent applicant group.
Approximately 30 percent of U.S. allopathic medical school seniors do not take the USMLE Step 2 prior to the Match.
Copyright ©2009 NRMP and AAMC. Copies may be made for educational or noncommercial uses only.
188 Charting Outcomes in the Match, 2009

0
20
40
60
80
100
120
1 2 3 4 5 6 7 8 9 10 11 12 13 14 15 16 orMore
7 11 919
2734 35
30
42
2918 21
12 9 6 792 1 1 1 1 1 1 2 1 0 0 0 0 0 0
Matched Not Matched
Contiguous Ranks
U.S. Seniors
0
20
40
60
80
100
120
1 2 3 4 5 6 7 8 9 10 11 12 13 14 15 16 orMore
2617 17 17
2513 10 5 6 5 7 5 3 2 1 5
109
37
20 15
1 2 5 4 3 2 3 1 0 1 0 5
Matched Not Matched
Contiguous RanksSource: NRMP Data Warehouse
Independent Applicants
Copyright ©2009 NRMP and AAMC. Copies may be made for educational or noncommercial uses only.
189 Charting Outcomes in the Match, 2009
Chart PTH-1
Number of Contiguous Ranks Within Preferred SpecialtyPathology-Anatomic and Clinical

Graph PTH-1
Probability of Matching to Preferred Specialty by Number of Contiguous RanksPathology-Anatomic and Clinical
0.00
0.10
0.20
0.30
0.40
0.50
0.60
0.70
0.80
0.90
1.00
0 1 2 3 4 5 6 7 8 9 10 11 12 13 14 15 16 17 18 19 20
U.S. SeniorsIndependent Applicants
Number of Contiguous RanksSource: NRMP Data Warehouse. Note: Probabilities
calculated based on 2007-2009 applicants.
Probability of Matching
190Copyright ©2009 NRMP and AAMC. Copies may be made for educational or noncommercial uses only.
Charting Outcomes in the Match, 2009

Chart PTH-2
Number of Distinct Specialties RankedPathology-Anatomic and Clinical
0
40
80
120
160
200
240
280
320
1 2 3 4 or More
307
6 2 119
1 0 0
Matched Not Matched
Distinct Specialties Ranked
U.S. Seniors
0
40
80
120
160
200
240
280
320
1 2 3 4 or More
138
214 1
144
36 226
Matched Not Matched
Distinct Specialties RankedSource: NRMP Data Warehouse
Independent Applicants
Copyright ©2009 NRMP and AAMC. Copies may be made for educational or noncommercial uses only.
Charting Outcomes in the Match, 2009191

Chart PTH-3
USMLE Step 1 ScoresPathology-Anatomic and Clinical
0
10
20
30
40
50
60
70
<= 180 Between 181and 190
Between 191and 200
Between 201and 210
Between 211and 220
Between 221and 230
Between 231and 240
Between 241and 250
Between 251and 260
>260 ScoreUnknown
29 11
39
50
6861
44
27
501 1 3
74
03 1 0 0 0
Matched Not Matched
Step 1 Scores Source: NRMP Data Warehouse and AAMC Data Warehouse. USMLEscores by permission of the NBME and ECFMG.
U.S. Seniors
0
5
10
15
20
25
30
35
40
<= 180 Between 181and 190
Between 191and 200
Between 201and 210
Between 211and 220
Between 221and 230
Between 231and 240
Between 241and 250
Between 251and 260
>260 ScoreUnknown
0
5
1417
24 25
17 18
7
2
35
4
3436
3230
2521
9
31
13
Matched Not Matched
Step 1 Scores Source: NRMP Data Warehouse and AAMC Data Warehouse. USMLEscores by permission of the NBME and ECFMG.
Independent Applicants
Copyright ©2009 NRMP and AAMC. Copies may be made for educational or noncommercial uses only.
Charting Outcomes in the Match, 2009192
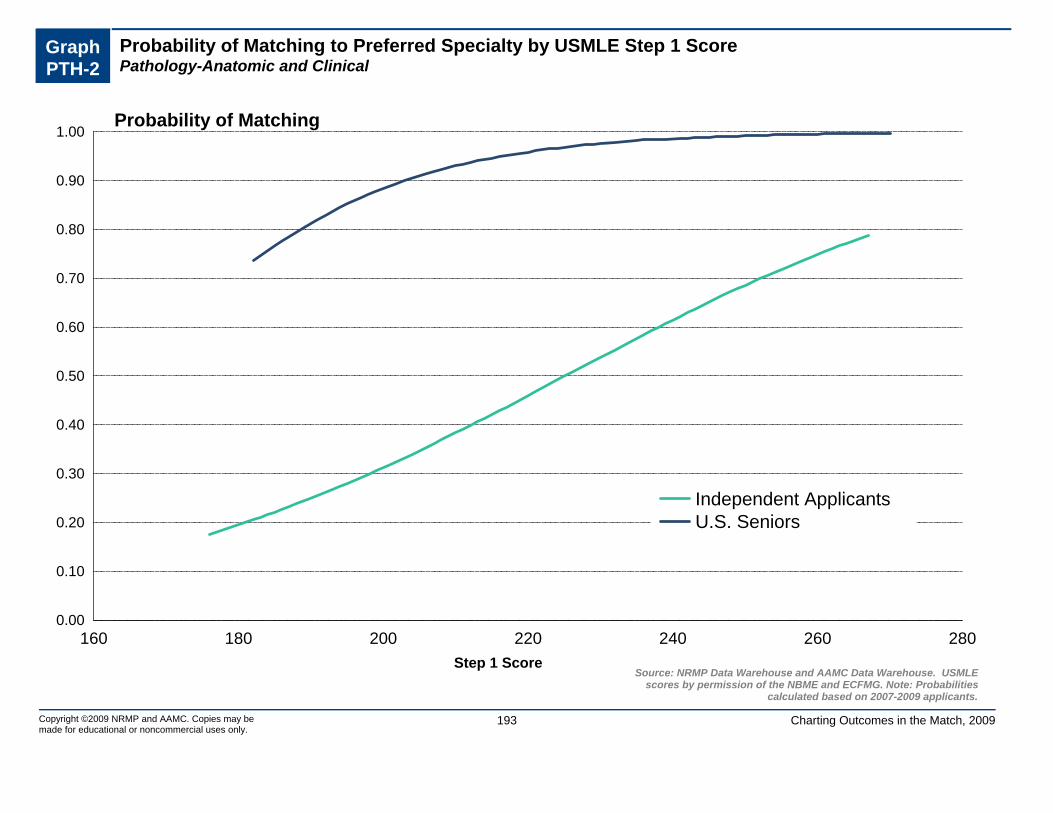
Graph PTH-2
Probability of Matching to Preferred Specialty by USMLE Step 1 ScorePathology-Anatomic and Clinical
0.00
0.10
0.20
0.30
0.40
0.50
0.60
0.70
0.80
0.90
1.00
160 180 200 220 240 260 280
Independent ApplicantsU.S. Seniors
Step 1 ScoreSource: NRMP Data Warehouse and AAMC Data Warehouse. USMLE
scores by permission of the NBME and ECFMG. Note: Probabilitiescalculated based on 2007-2009 applicants.
Probability of Matching
193Copyright ©2009 NRMP and AAMC. Copies may be made for educational or noncommercial uses only.
Charting Outcomes in the Match, 2009

Chart PTH-4
USMLE Step 2 ScoresPathology-Anatomic and Clinical
0
20
40
60
80
100
<= 180 Between 181and 190
Between 191and 200
Between 201and 210
Between 211and 220
Between 221and 230
Between 231and 240
Between 241and 250
Between 251and 260
>260 ScoreUnknown
3 4 8
24
44
2534
48
1913
94
2 2 2 2 1 0 2 0 1 17
Matched Not Matched
Step 2 Scores Source: NRMP Data Warehouse and AAMC Data Warehouse. USMLEscores by permission of the NBME and ECFMG.
U.S. Seniors
05
101520253035404550
<= 180 Between 181and 190
Between 191and 200
Between 201and 210
Between 211and 220
Between 221and 230
Between 231and 240
Between 241and 250
Between 251and 260
>260 ScoreUnknown
1
8
14 1520 22 23 21
4 2
34
11
27
46
36
2025
12 116
1
13
Matched Not Matched
Step 2 Scores Source: NRMP Data Warehouse and AAMC Data Warehouse. USMLEscores by permission of the NBME and ECFMG.
Independent Applicants
Copyright ©2009 NRMP and AAMC. Copies may be made for educational or noncommercial uses only.
Charting Outcomes in the Match, 2009194
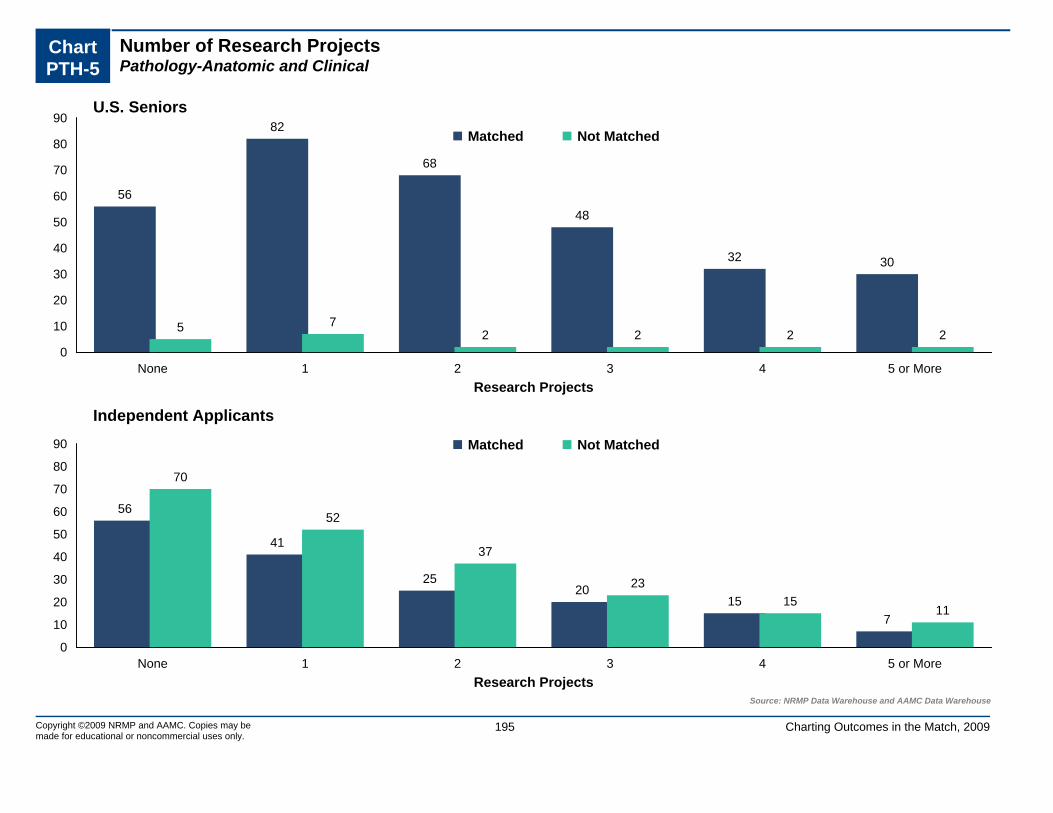
Chart PTH-5
Number of Research ProjectsPathology-Anatomic and Clinical
0
10
20
30
40
50
60
70
80
90
None 1 2 3 4 5 or More
56
82
68
48
32 30
5 72 2 2 2
Matched Not Matched
Research Projects
U.S. Seniors
0
10
20
30
40
50
60
70
80
90
None 1 2 3 4 5 or More
56
41
2520
157
70
52
37
2315
11
Matched Not Matched
Research ProjectsSource: NRMP Data Warehouse and AAMC Data Warehouse
Independent Applicants
Copyright ©2009 NRMP and AAMC. Copies may be made for educational or noncommercial uses only.
Charting Outcomes in the Match, 2009195
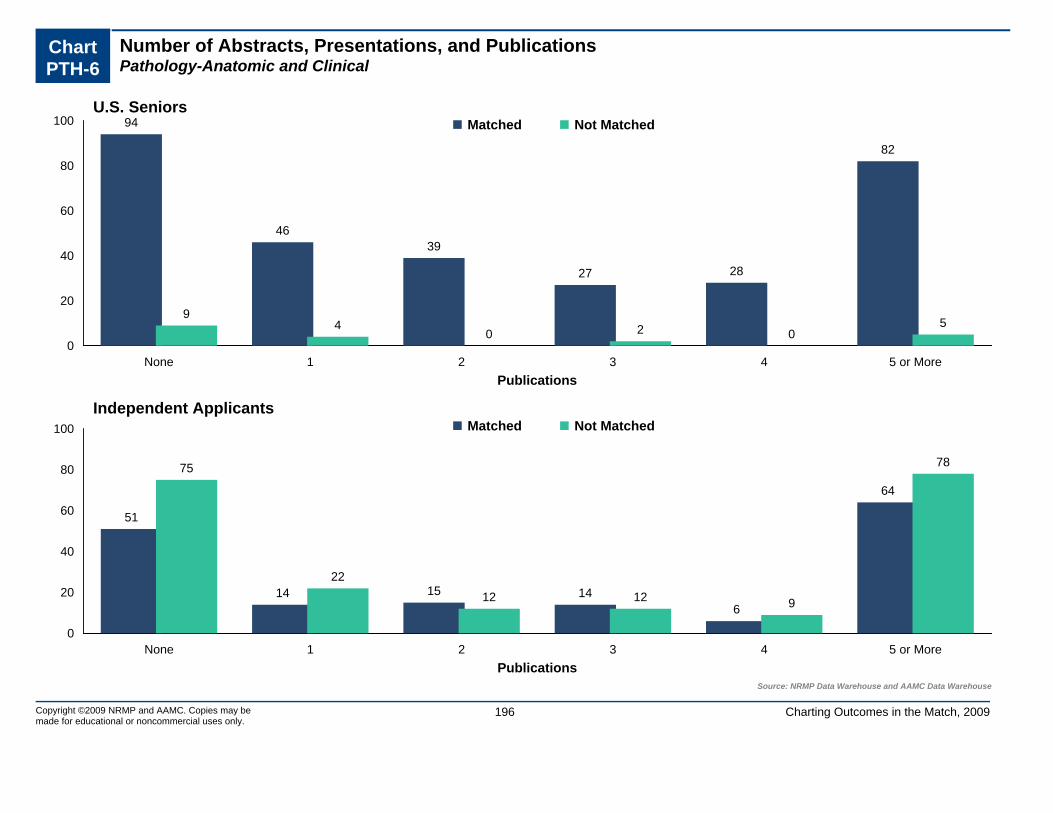
Chart PTH-6
Number of Abstracts, Presentations, and PublicationsPathology-Anatomic and Clinical
0
20
40
60
80
100
None 1 2 3 4 5 or More
94
4639
27 28
82
94
0 2 05
Matched Not Matched
Publications
U.S. Seniors
0
20
40
60
80
100
None 1 2 3 4 5 or More
51
14 15 146
64
75
2212 12 9
78
Matched Not Matched
PublicationsSource: NRMP Data Warehouse and AAMC Data Warehouse
Independent Applicants
Copyright ©2009 NRMP and AAMC. Copies may be made for educational or noncommercial uses only.
Charting Outcomes in the Match, 2009196

Chart PTH-7
Number of Work ExperiencesPathology-Anatomic and Clinical
0
10
20
30
40
50
60
70
None 1 2 3 4 5 or More
5863
59 61
32
43
25 3 2
5 3
Matched Not Matched
Work Experiences
U.S. Seniors
10
20
30
40
50
60
70
None 1 2 3 4 5 or More
25
37
29 31
13
29
20
36 3732 30
53
Matched Not Matched
Work ExperiencesSource: NRMP Data Warehouse and AAMC Data Warehouse
Independent Applicants
Copyright ©2009 NRMP and AAMC. Copies may be made for educational or noncommercial uses only.
Charting Outcomes in the Match, 2009197

Chart PTH-8
Number of Volunteer ExperiencesPathology-Anatomic and Clinical
0
20
40
60
80
100
None 1 2 3 4 5 6 7 8 9 10 or More
31 28
4440
46
26 2921
14 11
26
2 3 5 2 1 2 0 3 0 0 2
Matched Not Matched
Volunteer Experiences
U.S. Seniors
0
20
40
60
80
100
None 1 2 3 4 5 6 7 8 9 10 or More
44
26 27 25
1410
27
0 18
81
47
27
1713
4 5 72 1 4
Matched Not Matched
Volunteer ExperiencesSource: NRMP Data Warehouse and AAMC Data Warehouse.
Independent Applicants
Copyright ©2009 NRMP and AAMC. Copies may be made for educational or noncommercial uses only.
Charting Outcomes in the Match, 2009198

Chart PTH-9
Other Characteristics of U.S. SeniorsPathology-Anatomic and Clinical
0
40
80
120
160
200
240
280
No Yes
274
4220
0
Matched Not Matched
AOA Membership
0
40
80
120
160
200
No Yes
200
116
14 6
Graduate of One of the 40 U.S. Medical Schoolswith the Highest NIH Funding
0
40
80
120
160
200
240
280
No Yes
265
51
191
Ph.D. Degree
0
40
80
120
160
200
240
280
320
No Yes
288
28182
Other Graduate Degree
Sources. AOA membership from the AAMC Data Warehouse, NIH awards from http://report.nih.gov/award/trends/AggregateData.cfm Medical Schools Only.xls, Ph.D. and other graduate degrees from the AAMC Data Warehouse
Copyright ©2009 NRMP and AAMC. Copies may be made for educational or noncommercial uses only.
Charting Outcomes in the Match, 2009199
PD Pediatrics
Copyright ©2009 NRMP and AAMC. Copies may be made for educational or noncommercial uses only.
200 Charting Outcomes in the Match, 2009

Table PD-1
Summary StatisticsPediatrics
Measure (n=1,631) (n=92) (n=574) (n=500)
U.S. Seniors Independent Applicants
Matched Unmatched Matched Unmatched
1. 8.4 8.1 5.8 2.5Mean number of contiguous ranks2. 1.0 1.1 1.3 1.5Mean number of distinct specialties ranked3. 220 212 214 205Mean USMLE Step 1 score4. 229 220 220 208Mean USMLE Step 2 score5. 1.8 2.0 1.2 1.2Mean number of research experiences6. 2.1 1.9 1.9 2.2Mean number of abstracts, presentations, and
publications7. 2.7 2.8 3.3 3.8Mean number of work experiences8. 7.2 6.9 4.1 2.7Mean number of volunteer experiences9. 12.1 5.4Percentage who are AOA members n/a n/a
10. 33.4 33.7Percentage who graduated from one of the 40 U.S. medical schools with the highest NIH funding
n/a n/a
11. 4.2 3.3Percentage who have Ph.D. degree n/a n/a12. 9.3 10.9Percentage who have another graduate degree n/a n/a
n/a: The measure either does not apply to, applies to only a small percentage of, or no reliable data were available for independent applicants.
Sources. Measures 1, 2, and match outcome are from the NRMP Data Warehouse; measures 3 and 4 are from the AAMC Data Warehouse and from the ECFMG, both by permission of the NBME and ECFMG; measures 5-9 are from the AAMC Data Warehouse; measure 10 is from the NIH website (http://report.nih.gov/award/trends/AggregateDate.cfm Medical Schools Only.xls); and measures 11 and 12 are from the AAMC Data Warehouse.
Note: USMLE Step 1 scores are not available for most osteopathic medical school graduates included in the independent applicant group.
Approximately 30 percent of U.S. allopathic medical school seniors do not take the USMLE Step 2 prior to the Match.
Copyright ©2009 NRMP and AAMC. Copies may be made for educational or noncommercial uses only.
201 Charting Outcomes in the Match, 2009

0
40
80
120
160
200
240
280
320
1 2 3 4 5 6 7 8 9 10 11 12 13 14 15 16 orMore
69
3652
7187
150
181211
183 173
127
8966
4936
51
5 7 7 3 7 2 5 9 14 6 10 4 2 5 4 2
Matched Not Matched
Contiguous Ranks
U.S. Seniors
0
40
80
120
160
200
240
280
320
1 2 3 4 5 6 7 8 9 10 11 12 13 14 15 16 orMore
8652 49 61
46 53 47 5629 36
13 14 9 10 7 6
284
95
4223
7 12 8 4 4 5 2 3 1 1 0 9
Matched Not Matched
Contiguous RanksSource: NRMP Data Warehouse
Independent Applicants
Copyright ©2009 NRMP and AAMC. Copies may be made for educational or noncommercial uses only.
202 Charting Outcomes in the Match, 2009
Chart PD-1
Number of Contiguous Ranks Within Preferred SpecialtyPediatrics
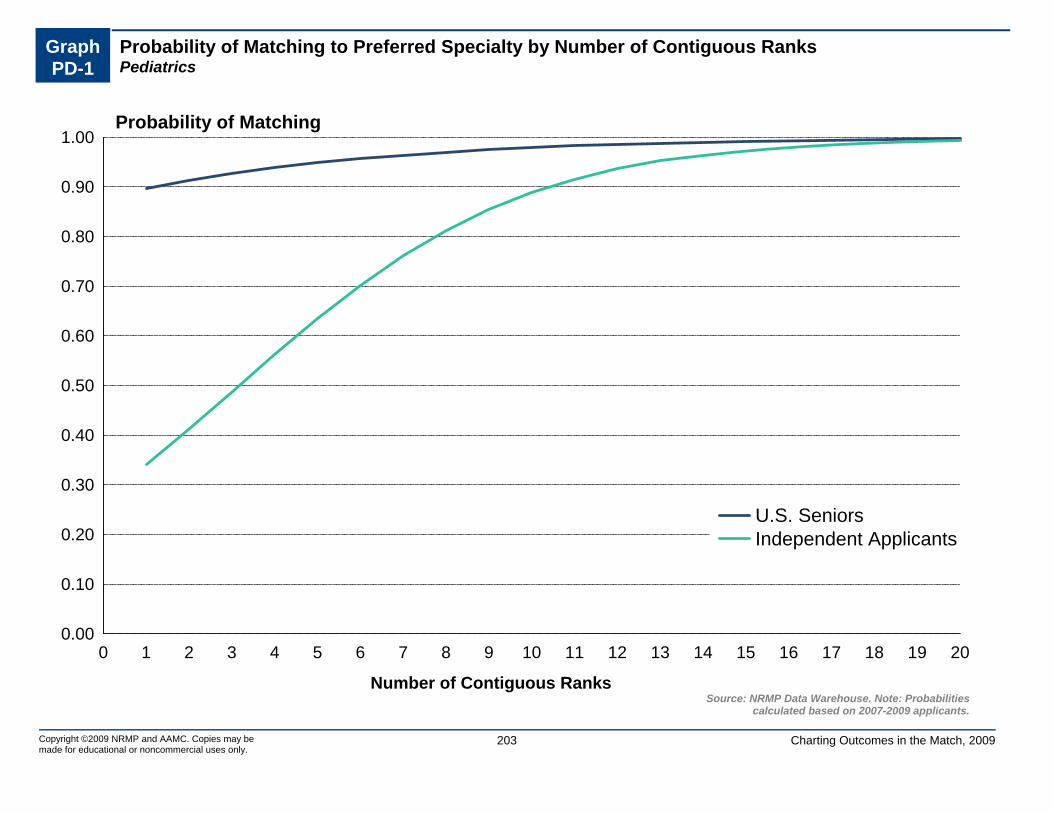
Graph PD-1
Probability of Matching to Preferred Specialty by Number of Contiguous RanksPediatrics
0.00
0.10
0.20
0.30
0.40
0.50
0.60
0.70
0.80
0.90
1.00
0 1 2 3 4 5 6 7 8 9 10 11 12 13 14 15 16 17 18 19 20
U.S. SeniorsIndependent Applicants
Number of Contiguous RanksSource: NRMP Data Warehouse. Note: Probabilities
calculated based on 2007-2009 applicants.
Probability of Matching
203Copyright ©2009 NRMP and AAMC. Copies may be made for educational or noncommercial uses only.
Charting Outcomes in the Match, 2009

Chart PD-2
Number of Distinct Specialties RankedPediatrics
0
200
400
600
800
1,000
1,200
1,400
1,600 1,595
27 8 185
6 1 0
1 2 3 4 or More
Matched Not Matched
Distinct Specialties Ranked
U.S. Seniors
0
200
400
600
800
1,000
1,200
1,400
1,600
1 2 3 4 or More
466
77 25 6
309130
47 14
Matched Not Matched
Distinct Specialties RankedSource: NRMP Data Warehouse
Independent Applicants
Copyright ©2009 NRMP and AAMC. Copies may be made for educational or noncommercial uses only.
Charting Outcomes in the Match, 2009204
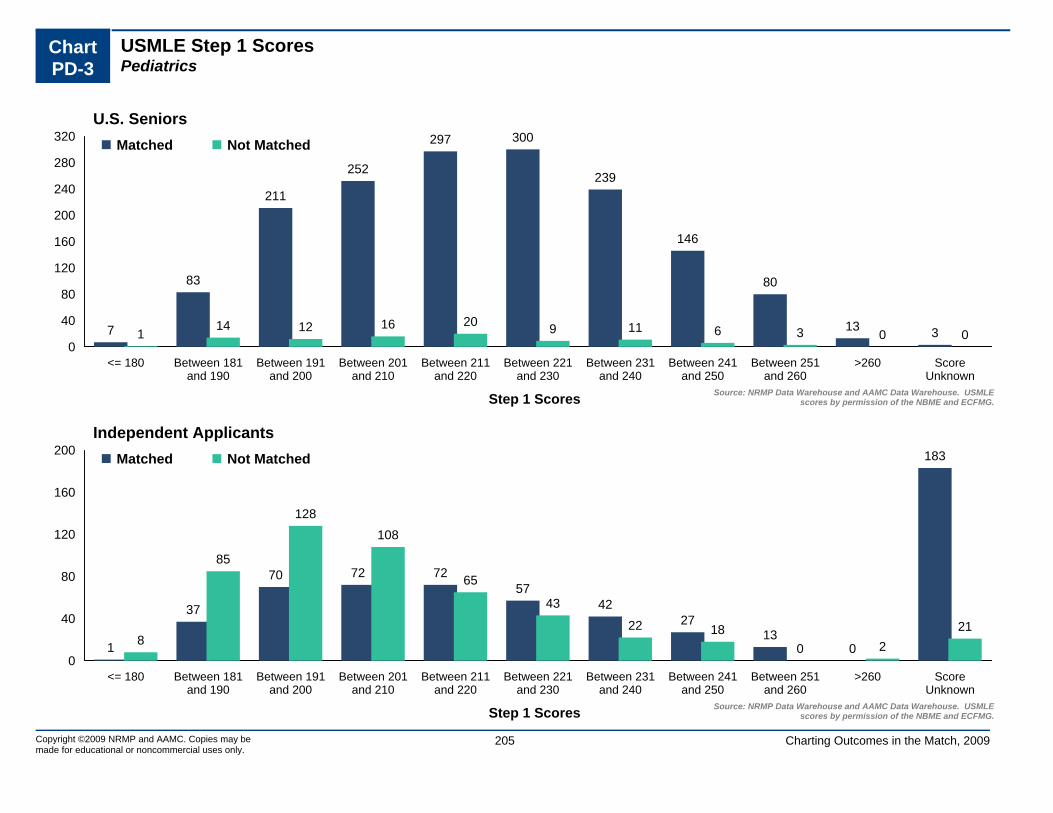
Chart PD-3
USMLE Step 1 ScoresPediatrics
0
40
80
120
160
200
240
280
320
<= 180 Between 181and 190
Between 191and 200
Between 201and 210
Between 211and 220
Between 221and 230
Between 231and 240
Between 241and 250
Between 251and 260
>260 ScoreUnknown
7
83
211
252
297 300
239
146
80
13 3114 12 16 20 9 11 6 3 0 0
Matched Not Matched
Step 1 Scores Source: NRMP Data Warehouse and AAMC Data Warehouse. USMLEscores by permission of the NBME and ECFMG.
U.S. Seniors
0
40
80
120
160
200
<= 180 Between 181and 190
Between 191and 200
Between 201and 210
Between 211and 220
Between 221and 230
Between 231and 240
Between 241and 250
Between 251and 260
>260 ScoreUnknown
1
37
70 72 7257
4227
130
183
8
85
128108
65
43
22 180 2
21
Matched Not Matched
Step 1 Scores Source: NRMP Data Warehouse and AAMC Data Warehouse. USMLEscores by permission of the NBME and ECFMG.
Independent Applicants
Copyright ©2009 NRMP and AAMC. Copies may be made for educational or noncommercial uses only.
Charting Outcomes in the Match, 2009205

Graph PD-2
Probability of Matching to Preferred Specialty by USMLE Step 1 ScorePediatrics
0.00
0.10
0.20
0.30
0.40
0.50
0.60
0.70
0.80
0.90
1.00
160 180 200 220 240 260 280
Independent ApplicantsU.S. Seniors
Step 1 ScoreSource: NRMP Data Warehouse and AAMC Data Warehouse. USMLE
scores by permission of the NBME and ECFMG. Note: Probabilitiescalculated based on 2007-2009 applicants.
Probability of Matching
206Copyright ©2009 NRMP and AAMC. Copies may be made for educational or noncommercial uses only.
Charting Outcomes in the Match, 2009

Chart PD-4
USMLE Step 2 ScoresPediatrics
0
40
80
120
160
200
240
280
320
<= 180 Between 181and 190
Between 191and 200
Between 201and 210
Between 211and 220
Between 221and 230
Between 231and 240
Between 241and 250
Between 251and 260
>260 ScoreUnknown
13
4863
135
184
226 232215
135
82
298
6 5 6 7 16 12 11 4 6 5 14
Matched Not Matched
Step 2 Scores Source: NRMP Data Warehouse and AAMC Data Warehouse. USMLEscores by permission of the NBME and ECFMG.
U.S. Seniors
0
40
80
120
160
200
<= 180 Between 181and 190
Between 191and 200
Between 201and 210
Between 211and 220
Between 221and 230
Between 231and 240
Between 241and 250
Between 251and 260
>260 ScoreUnknown
217
51
76
54 6147 42
2311
190
9
71
11393
81
51
2920
8 421
Matched Not Matched
Step 2 Scores Source: NRMP Data Warehouse and AAMC Data Warehouse. USMLEscores by permission of the NBME and ECFMG.
Independent Applicants
Copyright ©2009 NRMP and AAMC. Copies may be made for educational or noncommercial uses only.
Charting Outcomes in the Match, 2009207

Chart PD-5
Number of Research ProjectsPediatrics
0
50
100
150
200
250
300
350
400
450
None 1 2 3 4 5 or More
352
415378
270
11898
17 26 258 8 8
Matched Not Matched
Research Projects
U.S. Seniors
0
50
100
150
200
250
300
350
400
450
None 1 2 3 4 5 or More
226
175
97
4318 15
221
131
81
29 17 21
Matched Not Matched
Research ProjectsSource: NRMP Data Warehouse and AAMC Data Warehouse
Independent Applicants
Copyright ©2009 NRMP and AAMC. Copies may be made for educational or noncommercial uses only.
Charting Outcomes in the Match, 2009208

Chart PD-6
Number of Abstracts, Presentations, and PublicationsPediatrics
0
100
200
300
400
500
600
700
None 1 2 3 4 5 or More
687
308
202
13577
222
4210 11 10 4 15
Matched Not Matched
Publications
U.S. Seniors
0
100
200
300
400
500
600
700
None 1 2 3 4 5 or More
305
8657 34 25
67
277
7526 34 10
78
Matched Not Matched
PublicationsSource: NRMP Data Warehouse and AAMC Data Warehouse
Independent Applicants
Copyright ©2009 NRMP and AAMC. Copies may be made for educational or noncommercial uses only.
Charting Outcomes in the Match, 2009209

Chart PD-7
Number of Work ExperiencesPediatrics
0
50
100
150
200
250
300
350
None 1 2 3 4 5 or More
227
326 328
279
193
278
10 16 18 16 17 15
Matched Not Matched
Work Experiences
U.S. Seniors
0
50
100
150
200
250
300
350
None 1 2 3 4 5 or More
56
105 100 10067
146
34
70 78 83 82
153
Matched Not Matched
Work ExperiencesSource: NRMP Data Warehouse and AAMC Data Warehouse
Independent Applicants
Copyright ©2009 NRMP and AAMC. Copies may be made for educational or noncommercial uses only.
Charting Outcomes in the Match, 2009210

Chart PD-8
Number of Volunteer ExperiencesPediatrics
0
50
100
150
200
250
300
350
400
450
None 1 2 3 4 5 6 7 8 9 10 or More
40 4181
149 164188
164 148127 118
411
3 3 6 10 15 7 8 6 2 725
Matched Not Matched
Volunteer Experiences
U.S. Seniors
0
50
100
150
200
250
300
350
400
450
None 1 2 3 4 5 6 7 8 9 10 or More
74 87 72 7449 51 38 44
20 1748
122100
76 6041 37
18 11 11 7 17
Matched Not Matched
Volunteer ExperiencesSource: NRMP Data Warehouse and AAMC Data Warehouse.
Independent Applicants
Copyright ©2009 NRMP and AAMC. Copies may be made for educational or noncommercial uses only.
Charting Outcomes in the Match, 2009211

Chart PD-9
Other Characteristics of U.S. SeniorsPediatrics
0
200
400
600
800
1,000
1,200
1,400
1,600
No Yes
1,433
19887
5
Matched Not Matched
AOA Membership
0
200
400
600
800
1,000
1,200
No Yes
1,086
545
61 31
Graduate of One of the 40 U.S. Medical Schoolswith the Highest NIH Funding
0
200
400
600
800
1,000
1,200
1,400
1,600
No Yes
1,563
68893
Ph.D. Degree
0
200
400
600
800
1,000
1,200
1,400
1,600
No Yes
1,479
15282
10
Other Graduate Degree
Sources. AOA membership from the AAMC Data Warehouse, NIH awards from http://report.nih.gov/award/trends/AggregateData.cfm Medical Schools Only.xls, Ph.D. and other graduate degrees from the AAMC Data Warehouse
Copyright ©2009 NRMP and AAMC. Copies may be made for educational or noncommercial uses only.
Charting Outcomes in the Match, 2009212

PM Physical Medicine and Rehabilitation
Copyright ©2009 NRMP and AAMC. Copies may be made for educational or noncommercial uses only.
213 Charting Outcomes in the Match, 2009

Table PM-1
Summary StatisticsPhysical Medicine and Rehabilitation
Measure (n=135) (n=36) (n=156) (n=152)
U.S. Seniors Independent Applicants
Matched Unmatched Matched Unmatched
1. 9.3 9.3 7.2 3.9Mean number of contiguous ranks2. 1.4 1.2 1.4 1.6Mean number of distinct specialties ranked3. 214 206 211 201Mean USMLE Step 1 score4. 219 214 211 202Mean USMLE Step 2 score5. 1.9 1.5 1.5 1.2Mean number of research experiences6. 2.3 2.4 1.7 2.3Mean number of abstracts, presentations, and
publications7. 3.0 2.9 3.1 3.5Mean number of work experiences8. 6.5 5.5 5.2 3.4Mean number of volunteer experiences9. 5.2 0.0Percentage who are AOA members n/a n/a
10. 26.7 25.0Percentage who graduated from one of the 40 U.S. medical schools with the highest NIH funding
n/a n/a
11. 1.5 2.8Percentage who have Ph.D. degree n/a n/a12. 15.6 11.1Percentage who have another graduate degree n/a n/a
n/a: The measure either does not apply to, applies to only a small percentage of, or no reliable data were available for independent applicants.
Sources. Measures 1, 2, and match outcome are from the NRMP Data Warehouse; measures 3 and 4 are from the AAMC Data Warehouse and from the ECFMG, both by permission of the NBME and ECFMG; measures 5-9 are from the AAMC Data Warehouse; measure 10 is from the NIH website (http://report.nih.gov/award/trends/AggregateDate.cfm Medical Schools Only.xls); and measures 11 and 12 are from the AAMC Data Warehouse.
Note: USMLE Step 1 scores are not available for most osteopathic medical school graduates included in the independent applicant group.
Approximately 30 percent of U.S. allopathic medical school seniors do not take the USMLE Step 2 prior to the Match.
Copyright ©2009 NRMP and AAMC. Copies may be made for educational or noncommercial uses only.
214 Charting Outcomes in the Match, 2009

0
10
20
30
40
50
60
1 2 3 4 5 6 7 8 9 10 11 12 13 14 15 16 orMore
4 6 5 39
6
1410 12
1610 12 10
52
11
2 3 2 1 2 30
3 2 03 4 2 3 1
5
Matched Not Matched
Contiguous Ranks
U.S. Seniors
0
10
20
30
40
50
60
1 2 3 4 5 6 7 8 9 10 11 12 13 14 15 16 orMore
1511 10 9
12 13 14 14 1610 8
5 5 4 5 5
60
30
10 116 8 7
3 1 3 1 2 1 0 1
8
Matched Not Matched
Contiguous RanksSource: NRMP Data Warehouse
Independent Applicants
Copyright ©2009 NRMP and AAMC. Copies may be made for educational or noncommercial uses only.
215 Charting Outcomes in the Match, 2009
Chart PM-1
Number of Contiguous Ranks Within Preferred SpecialtyPhysical Medicine and Rehabilitation

Graph PM-1
Probability of Matching to Preferred Specialty by Number of Contiguous RanksPhysical Medicine and Rehabilitation
0.00
0.10
0.20
0.30
0.40
0.50
0.60
0.70
0.80
0.90
1.00
0 1 2 3 4 5 6 7 8 9 10 11 12 13 14 15 16 17 18 19 20
U.S. SeniorsIndependent Applicants
Number of Contiguous RanksSource: NRMP Data Warehouse. Note: Probabilities
calculated based on 2007-2009 applicants.
Probability of Matching
216Copyright ©2009 NRMP and AAMC. Copies may be made for educational or noncommercial uses only.
Charting Outcomes in the Match, 2009

Chart PM-2
Number of Distinct Specialties RankedPhysical Medicine and Rehabilitation
0
20
40
60
80
100
120
1 2 3 4 or More
98
18 17
2
30
4 2 0
Matched Not Matched
Distinct Specialties Ranked
U.S. Seniors
0
20
40
60
80
100
120
1 2 3 4 or More
116
26
122
95
33
186
Matched Not Matched
Distinct Specialties RankedSource: NRMP Data Warehouse
Independent Applicants
Copyright ©2009 NRMP and AAMC. Copies may be made for educational or noncommercial uses only.
Charting Outcomes in the Match, 2009217

Chart PM-3
USMLE Step 1 ScoresPhysical Medicine and Rehabilitation
0
5
10
15
20
25
30
35
<= 180 Between 181and 190
Between 191and 200
Between 201and 210
Between 211and 220
Between 221and 230
Between 231and 240
Between 241and 250
Between 251and 260
>260 ScoreUnknown
0
7
22
32
28
24
12
7
30 01
5
10
6 64
2 1 0 0 1
Matched Not Matched
Step 1 Scores Source: NRMP Data Warehouse and AAMC Data Warehouse. USMLEscores by permission of the NBME and ECFMG.
U.S. Seniors
0
20
40
60
80
100
<= 180 Between 181and 190
Between 191and 200
Between 201and 210
Between 211and 220
Between 221and 230
Between 231and 240
Between 241and 250
Between 251and 260
>260 ScoreUnknown
07 11 9
1912
3 2 1 0
92
3
3832
16 177 5 4 0 0
30
Matched Not Matched
Step 1 Scores Source: NRMP Data Warehouse and AAMC Data Warehouse. USMLEscores by permission of the NBME and ECFMG.
Independent Applicants
Copyright ©2009 NRMP and AAMC. Copies may be made for educational or noncommercial uses only.
Charting Outcomes in the Match, 2009218

Graph PM-2
Probability of Matching to Preferred Specialty by USMLE Step 1 ScorePhysical Medicine and Rehabilitation
0.00
0.10
0.20
0.30
0.40
0.50
0.60
0.70
0.80
0.90
1.00
170 180 190 200 210 220 230 240 250 260
Independent ApplicantsU.S. Seniors
Step 1 ScoreSource: NRMP Data Warehouse and AAMC Data Warehouse. USMLE
scores by permission of the NBME and ECFMG. Note: Probabilitiescalculated based on 2007-2009 applicants.
Probability of Matching
219Copyright ©2009 NRMP and AAMC. Copies may be made for educational or noncommercial uses only.
Charting Outcomes in the Match, 2009

Chart PM-4
USMLE Step 2 ScoresPhysical Medicine and Rehabilitation
0
4
8
12
16
20
24
28
<= 180 Between 181and 190
Between 191and 200
Between 201and 210
Between 211and 220
Between 221and 230
Between 231and 240
Between 241and 250
Between 251and 260
>260 ScoreUnknown
1
9 8
14
2826
1210
5
1
21
2 2 1
57
4 42
0 0
9
Matched Not Matched
Step 2 Scores Source: NRMP Data Warehouse and AAMC Data Warehouse. USMLEscores by permission of the NBME and ECFMG.
U.S. Seniors
0
20
40
60
80
100
<= 180 Between 181and 190
Between 191and 200
Between 201and 210
Between 211and 220
Between 221and 230
Between 231and 240
Between 241and 250
Between 251and 260
>260 ScoreUnknown
16
11 14 149 5 3 1 0
92
5
23
37
2217
8 4 3 2 0
31
Matched Not Matched
Step 2 Scores Source: NRMP Data Warehouse and AAMC Data Warehouse. USMLEscores by permission of the NBME and ECFMG.
Independent Applicants
Copyright ©2009 NRMP and AAMC. Copies may be made for educational or noncommercial uses only.
Charting Outcomes in the Match, 2009220

Chart PM-5
Number of Research ProjectsPhysical Medicine and Rehabilitation
0
10
20
30
40
50
60
70
80
None 1 2 3 4 5 or More
23
34 34
25
1369 11 9
4 3 0
Matched Not Matched
Research Projects
U.S. Seniors
0
10
20
30
40
50
60
70
80
None 1 2 3 4 5 or More
48 46
23 23
115
74
29
19 20
73
Matched Not Matched
Research ProjectsSource: NRMP Data Warehouse and AAMC Data Warehouse
Independent Applicants
Copyright ©2009 NRMP and AAMC. Copies may be made for educational or noncommercial uses only.
Charting Outcomes in the Match, 2009221

Chart PM-6
Number of Abstracts, Presentations, and PublicationsPhysical Medicine and Rehabilitation
0
20
40
60
80
100
None 1 2 3 4 5 or More
61
25
138
1216
22
3 2 2 16
Matched Not Matched
Publications
U.S. Seniors
0
20
40
60
80
100
None 1 2 3 4 5 or More
88
16 19
8 6
19
82
18 1610
5
21
Matched Not Matched
PublicationsSource: NRMP Data Warehouse and AAMC Data Warehouse
Independent Applicants
Copyright ©2009 NRMP and AAMC. Copies may be made for educational or noncommercial uses only.
Charting Outcomes in the Match, 2009222

Chart PM-7
Number of Work ExperiencesPhysical Medicine and Rehabilitation
0
5
10
15
20
25
30
35
40
None 1 2 3 4 5 or More
18
25 24 24
10
34
3
8 8
3
7 7
Matched Not Matched
Work Experiences
U.S. Seniors
0
5
10
15
20
25
30
35
40
None 1 2 3 4 5 or More
16
3033
27
16
34
16
28
21
2623
38Matched Not Matched
Work ExperiencesSource: NRMP Data Warehouse and AAMC Data Warehouse
Independent Applicants
Copyright ©2009 NRMP and AAMC. Copies may be made for educational or noncommercial uses only.
Charting Outcomes in the Match, 2009223

Chart PM-8
Number of Volunteer ExperiencesPhysical Medicine and Rehabilitation
0
4
8
12
16
20
24
28
32
None 1 2 3 4 5 6 7 8 9 10 or More
6
1113
15
10
17
8 7
119
28
1 2 13
8 7
3 42 1
4
Matched Not Matched
Volunteer Experiences
U.S. Seniors
0
4
8
12
16
20
24
28
32
None 1 2 3 4 5 6 7 8 9 10 or More
17
11
26
1417
7
1310
7 8
26
31
26
18
24
7 6
15
6 63
10
Matched Not Matched
Volunteer ExperiencesSource: NRMP Data Warehouse and AAMC Data Warehouse.
Independent Applicants
Copyright ©2009 NRMP and AAMC. Copies may be made for educational or noncommercial uses only.
Charting Outcomes in the Match, 2009224

Chart PM-9
Other Characteristics of U.S. SeniorsPhysical Medicine and Rehabilitation
0
20
40
60
80
100
120
140
No Yes
128
7
36
0
Matched Not Matched
AOA Membership
0
20
40
60
80
100
No Yes
99
3627
9
Graduate of One of the 40 U.S. Medical Schoolswith the Highest NIH Funding
0
20
40
60
80
100
120
140
No Yes
133
2
35
1
Ph.D. Degree
0
20
40
60
80
100
120
No Yes
114
2132
4
Other Graduate Degree
Sources. AOA membership from the AAMC Data Warehouse, NIH awards from http://report.nih.gov/award/trends/AggregateData.cfm Medical Schools Only.xls, Ph.D. and other graduate degrees from the AAMC Data Warehouse
Copyright ©2009 NRMP and AAMC. Copies may be made for educational or noncommercial uses only.
Charting Outcomes in the Match, 2009225
PS Plastic Surgery
Copyright ©2009 NRMP and AAMC. Copies may be made for educational or noncommercial uses only.
226 Charting Outcomes in the Match, 2009

Table PS-1
Summary StatisticsPlastic Surgery
Measure (n=86) (n=77) (n=12) (n=17)
U.S. Seniors Independent Applicants
Matched Unmatched Matched Unmatched
1. 8.9 3.9 3.6 2.6Mean number of contiguous ranks2. 1.6 1.8 1.4 1.8Mean number of distinct specialties ranked3. 245 232 224 221Mean USMLE Step 1 score4. 246 233 219 226Mean USMLE Step 2 score5. 3.6 3.1 3.4 2.4Mean number of research experiences6. 8.1 5.0 16.8 9.4Mean number of abstracts, presentations, and
publications7. 2.9 2.8 3.6 2.2Mean number of work experiences8. 6.8 6.1 3.8 3.5Mean number of volunteer experiences9. 41.9 14.3Percentage who are AOA members n/a n/a
10. 51.2 48.1Percentage who graduated from one of the 40 U.S. medical schools with the highest NIH funding
n/a n/a
11. 2.3 9.1Percentage who have Ph.D. degree n/a n/a12. 10.5 10.4Percentage who have another graduate degree n/a n/a
n/a: The measure either does not apply to, applies to only a small percentage of, or no reliable data were available for independent applicants.
Sources. Measures 1, 2, and match outcome are from the NRMP Data Warehouse; measures 3 and 4 are from the AAMC Data Warehouse and from the ECFMG, both by permission of the NBME and ECFMG; measures 5-9 are from the AAMC Data Warehouse; measure 10 is from the NIH website (http://report.nih.gov/award/trends/AggregateDate.cfm Medical Schools Only.xls); and measures 11 and 12 are from the AAMC Data Warehouse.
Note: USMLE Step 1 scores are not available for most osteopathic medical school graduates included in the independent applicant group.
Approximately 30 percent of U.S. allopathic medical school seniors do not take the USMLE Step 2 prior to the Match.
Copyright ©2009 NRMP and AAMC. Copies may be made for educational or noncommercial uses only.
227 Charting Outcomes in the Match, 2009

0
4
8
12
16
20
1 2 3 4 5 6 7 8 9 10 11 12 13 14 15 16 orMore
4 43
76
8
65
9
1
3
5
9
6
2
8
17
1312
9
7
4
7
3
01
3
10 0 0 0
Matched Not Matched
Contiguous Ranks
U.S. Seniors
0
4
8
12
16
20
1 2 3 4 5 6 7 8 9 10 11 12 13 14 15 16 orMore
42
1 12
10 0 0 0 0
10 0 0 0
9
3 3
0 0 01
0 0 0 0 01
0 0 0
Matched Not Matched
Contiguous RanksSource: NRMP Data Warehouse
Independent Applicants
Copyright ©2009 NRMP and AAMC. Copies may be made for educational or noncommercial uses only.
228 Charting Outcomes in the Match, 2009
Chart PS-1
Number of Contiguous Ranks Within Preferred SpecialtyPlastic Surgery
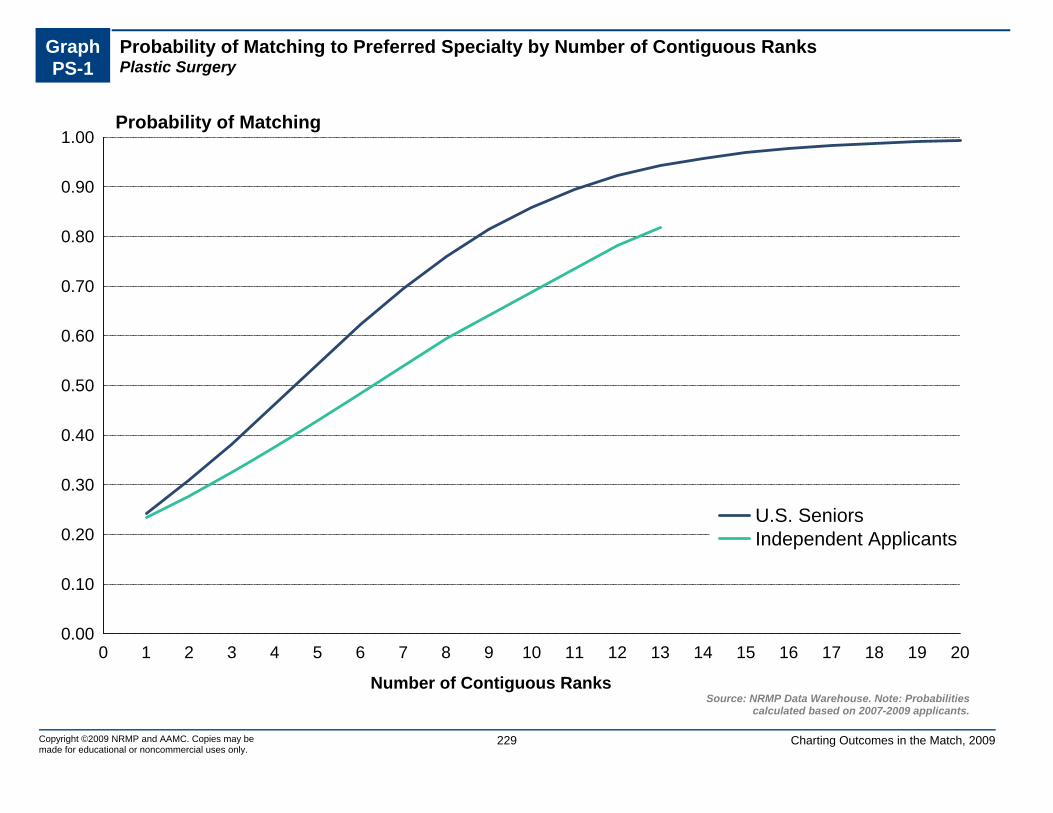
Graph PS-1
Probability of Matching to Preferred Specialty by Number of Contiguous RanksPlastic Surgery
0.00
0.10
0.20
0.30
0.40
0.50
0.60
0.70
0.80
0.90
1.00
0 1 2 3 4 5 6 7 8 9 10 11 12 13 14 15 16 17 18 19 20
U.S. SeniorsIndependent Applicants
Number of Contiguous RanksSource: NRMP Data Warehouse. Note: Probabilities
calculated based on 2007-2009 applicants.
Probability of Matching
229Copyright ©2009 NRMP and AAMC. Copies may be made for educational or noncommercial uses only.
Charting Outcomes in the Match, 2009

Chart PS-2
Number of Distinct Specialties RankedPlastic Surgery
0
10
20
30
40
50
60
1 2 3 4 or More
32
53
1 0
18
54
41
Matched Not Matched
Distinct Specialties Ranked
U.S. Seniors
0
10
20
30
40
50
60
1 2 3 4 or More
7 50 0
6 83
0
Matched Not Matched
Distinct Specialties RankedSource: NRMP Data Warehouse
Independent Applicants
Copyright ©2009 NRMP and AAMC. Copies may be made for educational or noncommercial uses only.
Charting Outcomes in the Match, 2009230

Chart PS-3
USMLE Step 1 ScoresPlastic Surgery
0
4
8
12
16
20
24
28
32
<= 180 Between 181and 190
Between 191and 200
Between 201and 210
Between 211and 220
Between 221and 230
Between 231and 240
Between 241and 250
Between 251and 260
>260 ScoreUnknown
0 0 1 14
912
23
29
6
102 3
5 6
14
22
14
8
2 1
Matched Not Matched
Step 1 Scores Source: NRMP Data Warehouse and AAMC Data Warehouse. USMLEscores by permission of the NBME and ECFMG.
U.S. Seniors
0.0
0.5
1.0
1.5
2.0
2.5
3.0
3.5
4.0
<= 180 Between 181and 190
Between 191and 200
Between 201and 210
Between 211and 220
Between 221and 230
Between 231and 240
Between 241and 250
Between 251and 260
>260 ScoreUnknown
0
1
0
3
1 1
3
0
1 1 11 1
3
1
2
1
4
0
3
0
1
Matched Not Matched
Step 1 Scores Source: NRMP Data Warehouse and AAMC Data Warehouse. USMLEscores by permission of the NBME and ECFMG.
Independent Applicants
Copyright ©2009 NRMP and AAMC. Copies may be made for educational or noncommercial uses only.
Charting Outcomes in the Match, 2009231

Graph PS-2
Probability of Matching to Preferred Specialty by USMLE Step 1 ScorePlastic Surgery
0.00
0.10
0.20
0.30
0.40
0.50
0.60
0.70
0.80
0.90
1.00
160 180 200 220 240 260 280
Independent ApplicantsU.S. Seniors
Step 1 ScoreSource: NRMP Data Warehouse and AAMC Data Warehouse. USMLE
scores by permission of the NBME and ECFMG. Note: Probabilitiescalculated based on 2007-2009 applicants.
Probability of Matching
232Copyright ©2009 NRMP and AAMC. Copies may be made for educational or noncommercial uses only.
Charting Outcomes in the Match, 2009

Chart PS-4
USMLE Step 2 ScoresPlastic Surgery
0
10
20
30
40
50
<= 180 Between 181and 190
Between 191and 200
Between 201and 210
Between 211and 220
Between 221and 230
Between 231and 240
Between 241and 250
Between 251and 260
>260 ScoreUnknown
0 1 1 0 03
7 7
14
5
48
1 1 2 36 8
4
127
4
29
Matched Not Matched
Step 2 Scores Source: NRMP Data Warehouse and AAMC Data Warehouse. USMLEscores by permission of the NBME and ECFMG.
U.S. Seniors
0.0
0.5
1.0
1.5
2.0
2.5
3.0
3.5
4.0
<= 180 Between 181and 190
Between 191and 200
Between 201and 210
Between 211and 220
Between 221and 230
Between 231and 240
Between 241and 250
Between 251and 260
>260 ScoreUnknown
1 1
0
3
0
1
4
0 0
1 11
2
0
1 1
4
2
1
3
1 1
Matched Not Matched
Step 2 Scores Source: NRMP Data Warehouse and AAMC Data Warehouse. USMLEscores by permission of the NBME and ECFMG.
Independent Applicants
Copyright ©2009 NRMP and AAMC. Copies may be made for educational or noncommercial uses only.
Charting Outcomes in the Match, 2009233
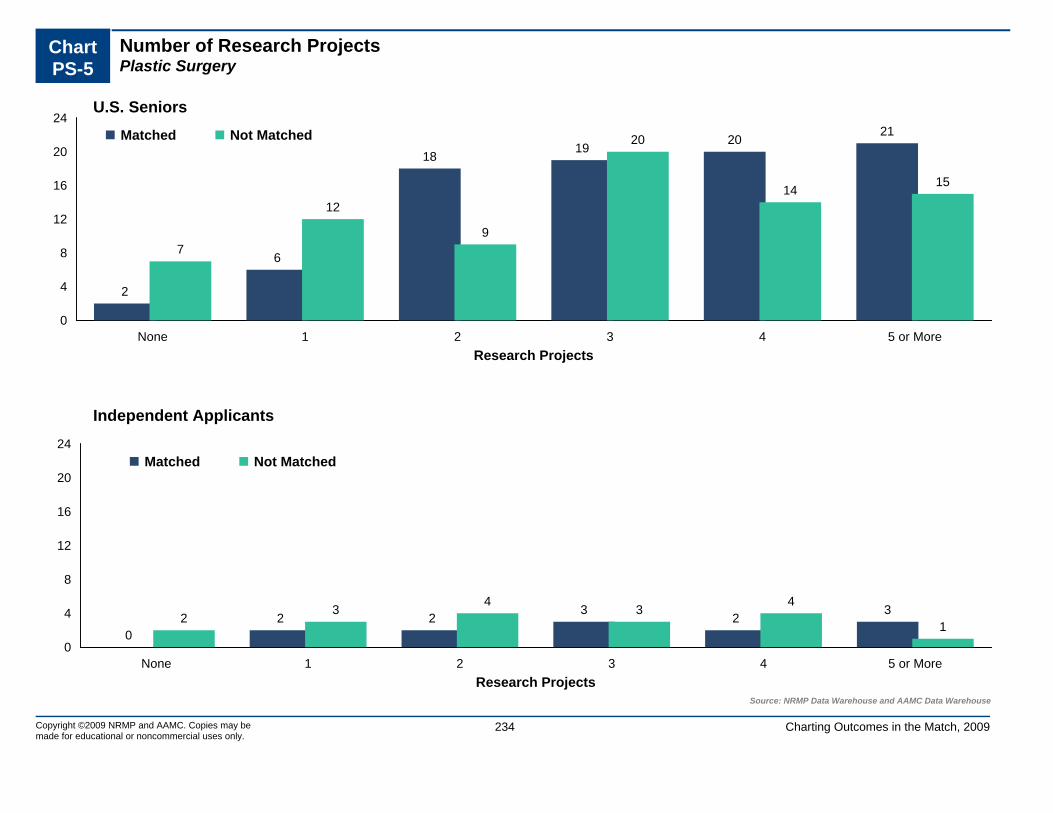
Chart PS-5
Number of Research ProjectsPlastic Surgery
0
4
8
12
16
20
24
None 1 2 3 4 5 or More
2
6
1819 20
21
7
12
9
20
1415
Matched Not Matched
Research Projects
U.S. Seniors
0
4
8
12
16
20
24
None 1 2 3 4 5 or More
02 2
32
32
34
34
1
Matched Not Matched
Research ProjectsSource: NRMP Data Warehouse and AAMC Data Warehouse
Independent Applicants
Copyright ©2009 NRMP and AAMC. Copies may be made for educational or noncommercial uses only.
Charting Outcomes in the Match, 2009234
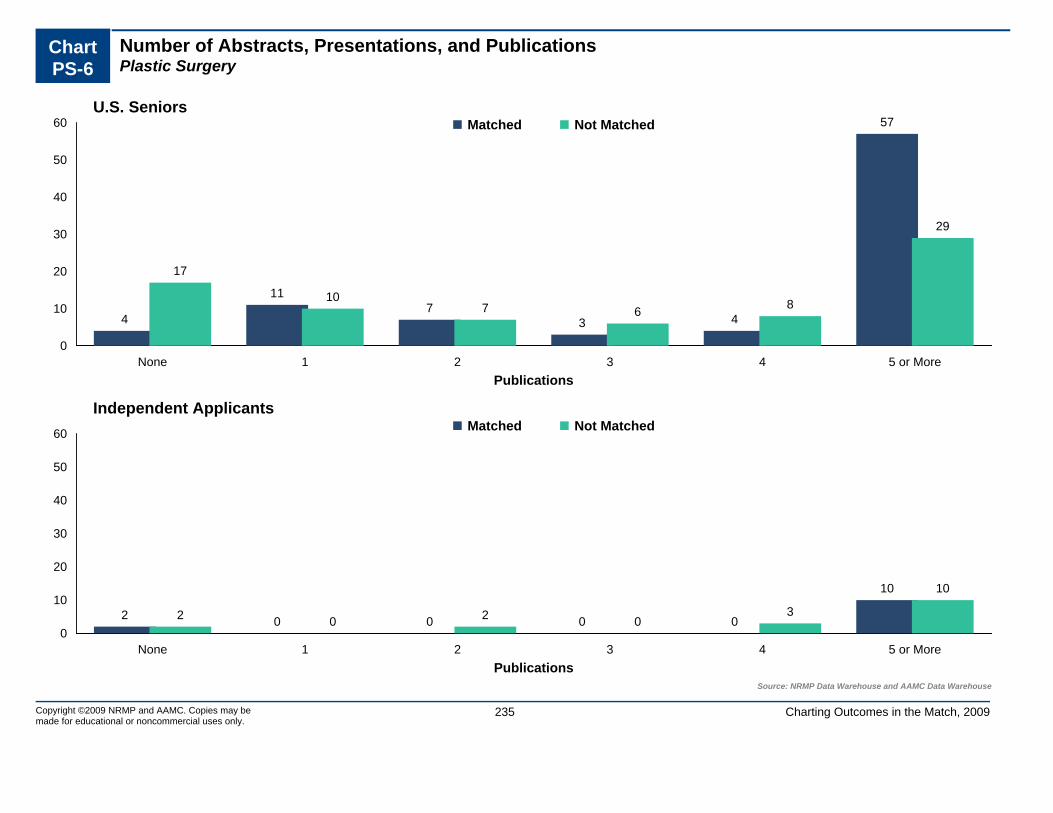
Chart PS-6
Number of Abstracts, Presentations, and PublicationsPlastic Surgery
0
10
20
30
40
50
60
None 1 2 3 4 5 or More
4
117
3 4
57
17
107 6 8
29
Matched Not Matched
Publications
U.S. Seniors
0
10
20
30
40
50
60
None 1 2 3 4 5 or More
2 0 0 0 0
10
2 0 2 03
10
Matched Not Matched
PublicationsSource: NRMP Data Warehouse and AAMC Data Warehouse
Independent Applicants
Copyright ©2009 NRMP and AAMC. Copies may be made for educational or noncommercial uses only.
Charting Outcomes in the Match, 2009235

Chart PS-7
Number of Work ExperiencesPlastic Surgery
0
3
6
9
12
15
18
21
24
None 1 2 3 4 5 or More
13
21
10
13
9
20
9
18 18
11
5
16
Matched Not Matched
Work Experiences
U.S. Seniors
0
3
6
9
12
15
18
21
24
None 1 2 3 4 5 or More
1
4
0
31
334 4
32
1
Matched Not Matched
Work ExperiencesSource: NRMP Data Warehouse and AAMC Data Warehouse
Independent Applicants
Copyright ©2009 NRMP and AAMC. Copies may be made for educational or noncommercial uses only.
Charting Outcomes in the Match, 2009236

Chart PS-8
Number of Volunteer ExperiencesPlastic Surgery
0
2
4
6
8
10
12
14
16
None 1 2 3 4 5 6 7 8 9 10 or More
1
43
7
10
12
910
6
9
15
54
8
6
2
10
8
12
8
3
11
Matched Not Matched
Volunteer Experiences
U.S. Seniors
0
2
4
6
8
10
12
14
16
None 1 2 3 4 5 6 7 8 9 10 or More
23
12
01
01
01 1
4
1
6
0
2
0 0 0
3
01
Matched Not Matched
Volunteer ExperiencesSource: NRMP Data Warehouse and AAMC Data Warehouse.
Independent Applicants
Copyright ©2009 NRMP and AAMC. Copies may be made for educational or noncommercial uses only.
Charting Outcomes in the Match, 2009237

Chart PS-9
Other Characteristics of U.S. SeniorsPlastic Surgery
10
20
30
40
50
60
70
No Yes
50
36
66
11
Matched Not Matched
AOA Membership
37
38
39
40
41
42
43
44
No Yes
42
44
40
37
Graduate of One of the 40 U.S. Medical Schoolswith the Highest NIH Funding
0
20
40
60
80
100
No Yes
84
2
70
7
Ph.D. Degree
0
10
20
30
40
50
60
70
80
No Yes
77
9
69
8
Other Graduate Degree
Sources. AOA membership from the AAMC Data Warehouse, NIH awards from http://report.nih.gov/award/trends/AggregateData.cfm Medical Schools Only.xls, Ph.D. and other graduate degrees from the AAMC Data Warehouse
Copyright ©2009 NRMP and AAMC. Copies may be made for educational or noncommercial uses only.
Charting Outcomes in the Match, 2009238

P Psychiatry
Copyright ©2009 NRMP and AAMC. Copies may be made for educational or noncommercial uses only.
239 Charting Outcomes in the Match, 2009

Table P-1
Summary StatisticsPsychiatry
Measure (n=643) (n=38) (n=371) (n=511)
U.S. Seniors Independent Applicants
Matched Unmatched Matched Unmatched
1. 7.3 4.2 5.8 2.8Mean number of contiguous ranks2. 1.1 1.2 1.2 1.4Mean number of distinct specialties ranked3. 216 205 207 198Mean USMLE Step 1 score4. 221 199 209 199Mean USMLE Step 2 score5. 1.8 1.8 1.4 1.2Mean number of research experiences6. 2.4 1.3 2.4 2.3Mean number of abstracts, presentations, and
publications7. 2.8 2.4 3.5 4.2Mean number of work experiences8. 5.9 4.3 3.5 2.4Mean number of volunteer experiences9. 4.2 2.6Percentage who are AOA members n/a n/a
10. 36.1 7.9Percentage who graduated from one of the 40 U.S. medical schools with the highest NIH funding
n/a n/a
11. 4.5 0.0Percentage who have Ph.D. degree n/a n/a12. 11.8 21.1Percentage who have another graduate degree n/a n/a
n/a: The measure either does not apply to, applies to only a small percentage of, or no reliable data were available for independent applicants.
Sources. Measures 1, 2, and match outcome are from the NRMP Data Warehouse; measures 3 and 4 are from the AAMC Data Warehouse and from the ECFMG, both by permission of the NBME and ECFMG; measures 5-9 are from the AAMC Data Warehouse; measure 10 is from the NIH website (http://report.nih.gov/award/trends/AggregateDate.cfm Medical Schools Only.xls); and measures 11 and 12 are from the AAMC Data Warehouse.
Note: USMLE Step 1 scores are not available for most osteopathic medical school graduates included in the independent applicant group.
Approximately 30 percent of U.S. allopathic medical school seniors do not take the USMLE Step 2 prior to the Match.
Copyright ©2009 NRMP and AAMC. Copies may be made for educational or noncommercial uses only.
240 Charting Outcomes in the Match, 2009

0
40
80
120
160
200
240
280
1 2 3 4 5 6 7 8 9 10 11 12 13 14 15 16 orMore
34 30 28 34
74 74 73 79 6646
27 27 227 9 1310 7 6 3 2 1 3 0 2 2 1 0 0 0 0 1
Matched Not Matched
Contiguous Ranks
U.S. Seniors
0
40
80
120
160
200
240
280
1 2 3 4 5 6 7 8 9 10 11 12 13 14 15 16 orMore
5131 40 37 25
45 36 25 24 2310 6 5 3 0 10
248
106
5330 19 8 8 6 3 13 1 0 0 3 1 12
Matched Not Matched
Contiguous RanksSource: NRMP Data Warehouse
Independent Applicants
Copyright ©2009 NRMP and AAMC. Copies may be made for educational or noncommercial uses only.
241 Charting Outcomes in the Match, 2009
Chart P-1
Number of Contiguous Ranks Within Preferred SpecialtyPsychiatry

Graph P-1
Probability of Matching to Preferred Specialty by Number of Contiguous RanksPsychiatry
0.00
0.10
0.20
0.30
0.40
0.50
0.60
0.70
0.80
0.90
1.00
0 1 2 3 4 5 6 7 8 9 10 11 12 13 14 15 16 17 18 19 20
U.S. SeniorsIndependent Applicants
Number of Contiguous RanksSource: NRMP Data Warehouse. Note: Probabilities
calculated based on 2007-2009 applicants.
Probability of Matching
242Copyright ©2009 NRMP and AAMC. Copies may be made for educational or noncommercial uses only.
Charting Outcomes in the Match, 2009

Chart P-2
Number of Distinct Specialties RankedPsychiatry
0
100
200
300
400
500
600
700
1 2 3 4 or More
603
364 0
324 2 0
Matched Not Matched
Distinct Specialties Ranked
U.S. Seniors
0
100
200
300
400
500
600
700
1 2 3 4 or More
312
41 14 4
362
10433 12
Matched Not Matched
Distinct Specialties RankedSource: NRMP Data Warehouse
Independent Applicants
Copyright ©2009 NRMP and AAMC. Copies may be made for educational or noncommercial uses only.
Charting Outcomes in the Match, 2009243

Chart P-3
USMLE Step 1 ScoresPsychiatry
0
20
40
60
80
100
120
140
<= 180 Between 181and 190
Between 191and 200
Between 201and 210
Between 211and 220
Between 221and 230
Between 231and 240
Between 241and 250
Between 251and 260
>260 ScoreUnknown
7
49
106 108101
125
78
45
157 21
8 115 5 4 3 0 1 0 0
Matched Not Matched
Step 1 Scores Source: NRMP Data Warehouse and AAMC Data Warehouse. USMLEscores by permission of the NBME and ECFMG.
U.S. Seniors
0
20
40
60
80
100
120
140
160
180
<= 180 Between 181and 190
Between 191and 200
Between 201and 210
Between 211and 220
Between 221and 230
Between 231and 240
Between 241and 250
Between 251and 260
>260 ScoreUnknown
1
49
68
47 4834
11 110 0
102
6
161148
84
41
225 7 1 1
35
Matched Not Matched
Step 1 Scores Source: NRMP Data Warehouse and AAMC Data Warehouse. USMLEscores by permission of the NBME and ECFMG.
Independent Applicants
Copyright ©2009 NRMP and AAMC. Copies may be made for educational or noncommercial uses only.
Charting Outcomes in the Match, 2009244

Graph P-2
Probability of Matching to Preferred Specialty by USMLE Step 1 ScorePsychiatry
0.00
0.10
0.20
0.30
0.40
0.50
0.60
0.70
0.80
0.90
1.00
160 180 200 220 240 260 280
U.S. SeniorsIndependent Applicants
Step 1 ScoreSource: NRMP Data Warehouse and AAMC Data Warehouse. USMLE
scores by permission of the NBME and ECFMG. Note: Probabilitiescalculated based on 2007-2009 applicants.
Probability of Matching
245Copyright ©2009 NRMP and AAMC. Copies may be made for educational or noncommercial uses only.
Charting Outcomes in the Match, 2009
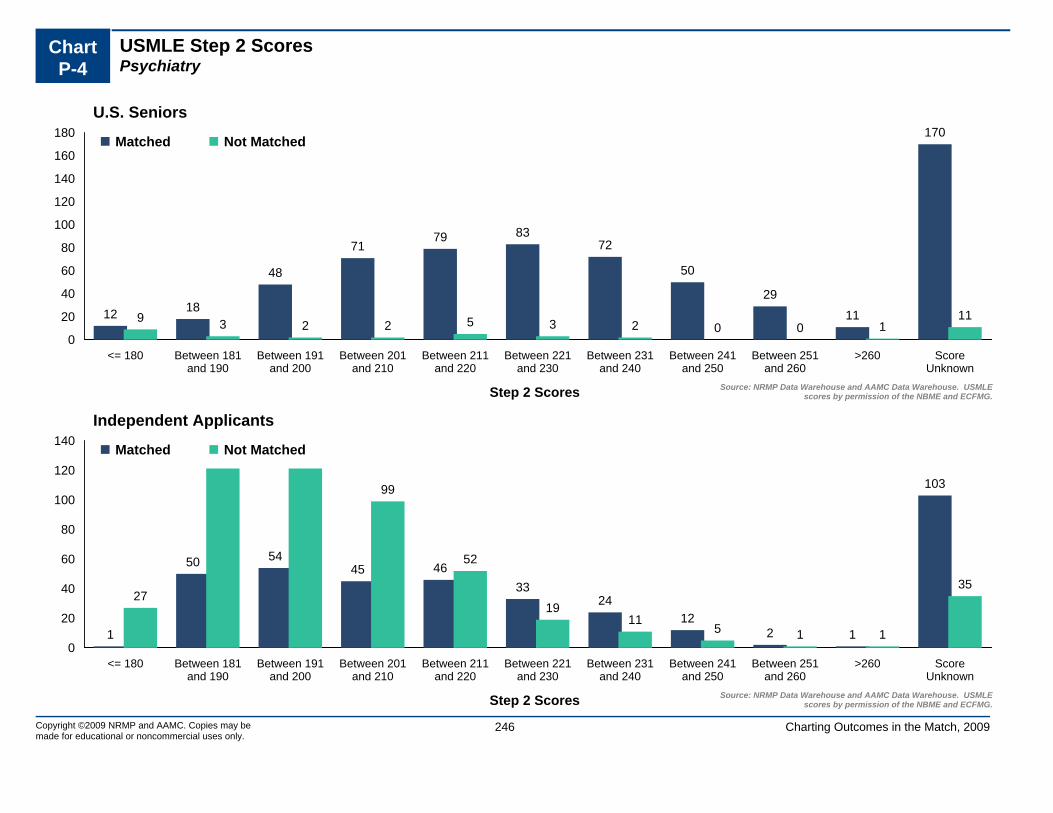
Chart P-4
USMLE Step 2 ScoresPsychiatry
0
20
40
60
80
100
120
140
160
180
<= 180 Between 181and 190
Between 191and 200
Between 201and 210
Between 211and 220
Between 221and 230
Between 231and 240
Between 241and 250
Between 251and 260
>260 ScoreUnknown
12 18
48
7179 83
72
50
2911
170
9 3 2 2 5 3 2 0 0 111
Matched Not Matched
Step 2 Scores Source: NRMP Data Warehouse and AAMC Data Warehouse. USMLEscores by permission of the NBME and ECFMG.
U.S. Seniors
0
20
40
60
80
100
120
140
<= 180 Between 181and 190
Between 191and 200
Between 201and 210
Between 211and 220
Between 221and 230
Between 231and 240
Between 241and 250
Between 251and 260
>260 ScoreUnknown
1
50 5445 46
3324
122 1
103
27
133 128
99
52
1911
5 1 1
35
Matched Not Matched
Step 2 Scores Source: NRMP Data Warehouse and AAMC Data Warehouse. USMLEscores by permission of the NBME and ECFMG.
Independent Applicants
Copyright ©2009 NRMP and AAMC. Copies may be made for educational or noncommercial uses only.
Charting Outcomes in the Match, 2009246

Chart P-5
Number of Research ProjectsPsychiatry
0
40
80
120
160
200
240
None 1 2 3 4 5 or More
153175
136
87
5141
11 10 6 5 3 3
Matched Not Matched
Research Projects
U.S. Seniors
0
40
80
120
160
200
240
None 1 2 3 4 5 or More
129
103
65
3222 20
220
132
77
3822 22
Matched Not Matched
Research ProjectsSource: NRMP Data Warehouse and AAMC Data Warehouse
Independent Applicants
Copyright ©2009 NRMP and AAMC. Copies may be made for educational or noncommercial uses only.
Charting Outcomes in the Match, 2009247

Chart P-6
Number of Abstracts, Presentations, and PublicationsPsychiatry
0
40
80
120
160
200
240
280
320
None 1 2 3 4 5 or More
293
95
6545 36
109
213 6 3 2 3
Matched Not Matched
Publications
U.S. Seniors
0
40
80
120
160
200
240
280
320
None 1 2 3 4 5 or More
193
61
23 19 12
63
281
69
38 29 17
77
Matched Not Matched
PublicationsSource: NRMP Data Warehouse and AAMC Data Warehouse
Independent Applicants
Copyright ©2009 NRMP and AAMC. Copies may be made for educational or noncommercial uses only.
Charting Outcomes in the Match, 2009248
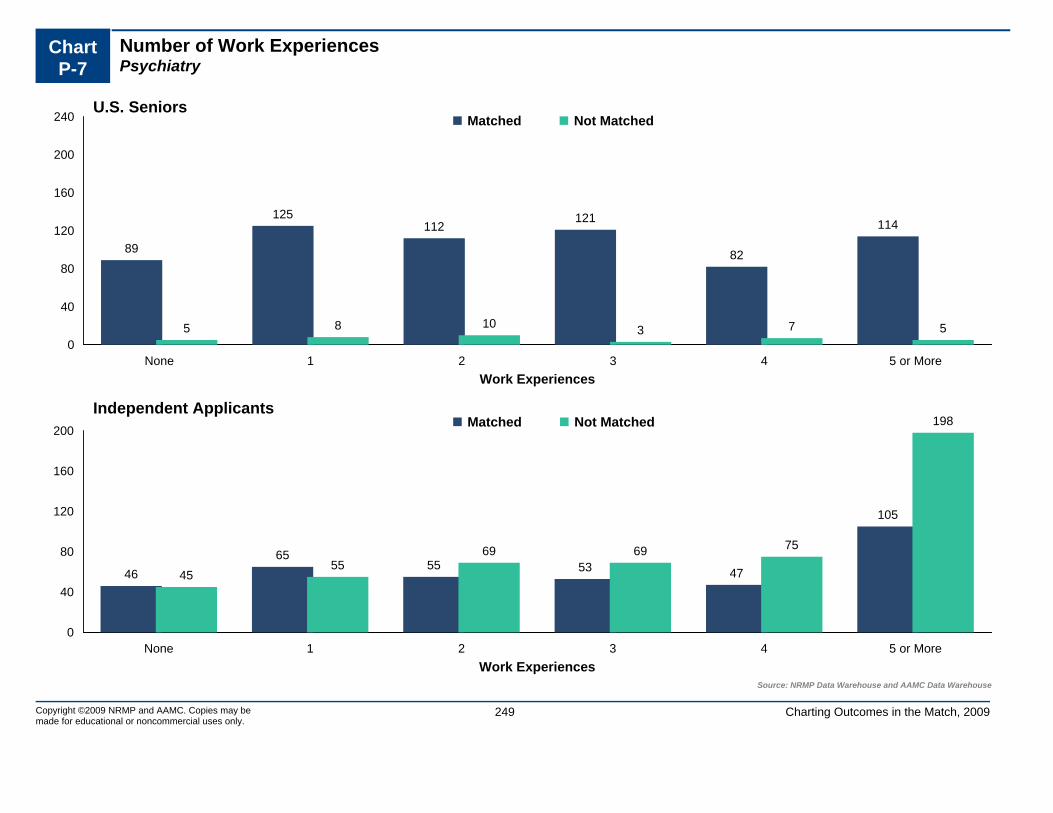
Chart P-7
Number of Work ExperiencesPsychiatry
0
40
80
120
160
200
240
None 1 2 3 4 5 or More
89
125112
121
82
114
5 8 10 3 7 5
Matched Not Matched
Work Experiences
U.S. Seniors
0
40
80
120
160
200
None 1 2 3 4 5 or More
4665
55 53 47
105
4555
69 69 75
198Matched Not Matched
Work ExperiencesSource: NRMP Data Warehouse and AAMC Data Warehouse
Independent Applicants
Copyright ©2009 NRMP and AAMC. Copies may be made for educational or noncommercial uses only.
Charting Outcomes in the Match, 2009249

Chart P-8
Number of Volunteer ExperiencesPsychiatry
0
20
40
60
80
100
120
None 1 2 3 4 5 6 7 8 9 10 or More
35 34
53
76 76
87
51 48 44
27
112
6 3 5 7 61 2 1 1 2 4
Matched Not Matched
Volunteer Experiences
U.S. Seniors
0
20
40
60
80
100
120
None 1 2 3 4 5 6 7 8 9 10 or More
59 6253 49 48
3022
149
4
21
114
98103
72
46
24 20 17
5 4 8
Matched Not Matched
Volunteer ExperiencesSource: NRMP Data Warehouse and AAMC Data Warehouse.
Independent Applicants
Copyright ©2009 NRMP and AAMC. Copies may be made for educational or noncommercial uses only.
Charting Outcomes in the Match, 2009250

Chart P-9
Other Characteristics of U.S. SeniorsPsychiatry
0
100
200
300
400
500
600
700
No Yes
616
27371
Matched Not Matched
AOA Membership
0
50
100
150
200
250
300
350
400
450
No Yes
411
232
353
Graduate of One of the 40 U.S. Medical Schoolswith the Highest NIH Funding
0
100
200
300
400
500
600
700
No Yes
614
29380
Ph.D. Degree
0
100
200
300
400
500
600
No Yes
567
7630 8
Other Graduate Degree
Sources. AOA membership from the AAMC Data Warehouse, NIH awards from http://report.nih.gov/award/trends/AggregateData.cfm Medical Schools Only.xls, Ph.D. and other graduate degrees from the AAMC Data Warehouse
Copyright ©2009 NRMP and AAMC. Copies may be made for educational or noncommercial uses only.
Charting Outcomes in the Match, 2009251

RO Radiation Oncology
Copyright ©2009 NRMP and AAMC. Copies may be made for educational or noncommercial uses only.
252 Charting Outcomes in the Match, 2009

Table RO-1
Summary StatisticsRadiation Oncology
Measure (n=127) (n=28) (n=8) (n=16)
U.S. Seniors Independent Applicants
Matched Unmatched Matched Unmatched
1. 10.2 5.6 4.0 3.4Mean number of contiguous ranks2. 1.6 1.7 1.6 1.6Mean number of distinct specialties ranked3. 238 231 238 224Mean USMLE Step 1 score4. 240 226 240 225Mean USMLE Step 2 score5. 3.7 3.8 1.9 2.8Mean number of research experiences6. 8.2 5.3 8.1 6.3Mean number of abstracts, presentations, and
publications7. 2.4 2.0 4.0 2.1Mean number of work experiences8. 5.0 4.0 4.8 2.2Mean number of volunteer experiences9. 33.9 21.4Percentage who are AOA members n/a n/a
10. 53.5 46.4Percentage who graduated from one of the 40 U.S. medical schools with the highest NIH funding
n/a n/a
11. 22.0 17.9Percentage who have Ph.D. degree n/a n/a12. 9.4 3.6Percentage who have another graduate degree n/a n/a
n/a: The measure either does not apply to, applies to only a small percentage of, or no reliable data were available for independent applicants.
Sources. Measures 1, 2, and match outcome are from the NRMP Data Warehouse; measures 3 and 4 are from the AAMC Data Warehouse and from the ECFMG, both by permission of the NBME and ECFMG; measures 5-9 are from the AAMC Data Warehouse; measure 10 is from the NIH website (http://report.nih.gov/award/trends/AggregateDate.cfm Medical Schools Only.xls); and measures 11 and 12 are from the AAMC Data Warehouse.
Note: USMLE Step 1 scores are not available for most osteopathic medical school graduates included in the independent applicant group.
Approximately 30 percent of U.S. allopathic medical school seniors do not take the USMLE Step 2 prior to the Match.
Copyright ©2009 NRMP and AAMC. Copies may be made for educational or noncommercial uses only.
253 Charting Outcomes in the Match, 2009

0
2
4
6
8
10
12
14
1 2 3 4 5 6 7 8 9 10 11 12 13 14 15 16 orMore
43
56 6
7
9
4
7 7
12
14
11
9 9
14
6
1
34
1
45
01
0 0 01
0 0
2
Matched Not Matched
Contiguous Ranks
U.S. Seniors
0
2
4
6
8
10
12
14
1 2 3 4 5 6 7 8 9 10 11 12 13 14 15 16 orMore
12
1 1 1 10 0
10 0 0 0 0 0 0
8
2 2 2
0 0 01
0 0 0 0 0 0 01
Matched Not Matched
Contiguous RanksSource: NRMP Data Warehouse
Independent Applicants
Copyright ©2009 NRMP and AAMC. Copies may be made for educational or noncommercial uses only.
254 Charting Outcomes in the Match, 2009
Chart RO-1
Number of Contiguous Ranks Within Preferred SpecialtyRadiation Oncology

Graph RO-1
Probability of Matching to Preferred Specialty by Number of Contiguous RanksRadiation Oncology
0.00
0.10
0.20
0.30
0.40
0.50
0.60
0.70
0.80
0.90
1.00
0 1 2 3 4 5 6 7 8 9 10 11 12 13 14 15 16 17 18 19 20
U.S. SeniorsIndependent Applicants
Number of Contiguous RanksSource: NRMP Data Warehouse. Note: Probabilities
calculated based on 2007-2009 applicants.
Probability of Matching
255Copyright ©2009 NRMP and AAMC. Copies may be made for educational or noncommercial uses only.
Charting Outcomes in the Match, 2009

Chart RO-2
Number of Distinct Specialties RankedRadiation Oncology
0
10
20
30
40
50
60
70 69
35
22
1
1310
50
1 2 3 4 or More
Matched Not Matched
Distinct Specialties Ranked
U.S. Seniors
0
10
20
30
40
50
60
70
1 2 3 4 or More
3 50 0
11
2 2 1
Matched Not Matched
Distinct Specialties RankedSource: NRMP Data Warehouse
Independent Applicants
Copyright ©2009 NRMP and AAMC. Copies may be made for educational or noncommercial uses only.
Charting Outcomes in the Match, 2009256

Chart RO-3
USMLE Step 1 ScoresRadiation Oncology
0
5
10
15
20
25
30
35
40
<= 180 Between 181and 190
Between 191and 200
Between 201and 210
Between 211and 220
Between 221and 230
Between 231and 240
Between 241and 250
Between 251and 260
>260 ScoreUnknown
0 02
47
20
36
28
23
52
0 13 3
03
58
41 0
Matched Not Matched
Step 1 Scores Source: NRMP Data Warehouse and AAMC Data Warehouse. USMLEscores by permission of the NBME and ECFMG.
U.S. Seniors
0
1
2
3
4
5
6
7
<= 180 Between 181and 190
Between 191and 200
Between 201and 210
Between 211and 220
Between 221and 230
Between 231and 240
Between 241and 250
Between 251and 260
>260 ScoreUnknown
0 0 0 0
1 1
2 2
1
0
1
0 0
1
0
7
2
3
2
0 0
1
Matched Not Matched
Step 1 Scores Source: NRMP Data Warehouse and AAMC Data Warehouse. USMLEscores by permission of the NBME and ECFMG.
Independent Applicants
Copyright ©2009 NRMP and AAMC. Copies may be made for educational or noncommercial uses only.
Charting Outcomes in the Match, 2009257

Graph RO-2
Probability of Matching to Preferred Specialty by USMLE Step 1 ScoreRadiation Oncology
0.00
0.10
0.20
0.30
0.40
0.50
0.60
0.70
0.80
0.90
1.00
180 200 220 240 260 280
U.S. SeniorsIndependent Applicants
Step 1 ScoreSource: NRMP Data Warehouse and AAMC Data Warehouse. USMLE
scores by permission of the NBME and ECFMG. Note: Probabilitiescalculated based on 2007-2009 applicants.
Probability of Matching
258Copyright ©2009 NRMP and AAMC. Copies may be made for educational or noncommercial uses only.
Charting Outcomes in the Match, 2009

Chart RO-4
USMLE Step 2 ScoresRadiation Oncology
0
10
20
30
40
50
60
70
<= 180 Between 181and 190
Between 191and 200
Between 201and 210
Between 211and 220
Between 221and 230
Between 231and 240
Between 241and 250
Between 251and 260
>260 ScoreUnknown
0 1 1 27 8
5
16
710
70
2 1 0 1 2 2 1 3 1 2
13
Matched Not Matched
Step 2 Scores Source: NRMP Data Warehouse and AAMC Data Warehouse. USMLEscores by permission of the NBME and ECFMG.
U.S. Seniors
0.0
0.4
0.8
1.2
1.6
2.0
2.4
2.8
3.2
<= 180 Between 181and 190
Between 191and 200
Between 201and 210
Between 211and 220
Between 221and 230
Between 231and 240
Between 241and 250
Between 251and 260
>260 ScoreUnknown
0 0 0 0
1
0
2 2 2
0
1
0
2
1 1 1
3
2
3
1 1 1
Matched Not Matched
Step 2 Scores Source: NRMP Data Warehouse and AAMC Data Warehouse. USMLEscores by permission of the NBME and ECFMG.
Independent Applicants
Copyright ©2009 NRMP and AAMC. Copies may be made for educational or noncommercial uses only.
Charting Outcomes in the Match, 2009259

Chart RO-5
Number of Research ProjectsRadiation Oncology
0
5
10
15
20
25
30
35
40
None 1 2 3 4 5 or More
5
10
19
2629
38
2 14
74
10
Matched Not Matched
Research Projects
U.S. Seniors
0
5
10
15
20
25
30
35
40
None 1 2 3 4 5 or More
2 20
31 0
41 2 2 3 4
Matched Not Matched
Research ProjectsSource: NRMP Data Warehouse and AAMC Data Warehouse
Independent Applicants
Copyright ©2009 NRMP and AAMC. Copies may be made for educational or noncommercial uses only.
Charting Outcomes in the Match, 2009260

Chart RO-6
Number of Abstracts, Presentations, and PublicationsRadiation Oncology
0
20
40
60
80
100
None 1 2 3 4 5 or More
7 711 9 10
83
2 5 50 2
14
Matched Not Matched
Publications
U.S. Seniors
0
20
40
60
80
100
None 1 2 3 4 5 or More
0 0 0 2 063 0 3 2 0
8
Matched Not Matched
PublicationsSource: NRMP Data Warehouse and AAMC Data Warehouse
Independent Applicants
Copyright ©2009 NRMP and AAMC. Copies may be made for educational or noncommercial uses only.
Charting Outcomes in the Match, 2009261
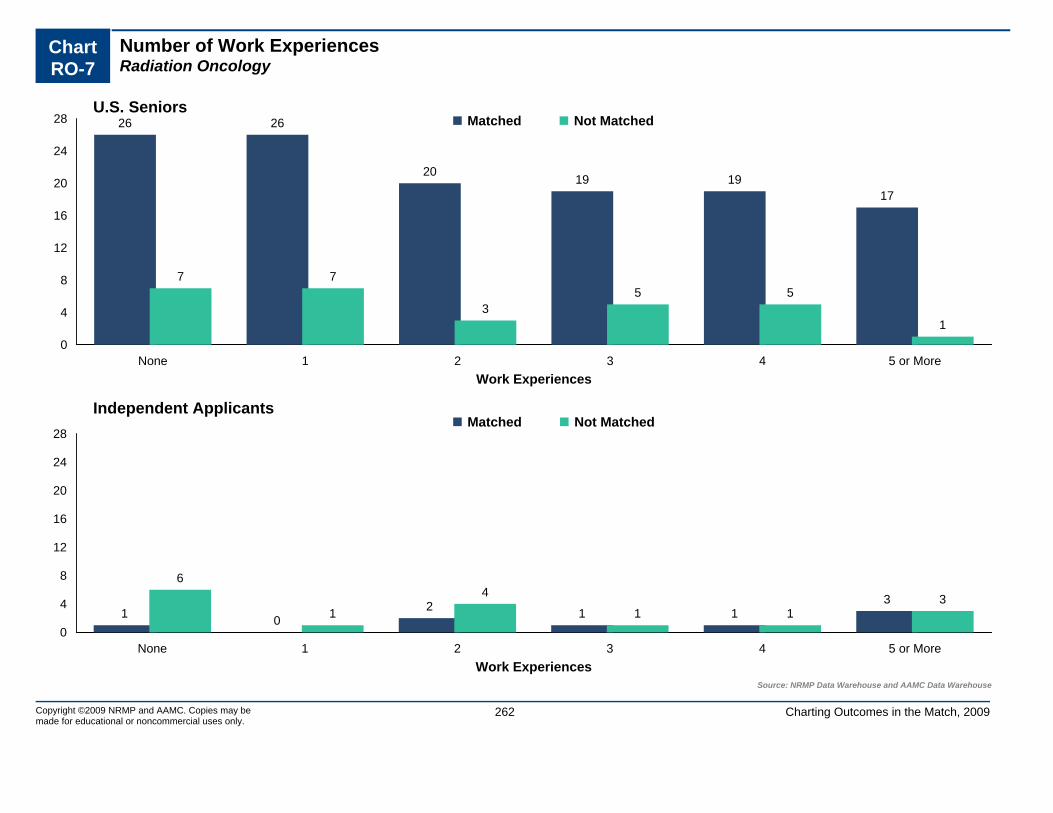
Chart RO-7
Number of Work ExperiencesRadiation Oncology
0
4
8
12
16
20
24
28
None 1 2 3 4 5 or More
26 26
20 19 1917
7 7
35 5
1
Matched Not Matched
Work Experiences
U.S. Seniors
0
4
8
12
16
20
24
28
None 1 2 3 4 5 or More
1 02 1 1
3
6
1
4
1 13
Matched Not Matched
Work ExperiencesSource: NRMP Data Warehouse and AAMC Data Warehouse
Independent Applicants
Copyright ©2009 NRMP and AAMC. Copies may be made for educational or noncommercial uses only.
Charting Outcomes in the Match, 2009262

Chart RO-8
Number of Volunteer ExperiencesRadiation Oncology
0
4
8
12
16
20
None 1 2 3 4 5 6 7 8 9 10 or More
98
1920
11
8
17
9
78
11
4 4
23
1
8
12
1 1 1
Matched Not Matched
Volunteer Experiences
U.S. Seniors
0
4
8
12
16
20
None 1 2 3 4 5 6 7 8 9 10 or More
02
0 01
3
0 01 1
0
6
21
4
01
02
0 0 0
Matched Not Matched
Volunteer ExperiencesSource: NRMP Data Warehouse and AAMC Data Warehouse.
Independent Applicants
Copyright ©2009 NRMP and AAMC. Copies may be made for educational or noncommercial uses only.
Charting Outcomes in the Match, 2009263

Chart RO-9
Other Characteristics of U.S. SeniorsRadiation Oncology
0
10
20
30
40
50
60
70
80
90
No Yes
84
43
22
6
Matched Not Matched
AOA Membership
10
20
30
40
50
60
70
No Yes
59
68
15 13
Graduate of One of the 40 U.S. Medical Schoolswith the Highest NIH Funding
0
20
40
60
80
100
No Yes
99
2823
5
Ph.D. Degree
0
20
40
60
80
100
120
No Yes
115
12
27
1
Other Graduate Degree
Sources. AOA membership from the AAMC Data Warehouse, NIH awards from http://report.nih.gov/award/trends/AggregateData.cfm Medical Schools Only.xls, Ph.D. and other graduate degrees from the AAMC Data Warehouse
Copyright ©2009 NRMP and AAMC. Copies may be made for educational or noncommercial uses only.
Charting Outcomes in the Match, 2009264

TR Transitional Year
Copyright ©2009 NRMP and AAMC. Copies may be made for educational or noncommercial uses only.
265 Charting Outcomes in the Match, 2009

Table TR-1
Summary StatisticsTransitional Year
Measure (n=193) (n=68) (n=15) (n=49)
U.S. Seniors Independent Applicants
Matched Unmatched Matched Unmatched
1. 2.4 1.9 1.5 2.0Mean number of contiguous ranks2. 1.9 2.0 1.7 1.9Mean number of distinct specialties ranked3. 236 228 213 209Mean USMLE Step 1 score4. 239 226 219 208Mean USMLE Step 2 score5. 3.1 2.7 1.7 1.6Mean number of research experiences6. 4.3 4.1 4.3 3.5Mean number of abstracts, presentations, and
publications7. 2.5 2.2 3.5 2.9Mean number of work experiences8. 6.4 5.6 3.3 3.9Mean number of volunteer experiences9. 24.9 16.2Percentage who are AOA members n/a n/a
10. 46.1 39.7Percentage who graduated from one of the 40 U.S. medical schools with the highest NIH funding
n/a n/a
11. 4.1 4.4Percentage who have Ph.D. degree n/a n/a12. 10.4 8.8Percentage who have another graduate degree n/a n/a
n/a: The measure either does not apply to, applies to only a small percentage of, or no reliable data were available for independent applicants.
Sources. Measures 1, 2, and match outcome are from the NRMP Data Warehouse; measures 3 and 4 are from the AAMC Data Warehouse and from the ECFMG, both by permission of the NBME and ECFMG; measures 5-9 are from the AAMC Data Warehouse; measure 10 is from the NIH website (http://report.nih.gov/award/trends/AggregateDate.cfm Medical Schools Only.xls); and measures 11 and 12 are from the AAMC Data Warehouse.
Note: USMLE Step 1 scores are not available for most osteopathic medical school graduates included in the independent applicant group.
Approximately 30 percent of U.S. allopathic medical school seniors do not take the USMLE Step 2 prior to the Match.
Copyright ©2009 NRMP and AAMC. Copies may be made for educational or noncommercial uses only.
266 Charting Outcomes in the Match, 2009
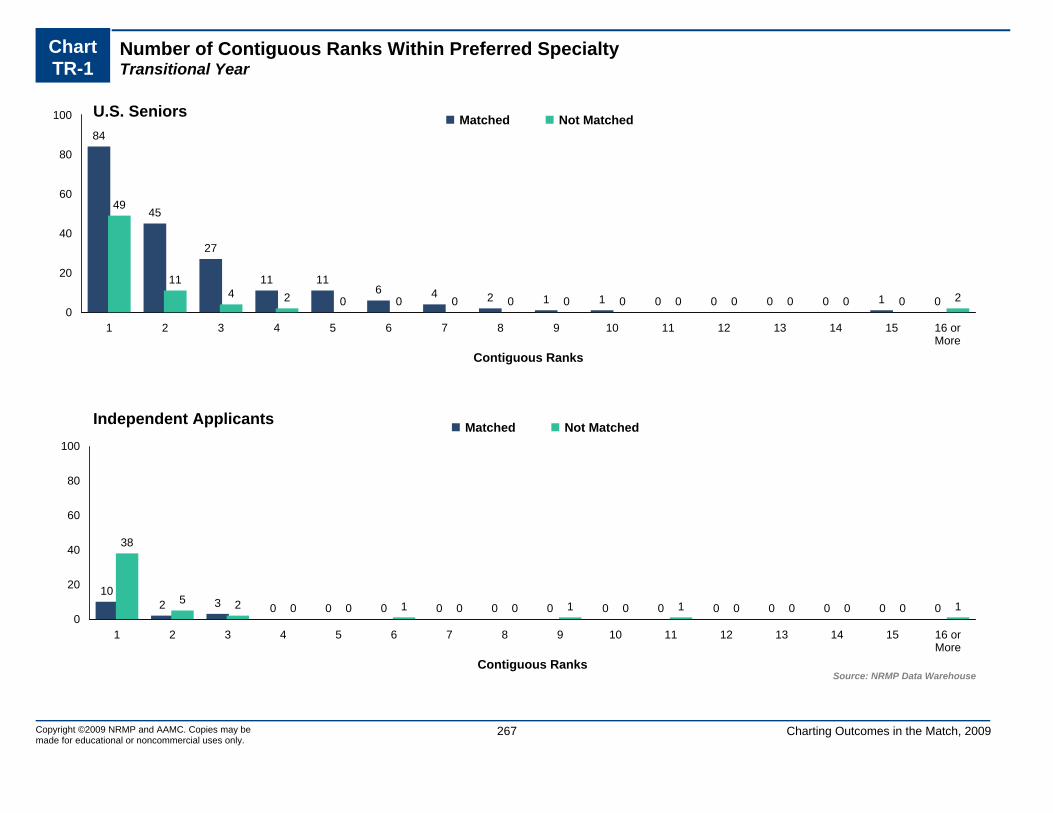
0
20
40
60
80
100
1 2 3 4 5 6 7 8 9 10 11 12 13 14 15 16 orMore
84
45
27
11 116 4 2 1 1 0 0 0 0 1 0
49
114 2 0 0 0 0 0 0 0 0 0 0 0 2
Matched Not Matched
Contiguous Ranks
U.S. Seniors
0
20
40
60
80
100
1 2 3 4 5 6 7 8 9 10 11 12 13 14 15 16 orMore
102 3 0 0 0 0 0 0 0 0 0 0 0 0 0
38
5 2 0 0 1 0 0 1 0 1 0 0 0 0 1
Matched Not Matched
Contiguous RanksSource: NRMP Data Warehouse
Independent Applicants
Copyright ©2009 NRMP and AAMC. Copies may be made for educational or noncommercial uses only.
267 Charting Outcomes in the Match, 2009
Chart TR-1
Number of Contiguous Ranks Within Preferred SpecialtyTransitional Year

Graph TR-1
Probability of Matching to Preferred Specialty by Number of Contiguous RanksTransitional Year
0.00
0.10
0.20
0.30
0.40
0.50
0.60
0.70
0.80
0.90
1.00
0 1 2 3 4 5 6 7 8 9 10 11 12 13 14 15 16 17 18 19 20
U.S. SeniorsIndependent Applicants
Number of Contiguous RanksSource: NRMP Data Warehouse. Note: Probabilities
calculated based on 2007-2009 applicants.
Probability of Matching
268Copyright ©2009 NRMP and AAMC. Copies may be made for educational or noncommercial uses only.
Charting Outcomes in the Match, 2009

Chart TR-2
Number of Distinct Specialties RankedTransitional Year
0
20
40
60
80
100
120
140
160
1 2 3 4 or More
28
154
110
8
54
5 1
Matched Not Matched
Distinct Specialties Ranked
U.S. Seniors
0
20
40
60
80
100
120
140
160
1 2 3 4 or More
7 6 2 0
19 216 3
Matched Not Matched
Distinct Specialties RankedSource: NRMP Data Warehouse
Independent Applicants
Copyright ©2009 NRMP and AAMC. Copies may be made for educational or noncommercial uses only.
Charting Outcomes in the Match, 2009269

Chart TR-3
USMLE Step 1 ScoresTransitional Year
0
5
10
15
20
25
30
35
40
45
<= 180 Between 181and 190
Between 191and 200
Between 201and 210
Between 211and 220
Between 221and 230
Between 231and 240
Between 241and 250
Between 251and 260
>260 ScoreUnknown
0 0
57
16
43 42 43
27
10
02 2
5 46
11
1612
7
2 1
Matched Not Matched
Step 1 Scores Source: NRMP Data Warehouse and AAMC Data Warehouse. USMLEscores by permission of the NBME and ECFMG.
U.S. Seniors
0
2
4
6
8
10
<= 180 Between 181and 190
Between 191and 200
Between 201and 210
Between 211and 220
Between 221and 230
Between 231and 240
Between 241and 250
Between 251and 260
>260 ScoreUnknown
01
32
32
10
10
2
0
910
87
5
0
2 21
5
Matched Not Matched
Step 1 Scores Source: NRMP Data Warehouse and AAMC Data Warehouse. USMLEscores by permission of the NBME and ECFMG.
Independent Applicants
Copyright ©2009 NRMP and AAMC. Copies may be made for educational or noncommercial uses only.
Charting Outcomes in the Match, 2009270

Graph TR-2
Probability of Matching to Preferred Specialty by USMLE Step 1 ScoreTransitional Year
0.00
0.10
0.20
0.30
0.40
0.50
0.60
0.70
0.80
0.90
1.00
160 180 200 220 240 260 280
Independent ApplicantsU.S. Seniors
Step 1 ScoreSource: NRMP Data Warehouse and AAMC Data Warehouse. USMLE
scores by permission of the NBME and ECFMG. Note: Probabilitiescalculated based on 2007-2009 applicants.
Probability of Matching
271Copyright ©2009 NRMP and AAMC. Copies may be made for educational or noncommercial uses only.
Charting Outcomes in the Match, 2009

Chart TR-4
USMLE Step 2 ScoresTransitional Year
0
20
40
60
80
100
120
<= 180 Between 181and 190
Between 191and 200
Between 201and 210
Between 211and 220
Between 221and 230
Between 231and 240
Between 241and 250
Between 251and 260
>260 ScoreUnknown
0 1 2 3 713 16 15 16
9
111
1 3 5 1 5 411 7 5 1
25
Matched Not Matched
Step 2 Scores Source: NRMP Data Warehouse and AAMC Data Warehouse. USMLEscores by permission of the NBME and ECFMG.
U.S. Seniors
0
2
4
6
8
10
<= 180 Between 181and 190
Between 191and 200
Between 201and 210
Between 211and 220
Between 221and 230
Between 231and 240
Between 241and 250
Between 251and 260
>260 ScoreUnknown
12
12
0
21
4
10
1
3
7
9 9
5 5
21
21
5
Matched Not Matched
Step 2 Scores Source: NRMP Data Warehouse and AAMC Data Warehouse. USMLEscores by permission of the NBME and ECFMG.
Independent Applicants
Copyright ©2009 NRMP and AAMC. Copies may be made for educational or noncommercial uses only.
Charting Outcomes in the Match, 2009272

Chart TR-5
Number of Research ProjectsTransitional Year
5
10
15
20
25
30
35
40
45
None 1 2 3 4 5 or More
11
25
36
4543
33
8
1214
1114
9
Matched Not Matched
Research Projects
U.S. Seniors
0
5
10
15
20
25
30
35
40
45
None 1 2 3 4 5 or More
4 4 41 1 1
1713
73 3
6
Matched Not Matched
Research ProjectsSource: NRMP Data Warehouse and AAMC Data Warehouse
Independent Applicants
Copyright ©2009 NRMP and AAMC. Copies may be made for educational or noncommercial uses only.
Charting Outcomes in the Match, 2009273
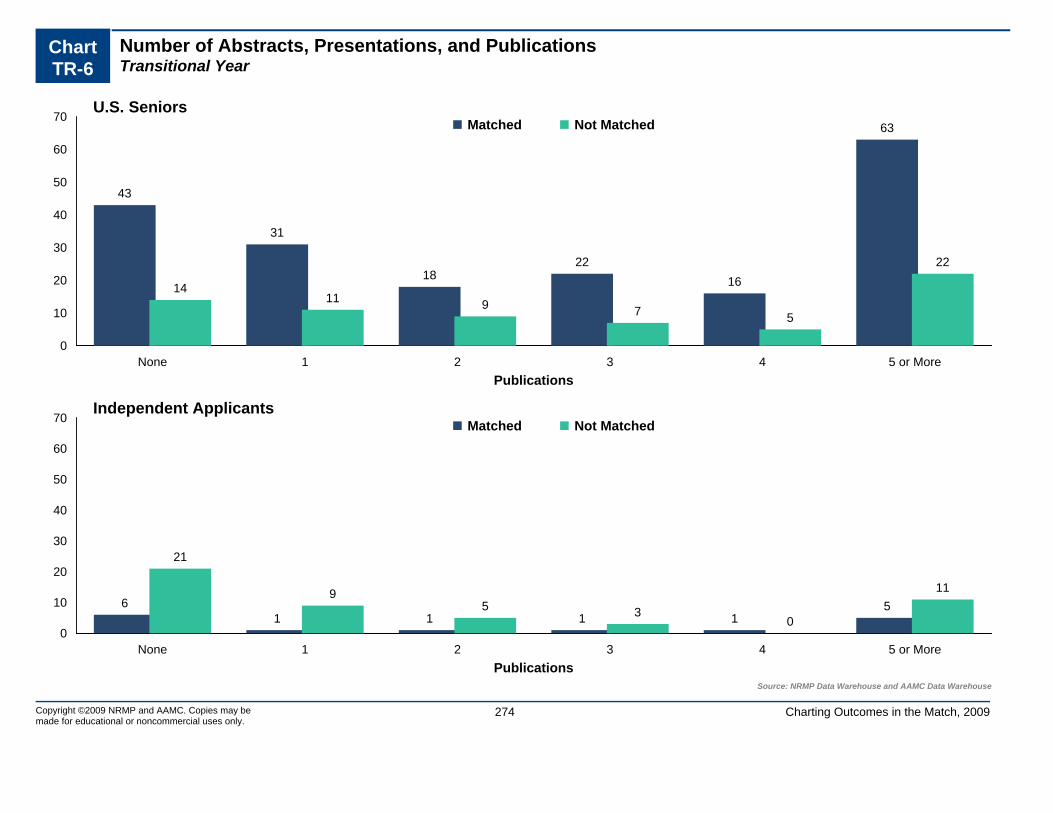
Chart TR-6
Number of Abstracts, Presentations, and PublicationsTransitional Year
0
10
20
30
40
50
60
70
None 1 2 3 4 5 or More
43
31
1822
16
63
1411 9 7 5
22
Matched Not Matched
Publications
U.S. Seniors
0
10
20
30
40
50
60
70
None 1 2 3 4 5 or More
61 1 1 1
5
21
95 3
0
11
Matched Not Matched
PublicationsSource: NRMP Data Warehouse and AAMC Data Warehouse
Independent Applicants
Copyright ©2009 NRMP and AAMC. Copies may be made for educational or noncommercial uses only.
Charting Outcomes in the Match, 2009274

Chart TR-7
Number of Work ExperiencesTransitional Year
5
10
15
20
25
30
35
40
45
None 1 2 3 4 5 or More
27
36
43
36
22
29
10
1518
10 10
5
Matched Not Matched
Work Experiences
U.S. Seniors
0
5
10
15
20
25
30
35
40
45
None 1 2 3 4 5 or More
2 13 4
2 36
11 10
5 6
11
Matched Not Matched
Work ExperiencesSource: NRMP Data Warehouse and AAMC Data Warehouse
Independent Applicants
Copyright ©2009 NRMP and AAMC. Copies may be made for educational or noncommercial uses only.
Charting Outcomes in the Match, 2009275

Chart TR-8
Number of Volunteer ExperiencesTransitional Year
0
5
10
15
20
25
30
35
40
None 1 2 3 4 5 6 7 8 9 10 or More
85
13 14
30
24
18
11 12
18
40
52
5 6
108
11
4 3 3
11
Matched Not Matched
Volunteer Experiences
U.S. Seniors
0
5
10
15
20
25
30
35
40
None 1 2 3 4 5 6 7 8 9 10 or More
35
03
1 1 0 1 0 0 1
9 96
4
9
2 20 1 2
5
Matched Not Matched
Volunteer ExperiencesSource: NRMP Data Warehouse and AAMC Data Warehouse.
Independent Applicants
Copyright ©2009 NRMP and AAMC. Copies may be made for educational or noncommercial uses only.
Charting Outcomes in the Match, 2009276

Chart TR-9
Other Characteristics of U.S. SeniorsTransitional Year
0
20
40
60
80
100
120
140
160
No Yes
145
4857
11
Matched Not Matched
AOA Membership
20
30
40
50
60
70
80
90
100
110
No Yes
104
89
41
27
Graduate of One of the 40 U.S. Medical Schoolswith the Highest NIH Funding
0
40
80
120
160
200
No Yes
185
8
65
3
Ph.D. Degree
0
20
40
60
80
100
120
140
160
180
No Yes
173
20
62
6
Other Graduate Degree
Sources. AOA membership from the AAMC Data Warehouse, NIH awards from http://report.nih.gov/award/trends/AggregateData.cfm Medical Schools Only.xls, Ph.D. and other graduate degrees from the AAMC Data Warehouse
Copyright ©2009 NRMP and AAMC. Copies may be made for educational or noncommercial uses only.
Charting Outcomes in the Match, 2009277