Charitable Giving to Universities in Australia and New ... - …€¦ · Charitable Giving to...
41
Charitable Giving to Universities in Australia and New Zealand Survey Findings from data collected from 24 universities in Australia and New Zealand for 2013, 2014 and 2015 Based on the Ross-CASE Survey methodology of Charitable Giving to universities in the UK
-
Upload
truongkhue -
Category
Documents
-
view
218 -
download
1
Transcript of Charitable Giving to Universities in Australia and New ... - …€¦ · Charitable Giving to...
Charitable Giving to Universities in Australia and New Zealand Survey Findings from data collected from 24 universities in Australia and New Zealand for 2013, 2014 and 2015 Based on the Ross-CASE Survey methodology of Charitable Giving to universities in the UK
Charitable Giving to Universities in Australia and New Zealand Survey - Editorial Board Asia-Pacific The Editorial Board members helped manage the project by contributing their time and expertise at each stage of the survey and report. They were involved with survey review, script creation, survey promotions, data collection, data verification, analysis, report writing and dissemination. The 2016 committee consisted of:
Nikki McGregor – University of Sydney (Director, Advancement Services)
Rosalind Ogilvie – University of Sydney (Acting Chief of Staff)
Stefanie Hardacre - Monash University (Gift Administration Advisor, Operations)
Agatha Albano – Macquarie University (Advancement Services Manager)
Mark Bentley – The University of Auckland (Director - Alumni Relations & Development)
Louise McCarthy – The University of Auckland (Deputy Director, Alumni Relations & Development)
Ruth O’Hanlon – University of London (Head of Development at SOAS) [Previous Associate Director, Development and Philanthropy, UQ Advancement at University of Queensland]
CASE staff Tricia King, Vice-President International, CASE Chua Beng Hwee, Executive Director CASE Asia-Pacific John Middleton, Executive Director, CASE Europe Carolee Summers-Sparks, Deputy Director, CASE Europe Fione Goh, Head, Business Development, CASE Asia-Pacific Yashraj Jain, Research Manager, CASE Europe [Report Author] © 2016 CASE All rights reserved. No part of the material in this document may be reproduced or used in any form, electronic or mechanical, including photocopying, recording, posting or distributing, or by any information storage and retrieval system, without the written consent of the Council for Advancement and Support of Education.
This report is not for sale, reproduction or commercial use
Limit of Liability/Disclaimer While the publisher has used its best efforts in preparing this document, it makes no representations or warranties with respect to the accuracy or completeness of the contents of this paper. No liability or responsibility of any kind (to extent permitted by law), including responsibility for negligence is accepted by the Council for Advancement and Support of Education, its servants or agents. All information gathered is believed correct at publication date. Neither the publisher nor the author is engaged in rendering legal, accounting or other professional services. If legal advice or other expert assistance is required, the services of a competent professional should be sought. Publication date 27 October 2016
Contents Introduction by CASE Asia-Pacific ................................... 1
Foreword .................................................................... 2
1 Executive summary ................................................... 4
1.1 Findings ................................................................................ 4
2 Key indicators ........................................................... 6
2.1 New funds secured 2015 ......................................................... 7
2.2 Cash income received 2015..................................................... 9
2.3 Annual funds 2015 ................................................................ 11
2.4 Alumni and donors 2015 ....................................................... 12
2.5 Fundraising investment 2015 ................................................ 14
2.6 Alumni relations investment 2015 ........................................ 16
2.7 Institutional expenditure and advancement staff 2015 ........ 18
3 Trends in key indicators 2013-2015 ........................ 20
3.1 Philanthropic income ............................................................ 20
3.2 Alumni and donors ............................................................... 26
3.3 Fundraising and alumni relations staffing trends .................. 28
3.4 Fundraising and alumni relations cost trends ....................... 29
4 Comparisons with institutions in the UK ................ 32
5 Appendix ................................................................. 34
5.1.1 CASE ................................................................................................................. 34
5.1.2 About the survey ................................................................................................ 34
5.1.3 Reporting conventions ....................................................................................... 34
5.1.4 Acknowledgements ............................................................................................ 35
5.1.5 Participating institutions .................................................................................... 35
5.1.6 Glossary ............................................................................................................... 38
1 | Copyright CASE 2016 | Charitable Giving to Universities in Australia and New Zealand 2013 – 2015
Introduction by CASE Asia-Pacific
The Council for Advancement and Support of Education, along with Group of Eight, introduced the
Charitable Giving to Universities in Australia and New Zealand Survey in 2012 to provide reliable data
on giving for institutional leaders, development and alumni staff in these two countries. I'm pleased
that the data has allowed these institutions to engage in more rigorous benchmarking, be more
confident in accountability and more persuasive in the relationships with alumni and other donors.
I'm also delighted to report that 24 institutions participated in this year's survey-- a higher
participation rate, thrice the number since its inception. This is a heartening sign that attention is
increasingly being given to this particular sector of the advancement profession, and that it is
something worth being concerned about. I would like to take this opportunity to thank all
participating institutions in contributing to the insightful results.
I would also like to express my appreciation to Tim Dolan, Vice Principal (Advancement) of the
University of Sydney, and chair of the committee of Chief Advancement Officers of the Group of
Eight and friends, for his leadership in this survey. Special thanks also goes to our survey committee
members for contributing their time and expertise to this project. I also would like to thank Nikki
McGregor, Director, Advancement Services of University of Sydney, for chairing the survey
committee, and Stefanie Hardacre, Gift Administration Advisor, Operations of Monash University,
for guiding the committee in the transition from the 2014 and 2015 surveys to the 2016 survey.
My appreciation also goes to our CASE colleagues from our London and Singapore offices, who have
worked together tirelessly with our volunteers in providing timely support to ensure that the survey
produced tangible results on the status of advancement activity.
Through everybody's continued support, I believe that we can further develop the survey to make it
even more significant, and eventually garner more support from Australia and New Zealand
institutions. Your contribution to the Charitable Giving to Universities in Australia and New Zealand
Survey is important. Thank you for your dedication towards the profession.
Chua Beng Hwee (Ms)
Executive Director, CASE Asia-Pacific
2 | Copyright CASE 2016 | Charitable Giving to Universities in Australia and New Zealand 2013 – 2015
Foreword
Philanthropy to universities in Australia and New Zealand is gathering both momentum and
conviction. Contrary to popular mythology, Australians and New Zealanders are generous people.
They will give to education. They do so in increasing numbers and with striking generosity. This is not
just a matter of anecdote and impression. With the survey of charitable giving now in its fourth year,
we are accumulating real evidence and can begin to see helpful trends in the data collected. It is a
pleasure therefore to introduce this report on behalf of the Group of Eight (Go8) research-intensive
universities, which initiated this survey exercise in 2012.
This year’s report, which draws on information from 2013-2015, charts several heights – though it
also indicates some areas for concern and for future attention. The largest number of universities to
date have taken part this year, 24 in total, with over 50 percent of eligible Australian institutions
submitting a response. Being willing and able to undertake a demanding benchmarking exercise is
not only an indicator of increasing competence; it also provides a valuable tool for improving
fundraising performance. On both counts, the growing number of participants bodes well for the
future. The drop in responses from New Zealand universities (from five last year to just one this
year) is, by the same token, disquieting. The sector in Australasia as a whole will benefit, as well as
the individual institutions, if it proves feasible for more of them to complete the survey in 2017.
Acceleration in new funds secured (26 percent) and cash income received (24 percent) in 2015 to
record levels is a matter for congratulation on several counts. It reflects strong growth in giving to
Go8 and, encouragingly, to non-Go8 universities in particular. This growth has continued
notwithstanding an economy that was less confident than in recent years and despite political
uncertainty over funding structures and deregulation. We can see that the right fundraising
behaviour, consistently and professionally followed, produces satisfying results.
2015 has been an exceptional year for income from bequests (standing out more sharply also
because of a weaker performance in 2014). This income strand is steadily strengthening, as
universities come to understand the importance of sustaining long-term relationships with donors.
Every university should pay consistent attention to “planned giving” at a time when we can expect a
massive intergenerational shift in wealth in the region – further fuelled by rising property prices in
our cities.
The headline-grabbing 8-figure gifts that are the real powerhouse of philanthropic success have
been achieved more broadly in 2015, and happily we know there will be more such transformative
gifts to be reported in future iterations of the survey. It is a welcome fact that there were 70 pledges
of $1m or more, with a 60% increase in 7-figure gifts to non-Go8 institutions. There is no question
that the oldest universities start the process of engaging their alumni and friends with some
advantages. But these substantial gifts to institutions beyond “the usual suspects” should encourage
all Australasian universities to develop advancement initiatives focused on their particular strengths
and opportunities. It is striking that, while alumni of Go8 universities are more generous to their
alma mater than other graduates, non-alumni donors are evenly divided between Go8 and non-Go8
institutions. That suggests the universities concerned are doing a fine job in telling the story:
presenting their philanthropic projects not as a matter of obligation, or “giving back”, but more as a
good cause, a project worthy of investment, regardless of whether the donor is a graduate, a
student’s parent, a resident of the community or an individual, trust or company who cares about an
area where the university has real strengths. “Giving forward”, in fact.
3 | Copyright CASE 2016 | Charitable Giving to Universities in Australia and New Zealand 2013 – 2015
Last year’s report encouraged advancement offices to rebalance investment slightly in favour of
alumni relations, as distinct from fundraising teams. We are seeing signs now of a shift from the era
when alumni relations was somewhat nervously characterised as “friend-raising” to a more
purposeful, strategic and measurable engagement with an institution’s supporters en masse.
So there is much to applaud in the story these figures reveal – but no room for complacency. It must
be the case that most universities are still performing below capacity on their advancement
potential. One reason for this is the ongoing frustration generated by the shortage of appropriate
fundraising professionals. We have all found that the right people are hard to find and difficult to
keep. If we could double our fundraising teams, the resulting impact would be phenomenal.
Encouragingly, a number of initiatives are taking shape to help “grow our own” in the longer term,
including the welcome introduction in Australia of CASE Asia-Pacific’s Educational Fundraising
Graduate Trainee program, pioneered in Europe.
For these and other reasons, we are grateful to our colleagues at CASE for their support and for the
use of the Ross-CASE1 survey instrument, which allows meaningful comparisons with UK institutions.
We would like to thank all those universities who participated in the survey this year and to
encourage a still wider group to get into better fundraising shape by doing so next year. It is in the
interests of advancement professionals, university leaders and donors alike that we should be
rigorous in our practice and accountable in our reporting through this means.
Tim Dolan, Vice Principal (Advancement), University of Sydney
Chair, Go8 Chief Advancement Officers
1 The Ross-CASE survey is annually performed by CASE Europe and provides an estimate of the overall state of
philanthropic giving to the higher education sector and is a key source of information on this subject in the UK.

4 | Copyright CASE 2016 | Charitable Giving to Universities in Australia and New Zealand 2013 – 2015
1 Executive summary
The survey Supporting Document prescribes definitions for recording philanthropic income. As
per the document the two main methods of reporting philanthropic income are:
New funds secured reflects the success of current fundraising activity. It includes new gifts
and confirmed pledges committed in the year. This includes both new single cash gifts as
well as the full value of new confirmed pledges. It does not include cash payments made
against gift pledges made in previous.
Cash income received reflects the success of both current and previous years’ fundraising
activity. It shows all cash received in the year, including new single cash gifts as well as
payments made on pledges.
1.1 Findings
New funds secured
The total amount of philanthropic income secured in new funds increased by 26 percent since
2014 and reached $538.19m in 2015. The number of confirmed pledges over $1m dollars was 70
in 2015, 15 percent more than in 2014. Non-Go8 institutions saw a 60 percent increase and Go8
institutions saw a 6 percent increase since 2014 in the number of gifts of million dollar plus
pledges secured.
Cash income received
Total cash income received increased by 24 percent since 2014 to $392.83m in 2015. The total
number of gifts over $1m in 2015 (74) was 72 percent higher than in 2014 (43). This was a
significantly large increase and is explained by the increase in number of million dollar plus gifts
at both Go8 and non-Go8 institutions. Total cash income from bequests was $72.64m in 2015,
162 percent higher than the amount received in bequests in 2014 ($27.70m).
Annual funds
Total new funds secured by annual funds was $13.14m in 2015 and cash income received by
annual funds was $10.92m. While cash income received by annual funds remained consistent
with previous years, new funds secured by annual funds increased by 15 percent since 2014.
Donors
The total number of donors and total number of alumni donors reached a peak of 60,452 and
33,442 respectively in 2015. Total number of donors increased by 23 percent since 2014, with
non-Go8 institutions reporting a 48 percent increase. The total number of contactable alumni
was also at its highest in 2015, at nearly 3.29 million (median of 136,199 alumni). The number of
alumni making gifts represents 0.71 percent of the total number of contactable alumni in 2015,
this has increased by 0.34 percentage points since 2013 when it was 0.37 percent. In 2015, non-
alumni donors accounted for approximately 40 percent of total donors.
5 | Copyright CASE 2016 | Charitable Giving to Universities in Australia and New Zealand 2013 – 2015
Investment in fundraising and alumni relations
In 2015, the total investment in fundraising was $65.51m being 1.8 times more than the total
investment in alumni relations at $36.53m. Fundraising staff costs and non-staff costs were
$45.75m and $19.76m respectively and alumni relations staff costs and non-staff costs were
$25.60m and $10.93m respectively. Alumni magazine production and distribution costs (not
included in alumni relations non-staff costs above) stood at $5.22m in 2015.
Institutions were investing 21 cents on fundraising activities per $1 in new funds raised and 28
cents on fundraising activities per $1 in cash income received.
Total fundraising costs increased by 11 percent and alumni relations costs by five percent since
2014. The increase in fundraising costs was fuelled by a significant increase in non-staff
fundraising costs of 33 percent since 2014.
Both fundraising staff numbers and alumni relations staff numbers increased by 13 percent since
2014 with 406 fundraising staff (from 359 in 2014) and 226 alumni relations staff (from 200 in
2014) in employment in 2015.
6 | Copyright CASE 2016 | Charitable Giving to Universities in Australia and New Zealand 2013 – 2015
2 Key indicators
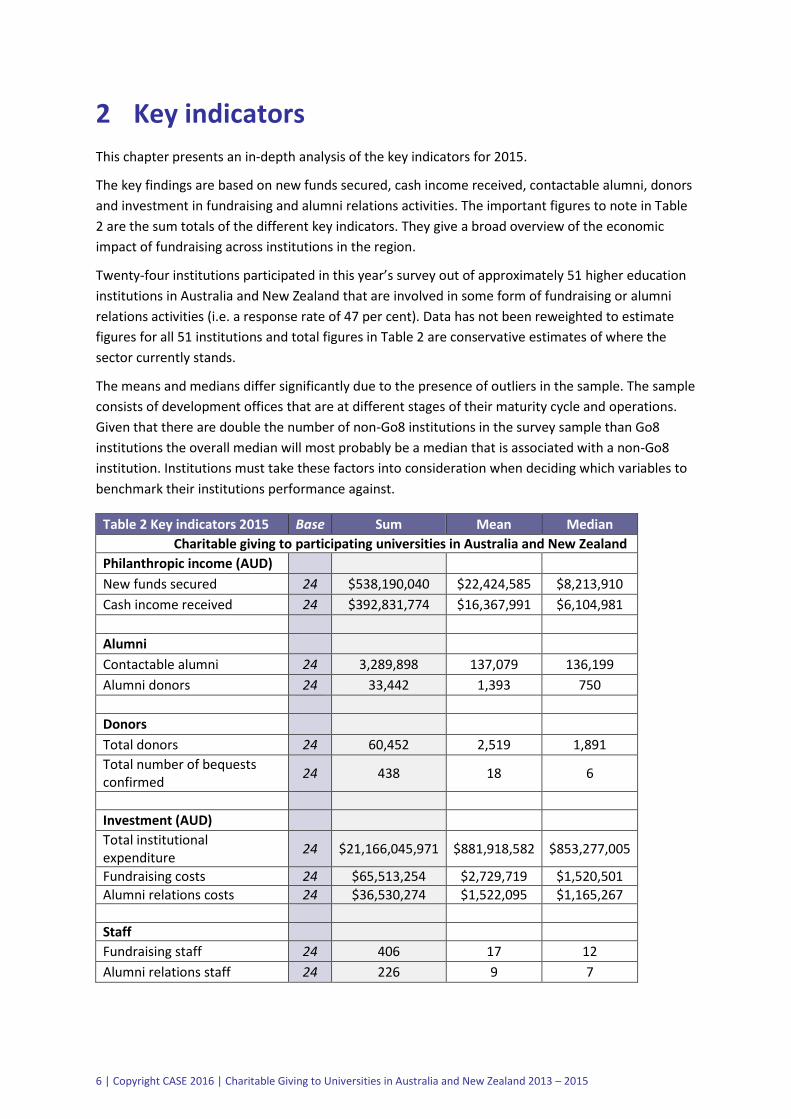
This chapter presents an in-depth analysis of the key indicators for 2015.
The key findings are based on new funds secured, cash income received, contactable alumni, donors
and investment in fundraising and alumni relations activities. The important figures to note in Table
2 are the sum totals of the different key indicators. They give a broad overview of the economic
impact of fundraising across institutions in the region.
Twenty-four institutions participated in this year’s survey out of approximately 51 higher education
institutions in Australia and New Zealand that are involved in some form of fundraising or alumni
relations activities (i.e. a response rate of 47 per cent). Data has not been reweighted to estimate
figures for all 51 institutions and total figures in Table 2 are conservative estimates of where the
sector currently stands.
The means and medians differ significantly due to the presence of outliers in the sample. The sample
consists of development offices that are at different stages of their maturity cycle and operations.
Given that there are double the number of non-Go8 institutions in the survey sample than Go8
institutions the overall median will most probably be a median that is associated with a non-Go8
institution. Institutions must take these factors into consideration when deciding which variables to
benchmark their institutions performance against.
Table 2 Key indicators 2015 Base Sum Mean Median
Charitable giving to participating universities in Australia and New Zealand
Philanthropic income (AUD)
New funds secured 24 $538,190,040 $22,424,585 $8,213,910
Cash income received 24 $392,831,774 $16,367,991 $6,104,981
Alumni
Contactable alumni 24 3,289,898 137,079 136,199
Alumni donors 24 33,442 1,393 750
Donors
Total donors 24 60,452 2,519 1,891
Total number of bequests confirmed
24 438 18 6
Investment (AUD)
Total institutional expenditure
24 $21,166,045,971 $881,918,582 $853,277,005
Fundraising costs 24 $65,513,254 $2,729,719 $1,520,501
Alumni relations costs 24 $36,530,274 $1,522,095 $1,165,267
Staff
Fundraising staff 24 406 17 12
Alumni relations staff 24 226 9 7
7 | Copyright CASE 2016 | Charitable Giving to Universities in Australia and New Zealand 2013 – 2015
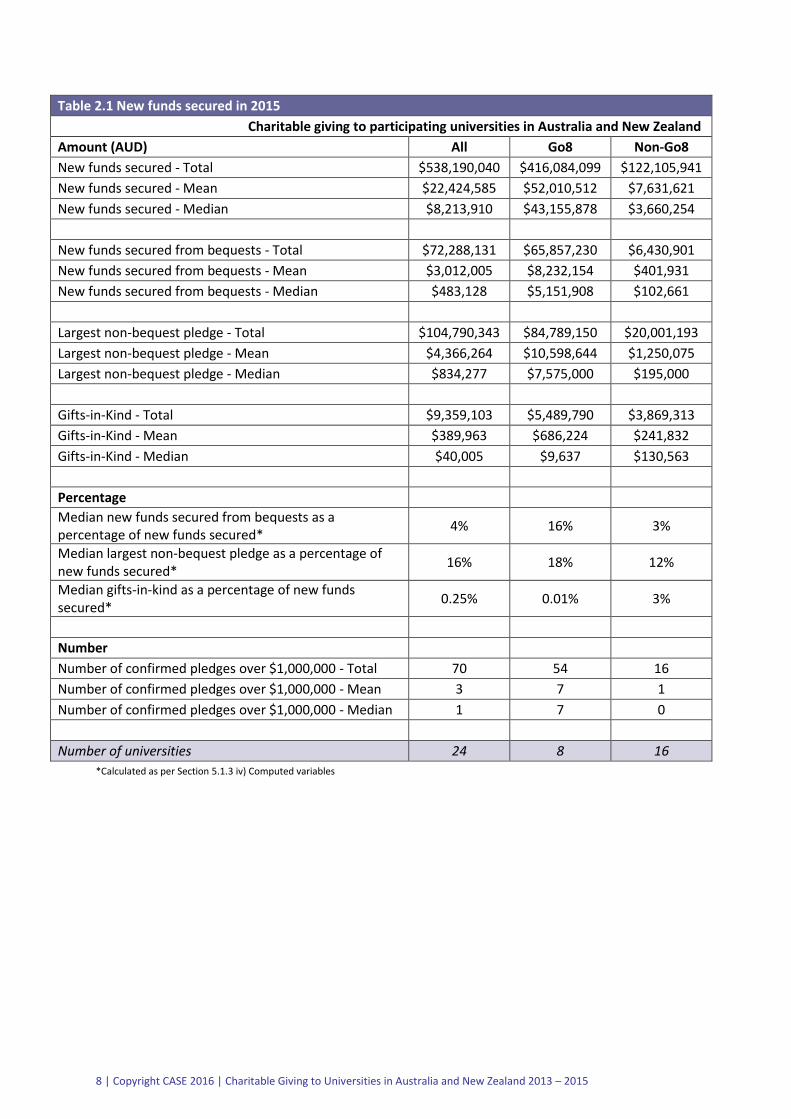
2.1 New funds secured 2015 New funds secured enables an institution to see the true impact of philanthropic support and its
future pipeline, not just in the current financial period but over a number of years. It can assist in
demonstrating the success of an advancement program.
The median value for new funds secured and new funds secured from bequests was $8.21m and
$483,128 respectively in 2015. Mean and median figures for new funds secured do not vary
significantly for Go8 institutions ($52.01m and $43.16m respectively) while they vary for non-Go8
institutions ($7.63m and $3.66m respectively) in 2015.
The number of confirmed pledges of more than $1m was 70 in 2015, 54 of which came from Go8
institutions. It is also interesting to note that bequest gifts in 2015 contribute to 16% of Go8
institutions’ total new funds secured while only three percent of non-Go8 institutions’ new funds
secured is covered by bequests. Both Go8 and non-Go8 institutions were considerably dependent on
their institution’s largest non-bequest pledge generating 18 percent and 12 percent of their total
new funds secured respectively in 2015 from such large pledges.
On ranking the values from highest to lowest, the top-five largest non-bequest pledges cover 79
percent of the total value of $104.79m while the bottom five account for only 0.24 percent. Three
out of five institutions received their largest non-bequest pledge from trusts and foundations and in
income terms, trusts and foundations contributed to 63 percent of the total income from the largest
non-bequest pledges.
8 | Copyright CASE 2016 | Charitable Giving to Universities in Australia and New Zealand 2013 – 2015
Table 2.1 New funds secured in 2015
Charitable giving to participating universities in Australia and New Zealand
Amount (AUD) All Go8 Non-Go8
New funds secured - Total $538,190,040 $416,084,099 $122,105,941
New funds secured - Mean $22,424,585 $52,010,512 $7,631,621
New funds secured - Median $8,213,910 $43,155,878 $3,660,254
New funds secured from bequests - Total $72,288,131 $65,857,230 $6,430,901
New funds secured from bequests - Mean $3,012,005 $8,232,154 $401,931
New funds secured from bequests - Median $483,128 $5,151,908 $102,661
Largest non-bequest pledge - Total $104,790,343 $84,789,150 $20,001,193
Largest non-bequest pledge - Mean $4,366,264 $10,598,644 $1,250,075
Largest non-bequest pledge - Median $834,277 $7,575,000 $195,000
Gifts-in-Kind - Total $9,359,103 $5,489,790 $3,869,313
Gifts-in-Kind - Mean $389,963 $686,224 $241,832
Gifts-in-Kind - Median $40,005 $9,637 $130,563
Percentage
Median new funds secured from bequests as a percentage of new funds secured*
4% 16% 3%
Median largest non-bequest pledge as a percentage of new funds secured*
16% 18% 12%
Median gifts-in-kind as a percentage of new funds secured*
0.25% 0.01% 3%
Number
Number of confirmed pledges over $1,000,000 - Total 70 54 16
Number of confirmed pledges over $1,000,000 - Mean 3 7 1
Number of confirmed pledges over $1,000,000 - Median 1 7 0
Number of universities 24 8 16
*Calculated as per Section 5.1.3 iv) Computed variables
9 | Copyright CASE 2016 | Charitable Giving to Universities in Australia and New Zealand 2013 – 2015
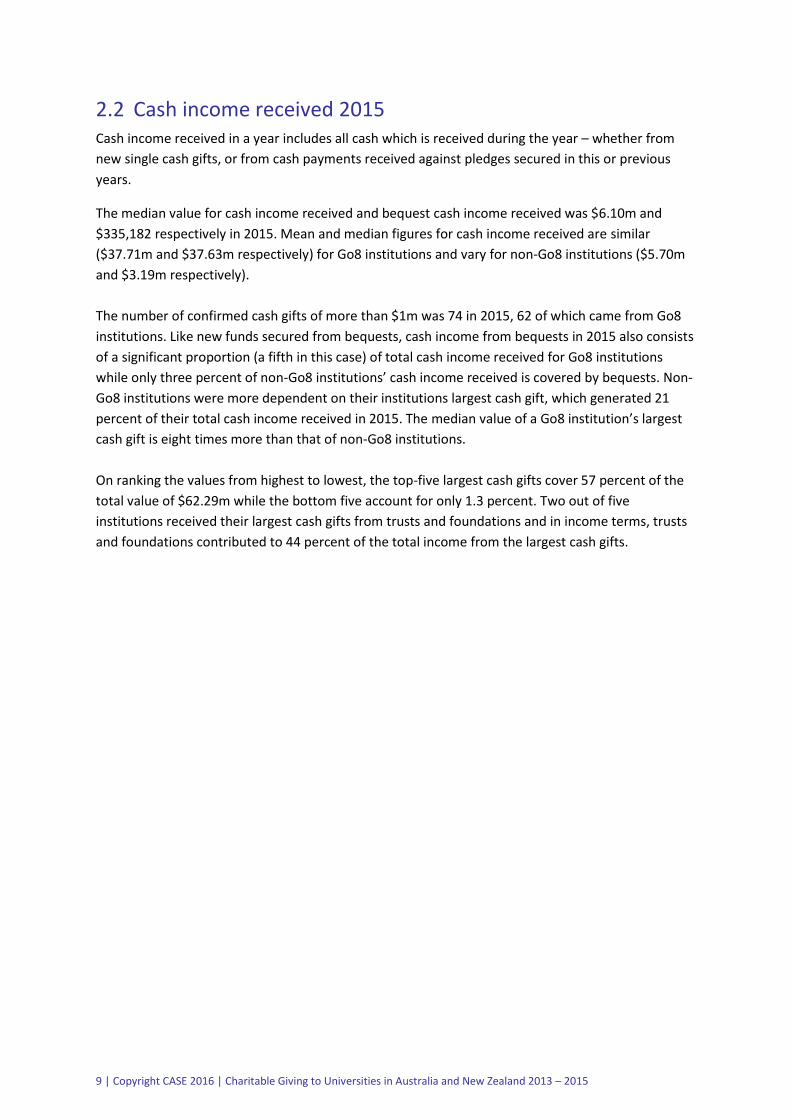
2.2 Cash income received 2015 Cash income received in a year includes all cash which is received during the year – whether from
new single cash gifts, or from cash payments received against pledges secured in this or previous
years.
The median value for cash income received and bequest cash income received was $6.10m and
$335,182 respectively in 2015. Mean and median figures for cash income received are similar
($37.71m and $37.63m respectively) for Go8 institutions and vary for non-Go8 institutions ($5.70m
and $3.19m respectively).
The number of confirmed cash gifts of more than $1m was 74 in 2015, 62 of which came from Go8
institutions. Like new funds secured from bequests, cash income from bequests in 2015 also consists
of a significant proportion (a fifth in this case) of total cash income received for Go8 institutions
while only three percent of non-Go8 institutions’ cash income received is covered by bequests. Non-
Go8 institutions were more dependent on their institutions largest cash gift, which generated 21
percent of their total cash income received in 2015. The median value of a Go8 institution’s largest
cash gift is eight times more than that of non-Go8 institutions.
On ranking the values from highest to lowest, the top-five largest cash gifts cover 57 percent of the
total value of $62.29m while the bottom five account for only 1.3 percent. Two out of five
institutions received their largest cash gifts from trusts and foundations and in income terms, trusts
and foundations contributed to 44 percent of the total income from the largest cash gifts.
10 | Copyright CASE 2016 | Charitable Giving to Universities in Australia and New Zealand 2013 – 2015
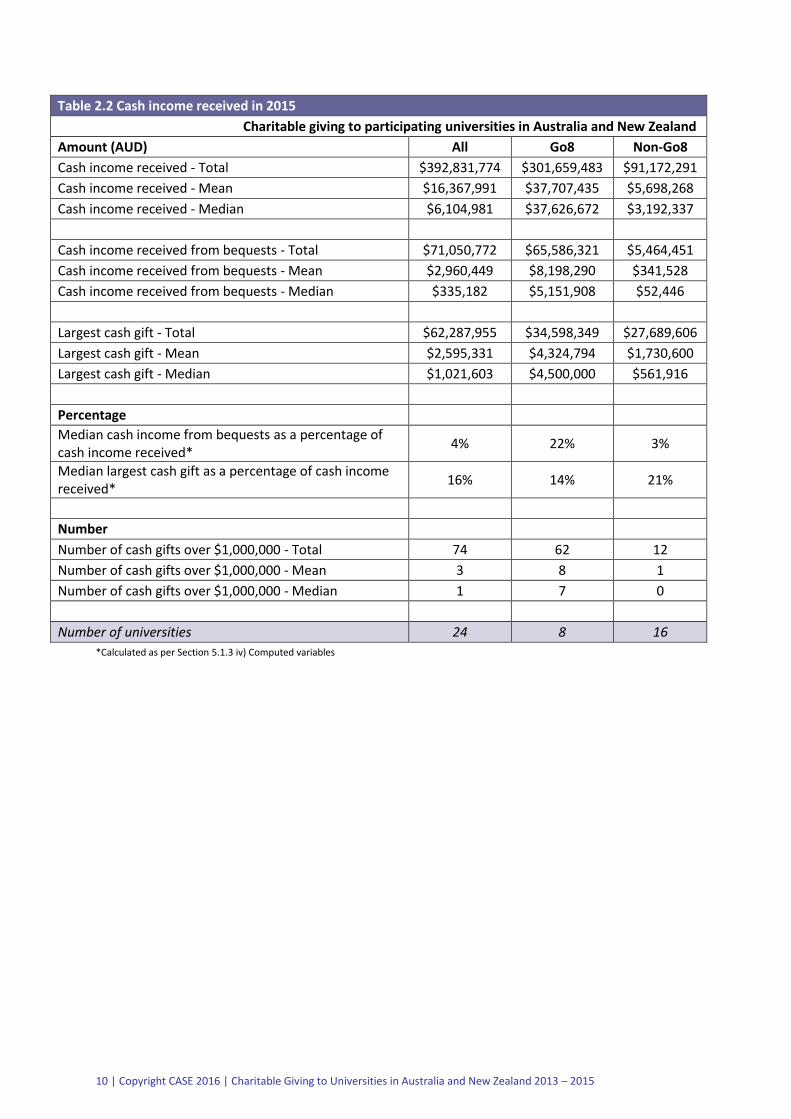
Table 2.2 Cash income received in 2015
Charitable giving to participating universities in Australia and New Zealand
Amount (AUD) All Go8 Non-Go8
Cash income received - Total $392,831,774 $301,659,483 $91,172,291
Cash income received - Mean $16,367,991 $37,707,435 $5,698,268
Cash income received - Median $6,104,981 $37,626,672 $3,192,337
Cash income received from bequests - Total $71,050,772 $65,586,321 $5,464,451
Cash income received from bequests - Mean $2,960,449 $8,198,290 $341,528
Cash income received from bequests - Median $335,182 $5,151,908 $52,446
Largest cash gift - Total $62,287,955 $34,598,349 $27,689,606
Largest cash gift - Mean $2,595,331 $4,324,794 $1,730,600
Largest cash gift - Median $1,021,603 $4,500,000 $561,916
Percentage
Median cash income from bequests as a percentage of cash income received*
4% 22% 3%
Median largest cash gift as a percentage of cash income received*
16% 14% 21%
Number
Number of cash gifts over $1,000,000 - Total 74 62 12
Number of cash gifts over $1,000,000 - Mean 3 8 1
Number of cash gifts over $1,000,000 - Median 1 7 0
Number of universities 24 8 16
*Calculated as per Section 5.1.3 iv) Computed variables

11 | Copyright CASE 2016 | Charitable Giving to Universities in Australia and New Zealand 2013 – 2015
2.3 Annual funds 2015 Participating institutions secured $13.14m in new funds for annual funds and received $10.92m in
cash income. Median value of annual funds from new funds for Go8 institutions was $664,027 and
median value of annual funds from cash income received was $568,824, compared to $160,785 for
non-Go8 institutions in new funds and $104,404 in cash income.
Participating institutions secured 2.9 percent of total new funds and 3.2 percent of total cash income
received from their annual fund.
Institutions vary significantly in terms of annual fund income as the mean and median values differ
across the sample and within the Go8 and non-Go8 groups.
Table 2.3 Annual fund income in 2015
Charitable giving to participating universities in Australia and New Zealand
Amount (AUD) All Go8 Non-Go8
Annual fund income secured - Total $13,142,369 $9,924,585 $3,217,784
Annual fund income secured - Mean $547,599 $1,240,573 $201,111
Annual fund income secured - Median $264,035 $664,027 $160,785
Annual fund income received in cash - Total $10,922,590 $8,476,243 $2,446,347
Annual fund income received in cash - Mean $455,108 $1,059,530 $152,897
Annual fund income received in cash - Median $201,041 $568,824 $104,404
Percentage
Median annual fund income secured as a percentage of new funds secured*
2.9% 2.4% 3.7%
Median annual fund income received in cash as a percentage of cash income received*
3.2% 2.7% 3.7%
Number of universities 24 8 16
*Calculated as per Section 5.1.3 iv) Computed variables
12 | Copyright CASE 2016 | Charitable Giving to Universities in Australia and New Zealand 2013 – 2015
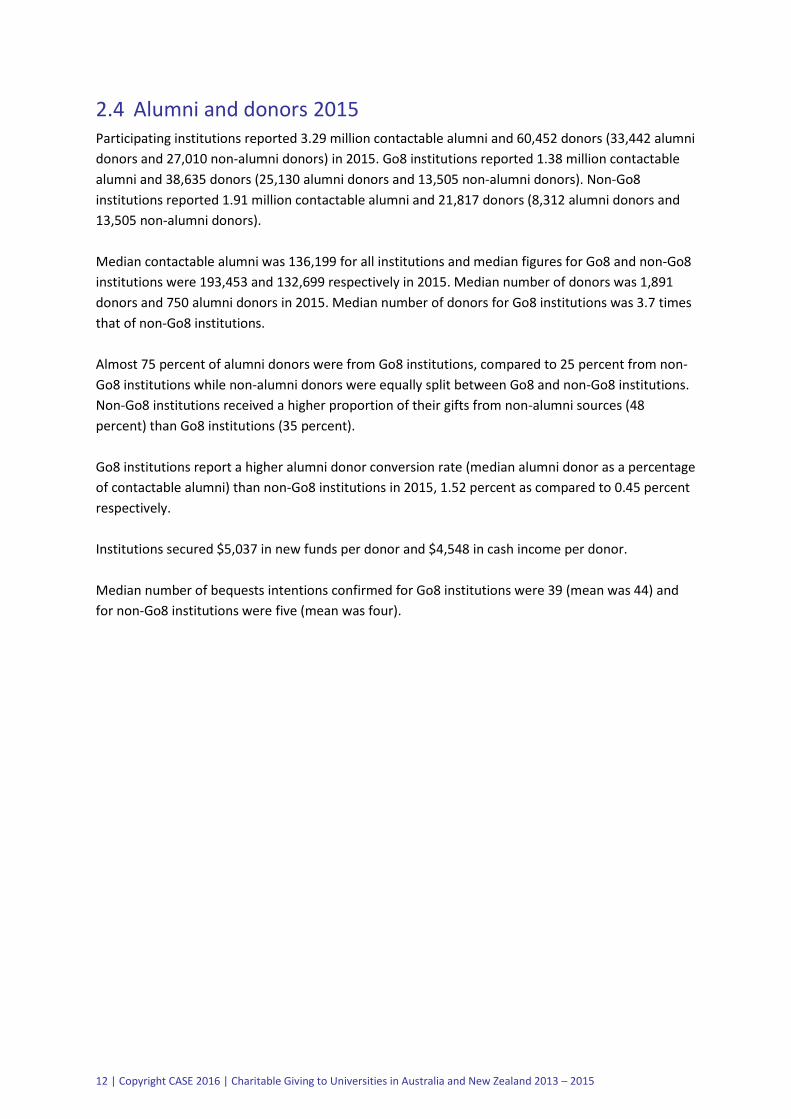
2.4 Alumni and donors 2015 Participating institutions reported 3.29 million contactable alumni and 60,452 donors (33,442 alumni
donors and 27,010 non-alumni donors) in 2015. Go8 institutions reported 1.38 million contactable
alumni and 38,635 donors (25,130 alumni donors and 13,505 non-alumni donors). Non-Go8
institutions reported 1.91 million contactable alumni and 21,817 donors (8,312 alumni donors and
13,505 non-alumni donors).
Median contactable alumni was 136,199 for all institutions and median figures for Go8 and non-Go8
institutions were 193,453 and 132,699 respectively in 2015. Median number of donors was 1,891
donors and 750 alumni donors in 2015. Median number of donors for Go8 institutions was 3.7 times
that of non-Go8 institutions.
Almost 75 percent of alumni donors were from Go8 institutions, compared to 25 percent from non-
Go8 institutions while non-alumni donors were equally split between Go8 and non-Go8 institutions.
Non-Go8 institutions received a higher proportion of their gifts from non-alumni sources (48
percent) than Go8 institutions (35 percent).
Go8 institutions report a higher alumni donor conversion rate (median alumni donor as a percentage
of contactable alumni) than non-Go8 institutions in 2015, 1.52 percent as compared to 0.45 percent
respectively.
Institutions secured $5,037 in new funds per donor and $4,548 in cash income per donor.
Median number of bequests intentions confirmed for Go8 institutions were 39 (mean was 44) and
for non-Go8 institutions were five (mean was four).
13 | Copyright CASE 2016 | Charitable Giving to Universities in Australia and New Zealand 2013 – 2015
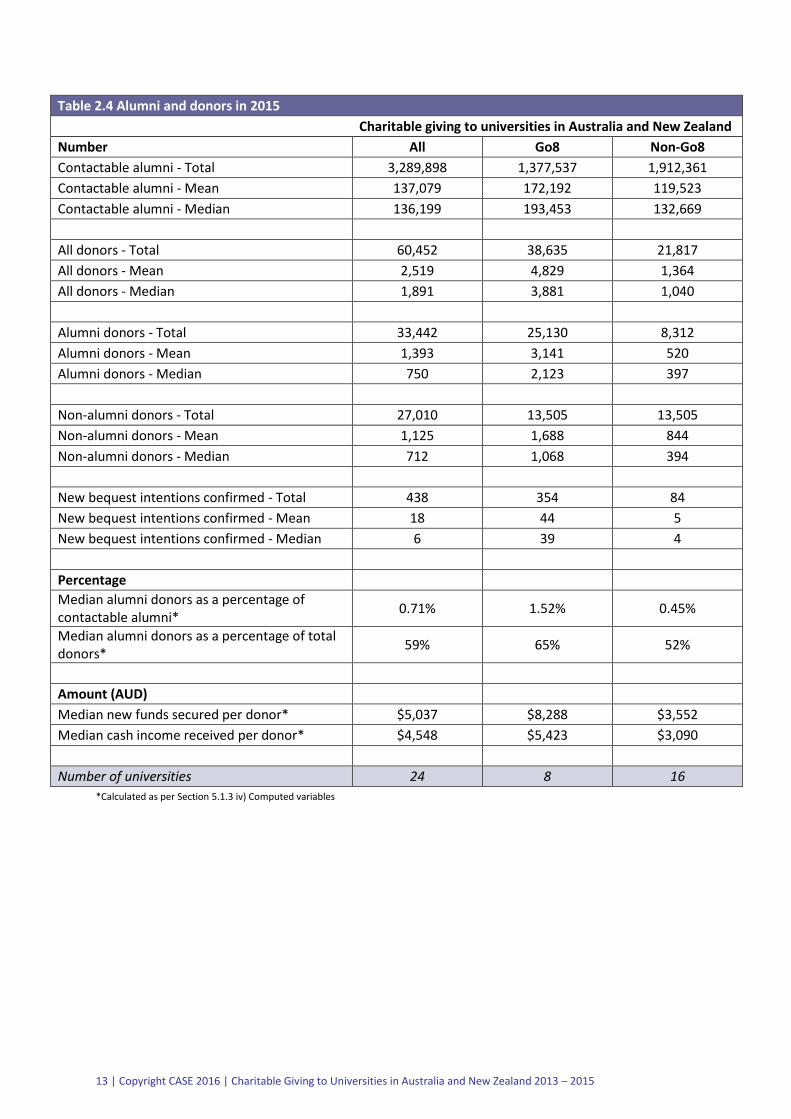
Table 2.4 Alumni and donors in 2015
Charitable giving to universities in Australia and New Zealand
Number All Go8 Non-Go8
Contactable alumni - Total 3,289,898 1,377,537 1,912,361
Contactable alumni - Mean 137,079 172,192 119,523
Contactable alumni - Median 136,199 193,453 132,669
All donors - Total 60,452 38,635 21,817
All donors - Mean 2,519 4,829 1,364
All donors - Median 1,891 3,881 1,040
Alumni donors - Total 33,442 25,130 8,312
Alumni donors - Mean 1,393 3,141 520
Alumni donors - Median 750 2,123 397
Non-alumni donors - Total 27,010 13,505 13,505
Non-alumni donors - Mean 1,125 1,688 844
Non-alumni donors - Median 712 1,068 394
New bequest intentions confirmed - Total 438 354 84
New bequest intentions confirmed - Mean 18 44 5
New bequest intentions confirmed - Median 6 39 4
Percentage
Median alumni donors as a percentage of contactable alumni*
0.71% 1.52% 0.45%
Median alumni donors as a percentage of total donors*
59% 65% 52%
Amount (AUD)
Median new funds secured per donor* $5,037 $8,288 $3,552
Median cash income received per donor* $4,548 $5,423 $3,090
Number of universities 24 8 16
*Calculated as per Section 5.1.3 iv) Computed variables
14 | Copyright CASE 2016 | Charitable Giving to Universities in Australia and New Zealand 2013 – 2015
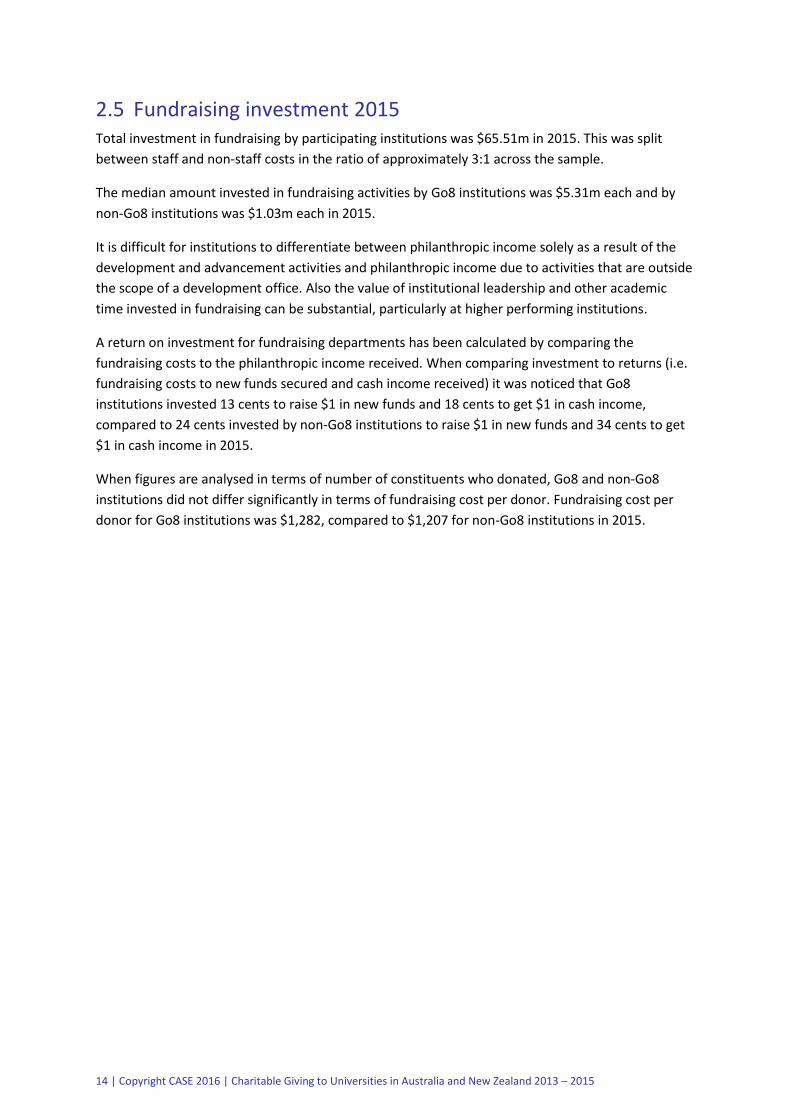
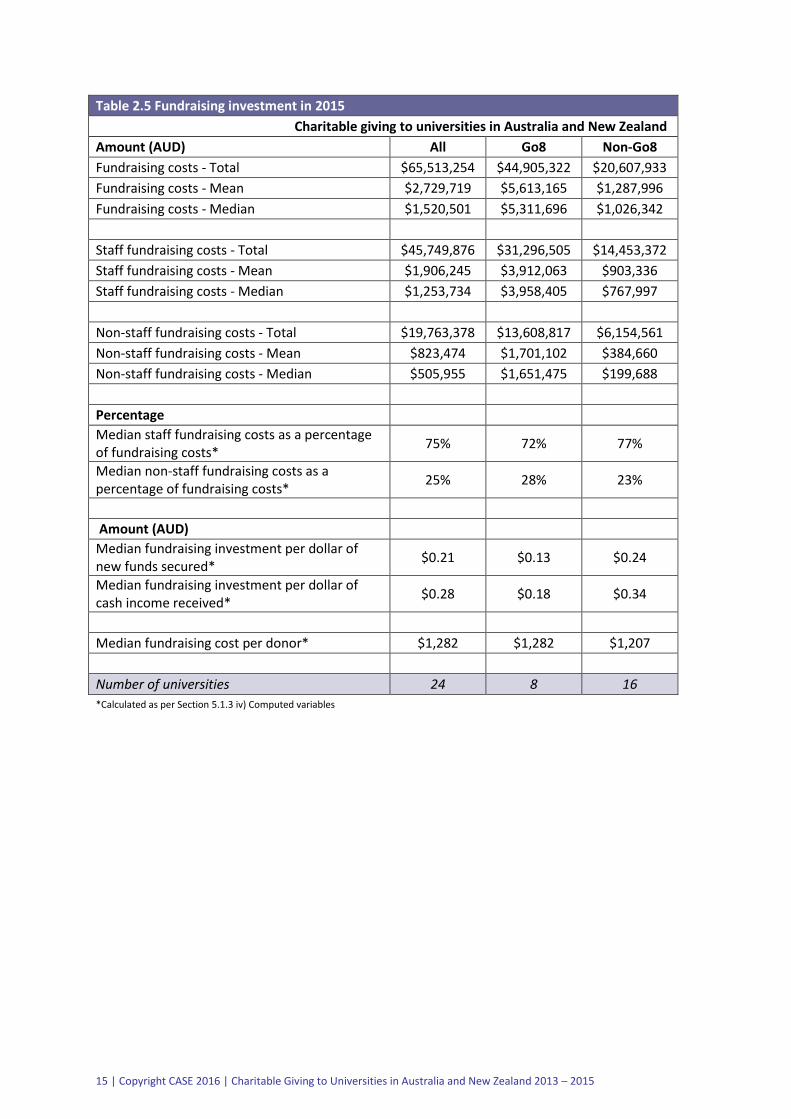
2.5 Fundraising investment 2015 Total investment in fundraising by participating institutions was $65.51m in 2015. This was split
between staff and non-staff costs in the ratio of approximately 3:1 across the sample.
The median amount invested in fundraising activities by Go8 institutions was $5.31m each and by
non-Go8 institutions was $1.03m each in 2015.
It is difficult for institutions to differentiate between philanthropic income solely as a result of the
development and advancement activities and philanthropic income due to activities that are outside
the scope of a development office. Also the value of institutional leadership and other academic
time invested in fundraising can be substantial, particularly at higher performing institutions.
A return on investment for fundraising departments has been calculated by comparing the
fundraising costs to the philanthropic income received. When comparing investment to returns (i.e.
fundraising costs to new funds secured and cash income received) it was noticed that Go8
institutions invested 13 cents to raise $1 in new funds and 18 cents to get $1 in cash income,
compared to 24 cents invested by non-Go8 institutions to raise $1 in new funds and 34 cents to get
$1 in cash income in 2015.
When figures are analysed in terms of number of constituents who donated, Go8 and non-Go8
institutions did not differ significantly in terms of fundraising cost per donor. Fundraising cost per
donor for Go8 institutions was $1,282, compared to $1,207 for non-Go8 institutions in 2015.
15 | Copyright CASE 2016 | Charitable Giving to Universities in Australia and New Zealand 2013 – 2015
Table 2.5 Fundraising investment in 2015
Charitable giving to universities in Australia and New Zealand
Amount (AUD) All Go8 Non-Go8
Fundraising costs - Total $65,513,254 $44,905,322 $20,607,933
Fundraising costs - Mean $2,729,719 $5,613,165 $1,287,996
Fundraising costs - Median $1,520,501 $5,311,696 $1,026,342
Staff fundraising costs - Total $45,749,876 $31,296,505 $14,453,372
Staff fundraising costs - Mean $1,906,245 $3,912,063 $903,336
Staff fundraising costs - Median $1,253,734 $3,958,405 $767,997
Non-staff fundraising costs - Total $19,763,378 $13,608,817 $6,154,561
Non-staff fundraising costs - Mean $823,474 $1,701,102 $384,660
Non-staff fundraising costs - Median $505,955 $1,651,475 $199,688
Percentage
Median staff fundraising costs as a percentage of fundraising costs*
75% 72% 77%
Median non-staff fundraising costs as a percentage of fundraising costs*
25% 28% 23%
Amount (AUD)
Median fundraising investment per dollar of new funds secured*
$0.21 $0.13 $0.24
Median fundraising investment per dollar of cash income received*
$0.28 $0.18 $0.34
Median fundraising cost per donor* $1,282 $1,282 $1,207
Number of universities 24 8 16
*Calculated as per Section 5.1.3 iv) Computed variables
16 | Copyright CASE 2016 | Charitable Giving to Universities in Australia and New Zealand 2013 – 2015
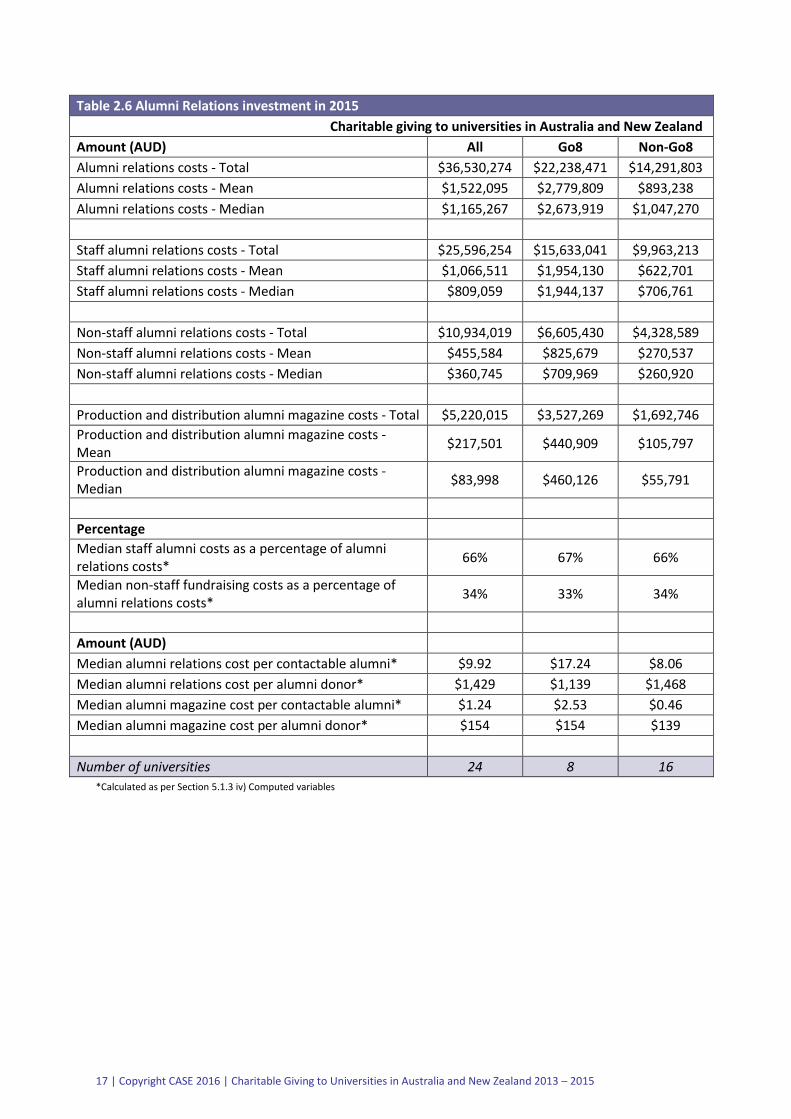
2.6 Alumni relations investment 2015
Participating institutions invested $36.53m in alumni relations activities, with median alumni
relations costs being $1.17m. This investment excludes costs to produce and distribute alumni
magazines, which was $5.22m with a median alumni magazine cost of $83,998. Magazine costs
varied across non-Go8 institutions as noticed by the difference in the mean and median figures.
Go8 institutions invested $17.24 in alumni relations cost per contactable alumni and $1,139 in
alumni relations costs per alumni donor and non-Go8 institutions invested $8.06 in alumni relations
cost per contactable alumni and $1,468 in alumni relations costs per alumni donor. Go8 institutions
invested $2.53 in alumni magazine costs per contactable alumni and $154 in alumni magazine costs
per alumni donor whereas non-Go8 institutions invested only $0.46 in alumni magazine costs per
contactable alumni and $139 in alumni magazine costs per alumni donor.
The median ratio of fundraising investment to investment in alumni relations excluding magazines is
2:1 for Go8 institutions, i.e. the amount they invest in fundraising activities is twice as much as the
amount they invest in alumni relations activities. This ratio for non-Go8 institutions is 1.4:1, they
invest 1.4 times the amount they invest in alumni relations activities, on fundraising activities.
17 | Copyright CASE 2016 | Charitable Giving to Universities in Australia and New Zealand 2013 – 2015
Table 2.6 Alumni Relations investment in 2015
Charitable giving to universities in Australia and New Zealand
Amount (AUD) All Go8 Non-Go8
Alumni relations costs - Total $36,530,274 $22,238,471 $14,291,803
Alumni relations costs - Mean $1,522,095 $2,779,809 $893,238
Alumni relations costs - Median $1,165,267 $2,673,919 $1,047,270
Staff alumni relations costs - Total $25,596,254 $15,633,041 $9,963,213
Staff alumni relations costs - Mean $1,066,511 $1,954,130 $622,701
Staff alumni relations costs - Median $809,059 $1,944,137 $706,761
Non-staff alumni relations costs - Total $10,934,019 $6,605,430 $4,328,589
Non-staff alumni relations costs - Mean $455,584 $825,679 $270,537
Non-staff alumni relations costs - Median $360,745 $709,969 $260,920
Production and distribution alumni magazine costs - Total $5,220,015 $3,527,269 $1,692,746
Production and distribution alumni magazine costs - Mean
$217,501 $440,909 $105,797
Production and distribution alumni magazine costs - Median
$83,998 $460,126 $55,791
Percentage
Median staff alumni costs as a percentage of alumni relations costs*
66% 67% 66%
Median non-staff fundraising costs as a percentage of alumni relations costs*
34% 33% 34%
Amount (AUD)
Median alumni relations cost per contactable alumni* $9.92 $17.24 $8.06
Median alumni relations cost per alumni donor* $1,429 $1,139 $1,468
Median alumni magazine cost per contactable alumni* $1.24 $2.53 $0.46
Median alumni magazine cost per alumni donor* $154 $154 $139
Number of universities 24 8 16
*Calculated as per Section 5.1.3 iv) Computed variables
18 | Copyright CASE 2016 | Charitable Giving to Universities in Australia and New Zealand 2013 – 2015
2.7 Institutional expenditure and advancement staff 2015
All participating institutions collectively had an annual expenditure of $21.17b in 2015. Median
fundraising costs as a percentage of institutional expenditure was 0.25 percent and median alumni
relations costs as a percentage of institutions expenditure was 0.15 percent. This totals 0.4 percent
of total institutional expenditure being invested in fundraising and alumni relations activities,
equivalent to over $102.04m.
The participating institutions’ fundraising workforce stood at 406 FTE staff. Go8 institutions
employed 268 FTE fundraising staff and non-Go8 employed 138 fundraising FTE staff. In alumni
relations, 226 FTE staff members worked across the participating institutions, 150 of which were at
Go8 institutions.
Institutions spent $113,561 per fundraising staff member and each of them can be attributed to
$682,041 in new funds secured and $446,432 in cash income received.
Go8 institutions invested $122,246 per fundraising FTE staff returning $1.50m in new funds secured
and $1.13m in cash income per fundraising FTE staff. Non-Go8 institutions invested $111,721 per
fundraising FTE staff returning $535,687 in new funds secured and $423,074 in cash income per
fundraising FTE staff.

19 | Copyright CASE 2016 | Charitable Giving to Universities in Australia and New Zealand 2013 – 2015
Table 2.7 Institutional expenditure and advancement staff 2015
Charitable giving to universities in Australia and New Zealand
Amount (AUD) All Go8 Non-Go8
Total institutional expenditure - Total $21,166,045,971 $11,688,545,000 $9,477,500,971
Total institutional expenditure - Mean $881,918,582 $1,461,068,125 $592,343,811
Total institutional expenditure - Median $853,277,005 $1,699,975,500 $605,557,500
Percentage
Median fundraising costs as a percentage of institutional expenditure*
0.25% 0.40% 0.23%
Median alumni relations costs as a percentage of institutional expenditure*
0.15% 0.19% 0.14%
Number
Fundraising staff - Total 406 268 138
Fundraising staff - Mean 17 34 9
Fundraising staff - Median 12 34 7
Alumni relations staff - Total 226 150 76
Alumni relations staff - Mean 9 19 5
Alumni relations staff - Median 7 18 5
Amount (AUD)
Median new funds secured per FTE fundraising staff*
$682,041 $1,497,379 $535,687
Median cash income received per FTE fundraising staff*
$446,432 $1,128,568 $423,074
Median fundraising staff cost per FTE fundraising staff*
$113,561 $122,246 $111,721
Median alumni relations staff cost per FTE alumni relations staff*
$102,200 $107,316 $100,680
Number of universities 24 8 16
*Calculated as per Section 5.1.3 iv) Computed variables
20 | Copyright CASE 2016 | Charitable Giving to Universities in Australia and New Zealand 2013 – 2015
3 Trends in key indicators 2013-2015
Trends are calculated using data from institutions that participated and provided information for a
key set of variables for three surveys, 2013, 2014 and 2015. These findings are on a like-for-like basis
and are illustrated in the following charts (all participating institutions, Go8 institutions and non-Go8
institutions).
Below are the highlights of the trends in key indicators:
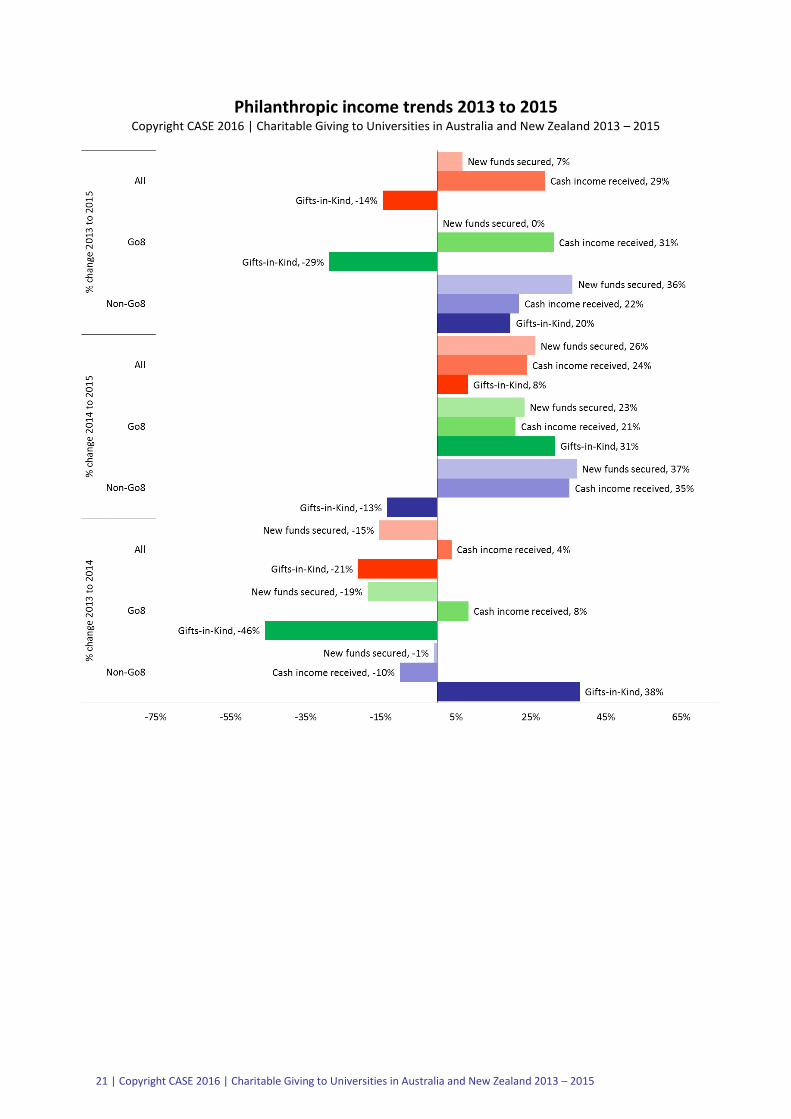
3.1 Philanthropic income New fund secured increased by 26 percent since 2014 after a 15 percent drop from 2013 to
2014.
Cash income received has shown an increase over the years since 2013 with a 29 percent
increase from 2013 to 2015.
Gifts-in-kind decreased by 21 percent from 2013 to 2014 and then increased by 8 percent
from 2014 to 2015.
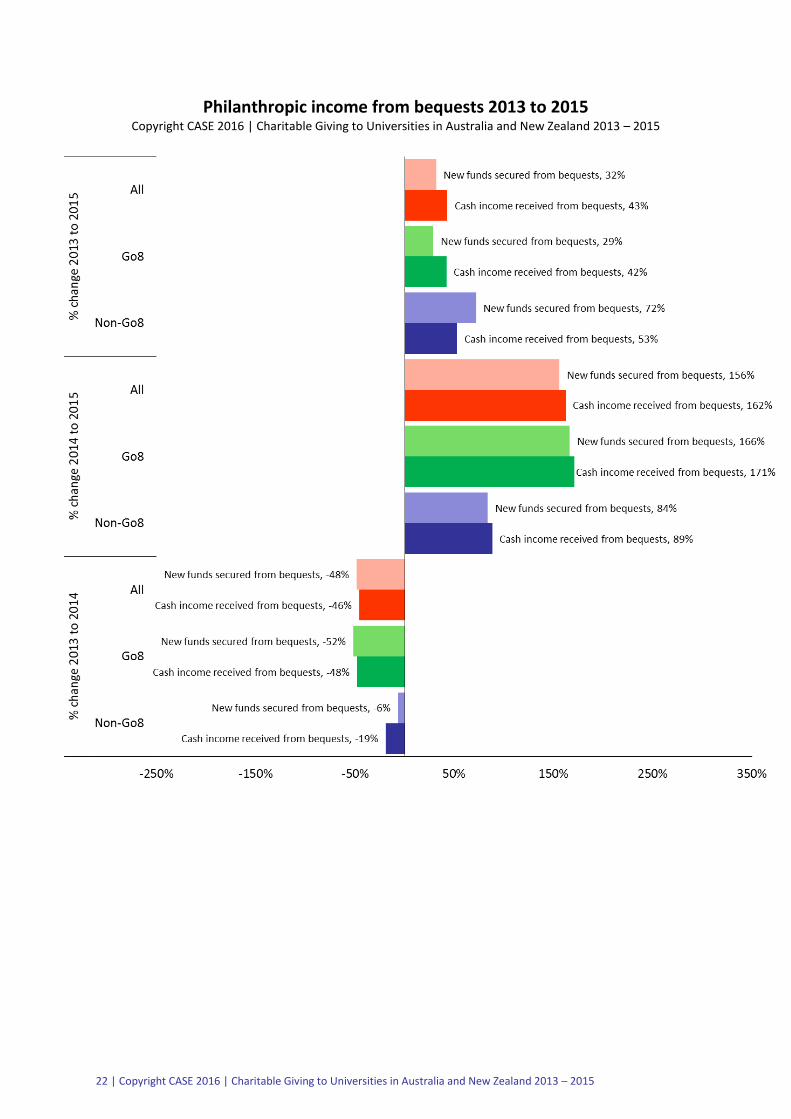
Income from bequests across the 24 institutions, Go8 institutions and the non-Go8
institutions rose considerably from 2014 to 2015.
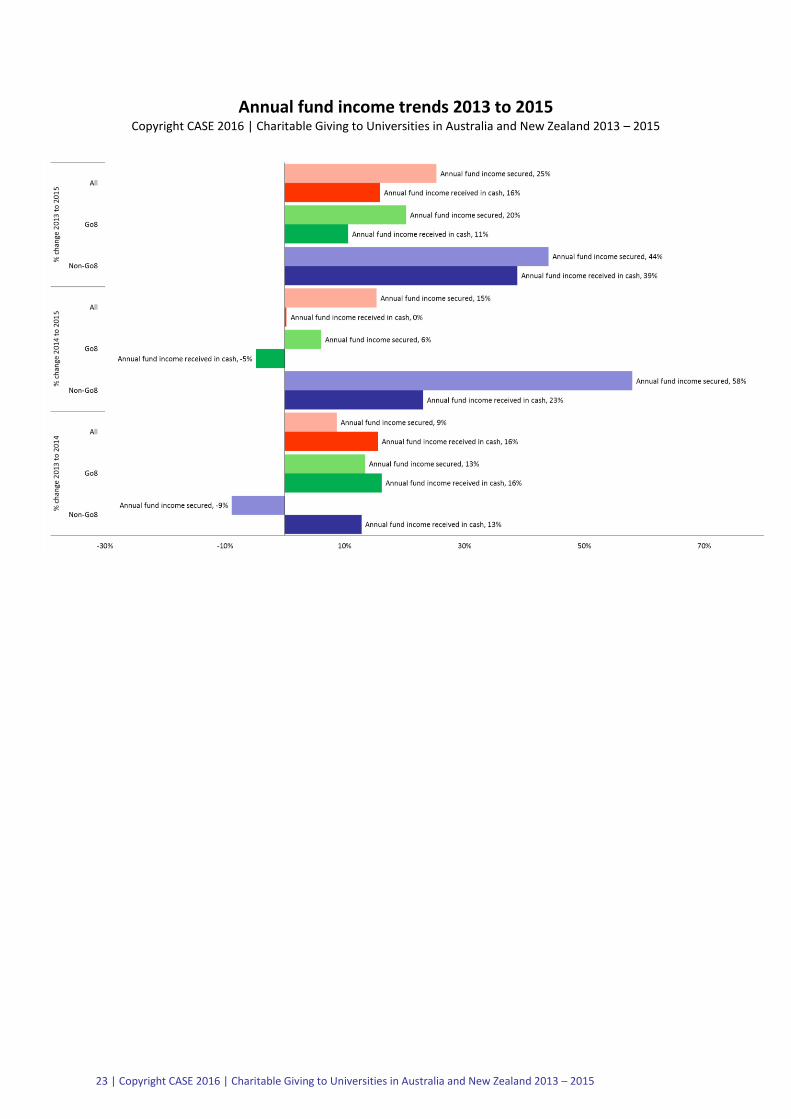
Annual fund income secured increased by 58 percent at non-Go8 institutions from 2014 to
2015 and Go8 institutions saw an increase of six percent in annual fund income secured
during the same time period.
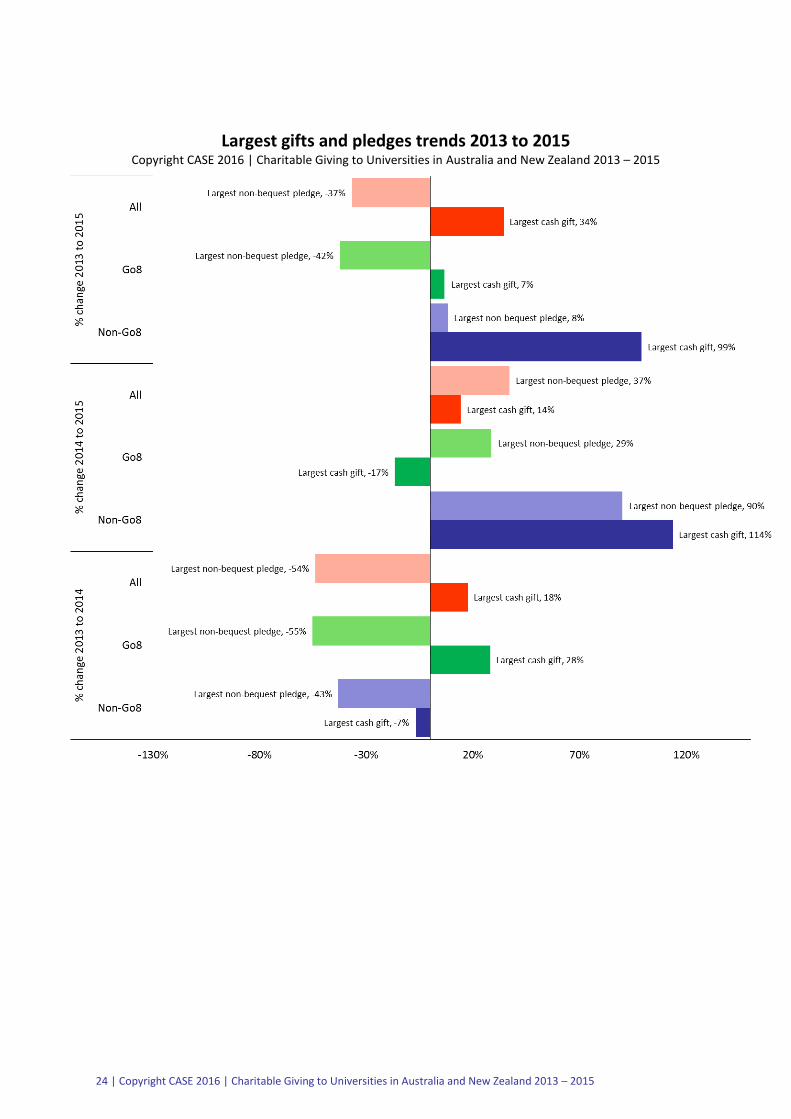
Non-Go8 institutions saw a significant rise in the amount of large gifts and pledges with a 90
percent increase in the amount of largest pledge secured and a 114 percent increase in the
amount of largest cash gift received from 2014 to 2015.
Go8 institutions reported a rise of 172 percent in the number of bequest intentions
confirmed from 2014 to 2015 after an increase of 14 percent from 2013 to 2014. Non-Go8
are consistently reporting an increase of over 40 percent year on year since 2013 on the
number of bequest intentions confirmed.
Number of cash gifts over $1m increased by 140 percent for non-Go8 institutions as
compared to a 63 percent increase for Go8 institutions from 2014 to 2015.
21 | Copyright CASE 2016 | Charitable Giving to Universities in Australia and New Zealand 2013 – 2015
Philanthropic income trends 2013 to 2015 Copyright CASE 2016 | Charitable Giving to Universities in Australia and New Zealand 2013 – 2015
22 | Copyright CASE 2016 | Charitable Giving to Universities in Australia and New Zealand 2013 – 2015
Philanthropic income from bequests 2013 to 2015 Copyright CASE 2016 | Charitable Giving to Universities in Australia and New Zealand 2013 – 2015
23 | Copyright CASE 2016 | Charitable Giving to Universities in Australia and New Zealand 2013 – 2015
Annual fund income trends 2013 to 2015 Copyright CASE 2016 | Charitable Giving to Universities in Australia and New Zealand 2013 – 2015
24 | Copyright CASE 2016 | Charitable Giving to Universities in Australia and New Zealand 2013 – 2015
Largest gifts and pledges trends 2013 to 2015 Copyright CASE 2016 | Charitable Giving to Universities in Australia and New Zealand 2013 – 2015

25 | Copyright CASE 2016 | Charitable Giving to Universities in Australia and New Zealand 2013 – 2015
Confirmed gifts, pledges and bequests trends 2013 to 2015 Copyright CASE 2016 | Charitable Giving to Universities in Australia and New Zealand 2013 – 2015
26 | Copyright CASE 2016 | Charitable Giving to Universities in Australia and New Zealand 2013 – 2015
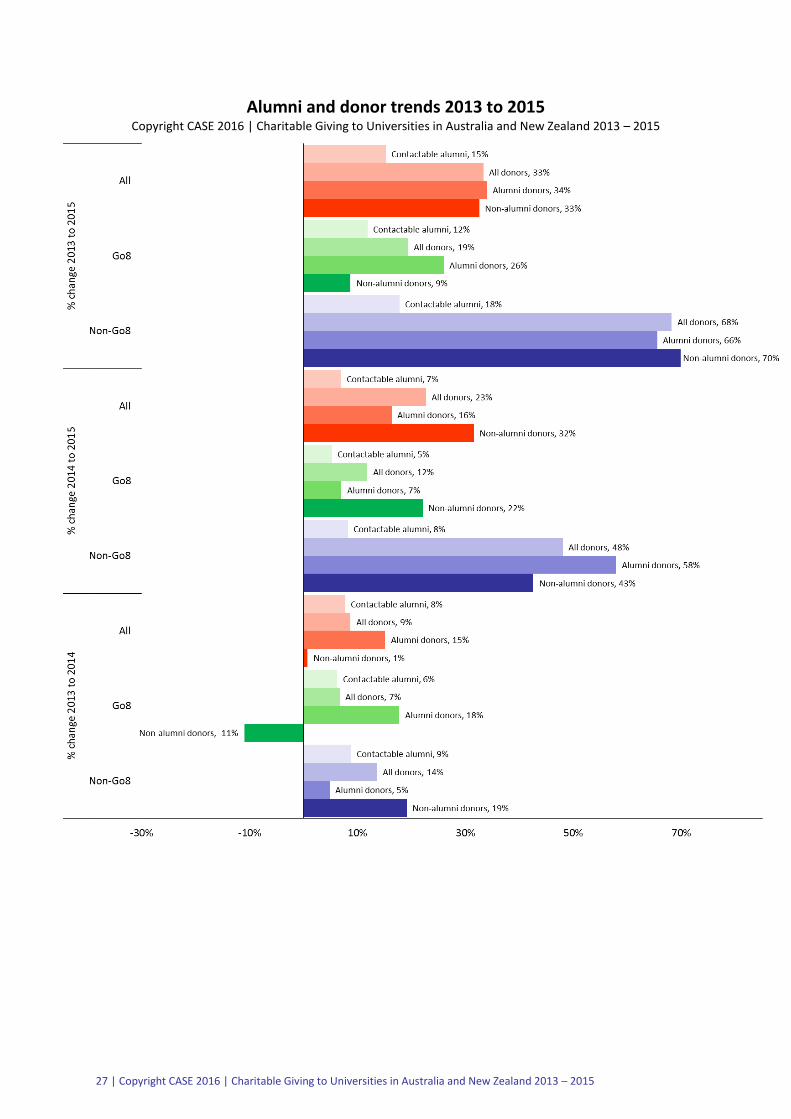
3.2 Alumni and donors Contactable alumni numbers grew by 12 percent and 18 percent for Go8 and non-Go8
institutions respectively from 2013 to 2015.
Total donors increased by 48 percent for non-Go8 institutions from 2014 to 2015 and 12
percent for Go8 institutions during the same time period.
Alumni donors increased by 58 percent at non-Go8 institutions and by seven percent at Go8
institutions from 2014 to 2015.
Number of non-alumni donors increased by 43 percent for non-Go8 institutions from 2014
to 2015 and by 22 percent for Go8 institutions.
27 | Copyright CASE 2016 | Charitable Giving to Universities in Australia and New Zealand 2013 – 2015
Alumni and donor trends 2013 to 2015 Copyright CASE 2016 | Charitable Giving to Universities in Australia and New Zealand 2013 – 2015
28 | Copyright CASE 2016 | Charitable Giving to Universities in Australia and New Zealand 2013 – 2015
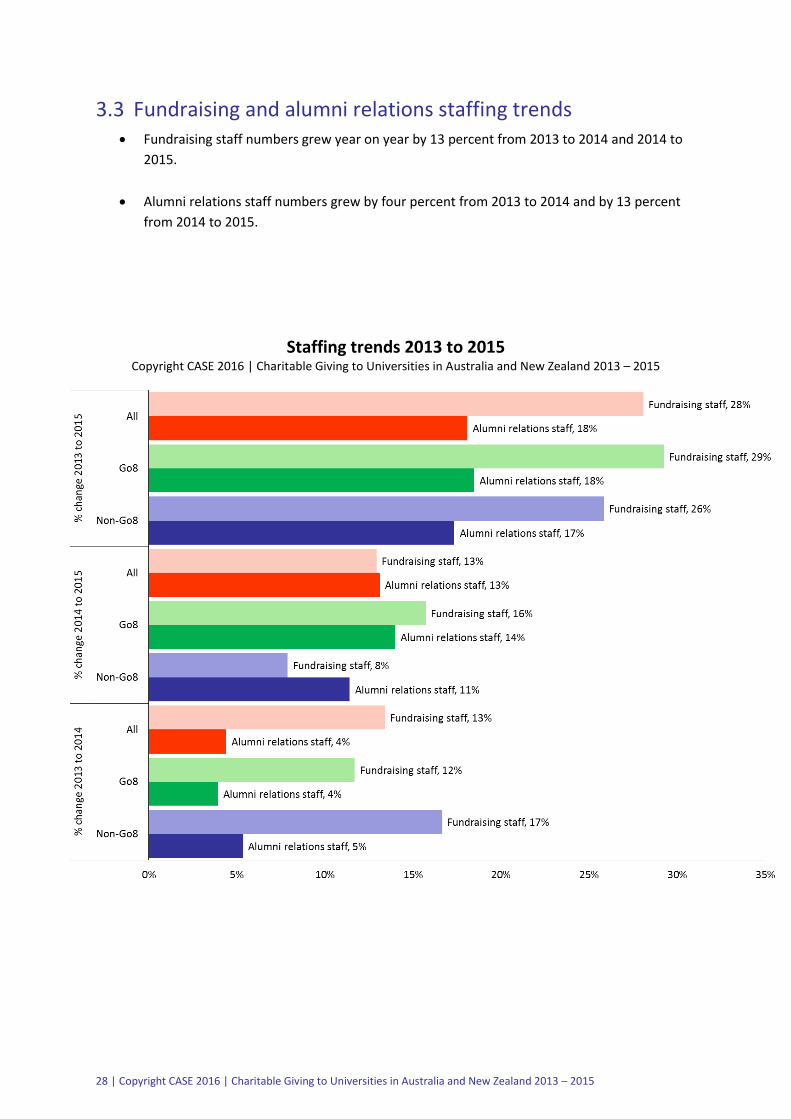
3.3 Fundraising and alumni relations staffing trends Fundraising staff numbers grew year on year by 13 percent from 2013 to 2014 and 2014 to
2015.
Alumni relations staff numbers grew by four percent from 2013 to 2014 and by 13 percent
from 2014 to 2015.
Staffing trends 2013 to 2015 Copyright CASE 2016 | Charitable Giving to Universities in Australia and New Zealand 2013 – 2015
29 | Copyright CASE 2016 | Charitable Giving to Universities in Australia and New Zealand 2013 – 2015
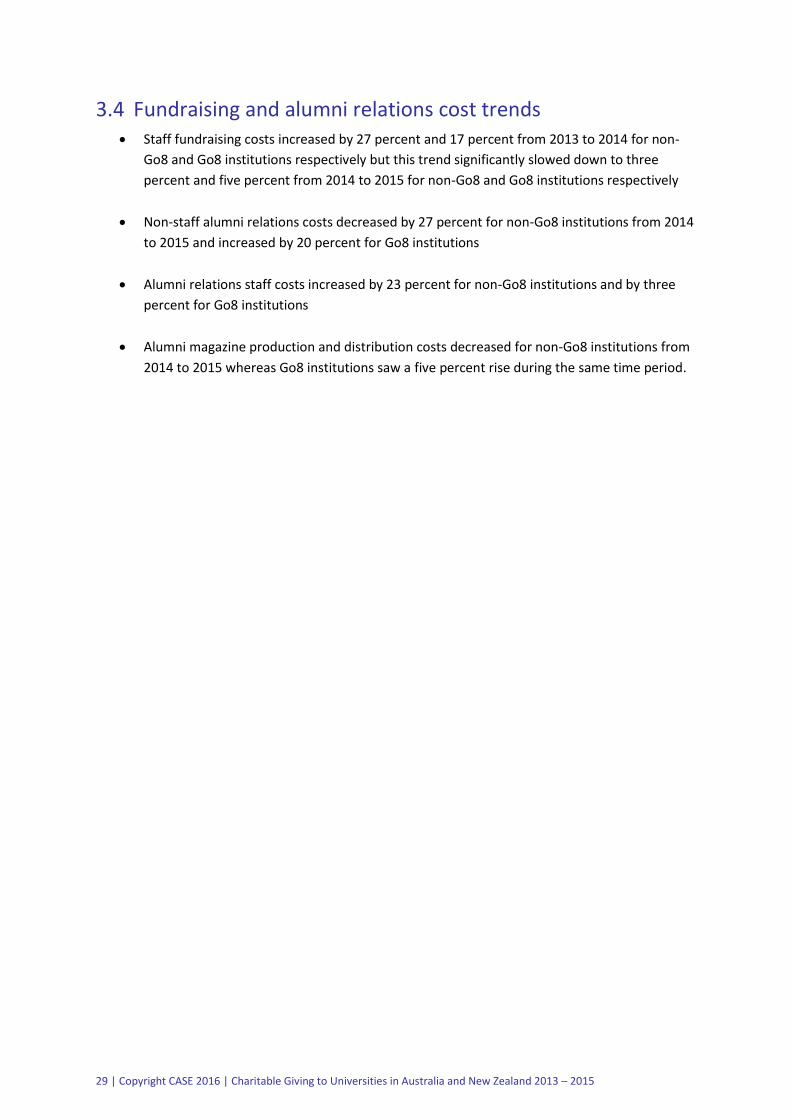
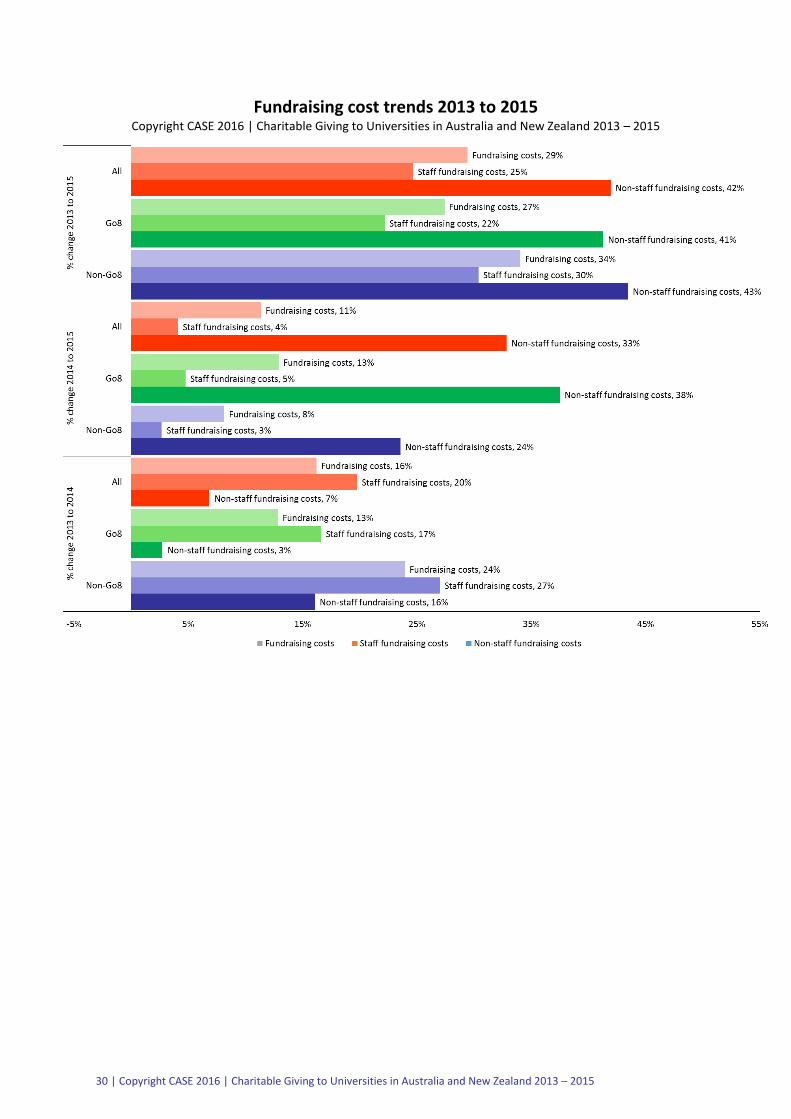
3.4 Fundraising and alumni relations cost trends Staff fundraising costs increased by 27 percent and 17 percent from 2013 to 2014 for non-
Go8 and Go8 institutions respectively but this trend significantly slowed down to three
percent and five percent from 2014 to 2015 for non-Go8 and Go8 institutions respectively
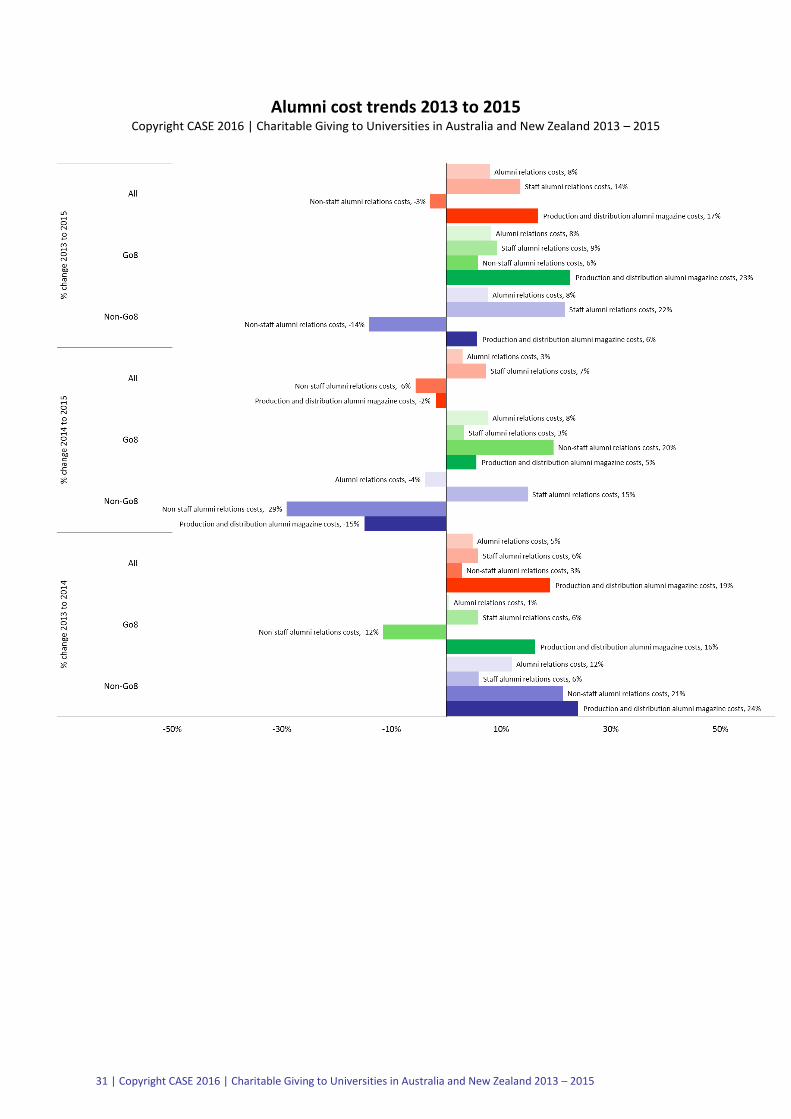
Non-staff alumni relations costs decreased by 27 percent for non-Go8 institutions from 2014
to 2015 and increased by 20 percent for Go8 institutions
Alumni relations staff costs increased by 23 percent for non-Go8 institutions and by three
percent for Go8 institutions
Alumni magazine production and distribution costs decreased for non-Go8 institutions from
2014 to 2015 whereas Go8 institutions saw a five percent rise during the same time period.
30 | Copyright CASE 2016 | Charitable Giving to Universities in Australia and New Zealand 2013 – 2015
Fundraising cost trends 2013 to 2015 Copyright CASE 2016 | Charitable Giving to Universities in Australia and New Zealand 2013 – 2015
31 | Copyright CASE 2016 | Charitable Giving to Universities in Australia and New Zealand 2013 – 2015
Alumni cost trends 2013 to 2015 Copyright CASE 2016 | Charitable Giving to Universities in Australia and New Zealand 2013 – 2015
32 | Copyright CASE 2016 | Charitable Giving to Universities in Australia and New Zealand 2013 – 2015
4 Comparisons with institutions in the UK
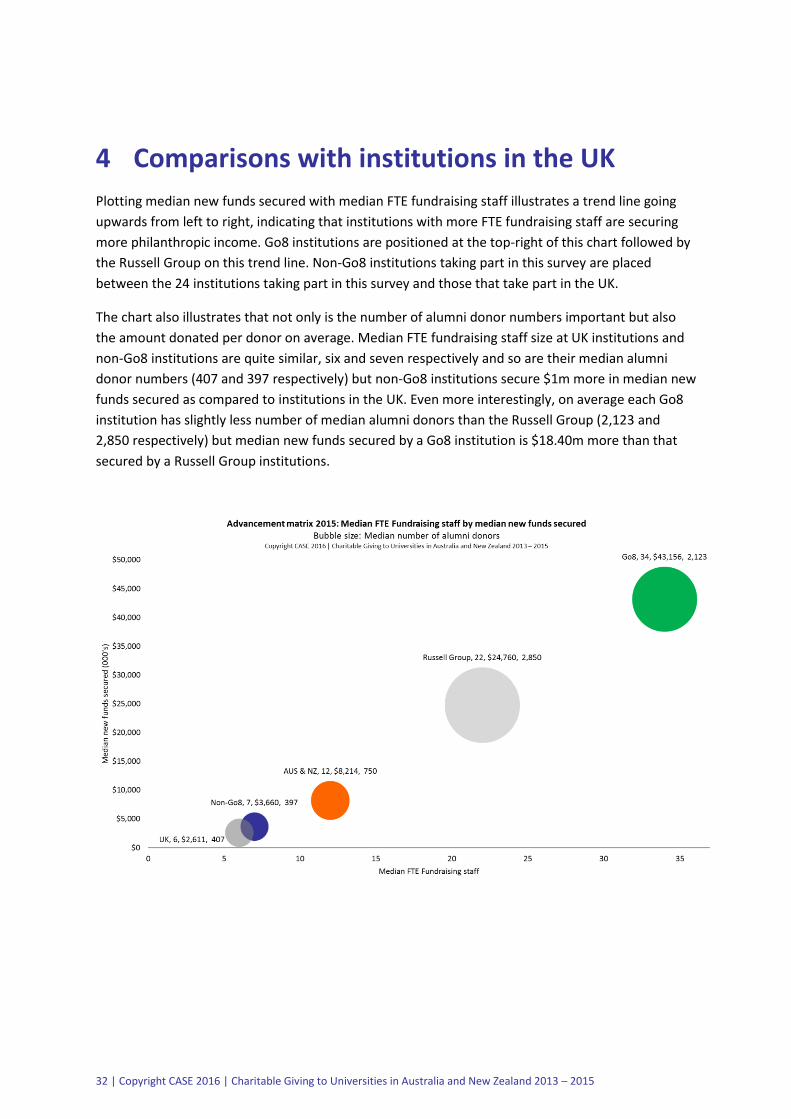
Plotting median new funds secured with median FTE fundraising staff illustrates a trend line going
upwards from left to right, indicating that institutions with more FTE fundraising staff are securing
more philanthropic income. Go8 institutions are positioned at the top-right of this chart followed by
the Russell Group on this trend line. Non-Go8 institutions taking part in this survey are placed
between the 24 institutions taking part in this survey and those that take part in the UK.
The chart also illustrates that not only is the number of alumni donor numbers important but also
the amount donated per donor on average. Median FTE fundraising staff size at UK institutions and
non-Go8 institutions are quite similar, six and seven respectively and so are their median alumni
donor numbers (407 and 397 respectively) but non-Go8 institutions secure $1m more in median new
funds secured as compared to institutions in the UK. Even more interestingly, on average each Go8
institution has slightly less number of median alumni donors than the Russell Group (2,123 and
2,850 respectively) but median new funds secured by a Go8 institution is $18.40m more than that
secured by a Russell Group institutions.
33 | Copyright CASE 2016 | Charitable Giving to Universities in Australia and New Zealand 2013 – 2015
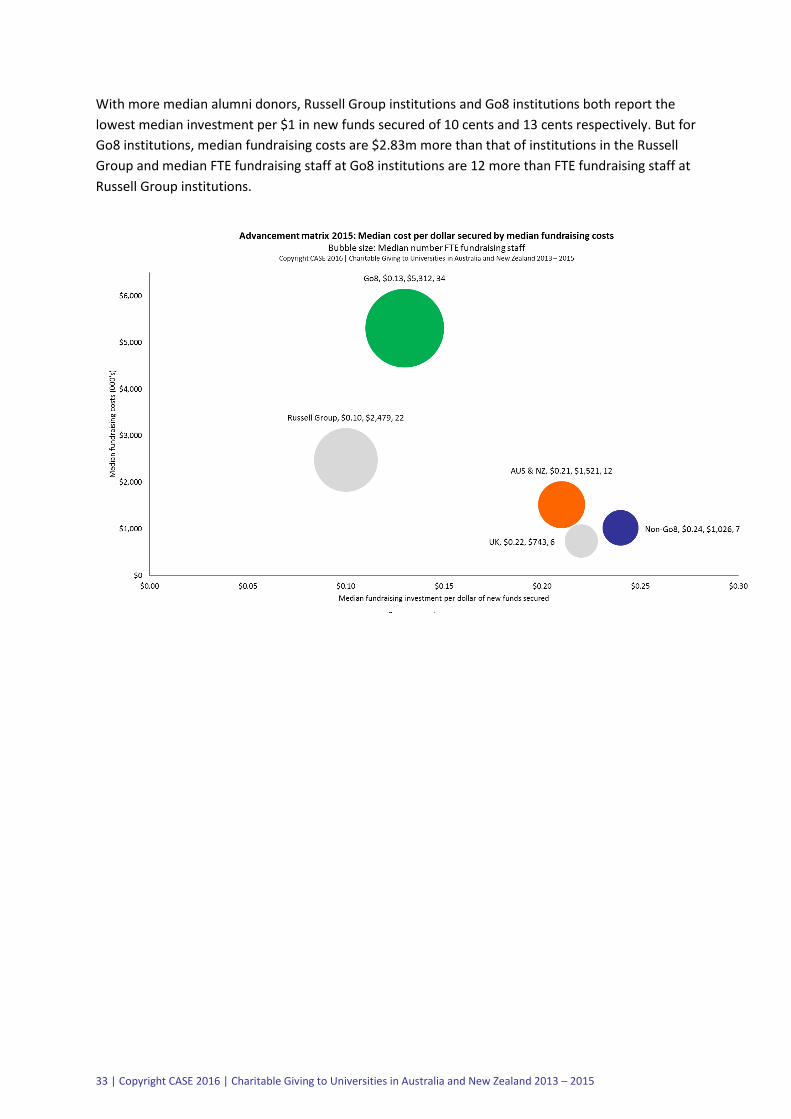
With more median alumni donors, Russell Group institutions and Go8 institutions both report the
lowest median investment per $1 in new funds secured of 10 cents and 13 cents respectively. But for
Go8 institutions, median fundraising costs are $2.83m more than that of institutions in the Russell
Group and median FTE fundraising staff at Go8 institutions are 12 more than FTE fundraising staff at
Russell Group institutions.

34 | Copyright CASE 2016 | Charitable Giving to Universities in Australia and New Zealand 2013 – 2015
5 Appendix
5.1.1 CASE
The Council for Advancement and Support of Education (CASE) is a professional not-for-profit association serving educational institutions and the advancement professionals who work on their behalf in alumni relations, communications, development, marketing and allied areas.
5.1.2 About the survey
This report presents findings from the Charitable Giving to Universities in Australia and New Zealand Survey 2013, 2014 and 2015. The project was conducted by CASE Europe and funded by the participating institutions. The survey is based on the UK Ross-CASE Survey and has been carried out since 2012. The survey was offered online for the first time in 2016 to collect data for 2013, 2014 and 2015. The survey is overseen by a survey committee. The committee and CASE research staff review the survey script, reporting rules and the question-by-question guide before launching the survey to eligible institutions in Australia and New Zealand. The 2013, 2014 and 2015 survey was launched online via the CASE Benchmarking Toolkit in July 2016 and closed in August 2016. Members of the board and CASE Research staff queried the data submitted by the institutions against an exhaustive set of logic, ratio, arithmetic and substantive tests (a full list can be obtained on request). The queries were emailed to the participating institutions who had the option of rectifying the errors by amending their data or leaving the answers unanswered. Best possible efforts were made to remove any unreliable data that was submitted. Descriptive statistics, mainly using the measures of central tendencies (mean and median), was used to analyse the data and key indicators were reported on this basis. Results were published by the medium of this report accompanied by an infographic. All participating institutions also received access to the CASE Benchmarking toolkit’s reporting tools. All data collected has been reported on a confidential and aggregated basis in this report. All income figures in this report are in Australian Dollars (AUD). As with previous reports this year’s data is intended for benchmarking purposes, and as such does not provide sector or organisational context, nor does it speculate as to reasons why differences may have occurred between years.
5.1.3 Reporting conventions
i) Trend data
Trend data are presented on a like-for-like basis for each variable reported in Chart 2.2 in percentages only. Participating institutions were requested to submit data for three years - 2013, 2014 and 2015.
ii) Base size
The number of institutions given as the base in tables and figures refers to the number of institutions answering a particular question or set of questions, rather than the total number participating in the survey.
iii) Measures of central tendencies
Mean figures provide a snapshot of the overall group’s performance while median figures highlight the distribution in fundraising figures across the participating institutions. Where the mean and median are close together, the group is relatively homogenous and where the mean is significantly different to the median, the group is much more diverse. Differences in mean and median figures could also be due to the presence of outliers in a sample. Given that the sample size covers a diverse range of institutions, there is a variation between institutions with some institutions having substantially higher values than others and vice-versa. Thus, some mean values are skewed upwards and are generally much higher than the median values. This variation is reduced when mission groups are analysed. This is because mission group institutions are generally very similar to each other in terms of their operations.
35 | Copyright CASE 2016 | Charitable Giving to Universities in Australia and New Zealand 2013 – 2015
iv) Computed variables
Some variables are calculated on the basis of two variables from the survey. For example largest cash gift as a percentage of total cash income received was calculated by first computing the percentage of largest cash gift to total cash income received for each institution and then the median was calculated from these figures rather than computing it by using the total of the largest cash gift and dividing that by total cash income received.
5.1.4 Acknowledgements
First and foremost we would like to thank the university staff who gave their time to provide information
about the philanthropic income of their institutions. A special thanks to all the new institutions participating in
the study for the first time and we are hopeful of increasing this number in the future and expanding the study
across the Asia-Pacific region. In addition we are grateful to the survey committee for their guidance and
support.
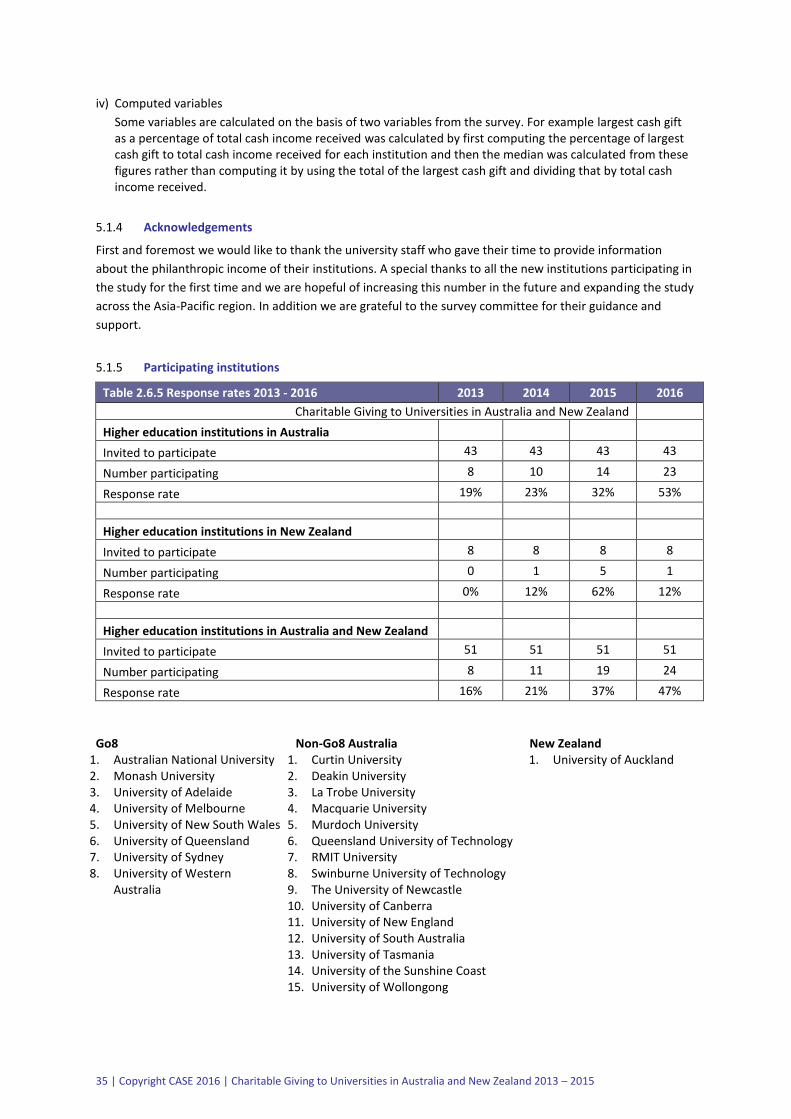
5.1.5 Participating institutions
Table 2.6.5 Response rates 2013 - 2016 2013 2014 2015 2016
Charitable Giving to Universities in Australia and New Zealand
Higher education institutions in Australia
Invited to participate 43 43 43 43
Number participating 8 10 14 23
Response rate 19% 23% 32% 53%
Higher education institutions in New Zealand
Invited to participate 8 8 8 8
Number participating 0 1 5 1
Response rate 0% 12% 62% 12%
Higher education institutions in Australia and New Zealand
Invited to participate 51 51 51 51
Number participating 8 11 19 24
Response rate 16% 21% 37% 47%
Go8 1. Australian National University 2. Monash University 3. University of Adelaide 4. University of Melbourne 5. University of New South Wales 6. University of Queensland 7. University of Sydney 8. University of Western
Australia
Non-Go8 Australia 1. Curtin University 2. Deakin University 3. La Trobe University 4. Macquarie University 5. Murdoch University 6. Queensland University of Technology 7. RMIT University 8. Swinburne University of Technology 9. The University of Newcastle 10. University of Canberra 11. University of New England 12. University of South Australia 13. University of Tasmania 14. University of the Sunshine Coast 15. University of Wollongong
New Zealand 1. University of Auckland
36 | Copyright CASE 2016 | Charitable Giving to Universities in Australia and New Zealand 2013 – 2015
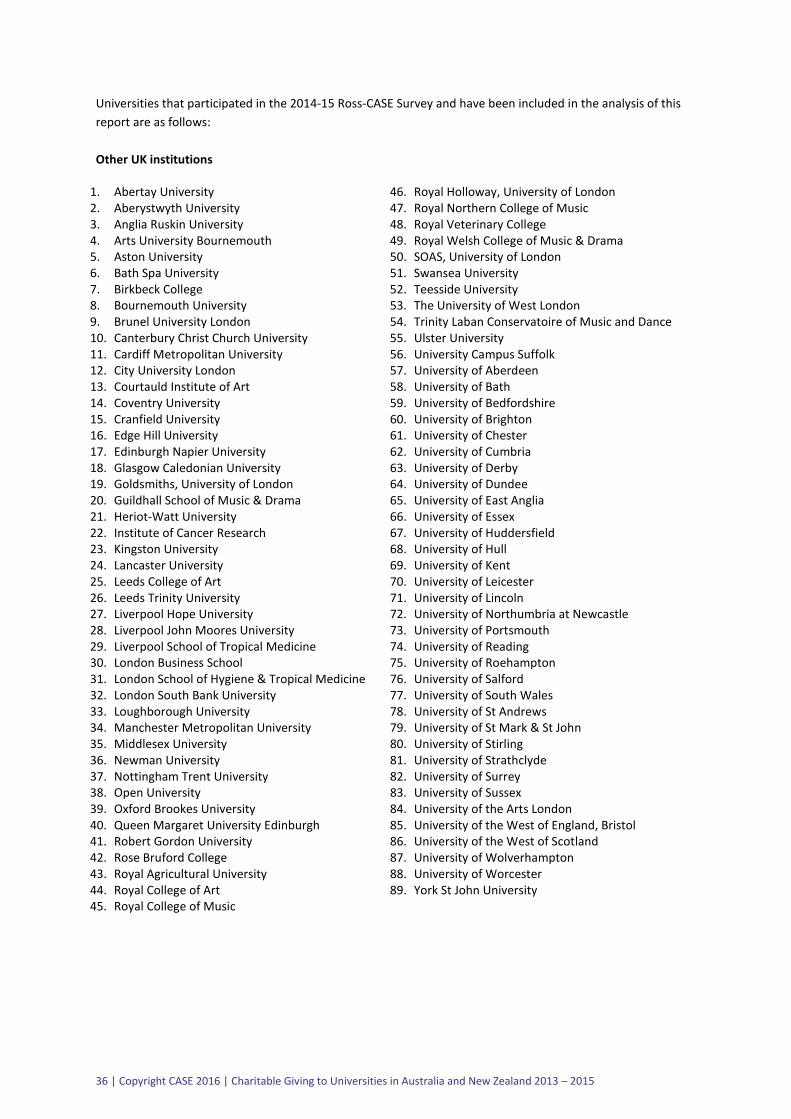
Universities that participated in the 2014-15 Ross-CASE Survey and have been included in the analysis of this
report are as follows:
Other UK institutions 1. Abertay University 2. Aberystwyth University 3. Anglia Ruskin University 4. Arts University Bournemouth 5. Aston University 6. Bath Spa University 7. Birkbeck College 8. Bournemouth University 9. Brunel University London 10. Canterbury Christ Church University 11. Cardiff Metropolitan University 12. City University London 13. Courtauld Institute of Art 14. Coventry University 15. Cranfield University 16. Edge Hill University 17. Edinburgh Napier University 18. Glasgow Caledonian University 19. Goldsmiths, University of London 20. Guildhall School of Music & Drama 21. Heriot-Watt University 22. Institute of Cancer Research 23. Kingston University 24. Lancaster University 25. Leeds College of Art 26. Leeds Trinity University 27. Liverpool Hope University 28. Liverpool John Moores University 29. Liverpool School of Tropical Medicine 30. London Business School 31. London School of Hygiene & Tropical Medicine 32. London South Bank University 33. Loughborough University 34. Manchester Metropolitan University 35. Middlesex University 36. Newman University 37. Nottingham Trent University 38. Open University 39. Oxford Brookes University 40. Queen Margaret University Edinburgh 41. Robert Gordon University 42. Rose Bruford College 43. Royal Agricultural University 44. Royal College of Art 45. Royal College of Music
46. Royal Holloway, University of London 47. Royal Northern College of Music 48. Royal Veterinary College 49. Royal Welsh College of Music & Drama 50. SOAS, University of London 51. Swansea University 52. Teesside University 53. The University of West London 54. Trinity Laban Conservatoire of Music and Dance 55. Ulster University 56. University Campus Suffolk 57. University of Aberdeen 58. University of Bath 59. University of Bedfordshire 60. University of Brighton 61. University of Chester 62. University of Cumbria 63. University of Derby 64. University of Dundee 65. University of East Anglia 66. University of Essex 67. University of Huddersfield 68. University of Hull 69. University of Kent 70. University of Leicester 71. University of Lincoln 72. University of Northumbria at Newcastle 73. University of Portsmouth 74. University of Reading 75. University of Roehampton 76. University of Salford 77. University of South Wales 78. University of St Andrews 79. University of St Mark & St John 80. University of Stirling 81. University of Strathclyde 82. University of Surrey 83. University of Sussex 84. University of the Arts London 85. University of the West of England, Bristol 86. University of the West of Scotland 87. University of Wolverhampton 88. University of Worcester 89. York St John University
37 | Copyright CASE 2016 | Charitable Giving to Universities in Australia and New Zealand 2013 – 2015
UK institutions in the Russell Group 1. Cardiff University 2. Imperial College London 3. King's College London 4. London School of Economics and Political Science 5. Newcastle University 6. Queen Mary University of London 7. Queen's University Belfast 8. University College London 9. University of Birmingham 10. University of Bristol 11. University of Cambridge 12. University of Durham 13. University of Edinburgh 14. University of Exeter 15. University of Glasgow 16. University of Leeds 17. University of Liverpool 18. University of Manchester 19. University of Nottingham 20. University of Oxford 21. University of Sheffield 22. University of Southampton 23. University of Warwick 24. University of York
38 | Copyright CASE 2016 | Charitable Giving to Universities in Australia and New Zealand 2013 – 2015
5.1.6 Glossary
Annual funds: Gifts obtained through mass participation often directed to general operations and/or designated university priorities. Bequests: A commitment (pledge) that a transfer of wealth will occur upon a donor’s death. Within the survey bequest gifts are only counted in either new funds secured or cash income received (depending on the type of gift) when it is actually received. Committed bequests (whether received in year or not) are included in the committed bequests question within the survey. Cash income received: Income actually received by the institution including payments received towards pledges made in previous years, excluding new pledges where payment has not been received. Contactable alumni: This refers to addressable alumni (former students of the institution) – those who you have reliable postal or email addresses anywhere in the world. Gifts-in-kind: This includes other goods donated that are not a monetary contribution. Group of Eight: The Group of Eight (Go8) is a coalition of Australian higher education institutions. Investment in alumni relations: The costs associated with engagement activity with alumni and community, including staff and non-staff expenditure. Investment in fundraising: The costs associated with the efforts to gather new funds secured and cash income received. It includes the cost of the staff (staff expenditure) undertaking the fundraising and the other costs (non-staff expenditure) of running and maintaining the fundraising operations. When the cost of both staff expenditure and non-staff expenditure is combined this equals the total fundraising expenditure. Mean: A measure of central tendency which is the average value i.e. the sum of the sampled values divide by the number of items in the sample. In this report mean denotes the arithmetic mean. Median: A measure of central tendency the median separates the higher half of a data sample, a population, or a probability distribution, from the lower half. New funds secured: New funding secured by the institution, including new donations received and new confirmed pledges not yet received but excluding payments of pledges made in previous years. This does not include bequest pledges but includes bequest received. Organisations: Includes trusts, foundations, companies and other organisations. Philanthropic income: This is defined in the Supporting Document and includes gifts/donations or grants that meet two criteria – source of funds should be eligible and the nature of funds should meet the survey’s definition of philanthropic intent. The survey reports philanthropic income in two ways – new funds secured and cash income received. Reporting rules and Question-by-question guide: These documents provide guidance and definitions on funding that is eligible for inclusion in the survey and how that funding is recorded. It also contains general guidance on completing the survey. Russell Group Universities: The Russell Group is an Association of 24 research-intensive institutions in the UK. Sum: Summation is the operation of adding a sequence of numbers; the result is their sum or total.