Charging up America: Assessing the growing need for U.S ...
45
JULY 2021 WHITE PAPER CHARGING UP AMERICA: ASSESSING THE GROWING NEED FOR U.S. CHARGING INFRASTRUCTURE THROUGH 2030 Gordon Bauer, Chih-Wei Hsu, Mike Nicholas, and Nic Lutsey BEIJING | BERLIN | SAN FRANCISCO | SÃO PAULO | WASHINGTON www.theicct.org [email protected] twitter @theicct
Transcript of Charging up America: Assessing the growing need for U.S ...
JULY 2021
WHITE PAPER
CHARGING UP AMERICA: ASSESSING THE GROWING NEED FOR U.S. CHARGING INFRASTRUCTURE THROUGH 2030Gordon Bauer, Chih-Wei Hsu, Mike Nicholas, and Nic Lutsey
B E I J I N G | B E R L I N | S A N F R A N C I S C O | S Ã O PA U LO | WA S H I N G TO N
www.theicct.org
twitter @theicct

ACKNOWLEDGMENTS
This project was supported by the Heising-Simons Foundation. Critical reviews on an earlier version of this paper were provided by Dale Hall, Aaron Isenstadt, Lucy McKenzie, Marie Rajon Bernard, and Peter Slowik. Any errors are the authors’ own.
International Council on Clean Transportation 1500 K Street NW, Suite 650Washington, DC 20005
[email protected] | www.theicct.org | @TheICCT
© 2021 International Council on Clean Transportation
i ICCT WHITE PAPER | CHARGING UP AMERICA: ASSESSING U.S. CHARGING INFRASTRUCTURE THROUGH 2030
EXECUTIVE SUMMARYElectric vehicles surpassed 10 million cumulative sales globally in late 2020. Announcements from automakers and the U.S. government regarding manufacturing goals, new vehicle emission standards, incentives, and infrastructure investments suggest the U.S. electric vehicle market could expand dramatically in the years ahead. These developments spur broad questions about how much infrastructure is needed to support electric vehicle growth, and the associated costs.
This paper assesses growing home, workplace, and public charging needs through 2030 to support the transition to electric vehicles in the United States. The analysis incorporates local market trends, evolving charging technology and behavior, household characteristics, and home charging availability. It includes charging needs for lower-income communities, rural areas, highway corridor charging, and ride-hailing vehicles. The charging analysis is also integrated with bottom-up charging costs to estimate the associated infrastructure investment required to support the electric transition.
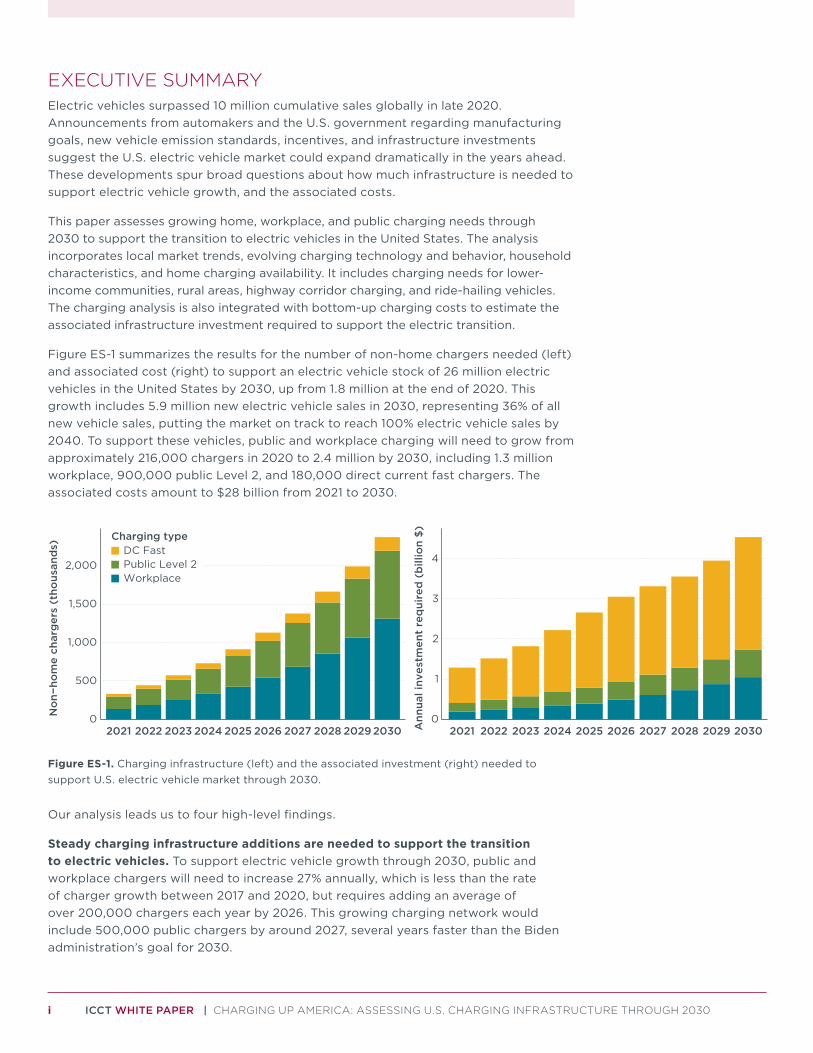
Figure ES-1 summarizes the results for the number of non-home chargers needed (left) and associated cost (right) to support an electric vehicle stock of 26 million electric vehicles in the United States by 2030, up from 1.8 million at the end of 2020. This growth includes 5.9 million new electric vehicle sales in 2030, representing 36% of all new vehicle sales, putting the market on track to reach 100% electric vehicle sales by 2040. To support these vehicles, public and workplace charging will need to grow from approximately 216,000 chargers in 2020 to 2.4 million by 2030, including 1.3 million workplace, 900,000 public Level 2, and 180,000 direct current fast chargers. The associated costs amount to $28 billion from 2021 to 2030.
0
1
2
3
4
2021 2022 2023 2024 2025 2026 2027 2028 2029 2030Ann
ual i
nves
tmen
t re
qui
red
(b
illio
n $
)
0
500
1,000
1,500
2,000
2021 2022 2023 2024 2025 2026 2027 2028 2029 2030
No
n−ho
me
char
ger
s (t
hous
and
s)
Charging typeDC FastPublic Level 2Workplace
Figure ES-1. Charging infrastructure (left) and the associated investment (right) needed to support U.S. electric vehicle market through 2030.
Our analysis leads us to four high-level findings.
Steady charging infrastructure additions are needed to support the transition to electric vehicles. To support electric vehicle growth through 2030, public and workplace chargers will need to increase 27% annually, which is less than the rate of charger growth between 2017 and 2020, but requires adding an average of over 200,000 chargers each year by 2026. This growing charging network would include 500,000 public chargers by around 2027, several years faster than the Biden administration’s goal for 2030.

ii ICCT WHITE PAPER | CHARGING UP AMERICA: ASSESSING U.S. CHARGING INFRASTRUCTURE THROUGH 2030
Broad charging infrastructure investments will be needed to support an expanding electric vehicle market. The charging infrastructure network will need to provide greater coverage for a broader set of drivers by 2030. About a million chargers will be needed at multiunit dwellings to support apartment residents and charging will need to grow at greater rates in many rural areas and across the Midwest and South. Lower-income communities will need persistent investments, amounting to about 30% of chargers and charging investments through 2030, to ensure equitable infrastructure access.
Associated charging infrastructure costs are substantial but are in line with recent trends. The associated 2021–2030 charging investments are $28 billion for public and workplace chargers, including $15 billion for charger installation labor. Direct current fast chargers are 7% of these chargers, provide 57% of the charging energy, and represent 66% of the costs, reinforcing the need to install inexpensive and convenient home and workplace charging. Near-term charging needs are being covered by public funding, utility investments, Volkswagen’s dieselgate settlement funds, and other private companies. More sustained long-term funding is needed, especially where investments through 2020 have been limited. Such investments fit well within the infrastructure and climate goals, and they would represent just 1%-2% of the associated budgets in policymakers’ 2021 proposed infrastructure plans.
Charging infrastructure costs can be shared across many interested stakeholders. The diverse charging infrastructure needs present opportunities for coordination and broad cost sharing. Electric power utilities, private charging companies, automakers, and property owners each have roles in developing the charging infrastructure network. Charging investments can be spurred by public support from federal, state, and local governments via direct funding, cost-sharing, tax credits, regulations, and city codes. Further exploration into the ideal combination of new policies, standards, investments, and coordination across the players is warranted.
Although electric vehicle charging infrastructure costs are substantial, the benefits are also great. Charging infrastructure enables a fleet of electric vehicles that will themselves have lower upfront costs than conventional vehicles and will deliver thousands of dollars in fuel savings per vehicle by 2030. The benefits of the electric vehicle transition are at least an order of magnitude greater than charging infrastructure costs, making charging infrastructure a modest down payment to decarbonize the transport sector.

iii ICCT WHITE PAPER | CHARGING UP AMERICA: ASSESSING U.S. CHARGING INFRASTRUCTURE THROUGH 2030
TABLE OF CONTENTS
Executive summary ................................................................................................................... i
Introduction ................................................................................................................................1
Analysis ..................................................................................................................................... 3
Charger definitions ..................................................................................................................................3
Electric vehicle sales ..............................................................................................................................4
Lower-income communities ................................................................................................................6
Vehicle stock-turnover model .............................................................................................................6
Charging by housing type ....................................................................................................................8
Charger utilization ...................................................................................................................................11
Charger power .........................................................................................................................................12
Electric vehicle charger counts ........................................................................................................ 14
Charger cost ............................................................................................................................................. 14
Electric ride-hailing charging ............................................................................................................ 15
Results ...................................................................................................................................... 16
Summary of overall U.S. results ....................................................................................................... 16
Charging needs in lower-income communities ..........................................................................17
Geographic variation in charging needs ...................................................................................... 18
Variation in electric vehicles per charger ................................................................................... 20
Comparison with previous analyses .............................................................................................. 22
Electric vehicle charging infrastructure costs .......................................................................... 24
Discussion of key uncertainties ...................................................................................................... 26
Conclusion ...............................................................................................................................29
References ...............................................................................................................................32
Appendix ..................................................................................................................................37

iv ICCT WHITE PAPER | CHARGING UP AMERICA: ASSESSING U.S. CHARGING INFRASTRUCTURE THROUGH 2030
LIST OF FIGURESFigure 1. Flowchart depicting approach to calculate the number of chargers and total investment to support EV goals. ..................................................................................................3
Figure 2. Annual sales by vehicle technology for selected metropolitan areas. .................6
Figure 3. Distribution of vehicle ages in 2020 for selected metropolitan areas. ................7
Figure 4. Distributions of housing type and home charging access by year, for the general population and only lower-income communities..............................................................9
Figure 5. Charging energy consumption by charging type and year, for the general population and in lower-income communities. ................................................................ 10
Figure 6. Distribution of charger utilization rates among different regions, by year, including both Level 2 and DC fast chargers. ........................................................................ 12
Figure 8. Non-home and home chargers across the United States, reference 2020 and annual projections to 2030. ..................................................................................................17
Figure 9. Proportion of total U.S. chargers required in lower-income communities, by year and charger type. ............................................................................................. 18
Figure 10. Map showing density of non-home chargers per square mile needed in 2030, by region. ....................................................................................................................... 19
Figure 11. Map showing proportion of non-home chargers needed in 2030 that are installed through 2020, by region. ......................................................................................20
Figure 12. Number of EVs served by each non-home charger in 2030, EV share of vehicle stock, and total non-home chargers by state. ................................................. 21
Figure 13. Number of EVs served by each charger type for selected regions for 2020–2030. ............................................................................................................................................. 22
Figure 14. Annual public and workplace charging infrastructure investments required, by charger type. ........................................................................................................................ 24
Figure 15. Annual private home and multiunit dwelling charging infrastructure investments required. ................................................................................................................................. 25
LIST OF TABLESTable 1. Summary of key analysis results by year............................................................................16
Table 2. Summary of previous EV infrastructure need studies. ..............................................23

1 ICCT WHITE PAPER | CHARGING UP AMERICA: ASSESSING U.S. CHARGING INFRASTRUCTURE THROUGH 2030
INTRODUCTIONAs electric vehicles (EVs) have now surpassed 10 million cumulative sales through 2020, it is becoming increasing clear that a transition to an electric transportation sector is underway. Annual EV sales grew by more than 40% in 2020 to over 3 million, whereas sales of conventional combustion vehicles declined 14%, and the resulting global EV sales share of passenger vehicles jumped from 2.5% to 4.2% from 2019 to 2020 (EV-Volumes, 2021). The markets of China, Europe, and the United States, where there are the most supporting policies, made up more than 90% of global EV sales. Automakers continue to announce timelines to shift their portfolios to plug-in electric vehicles (Ford, 2021b; General Motors, 2021; Volkswagen, 2021b; Volvo, 2021). Although at an early phase, the transition to EVs appears to be underway.
Recent developments suggest the U.S. EV market could expand dramatically in the next 10 to 15 years. The Biden administration has moved to reinstate more stringent fuel economy standards and state-level vehicle emission authority—and stated its aim of 100% zero-emission vehicle sales (Joe Biden for President, 2020; Joselow, 2020; The White House, 2021a). In 2020, California became the first U.S. state to set a target to reach a 100% market share for zero-emission vehicles (ZEVs), with a target date of 2035 (California Office of the Governor, 2020). California has the highest EV share of any state at 8% of new passenger vehicle sales, four times the U.S. average, and many states are adopting similar EV regulations and supporting policies (HB 1965, 2021; Bui, Slowik, & Lutsey, 2020; Colorado Energy Office, 2021; Minnesota Pollution Control Agency, 2019; Washington State Department of Ecology, 2021).
These developments lead to broad questions about how much infrastructure is needed to support the transition to electric vehicles. The Biden administration has stated its goal for 500,000 public electric vehicle chargers by 2030 as part of its American Jobs Plan and has convened electric vehicle charging leaders to discuss (The White House, 2021b, 2021c). For context, there were approximately 133,000 public chargers across the United States in 2020 (PlugShare, 2021; Xu, Davis, & Tal, 2021; U.S. Department of Energy, 2021). However, more analysis is needed to assess the associated cost and where different types of chargers are needed most. Many cities, like Los Angeles (Bui et al., 2021), San Francisco (Hsu, Slowik, & Lutsey, 2020), and Seattle (Hsu, Slowik, & Lutsey, 2021a) have higher EV uptake and more aggressive targets to meet their air quality and climate goals, often aiming for 100% electric vehicle sales by 2030. Quantifying state- and metropolitan area-specific charging demand will be important to accurately reflect infrastructure needs for utilities and EV drivers going forward.
Limited charging infrastructure has been one of the main barriers to EV uptake, and deploying sufficient charging infrastructure in unison with EV deployment is critical to ensure EVs are as convenient as conventional vehicles. Previous studies have found that charging infrastructure deployment and corresponding public investment is consistently linked with increased EV sales (Hall & Lutsey, 2017; Harrison & Thiel, 2017; Li, Tong, Xing, & Zhou, 2017; Sierzchula, Bakker, Maat, & Van Wee, 2014; Slowik & Lutsey, 2017; Springel, 2017).
Previous analyses have reported a wide range of public charging infrastructure needs depending on key underlying assumptions, geography, and other factors. For example, two studies released in 2021 that examined scenarios with 100% EV sales nationwide by 2035 found charging infrastructure needs ranging from 500,000 non-home chargers to five million, largely due to differing assumptions regarding the speed of EV uptake, charger power, and EV driver charging preferences (McKenzie, Satterfield, & Nigro,

2 ICCT WHITE PAPER | CHARGING UP AMERICA: ASSESSING U.S. CHARGING INFRASTRUCTURE THROUGH 2030
2021; Phadke et al. 2021). Meanwhile, previous studies typically have not explored variation in charging needs between regions and different demographic groups, which will be necessary to ensure equitable access to EV technology.
In this white paper, we build from previous work to assess growing charging needs for the U.S. transition toward all EV sales. We analyze the case where EVs are on a path toward 100% of new vehicle sales in 2035 in early-adopting states, and in 2040 in the rest of the country. Updating analysis from Nicholas, Hall, and Lutsey (2019), we estimate how many home, workplace, and public chargers will need to be installed through 2030. The analysis is based on household characteristics at the census tract level, incorporating vehicle ownership, home charging availability, and charging needs. We conduct this analysis separately for both the general population and lower-income communities specifically. Building on the previous work, we incorporate recent trends, including for battery and charging technology, and the analysis newly includes charging needs across rural areas and for shared mobility growth. Finally, we integrate bottom-up estimates of infrastructure costs to estimate the associated investment to support the EV transition.

3 ICCT WHITE PAPER | CHARGING UP AMERICA: ASSESSING U.S. CHARGING INFRASTRUCTURE THROUGH 2030
ANALYSIS Similar to a previous ICCT analysis (Nicholas et al., 2019), we conduct a holistic assessment of EV electricity demand and supply to determine the number of chargers required by region and by type to support a growing EV fleet. Regions are defined as core-based statistical areas, including both metropolitan and micropolitan areas, as well as rural areas in each state that fall outside of these statistical areas. As shown from top to bottom in Figure 1, this analysis involves several distinct components, including data inputs (blue icons), modeling steps (yellow), intermediate outputs (green), and final outputs (purple). Electric vehicle sales, household characteristics, current infrastructure, and cost data are the major inputs. Intermediate analytical steps involve tracking the EVs and their electricity usage, incorporating trends in charging behavior and charger utilization. The major outputs are charging counts needed annually and the associated investment cost, disaggregated by year and region, with separate estimates for both the general and lower-income population.
Vehicle stockturnover model
Charger counts and investment• Resolution: urban/rural, income group, years 2020-2030• Categories: Home, workplace, public level 2, DC fast
Energydemand
Analysis steps
Intermediate
Outputs
Chargingbehavior
Chargerutilization
Chargerpower
Householdcharacteristics
Electric vehiclesales
Currentinfrastructure data Cost dataData inputs
Future markettrends
Figure 1. Flowchart depicting approach to calculate the number of chargers and total investment to support EV goals.
CHARGER DEFINITIONSWe assess chargers in five main groups: home, public, workplace, direct current (DC) fast, and multiunit dwelling. Home chargers are chargers at private residences, typically single-family homes with garages or on-street parking. Multiunit dwelling chargers are home chargers at residential locations with several tenants. Public chargers and DC fast chargers are those with some public access, including those with membership-constrained usage. Workplace chargers are intended primarily for employees that commute to work. There is some overlap in usage between the categories: for example, workplace chargers are sometimes accessible to the public, whereas public chargers are often used by people charging during work hours. Roughly 80% of employers provide some form of parking at their workplace (Winters & Hendricks, 2003), suggesting that public charging usage during work hours will fall if adequate workplace charging is provided.
The home, multiunit dwelling, workplace, and public chargers can be classified as Level 1 or Level 2, which are electrical standards corresponding to voltages and charging speeds. Level 1 charging is typically done with a standard 120-volt outlet and provides roughly five miles of battery range per hour of charging, whereas Level 2 charging is done with a 240-volt outlet and provides roughly 20 miles of range per hour, though it

4 ICCT WHITE PAPER | CHARGING UP AMERICA: ASSESSING U.S. CHARGING INFRASTRUCTURE THROUGH 2030
is possible to supply more than twice that if the vehicle allows for it. DC fast chargers are normally rated to powers of at least 50 kilowatts (kW), up to over 300 kW, with voltages of 400 to 800 volts, providing anywhere from 50 to 300 miles of charge in 20 minutes. These chargers require specialized and expensive equipment, and are suitable for corridor charging along major highways, as well as charging depots analogous to gas stations in and around cities.
Precise delineation of chargers by location and use can be more complex. In some cases, curbside public chargers located in residential areas will be used overnight by people without access to home charging. We define public Level 2 charging as any station not located at a workplace that is open to all EV owners, including destination charging at supermarket parking lots and parking garages, and curbside charging stations owned by local or state governments. Public chargers can include chargers at government buildings’ parking garages, and commercial or recreational destinations like grocery stores, movie theaters, and parks. DC fast charging includes both stations in urban areas and along highway corridors to serve long-distance travel.
ELECTRIC VEHICLE SALES Based on market and policy developments through 2020, we develop adoption curves for new EV sales assuming that an increasing number of states follow California’s ZEV regulation and reach 100% zero-emission vehicle sales by 2035 (California Office of the Governor, 2020). We assume states without ZEV regulations follow a five-year delayed trajectory, reaching 100% electric sales in 2040. Pending the Biden administration’s reinstatement of state vehicle emission authority, ZEV states in 2020 include California, Colorado, Connecticut, Maine, Maryland, Massachusetts, New Jersey, New York, Oregon, Rhode Island, Vermont, and Washington. Based on ongoing ZEV regulation developments, we assume Minnesota, Nevada, New Mexico, and Virginia will join the 2035 target as well. These potential ZEV state additions would increase the share of U.S. new light-duty vehicle sales that are in ZEV regulation states from 29% to 36%. In February 2021, Pennsylvania began considering joining the ZEV regulation as well, but is still considered a non-ZEV state in this analysis (Pennsylvania Department of Environmental Protection, 2021).
The underlying EV uptake sets new vehicle sales to a path toward 100% EVs nationwide by 2040. Our EV adoption assumptions include the EV share of new light-duty vehicle sales across all the ZEV states reaching 18% by 2025 and 61% by 2030. The EV share across all the states not assumed to adopt the ZEV regulations reaches 6% by 2025 and 22% by 2030. The underlying premise is that regulations (led by ZEV regulation states, followed by increasingly stronger federal regulations) are the fundamental drivers for increasing EV volume and increasing EV model availability across U.S. markets. As a result, EV shares in ZEV-adoption states, on average, lead the non-ZEV states by 5 years through the transition toward all EVs (e.g., toward 100% EVs in ZEV states by 2035, and by 2040 in non-ZEV states). Based on these assumptions, the U.S. EV sales share increases from 2% in 2020, to 10% in 2025, to 36% in 2030. Plug-in hybrid electric vehicles (PHEVs) represented 24% of 2020 EV sales, and given advances in battery technology and automaker announcements, growth in pure battery electric vehicles (BEVs) is expected. We project the PHEV share of EVs will gradually decline, reaching 10% of EV sales in 2030.
Using data from Bui et al. (2020), we adjust the EV growth trajectory based on the EV market shares for each region in 2019, relative to their respective state-wide target. We analyze core-based statistical areas (i.e., metropolitan and smaller urban areas)

5 ICCT WHITE PAPER | CHARGING UP AMERICA: ASSESSING U.S. CHARGING INFRASTRUCTURE THROUGH 2030
and rural areas in each state. The highest EV-uptake area is San Jose, California, which had an EV market share of 20% in 2019, putting it seven years ahead of the adoption target for ZEV states. At the opposite end of the spectrum, smaller cities such as Elko, Nevada, and Fort Morgan, Colorado, had negligible EV sales in 2019, putting them six years behind the ZEV states’ target trajectory. Regions that had lower rates of adoption are projected to catch up to early-adopting regions in the late 2020s, such that all regions reach the corresponding state-wide target for 100% EV market share.
To convert these adoption curves into projections for absolute numbers of EV sales, we develop forecasts for the relative number of vehicle sales in each region. Using county-level gross domestic product (GDP) data from the past 20 years, we project future relative GDP for each region, limiting changes in relative annual GDP growth to 2% between the fastest and slowest growth regions. Integrating these relative GDP projections with 2019 relative vehicle sales by region and nationwide sales projections from the Annual Energy Outlook (AEO) report (U.S. Energy Information Administration, 2020), we then estimate relative vehicle sales by region in the years 2020 to 2030.
We also develop projections of relative sales of cars and light trucks in each region, using AEO projections for the national level, and 2019 market shares at the region level from Bui et al. (2020). Light trucks include pickup trucks, sports utility vehicles, minivans, and crossovers with all-wheel drive as defined in the vehicle regulation for light-duty vehicles. Finally, we integrate the region-level sales estimates with our EV adoption projections to estimate EV sales for each region in each year. Although EV sales through 2020 were primarily in passenger cars and smaller crossovers, we assume sales become more proportionally distributed across cars and light trucks over time.
Figure 2 shows the resulting annual sales by vehicle type for six selected major metropolitan areas representing a wide range of geographies and levels of EV policy ambition. In all areas, BEV sales (green slices) grow rapidly in the latter part of the decade, whereas PHEV sales (blue slices) grow more slowly, and gasoline vehicle sales (gray slices) decline. EV adoption grows more slowly in the three metropolitan areas outside of ZEV states—Chicago, Illinois; Houston, Texas; and Miami, Florida. Our EV adoption trajectory for Houston is slightly slower than the metropolitan area leadership’s goal of 30% EV sales by 2030 (EVolve Houston, 2021); in that year, we project EV new sales share will be 25%. EV sales are expected to grow faster in Miami than in the other two cities because the rate of adoption is already ahead of the non-ZEV state trajectory that would put it at 100% EV market share in 2040. Similarly, adoption as of 2020 was ahead of the ZEV state trajectory in Seattle and Los Angeles, whereas other cities like New York catch up in later years, putting all cities in ZEV states on track for 100% market share by 2035. Based on GDP trends, we expect total vehicle sales to grow by 11% in Houston and Seattle between 2020 and 2030, although sales in Chicago will decline by 7%.

6 ICCT WHITE PAPER | CHARGING UP AMERICA: ASSESSING U.S. CHARGING INFRASTRUCTURE THROUGH 2030
Miami New York Seattle
Chicago Houston Los Angeles
2020 2025 2030 2020 2025 2030 2020 2025 2030
2020 2025 2030 2020 2025 2030 2020 2025 20300
200,000
400,000
0
50,000
100,000
150,000
200,000
0
100,000
200,000
300,000
400,000
0
200,000
400,000
600,000
800,000
0
100,000
200,000
300,000
400,000
0
100,000
200,000
300,000
New
veh
icle
sal
es
Fuel type PHEV BEV Gasoline
Figure 2. Annual sales by vehicle technology for selected metropolitan areas.
LOWER-INCOME COMMUNITIESFor each region, we also estimate EV adoption within lower-income communities. These are defined as census tracts with median income less than 80% of the region-wide median, or less than 80% of the state-wide median for rural areas, also known as low- and moderate-income (LMI) areas (U.S. Department of Housing and Urban Development, 2021). Based on vehicle registration data from Atlas EVHub (Atlas Public Policy, 2021b), we estimate that EV adoption in lower-income communities was 60% of the regional average in 2020. Given decreasing vehicle prices and expanding model availability (Bauer, Hsu, & Lutsey, 2021), the EV new sales share in these areas catches up to the regional average by 2026 in this analysis. We assume the distribution of PHEVs versus BEVs and cars versus light trucks among lower-income EV buyers is the same as in the general population. Throughout this analysis, we report results for both the general population and lower-income communities, allowing us to draw specific conclusions related to infrastructure needs within disadvantaged communities in each region.
VEHICLE STOCK-TURNOVER MODELThe EV sales curves serve as inputs to a vehicle stock-turnover model that adds new sales to each region in each year and removes vehicles based on the scrappage rate corresponding to the vehicle’s age and size category from the Transportation Energy Data Book (Oak Ridge National Laboratory, 2020). Considering advances in battery and EV drivetrain technology (Hanley, 2019; Kane, 2020; Way, 2019), EVs and gasoline vehicles are assumed to have the same lifespan.

7 ICCT WHITE PAPER | CHARGING UP AMERICA: ASSESSING U.S. CHARGING INFRASTRUCTURE THROUGH 2030
Not all regions of the United States have the same rate of new vehicle acquisition and scrappage of older vehicles. Some areas have higher new sales and are net exporters of used vehicles, while others are net importers of used vehicles. To adjust for these dynamics, we apply data from the National Household Travel Survey (U.S. Federal Highway Administration, 2018) to incorporate how vehicle age varies with income, state, household vehicle ownership, and population density. This model estimates the average vehicle age in each census tract, then aggregates the results to estimate the average vehicle age in each region, for both the general population and only lower-income communities.
As shown by the distribution of vehicles by age in 2020 in Figure 3, scrappage leads to declining vehicle counts with age in each region (represented as different colored lines). From the data we apply, there are fewer vehicles 11 years and 12 years of age due to the decrease in new vehicle sales around the 2009 financial crisis. Within the region-to-region variation among major metropolitan areas, New York has the highest percentage of new vehicles and an average vehicle age of 7.8 years; Seattle has the oldest fleet average vehicle age, at 10.8 years. Within lower-income communities, the age distribution mirrors the overall region, but there are fewer new vehicle sales and the distribution is shifted somewhat toward older vehicles. In most regions, the average vehicle age in lower-income communities is slightly more than one year older than the average age of vehicles owned by the general population.
General population Lower−income areas
0 10 20 30 0 10 20 300.0%
2.0%
4.0%
6.0%
8.0%
Vehicle age (years)
Per
cent
of
all v
ehic
les
New YorkMiamiHoustonChicagoSeattleLos Angeles
Figure 3. Distribution of vehicle ages in 2020 for selected metropolitan areas.
The vehicle stock-turnover rate across each region is calibrated such that the resulting average vehicle age of the vehicle fleet matched estimates for each region and the total number of vehicles in each region matches data from the American Community Survey (U.S. Census Bureau, 2020a). Vehicle populations are also validated by comparing EV stock data to EV registration data for selected states from Atlas Public Policy (2020). Finally, we also adjust overall vehicle ownership patterns to match

8 ICCT WHITE PAPER | CHARGING UP AMERICA: ASSESSING U.S. CHARGING INFRASTRUCTURE THROUGH 2030
projected trends from the Annual Energy Outlook report (U.S. Energy Information Administration, 2020). These calibration steps ensure that future trends are realistic and compatible with historical vehicle ownership patterns.
Based on survey data from the National Household Travel Survey (U.S. Federal Highway Administration, 2018) and Transportation Energy Data Book (Oak Ridge National Laboratory, 2020), we estimate the annual vehicle miles traveled (VMT) by vehicle age and vehicle class. As with vehicle ownership, we also adjust nationwide VMT to match projected trends from the Annual Energy Outlook report (U.S. Energy Information Administration, 2020).
Our estimations of EV miles traveled are based on several sources. Based on Plötz, Moll, Bieker, Mock, and Li (2020), average PHEVs are assumed to drive 54% of their miles on electricity. To account for earlier, shorter-range BEVs being driven somewhat less than gasoline vehicles each year, we assume that each BEV sold in 2016 and earlier drives 80% as much as a corresponding gasoline vehicle. Based on findings that newer BEVs are driven at least as much as gasoline vehicles (Chakraborty, Hardman, Karten, & Tal, 2021), we assume this ratio increases by 4 percentage points each year, reaching 100% for BEVs sold in 2021 and onward. Based on Lutsey and Nicholas (2019b), we assume BEV cars consume 0.33 kilowatt hours (kWh) per mile in 2020, BEV light trucks consume 0.53 kWh/mile, and PHEVs consume 2% more than a comparable BEV when driving on electricity. As technology improves, we estimate the EV per-mile efficiency within each class to improve by roughly 10% by 2030.
CHARGING BY HOUSING TYPEUsing data at the census tract level from the American Communities Survey (U.S. Census Bureau, 2020a), we estimate the share of vehicles in each region by employment status (commuter versus non-commuter) and housing type for both lower-income communities and the general population (including all census tracts). Because the Census does not include joint distributions for vehicle ownership by commute status and housing type, we assume that residents of single-family detached and attached homes own 25% more vehicles on average than residents of other housing types. Surveys show that early EV adopters are disproportionately commuters who live in single-family detached homes (Center for Sustainable Energy, 2016), so we adjust the housing type distribution for EV owners accordingly.
As shown in Figure 4, we estimate that in 2020, 81% of EV owners live in single-family detached homes (green and yellow bars), and 73% of EVs are used to commute to work (green, maroon, beige, and brown bars). As the EV market expands, we estimate that by 2025 these values for new EV buyers will converge with the nationwide overall single-family detached home and commuting percentages of 68% and 56%, respectively. The market evolution in lower-income communities mirrors this overall trend but is skewed somewhat toward higher percentages of vehicle commuters and drivers in apartments and attached homes.

9 ICCT WHITE PAPER | CHARGING UP AMERICA: ASSESSING U.S. CHARGING INFRASTRUCTURE THROUGH 2030
General population Lower−income areas
2020 2025 2030 2020 2025 20300%
25%
50%
75%
100%
Per
cent
EV
ow
ners
Housing typeOther − Non−commuterOther − CommuterApartment − Non−commuterApartment − CommuterAttached house − Non−commuterAttached house − CommuterDetached house − Non−commuterDetached house − Commuter
Home plug access
Figure 4. Distributions of housing type and home charging access by year, for the general population and only lower-income communities.
Home charging access: One of the biggest factors that will determine the amount of charging infrastructure required is how many EV owners have access to home charging. We estimate the home charging access among early EV adopters based on reported home charging access from 3,000 EV owners in surveys collected between 2014 and 2017 (Lee, Chakraborty, Hardman, & Tal, 2020; Tal, Nicholas, Davies, & Woodjack, 2014). As the market expands, more people who do not have access to home charging will purchase EVs, and so the percentage of EV owners with home charging access will decline. The Residential Energy Consumption Survey (RECS) (U.S. Energy Information Administration, 2015) provides data on the share of vehicles that park within a short distance of an electrical outlet, which approximates a lower bound on the amount of home charging; as more people install charging in their homes and change their parking behavior to accommodate an EV purchase, the amount of electrical outlet access will increase. Given these two countervailing forces, we estimate that home charging access for EV owners will fall slowly, converging to the average of the data representing early adopters and that representing the general population by 2030.
Reflecting these dynamics, Figure 4 depicts the estimated home charger access by home type, as the EV market expands from 2020 through 2030. For EV owners in single-family detached homes, this results in a decline in home plug access from 93% in 2020 to 80% in 2030. EV owners in other housing types start out with somewhat less home access, and the level of home access declines more; for example, we estimate 46% of EV owners in apartments have home plug access in 2020, but only 30% in 2030. Also shown in Figure 4, the overall average home charging access (represented by the black lines) falls from 88% in 2020 to 70% in 2030. In lower-income communities, access starts somewhat lower in 2020 at 83% and falls more rapidly as more apartment-dwellers enter the market, reaching 59% in 2030. Charging behavior also depends on whether drivers have access to a Level 1 or Level 2 plug at home. Based on Nicholas et al. (2019), we assume 40% of all EV drivers have Level 1 charging in 2020. Given current trends toward larger batteries and fast charging, we assume Level 1 home charging decreases to 20% by 2030.
10 ICCT WHITE PAPER | CHARGING UP AMERICA: ASSESSING U.S. CHARGING INFRASTRUCTURE THROUGH 2030
For each housing-commute-vehicle type cohort, we develop estimates for the proportion of total kWh required that will be supplied by each of the following charging types: home, workplace, public Level 2, and DC fast. Both workplace and public Level 2 stations in some locations can potentially serve EV owners who want to charge for a few hours during the day, or for longer periods overnight. This analysis is based primarily on the survey data presented in Tal et al. (2014) and Lee et al. (2020), which includes self-reported charging behavior over a seven-day period.
By comparing these results with analysis of real-world charging usage data, we extrapolate prevailing trends to estimate the total amount of energy that will be supplied by each charger category in each year. For example, DC fast charging has been highly utilized between 2018 and 2020, especially among Tesla owners (Tal et al., 2020), likely because the Supercharger network is ubiquitous, convenient, and in many cases subsidized (Keeney, 2016; Tesla, 2015). In 2019, Tesla reported total Supercharger generation that equates to an average of more than 100 kWh per vehicle per month (Kane, 2019), or more than 20% of estimated charging demand. Combining this with the survey mentioned above and other utilization data, we estimate that DC fast charging accounted for 11% of total charging demand in 2020.
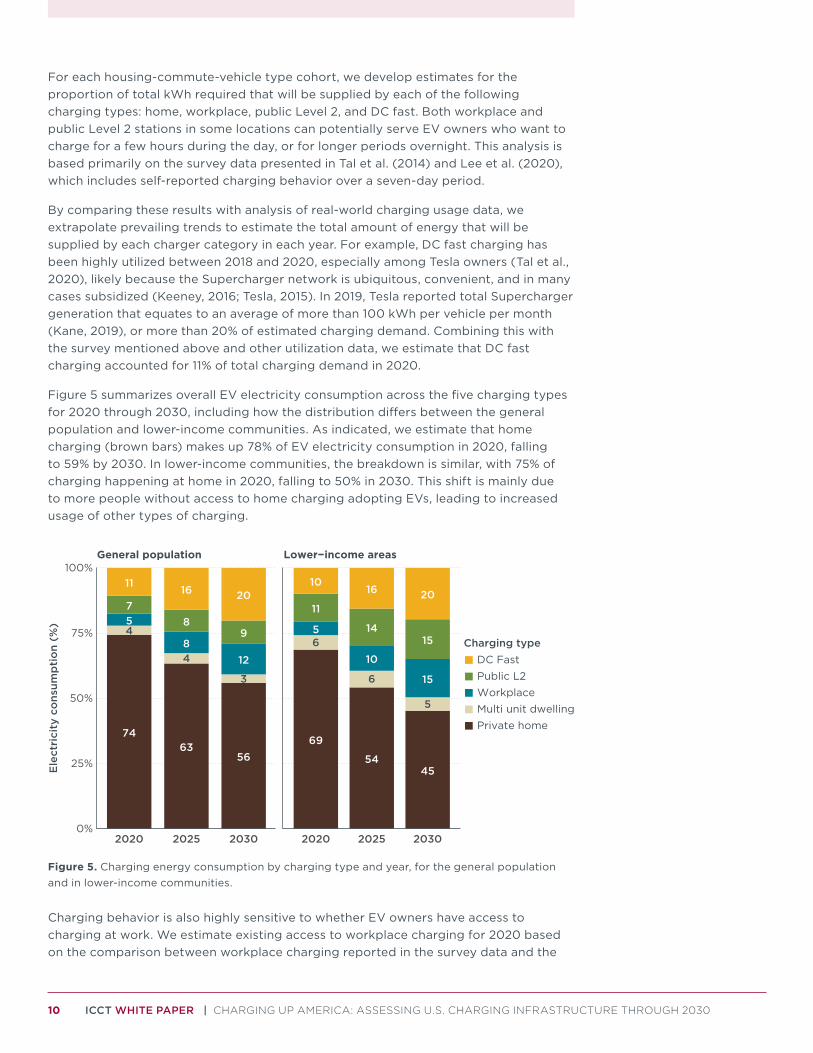
Figure 5 summarizes overall EV electricity consumption across the five charging types for 2020 through 2030, including how the distribution differs between the general population and lower-income communities. As indicated, we estimate that home charging (brown bars) makes up 78% of EV electricity consumption in 2020, falling to 59% by 2030. In lower-income communities, the breakdown is similar, with 75% of charging happening at home in 2020, falling to 50% in 2030. This shift is mainly due to more people without access to home charging adopting EVs, leading to increased usage of other types of charging.
General population Lower−income areas
74
457
11
2020
63
48
8
16
2025
56
3
12
9
20
2030
69
65
11
10
2020
54
6
10
14
16
2025
45
5
15
15
20
20300%
25%
50%
75%
100%
Ele
ctri
city
co
nsum
pti
on
(%)
Charging typeDC FastPublic L2WorkplaceMulti unit dwellingPrivate home
Figure 5. Charging energy consumption by charging type and year, for the general population and in lower-income communities.
Charging behavior is also highly sensitive to whether EV owners have access to charging at work. We estimate existing access to workplace charging for 2020 based on the comparison between workplace charging reported in the survey data and the
11 ICCT WHITE PAPER | CHARGING UP AMERICA: ASSESSING U.S. CHARGING INFRASTRUCTURE THROUGH 2030
estimated total amount of electricity produced by workplace charging stations in 2019. Many of these chargers are not publicly accessible, and previous studies have found that charger datasets systematically undercount chargers (Xu et al., 2021), so we compare data from PlugShare (2021) with reports from the Department of Energy’s Workplace Charging Challenge (U.S. Department of Energy, 2018) to estimate the number of missing chargers. We then integrate this analysis with charger usage data to estimate electricity supply.
Based on this analysis, we estimate that only about a third of EV commuters had access to charging at their workplace in 2020. However, usage is high among those who have access, and workplace charging is desirable due to its low cost and benefits to utilities, for example during days with low power demand and high renewable power availability (Szinai, Sheppard, Abhyankar, & Gopal, 2020). Thus, we project that access to workplace charging will expand to more than half of commuters with EVs by 2030. In turn, the percentage of charging energy coming from workplace chargers (blue bars in Figure 5) increases from 5% in 2020 to 12% in 2030. In the past few years, expansion in workplace charging has roughly kept pace with EV sales; this scenario represents an acceleration in workplace charging deployment in the future. It is likely that workers will begin to demand charging access as a standard benefit of employment, and based on recent trends (e.g., in PlugShare, 2021), workplace charging continues expanding in turn. As noted above, in many cases these chargers at workplaces will be used by nonemployees as well, such as at supermarkets, restaurants, or government buildings. As EV adoption increases in the future, boundaries between types of chargers will likely continue to blur.
CHARGER UTILIZATIONAs more EVs enter the market, charging infrastructure will continue to evolve from providing a minimum level of coverage, such that each EV owner has the opportunity to charge at convenient locations, to providing capacity, where there are enough chargers to serve overall demand. This shift from coverage to capacity leads to economies of scale that increase the number of hours per day each charger can be in service. Based on analysis of charger usage data, we find that chargers in regions with higher EV penetration tend to see higher levels of utilization. Based on these data we find that charger utilization increases roughly with the square root of the EV stock share. We extrapolate this relationship into the future based on the EV outputs from the vehicle stock-turnover model.
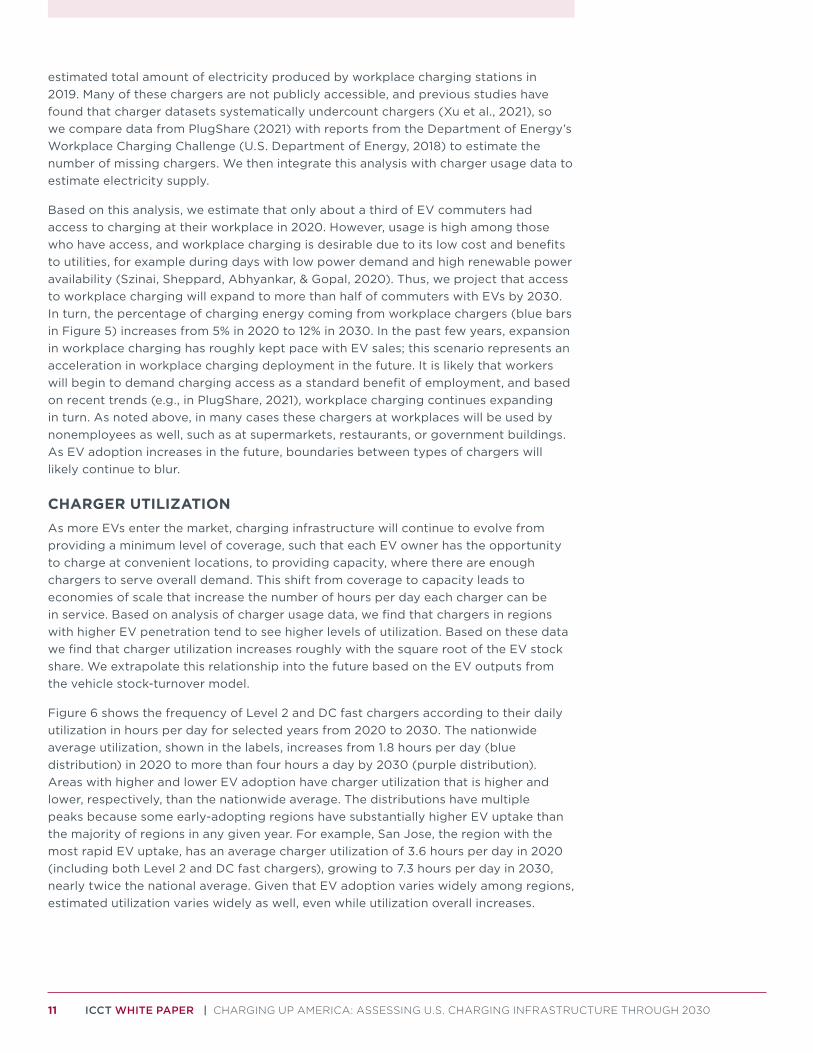
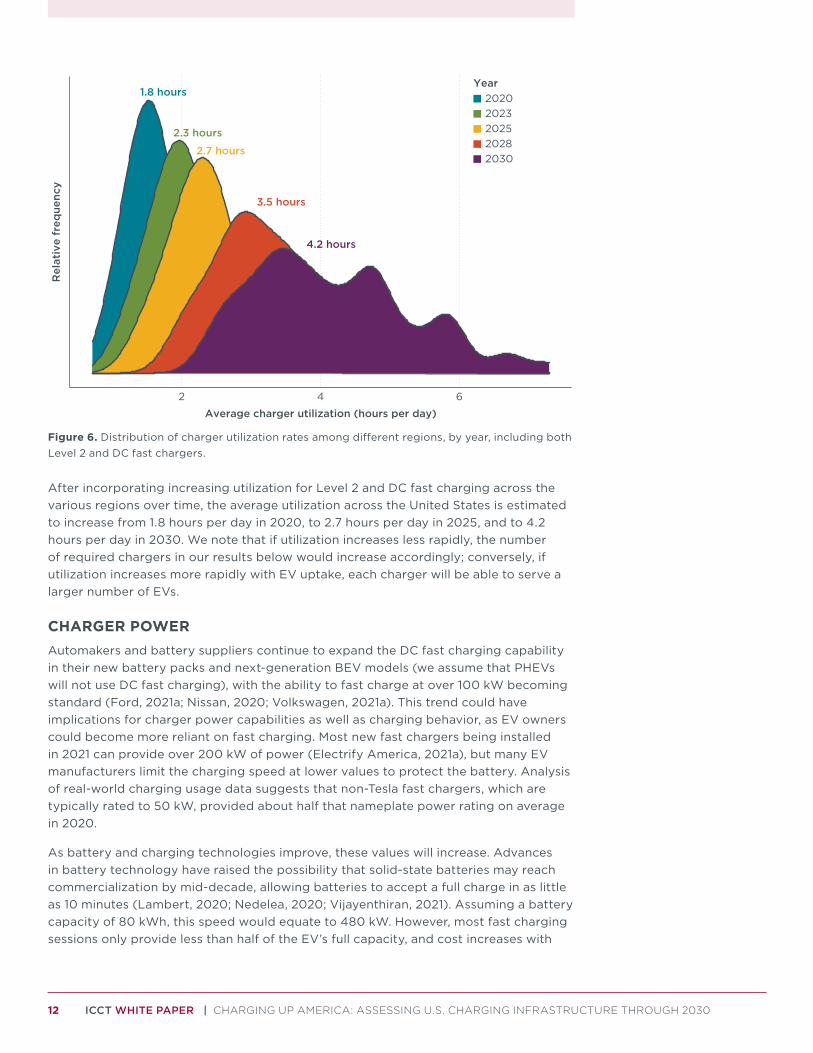
Figure 6 shows the frequency of Level 2 and DC fast chargers according to their daily utilization in hours per day for selected years from 2020 to 2030. The nationwide average utilization, shown in the labels, increases from 1.8 hours per day (blue distribution) in 2020 to more than four hours a day by 2030 (purple distribution). Areas with higher and lower EV adoption have charger utilization that is higher and lower, respectively, than the nationwide average. The distributions have multiple peaks because some early-adopting regions have substantially higher EV uptake than the majority of regions in any given year. For example, San Jose, the region with the most rapid EV uptake, has an average charger utilization of 3.6 hours per day in 2020 (including both Level 2 and DC fast chargers), growing to 7.3 hours per day in 2030, nearly twice the national average. Given that EV adoption varies widely among regions, estimated utilization varies widely as well, even while utilization overall increases.
12 ICCT WHITE PAPER | CHARGING UP AMERICA: ASSESSING U.S. CHARGING INFRASTRUCTURE THROUGH 2030
1.8 hours
2.3 hours
2.7 hours
3.5 hours
4.2 hours
2 4 6
Average charger utilization (hours per day)
Rel
ativ
e fr
eque
ncy
Year20202023202520282030
Figure 6. Distribution of charger utilization rates among different regions, by year, including both Level 2 and DC fast chargers.
After incorporating increasing utilization for Level 2 and DC fast charging across the various regions over time, the average utilization across the United States is estimated to increase from 1.8 hours per day in 2020, to 2.7 hours per day in 2025, and to 4.2 hours per day in 2030. We note that if utilization increases less rapidly, the number of required chargers in our results below would increase accordingly; conversely, if utilization increases more rapidly with EV uptake, each charger will be able to serve a larger number of EVs.
CHARGER POWERAutomakers and battery suppliers continue to expand the DC fast charging capability in their new battery packs and next-generation BEV models (we assume that PHEVs will not use DC fast charging), with the ability to fast charge at over 100 kW becoming standard (Ford, 2021a; Nissan, 2020; Volkswagen, 2021a). This trend could have implications for charger power capabilities as well as charging behavior, as EV owners could become more reliant on fast charging. Most new fast chargers being installed in 2021 can provide over 200 kW of power (Electrify America, 2021a), but many EV manufacturers limit the charging speed at lower values to protect the battery. Analysis of real-world charging usage data suggests that non-Tesla fast chargers, which are typically rated to 50 kW, provided about half that nameplate power rating on average in 2020.
As battery and charging technologies improve, these values will increase. Advances in battery technology have raised the possibility that solid-state batteries may reach commercialization by mid-decade, allowing batteries to accept a full charge in as little as 10 minutes (Lambert, 2020; Nedelea, 2020; Vijayenthiran, 2021). Assuming a battery capacity of 80 kWh, this speed would equate to 480 kW. However, most fast charging sessions only provide less than half of the EV’s full capacity, and cost increases with
13 ICCT WHITE PAPER | CHARGING UP AMERICA: ASSESSING U.S. CHARGING INFRASTRUCTURE THROUGH 2030
charging speed, so we expect that most drivers will ultimately charge more slowly, at roughly 200 kW. Many chargers will still exist that cannot provide this power, and such high charging speeds will likely increase vehicle cost, such that many consumers may elect for models with reduced charging capabilities. Yet, the ratio of fast chargers by speed has been shifting to higher speeds over the past few years, and we assume that this trend will continue. In 2020, Tesla captured 80% of BEV sales with all vehicles capable of charging at 150 kW or higher (Kane, 2021), suggesting that 50 kW charging may become less common in the next few years.
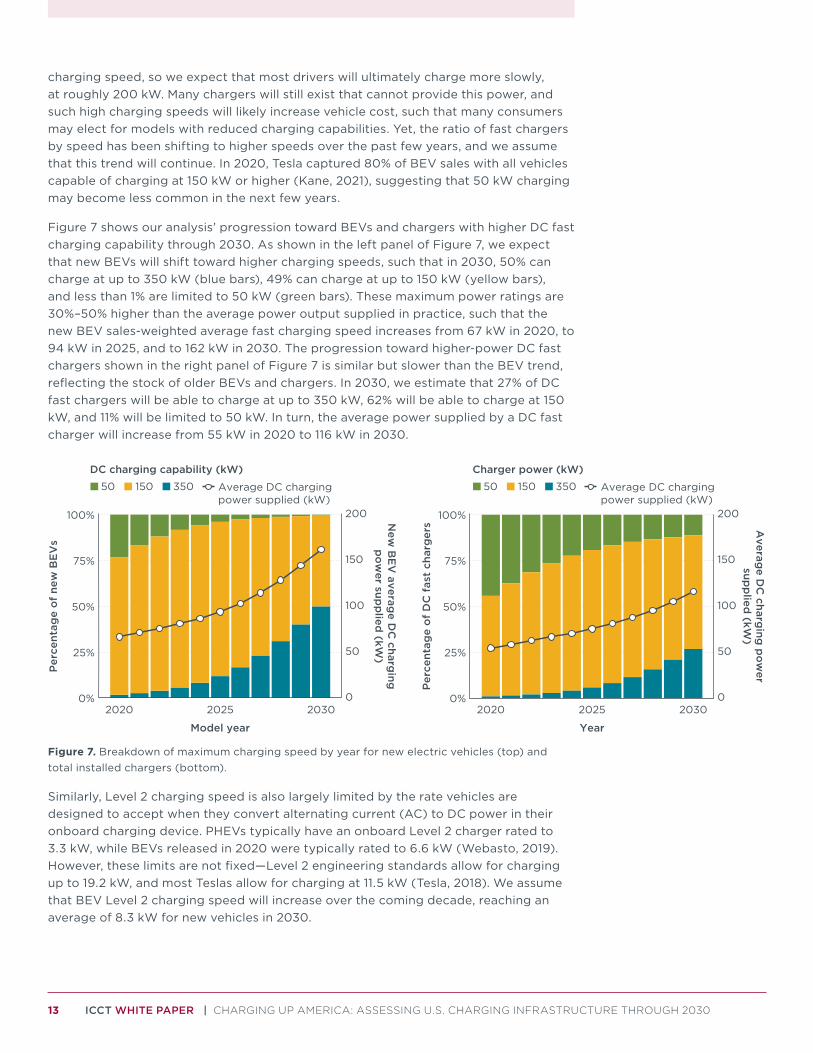
Figure 7 shows our analysis’ progression toward BEVs and chargers with higher DC fast charging capability through 2030. As shown in the left panel of Figure 7, we expect that new BEVs will shift toward higher charging speeds, such that in 2030, 50% can charge at up to 350 kW (blue bars), 49% can charge at up to 150 kW (yellow bars), and less than 1% are limited to 50 kW (green bars). These maximum power ratings are 30%–50% higher than the average power output supplied in practice, such that the new BEV sales-weighted average fast charging speed increases from 67 kW in 2020, to 94 kW in 2025, and to 162 kW in 2030. The progression toward higher-power DC fast chargers shown in the right panel of Figure 7 is similar but slower than the BEV trend, reflecting the stock of older BEVs and chargers. In 2030, we estimate that 27% of DC fast chargers will be able to charge at up to 350 kW, 62% will be able to charge at 150 kW, and 11% will be limited to 50 kW. In turn, the average power supplied by a DC fast charger will increase from 55 kW in 2020 to 116 kW in 2030.
0%
25%
50%
75%
100%
0
50
100
150
200
2020 2025 2030
Model year
Per
cent
age
of
new
BE
Vs
New
BE
V averag
e DC
charging
po
wer sup
plied
(kW)
DC charging capability (kW)50 150 350 Average DC charging
power supplied (kW)
0%
25%
50%
75%
100%
0
50
100
150
200
2020 2025 2030
Year
Per
cent
age
of
DC
fas
t ch
arg
ers A
verage D
C charg
ing p
ow
ersup
plied
(kW)
Charger power (kW)50 150 350 Average DC charging
power supplied (kW)
Figure 7. Breakdown of maximum charging speed by year for new electric vehicles (top) and total installed chargers (bottom).
Similarly, Level 2 charging speed is also largely limited by the rate vehicles are designed to accept when they convert alternating current (AC) to DC power in their onboard charging device. PHEVs typically have an onboard Level 2 charger rated to 3.3 kW, while BEVs released in 2020 were typically rated to 6.6 kW (Webasto, 2019). However, these limits are not fixed—Level 2 engineering standards allow for charging up to 19.2 kW, and most Teslas allow for charging at 11.5 kW (Tesla, 2018). We assume that BEV Level 2 charging speed will increase over the coming decade, reaching an average of 8.3 kW for new vehicles in 2030.
14 ICCT WHITE PAPER | CHARGING UP AMERICA: ASSESSING U.S. CHARGING INFRASTRUCTURE THROUGH 2030
ELECTRIC VEHICLE CHARGER COUNTSWe integrate charger utilization and power estimations to determine the amount of energy supplied by each charger of each type, and then quantify the number of chargers of each type required to meet our estimated charging demand in each year. We validate these results against charger stock data from Plugshare at the end of 2020 (PlugShare, 2021), and adjust our assumptions accordingly for each region.
We then use Longitudinal Employer-Household Dynamics Origin-Destination Employment Statistics (LODES) data (U.S. Census Bureau, 2020b) to adjust workplace charging for commutes between different regions and for charging required at workplaces in lower-income communities. This step generally leads to slightly higher workplace charger counts in major cities, and lower counts in surrounding areas. For example, workplace charger counts in 2030 in San Francisco increase by 8%, while counts in surrounding cities like Stockton and Santa Rosa decrease by 11%. The effect of such adjustments on workplace chargers needed in lower-income communities varies from city to city, ranging from an increase of 37% in Seattle to decreases of 11% in Los Angeles and 22% in Chicago. This approach reflects how more people tend to commute into lower-income communities from other areas than the other way around.
CHARGER COSTBuilding on a previous ICCT analysis (Nicholas, 2019), we examine trends and bottom-up cost charging infrastructure cost estimates out to 2030. The 2019 estimates were based on the earliest, generally lower-cost charging station sites and did not include those sites that charging providers deemed too costly. As EVs greatly increase in volume through 2030 and far more charging is expected by the increasing number of EV drivers, those looking to install charging will no longer have the luxury of simply choosing the lowest-cost sites. Many cities are mandating charger installations with new construction or significant building or parking facility renovations. In addition, many businesses are installing charging as a matter of course. Based on these trends, we assume a progression toward incrementally higher-cost sites in future installations. We model labor and material costs increasing by four percentage points per year from 2025 to 2030, for a total increase of 20%.
The Americans with Disabilities Act (ADA) requires reasonable accommodations for people with disabilities at all facilities. In California, regulations require some chargers at each location to have a path of travel from the charger to a building. If this cost exceeds 20% of project costs, the 20% must be still be spent on site improvements that address access needs (Clair, 2017). This requirement often means that the spaces closest to the transformer may not be chosen for installation of a charger, driving up project costs due to the increased material and labor required. We expect these regulations to gradually be applied uniformly as more states adopt ADA standards for charging stations. Starting in 2021, charger materials and labor costs will increase two and a half percentage points per year till 2025 for a total of a 10% increase in those costs.
Countervailing these cost increases are decreases in per-charger costs due to other factors, including increasing scale and more chargers being installed at larger sites. Permitting, labor, materials, and site preparation all benefit from economies of scale. In addition, scale and manufacturing learning cost reductions are estimated to result in a 3% annual cost reduction of per-charger hardware costs. Following Nicholas (2019), the number of chargers per site for Level 2 charging increases as a function of electric vehicle stock per capita. For fast charging sites, the proportion of larger sites increases

15 ICCT WHITE PAPER | CHARGING UP AMERICA: ASSESSING U.S. CHARGING INFRASTRUCTURE THROUGH 2030
each year such that by 2030, 70% of fast chargers are located at sites with at least six chargers. Even with increasing labor costs, the average cost for a 150 kW fast charger in 2030 is $100,416 versus $103,636 in 2021, showing how economies of scale decrease overall charger costs.
Several factors could lead to higher costs than reported here. This analysis does not include planning costs, which in some cases can increase total cost by more than 25% (Hsu, Slowik, & Lutsey, 2021b; Nelder & Rogers, 2019). By 2030 we assume that many of these soft costs will be mitigated by greater experience and operational efficiency.
ELECTRIC RIDE-HAILING CHARGINGWe incorporate increasing ride-hailing vehicle driving and an increasing fraction of such driving being made by EVs over time. Based on the number of trips completed by Uber between 2018 and 2020 (Uber, 2020) and Uber’s market share (Bosa, 2018), we estimate that ride-hailing vehicles were responsible for about 1% of all light-duty VMT annually between 2018 and 2020, and up to 3% in major metropolitan areas (Fehr & Peers, 2019). Assuming similar growth to that observed from 2018 to 2020, the ride-hailing VMT share is approximated to be 2.5% nationwide by 2030—as high as 5% in the largest regions, and lower elsewhere.
These ride-hailing trips are assumed to increasingly be undertaken with EVs due to company and policy developments. Based on recent announcements from Uber, Lyft, and the California Air Resources Board (Dooley, 2020), it is possible that ride-hailing companies will have substantially higher levels of EV penetration by 2030. We estimate that ride-hailing company driving that was done with EVs was 1% in 2020, based on Slowik, Fedirko, and Lutsey (2019). By 2030, we expect EV adoption by ride-hailing drivers will reach 100% in major metropolitan areas in ZEV states, 50% in other major metropolitan areas, and 10% elsewhere. These targets are lower than current industry goals because reaching higher levels of adoption could be difficult, taking into account constraints on vehicle supply and challenges with providing EV access for the many drivers who only work for ride-hailing companies a few hours a week.
Due to ride-hailing drivers’ work schedules and housing patterns, a greater share of charging is expected to happen at DC fast chargers than for private EVs. Based on Nicholas, Slowik, and Lutsey (2020), we assume 65% of ride-hailing charging will come from DC fast chargers and the rest will come from home charging. We assume that EVs used in ride-hailing are already accounted for in the private market, and so have no impact on home charging needs. Given that ride-hailing drivers require charging at different times of day than private users, each DC fast charger in urban areas (estimated at 50% of all DC fast chargers in each region) can provide an additional two hours of charging to ride-hailing drivers. The remainder of charging demand is assumed to be served by dedicated fast chargers, providing six hours of charging each day. This results in an estimated need of 23,000 dedicated DC fast chargers in 2030. If ride-hailing companies reach 100% EV adoption in 2030, this estimate would increase to roughly 42,000 dedicated DC fast chargers needed.
16 ICCT WHITE PAPER | CHARGING UP AMERICA: ASSESSING U.S. CHARGING INFRASTRUCTURE THROUGH 2030
RESULTS
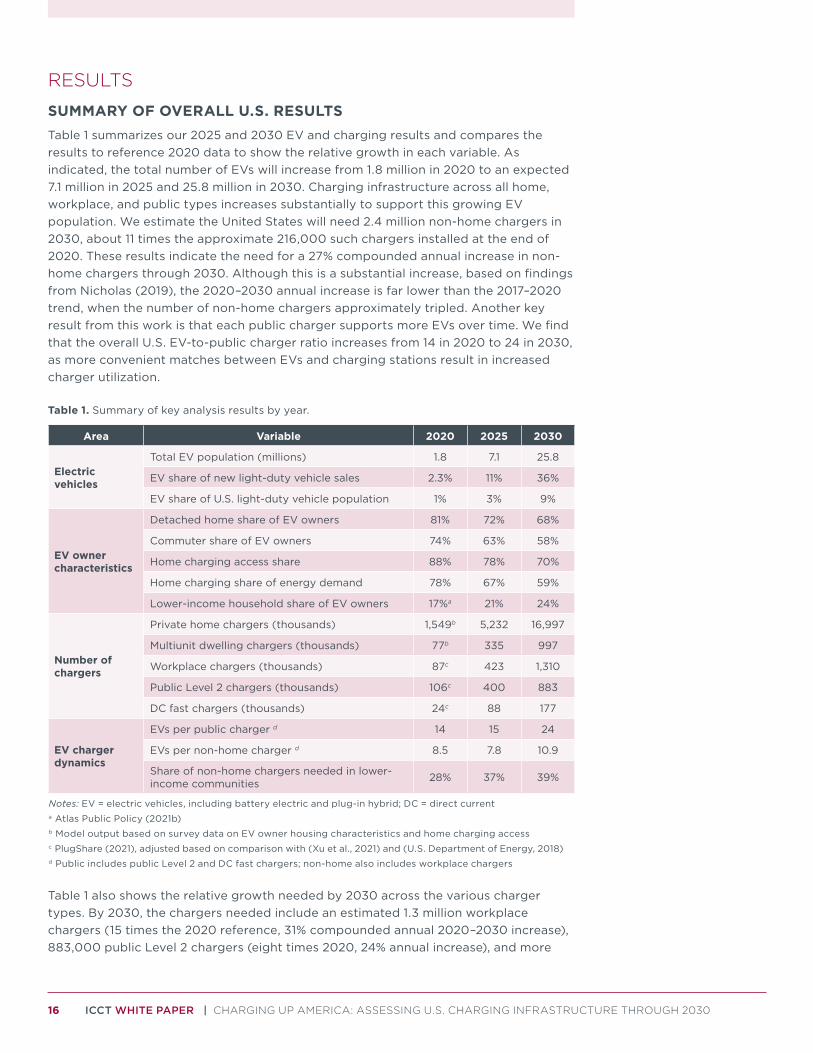
SUMMARY OF OVERALL U.S. RESULTSTable 1 summarizes our 2025 and 2030 EV and charging results and compares the results to reference 2020 data to show the relative growth in each variable. As indicated, the total number of EVs will increase from 1.8 million in 2020 to an expected 7.1 million in 2025 and 25.8 million in 2030. Charging infrastructure across all home, workplace, and public types increases substantially to support this growing EV population. We estimate the United States will need 2.4 million non-home chargers in 2030, about 11 times the approximate 216,000 such chargers installed at the end of 2020. These results indicate the need for a 27% compounded annual increase in non-home chargers through 2030. Although this is a substantial increase, based on findings from Nicholas (2019), the 2020–2030 annual increase is far lower than the 2017–2020 trend, when the number of non-home chargers approximately tripled. Another key result from this work is that each public charger supports more EVs over time. We find that the overall U.S. EV-to-public charger ratio increases from 14 in 2020 to 24 in 2030, as more convenient matches between EVs and charging stations result in increased charger utilization.
Table 1. Summary of key analysis results by year.
Area Variable 2020 2025 2030
Electric vehicles
Total EV population (millions) 1.8 7.1 25.8
EV share of new light-duty vehicle sales 2.3% 11% 36%
EV share of U.S. light-duty vehicle population 1% 3% 9%
EV owner characteristics
Detached home share of EV owners 81% 72% 68%
Commuter share of EV owners 74% 63% 58%
Home charging access share 88% 78% 70%
Home charging share of energy demand 78% 67% 59%
Lower-income household share of EV owners 17%a 21% 24%
Number of chargers
Private home chargers (thousands) 1,549b 5,232 16,997
Multiunit dwelling chargers (thousands) 77b 335 997
Workplace chargers (thousands) 87c 423 1,310
Public Level 2 chargers (thousands) 106c 400 883
DC fast chargers (thousands) 24c 88 177
EV charger dynamics
EVs per public charger d 14 15 24
EVs per non-home charger d 8.5 7.8 10.9
Share of non-home chargers needed in lower-income communities 28% 37% 39%
Notes: EV = electric vehicles, including battery electric and plug-in hybrid; DC = direct currenta Atlas Public Policy (2021b)b Model output based on survey data on EV owner housing characteristics and home charging accessc PlugShare (2021), adjusted based on comparison with (Xu et al., 2021) and (U.S. Department of Energy, 2018)d Public includes public Level 2 and DC fast chargers; non-home also includes workplace chargers
Table 1 also shows the relative growth needed by 2030 across the various charger types. By 2030, the chargers needed include an estimated 1.3 million workplace chargers (15 times the 2020 reference, 31% compounded annual 2020–2030 increase), 883,000 public Level 2 chargers (eight times 2020, 24% annual increase), and more
17 ICCT WHITE PAPER | CHARGING UP AMERICA: ASSESSING U.S. CHARGING INFRASTRUCTURE THROUGH 2030
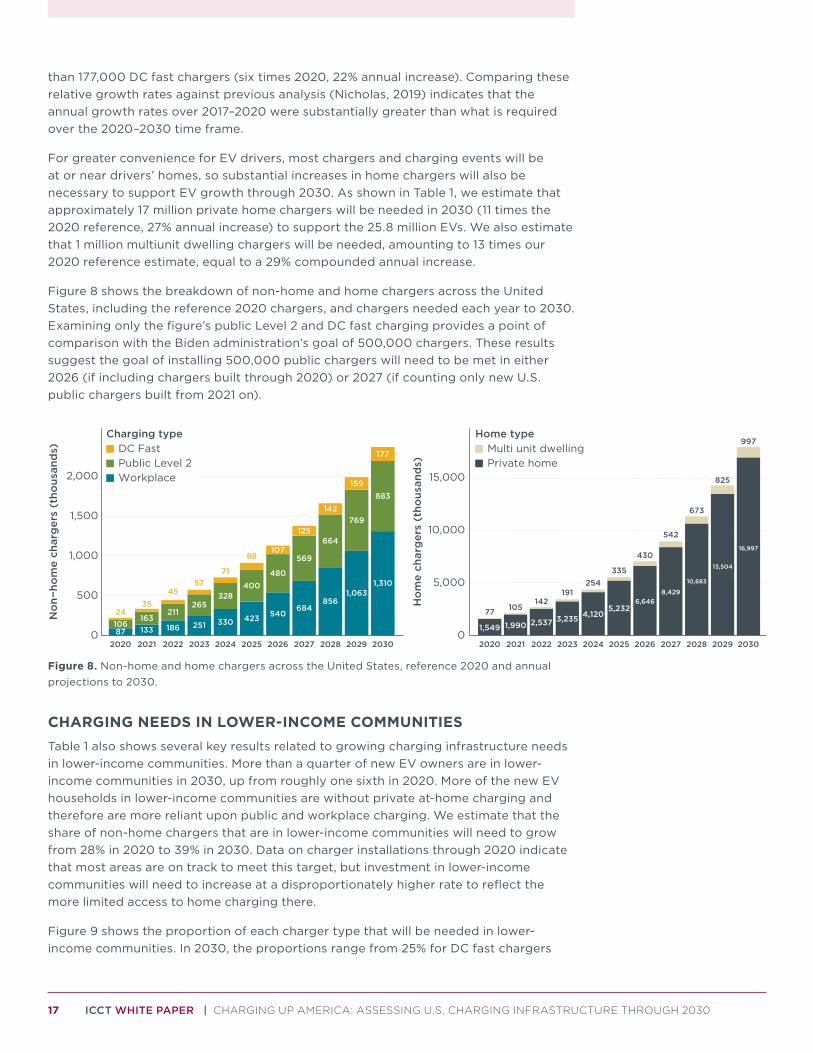
than 177,000 DC fast chargers (six times 2020, 22% annual increase). Comparing these relative growth rates against previous analysis (Nicholas, 2019) indicates that the annual growth rates over 2017–2020 were substantially greater than what is required over the 2020–2030 time frame.
For greater convenience for EV drivers, most chargers and charging events will be at or near drivers’ homes, so substantial increases in home chargers will also be necessary to support EV growth through 2030. As shown in Table 1, we estimate that approximately 17 million private home chargers will be needed in 2030 (11 times the 2020 reference, 27% annual increase) to support the 25.8 million EVs. We also estimate that 1 million multiunit dwelling chargers will be needed, amounting to 13 times our 2020 reference estimate, equal to a 29% compounded annual increase.
Figure 8 shows the breakdown of non-home and home chargers across the United States, including the reference 2020 chargers, and chargers needed each year to 2030. Examining only the figure’s public Level 2 and DC fast charging provides a point of comparison with the Biden administration’s goal of 500,000 chargers. These results suggest the goal of installing 500,000 public chargers will need to be met in either 2026 (if including chargers built through 2020) or 2027 (if counting only new U.S. public chargers built from 2021 on).
0 0
500
1,000
1,500
2,000
2020 2021 2022 2023 2024 2025 2026 2027 2028 2029 2030
No
n−ho
me
char
ger
s (t
hous
and
s)
5,000
10,000
15,000
2020 2021 2022 2023 2024 2025 2026 2027 2028 2029 2030
Ho
me
char
ger
s (t
hous
and
s)
87 133 186 251 330 423 540684
8561,063
1,310
106163
211265
328400
480
569
664
769
883
2435
4557
71
88107
125
142
159
177
Charging typeDC FastPublic Level 2Workplace
1,549 1,990 2,537 3,235 4,1205,232
6,6468,429
10,683
13,504
16,997
77 105142
191254
335
430
542
673
825
997Home type
Multi unit dwellingPrivate home
Figure 8. Non-home and home chargers across the United States, reference 2020 and annual projections to 2030.
CHARGING NEEDS IN LOWER-INCOME COMMUNITIESTable 1 also shows several key results related to growing charging infrastructure needs in lower-income communities. More than a quarter of new EV owners are in lower-income communities in 2030, up from roughly one sixth in 2020. More of the new EV households in lower-income communities are without private at-home charging and therefore are more reliant upon public and workplace charging. We estimate that the share of non-home chargers that are in lower-income communities will need to grow from 28% in 2020 to 39% in 2030. Data on charger installations through 2020 indicate that most areas are on track to meet this target, but investment in lower-income communities will need to increase at a disproportionately higher rate to reflect the more limited access to home charging there.
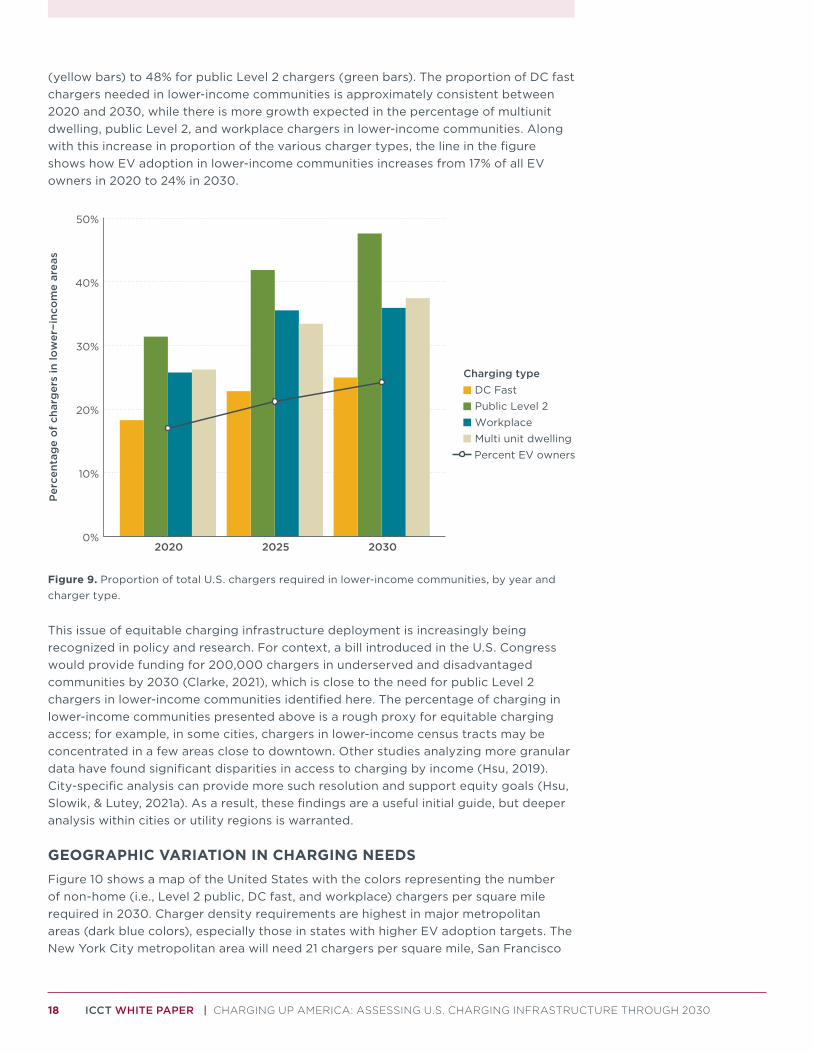
Figure 9 shows the proportion of each charger type that will be needed in lower-income communities. In 2030, the proportions range from 25% for DC fast chargers
18 ICCT WHITE PAPER | CHARGING UP AMERICA: ASSESSING U.S. CHARGING INFRASTRUCTURE THROUGH 2030
(yellow bars) to 48% for public Level 2 chargers (green bars). The proportion of DC fast chargers needed in lower-income communities is approximately consistent between 2020 and 2030, while there is more growth expected in the percentage of multiunit dwelling, public Level 2, and workplace chargers in lower-income communities. Along with this increase in proportion of the various charger types, the line in the figure shows how EV adoption in lower-income communities increases from 17% of all EV owners in 2020 to 24% in 2030.
0%
10%
20%
30%
40%
50%
2020 2025 2030
Per
cent
age
of
char
ger
s in
low
er−i
nco
me
area
s
Percent EV owners
Charging typeDC FastPublic Level 2WorkplaceMulti unit dwelling
Figure 9. Proportion of total U.S. chargers required in lower-income communities, by year and charger type.
This issue of equitable charging infrastructure deployment is increasingly being recognized in policy and research. For context, a bill introduced in the U.S. Congress would provide funding for 200,000 chargers in underserved and disadvantaged communities by 2030 (Clarke, 2021), which is close to the need for public Level 2 chargers in lower-income communities identified here. The percentage of charging in lower-income communities presented above is a rough proxy for equitable charging access; for example, in some cities, chargers in lower-income census tracts may be concentrated in a few areas close to downtown. Other studies analyzing more granular data have found significant disparities in access to charging by income (Hsu, 2019). City-specific analysis can provide more such resolution and support equity goals (Hsu, Slowik, & Lutey, 2021a). As a result, these findings are a useful initial guide, but deeper analysis within cities or utility regions is warranted.
GEOGRAPHIC VARIATION IN CHARGING NEEDSFigure 10 shows a map of the United States with the colors representing the number of non-home (i.e., Level 2 public, DC fast, and workplace) chargers per square mile required in 2030. Charger density requirements are highest in major metropolitan areas (dark blue colors), especially those in states with higher EV adoption targets. The New York City metropolitan area will need 21 chargers per square mile, San Francisco

19 ICCT WHITE PAPER | CHARGING UP AMERICA: ASSESSING U.S. CHARGING INFRASTRUCTURE THROUGH 2030
will need 32 chargers per square mile, and Los Angeles will need 36 chargers per square mile. In contrast, in parts of the rural West, less than one public charger will be needed every 100 square miles (light colors).
0.010
0.100
1.000
10.000
Chargersper sq. mi.
Los AngelesLos Angeles
MiamiMiami
New YorkNew York
SeattleSeattle
HoustonHoustonHouston
Los Angeles
Miami
New York
Seattle
ChicagoChicagoChicago
Figure 10. Map showing density of non-home chargers per square mile needed in 2030, by region.
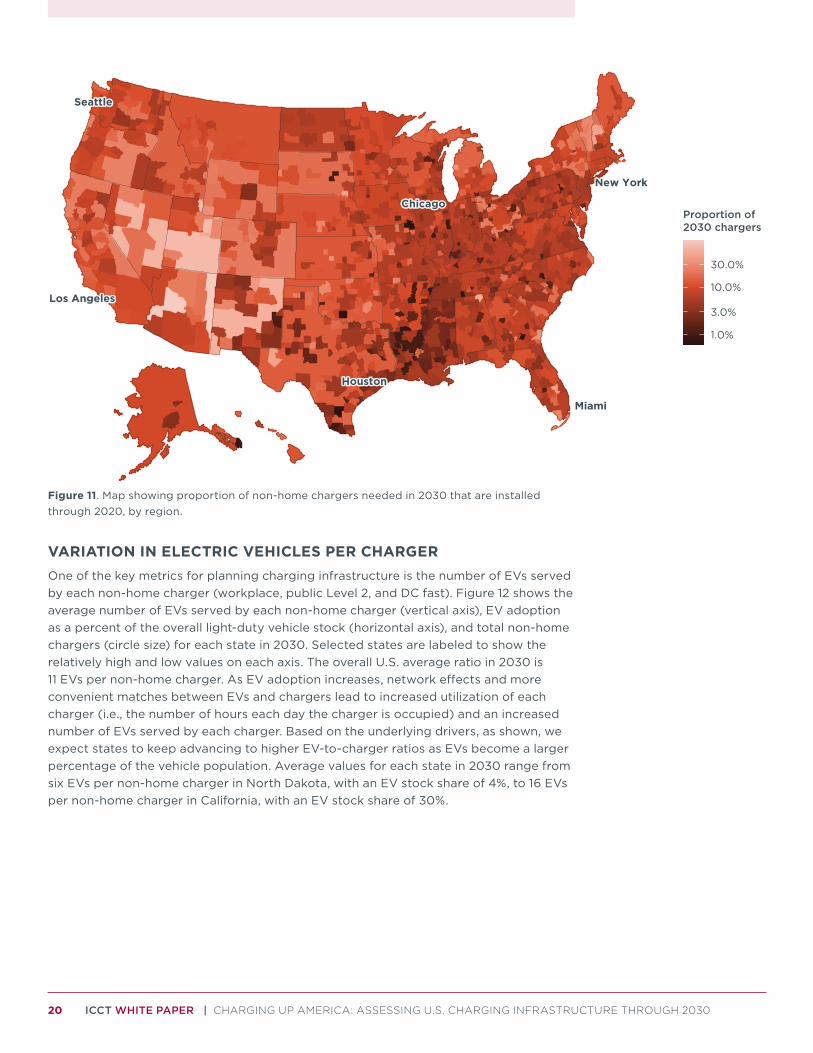
Figure 11 shows a similar map, but with the colors representing the proportion of non-home chargers needed in 2030 that are installed at the end of 2020 in each region. Most areas had 10% of their 2030 charging needs met in 2020 and therefore will need at least 10 times more non-home chargers in 2030. A few of the lighter-colored areas have relatively higher fractions of the 2030 infrastructure needs already installed. For example, parts of the rural West with low charging needs in 2030 already have more than half the required charging installed. The relative charging needs are greatest in parts of the Midwest and South that had low levels of EV adoption through 2020 but will likely experience more rapid EV uptake in the later part of the decade (dark colors).
20 ICCT WHITE PAPER | CHARGING UP AMERICA: ASSESSING U.S. CHARGING INFRASTRUCTURE THROUGH 2030
Los AngelesLos Angeles
MiamiMiami
New YorkNew York
SeattleSeattle
1.0%
3.0%
10.0%
30.0%
Proportion of2030 chargers
ChicagoChicagoChicago
HoustonHoustonHouston
Los Angeles
Miami
New York
Seattle
Figure 11. Map showing proportion of non-home chargers needed in 2030 that are installed through 2020, by region.
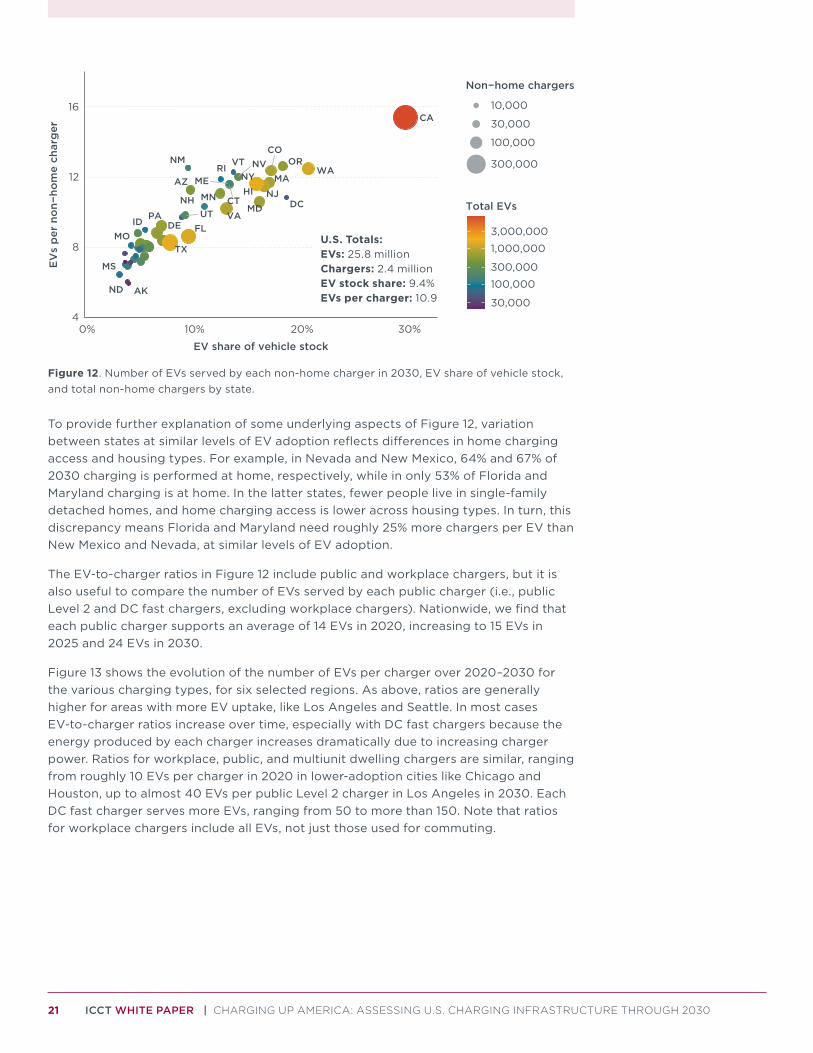
VARIATION IN ELECTRIC VEHICLES PER CHARGEROne of the key metrics for planning charging infrastructure is the number of EVs served by each non-home charger (workplace, public Level 2, and DC fast). Figure 12 shows the average number of EVs served by each non-home charger (vertical axis), EV adoption as a percent of the overall light-duty vehicle stock (horizontal axis), and total non-home chargers (circle size) for each state in 2030. Selected states are labeled to show the relatively high and low values on each axis. The overall U.S. average ratio in 2030 is 11 EVs per non-home charger. As EV adoption increases, network effects and more convenient matches between EVs and chargers lead to increased utilization of each charger (i.e., the number of hours each day the charger is occupied) and an increased number of EVs served by each charger. Based on the underlying drivers, as shown, we expect states to keep advancing to higher EV-to-charger ratios as EVs become a larger percentage of the vehicle population. Average values for each state in 2030 range from six EVs per non-home charger in North Dakota, with an EV stock share of 4%, to 16 EVs per non-home charger in California, with an EV stock share of 30%.
21 ICCT WHITE PAPER | CHARGING UP AMERICA: ASSESSING U.S. CHARGING INFRASTRUCTURE THROUGH 2030
AK
AZ
CA
CO
CT
DE FL
HI
ID
ME
MD
MA
MN
MS
MO
NV
NHNJ
NM
NY
ND
OR
PA
RI
TX
UT
VT
VA
WA
DC
4
8
12
16
0% 10% 20% 30%
EV share of vehicle stock
EV
s p
er n
on−
hom
e ch
arg
er
Non−home chargers
10,000
30,000
100,000
300,000
30,000
100,000
300,000
1,000,000
3,000,000
Total EVs
Figure 12. Number of EVs served by each non-home charger in 2030, EV share of vehicle stock, and total non-home chargers by state.
To provide further explanation of some underlying aspects of Figure 12, variation between states at similar levels of EV adoption reflects differences in home charging access and housing types. For example, in Nevada and New Mexico, 64% and 67% of 2030 charging is performed at home, respectively, while in only 53% of Florida and Maryland charging is at home. In the latter states, fewer people live in single-family detached homes, and home charging access is lower across housing types. In turn, this discrepancy means Florida and Maryland need roughly 25% more chargers per EV than New Mexico and Nevada, at similar levels of EV adoption.
The EV-to-charger ratios in Figure 12 include public and workplace chargers, but it is also useful to compare the number of EVs served by each public charger (i.e., public Level 2 and DC fast chargers, excluding workplace chargers). Nationwide, we find that each public charger supports an average of 14 EVs in 2020, increasing to 15 EVs in 2025 and 24 EVs in 2030.
Figure 13 shows the evolution of the number of EVs per charger over 2020–2030 for the various charging types, for six selected regions. As above, ratios are generally higher for areas with more EV uptake, like Los Angeles and Seattle. In most cases EV-to-charger ratios increase over time, especially with DC fast chargers because the energy produced by each charger increases dramatically due to increasing charger power. Ratios for workplace, public, and multiunit dwelling chargers are similar, ranging from roughly 10 EVs per charger in 2020 in lower-adoption cities like Chicago and Houston, up to almost 40 EVs per public Level 2 charger in Los Angeles in 2030. Each DC fast charger serves more EVs, ranging from 50 to more than 150. Note that ratios for workplace chargers include all EVs, not just those used for commuting.
U.S. Totals:EVs: 25.8 millionChargers: 2.4 millionEV stock share: 9.4%EVs per charger: 10.9

22 ICCT WHITE PAPER | CHARGING UP AMERICA: ASSESSING U.S. CHARGING INFRASTRUCTURE THROUGH 2030
DC Fast Multi unit dwelling
Workplace Public Level 2
Chicago Houston LosAngeles
Miami New York Seattle Chicago Houston LosAngeles
Miami New York Seattle
Chicago Houston LosAngeles
Miami New York Seattle Chicago Houston LosAngeles
Miami New York Seattle
0
10
20
30
0
5
10
15
20
25
0
10
20
0
50
100
150
EV
s p
er c
harg
er
2020 2025 2030
Figure 13. Number of EVs served by each charger type for selected regions for 2020–2030.
The number of EVs served by each charger remains relatively unchanged between 2020 and 2025 because the increased utilization of each charger is offset by increased demand for non-home charging. As EVs enter the mainstream market, more consumers without access to home charging will purchase an EV, increasing the need for chargers at other locations. In particular, more EV owners will reside in apartments and depend on charging at workplaces and multiunit dwellings, such that the number of EVs served by each charger decreases for each of these charger types between 2020 and 2025. After 2025, the EV market resembles the general population of vehicle buyers, so the demographics of EV owners and corresponding charging behavior are more stable. Utilization rates increase due to increased EV share of vehicle stock in each region, leading to more convenient matches between EVs and chargers.
Based on analysis of long-distance travel behavior (U.S. Federal Highway Administration, 2018), we estimate that, on average, 8% of charging energy will come from DC fast chargers along major corridors where drivers will stop part-way through their trip. This estimate assumes drivers will charge at home before and after the trip as long as they have at least an hour to do so, and that charging will be available at 50% of non-home destinations. In turn, based on analysis of road networks in each state, we find that roughly 19% of DC fast chargers will need to be located along corridors outside of urban areas. The percentage of DC fast charging that is along corridors is higher in more rural states, ranging from 4% in Massachusetts and 11% in California, up to 50% in Idaho and 76% in Wyoming.
COMPARISON WITH PREVIOUS ANALYSESPrevious studies have found the projected public charging infrastructure needs vary greatly depending on key underlying assumptions, geography, and other factors. Various studies’ projections indicate a range from 12 EVs to 129 EVs per public charger, with an average of about 37 EVs per public charger (see Table 2). This study’s EV-to-public charger ratio of 24 is among the middle of the studies—and including workplace charger makes this study’s EV-to-non-home chargers on the lower side of the studies’ EV-to-charger ratios. The studies’ geographic scales range from metropolitan areas to the entire United States. The studies generally apply relatively low EV adoption rates,
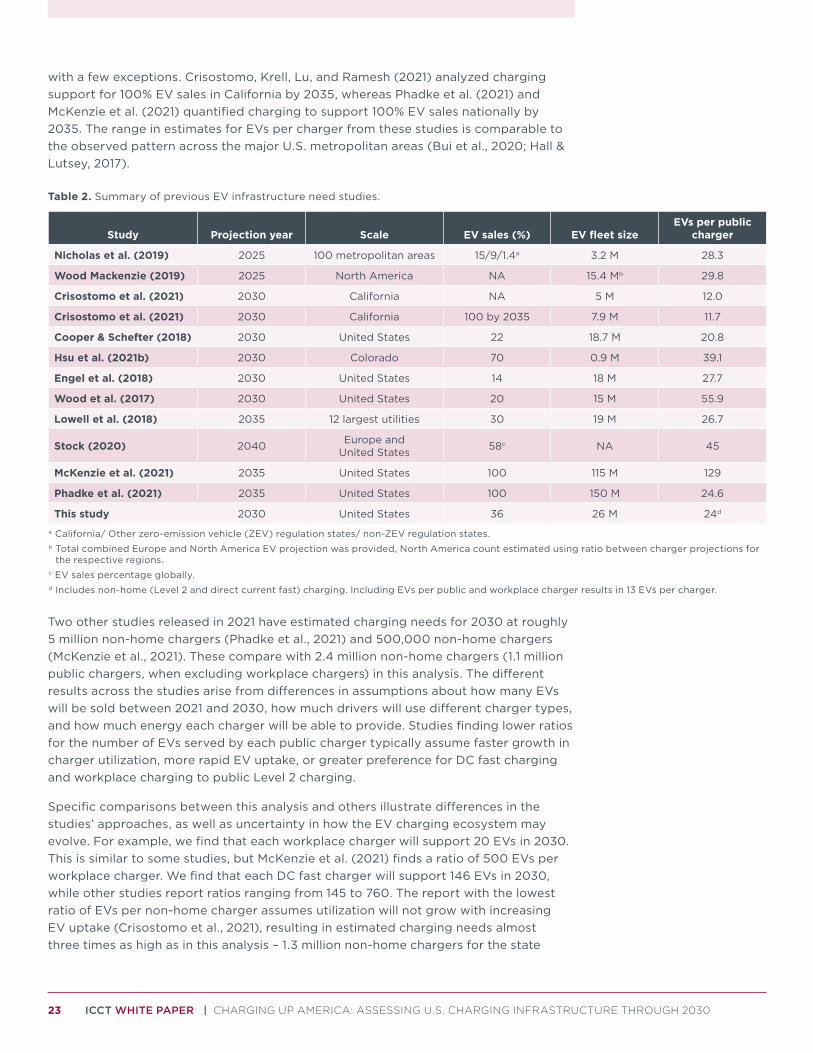
23 ICCT WHITE PAPER | CHARGING UP AMERICA: ASSESSING U.S. CHARGING INFRASTRUCTURE THROUGH 2030
with a few exceptions. Crisostomo, Krell, Lu, and Ramesh (2021) analyzed charging support for 100% EV sales in California by 2035, whereas Phadke et al. (2021) and McKenzie et al. (2021) quantified charging to support 100% EV sales nationally by 2035. The range in estimates for EVs per charger from these studies is comparable to the observed pattern across the major U.S. metropolitan areas (Bui et al., 2020; Hall & Lutsey, 2017).
Table 2. Summary of previous EV infrastructure need studies.
Study Projection year Scale EV sales (%) EV fleet sizeEVs per public
charger
Nicholas et al. (2019) 2025 100 metropolitan areas 15/9/1.4a 3.2 M 28.3
Wood Mackenzie (2019) 2025 North America NA 15.4 Mb 29.8
Crisostomo et al. (2021) 2030 California NA 5 M 12.0
Crisostomo et al. (2021) 2030 California 100 by 2035 7.9 M 11.7
Cooper & Schefter (2018) 2030 United States 22 18.7 M 20.8
Hsu et al. (2021b) 2030 Colorado 70 0.9 M 39.1
Engel et al. (2018) 2030 United States 14 18 M 27.7
Wood et al. (2017) 2030 United States 20 15 M 55.9
Lowell et al. (2018) 2035 12 largest utilities 30 19 M 26.7
Stock (2020) 2040 Europe and United States 58c NA 45
McKenzie et al. (2021) 2035 United States 100 115 M 129
Phadke et al. (2021) 2035 United States 100 150 M 24.6
This study 2030 United States 36 26 M 24d
a California/ Other zero-emission vehicle (ZEV) regulation states/ non-ZEV regulation states.b Total combined Europe and North America EV projection was provided, North America count estimated using ratio between charger projections for
the respective regions.c EV sales percentage globally.d Includes non-home (Level 2 and direct current fast) charging. Including EVs per public and workplace charger results in 13 EVs per charger.
Two other studies released in 2021 have estimated charging needs for 2030 at roughly 5 million non-home chargers (Phadke et al., 2021) and 500,000 non-home chargers (McKenzie et al., 2021). These compare with 2.4 million non-home chargers (1.1 million public chargers, when excluding workplace chargers) in this analysis. The different results across the studies arise from differences in assumptions about how many EVs will be sold between 2021 and 2030, how much drivers will use different charger types, and how much energy each charger will be able to provide. Studies finding lower ratios for the number of EVs served by each public charger typically assume faster growth in charger utilization, more rapid EV uptake, or greater preference for DC fast charging and workplace charging to public Level 2 charging.
Specific comparisons between this analysis and others illustrate differences in the studies’ approaches, as well as uncertainty in how the EV charging ecosystem may evolve. For example, we find that each workplace charger will support 20 EVs in 2030. This is similar to some studies, but McKenzie et al. (2021) finds a ratio of 500 EVs per workplace charger. We find that each DC fast charger will support 146 EVs in 2030, while other studies report ratios ranging from 145 to 760. The report with the lowest ratio of EVs per non-home charger assumes utilization will not grow with increasing EV uptake (Crisostomo et al., 2021), resulting in estimated charging needs almost three times as high as in this analysis – 1.3 million non-home chargers for the state
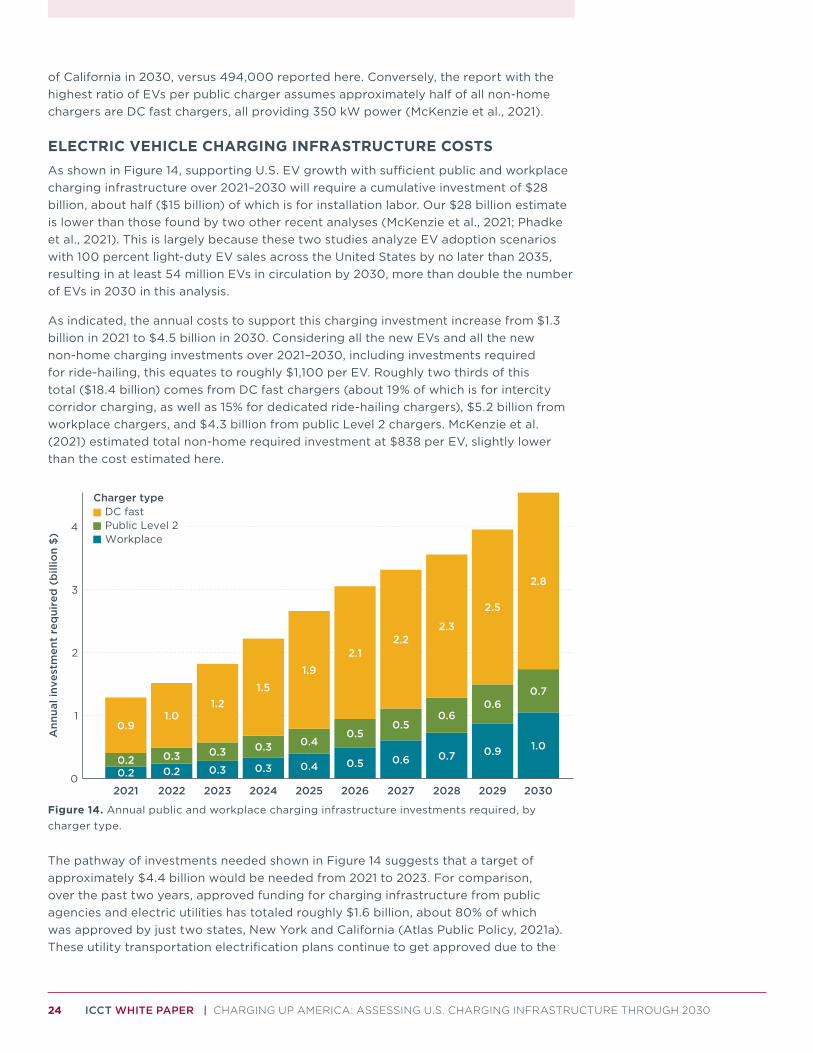
24 ICCT WHITE PAPER | CHARGING UP AMERICA: ASSESSING U.S. CHARGING INFRASTRUCTURE THROUGH 2030
of California in 2030, versus 494,000 reported here. Conversely, the report with the highest ratio of EVs per public charger assumes approximately half of all non-home chargers are DC fast chargers, all providing 350 kW power (McKenzie et al., 2021).
ELECTRIC VEHICLE CHARGING INFRASTRUCTURE COSTSAs shown in Figure 14, supporting U.S. EV growth with sufficient public and workplace charging infrastructure over 2021–2030 will require a cumulative investment of $28 billion, about half ($15 billion) of which is for installation labor. Our $28 billion estimate is lower than those found by two other recent analyses (McKenzie et al., 2021; Phadke et al., 2021). This is largely because these two studies analyze EV adoption scenarios with 100 percent light-duty EV sales across the United States by no later than 2035, resulting in at least 54 million EVs in circulation by 2030, more than double the number of EVs in 2030 in this analysis.
As indicated, the annual costs to support this charging investment increase from $1.3 billion in 2021 to $4.5 billion in 2030. Considering all the new EVs and all the new non-home charging investments over 2021–2030, including investments required for ride-hailing, this equates to roughly $1,100 per EV. Roughly two thirds of this total ($18.4 billion) comes from DC fast chargers (about 19% of which is for intercity corridor charging, as well as 15% for dedicated ride-hailing chargers), $5.2 billion from workplace chargers, and $4.3 billion from public Level 2 chargers. McKenzie et al. (2021) estimated total non-home required investment at $838 per EV, slightly lower than the cost estimated here.
0.2 0.2 0.3 0.3 0.40.2 0.3 0.3 0.3 0.40.9
1.01.2
1.5
1.9
0.5 0.6 0.7 0.9 1.00.5
0.50.6
0.60.7
2.12.2
2.3
2.5
2.8
0
1
2
3
4
2021 2022 2023 2024 2025 2026 2027 2028 2029 2030
Ann
ual i
nves
tmen
t re
qui
red
(b
illio
n $
)
Charger typeDC fastPublic Level 2Workplace
Figure 14. Annual public and workplace charging infrastructure investments required, by charger type.
The pathway of investments needed shown in Figure 14 suggests that a target of approximately $4.4 billion would be needed from 2021 to 2023. For comparison, over the past two years, approved funding for charging infrastructure from public agencies and electric utilities has totaled roughly $1.6 billion, about 80% of which was approved by just two states, New York and California (Atlas Public Policy, 2021a). These utility transportation electrification plans continue to get approved due to the
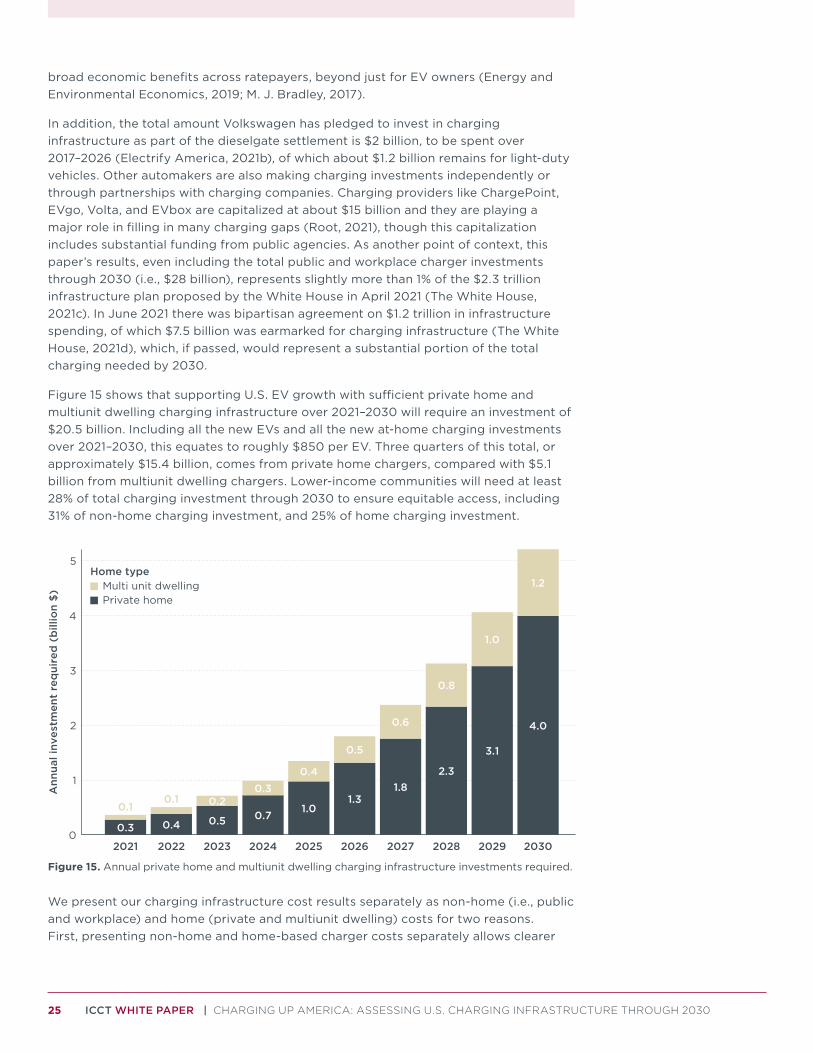
25 ICCT WHITE PAPER | CHARGING UP AMERICA: ASSESSING U.S. CHARGING INFRASTRUCTURE THROUGH 2030
broad economic benefits across ratepayers, beyond just for EV owners (Energy and Environmental Economics, 2019; M. J. Bradley, 2017).
In addition, the total amount Volkswagen has pledged to invest in charging infrastructure as part of the dieselgate settlement is $2 billion, to be spent over 2017–2026 (Electrify America, 2021b), of which about $1.2 billion remains for light-duty vehicles. Other automakers are also making charging investments independently or through partnerships with charging companies. Charging providers like ChargePoint, EVgo, Volta, and EVbox are capitalized at about $15 billion and they are playing a major role in filling in many charging gaps (Root, 2021), though this capitalization includes substantial funding from public agencies. As another point of context, this paper’s results, even including the total public and workplace charger investments through 2030 (i.e., $28 billion), represents slightly more than 1% of the $2.3 trillion infrastructure plan proposed by the White House in April 2021 (The White House, 2021c). In June 2021 there was bipartisan agreement on $1.2 trillion in infrastructure spending, of which $7.5 billion was earmarked for charging infrastructure (The White House, 2021d), which, if passed, would represent a substantial portion of the total charging needed by 2030.
Figure 15 shows that supporting U.S. EV growth with sufficient private home and multiunit dwelling charging infrastructure over 2021–2030 will require an investment of $20.5 billion. Including all the new EVs and all the new at-home charging investments over 2021–2030, this equates to roughly $850 per EV. Three quarters of this total, or approximately $15.4 billion, comes from private home chargers, compared with $5.1 billion from multiunit dwelling chargers. Lower-income communities will need at least 28% of total charging investment through 2030 to ensure equitable access, including 31% of non-home charging investment, and 25% of home charging investment.
0.3 0.4 0.5 0.71.0
1.31.8
2.3
3.1
4.0
0.10.1 0.2
0.30.4
0.5
0.6
0.8
1.0
1.2
0
1
2
3
4
5
2021 2022 2023 2024 2025 2026 2027 2028 2029 2030
Ann
ual i
nves
tmen
t re
qui
red
(b
illio
n $
)
Home typeMulti unit dwellingPrivate home
Figure 15. Annual private home and multiunit dwelling charging infrastructure investments required.
We present our charging infrastructure cost results separately as non-home (i.e., public and workplace) and home (private and multiunit dwelling) costs for two reasons. First, presenting non-home and home-based charger costs separately allows clearer

26 ICCT WHITE PAPER | CHARGING UP AMERICA: ASSESSING U.S. CHARGING INFRASTRUCTURE THROUGH 2030
comparisons with other studies referenced above. Second, these chargers broadly involve different primary actors making the charging investments and require different forms of policy support from different levels of government.
Combining the required infrastructure investments from non-home (see Figure 14) and home (see Figure 15) chargers, supporting the expected rapid growth of EVs over 2021 to 2030 will cost $48 billion, with almost 60% of the total coming from non-home charging. The overall 2021–2030 infrastructure costs break down to 32% private home, 38% DC fast, 11% multiunit dwelling, 11% workplace, and 9% public Level 2. Accordingly, these costs relate to investments by many stakeholders. Those making major investments through 2020 have included electric power utilities managing benefits across their ratepayers, private pure-play charging companies, automakers working to assure new EV buyers about the expanding network, and companies providing workplace charging as a perk for commuting employees. Home charging infrastructure has been continually supported by private homeowners to support convenient and low-cost overnight charging, as well as to a lesser extent by property owners to support more EV-owning apartment dwellers. Many of these investments have included public investments from federal, state, and local governments via direct funding, cost-sharing, subsidies, or tax credits. In addition, many chargers are increasingly supported by other policies like city EV-ready building and parking codes.
The overall charging infrastructure costs on a per-EV basis have increased by a factor of approximately two to three since ICCT’s 2019 analysis (Nicholas, 2019). Non-home charging costs over 2021–2030 for this analysis are $1,100 per EV, compared to $300–$500 over 2019–2025 in the 2019 analysis. Home-based charging is $850 per EV in this study, compared to around $500 in the 2019 analysis. There are several major reasons for these relative cost increases. Consideration of new site costs increases charging station capital and installation overall costs by 30%. In this longer-term study, a greater share of EVs are BEVs (increasing to 90% of new EVs by 2030), which typically have greater home and non-home charging needs than PHEVs. Broader EV adoption results in more EVs in households with less home charging access (see Figure 4), meaning more reliance on more costly non-home chargers. New analysis of multiunit dwellings increases charging needs, and analysis of new real-world data suggests chargers have experienced lower utilization than previously expected. Importantly, the recent shift toward reliance on DC fast charging, which is likely to continue in the future, results in increased costs.
DISCUSSION OF KEY UNCERTAINTIES As with any future-looking analysis, our findings are contingent on several key assumptions. There are several uncertainties in the market that could sway our results, resulting in either higher or lower estimates for charging infrastructure requirements. Policymakers will need to monitor conditions closely to observe how future trends compare to expectations and adjust infrastructure deployment plans accordingly. Based on our analysis and findings, we discuss several such areas of uncertainty and suggest several ways to track and better understand related dynamics to help inform charging behavior, charging needs, and policies going forward.
Charger utilization: The charger count estimates are directly proportional to the average number of hours per day each charger is in use. Based on usage in 2020 in regions around the United States, we expect average utilization to increase gradually with EV uptake. But these trends may not remain constant, and future utilization patterns may differ significantly from current behavior. If drivers prefer to charge at
27 ICCT WHITE PAPER | CHARGING UP AMERICA: ASSESSING U.S. CHARGING INFRASTRUCTURE THROUGH 2030
similar times of day, more charging infrastructure will be needed to prevent congestion at charging stations during peak demand hours. As mentioned above, other reports assuming either no changes in utilization (Crisostomo et al., 2021) or assuming optimal charger utilization (Wood et al., 2017) have arrived at estimates for infrastructure requirements ranging from 30% less than our estimates, to more three times greater.
With improved monitoring and reporting of charging station data, policymakers can make informed decisions about how to adjust infrastructure plans. Such monitoring can be facilitated by requirements that charging station operators and utilities make aggregated charger usage data public. If average utilization does not increase as EV uptake grows and reports of congestion at charging stations increase, policymakers should increase infrastructure deployment targets. Alternatively, if utilization remains low but congestion remains absent, or utilization grows rapidly at some stations while remaining low at stations nearby, there may be a surplus of charging infrastructure.
Workplace charging: We expect that workplace chargers will represent the majority of non-home chargers, based on several key advantages. Roughly 80% of employers provide some form of parking access at their workplace (Winters & Hendricks, 2003). Vehicles remain parked for several hours, providing ample time to charge, making workplaces the second-longest time, after homes, for longer-term, lower cost charging. This charging also typically occurs during the middle of the day when total grid load is often lower and the share of renewable energy is higher and increasing, reducing both cost and carbon emissions (Szinai et al., 2020). However, deploying workplace charging both efficiently and rapidly may pose substantial challenges regarding coordination among government officials, utilities, EV drivers, and property managers.
More information on workplace charging, and the potential to greatly expand it, will be important in the years ahead. In many cases, the installation of workplace charging is being done by companies as a perk for their employees. Tax credits, utility programs, and other policies can further incentivize employers to install charging for all employees who want it. Studies vary greatly on the real-world installations, daily utilization assumptions, and therefore future projections for workplace charging. As a result, it would be prudent to link any policy support concerning workplace chargers to the sharing of data on cost and charger use to inform improved future policies and projections. If workplace charging does not expand rapidly, increased investment in public Level 2 and DC fast chargers can offset the resulting charging shortfall.
Home charging access: Limited access to home charging poses a barrier to EV adoption, especially for those who do not own their homes. Many private at-home EV chargers are needed, and EV owners and utilities have largely been navigating the issues and installing charging because the costs are more than offset by the money saved on fuel. Roughly one million chargers are expected to be needed at multiunit dwellings by 2030. Meanwhile, by 2030 the EV market will increasingly expand to buyers of used and new vehicles who rent homes. These EV drivers will need better access to charging at their homes to ensure convenient and low-cost charging. If landlords are unwilling to install charging for their renters, our analysis indicates that these households will have to rely on more workplace and public charging, including more expensive DC fast charging.
Questions about access to at- or near-home charging for an expanding EV market are at the heart of various charging infrastructure projections. To reduce the related uncertainty, state, utility, and research groups would ideally conduct EV driver surveys like those applied here (Lee et al., 2020; Tal et al., 2014) over time to understand

28 ICCT WHITE PAPER | CHARGING UP AMERICA: ASSESSING U.S. CHARGING INFRASTRUCTURE THROUGH 2030
the evolving dynamics in the expanding market. In addition, tax credits, incentives, support programs, and local building and parking codes can incentivize landlords and developers to support charging installations in and around multiunit dwellings. Again, any policy support would ideally be tied to publicly sharing cost and usage data to support improved understanding of how the charging ecosystem is evolving. Charging-as-a-service programs, in which a third party (e.g., charging companies, utilities, or government agencies) retains ownership of the hardware and users pay a monthly fee, can also help expand access at multiunit dwellings and rental properties.
29 ICCT WHITE PAPER | CHARGING UP AMERICA: ASSESSING U.S. CHARGING INFRASTRUCTURE THROUGH 2030
CONCLUSIONDue to a combination of industry and policy developments, the U.S. EV market is primed to expand greatly through 2030 and beyond. As more electric vehicle models are made available and their costs decline, lack of charging infrastructure becomes a central barrier for many prospective EV drivers. As this analysis indicates, addressing the charging infrastructure barrier requires the installation of convenient charging options where vehicles are naturally parked at homes and workplaces, as well as more broadly in public locations and along highways. This analysis accounts for the diversity of household characteristics, charging behavior, and regional market differences to estimate charging needs and costs for a growing EV market in the United States through 2030.
Our analysis leads to four high-level findings.
Steady charging infrastructure additions are needed to support the transition to electric vehicles. The United States will need approximately 2.4 million public and workplace chargers by 2030 to support rapid EV growth, including 180,000 DC fast chargers within cities and along highways, 900,000 public Level 2 chargers in parking lots and along street curbs, and 1.3 million workplace chargers. This infrastructure corresponds to one non-home charger for every 11 EVs, and roughly 11 times as many chargers in 2030 as there were at the start of 2021.
To support electric vehicle growth through 2030, which is consistent with reaching 100% EV sales by 2040, the number of non-home chargers would need to increase by 27% annually. This growth rate is substantially less than the charger growth observed from 2017 through 2020, indicating that the public-access charging infrastructure investments have been approximately on target, but requires adding more than 200,000 chargers each year by 2026. This growing public charging network, including public Level 2 and direct current fast charging, would reach 500,000 chargers by around 2027. This infrastructure growth would be several years faster than the Biden administration’s goal of 500,000 chargers by 2030.
Broad charging infrastructure investments will be needed to support an expanding electric vehicle market. Compared to infrastructure deployment through 2020, the growing charging infrastructure network will need to evolve to provide greater coverage for EV drivers across more multiunit dwellings, lower-income communities, and rural areas. In addition to home chargers at single family homes, the United States will need one million chargers at multiunit dwellings to support apartment residents by 2030, the highest relative increase among the charging types analyzed here. To meet projected EV growth, public and workplace charging infrastructure will need to grow at greater rates in many rural areas. Many regions across the Midwest and South with less infrastructure investment to date would need annual charger growth rates exceeding 50%, at least double the national average.
Lower-income communities will need persistent infrastructure investment. Although only 24% of EVs owners are expected to live in lower-income communities in 2030, these areas typically have less home charging access and will need a growing amount of the new chargers over time. We estimate that the share of public and workplace chargers that are in lower-income communities will need to grow from 28% in 2020 to 39% in 2030. Most regions had at least 30% of chargers in lower-income communities in 2020, but all areas will need to continue supplying equitable infrastructure access as the EV market grows. Lower-income communities will need at least 28% of total
30 ICCT WHITE PAPER | CHARGING UP AMERICA: ASSESSING U.S. CHARGING INFRASTRUCTURE THROUGH 2030
charging investment through 2030 to meet this target, including 31% of non-home charging investment and 25% of home charging investment.
The associated charging infrastructure costs are substantial but are in line with recent trends. The 2021–2030 charging infrastructure investments needed amount to $28 billion for public and workplace chargers, with the annual costs increasing from $1.1 billion in 2021 to $4.5 billion by 2030. Direct current fast chargers in 2030 make up only 7% of the public and workplace chargers and provide 57% of energy but account for roughly 66% of the costs, which reinforces the importance of installing less expensive convenient home and workplace charging where vehicles are naturally parked for long periods. The home charging investments are also substantial, including $21 billion through 2030, with three quarters at private homes and one quarter at multiunit dwellings.
Recent trends through 2020 indicate charging infrastructure has been installed at pace with near-term needs. For example, public agencies and utility commissions have approved funding totaling approximately $1.6 billion. Volkswagen’s dieselgate settlement is set to contribute $2 billion from 2017 to 2026. Charging providers are capitalized at about $15 billion. However, considering the much larger costs, as assessed in this report, sustained funding support is needed through 2030. The $28 billion investment in public and workplace charging needed that is identified in this paper fits well within the objectives of the recently proposed federal infrastructure plans. For example, the White House originally proposed a $2.3 trillion infrastructure plan and there was bipartisan agreement on $1.2 trillion. The $28 billion indicated from this analysis for public and workplace charging would represent 1%–2% of those overall target budgets.
Charging infrastructure costs can be shared across many interested stakeholders. This report finds diverse charging infrastructure needs across various drivers, households, property owners, companies, and governments, presenting opportunities for collaboration and the ability to share the costs broadly. Of the total charging infrastructure costs through 2030, 32% comes from private home chargers, 38% from DC fast charging, 11% from chargers at multiunit dwellings, 11% from chargers at workplaces, and 9% from public Level 2 chargers.
Major investments made to fill these charging needs through 2020 have included electric power utilities, to ensure broad benefits beyond just EV owners; private pure-play charging companies to develop and grow their business models; automakers, to assure new EV buyers of the expanding network; and workplace charging providers, to provide a perk for commuting employees. Home charging infrastructure has generally been covered by private homeowners to support convenient and low-cost overnight charging, as well as to a lesser extent by property owners to support EV-owning apartment dwellers. Many of these investments have included public support from federal, state, and local governments via direct funding, cost-sharing, subsidies, or tax credits. In addition, many chargers are increasingly supported by other policies like EV-ready building and parking codes.
For a broader perspective, other more comprehensive studies reveal the benefits of the transition to electric vehicles are much greater than these charger infrastructure costs. The upfront cost of purchasing an EV is widely expected to be lower than a conventional vehicle by around 2025–2030 (National Academies of Sciences, Engineering, and Medicine, 2021). In addition to upfront cost savings at the vehicle purchase, electric vehicles’ accrued fuel savings amount to thousands of dollars per

31 ICCT WHITE PAPER | CHARGING UP AMERICA: ASSESSING U.S. CHARGING INFRASTRUCTURE THROUGH 2030
vehicle by 2030 (Lutsey & Nicholas, 2019a). In studies analyzing the broader costs and benefits of the transition to electric vehicles, charging infrastructure costs have been shown to be at least an order of magnitude smaller than total EV benefits (National Research Council, 2013; Slowik, Hall, et al., 2019).
Based on the diversity of charging behavior across tens of millions of new EV drivers and the uncertainty in the analytical projections here, expanded data collection will be needed. Data collection is especially important to monitor infrastructure usage as market composition and charging behavior evolve. Infrastructure projections inherently contain several major uncertainties, including estimates of private charging expansion and charger utilization. Policymakers would ideally consider tying infrastructure incentives to requirements for data reporting, including average daily charger usage, to serve the public interest and inform future infrastructure planning.
Although the paper does not analyze the associated policies, the findings allow for some concluding ideas on potential policies to explore further that could spur charging infrastructure investments in line with the preceding analysis. Different aspects of EV charging infrastructure deployment policy are best suited to different levels of government. Federal stimulus and clean energy infrastructure investments offer great prospects to support economic recovery and the transition to a transport sector that is aligned with climate goals. Federal policy mechanisms could include federal tax credits, frequently used for clean energy technologies, as a way to share the costs and vest charging providers in the long-term success of the charging installations, as well as grants for home chargers for individuals who may not have sufficient income to take advantage of tax credits.
Beyond federal support, states and cities are also developing stronger action plans to quantify the scale of charging infrastructure needed and the cost involved to pave the way for 100% EV goals (Bui, Slowik, & Lutsey, 2021; Hsu et al., 2021b). This often precedes new and expanded state policies related to increasing utility investments (e.g., rate-basing and make-ready investments). Local governments can develop EV-ready building and parking codes to accelerate workplace charging infrastructure installation and incentivize other property owners to invest in charging, as well as streamlining permitting and ensuring equal access to charging in disadvantaged communities. Considering the different charging types and different players, the broader conclusion is that effective infrastructure planning will gain from extensive coordination among governments and private entities.

32 ICCT WHITE PAPER | CHARGING UP AMERICA: ASSESSING U.S. CHARGING INFRASTRUCTURE THROUGH 2030
REFERENCESAtlas Public Policy. (2020). State EV Registration Data [database]. Retrieved from Atlas EV Hub
https://www.atlasevhub.com/materials/state-ev-registration-data/
Atlas Public Policy. (2021a). Electric Utility Filings [database]. Retrieved from Atlas EV Hub https://www.atlasevhub.com/materials/electric-utility-filings/
Atlas Public Policy. (2021b). State EV Registration Data [database]. Retrieved from Atlas EV Hub https://www.atlasevhub.com/materials/state-ev-registration-data/
Bauer, G., Hsu, C.-W., & Lutsey, N. (2021). When might lower-income drivers benefit from electric vehicles? Quantifying the economic equity implications of electric vehicle adoption. Retrieved from the International Council on Clean Transportation https://theicct.org/sites/default/files/publications/EV-equity-feb2021.pdf
Bosa, D. (2018, May 14). Lyft claims it now has more than one-third of the US ride-sharing market. CNBC. https://www.cnbc.com/2018/05/14/lyft-market-share-051418-bosa-sf.html
Bui, A., Slowik, P., & Lutsey, N. (2020). Update on electric vehicle adoption across U.S. cities. Retrieved from the International Council on Clean Transportation https://theicct.org/publications/ev-update-us-cities-aug2020
Bui, A., Slowik, P., & Lutsey, N. (2021). Los Angeles electric vehicle charging infrastructure needs and implications for zero-emission area planning. Retrieved from the International Council on Clean Transportation. https://theicct.org/publications/LA-charging-infra-feb2021
California Office of the Governor. (2020, September 23). Governor Newsom Announces California Will Phase Out Gasoline-Powered Cars & Drastically Reduce Demand for Fossil Fuel in California’s Fight Against Climate Change [press release]. https://www.gov.ca.gov/2020/09/23/governor-newsom-announces-california-will-phase-out-gasoline-powered-cars-drastically-reduce-demand-for-fossil-fuel-in-californias-fight-against-climate-change/
Center for Sustainable Energy. (2016, April 4). EV Consumer Survey Dashboard [database]. Clean Vehicle Rebate Project. https://cleanvehiclerebate.org/eng/survey-dashboard/ev
Chakraborty, D., Hardman, S., Karten, S., & Tal, G. (2021, February 25). No, electric vehicles aren’t driven less than gas cars [blog post]. UC Davis Transportation and Climate Blog. https://its.ucdavis.edu/blog-post/no-electric-vehicles-arent-driven-less-than-gas-cars/
Clair, I. (2017). New Accessibility Regulations for Electric Vehicle Charging Stations. Retrieved from the California Department of General Services https://www.dgs.ca.gov/-/media/Divisions/DSA/Publications/access/EVCSpresentation-outline_04-07-17r.rtf
Office of Congresswoman Yvette Clarke. (2021, February 24). Clarke Introduces Legislation to Create 200,000 EV Charging Stations in Underserved Communities by 2030 [press release]. https://clarke.house.gov/clarke-introduces-legislation-to-create-200000-ev-charging-stations-in-underserved-communities-by-2030/
Colorado Energy Office. (2021). Zero Emission Vehicles. https://energyoffice.colorado.gov/zero-emission-vehicles
Cooper, A., & Schefter, K. (2018). Electric Vehicle Sales Forecast and the Charging Infrastructure Required Through 2030. Retrieved from the Edison Foundation Institute for Electric Innovation https://www.edisonfoundation.net/-/media/Files/IEI/publications/IEI_EEI-EV-Forecast-Report_Nov2018.ashx
Crisostomo, N., Krell, W., Lu, J., & Ramesh, R. (2021). Assembly Bill 2127 Electric Vehicle Charging Infrastructure Assessment: Analyzing Charging Needs to Support Zero-Emission Vehicles in 2030 (CEC-600-2021-001; p. 123). California Energy Commission.
Dooley, E. (2020, November 19). California Mulls 90% Electric Vehicle Goal for Uber, Lyft. Bloomberg Law. https://news.bloomberglaw.com/environment-and-energy/california-mulls-90-electric-vehicle-fleet-goal-for-uber-lyft
Electrify America. (2021a). Locate a public EV charger. https://www.electrifyamerica.com/locate-charger/
Electrify America. (2021b). Our Zero Emission Vehicle Investment Plan. https://www.electrifyamerica.com/our-plan/
Energy and Environmental Economics. (2019). Benefit cost analysis of electric vehicle deployment in New York State. Retrieved from the New York State Energy Research and Development Authority https://www.nyserda.ny.gov/-/media/Files/Publications/Research/Transportation/19-07-Benefit-Cost-Analysis-EV-Deployment-NYS.pdf

33 ICCT WHITE PAPER | CHARGING UP AMERICA: ASSESSING U.S. CHARGING INFRASTRUCTURE THROUGH 2030
Engel, H., Hensley, R., Knupfer, S., & Sahdev, S. (2018). Charging ahead: Electric vehicle infrastructure demand. Retrieved from McKinsey & Co. https://www.mckinsey.com/~/media/McKinsey/Industries/Automotive%20and%20Assembly/Our%20Insights/Charging%20ahead%20Electric-vehicle%20infrastructure%20demand/Charging-ahead-electric-vehicle-infrastructure-demand-final.pdf
EVolve Houston. (2021). Electrifying transportation in the energy capital. https://www.evolvehouston.org
EV-Volumes. (2021). EV data center [database]. Retrieved from https://www.ev-volumes.com/datacenter/
Fehr & Peers. (2019, August 8). What are TNCs’ Share of VMT? https://www.fehrandpeers.com/what-are-tncs-share-of-vmt/
Ford. (2021a). Mustang Mach-E. https://media.ford.com/content/fordmedia/fna/us/en/products/evs/mustang-mach-e/mustang-mach-e.html
Ford. (2021b, February 17). Ford Europe Goes All-In on EVs on Road to Sustainable Profitability; Cologne Site Begins $1 Billion Transformation [press release]. https://media.ford.com/content/fordmedia/feu/en/news/2021/02/17/ford-europe-goes-all-in-on-evs-on-road-to-sustainable-profitabil.html
General Motors. (2021, January 28). General Motors, the Largest U.S. Automaker, Plans to be Carbon Neutral by 2040 [press release]. https://media.gm.com/media/us/en/gm/home.detail.html/content/Pages/news/us/en/2021/jan/0128-carbon.html
Hall, D., & Lutsey, N. (2017). Emerging best practices for electric vehicle charging infrastructure. Retrieved from the International Council on Clean Transportation https://theicct.org/sites/default/files/publications/EV-charging-best-practices_ICCT-white-paper_04102017_vF.pdf
Hanley, S. (2019). New Data Shows Heat & Fast-Charging Responsible For More Battery Degradation Than Age Or Mileage. CleanTechnica. https://cleantechnica.com/2019/12/16/new-data-shows-heat-fast-charging-responsible-for-more-battery-degradation-than-age-or-mileage/
Harrison, G., & Thiel, C. (2017). An exploratory policy analysis of electric vehicle sales competition and sensitivity to infrastructure in Europe. Technological Forecasting and Social Change, 114, 165–178. https://doi.org/10.1016/j.techfore.2016.08.007
HB 1965, 2021 Reg. Sess., (Va., 2021) https://lis.virginia.gov/cgi-bin/legp604.exe?211+sum+HB1965
Hsu, C.-W. (2019). Disparities in public charging infrastructure deployment and inequitable electric vehicle ownership cost based on income and race (master’s thesis). Retrieved from Humboldt State University https://digitalcommons.humboldt.edu/etd/346/
Hsu, C.-W., Slowik, P., & Lutsey, N. (2020). City charging infrastructure needs to reach 100% electric vehicles: The case of San Francisco. Retrieved from the International Council on Clean Transportation. https://theicct.org/publications/sf-ev-charging-infra-oct2020
Hsu, C.-W., Slowik, P., & Lutsey, N. (2021a). City charging infrastructure needs to reach electric vehicle goals: The case of Seattle. Retrieved from the International Council on Clean Transportation. https://theicct.org/publications/seattle-ev-charging-infra-jan2021
Hsu, C.-W., Slowik, P., & Lutsey, N. (2021b). Colorado charging infrastructure needs to reach electric vehicle goals. Retrieved from the International Council on Clean Transportation https://theicct.org/sites/default/files/publications/colorado-charging-infra-feb2021.pdf
Joe Biden for President. (2020). 9 Key Elements of Joe Biden’s Plan for a Clean Energy Revolution. https://joebiden.com/9-key-elements-of-joe-bidens-plan-for-a-clean-energy-revolution/ (Accessed March 8, 2021)
Joselow, M. (2020, October 20). Biden wants to end gas car sales. He hasn’t said when. E&E News. https://subscriber.politicopro.com/article/eenews/1063717311
Kane, M. (2019, August 26). In July Tesla Superchargers Dispensed 72 GWh Of Electricity. InsideEVs. https://insideevs.com/news/367053/july-tesla-superchargers-dispensed-72-gwh/
Kane, M. (2020, June 20). Check Out This Official Tesla Model S/X Battery Capacity Degradation Chart. InsideEVs. https://insideevs.com/news/429818/tesla-model-s-x-battery-capacity-degradation/
Kane, M. (2021, February 15). 2020 U.S. Electric Car Sales: Tesla Captures 80% Of BEV Market. InsideEVs. https://insideevs.com/news/487969/2020-us-electric-car-sales-tesla-share/
Keeney, T. (2016, July 11). Supercharger: It Could Cost Half the Price of Gas. Retrieved from ARK Invest https://ark-invest.com/articles/analyst-research/supercharger-cost-comparison/

34 ICCT WHITE PAPER | CHARGING UP AMERICA: ASSESSING U.S. CHARGING INFRASTRUCTURE THROUGH 2030
Lambert, F. (2020, December 8). Tesla co-founder JB Straubel on QuantumScape’s new fast-charging battery: It’s a ‘major breakthrough’. Electrek. https://electrek.co/2020/12/08/tesla-co-founder-jb-straubel-quantumscape-new-fast-charging-battery-major-breakthrough/
Lee, J. H., Chakraborty, D., Hardman, S. J., & Tal, G. (2020). Exploring electric vehicle charging patterns: Mixed usage of charging infrastructure. Transportation Research Part D: Transport and Environment, 79, 102249. https://doi.org/10.1016/j.trd.2020.102249
Li, S., Tong, L., Xing, J., & Zhou, Y. (2017). The market for electric vehicles: Indirect network effects and policy design. Journal of the Association of Environmental and Resource Economists, 4(1), 89–133. https://doi.org/10.1086/689702
Lowell, D., Jones, B., & Seamonds, D. (2018). Accelerating Investment in Electric Vehicle Charging Infrastructure: Estimated Needs in Selected Utility Service Territories in Seven States. Retrieved from M.J. Bradley & Associates LLC https://www.mjbradley.com/sites/default/files/Ceres_PEVinfraAnalysis_120617.pdf
Lutsey, N., & Nicholas, M. (2019a). Electric vehicle costs and consumer benefits in Colorado in the 2020–2030 time frame. The International Council on Clean Transportation. https://theicct.org/publications/ev-costs-colorado-2020-2030
Lutsey, N., & Nicholas, M. (2019b). Update on electric vehicle costs in the United States through 2030. Retrieved from the International Council on Clean Transportation https://theicct.org/publications/update-US-2030-electric-vehicle-cost
McKenzie, L., Satterfield, C., & Nigro, N. (2021). U.S. Passenger Vehicle Electrification Infrastructure Assessment. Retrieved from Atlas Public Policy https://atlaspolicy.com/rand/u-s-passenger-vehicle-electrification-infrastructure-assessment/
M. J. Bradley (2017). Plug-in electric vehicle cost-benefit analysis: Illinois. https://mjbradley.com/sites/default/files/IL%20PEV%20CB%20Analysis%20FINAL%2026sep17.pdf
Minnesota Pollution Control Agency. (2019, September 30). Rulemaking: Clean Cars Minnesota. Minnesota Pollution Control Agency. https://www.pca.state.mn.us/air/clean-cars-mn-rulemaking
National Academies of Sciences, Engineering, and Medicine. (2021). Assessment of Technologies for Improving Light-Duty Vehicle Fuel Economy—2025-2035. The National Academies Press. https://doi.org/10.17226/26092
National Research Council. (2013). Transitions to Alternative Vehicles and Fuels. The National Academies Press. https://doi.org/10.17226/18264
Nedelea, A. (2020, December 14). Toyota’s 2021 Solid State Battery: What You Need To Know. InsideEVs. https://insideevs.com/news/460244/toyota-solid-state-battery-detailed/
Nelder, C., & Rogers, E. (2019). Reducing EV Charging Infrastructure Costs. Retrieved from the Rocky Mountain Institute https://rmi.org/insight/reducing-ev-charging-infrastructure-costs/
Nicholas, M. (2019). Estimating electric vehicle charging infrastructure costs across major U.S. metropolitan areas. The International Council on Clean Transportation. https://theicct.org/publications/charging-cost-US
Nicholas, M., Hall, D., & Lutsey, N. (2019). Quantifying the electric vehicle charging infrastructure gap across U.S. markets. Retrieved from the International Council on Clean Transportation https://theicct.org/sites/default/files/publications/US_charging_Gap_20190124.pdf
Nicholas, M., Slowik, P., & Lutsey, N. (2020). Charging infrastructure requirements to support electric ride-hailing in U.S. cities. Retrieved from the International Council on Clean Transportation https://theicct.org/publications/charging-infrastructure-electric-ride-hailing-us-032020
Nissan. (2020, July 15). Nissan Ariya Press Kit. https://usa.nissannews.com/en-US/releases/2021-nissan-ariya-press-kit
Oak Ridge National Laboratory. (2020). Transportation Energy Data Book: Edition 38. https://tedb.ornl.gov/data/
Pennsylvania Department of Environmental Protection. (2021, February 19). DEP Advances Actions To Support Electric Vehicle Use Statewide [press release]. https://www.media.pa.gov:443/pages/dep_details.aspx?newsid=1419
Phadke, A., Abhyankar, N., Kersey, J., McNair, T., Paliwal, U., Wooley, D., … Rajagopal, D. (2021). 2035 Report, Transportation: Plummeting costs and dramatic improvements in batteries can accelerate our clean transportation future. University of California, Berkeley, Goldman School of Public Policy. https://www.2035report.com/transportation/
Plötz, P., Moll, C., Bieker, G., Mock, P., & Li, Y. (2020). Real-world usage of plug-in hybrid electric vehicles: Fuel consumption, electric driving, and CO2 emissions. Retrieved from the International Council on Clean Transportation https://theicct.org/publications/phev-real-world-usage-sept2020

35 ICCT WHITE PAPER | CHARGING UP AMERICA: ASSESSING U.S. CHARGING INFRASTRUCTURE THROUGH 2030
PlugShare. (2021). Charging infrastructure data. Retrieved from https://www.plugshare.com/
Root, A. (2021). 4 Electric-Vehicle Charging Stocks at Fire-Sale Prices. Barron’s. https://www.barrons.com/articles/4-electric-vehicle-charging-stocks-at-fire-sale-prices-51618619555
Sierzchula, W., Bakker, S., Maat, K., & Van Wee, B. (2014). The influence of financial incentives and other socio-economic factors on electric vehicle adoption. Energy Policy, 68, 183–194. https://doi.org/10.1016/j.enpol.2014.01.043
Slowik, P., Fedirko, L., & Lutsey, N. (2019). Assessing ride-hailing company commitments to electrification. Retrieved from the International Council on Clean Transportation https://www.theicct.org/publications/ridehailing-electrification-commitment
Slowik, P., Hall, D., Lutsey, N., Nicholas, M., & Wappelhorst, S. (2019). Funding the transition to all zero-emission vehicles. Retrieved from the International Council on Clean Transportation https://theicct.org/publications/funding-ZEV-transition
Slowik, P., & Lutsey, N. (2017). Expanding the electric vehicle market in U.S. cities. Retrieved from the International Council on Clean Transportation. https://theicct.org/publications/expanding-electric-vehicle-market-us-cities
Springel, K. (2017). Network externality and subsidy structure in two-sided markets: Evidence from electric vehicle incentives. http://econweb.umd.edu/~sweeting/kspringel_ev.pdf
Stock, K. (2020, December 2). Biden’s Charging Plan Could Sell 25 Million EVs. Bloomberg Green. https://www.bloomberg.com/news/articles/2020-12-02/joe-biden-plan-to-fight-climate-change-could-sell-25-million-electric-cars
Szinai, J. K., Sheppard, C. J., Abhyankar, N., & Gopal, A. R. (2020). Reduced grid operating costs and renewable energy curtailment with electric vehicle charge management. Energy Policy, 136, 111051. https://doi.org/10.1016/j.enpol.2019.111051
Tal, G., Nicholas, M. A., Davies, J., & Woodjack, J. (2014). Charging behavior impacts on electric vehicle miles traveled: Who is not plugging in? Transportation Research Record, 2454(1), 53–60. https://doi.org/10.3141/2454-07
Tal, G., Raghavan, S., Karanam, V., Favetti, M., Sutton, K., Lee, J., Nitta, C., Chakraborty, D., Nicholas, M., & Turrentine, T. (2020). Advanced plug-in electric vehicle travel and charging behavior-final report [California Air Resources Board Contract, 12–319].
Tesla. (2015, January 22). Letter to the United States Securities and Exchange Commission. https://www.sec.gov/Archives/edgar/data/1318605/000119312515017866/filename1.htm
Tesla. (2018, September 7). Onboard Charger. https://www.tesla.com/support/home-charging-installation/onboard-charger
Uber. (2020). Uber Technologies, Inc. - Financials. https://investor.uber.com/financials/default.aspx
U.S. Census Bureau. (2020a). Explore Census Data [database]. https://data.census.gov/cedsci/
U.S. Census Bureau. (2020b). Longitudinal Employer-Household Dynamics [database]. https://lehd.ces.census.gov/data/
U.S. Department of Energy. (2018). Workplace Charging Challenge Reports. Energy.Gov. https://www.energy.gov/eere/vehicles/downloads/workplace-charging-challenge-reports
U.S. Department of Energy. (2021). Alternative Fueling Station Locator. Energy.Gov. https://afdc.energy.gov/stations/#/find/nearest
U.S. Department of Housing and Urban Development. (2021). FY 2020 ACS 5-Year 2011-2015 Low- and Moderate-Income Summary Data—HUD Exchange. https://www.hudexchange.info/programs/acs-low-mod-summary-data/
U.S. Energy Information Administration. (2015). 2015 RECS Survey Data [database]. https://www.eia.gov/consumption/residential/data/2015/
U.S. Energy Information Administration. (2020). Annual Energy Outlook 2020. https://www.eia.gov/outlooks/aeo/
U.S. Federal Highway Administration. (2018). National Household Travel Survey. https://nhts.ornl.gov/
Vijayenthiran, V. (2021, March 15). VW Group: Solid-state batteries can deliver 30% more range, 12-minute charge times. Motor Authority. https://www.motorauthority.com/news/1131576_vw-group-solid-state-batteries-can-deliver-30-more-range-12-minute-charge-times
Volkswagen. (2021a). Project Trinity: With high range, extremely short charging times and revolutionary production, the sedan will launch in 2026 [press release]. https://www.volkswagen-newsroom.com:443/en/press-releases/project-trinity-with-high-range-extremely-short-charging-times-and-revolutionary-production-the-sedan-will-launch-in-2026-6879

36 ICCT WHITE PAPER | CHARGING UP AMERICA: ASSESSING U.S. CHARGING INFRASTRUCTURE THROUGH 2030
Volkswagen. (2021b, March 5). Volkswagen is accelerating transformation into software-driven mobility provider [press release]. https://www.volkswagen-newsroom.com:443/en/press-releases/volkswagen-is-accelerating-transformation-into-software-driven-mobility-provider-6878
Volvo. (2021, March 2). Volvo Cars to be fully electric by 2030 [press release]. https://www.media.volvocars.com/us/en-us/media/pressreleases/277409/volvo-cars-to-be-fully-electric-by-2030
Washington State Department of Ecology. (2021). Washington clean car standards. Washington State Department of Ecology. https://ecology.wa.gov/Air-Climate/Air-quality/Vehicle-emissions/Clean-cars
Way, E. (2019). Chevy Bolt EV Battery Health After 100,000 Miles. Torque News. https://www.torquenews.com/8861/chevy-bolt-ev-battery-health-after-100000-miles
Webasto. (2019). Charge Time Guide. https://cdn2.hubspot.net/hubfs/3425125/Webasto_Charge_Time_Guide2019.pdf
The White House. (2021a, January 21). Executive Order on Protecting Public Health and the Environment and Restoring Science to Tackle the Climate Crisis. https://www.whitehouse.gov/briefing-room/presidential-actions/2021/01/20/executive-order-protecting-public-health-and-environment-and-restoring-science-to-tackle-climate-crisis/
The White House. (2021b, March 3). Readout of the White House’s Meeting with Electric Vehicle Charging Infrastructure Leaders. https://www.whitehouse.gov/briefing-room/statements-releases/2021/03/02/readout-of-the-white-houses-meeting-with-electric-vehicle-charging-infrastructure-leaders/
The White House. (2021c, March 31). FACT SHEET: The American Jobs Plan. https://www.whitehouse.gov/briefing-room/statements-releases/2021/03/31/fact-sheet-the-american-jobs-plan/
The White House. (2021d, April 22). Fact sheet: President Biden Announces Support for the Bipartisan Infrastructure Framework. https://www.whitehouse.gov/briefing-room/statements-releases/2021/06/24/fact-sheet-president-biden-announces-support-for-the-bipartisan-infrastructure-framework/
Winters, P. L., Hendricks, S. J., & BC137, F. C. N. (2003). Quantifying the business benefits of TDM. National Center for Transit Research, Center for Urban Transportation https://www.nctr.usf.edu/pdf/416-11.pdf
Wood, E., Rames, C., Muratori, M., Raghavan, S., & Melaina, M. (2017). National Plug-In Electric Vehicle Infrastructure Analysis. https://doi.org/10.13140/RG.2.2.25881.93280
Wood Mackenzie. (2019, November 6). Europe and North America will have over 1 million workplace EV chargers by 2025 [press release]. https://www.woodmac.com/press-releases/europe-and-north-america-will-have-over-1-million-workplace-ev-chargers-by-2025/
Xu, B., Davis, A. W., & Tal, G. (2021). Estimating the Total Number of Workplace and Public EV Chargers in California. Transportation Research Board 100th Annual Meeting, Washington, D.C. https://trid.trb.org/view/1759518
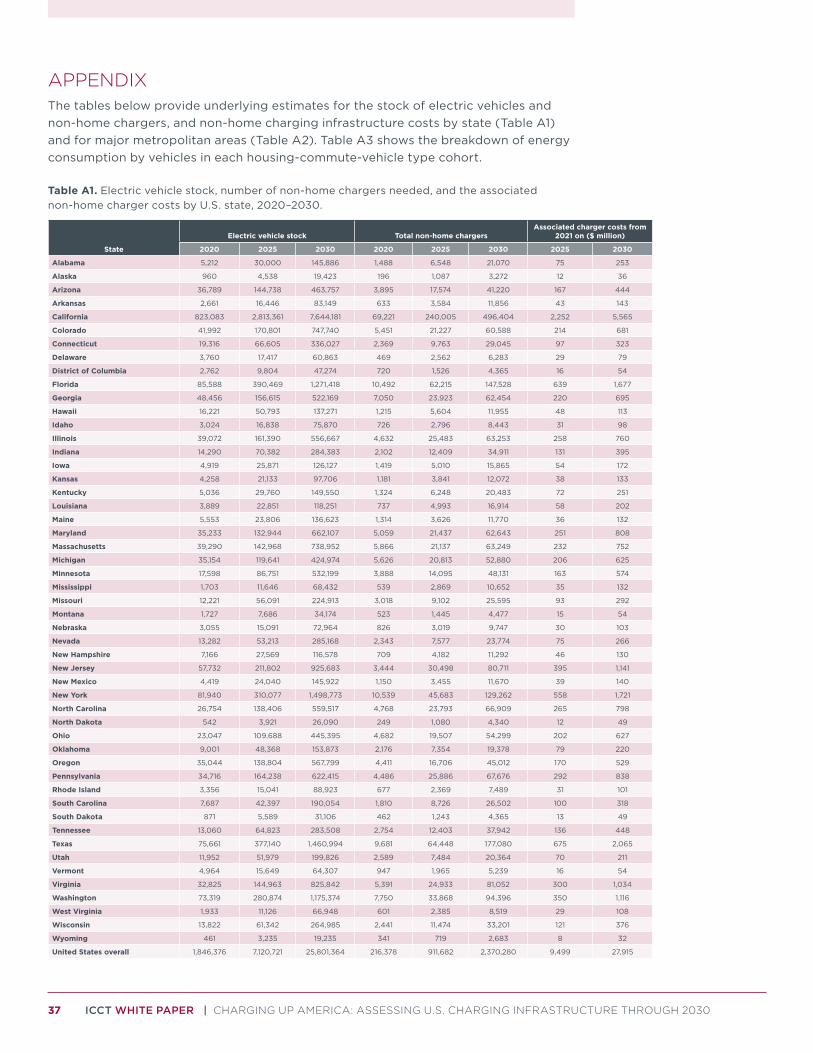
37 ICCT WHITE PAPER | CHARGING UP AMERICA: ASSESSING U.S. CHARGING INFRASTRUCTURE THROUGH 2030
APPENDIXThe tables below provide underlying estimates for the stock of electric vehicles and non-home chargers, and non-home charging infrastructure costs by state (Table A1) and for major metropolitan areas (Table A2). Table A3 shows the breakdown of energy consumption by vehicles in each housing-commute-vehicle type cohort.
Table A1. Electric vehicle stock, number of non-home chargers needed, and the associated non-home charger costs by U.S. state, 2020–2030.
State
Electric vehicle stock Total non-home chargersAssociated charger costs from
2021 on ($ million)
2020 2025 2030 2020 2025 2030 2025 2030
Alabama 5,212 30,000 145,886 1,488 6,548 21,070 75 253
Alaska 960 4,538 19,423 196 1,087 3,272 12 36
Arizona 36,789 144,738 463,757 3,895 17,574 41,220 167 444
Arkansas 2,661 16,446 83,149 633 3,584 11,856 43 143
California 823,083 2,813,361 7,644,181 69,221 240,005 496,404 2,252 5,565
Colorado 41,992 170,801 747,740 5,451 21,227 60,588 214 681
Connecticut 19,316 66,605 336,027 2,369 9,763 29,045 97 323
Delaware 3,760 17,417 60,863 469 2,562 6,283 29 79
District of Columbia 2,762 9,804 47,274 720 1,526 4,365 16 54
Florida 85,588 390,469 1,271,418 10,492 62,215 147,528 639 1,677
Georgia 48,456 156,615 522,169 7,050 23,923 62,454 220 695
Hawaii 16,221 50,793 137,271 1,215 5,604 11,955 48 113
Idaho 3,024 16,838 75,870 726 2,796 8,443 31 98
Illinois 39,072 161,390 556,667 4,632 25,483 63,253 258 760
Indiana 14,290 70,382 284,383 2,102 12,409 34,911 131 395
Iowa 4,919 25,871 126,127 1,419 5,010 15,865 54 172
Kansas 4,258 21,133 97,706 1,181 3,841 12,072 38 133
Kentucky 5,036 29,760 149,550 1,324 6,248 20,483 72 251
Louisiana 3,889 22,851 118,251 737 4,993 16,914 58 202
Maine 5,553 23,806 136,623 1,314 3,626 11,770 36 132
Maryland 35,233 132,944 662,107 5,059 21,437 62,643 251 808
Massachusetts 39,290 142,968 738,952 5,866 21,137 63,249 232 752
Michigan 35,154 119,641 424,974 5,626 20,813 52,880 206 625
Minnesota 17,598 86,751 532,199 3,888 14,095 48,131 163 574
Mississippi 1,703 11,646 68,432 539 2,869 10,652 35 132
Missouri 12,221 56,091 224,913 3,018 9,102 25,595 93 292
Montana 1,727 7,686 34,174 523 1,445 4,477 15 54
Nebraska 3,055 15,091 72,964 826 3,019 9,747 30 103
Nevada 13,282 53,213 285,168 2,343 7,577 23,774 75 266
New Hampshire 7,166 27,569 116,578 709 4,182 11,292 46 130
New Jersey 57,732 211,802 925,683 3,444 30,498 80,711 395 1,141
New Mexico 4,419 24,040 145,922 1,150 3,455 11,670 39 140
New York 81,940 310,077 1,498,773 10,539 45,683 129,262 558 1,721
North Carolina 26,754 138,406 559,517 4,768 23,793 66,909 265 798
North Dakota 542 3,921 26,090 249 1,080 4,340 12 49
Ohio 23,047 109,688 445,395 4,682 19,507 54,299 202 627
Oklahoma 9,001 48,368 153,873 2,176 7,354 19,378 79 220
Oregon 35,044 138,804 567,799 4,411 16,706 45,012 170 529
Pennsylvania 34,716 164,238 622,415 4,486 25,886 67,676 292 838
Rhode Island 3,356 15,041 88,923 677 2,369 7,489 31 101
South Carolina 7,687 42,397 190,054 1,810 8,726 26,502 100 318
South Dakota 871 5,589 31,106 462 1,243 4,365 13 49
Tennessee 13,060 64,823 283,508 2,754 12,403 37,942 136 448
Texas 75,661 377,140 1,460,994 9,681 64,448 177,080 675 2,065
Utah 11,952 51,979 199,826 2,589 7,484 20,364 70 211
Vermont 4,964 15,649 64,307 947 1,965 5,239 16 54
Virginia 32,825 144,963 825,842 5,391 24,933 81,052 300 1,034
Washington 73,319 280,874 1,175,374 7,750 33,868 94,396 350 1,116
West Virginia 1,933 11,126 66,948 601 2,385 8,519 29 108
Wisconsin 13,822 61,342 264,985 2,441 11,474 33,201 121 376
Wyoming 461 3,235 19,235 341 719 2,683 8 32
United States overall 1,846,376 7,120,721 25,801,364 216,378 911,682 2,370,280 9,499 27,915
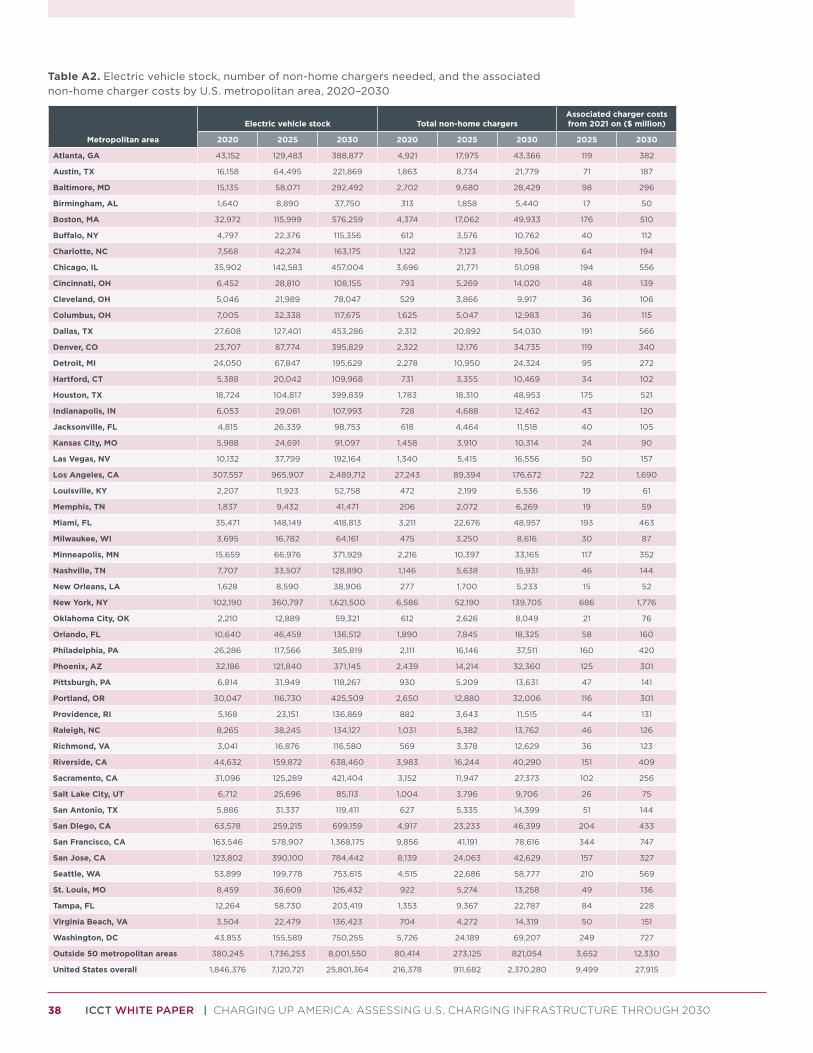
38 ICCT WHITE PAPER | CHARGING UP AMERICA: ASSESSING U.S. CHARGING INFRASTRUCTURE THROUGH 2030
Table A2. Electric vehicle stock, number of non-home chargers needed, and the associated non-home charger costs by U.S. metropolitan area, 2020–2030
Metropolitan area
Electric vehicle stock Total non-home chargersAssociated charger costs from 2021 on ($ million)
2020 2025 2030 2020 2025 2030 2025 2030
Atlanta, GA 43,152 129,483 388,877 4,921 17,975 43,366 119 382
Austin, TX 16,158 64,495 221,869 1,863 8,734 21,779 71 187
Baltimore, MD 15,135 58,071 292,492 2,702 9,680 28,429 98 296
Birmingham, AL 1,640 8,890 37,750 313 1,858 5,440 17 50
Boston, MA 32,972 115,999 576,259 4,374 17,062 49,933 176 510
Buffalo, NY 4,797 22,376 115,356 612 3,576 10,762 40 112
Charlotte, NC 7,568 42,274 163,175 1,122 7,123 19,506 64 194
Chicago, IL 35,902 142,583 457,004 3,696 21,771 51,098 194 556
Cincinnati, OH 6,452 28,810 108,155 793 5,269 14,020 48 139
Cleveland, OH 5,046 21,989 78,047 529 3,866 9,917 36 106
Columbus, OH 7,005 32,338 117,675 1,625 5,047 12,983 36 115
Dallas, TX 27,608 127,401 453,286 2,312 20,892 54,030 191 566
Denver, CO 23,707 87,774 395,829 2,322 12,176 34,735 119 340
Detroit, MI 24,050 67,847 195,629 2,278 10,950 24,324 95 272
Hartford, CT 5,388 20,042 109,968 731 3,355 10,469 34 102
Houston, TX 18,724 104,817 399,839 1,783 18,310 48,953 175 521
Indianapolis, IN 6,053 29,081 107,993 728 4,688 12,462 43 120
Jacksonville, FL 4,815 26,339 98,753 618 4,464 11,518 40 105
Kansas City, MO 5,988 24,691 91,097 1,458 3,910 10,314 24 90
Las Vegas, NV 10,132 37,799 192,164 1,340 5,415 16,556 50 157
Los Angeles, CA 307,557 965,907 2,489,712 27,243 89,394 176,672 722 1,690
Louisville, KY 2,207 11,923 52,758 472 2,199 6,536 19 61
Memphis, TN 1,837 9,432 41,471 206 2,072 6,269 19 59
Miami, FL 35,471 148,149 418,813 3,211 22,676 48,957 193 463
Milwaukee, WI 3,695 16,782 64,161 475 3,250 8,616 30 87
Minneapolis, MN 15,659 66,976 371,929 2,216 10,397 33,165 117 352
Nashville, TN 7,707 33,507 128,890 1,146 5,638 15,931 46 144
New Orleans, LA 1,628 8,590 38,906 277 1,700 5,233 15 52
New York, NY 102,190 360,797 1,621,500 6,586 52,190 139,705 686 1,776
Oklahoma City, OK 2,210 12,889 59,321 612 2,626 8,049 21 76
Orlando, FL 10,640 46,459 136,512 1,890 7,845 18,325 58 160
Philadelphia, PA 26,286 117,566 385,819 2,111 16,146 37,511 160 420
Phoenix, AZ 32,186 121,840 371,145 2,439 14,214 32,360 125 301
Pittsburgh, PA 6,814 31,949 118,267 930 5,209 13,631 47 141
Portland, OR 30,047 116,730 425,509 2,650 12,880 32,006 116 301
Providence, RI 5,168 23,151 136,869 882 3,643 11,515 44 131
Raleigh, NC 8,265 38,245 134,127 1,031 5,382 13,762 46 126
Richmond, VA 3,041 16,876 116,580 569 3,378 12,629 36 123
Riverside, CA 44,632 159,872 638,460 3,983 16,244 40,290 151 409
Sacramento, CA 31,096 125,289 421,404 3,152 11,947 27,373 102 256
Salt Lake City, UT 6,712 25,696 85,113 1,004 3,796 9,706 26 75
San Antonio, TX 5,886 31,337 119,411 627 5,335 14,399 51 144
San Diego, CA 63,578 259,215 699,159 4,917 23,233 46,399 204 433
San Francisco, CA 163,546 578,907 1,368,175 9,856 41,191 78,616 344 747
San Jose, CA 123,802 390,100 784,442 8,139 24,063 42,629 157 327
Seattle, WA 53,899 199,778 753,615 4,515 22,686 58,777 210 569
St. Louis, MO 8,459 36,609 126,432 922 5,274 13,258 49 136
Tampa, FL 12,264 58,730 203,419 1,353 9,367 22,787 84 228
Virginia Beach, VA 3,504 22,479 136,423 704 4,272 14,319 50 151
Washington, DC 43,853 155,589 750,255 5,726 24,189 69,207 249 727
Outside 50 metropolitan areas 380,245 1,736,253 8,001,550 80,414 273,125 821,054 3,652 12,330
United States overall 1,846,376 7,120,721 25,801,364 216,378 911,682 2,370,280 9,499 27,915
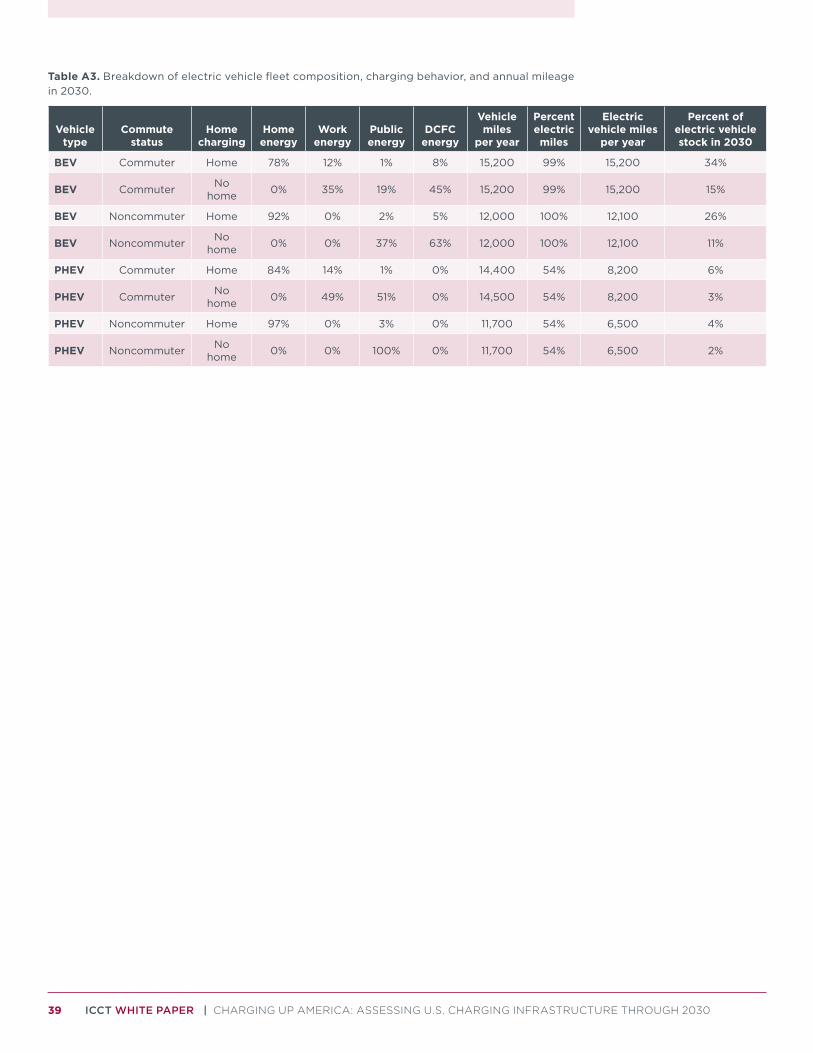
39 ICCT WHITE PAPER | CHARGING UP AMERICA: ASSESSING U.S. CHARGING INFRASTRUCTURE THROUGH 2030
Table A3. Breakdown of electric vehicle fleet composition, charging behavior, and annual mileage in 2030.
Vehicle type
Commute status
Home charging
Home energy
Work energy
Public energy
DCFC energy
Vehicle miles
per year
Percent electric miles
Electric vehicle miles
per year
Percent of electric vehicle stock in 2030
BEV Commuter Home 78% 12% 1% 8% 15,200 99% 15,200 34%
BEV Commuter No home 0% 35% 19% 45% 15,200 99% 15,200 15%
BEV Noncommuter Home 92% 0% 2% 5% 12,000 100% 12,100 26%
BEV Noncommuter No home 0% 0% 37% 63% 12,000 100% 12,100 11%
PHEV Commuter Home 84% 14% 1% 0% 14,400 54% 8,200 6%
PHEV Commuter No home 0% 49% 51% 0% 14,500 54% 8,200 3%
PHEV Noncommuter Home 97% 0% 3% 0% 11,700 54% 6,500 4%
PHEV Noncommuter No home 0% 0% 100% 0% 11,700 54% 6,500 2%