Charcoal versus LPG grilling: A carbon-footprint comparison
9
Charcoal versus LPG grilling: A carbon-footprint comparison Eric Johnson ⁎ Atlantic Consulting, Obstgartenstrasse 14, 8136 Gattikon, Switzerland abstract article info Article history: Received 2 February 2009 Received in revised form 20 February 2009 Accepted 20 February 2009 Available online 8 May 2009 Keywords: Carbon footprint Biofuel GHG comparison Undoubtedly, grilling is popular. Britons fire up their barbeques some 60 million times a year, consuming many thousands of tonnes of fuel. In milder climates consumption is even higher, and in the developing world, charcoal continues to be an essential cooking fuel. So it is worth comparing the carbon footprints of the two major grill types, charcoal and LPG, and that was the purpose of the study this paper documents. Charcoal and LPG grill systems were defined, and their carbon footprints were calculated for a base case and for some plausible variations to that base case. In the base case, the charcoal grilling footprint of 998 kg CO 2 e is almost three times as large as that for LPG grilling, 349 kg CO 2 e. The relationship is robust under all plausible sensitivities. The overwhelming factors are that as a fuel, LPG is dramatically more efficient than charcoal in its production and considerably more efficient in cooking. Secondary factors are: use of firelighters, which LPG does not need; LPG's use of a heavier, more complicated grill; and LPG's use of cylinders that charcoal does not need. © 2009 Published by Elsevier Inc. 1. Introduction This report documents a study of the carbon footprints of charcoal and LPG grills. 1.1. What was studied? The study looked at conventional, outdoor-barbeque grills that number in the millions in the developed world. Our notional location was the UK, but the results could apply to many other locations. Two types of grills were examined: charcoal and LPG fired. Except for this fuel-type difference, the grills are very similar. 1.2. Why is this study important? There are three main reasons: to inform consumers and policy- makers; to test the presumed biofuel advantage over petrofuels; and to show the value of footprinting. 1.2.1. To inform consumers Grill usage is popular in the developed world. Many of the users would like to know how grilling's environmental impacts can be minimised or reduced (SF Chronicle, 2007), and policy-makers prob- ably would like to know this as well. Grill usage is also very widespread in the developing world (Bailis, 2005). Their grills are not identical to leisure barbeques used in the West, but there are plenty of similarities. Researchers and policy-makers are interested in the impacts of fuel-switching on carbon footprints and other indicators 1 (Natiyal and Kaechele, 2008). 1.2.2. To test the presumed biofuels' advantage over petrofuels Several standards for carbon footprinting, and most published carbon footprints or LCAs, presume that biomass heating fuels are carbon neutral. However, it is recognised increasingly that this is incorrect: biomass fuels are not always carbon neutral. Indeed, they can in some cases be far more carbon positive than fossil fuels. For liquid biofuels (mainly biodiesel and bioethanol), this false presumption of carbon neutrality has been corrected by numerous studies (for example, RTFO, 2008) in recent years. Today it is widely accepted that land-use change must be accounted in liquid biofuel footprints. For solid biofuels (wood and woody fuels), land-use change may be significant, as may land-use (e.g. increasing the harvest intensity of a forest) — so these factors need to work their way into standards and studies. (Johnson, 2009) 1.2.3. To show the value of footprinting From initial calculations prior to undertaking the study, it was posited that this study would generate a counterintuitive answer, i.e. one at odds with conventional wisdom yet still robust. Footprinting's ability to generate non-obvious, important answers is of value to society. 2. Context and method The following subsections briefly review the approach to foot- printing, sources of data and the study's accuracy and precision. Environmental Impact Assessment Review 29 (2009) 370–378 ⁎ Tel.: +41 44 772 1079. E-mail address: [email protected]. 1 For instance, indoor-air quality. 0195-9255/$ – see front matter © 2009 Published by Elsevier Inc. doi:10.1016/j.eiar.2009.02.004 Contents lists available at ScienceDirect Environmental Impact Assessment Review journal homepage: www.elsevier.com/locate/eiar
-
Upload
eric-johnson -
Category
Documents
-
view
252 -
download
12
Transcript of Charcoal versus LPG grilling: A carbon-footprint comparison

Environmental Impact Assessment Review 29 (2009) 370–378
Contents lists available at ScienceDirect
Environmental Impact Assessment Review
j ourna l homepage: www.e lsev ie r.com/ locate /e ia r
Charcoal versus LPG grilling: A carbon-footprint comparison
Eric Johnson ⁎Atlantic Consulting, Obstgartenstrasse 14, 8136 Gattikon, Switzerland
⁎ Tel.: +41 44 772 1079.E-mail address: [email protected].
0195-9255/$ – see front matter © 2009 Published by Edoi:10.1016/j.eiar.2009.02.004
a b s t r a c t
a r t i c l e i n f oArticle history:Received 2 February 2009Received in revised form 20 February 2009Accepted 20 February 2009Available online 8 May 2009
Keywords:Carbon footprintBiofuelGHG comparison
Undoubtedly, grilling is popular. Britons fire up their barbeques some 60 million times a year, consumingmany thousands of tonnes of fuel. In milder climates consumption is even higher, and in the developingworld, charcoal continues to be an essential cooking fuel. So it is worth comparing the carbon footprints ofthe two major grill types, charcoal and LPG, and that was the purpose of the study this paper documents.Charcoal and LPG grill systems were defined, and their carbon footprints were calculated for a base case andfor some plausible variations to that base case. In the base case, the charcoal grilling footprint of 998 kg CO2eis almost three times as large as that for LPG grilling, 349 kg CO2e. The relationship is robust under allplausible sensitivities. The overwhelming factors are that as a fuel, LPG is dramatically more efficient thancharcoal in its production and considerably more efficient in cooking. Secondary factors are: use offirelighters, which LPG does not need; LPG's use of a heavier, more complicated grill; and LPG's use ofcylinders that charcoal does not need.
© 2009 Published by Elsevier Inc.
1. Introduction
This report documents a study of the carbon footprints of charcoaland LPG grills.
1.1. What was studied?
The study looked at conventional, outdoor-barbeque grills thatnumber in the millions in the developed world. Our notional locationwas the UK, but the results could apply to many other locations. Twotypes of grills were examined: charcoal and LPG fired. Except for thisfuel-type difference, the grills are very similar.
1.2. Why is this study important?
There are three main reasons: to inform consumers and policy-makers; to test the presumed biofuel advantage over petrofuels; andto show the value of footprinting.
1.2.1. To inform consumersGrill usage is popular in the developed world. Many of the users
would like to know how grilling's environmental impacts can beminimised or reduced (SF Chronicle, 2007), and policy-makers prob-ably would like to know this as well.
Grill usage is also very widespread in the developing world (Bailis,2005). Their grills are not identical to leisure barbeques used in theWest, but there are plenty of similarities. Researchers and policy-makers
lsevier Inc.
are interested in the impacts of fuel-switching on carbon footprints andother indicators1 (Natiyal and Kaechele, 2008).
1.2.2. To test the presumed biofuels' advantage over petrofuelsSeveral standards for carbon footprinting, and most published
carbon footprints or LCAs, presume that biomass heating fuels arecarbon neutral. However, it is recognised increasingly that this isincorrect: biomass fuels are not always carbon neutral. Indeed, theycan in some cases be far more carbon positive than fossil fuels.
For liquid biofuels (mainly biodiesel and bioethanol), this falsepresumption of carbon neutrality has been corrected by numerousstudies (for example, RTFO, 2008) in recent years. Today it is widelyaccepted that land-use change must be accounted in liquid biofuelfootprints. For solid biofuels (wood and woody fuels), land-usechange may be significant, as may land-use (e.g. increasing theharvest intensity of a forest)— so these factors need to work their wayinto standards and studies. (Johnson, 2009)
1.2.3. To show the value of footprintingFrom initial calculations prior to undertaking the study, it was
posited that this study would generate a counterintuitive answer, i.e.one at odds with conventional wisdom yet still robust. Footprinting'sability to generate non-obvious, important answers is of value tosociety.
2. Context and method
The following subsections briefly review the approach to foot-printing, sources of data and the study's accuracy and precision.
1 For instance, indoor-air quality.

Table 1Properties of charcoal and wood, approximate values (Biomass Handbook, 2007).
Property Units Lump charcoal Air-dried wood Fresh harvestedwood
Density kg/m3 250 700–800 800–1,300Moisture content wt.% Nil 20 NACarbon content Wt.% 85–98 50 NALower heating value MJ/kg 32 20 15
Table 2UK imports of charcoal, 2008 (UK Trade Info, 2009).
% of total
Quantity tones All imports EU and developedcountries
Africa Developingcountries
CountrySouth Africa 15,979 30% 30% 30%Argentina 9,323 18% 18%Spain 7,369 14% 14%Namibia 6,297 12% 12% 12%Nigeria 3,590 7% 7% 7%Brazil 2,149 4% 4%China 1,625 3% 3%Poland 1,209 2% 2%Paraguay 1,162 2% 2%Italy 750 1% 1%Indonesia 708 1% 1%Uruguay 542 1% 1%Netherlands 470 1% 1%Germany 435 1% 1%Malaysia 289 1% 1%Other 1,243 2% 2%Total 53,140 100% 19% 49% 81%
Table 3Changes in forest stock of leading charcoal exporting countries (FAO, 2005).
Change in forest growingstock, 2000–2005
Change in extent of forest andwooded land, 2000–2005
Leading charcoalexporters to the UK
thousand m3/year thousandha/year
% per year
South Africa 0 0 0.0Argentina −21,200 −150 −0.4Spain 19,600 296 1.7Namibia −1,800 −74 −0.9Nigeria −45,000 −410 −3.3Brazil −698,892 −3,103 −0.6China 181,400 4058 2.2Poland 25,660 27 0.3Paraguay NA −179 −0.9Italy 31,560 106 1.1Indonesia −561,200 −1,871 −2.0Uruguay NA 19 1.3Netherlands 800 1 0.3Germany NA 0 0.0
371E. Johnson / Environmental Impact Assessment Review 29 (2009) 370–378
2.1. Footprinting approach
Carbon footprints are a summation of the greenhouse-gasemissions of a product or service across its lifetime (or life cycle). Acarbon footprint is a subset of a life-cycle assessment (LCA), which is asummation of all emissions of a product or service. The approach tofootprinting is identical to that for LCA; the only difference is that in acarbon footprint, a smaller scope of emissions is covered.
The approach used in this study is believed to be in line withcurrent, global best-practice, and it is broadly compliant with LCAstandards ISO 14040 and ISO 14044. Most of the inputs for the studywere tabulated in Excel. The footprints were then calculated andanalysed in SimaPro 7, a commercial software package for LCA.
2.2. Sources of process data
A major source of process data2 for this study was the EcoInvent2.0 database. This database was published in 2007; it is based on 15–20 years of research by a group of researchers funded by Switzerland'sgovernment and led by Switzerland's materials testing institute,EMPA. It is probably the most authoritative databases for LCA andfootprinting.
Process data not sourced from EcoInvent and BUWAL were for LPGproduction. These came from previous work on UK LPG by AtlanticConsulting. A few other factors were used in the calculations — theseare cited in the text.
2.3. Accuracy and precision
Footprint estimates of the type conducted for this study aregenerally understood to be accurate within a range of ±10–20%. Bydefinition they are somewhat imprecise, because they express arepresentation of an entire industry.
Comparing footprints as measured by different studies orresearchers is often problematic. Because methods and assumptionscan vary widely, so can answers. However, by using EcoInvent —
probably the most widely-used and authoritative databases — to theextent possible, we are most likely to generate results consistent withthose of other researchers.
3. Definitions of the grilling systems
Two grilling systems were defined: a charcoal and a LPG one. Bothare located in the UK for the period 2000–2010. The followingsubsections present definitions of subsystems: production of charcoal;production of LPG; use and disposal of charcoal; use and disposal ofLPG; and production, use and disposal of the grill and the LPG cylinder.
3.1. Production of charcoal
Charcoal is a dried, carbon-concentrated form of wood3. Comparedto wood (Table 1), it is easier to store and to use, and because of itshigher heating value, it is more efficient to transport.
2 By process data, we mean GHG emissions for a process, for example the amount ofGHGs emitted in production of a UK-average kWh of electricity.
3 Or other biomass. For convenience's sake, hereafter we shall refer simply to wood.
3.1.1. Usage and sources of UK charcoalIn 2006 the UK consumed 50,000 tonnes of charcoal. Domestic
production was 5000 tonnes, imports were 55,000 tonnes, and10,000 tonnes were exported or re-exported (UK Forestry Commission,2008). At least two-thirds (Royal Botanic Gardens, 2008) or perhaps evenmost of UK charcoal (Friends of the Earth, 2004) is consumed in barbequegrills, but this is not captured in official statistics (UK ForestryCommission, 2008). Consumption and trade have changed modestlyover thepast decade; 2006 canbe considered a typical year of thepresent.
Where do UK charcoal imports come from? Royal Botanic Gardens(2008) and Friends of the Earth (2004) say that leading exporters tothe UK are countries such as Indonesia, Brazil, Ghana, and Nigeria. TheEuropean Parliament (2008) disagrees, claiming that “Trade incharcoal from Africa to the EU is not significant, however. The largestimporters of charcoal in the EU (Germany, Poland, Spain, Bulgaria andUK) source charcoal mainly from other countries inside the EU (thelargest exporters of charcoal are Poland, France and Germany).”
For theUK at least, the European Parliament has the facts completelywrong, while Royal Botanic Garden and Friends of the Earth are broadlyright. According to UK statistics (UK Trade Info, 2009) for 2008, half of
Malaysia 6,800 −140 −0.7Total, for leading exportersof charcoal to the UK
−1,062,272 −1,420 NA
Total world Not reported −7,317 −0.18

Table 4Charcoal production, process definition.
Output Quantity Unit
Charcoal, at plant 1000 kgInputsWater, cooling 50 m3
Logs, hardwood, at forest (5.128 m3) 4000 kgElectricity, medium voltage, production UCTE, at grid 75 kW hWood chips, from forest, hardwood, burned in furnace 50 kW 900 MJTransport, lorry N16t, fleet average 0.000394 tkmEmissions to air 0Heat, waste 11,603 MJCarbon dioxide, biogenic 2695 kgCarbon monoxide, biogenic 190 kgMethane, biogenic 40.33 kgEthene 2.33 kgEthane 7 kgParticulates, b2.5 um 0.45 kgParticulates, N2.5 um, and b10 um 0.05 kgParticulates, N10 um 0.055 kg
372 E. Johnson / Environmental Impact Assessment Review 29 (2009) 370–378
UK charcoal imports came from Africa, 80% from developing countriesand only 20% from the EU. The largest single importer is South Africa,with a 30% import share (Table 2).
Some UK charcoal imports are certified or controlled by the ForestStewardship Council (FSC). The FSC itself does not knowwhat fractionof imports this constitutes (FSC, 2008).
3.1.2. Wood production and depletionMost charcoal is produced from wood harvested from forests (US
EPA, 1999, Clean Fuels, 2002). Unlike Europe or North America, wherethey are increasing, forest stocks are declining among many of thecharcoal exporting countries and also globally (Table 3).
The decline in forest growing stock (column 2 in Table 3) suggeststhat UK imports are depleting carbon stocks among the charcoalexporters. This holds true even for FSC controlled or certified charcoal,because FSC does not control or certify changes in forest growing stock(FSC, 2007).
Harvesting trees for charcoal also displaces their use in non-fuelapplications. As FSC explains (SGS Qualifor, 2003) about one of itscertified operations in Brazil: “Harvest for charcoal production isconducted in a 6-year cycle. For sawn timber, the cycle is 12 years, andfor logs for the production of poles, 6 years.” In other words, woodprocessed into charcoal could alternatively be processed into poles, orleft to mature another 6 years and then processed into sawn timber.
3.1.3. Wood harvesting processTrees are felled, air dried in the forest, split and transported to the
charcoal kiln. We have defined this as the EcoInvent process modulefor ‘Logs, hardwood at forest’, that is used as an input to EcoInvent'scharcoal production module.
3.1.4. Charcoal production processCharcoal is made by pyrolising4 wood at 300–500 °C, usually in a
kiln, to flash off all volatiles, leaving behind mostly dry carbon. Theprocess can be rather simple. In the developing world, “much of its(charcoal) production occurs on a small scale, typically involving nomore than covering a stack of burning wood with dirt and leaving it tosmoulder for a week.” (OECD, 2005) To aid and speed up the process,most commercial kilns add fuel to the process: some use wood, othersuse fossil fuels. (EcoInvent, 2007)
Yields vary depending on type of wood, kiln and processconditions. Commercial yields (charcoal:wood at 20% moisture) arein the 20–35% range (Biomass Handbook, 2007, OECD, 2005), yet openpits or rural kilns may yield as little as 10–15% (Clean Fuels, 2002).
For the base case, we have used the charcoal process model fromEcoInvent, which yields 25% charcoal. The module (Table 4) is basedon actual operations in Brazil, and is seen as a proxy for commercialoperations in developing countries. (EcoInvent, 2007)
3.1.5. Packaging and transportCharcoal is shipped, bagged, distributed, sold and transported by
the end-consumer (Table 5). Using data from EcoInvent, we have putthese processes into the system model.
3.2. Production of LPG
Liquified petroleum gas is a mixture of the hydrocarbons propaneand butane that are gaseous in ambient conditions. For use as a fuel,LPG is compressed and contained; in the case of grills it is contained ina portable, refillable cylinder (Table 6).
4 Heating with an absence or deficit of oxygen. Heating with oxygen leads tocombustion, i.e. fire.
3.2.1. Sources of UK LPGLPG is a byproduct of two energy-production processes: petroleum
refining and gas processing. In the UK today (Table 7), about two-thirds of LPG comes from associated gas, while the rest comes fromrefining.
3.2.2. LPG production and distribution processesLPG is produced in the 2/3:1/3 ratio of associated gas and pet-
roleum refining, and is transported by tank truck to a cylinder fillingplant. From there, cylinders are distributed to retailers. Inputs to thisand associated GHG emissions (Table 8) were taken over from aprevious study of UK LPG production (Atlantic Consulting, 2007).
For car transport to the end consumer, we have defined the samedistance and mode as for charcoal, 5 km by passenger car.
3.3. Consumption of charcoal and LPG
To use a grill consists of loading fuel, ignition, warmup, cookingand cooldown. Data on these steps are not available from EcoInvent orother LCA databases, and an extensive literature search identified onlyone other similar study (West, 2008)5. For LPG grills, fuel consump-tion can be estimated from a grill's power rating, but charcoal grillshave no such power ratings.
Two methods to estimate fuel consumption were considered:1) the approach taken by the other study (West, 2008), which was touse theoretical heating values, or 2) to conduct a testing programmeusing volunteer grillers. The first method was rejected and the secondadopted, as explained in the following subsections.
3.3.1. Theoretical heating valuesA comparison of charcoal, LPG, natural gas and electric barbeque
grills by a researcher at Oak Ridge Laboratory (West, 2008) comes tosome broadly similar relationships as this study (compare Table 9 toSection 4.6), yet by a different approach to estimating fuel or powerconsumption. Oak Ridge estimates fuel or power consumption basedon theoretical, one-hour usage of each grill.
This approach could be used to estimate LPG consumption, becauseLPG grills have power ratings, so power rating times one hour equalsenergy consumed in a one-hour grilling session. However, as our testingshowed (Section 3.3.2.2), there still will be variance among grillers.Moreover, for charcoal, this approach is too difficult to apply. Charcoalhas awarm-up and a cool-off phase that can consume considerable fuel,and there is neither a power rating on the grill nor an obvious way to
5 Two other related, but not really similar, studies may be of value to otherresearchers: Jungbluth (1997) and Jungbluth et al. (1997).

Table 6Properties of LPG.a
Property Unit Quantity
Lower heating value MJ/kg 46.4Density (in cylinder) kg/l 0.541Cylinder weight, tare kg 14.5Cylinder weight, full kg 27.5
a Cylinder weights are standard for the UK, taken from the previous work on LPG bythe author.
Table 5Charcoal's packaging and transport inputs.
Input Quantity Unit Comment
Paper sack (for 3 kg charcoal) 74 g Estimate, based onmeasuring actual sacks
Ship transport, Brazil-UK 9000 kmUK distribution, by lorry 100 kmCar transport to end
consumer, UK5 km
Table 7Production/Consumption of LPG, UK (Johnson, 2003).
1999 2010
thousand tonnes/yearProduction 6450 4708Of whichRefined 1500 1500Associated gas 4950 3208Consumption 3140 4700
Table 8Carbon footprint of LPG production and distribution.
Process Carbon footprint kg CO2e/t LPG
Production 177Transport to cylinder filling 4Cylinder filling 11Transport to retailer 38Total 230
Table 10Charcoal consumption varies far less than food quantity or cooking time.
Variation in consumption,at 95% confidence
Charcoal Food Cooking time Comment
Griller Grill type g g min
JB Kettle ±1% ±17% ±11%NE Kettle ±7% ±13% ±0%EJ Pan ±12% ±15% ±28% Using a new,
unfamiliar grillEJ Kettle ±7% ±92% ±49%MR Kettle ±3% ±30% ±36%Average variation
(at 95% confidence)6%±2% 34%±12 25%±9%
Table 11Charcoal consumption varies according to the griller's loading.
Mean charcoalconsumption persession
Mean fire lighterconsumption persession
Griller Grill Charcoal g g
373E. Johnson / Environmental Impact Assessment Review 29 (2009) 370–378
measure it. Consequently, we did not apply this method to estimate fuelconsumption; instead, we conducted grill testing.
3.3.2. Grill testing for this studyTo determine fuel consumption, a grilling test-programme was
organised to support this study. Eight volunteers (including theauthor) were recruited; all were experienced, amateur grillers,representing typical barbeque grill users. They conducted 50 indivi-dual grill ‘sessions’, where they grilled as usual, yet documented therelevant quantities of times and weights of fuel and food usage.
3.3.2.1. How much charcoal (and lighter) do grillers use? Charcoalgrilling differs from most types of western-style cooking in that thereis no ‘on/off’ switch, and fuel consumption is not easily regulated witha dial. Key factors in determining fuel consumption are: size of the
Table 9Oak Ridge footprints of grilling fuels.
Fuel (or power source) Footprint, kg C/h
Electricity 1846Charcoal, briquettes 1391Charcoal, lump 1366LPG 690Natural gas 537
grill, design of the grill, amount of food to be cooked, cooking style andthe griller's loading (i.e. how much charcoal does he or she put on,what sort of starting-aid does he use and how much). The primaryfactor is the griller's loading (Table 10).
Our volunteers used charcoal grills of nearly identical size (cookingarea). Four of the grills were kettle type, of nearly identical design,whileone was a pan type without vents. Their loadings varied by only 4–8%from session to session, while the quantity of food cooked varied by 22–46% and the cooking timevaried from16–34% (Table 10). In otherwords,charcoal grillers tend to use a similar load of fuel fromone session to thenext, although the amount of food to be cooked and the cooking timemay vary considerably. They fill the grill and then they cook; theycompensate a bit for the amount and type of food, but not much.
Not surprisingly, there is variation inwhateach griller considers to bea loaded grill (Table 11). At the minimum, griller NE consumed anaverage of 490 g charcoal per session; at the maximum, griller JBconsumed 918 g. Average consumption, at 95% confidence, was in therange of 667–799 g per session. Fire-lighter consumption was fairlyconsistent (except for griller NE), with a 95% confidence range of 94–136 g per session.
To improve efficiency of the pan grill, a pan-sized sheet ofaluminium foil was applied to the bottom of the grill before charcoalwas loaded. This foil was changed out for every session.
3.3.2.2. How much LPG do grillers use? LPG grilling is similar to mosttypes of western-style cooking— and unlike charcoal grilling— in thatthere is an ‘on/off’ switch, and fuel consumption is easily regulatedwith a dial. This suggests that, compared to charcoal grilling, fuelconsumption is more closely related to the amount of food to becooked.
Our testing showed this to be the case: LPG consumption at 95%confidence stayed within the 25–45% range, by weight, of the foodbeing cooked. (By contrast, charcoal consumption ranged far morebroadly, from a minimum of around 30% to a maximum of 140% persession.) Quantities of food cooked and cooking time were broadly
type type
JB Kettle Lump 918 158NE Kettle Lump 490 30EJ Pan Lump 645 150EJ Kettle Lump 708 120MR Kettle Briquette 905 Lighter is built-into
the pre-treated bagMean averagea
(at 95% confidence)733±66 115±21
a The mean of the means, 733 g/session, was nearly identical to the absolute mean(all charcoal consumed/total number of sessions) of 735 g.

Table 12Composition of grills and LPG cylinder.
Grill
Materials Units Charcoal LPG LPG Cylinder
Carbon steel kg 15 15 14.5Stainless steel kg 4
Table 13Functional unit, base case.
Factor Quantity Comment
Functional unit 150 grill sessions 15/year×10 years, or 10/year×15 yearsFood cooked 1.5 kg/session Inferred from grill testingLPG consumption 525 g/session 35% of food weight, see Section 3.3.2.2Charcoal consumption 733 g see Table 11Firelighter consumption 115 g see Table 11
Table 14Combustion emission factors, from IPCC (IPCC, 2006).
kg CO2e per tonne
Fuel CO2 CH4 N2O Sum, GHG
Charcoal 3,584 147 9 3,741LPG 2,928 5 1 2,935Wooda 2,240 138 24 2,402
a Wood's emission factors are provided for reference.
374 E. Johnson / Environmental Impact Assessment Review 29 (2009) 370–378
similar for both grill types: about an hour of grilling to prepare about2 kg of food.
3.4. Disposal of charcoal and LPG
For the base case, we have presumed that cooled ash from thecharcoal and the charcoal bag are disposed to municipal solid waste.LPG is combusted, so it is ‘disposed’ to the atmosphere. Disposal of theLPG cylinder is defined below in Section 3.5.2.
3.5. Production, use and disposal of the grill and the LPG cylinder
With help from a grill manufacturer (O'Connell, 2008), composi-tions of two equivalent grills were defined for usage in the UK; withthe help of a UK LPG distributor, compositions of grill–gas cylinderswere also defined (Table 12).
Grills are manufactured in the Far East, cylinders in Europe.Transport for both is included.We used generic EcoInvent processes todefine these.
3.5.1. Production and disposal of the grillCarbon steel production is defined by EcoInvent as a ‘production
mix’ of 63% virgin (or primary) plus 37% recycled metal. We havetreated this as a so-called closed-loop/open-loop system. This ap-proach complies with the ISO standard6 for recycling allocation.
At the end of their useful lives, the grills are disposed of tomunicipal solid waste. Because scrap steel is unusually valuable today,we have presumed that all steel will ultimately be sold or collected forrecycling.
3.5.2. Production and disposal of the LPG cylinderAgain, carbon steel production is defined by EcoInvent as a
‘production mix’ of 63% virgin (or primary) plus 37% recycled metal.We have treated this as a so-called closed-loop/open-loop system. Thisapproach complies with the ISO standard7 for recycling allocation.
Cylinders have a lifetime of 40 uses. At the end of this life, 95% ofscrapped cylinders are reconditioned and put back into life for another40 uses. The 5% remaining are recycled. In summary, cylinder disposalis: 97.5% reuse; 2.38% reconditioning; and 0.12% recycling.
4. Base case footprints
This chapter presents the base case footprints for both grill typesand compares the two. Before that, we present the functional unit, theimpact assessment (characterisation) method and the combustionemission factors.
6 Paragraph 4.3.4.3.3 of ISO's LCA standard 14044.7 Paragraph 4.3.4.3.3 of ISO's LCA standard 14044.
4.1. Functional unit
Based on the collected consumption data (see Section 3.3) a basecase functional unit (Table 13) was defined for the grills.
Charcoal and LPG are deemed to be equally functional, i.e. fit-for-purpose of cooking the food.
4.2. Impact assessment method
Global warming potentials (GWPs) for atmospheric gases have beendefined and redefined over time by the Intergovernmental Panel onClimate Change (IPCC) as part of the UN Framework Conventional onClimate Change (UNFCCC). These 100-year GWPs are commonly used inLCAs and footprints, and they are recommended in footprint guidelinesissued by UK authorities (DEFRA, 2003; PAS 2050, 2008) and theWorldBusiness Council for SustainableDevelopment (WBCSD, 2004).Wehaveused the IPCC's most recent 100-year factors, published in 2007.
Biofuels are not presumed to be inherently carbon neutral. Thispresumption was common until recently, when it was refuted first fortransport biofuels (RTFO, 2008) and then for solid fuels such as woodand charcoal (Johnson, 2009; Eliasch Review, 2008).
4.3. Combustion emission factors
To calculate greenhouse gases emitted in combustion of the fuels,we used emission factors published by the IPCC (Table 14).
4.4. Charcoal grilling footprint
The footprint of charcoal grilling, for 150 grill sessions, comes out at998 kg of CO2e, or 6.7 kg CO2e per grill session (Fig. 2). So each charcoalgrilling session has a footprint similar to that of driving an averageEuropean passenger car, as defined by EcoInvent, for about 35 km.
As might be expected, most of the footprint, about 87%, comesfrom CO2, and the rest comes from methane. Nitrous oxide and othergreenhouse gases make a negligible contribution to the footprint.
The footprint is dominated by charcoal production, about 45%, andcharcoal combustion, about 40%. The rest of the footprint comes fromfirelighter combustion and production of the grill— each contributingaround 7%.
4.5. LPG grilling footprint
The footprint of LPG grilling, for 150 grill sessions, comes out at349 kg of CO2e, or 2.3 kg CO2e per grill session (Fig. 1). So each LPGgrilling session has a footprint similar to that of driving an averageEuropean passenger car8 for about 13 km.
Asmight be expected, almost all the footprint, nearly 99%, comes fromCO2, and the rest comes mainly from methane. Nitrous oxide and othergreenhouse gases make a negligible contribution to the footprint.
The dominant process in the footprint is LPG combustion, whichaccounts for two-thirds of the total. Production of the grill accounts foranother one-quarter, and the remaining one-tenth is split almostequally between LPG production and cylinder production and use.
8 As defined by EcoInvent.

Fig. 1. Charcoal grilling footprint, base case. LC = life cycle, ASM = assembly, C-grill = charcoal grill, Charc&Lightr ASM = the combined charcoal and lighter consumed in grilling.Heat, heavy fuel oil is used as a proxy for firelighter production and combustion, because paraffin's footprint is pretty similar to that of heavy fuel oil.
375E. Johnson / Environmental Impact Assessment Review 29 (2009) 370–378
4.6. Comparison of charcoal and LPG footprints
The charcoal grilling footprint of 998 kg CO2e is almost three timesas large as that for LPG grilling, 349 kg CO2e.
The difference can be understood through a comparison of the twoby component (Table 15, Fig. 3). The overwhelming factors are that asa fuel, LPG is dramatically more efficient than charcoal in itsproduction and considerably more efficient in cooking.
Secondary factors are: use of firelighters, which LPG does not need;LPG's use of a heavier, more complicated grill; and LPG's use ofcylinders that charcoal does not need.
5. Sensitivities of the footprints
To test the robustness of the footprint comparison (see previouschapter), a series of sensitivities9 were identified and tested (Table 16).The sensitivity cases are presented in the first section of this chapter;their results are presented and discussed in the second. Two other
9 Sensitivity analysis means testing how assumptions or input variables affect theresults.
potential sensitivities — one less plausible and another one difficult todefine precisely — are presented and discussed in the third and fourthsections.
5.1. Sensitivity cases
Based on inspection and experience, four potential sensitivitieswere identified as plausible: relative fuel consumption; charcoal yield;cylinder disposal; and use of fossil fuel in charcoal production. Theseare presented in the following subsections.
5.1.1. Relative fuel consumption (functional unit)Fuel consumption is inherently variable (see Section 3.3), mainly
depending on how an individual griller loads `and uses the grill. Welooked at this with two sensitivity cases, a maximum and a minimumfuel use, based on grill test data.
5.1.1.1. Maxima and minima, from test data. Sensitivities for both wererun for charcoal and for LPG.
5.1.1.1.1. Charcoal. For the base case footprint, we used 773 g ofcharcoal per grilling session, which was the average for all test
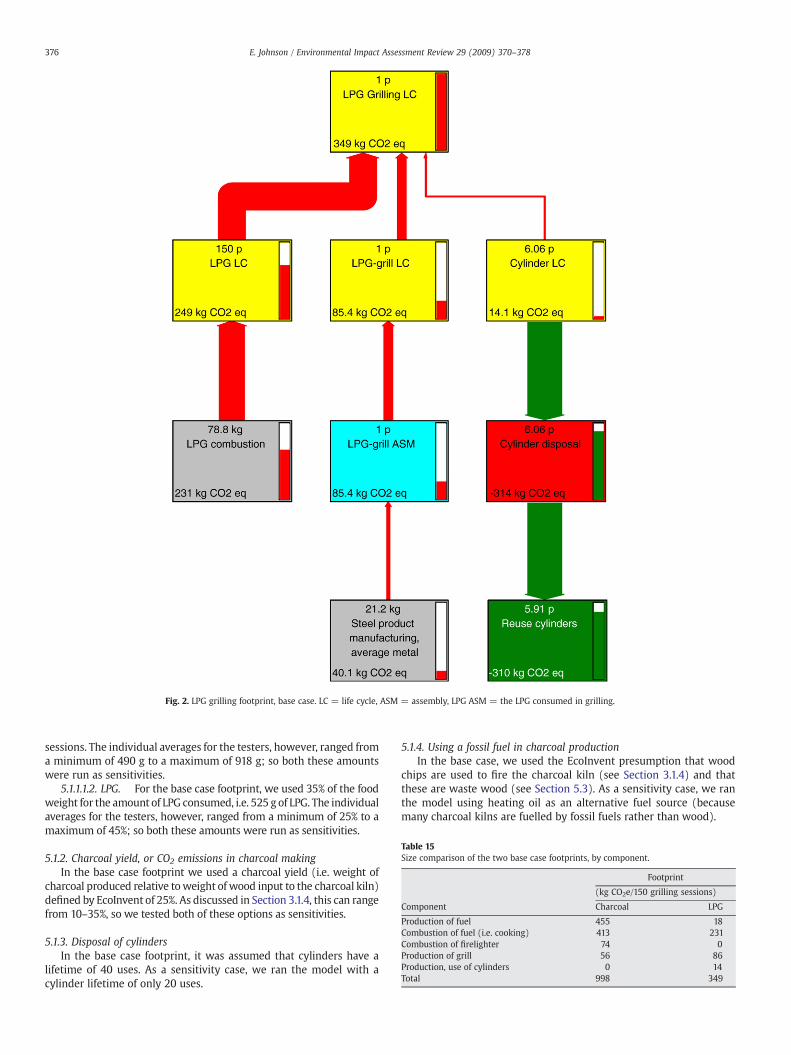
Fig. 2. LPG grilling footprint, base case. LC = life cycle, ASM = assembly, LPG ASM = the LPG consumed in grilling.
Table 15Size comparison of the two base case footprints, by component.
Footprint
(kg CO2e/150 grilling sessions)
Component Charcoal LPG
Production of fuel 455 18Combustion of fuel (i.e. cooking) 413 231Combustion of firelighter 74 0Production of grill 56 86Production, use of cylinders 0 14Total 998 349
376 E. Johnson / Environmental Impact Assessment Review 29 (2009) 370–378
sessions. The individual averages for the testers, however, ranged froma minimum of 490 g to a maximum of 918 g; so both these amountswere run as sensitivities.
5.1.1.1.2. LPG. For the base case footprint, we used 35% of the foodweight for the amount of LPG consumed, i.e. 525 g of LPG. The individualaverages for the testers, however, ranged from a minimum of 25% to amaximum of 45%; so both these amounts were run as sensitivities.
5.1.2. Charcoal yield, or CO2 emissions in charcoal makingIn the base case footprint we used a charcoal yield (i.e. weight of
charcoal produced relative toweight of wood input to the charcoal kiln)defined by EcoInvent of 25%. As discussed in Section 3.1.4, this can rangefrom 10–35%, so we tested both of these options as sensitivities.
5.1.3. Disposal of cylindersIn the base case footprint, it was assumed that cylinders have a
lifetime of 40 uses. As a sensitivity case, we ran the model with acylinder lifetime of only 20 uses.
5.1.4. Using a fossil fuel in charcoal productionIn the base case, we used the EcoInvent presumption that wood
chips are used to fire the charcoal kiln (see Section 3.1.4) and thatthese are waste wood (see Section 5.3). As a sensitivity case, we ranthe model using heating oil as an alternative fuel source (becausemany charcoal kilns are fuelled by fossil fuels rather than wood).

Fig. 3. Size comparison of the two base case footprints, by component. Fig. 4. Footprint sensitivities.
377E. Johnson / Environmental Impact Assessment Review 29 (2009) 370–378
5.2. Sensitivity results
The sensitivities (Table 16, Fig. 4) show the base case to be robust:charcoal grilling generates a significantly higher carbon footprint thandoes LPG grilling.
Although the sensitivities show some considerable variation, innone of the sensitivities are the footprints of the two grill types evenclose.
5.3. A less plausible sensitivity: charcoal sourced from waste wood
From the review of charcoal markets and production conducted forthis study (Section 3.1), it is clear that charcoal supplied to the UKmarket in particular and global markets in general is produced fromharvested wood, i.e. wood harvested expressly for the purpose ofproducing charcoal. By definition, this is not waste wood.
Waste wood is wood not usable anywhere else, including otherenergy generation processes. If the wood could be used in some otherprocess than charcoal making, then it is not a waste. For instance,sawdust generated by a saw mill or paper mill is not necessarily awaste if it could be used some other way. A good example of genuinewastewood is a disused pallet that otherwisewould be sent to landfill.
Charcoal can (and sometimes is) made from waste wood or otherbiomass wastes. If waste wood in a forest were not converted tocharcoal, then the alternative would be to leave it in the forest floor,where it will decompose. In decomposing, some carbon would beemitted to atmosphere, some to the soil.
For this sensitivity, we have used a 95:5 atmosphere:soil ratiobased on a literature value (Börjesson and Gustavsson, 2000) that isitself recognised as a rough approximation. It is presumed that 95% of
Table 16Footprint sensitivities and significance.
Charcoal LPG
Footprint Delta tobasecase
% change,to basecase
Footprint Deltato basecase
% change,to basecase
Scenario kg CO2e kg CO2eBase case 998 NA NA 349 NA NA
SensitivityMaximum fuel 1208 210 21% 420 71 20%Minimum fuel 722 −276 −28% 278 −71 −20%10% charcoal yield 1627 629 63% NA NA NA35% charcoal yield 878 −120 −12% NA NA NA20 cylinder reuses NA NA NA 353 4 1%Fossil fuel atcharcoal kiln
1007 9 1% NA NA NA
the direct CO2 emissions in producing and cooking with charcoalwould have happened anyway, so they are removed from the grillingfootprint. Other indirect emissions CO2 from equipment, transport andso on are still included. The result is a charcoal grilling footprint of342 kg CO2e, about two-thirds lower than the base case and roughlyequal to that of the LPG base case.
5.4. What about land-use change?
In compiling the charcoal footprint, the idea of land-use change— i.e.destroying forest to harvest charcoal — was not analysed for tworeasons: 1) no data on land-use change specifically for charcoalproduction appear to be available; and 2) the result would be fairlyobvious — an increase in the charcoal footprint. Nonetheless, therelationship of charcoal production and land-use change would be agood topic for further research.
5.5. A difficult-to-define sensitivity: Lifetime of the grill
In the base case, the lifetime of the grill was defined as 150 grillsessions: either 10 years×15 sessions/year or 15 years×10 sessions/year. In the British climate, this seems plausible, but there are nostatistics available to prove or disprove it. In any case, reducing orincreasing the grill lifetime does not change the fundamental result ofthe comparison (Fig. 5).
Fig. 5. Grilling less means lower footprints.

378 E. Johnson / Environmental Impact Assessment Review 29 (2009) 370–378
But what if the grills have different lifetimes? Again, there are nodata available on grill lifetimes, but based on inspection of numerousgrills during the course of this study, it is suspected that LPG grillsprobably last longer than charcoal ones, because they are both morerobust and more expensive. If they do last longer, this too will notchange the fundamental result of the comparison; indeed, it wouldwiden the gap.
References
Atlantic Consulting. Greenhouse gas emissions from production and transport of LPG;2007. Gattikon, Switzerland.
Bailis, Robert Eric, 2005. Fuel from the Savanna: the social and environmentalimplications of the charcoal trade in Sub-Saharan Africa. Ph.D dissertation, Energyand Resources, University of California, Berkeley.
Biomass Handbook, 2007. The biomass assessment handbook. Frank Rosillo-Calle et al.ISBN 978-1-84407-526-3. Earthscan. London.
Börjesson Pal, Gustavsson Leif. Greenhouse gas balances in building construction: woodversus concrete from life-cycle and forest land-use perspectives. Energy Policy2000;28:575–88.
Clean Fuels, 2002. Charcoal productionwith reduced emissions. P J Reumerman and B FFrederiks, Biomass Technology Group, Clean Fuels b.v. Presented to 12th EuropeanConference on biomass for energy, industry, and climate protection. Amsterdam,2002.
DEFRA. Guidelines for the measurement and reporting of emissions by direct par-ticipants in the UK emissions trading scheme; 2003.
EcoInvent, 2007. Life cycle inventories of wood as fuel and construction material.EcoInvent report no. 9. Werner et al.
Eliasch Review, 2008. Forest management impacts on ecosystem services. Todd Sajwaj,Mike Harley and Clare Parker. Report to the UKOffice of Climate Change, April 2008.
European Parliament, 2008.Notice to members: Petition 0435/52007 by Rafael Schiel(German), on behalf of the First Focus Foundation, on against deforestation in sub-Saharan Africa. 10 June 2008. Committee on Petitions. www.europarl.europa.eu/meetdocs/2004_2009/documents/cm/729/729457/729457en.pdf.
FAO, 2005. Global Forest Resources Assessment 2005. Forestry paper 147. Food andAgricultural Organization of the United Nations. 2006, Rome.
Friends of the Earth. Media briefing: rainforest on your BBQ. UK: Friends of the EarthLtd; 2004. 28 August.
FSC. FSC controlled wood standard: avoiding environmentally and socially damagingwood. Bonn: FSC International; 2007. www.fsc.org.
FSC, 2008. Personal communication. Rosie Teasdale, Marketing Officer, Forest Steward-ship Council UK Working Group.
IPCC, 2006. Guidelines for National Greenhouse Gas Inventories, Volume 2. Table 2.5,Emission factors for stationary combustion. UN Intergovernmental Panel onClimate Change.
Johnson Eric. LPG: a secure, cleaner transport fuel? Energy Policy 2003;31:1573–7.Johnson Eric. Goodbye to carbon neutral: getting biomass footprints right. Environ-
mental Impact Assessment Review 2009;29(3):165–8.Jungbluth, Neils, 1997. Life-Cycle-Assessment for Stoves and Ovens. Eidgenössische
Technische Hochschule, UNS-Working Paper No. 16. Available at http://www.esu-services.ch/cms/index.php?id=energy.
Jungbluth Niels, Kollar M, Koss V. Life Cycle Inventory for Cooking. Energy Policy1997;25:471–80.
Natiyal Sunil, Kaechele Harald. Fuel switching from wood to LPG can benefit theenvironment. Environmental Impact Assessment Review 2008;28(8):523–32.
O'Connell, Joe, 2008. Personal communication, Managing Director. Universal Innova-tions. Wicklow, Ireland.
OECD, 2005. Liberalisation of trade in renewable energy products and associated goods:charcoal, solar photovoltaic systems, wind pumps and turbines. OECD Trade andEnvironment Working Paper 2005–07. Ronald Steenblik, 9 December 2005.
PAS 2050, 2008. Specification for the assessment of the life cycle greenhouse gasemissions of goods and services.Version 3.1. BSI and Carbon Trust.
Royal Botanic Gardens. Charcoal production and coppice management at WakehurstPlace; 2008. www.kew.org/gowild/wildscience/charcoal.html.
RTFO. Carbon and sustainability reporting within the renewable transport fuelobligation: requirements and guidance. London: United Kingdom Department forTransport; 2008. January.
SF Chronicle, 2007. Gas or charcoal? Reducing carbon footprint is tricky business. PaulKildoff. San Francisco (California) Chronicle, 11 August 2007.
SGS Qualifor, 2003. Forest Management Certification Report AD 65-03, CAF SantaBarbara Ltda, Belo Horizonte, Minas Gerais, Brazil.
UK Forestry Commission, 2008. Personal communication, Jackie Watson. Economicsand Statistics group. UK Forestry Commission, Edinburgh.
UK Trade Info, 2009. Imports of charcoal 2008. 4402:wood charcoal, incl. shell or nutcharcoal, whether or not compressed (excl. wood charcoal used as a medicament,charcoal mixed with incense, activated charcoal and charcoal in the form ofcrayons) imports. HM Revenues and Customs. https://www.uktradeinfo.com/.
US EPA, 1999. Greenhouse gases from small-scale combustion devices in developingcountries: charcoal-making kilns in Thailand. Kirk R Smith, David M Pennise et al.EPA-600/R-99-109. United States Environmental Protection Agency.
WBCSD, 2004. The greenhouse gas protocol: a corporate accounting and reportingstandard. World Business Council for Sustainable Development, World ResourcesInstitute.
West, Tristram, 2008. Personal Communication. C emissions from BBQ grills.Environmental Sciences Division, Oak Ridge National Laboratory, Tennessee, USA.


![CHARCOAL GRILL - Woodland Direct · Lump Charcoal [DPA 305] From grilling steaks and fish to smoking a pork shoulder or turkey, our natural hardwood charcoal lets you sear, grill,](https://static.fdocuments.net/doc/165x107/5f0fda297e708231d446345f/charcoal-grill-woodland-direct-lump-charcoal-dpa-305-from-grilling-steaks-and.jpg)


