Characterizing Vehicle Rear Compartment Geometry for Child ...
31
DOT HS 812 057 August 2014 Characterizing Vehicle Rear Compartment Geometry for Child Restraint Applications
Transcript of Characterizing Vehicle Rear Compartment Geometry for Child ...

DOT HS 812 057 August 2014
Characterizing Vehicle Rear Compartment Geometry for Child Restraint Applications

DISCLAIMER
This publication is distributed by the U.S. Department of Transportation, National Highway Traffic Safety Administration, in the interest of information exchange. The opinions, findings, and conclusions expressed in this publication are those of the authors and not necessarily those of the Department of Transportation or the National Highway Traffic Safety Administration. The United States Government assumes no liability for its contents or use thereof. If trade or manufacturers’ names or products are mentioned, it is because they are considered essential to the object of the publication and should not be construed as an endorsement. The United States Government does not endorse products or manufacturers.
Suggested APA Format Citation:
Reed, M. P., Ebert-Hamilton, S. M., & Klinich, K. D. (2014, August). Characterizing vehicle rear compartment geometry for child restraint applications. (Report No. DOT HS 812 057). Washington, DC: National Highway Traffic Safety Administration.

ii
(of this report) 20. Security Classif. (of this page) 21Pa
300.7 Reproduction of completed page authorized(8‐72)
Technical Report Documentation Page 1. Report No.
DOT HS 811 057 2. Government Accession No.
3. Recipient's Catalog No.
4. Title and Subtitle
Characterizing Vehicle Rear Compartment Geometry for Child Restraint Applications
5. Report Date
August 2014
6. Performing Organization Code
7. Author(s)
Reed, Matthew P., Ebert-Hamilton, Sheila M., and Klinich, K. D.8. Performing Organization Report No.
UMTRI-2012-18
9. Performing Organization Name and Address
University of Michigan Transportation Research Institute 2901 Baxter Rd. Ann Arbor, MI 48109
10. Work Unit No. (TRAIS)
11. Contract or Grant No.
12. Sponsoring Agency Name and Address
National Highway Traffic Safety Administration 1200 New Jersey Avenue SE Washington, DC 20590
13. Type of Report and Period Covered
January 2011 to August 2012
14. Sponsoring Agency Code
15. Supplementary Notes
16. Abstract
The space available in the second row of a vehicle is a critical determinant of whether head contact with the interior will occur during a crash. Limited space can also make child-restraint installation difficult, and a child restraint system (CRS) in the second row may limit driver seat position. In the first part of this study, vehicle interior geometry for the driver and left, outboard, second-row seating positions of 25 vehicles were recorded. The measurements were combined with data from 35 vehicles measured in previous UMTRI studies, yielding a total of 60 vehicles for analysis. For each vehicle, driver seat, steering wheel, and pedal measurements were used to estimate the distribution of driver-selected seat positions that would be expected in the vehicle based on the SAE J4004 seating accommodation model. The resulting seat position distributions were expressed with respect to the second-row seating reference point established using the SAE J826 H-point machine. Quantiles of driver-selected seat position were computed with respect to the second row for an assumed 50/50 male/female U.S. adult driver population. The quantiles were compared to the excursion limits in FMVSS No. 213. In the second part of the study, detailed measurements of 21 convertible and combination child restraints were made using a coordinate digitizer. A simulation procedure was developed to estimate the space these restraints would occupy if installed rear-facing. The resulting child restraint profile locations with respect to the second-row seating reference point were overlaid with the driver seat back quantiles to estimate the frequency with which interference between the CRS and driver seat would be expected. In a separate analysis, the simulated positions of the CRS in forward-facing mode were assessed relative to the measured head restraint location using seat profile data from 11 vehicles with prominent head restraints. The head restraint appeared to influence the CRS position in about half of the simulated CRS/vehicle combinations.
17. Key Words
Child restraints, vehicle dimensions, excursion limits 18. Distribution Statement
Document is available to the public from the National Technical Information Service www.ntis.gov
19. Security Classif.
. No. of ges
1
22. Price
Form DOT F 17

ii
ACKNOWLEDGMENTS
This work was funded by the National Highway Traffic Safety Administration under cooperative agreement DTNH22-10-H-00288 with the University of Michigan. The authors acknowledge the valuable contributions of Laura Malik and Jamie Moore to the study.

iii
CONTENTS
ACKNOWLEDGMENTS .................................................................................................. ii
INTRODUCTION .............................................................................................................. 1
METHODS ......................................................................................................................... 3
RESULTS ......................................................................................................................... 12
DISCUSSION ................................................................................................................... 22
REFERENCES ................................................................................................................. 24
APPENDIX .................
...................................................................................................... 25

1
INTRODUCTION
Head injury due to contact with the vehicle interior is the most concerning crash injury problem for rear-seat passengers. In a study of 28 cases of children ages 0 to 15 who sustained AIS2+ head or face injury in a frontal crash, Arbogast et al., (2012) found that the first-row seat back and the B-pillar were the most commonly contacted vehicle components.
The size of the space around an occupant relative to the occupant’s size and initial position is a critical determinant of the likelihood of head contact during a crash. Recognizing the importance of eliminating head contacts, the National Highway Traffic Safety Administration establishes head excursion limits for frontal sled tests of child restraints and belt-positioning boosters in Federal Motor Vehicle Safety Standard (FMVSS) No. 213. In addition to child restraint applications, knowledge regarding the dimensions of the space available for occupant ride-down is critical for optimizing the performance of belt restraints for all occupants. For example, although torso load limiting is important to protect the thorax of an elderly occupant, load limiting is also accompanied by increased head excursion. For younger occupants, optimizing belt geometry to reduce submarining risk increases head excursion. The likelihood of head contact as a function of excursion distance is an important input to these optimizations.
Recent trends in vehicle and child restraint design have further focused attention on rear-compartment space. Mandates for increased vehicle fuel economy and consumer demand for more-efficient vehicles have increased the number of small cars in the new-vehicle fleet. At the same time, more large child restraints are available, with more caregivers opting for convertible, combination, and “3-in-1” restraints designed for use with larger weight ranges (Klinich & Manary, 2012). Of particular concern are large convertibles, which may be difficult to fit in a vehicle when oriented rear-facing, and large belt-positioning boosters and combination restraints that may encounter interference from vehicle head restraints.
To address these issues, a research study on the geometry of second-row, outboard seating positions was conducted. Detailed measurements were made in 25 late-model vehicles, with a focus on small cars and those with prominent second-row head restraints. The driver position was measured in each of the vehicles to permit calculation of expected driver-selected seat positions. The data from these vehicles were combined with data from 35 vehicles measured in previous UMTRI studies for a quantitative analysis of second-row space. In each vehicle, the estimated distribution of driver-selected seat positions, limited by the available seat track travel, was used to compute the corresponding locations of the profile of the back of the driver seat and head restraint. Across 60 vehicles, quantiles of the driver seat back profile were computed relative to the second-row seating reference point. These quantiles were compared with the FMVSS No. 213 excursion limits.
Separately, a FARO Arm coordinate digitizer was used to measure the geometry of 21 child restraint seats that include belt-positioning boosters as well as convertible and
2
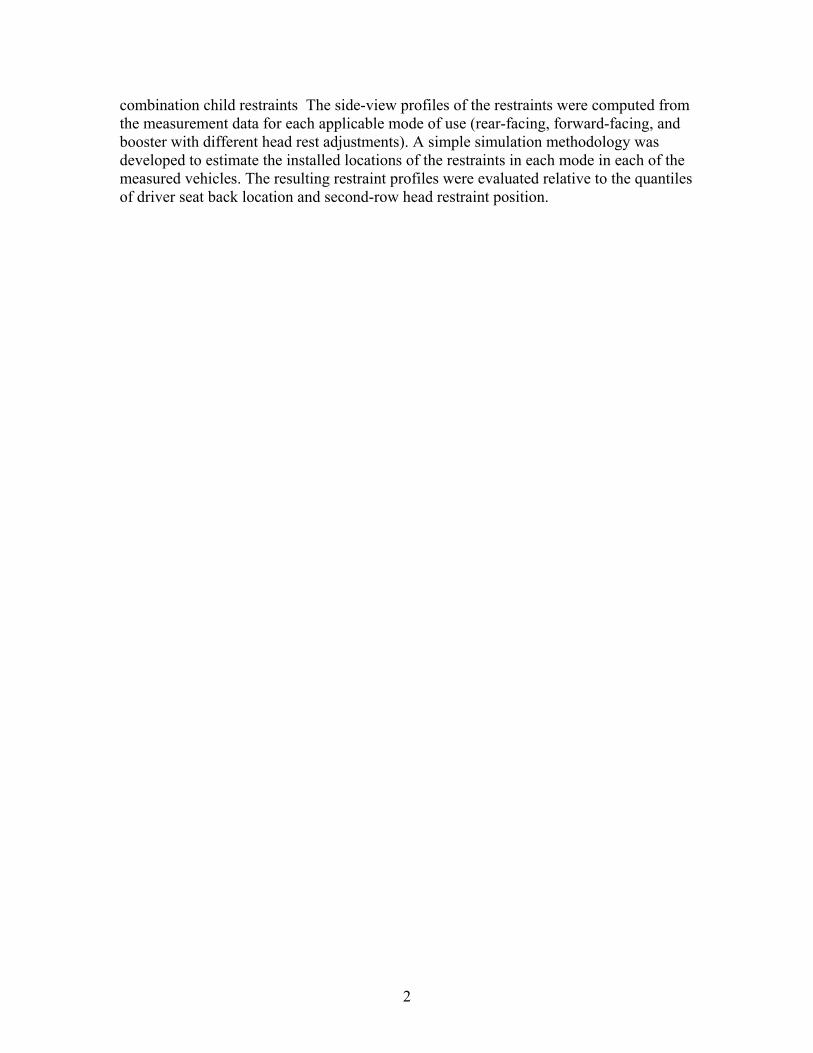
combination child restraints The side-view profiles of the restraints were computed from the measurement data for each applicable mode of use (rear-facing, forward-facing, and booster with different head rest adjustments). A simple simulation methodology was developed to estimate the installed locations of the restraints in each mode in each of the measured vehicles. The resulting restraint profiles were evaluated relative to the quantiles of driver seat back location and second-row head restraint position.

3
METHODS Vehicle Measurement
A sample of vehicles was selected based on several criteria. The primary emphasis was on small sedans with reasonably accessible second-row seats and vehicles identified as having prominent and/or fixed head restraints. Several SUVs, minivans, and full-size passenger cars were also included. Table 1 lists the 25 vehicles measured as part of the current study. Vehicle dimensions are found in the appendix.
Table 1 Vehicles Measured
UMTRI Vehicle Number
Make Model Year Category
65 Chevrolet Traverse
66 Volvo XC60
67 Ford Taurus
68 Honda Civic
69 Dodge Caravan
70 Ford Taurus
71 Hyundai Sonata
72 Toyota Sienna
73 Chrysler Grand Caravan
74 Kia Soul
75 Nissan Versa
76 Chevrolet Impala
77 Ford Explorer
78 Mitsubishi Lancer
79 Mazda 3
80 Ford F150
81 Chevrolet Tahoe
82 Volkswagen Eos
83 Audi A4
84 Ford Focus
85 Hyundai Accent
86 Honda Fit
87 Nissan Cube
88 Ford Fiesta
89 Chevrolet Aveo
* 2-door † Prominent and/or fixed head restraint
2011
2010
2006
2010
2010
2011
2011
2011
2011
2011
2011
2011
2011
2011
2011
2011
2011
2012
2004
2004
2010
2009
2011
2011
2011
SUV
SUV†
Passenger
Passenger
Minivan
Passenger†
Passenger†
Minivan†
Minivan†
Passenger
Passenger†
Passenger†
SUV†
Passenger†
Passenger
Pickup
SUV†
Passenger*†
Passenger
Passenger
Passenger
Passenger
Passenger
Passenger
Passenger
4
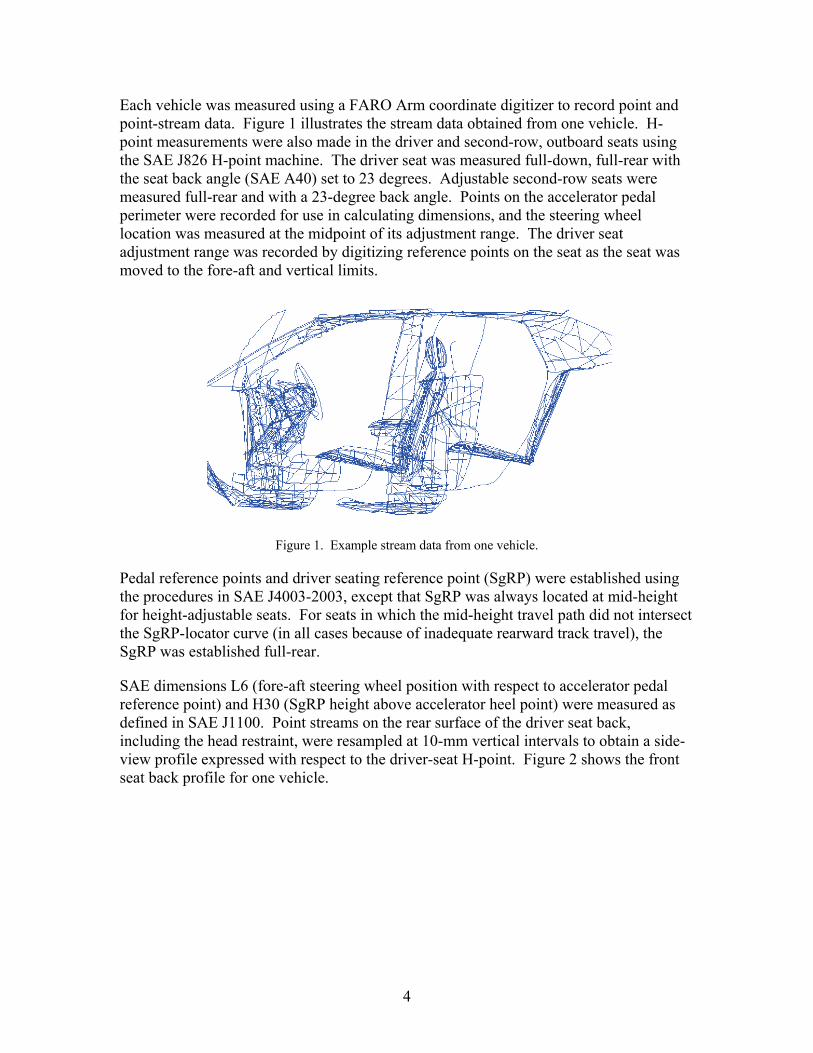
Each vehicle was measured using a FARO Arm coordinate digitizer to record point and point-stream data. Figure 1 illustrates the stream data obtained from one vehicle. H-point measurements were also made in the driver and second-row, outboard seats using the SAE J826 H-point machine. The driver seat was measured full-down, full-rear with the seat back angle (SAE A40) set to 23 degrees. Adjustable second-row seats were measured full-rear and with a 23-degree back angle. Points on the accelerator pedal perimeter were recorded for use in calculating dimensions, and the steering wheel location was measured at the midpoint of its adjustment range. The driver seat adjustment range was recorded by digitizing reference points on the seat as the seat was moved to the fore-aft and vertical limits.
Figure 1. Example stream data from one vehicle.
Pedal reference points and driver seating reference point (SgRP) were established using the procedures in SAE J4003-2003, except that SgRP was always located at mid-height for height-adjustable seats. For seats in which the mid-height travel path did not intersect the SgRP-locator curve (in all cases because of inadequate rearward track travel), the SgRP was established full-rear.
SAE dimensions L6 (fore-aft steering wheel position with respect to accelerator pedal reference point) and H30 (SgRP height above accelerator heel point) were measured as defined in SAE J1100. Point streams on the rear surface of the driver seat back, including the head restraint, were resampled at 10-mm vertical intervals to obtain a side-view profile expressed with respect to the driver-seat H-point. Figure 2 shows the front seat back profile for one vehicle.

5
Figure 2. Driver seat back profile for one vehicle (red line) along with driver and passenger seat front profiles and streams for the driver seat back and rear-compartment floor and headliner. Blue dots are H-
points measured with the SAE J826 H-point machine.
For each vehicle, the distribution of driver-selected seat position was predicted using the UMTRI seating accommodation model (Flannagan et al., 1998). This model is the basis for the seating accommodation calculations in SAE J4004-2003 and has previously been used for crash dummy positioning (Manary et al., 1998, Reed et al., 2001). For the current analysis, the driver population was assumed to be a 50/50 male/female population with normally distributed stature for each gender. Following J4004, the 1990 National Health and Nutrition Examination Survey (NHANES) III anthropometric survey of U.S. adult population was used, with the mean and standard deviation for men and women given by 1,755 (74.2) and 1,615 (68.7) mm respectively.
The distributions of fore-aft seat back position in each vehicle were estimated as follows:
1. The mean expected seat positions for men and women were calculated using the seating accommodation model equation (Flannagan et al., 1998):
HPtX = BOFX + 16.8 + 0.433 Stature - 0.24 H30 - 2.19 A27 + 0.41 L6 - 18.2 t,
where HPtX is the seat position (translated H-point) in vehicle coordinates, BOFX is the fore-aft location of the ball-of-foot reference point (see J4004), 16.8 is regression intercept, Stature is mean single-gender stature, H30 is seat height, and L6 is fore-aft steering wheel position, t is transmission type (1 for manual transmission), and A27 is seat cushion angle. Because seat cushion angle is not relevant for vehicles with angle-adjustable seats, and most vehicles in the current sample had angle-adjustable seats, A27 was taken as a typical value 14.5 degrees for all vehicles. All dimensions except A27 were entered in mm. The standard deviation of fore-aft seat position was calculated using the relationship in J4004 as 32.6 mm for men and 30.2 mm for women.

6
2. The resampled driver seat back profile was copied to the mean expected seat positions for men and women. In all cases, these predicted seat positions were within the available seat track travel. The H-point for each profile was located on the mid-height seat travel path.
3. The relocated male and female profiles were expressed relative to second-row SgRP and resampled at uniform vertical increments.
4. An empirical cumulative density function (CDF) of fore-aft seat position was computed. For each vehicle, the combined normal CDFs of the male and female seat position distributions were evaluated at 10-mm increments of X locations relative to the second-row SgRP. In each case, however, the CDF evaluated to unity if the sampled seat location (X-coordinate value) was aft of the profile at the rearmost seat position, effectively censoring the seat position based on available track travel. These calculations were repeated at each vertical increment.
5. The CDF values at each vertical increment and X value were then averaged across vehicles. This calculation gives the mean expected fraction of seat back profiles, across vehicles and drivers, lying forward of the specified X value.
6. At each vertical position, the quantiles of the resulting fore-aft distribution were computed, and the results were smoothed using a B-spline with 4 knots.
Child Restraint Measurement
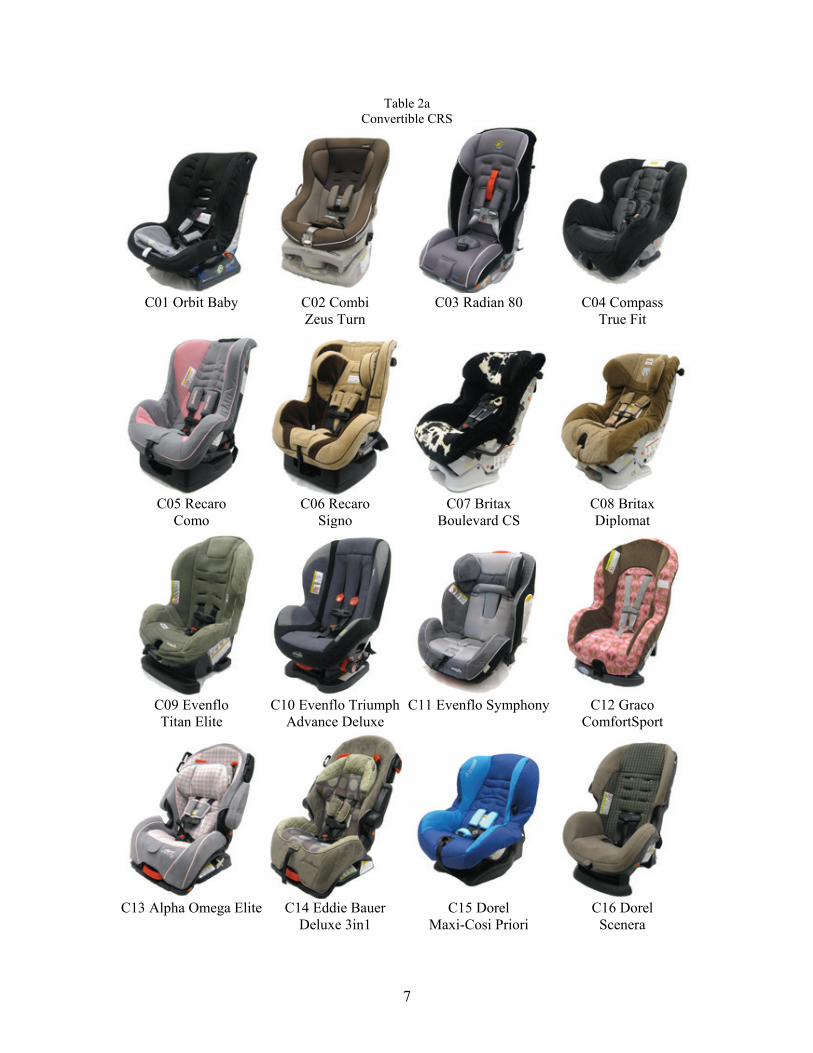
A FARO Arm coordinate digitizer was used to record the overall size and shape of 16 convertible child restraint systems (CRS) purchased in 2009. Table 2a shows each CRS in the forward-facing harness configuration. In addition, five combination restraints, shown in Table 2b, which can be used either as forward-facing harnessed restraints or as belt-positioning boosters were measured. Each child restraint was measured in all of its relevant configurations: rear-facing, forward-facing, and booster using each head restraint position. Figure 3 shows measurement data for one CRS.
7
Table 2a Convertible CRS
C01 Orbit Baby C02 Combi
Zeus Turn C03 Radian 80 C04 Compass
True Fit
C05 Recaro
Como C06 Recaro
Signo C07 Britax
Boulevard CS C08 Britax Diplomat
C09 Evenflo Titan Elite
C10 Evenflo Triumph Advance Deluxe
C11 Evenflo Symphony C12 Graco ComfortSport
C13 Alpha Omega Elite C14 Eddie Bauer
Deluxe 3in1 C15 Dorel
Maxi-Cosi Priori C16 Dorel
Scenera

8
Table 2b Combination Restraints and Belt-Positioning Boosters
B34 Evenflo Generations
B35 Britax Frontier
B36 Recaro ProBooster
B37 Graco Nautilus 3-in-1
B38 Evenflo
aestro M
Figure 3. Example CRS stream data.

9
To simplify the evaluation of CRS fit in the second row, a planar, convex contour was fit to the digitized data from each CRS. Contours were generated for the most-prominent rear- and forward-facing configurations. Figure 4 shows examples of contours created for two CRS.
Figure 4. Examples of planar, convex contours fit to rear-facing (left) and forward-facing (right) configurations for two CRS. A planar, pseudo-physics method was developed to estimate the installed position of the CRS. Figure 5 shows 60 vehicle second-row seat profiles extracted from the vehicle geometry database. Each profile was resampled using a distance-based metric to obtain 200 equally spaced points. Similarly, each CRS profile was resampled to obtain 200 points along the convex hull, as shown in Figure 6. To simulate installation, the CRS profile was positioned forward and above the seat and iteratively moved downward and rearward as though a spring force were pulling it into the seat bight. At each update, the penetration of the CRS profile into the seat profile was calculated and assigned a pseudo-force value based on a linear “stiffness.” The CRS profile was allowed to pivot in the plane as the seat interaction progressed. The simulation was halted when a particular pseudo-force value was achieved for the interaction. The stopping criterion was determined subjectively, based on visual observation of the simulation results. Figure 7 shows an overlaid sequence of images from one simulation.

10
Figure 5. Overlay of 56 second-row seat centerlines aligned at H-point.
Figure 6. Example of a CRS resampled convex hull and resampled seat profile prior to installation simulation. Larger colored dots indicate the ends of the seat back and seat cushion streams.

11
Figure 7. Overlaid sequence from a planar, pseudo-physics simulation of CRS installation. The red line shows the final position.
12
RESULTS
Quantiles of Driver Seat back Profile
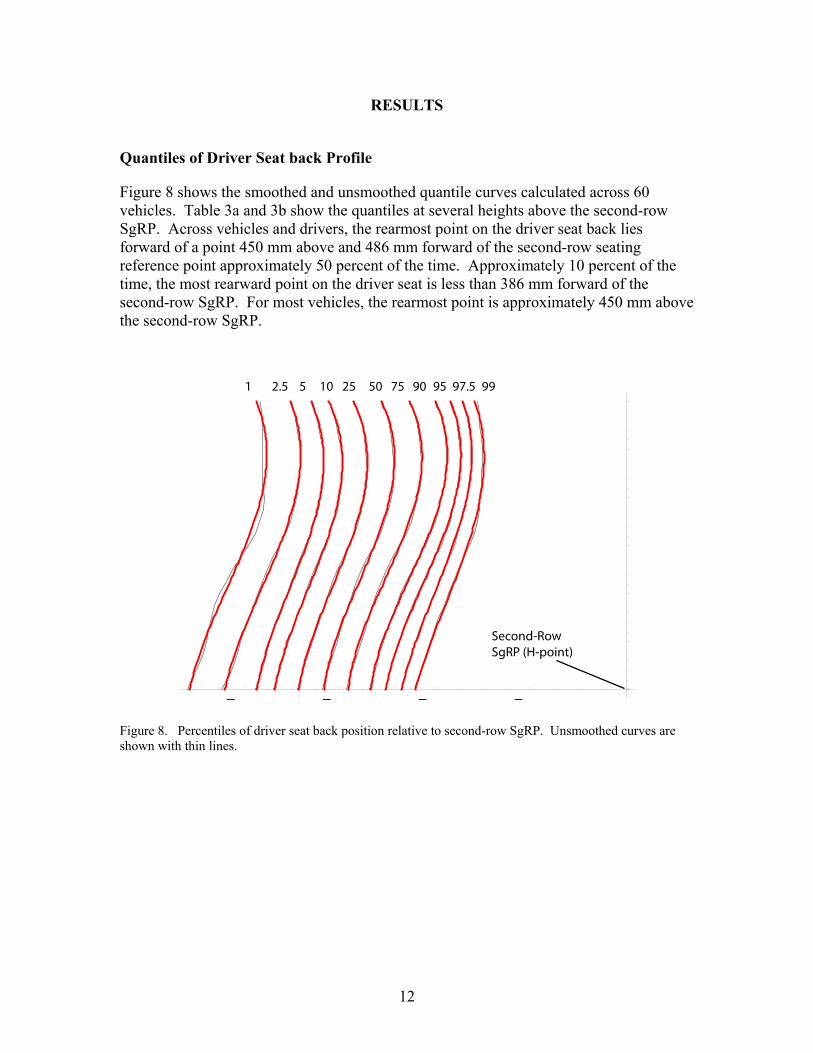
Figure 8 shows the smoothed and unsmoothed quantile curves calculated across 60 vehicles. Table 3a and 3b show the quantiles at several heights above the second-row SgRP. Across vehicles and drivers, the rearmost point on the driver seat back lies forward of a point 450 mm above and 486 mm forward of the second-row seating reference point approximately 50 percent of the time. Approximately 10 percent of the time, the most rearward point on the driver seat is less than 386 mm forward of the second-row SgRP. For most vehicles, the rearmost point is approximately 450 mm above the second-row SgRP.
Figure 8. Percentiles of driver seat back position relative to second-row SgRP. Unsmoothed curves are shown with thin lines.
13
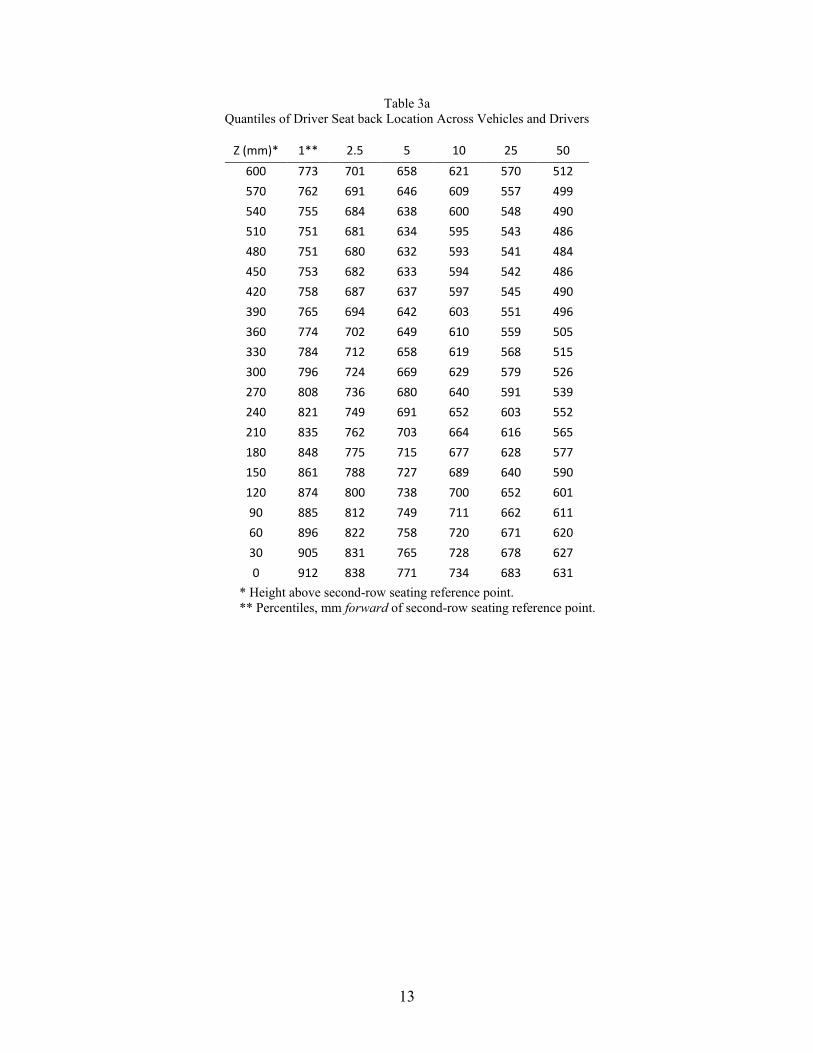
Table 3a Quantiles of Driver Seat back Location Across Vehicles and Drivers
Z (mm)* 1** 2.5 5 10 25 50 600 773 701 658 621 570 512 570 762 691 646 609 557 499 540 755 684 638 600 548 490 510 751 681 634 595 543 486 480 751 680 632 593 541 484 450 753 682 633 594 542 486 420 758 687 637 597 545 490 390 765 694 642 603 551 496 360 774 702 649 610 559 505 330 784 712 658 619 568 515 300 796 724 669 629 579 526 270 808 736 680 640 591 539 240 821 749 691 652 603 552 210 835 762 703 664 616 565 180 848 775 715 677 628 577 150 861 788 727 689 640 590 120 874 800 738 700 652 601 90 885 812 749 711 662 611 60 896 822 758 720 671 620 30 905 831 765 728 678 627 0 912 838 771 734 683 631
* Height above second-row seating reference point. ** Percentiles, mm forward of second-row seating reference point.

14
Table 3b Quantiles of Driver Seat back Location Across Vehicles and Drivers
Z (mm)* 75** 90 95 97.5 99 600 453 399 368 341 316 570 441 387 357 332 307 540 432 379 350 326 301 510 428 375 346 323 298 480 427 374 346 323 297 450 429 377 348 325 299 420 434 382 353 329 302 390 441 390 360 335 307 360 450 399 368 343 314 330 461 410 379 352 322 300 473 422 390 362 332 270 486 436 403 373 342 240 499 449 416 385 353 210 513 463 429 397 365 180 526 477 442 409 377 150 539 490 455 421 389 120 551 502 467 433 400 90 561 513 478 443 412 60 570 522 488 453 423 30 576 529 496 462 432 0 580 533 502 469 441
* Height above second-row seating reference point. ** Percentiles, mm forward of second-row seating reference point.

15
Figure 9 shows the cumulative distribution 450 mm above the second-row SgRP for all vehicles, passenger cars only, and all vehicles except minivans. The plot demonstrates that the lower tail of the distribution (most-forward quantiles) is modestly affected by the inclusion of the SUVs and minivans (a range of 40 mm at the 10th percentile), but the effect is small relative to the range of seat positions expected in any given vehicle (approximately 240 mm) or the range across drivers and vehicles shown in Figure 8. The effect of vehicle type is smaller at higher quantiles, corresponding to more-rearward seat positions. That is, the differences between vehicle categories are smaller near the rear of the seat position distribution. This is in part due to censoring of the seat position distributions due to limitations in seat track travel.
Figure 9. Quantiles of driver seat back position relative to second-row SgRP 450 mm above the SgRP for all vehicles (—), all vehicles except minivans (….), and passenger cars only (-- . --).
0.0
0.1
0.2
0.3
0.4
0.5
0.6
0.7
0.8
0.9
1.0
-800 -700 -600 -500 -400 -300
16
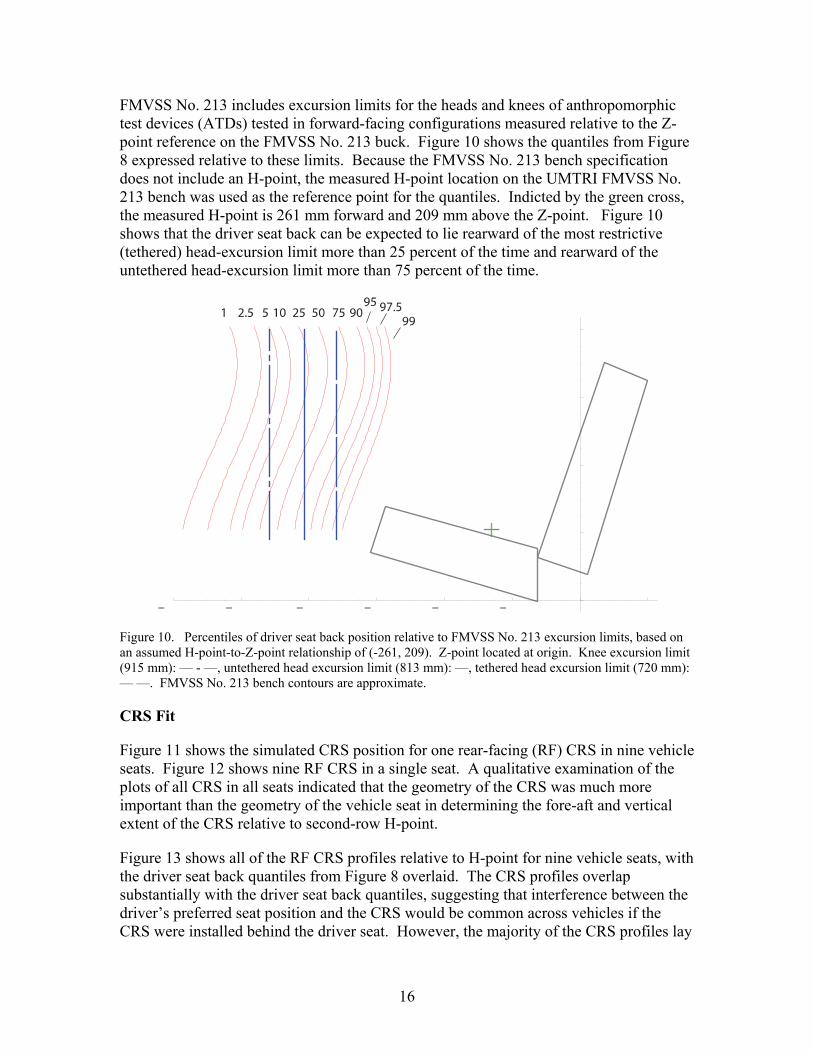
FMVSS No. 213 includes excursion limits for the heads and knees of anthropomorphic test devices (ATDs) tested in forward-facing configurations measured relative to the Z-point reference on the FMVSS No. 213 buck. Figure 10 shows the quantiles from Figure 8 expressed relative to these limits. Because the FMVSS No. 213 bench specification does not include an H-point, the measured H-point location on the UMTRI FMVSS No. 213 bench was used as the reference point for the quantiles. Indicted by the green cross, the measured H-point is 261 mm forward and 209 mm above the Z-point. Figure 10 shows that the driver seat back can be expected to lie rearward of the most restrictive (tethered) head-excursion limit more than 25 percent of the time and rearward of the untethered head-excursion limit more than 75 percent of the time.
Figure 10. Percentiles of driver seat back position relative to FMVSS No. 213 excursion limits, based on an assumed H-point-to-Z-point relationship of (-261, 209). Z-point located at origin. Knee excursion limit (915 mm): — - —, untethered head excursion limit (813 mm): —, tethered head excursion limit (720 mm): — —. FMVSS No. 213 bench contours are approximate.
CRS Fit
Figure 11 shows the simulated CRS position for one rear-facing (RF) CRS in nine vehicle seats. Figure 12 shows nine RF CRS in a single seat. A qualitative examination of the plots of all CRS in all seats indicated that the geometry of the CRS was much more important than the geometry of the vehicle seat in determining the fore-aft and vertical extent of the CRS relative to second-row H-point.
Figure 13 shows all of the RF CRS profiles relative to H-point for nine vehicle seats, with the driver seat back quantiles from Figure 8 overlaid. The CRS profiles overlap substantially with the driver seat back quantiles, suggesting that interference between the driver’s preferred seat position and the CRS would be common across vehicles if the CRS were installed behind the driver seat. However, the majority of the CRS profiles lay

17
behind the 50th-percentile driver seat back profile, suggesting that more than half of drivers, (across vehicles ), could sit directly in front of the RF CRS included in this study without the CRS contacting the driver’s seat back.
Figure 11. Simulated positions of one RF CRS in nine vehicle seats.

18
Figure 12. Simulated positions of nine RF CRS in one vehicle seat.

19
Figure 13. Profiles of 16 RF CRS on nine vehicle seats with the quantiles of driver seat back position overlaid.
The profiles of the 16 convertible CRS in forward-facing mode, as well as the combination restraints and boosters, were used to simulate installations of these restraints in the 11 vehicles identified in Table 1 as having prominent head restraints. Figure 14 shows the profiles of these seats with respect to H-point.
Figure 14. Profiles of 11 vehicle seats with prominent head restraints (see Table 1).
H-point

20
Installation simulations were conducted with side-view profiles of a total of 20 forward-facing and booster conditions in all 11 vehicle seats shown in Figure 14. The results were assessed graphically to determine in which CRS/vehicle seat combinations a significant interaction between the head restraint and the CRS was likely to occur. Figure 15 shows a range of simulated installations with no head restraint interactions and Figure 16 shows some of the conditions in which interaction appeared likely. In total, 105 simulations (48%) were judged to exhibit significant CRS/head restraint interaction and 115 (52%) showed little or no interaction.
Figure 15. Examples of simulated CRS installations in which interaction between the CRS and head restraint did not appear likely.

21
Figure 16. Examples of simulated CRS installations in which interaction between the CRS and head restraint appeared likely.

22
DISCUSSION Rear-Seat Space
This report presents the first analysis of second-row space availability based on a validated model of driver-selected seat position. The data were gathered using SAE-standard methods and a large, diverse sample of U.S. vehicles. The results of this study suggest that these driver-selected vehicle seat positions often place the vehicle seat rearward of the head excursion limits in FMVSS No. 213, when expressed relative to second-row H-point.
To simplify the analysis, the calculations of driver seat back position did not include the effects of driver-selected seat back angle. Previous work has shown that although there is a tendency for taller drivers to select more-reclined seat back angles, the effect is not large (Manary et al., 1998). The calculations also did not account for possible driver behavior to compensate for a second-row passenger. For example, drivers seated in front of a child or other second-row passenger might sit further forward, or more upright, even if there is no physical interference (such as with a CRS) with their preferred seat positions. The analysis also did not consider the comfort or safety costs of interference between a CRS and a driver’s preferred seat position.
CRS Fit
Many rear-facing child restraints extend forward of the upper quantiles of the driver seat back profile when placed in the second row using a simulated installation method. Using the simulated installation procedure, the analysis suggests that many drivers would need to sit further forward than normal if a rear-facing child restraint was placed in the second row position immediately behind them in the vehicle. (Though not analyzed explicitly during this study, a RF CRS placed in the center second-row position would also interfere with some drivers’ preferred seat positions in some vehicles.) However, NHTSA does provide consumer guidance on the proper installation of CRSs. Caregivers and parents must refer to the child restraint and vehicle manufacturers’ guidelines regarding the allowance of CRS contact against the forward seatback during regular transit.
Using the simulated installation procedure, contact between a forward-facing harnessed CRS or booster and the head restraint was noted in about half of CRS/vehicle combinations evaluated. In some cases, these contacts would not adversely affect the installation, because the CRS or booster could be adjusted to avoid or compensate for the contact. Some CRS are more rigid, however, and contact with the head restraint might make a tight installation difficult or cause stability problems when the restraint is used as a booster.
The simulated CRS installation procedure has not been validated. In any given vehicle, the installed CRS position is likely to be somewhat different from the simulated position. Only one RF configuration for each CRS was used in the simulations even if a range of rear-facing angles was allowed, and the simulations did not take into account the expected caregiver behavior of maintaining an appropriate recline angle for the CRS. These procedures may result in a more upright or more reclined CRS installation in any
23
given vehicle. The locations of CRS belt paths and vehicle seat belt or LATCH anchor geometry will also affect the installed orientation. The influence of driver seat position on CRS installation was also not considered; that is, caregivers may install the CRS in a less reclined orientation to avoid interference with the driver seat.
24
REFERENCES Arbogast, K. B., Wozniak, S., Locey, C. M., Maltese, M. R., & Zonfrillo, M. R. (2012). Head impact contact points for restrained child occupants. Traffic Injury Prevention, 13(2):172-81.
Flannagan, C. A. C., Manary, M. A., Schneider, L. W., & Reed, M. P. (1998). An Improved seating accommodation model with application to different user populations. SAE Transactions: Journal of Passenger Cars, 107(6): 1189-1197.
Klinich, K. D.,& Manary, M. A. (2012). Crash Protection for Child Passengers: Rationale for Best Practice. UMTRI Research Review 43(1).
Manary, M. A., Reed, M. P., Flannagan, C. A. C., & Schneider, L. W. (1998). ATD positioning based on driver posture and position. SAE Transactions: Journal of Passenger Cars, 107: 2911-2923. Also appeared in Proceedings of the 42nd Stapp Car Crash Conference. Warrendale, PA: Society of Automotive Engineers.
National Center for Health Statistics. (1990). National Health and Nutrition Examination Survey (NHANES III). Atlanta: Centers for Disease Control and Prevention.
Reed, M. P., Manary, M. A., Flannagan, C. A. C., Schneider, L. W., & Arbalaez, R. A. (2001). Improved ATD positioning procedures. SAE Transactions: Journal of Passenger Cars — Mechanical Systems, 110: 497-504.
SAE International Surface Vehicle Recommended Practice. “H-Point Machine (HPM-II)--Procedure for H-Point Determination--Benchmarking Vehicle Seats.” SAE Standard J4003, Rev. Oct. 2003. Warrendale, PA: Society of Automotive Engineers.
SAE International Surface Vehicle Recommended Practice. “Motor vehicle dimensions.” SAE Standard J1100, Rev. Sep. 2009. Warrendale, PA: Society of Automotive Engineers.
SAE International Surface Vehicle Recommended Practice. “Positioning the H-Point Design Tool - Seating Reference Point and Seat Track Length.” SAE Standard J4004, Rev. Aug. 2005. Warrendale, PA: Society of Automotive Engineers.

25
Appendix Vehicle Dimensions (mm)
UMTRI Vehicle
Number
Make Model Model Year
Category H30* L6* H17*
65 Chevrolet Traverse 2011 SUV 323 496 692 66 Volvo XC60 2010 SUV 339 483 693 67 Ford Taurus 2006 Passenger 265 574 647 68 Honda Civic 2010 Passenger 267 522 654 69 Dodge Caravan 2010 Minivan 373 513 734 70 Ford Taurus 2011 Passenger 311 513 673 71 Hyundai Sonata 2011 Passenger 270 564 638 72 Toyota Sienna 2011 Minivan 351 497 693 73 Chrysler Grand Caravan 2011 Minivan 349 515 719 74 Kia Soul 2011 Passenger 338 497 694 75 Nissan Versa 2011 Passenger 284 503 654 76 Chevrolet Impala 2011 Passenger 240 596 655 77 Ford Explorer 2011 SUV 357 484 719 78 Mitsubishi Lancer 2011 Passenger 281 502 651 79 Mazda 3 2011 Passenger 261 500 631 80 Ford F150 2011 Pickup 324 511 707 81 Chevrolet Tahoe 2011 SUV 353 524 705 82 Volkswagen Eos 2012 Passenger 250 524 619 83 Audi A4 2004 Passenger 241 546 607 84 Ford Focus 2004 Passenger 282 466 664 85 Hyundai Accent 2010 Passenger 277 528 649 86 Honda Fit 2009 Passenger 294 490 667 87 Nissan Cube 2011 Passenger 361 489 695 88 Ford Fiesta 2011 Passenger 255 587 674 89 Chevrolet Aveo 2011 Passenger 301 491 697
* H30 = seat height at driver SgRP, L6 = fore-aft steering wheel position, H17= steering wheel height above accelerator heel point. See SAE J1100 for detailed measurement definitions. All dimensions taken in driver seating position.
DOT HS 812 057 August 2014
10844-073114-v2