Characterizing the Role of Bmi1 in Human Brain Tumour ...
117
CHARACTERIZING THE ROLE OF BMI1 IN HUMAN BRAIN TUMOUR INITIATING CELLS
Transcript of Characterizing the Role of Bmi1 in Human Brain Tumour ...

CHARACTERIZING THE ROLE OF BMI1 IN HUMAN BRAIN TUMOUR INITIATING
CELLS

CHARACTERIZING THE ROLE OF BMI1 IN HUMAN BRAIN TUMOUR INITIATING
CELLS
By
ERIN L. O`FARRELL, Hon.B.Sc.
A Thesis Submitted to the School of Graduate Studies
in Partial Fulfilment of the Requirements for the Degree
Master of Science
McMaster University © Copyright by Erin O’Farrell, August 2011

ii
McMaster University MASTER OF SCIENCE (2011) Hamilton, Ontario (Psychology,
Neuroscience, & Behaviour)
TITLE: Characterizing the Role of Bmi1 in Human Brain Tumour Initiating Cells
AUTHOR: Erin L. O`Farrell, Hon.B.Sc. (Carleton University)
SUPERVISOR: Dr. Sheila K. Singh
NUMBER OF PAGES: xiv, 102

iii
Abstract
Bmi1 is a member of the Polycomb Group proteins and has been demonstrated as being vital in
stem cell regulation. Bmi1 is overexpressed in many cancers, including glioblastoma, and has
been shown to regulate cancer cell self-renewal and proliferation both in vitro and in vivo. This
study aimed to determine if Bmi1 modulates brain tumour initiating cell properties using a
spontaneous primary glioblastoma cell line and a commercial glioblastoma cell line. To
determine the role of Bmi1 in glioblastoma cells, stem cell assays and in vivo analysis of tumour
formation was performed on both control cells and Bmi1 knockdown cells. In both cell lines,
Bmi1 was found to play a positive regulatory role in stem cell properties. When Bmi1 was
knocked down in brain tumour initiating cells, properties such as self-renewal, proliferation and
tumour formation were impaired compared to control cells. This study supports recent literature
which shows that Bmi1 regulates stem cell properties in glioblastoma cells and supports the
potential use of Bmi1 as a therapeutic target in glioblastoma brain tumours.

iv
Acknowledgements
This thesis would not have been possible without the help and support of many people. Firstly, I
would like to give sincere thanks to my supervisor, Dr. Sheila Singh. Her support and constant
guidance helped shape this thesis and advance my scientific skills. To her, I owe the greatest
gratitude for her constant encouragement and positivity through all the challenges we
encountered along the way.
I would also like to thank all members of my advisory committee, Dr. André Bédard, Dr. Bradley
Doble, and Dr. Ray Truant, for all of their guidance and advice throughout the past two years.
Sincere gratitude must be given to all members of the Singh Lab. Without their support and help,
this thesis would never have been possible. To Dr. Chitra Venugopal for her lentiviral help and
guidance throughout this entire project and to Nicole McFarlane for all flow cytometric work, I
could not have achieved anything without you. I would also like to thank Monika Lenkiewicz for
all of her teachings and guidance during my first year and Sara Nolte for her support and
friendship throughout the past two years.
Finally, the past two years and the completion of this thesis would never been possible without
the continuous love and support of my family and friends. The words “thank you” do not
adequately express my deep gratitude to you all.

v
TABLE OF CONTENTS
Chapter 1. Introduction
1.1 Glioblastoma 2
1.2 Cancer Stem Cell Hypothesis 3
1.3 Brain Tumour Initiating Cells 5
1.4 Caveats of the Cancer Stem Cell Hypothesis 7
1.5 Bmi1 8
1.6 Bmi1 and Cancer 10
1.7 Bmi1 Knockdown 14
Chapter 2. Methods
2.1 Tumour Dissociation, RBC lysis, Cell Feeding 19
2.2 Secondary Sphere Formation Assay 20
2.3 Sphere Size Assay 20
2.4 Proliferation Assay 20
2.5 Differentiation Assay and Cell Staining 21
2.6 Flow Cytometry and Cell Sorting 23
2.7 Viral Knockdown 24
2.8 Real-Time Polymerase Chain Reaction 28
2.9 Western Blot 29
2.10 Intracranial Injection 29
2.11 Animal Collection, Sectioning and Staining 30
2.12 Statistical Analysis 31
2.13 Sample Numbers 31

vi
Chapter 3. Results
3.1 BT 241 Characterization 33
3.2 BT 241 Knockdown with shLuc and shBmi1 1 37
3.3 U-118 MG Knockdown with shLuc and shBmi1 1 46
3.4 BT 241 Knockdown with shControl shBmi1 2,
shBmi1 3, and shBmi1 4 53
3.5 In Vivo Injection of BT 241 shLuc and shBmi1 1 cells 61
Chapter 4. Discussion 66
Chapter 5. References 77
Supplementary Materials 85

vii
List of Figures
Figure 1. BT 241 culture 33
Figure 2. Expression levels of Bmi1, CD133, MAP2, and
GFAP for BT 241 34
Figure 3. Secondary sphere formation of BT 241 as compared to 3
primary GBMs. 35
Figure 4. BT 241 sphere 36
Figure 5. Proliferation of BT 241 37
Figure 6. GFP expression of BT 241 shLuc and shBmi1 cells 38
Figure 7. Bmi1 mRNA levels of BT 241 shLuc and shBmi1 1 cells 39
Figure 8. Bmi1 protein levels of BT 241 shLuc and shBmi1 1 cells 39
Figure 9. Expression levels of Bmi1, CD133, and CD15 for BT 241
shLuc and shBmi1 1 cells 40
Figure 10. Secondary sphere formation of BT 241 shLuc and
shBmi1 1 cells 41
Figure 11. Sphere size for BT 241 shLuc and shBmi1 1 spheres 42
Figure 12. Proliferation of BT 241 shLuc and shBmi1 1 cells 43

viii
Figure 13. Neuronal differentiation of BT 241 shLuc
and shBmi1 1 cells 44
Figure 14. Glial differentiation of BT 241 shLuc
and shBmi1 1 cells 44
Figure 15. Differentiation marker expression levels for BT 241
shLuc and shBmi1 1 cells 45
Figure 16. Bmi1 mRNA levels of U-118 MG shLuc and
shBmi1 1 cells 47
Figure 17. Secondary sphere formation of U-118 MG shLuc
and shBmi1 1 cells 48
Figure 18. Sphere size for U-118 MG shLuc and shBmi1 1
spheres 48
Figure 19. Proliferation of U-118 MG shLuc and shBmi1 1
cells 49
Figure 20. Neuronal differentiation of U-118 MG shLuc
and shBmi1 1 cells 50
Figure 21. Glial differentiation of U-118 MG shLuc
and shBmi1 1 cells 51
Figure 22. Differentiation marker expression levels for
U-118 MG shLuc and shBmi1 1 cells 52

ix
Figure 23. Bmi1 mRNA levels for shLuc, shControl,
shBmi1 2, shBmi1 3, and shBmi1 4 cells 54
Figure 24. Bmi1 protein levels for untransduced cells,
shControl, shBmi1 2, shBmi1 3, and shBmi1 4 cells 54
Figure 25. Secondary sphere formation for BT 241 shLuc,
shControl, shBmi1 2, shBmi1 3, and shBmi1 4 cells 55
Figure 26. Sphere size for BT 241 shControl, shBmi1 2,
shBmi1 3, and shBmi1 4 spheres 56
Figure 27. Proliferation of BT 241 shControl, shBmi1 2,
shBmi1 3, and shBmi1 4 cells under neural stem cell conditions 57
Figure 28. Proliferation of BT 241 shControl, shBmi1 2,
shBmi1 3, and shBmi1 4 cells under serum conditions 58
Figure 29. Differentiation of BT 241 shControl, shBmi1 2,
shBmi1 3, and shBmi1 4 cells 59
Figure 30. Differentiation marker expression levels for
BT 241 shLuc, shControl, shBmi1 2, shBmi1 3, and
shBmi1 4 cells 60
Figure 31. Tumour formation of 100 sorted BT 241 shLuc and
shBmi1 1 cells 62

x
Figure 32. Tumour size is decreased in NSG mice injected
with BT 241 shBmi1 1 cells compared to control cells 63
Figure 33. Tumour size appeared smaller in BT 241
shBmi1 1 cells compared to control cells 64

xi
List of Tables
Table 1. Intracranial injections of BT 241 cells transduced with
shLuc and shBmi1 1 61
Table 2. Relative tumour size of BT 241 cells transduced with
shLuc and shBmi1 1 64

xii
List of Abbreviations
AML Acute myeloid leukemia
ARF Alternative Reading Frame
bFGF basic fibroblast growth factor
Bmi1 B cell-specific Moloney murine leukemia virus insertion site-1
BTIC Brain tumour initiating cell
CDK4 Cyclin-dependent kinase 4
CDKN2A Cyclin-dependent kinase inhibitor 2A
ChIP-Seq Chromatin immunoprecipitation sequencing
CSC Cancer stem cell
DMEM Dulbecco’s Modified Eagle Medium
EDTA Ethylenediaminetetraacetic acid
EGF Epidermal growth factor
EGFR Epidermal growth factor receptor
FBS Fetal bovine serum
GAPDH Glyceraldehyde 3-phosphate dehydrogenase
GBM Glioblastoma
GFAP Glial fibrillary acidic protein
GFP Green fluorescent protein
HLA Human leukocyte antigen
hTERT human telomerase reverse transcriptase
Id1 Inhibitor of differentiation and DNA binding 1
IDH1/IDH2 Isocitrate dehydrogenase 1 or 2
INK4A Inhibitor of cyclin-dependent kinase 4

xiii
LIF Leukemia inhibitory factor
MAP2 Microtubule-associated protein 2
mir128 microRNA 128
MOI Multiplicity of infection
mRNA Messenger ribonucleic acid
NF1 Neurofibromin 1
NOD-SCID Non-obese diabetic severe combined immunodeficient
NSC Neural stem cell
NSG NOD/SCID gamma immunodeficient
PBS Phosphate buffered saline
PcG Polycomb group
PDGFRα Platelet-derived growth factor receptor alpha
PI3K Phosphoinositide 3-kinase
PIP2 Phosphatidylinositol 4,5-bisphosphate
PIP3 Phosphatidylinositol (3,4,5)-trisphosphate
PTEN Phosphatase and tensin homolog
PRC Polycomb repression complex
Rb Retinoblastoma protein
shBmi1 short hairpin RNA targeting Bmi1
Shh Sonic hedgehog
shLuc short hairpin RNA targeting Luciferase
shRNA short hairpin RNA
TIC Tumour initiating cell

xiv
Declaration of Academic Achievement
The completion of this thesis was the result of contributions from all Singh lab members and
myself. In particular, Dr. Chitra Venugopal performed all lentiviral work, RT-PCR, and Western
Blot analysis. Nicole McFarlane performed all flow analysis and cell sorting. Sara Nolte assisted
with BT 241 flow analysis and secondary sphere formation assays. For in vivo work, assistance
was provided by Dr. Chitra Venugopal, Sara Nolte, and Branavan Manoranjan. Pathological
analysis of in vivo tumours was provided by Dr. Jacek Kwiecien.

M.Sc. Thesis - E. O’Farrell; McMaster University – Neuroscience Graduate Program
1
Chapter 1.
INTRODUCTION

M.Sc. Thesis - E. O’Farrell; McMaster University – Neuroscience Graduate Program
2
1.1 Glioblastoma
Malignant gliomas are the most common primary brain tumour in adults, representing 70% of
primary brain tumours (Wen & Kesari, 2008). The most prevalent and aggressive type of
malignant glioma is termed glioblastoma (GBM) (Holland, 2000; Huse & Holland, 2010; Oliver
& Wechsler-Reya, 2004). Glioblastomas arise from glial cells within the central nervous system
and are extremely heterogeneous tumours displaying both intertumoural as well as intratumoural
heterogeneity (Bonavia et al., 2011; Holland, 2000; Chen et al., 2011; Wen & Kesari, 2008). The
heterogeneity of GBM extends to every level of the tumour from gross morphology down to
genetic mutations (Holland, 2000). Pathologically, glioblastomas are characterized by high levels
of proliferation, nuclear atypia, endothelial hypertrophy and hyperplasia, and necrosis (Huse &
Holland, 2010; Miller & Perry, 2007). At the molecular level, glioblastomas are characterized by
a multitude of mutations which can include p53 mutations, amplification of the epidermal growth
factor receptor (EGFR), loss of chromosome 1p and 19q, amplification of cyclin-dependent
kinase 4 (CDK4), deletion of cyclin-dependent kinase inhibitor 2A (CDKN2A), deletion of
retinoblastoma protein (Rb), amplification of platelet-derived growth factor receptor-α
(PDGFRα), loss of phosphatase and tensin homolog (PTEN), deletion of neurofibromin 1 (NF1),
or a mutation in isocitrate dehydrogenase 1 or 2 (IDH1/IDH2) (Huse & Holland, 2010; Verhaak
et al., 2010; Wen & Kesari, 2008).
Glioblastomas are diffuse in nature, with tumorigenic cells invading vital areas of the brain,
leaving no focal tumour to target with current therapies, and resulting in an inevitably poor
prognosis (Holland, 2000). Treatment for these tumours, which has not changed significantly for
several decades, involves surgical resection of the bulk tumour followed by radiation and
chemotherapy to target the diffusely invading cells. Average life expectancy for patients, even

M.Sc. Thesis - E. O’Farrell; McMaster University – Neuroscience Graduate Program
3
with aggressive treatment, is 12 to 15 months (Holland, 2000; Huse & Holland, 2010; Oliver &
Wechsler-Reya, 2004; Wen & Kesari, 2008).
1.2 Cancer Stem Cell Hypothesis
The idea that cancer cells arise from stem-like cells is not a new one. In 1867, the German
scientist Cohnheim suggested that cancer was the result of abnormal embryonic cells, now
known to be stem cells, or cells with stem cell properties (Tan et al., 2006). Stem cells make an
appealing “cell of origin” as they possess the capacity for self-renewal, providing long life spans
with time to acquire multiple mutations and become cancerous (Reya et al., 2001; Wicha et al,
2006).
The idea that a rare sub-population of cells within both circulating cancers and solid tumours
have the ability to self-renew and proliferate in vitro, as well as reconstitute the original tumour
phenotype in vivo, defines the cancer stem cell hypothesis. This hypothesis states that there is a
hierarchy of cancer cells ranging from “stem-like” cells, termed tumour initiating cells (TICs),
which have high proliferative capacity allowing the expansion of a tumour, down to more
differentiated cells which possess restricted proliferative capacity (Clarke et al., 2006; Dalerba et
al., 2007; Ishizawa et al., 2010; O’Brien et al., 2009; Pardal et al., 2003; Shackleton et al., 2009;
Shipitsin & Polyak, 2008; Visvader & Lindeman, 2008; Wicha et al., 2008). Cancer stem cells
are thought to either be derived from normal stem cells or from more committed progenitor cells
which have acquired the ability to self-renew and maintain tumour growth through mutations
(Ailles & Weissman, 2007; Clarke et al., 2006). The cancer stem cell hypothesis is an alternative
hypothesis to the clonal evolution model which suggests that, within a tumour, all cells have an
equal capacity to generate and maintain tumour growth. Within this hypothesis, certain cells

M.Sc. Thesis - E. O’Farrell; McMaster University – Neuroscience Graduate Program
4
have a growth advantage and as a result, are selected for throughout tumour development
(O’Brien et al., 2009; Reya et al., 2001; Shackleton et al., 2009; Vescovi et al., 2006; Visvader
& Lindeman, 2008; Wicha et al, 2006). The cancer stem cell hypothesis states that cancer stem
cells are similar to somatic, or adult, stem cells with several key differences. Although somatic
stem cells and cancer stem cells share many properties, such as the ability to self-renew and
differentiate into multiple lineages, one key difference between these two cells types is their
ability to regulate these stem cell properties. While somatic stem cells self-renew and
differentiate in an extremely controlled manner, cancer stem cells do so in an uncontrolled and
abnormal fashion (Pardal et al., 2003). Another distinction between somatic stem cells and
cancer stem cells must also be made clear: although both cell types show extensive self-renewal
and proliferation, cancer stem cells are defined by their ability to initiate and maintain tumour
formation in vivo (Clarke et al., 2006; Oliver & Wechsler-Reya, 2004; Vescovi et al., 2006). The
idea of cancer stem cells is an appealing one from a clinical standpoint as these cells make
excellent candidates for therapy evasion. Normal neural stem cells have been shown to possess
drug resistance abilities through the use of efflux pumps as well as DNA repair mechanisms. If
cancer stem cells are similar to normal stem cells, they too would possess these evasion
properties, supporting the hypothesis that a subpopulation of cells can evade cancer therapy and
regenerate the tumour in patients (Ailles & Weissman, 2007). This evasion of therapy has been
demonstrated in acute myeloid leukemia (AML) cancer stem cells which possess drug efflux
pumps as well as CD133+ cancer stem cells which possess increased DNA damage repair activity
(Steinbach & Legrand, 2007; Bao et al., 2006).
Cancer stem cells were first identified in AML through the use of cell surface markers
CD34+CD38
- which were used to isolate a highly proliferative “stem cell” population from the

M.Sc. Thesis - E. O’Farrell; McMaster University – Neuroscience Graduate Program
5
AML cell population (Bonnet & Dick, 1997). These cells both possessed high self-renewal and
were capable of initiating AML in immunocompromised mice which recapitulated the original
patient AML phenotype (Bonnet & Dick, 1997). This original identification of cancer stem cells
ruled out the stochastic model of tumour heterogeneity for leukemia. Following this discovery,
the first solid tumour cancer stem cells were discovered in breast cancer using the surface
markers CD44+CD24
- (Al-Hajj et al., 2003) and shortly thereafter in medulloblastoma and
glioblastoma using the surface marker CD133+ (Singh et al., 2003; Singh et al., 2004b). These
subpopulations of cells all demonstrated high self-renewal and multipotentiality both in vitro and
in vivo as compared to their non-cancer stem cell counterparts (Al-Hajj et al., 2003; Singh et al.,
2003; Singh et al., 2004b).
1.3 Brain Tumour Initiating Cells
Brain tumours are composed of both neurons and glial cells which suggest that they may also
contain pluripotent progenitor cells. Brain tumours have also been demonstrated as expressing
neural stem/progenitor cell markers such as CD133 and nestin (Oliver & Wechsler-Reya, 2004).
Primary brain tumour cells, isolated from patient samples, cultured in vitro form neurospheres, or
“tumour spheres”, under serum-free culture conditions similarly to neural stem cells (Singh et al,
2003). When placed under differentiation conditions, these tumour cells differentiate into both
neurons and glial cells which reflect the heterogeneity of the primary tumour. These observations
in vitro indicate that brain tumour cells have the capacity for self-renewal and multi-lineage
differentiation similar to neural stem cells (Oliver & Wechsler-Reya, 2004; Singh et al., 2003).
This observation of neural stem-like cells in brain tumours suggests that a subset of tumour cells
can be classified as “cancer stem cells” (Oliver & Wechsler-Reya, 2004, Singh et al, 2003).
M.Sc. Thesis - E. O’Farrell; McMaster University – Neuroscience Graduate Program
6
Brain tumour initiating cells (BTICs) were originally identified when a subpopulation of primary
brain tumour cells in non-adherent cell culture conditions selecting for neural stem cell growth
formed tumour spheres within 48 hours of placing these cells into culture (Singh et al., 2003).
Over time, these tumour spheres continued to thrive and proliferate, while the other cells within
the culture either adhered and differentiated or simply lost the ability to proliferate. The isolated
tumour spheres were then analysed for marker determination and found to be nestin positive and
CD133 positive. Nestin is an intermediate filament protein which is used as a neural stem cell
marker as it is found in undifferentiated neural cells. CD133 is a five transmembrane protein of
unknown biological function originally used to identify hematopoietic stem and progenitor cells
and thought to be a neural stem cell marker as it has been used to isolate fetal human neural stem
cells (Tabatabai & Weller, 2011; Singh et al., 2003; Singh et al.,2004a; Uchida et al., 2000; Yin
et al., 1997). The tumour spheres were subjected to neural stem cell assays to determine self-
renewal, proliferative, and differentiation capacity. Interestingly, when CD133+ cells and CD133
-
cells were isolated and cultured independently, CD133+ cells showed the proliferative
characteristics of whole tumour spheres while CD133- cells exhibited adherence and a decrease
in proliferation. As well as displaying stem cell-like properties, the isolated CD133+ cells, when
differentiated, displayed an identical phenotype to the original primary tumour rather than
differentiating as normal neural stem cells into 20-30% neurons, 50-60% astrocytes, and 5-10%
oligodendrocytes. This observation indicated that the isolated subpopulation of cells were not
normal neural stem cells but rather tumour cells with stem cell-like properties (Singh et al.,
2003). Further in vivo characterization of this subpopulation of cells revealed that only the
CD133+ population were capable of forming tumours in non-obese diabetic severe combined
immunodeficient (NOD-SCID) mice. In fact, an injection of 100,000 CD133- cells did not

M.Sc. Thesis - E. O’Farrell; McMaster University – Neuroscience Graduate Program
7
initiate tumour formation whereas an injection of 100 CD133+ cells was able to initiate tumour
formation (Singh et al., 2004b). The xenograft tumours also recapitulated the original patient
tumour phenotype. To truly confirm whether these CD133+ cells reflected a cancer stem cell
population, serial re-transplantation of primary xenografts was performed. All mice injected
serially with primary xenograft cells exhibited tumour formation and the secondary tumour
reflected the original patient tumour phenotype confirming that the CD133+ subpopulation of
cells displayed in vivo self-renewal and reflected a cancer stem cell population (Singh et al.,
2004b).
1.4 Caveats of the Cancer Stem Cell Hypothesis
Much debate exists around the ideas proposed in the Cancer Stem Cell Hypothesis. The main
argument against the Cancer Stem Cell Hypothesis is that the hypothesis attributes cancer
properties to the intrinsic cellular processes and may not account for extrinsic factors such as
environmental niche and immune system (Rosen & Jordan, 2009). Normal stem cells require a
niche for survival and maintenance of stem cell properties, therefore the same must hold true for
cancer stem cells, however, this has not yet been fully explored within the Cancer Stem Cell
Hypothesis (Shipitsin & Polyak, 2008). This argument is further supported by the idea that the
“gold standard” for demonstrating the existence of cancer stem cells is serial re-transplantation in
a xenograft model. Xenografts, although informative, do not provide human cells with the
appropriate extrinsic factors and cues. In this regard, it is argued that xenograft models merely
select for cells which are better able to survive in a mouse environment rather than selecting for
truly tumorigenic cells (Clarke et al., 2006; Hadjipanayis & Van Meir, 2009; Kelly et al., 2007;
Marquardt et al., 2010; Rosen & Jordan, 2009; Shipitsin & Polyak, 2008, Visvader & Lindeman,
2008). This is especially true for solid tumours which require extensive niches for growth,

M.Sc. Thesis - E. O’Farrell; McMaster University – Neuroscience Graduate Program
8
including endothelial cells and extensive vasculature (Shipitsin & Polyak, 2008). The niche of a
tumour is so important that it has even been shown that the site of injection of tumour cells can
create marked differences in engraftment rates and therefore cancer stem cell read-out (Clarke et
al., 2006; Visvader & Lindeman, 2008). This has been demonstrated using GBM cells which,
when injected subcutaneously, resulted in a 50% engraftment rate as compared to 100%
engraftment when injected intracranially (Galli et al., 2004). Furthermore, intrinsic factors of
cancer cells such as genomic instability and rapid changes in marker expression are not
accounted for by the Cancer Stem Cell Hypothesis. Malignant cells are known to change over
time and adapt to environmental changes, thus raising the question about the validity of using
surface markers to isolate so-called cancer stem cells. Not only have surface markers been shown
to be stochastically activated by culture conditions thus impacting the true isolation of a cancer
stem cell, the ever changing nature of malignant cells dictates that surface marker expression
would change rapidly as a result of environmental changes and stressors (Clarke et al., 2006;
Emmenegger & Wechsler-Reya, 2008; Marquardt et al., 2010; Shipitsin & Polyak, 2008). As
well as surface marker expression changes as a result of environment, technical issues such as
different cell preparation techniques and different isolation techniques leads to marked
differences in supposed cancer stem cell frequencies as reported by different groups (Clarke et
al., 2006; Visvader & Lindeman, 2008).
1.5 Bmi1
The Bmi1 (B cell-specific Moloney murine leukemia virus insertion site-1) gene is located on the
plus strand of chromosome 10 at 22,605,381 bp from pter (Alkema et al., 1993). The gene
extends over a 4.9Kb range and comprises 10 exons and 9 introns (Jiang et al., 2009). The
functional promoter region of Bmi1 has yet to be conclusively defined and as a result, most

M.Sc. Thesis - E. O’Farrell; McMaster University – Neuroscience Graduate Program
9
researchers use a sequence of 20-30 base pairs upstream of the translational start site as the
promoter (Abdouh et al., 2009; Alkema et al., 1993; Chiba et al., 2008; Zencak et al., 2005). The
Bmi1 protein is 37KDa and is comprised of 326 amino acids. It is mainly found in the nucleus
but is also present in the cytoplasm of a cell (Cohen et al., 1996). Bmi1 contains a RING-type
zinc finger at the N-terminus of the protein and a conserved helix-turn-helix site in its centre
(Alkema et al., 1993; Dimri et al., 2002; Jiang et al., 2009; Park et al., 2004).
Bmi1 is a member of the highly conserved polycomb group (PcG) genes and acts as a
transcriptional repressor of multiple genes, including genes which determine proliferation and
differentiation of cells throughout development (Alkema et al., 1993; Bracken et al., 2010; Chen
et al., 2010; Sauvageau & Sauvageau, 2010; Schuringa & Vellenga, 2010; Valk-Lingbeek et al.,
2004). Bmi1 is one of several subunits in the polycomb repression complex 1 (PRC1) which is
also comprised of Mel-18, Ring1A/B, CBX2, CBX4, CBX6, CBX7, CBX8, and PH1/PH2 (Li et
al., 2006). A second repression complex, PRC2, is comprised of the subunits EZH2, EED,
SUZ12, and RbAp46/48. Together PRC1 and PRC2 are responsible for the transcriptional
regulation of multiple genes through histone modifications (Bracken et al., 2010; Kallin et al.,
2009; Schuringa & Vellenga, 2010). The initial step of transcriptional regulation involves the
trimethylation of histone 3 on lysine 27 by PRC2 which compacts the chromatin. The
catalytically active subunit of PRC2 responsible for this step is EZH2, a histone
methyltransferase specific to lysine 27 of histone 3 and lysine 26 of histone 1. The PRC1
subunits recognize the H3K27 trimethylation mark (H3K27me3) left by PRC2 and subsequently
induce the monoubiquitination of lysine 119 of histone H2A. The monoubiquitination of lysine
119 of histone H2A is made possible by Bmi1 which binds to Ring1B thus stimulating its E3
ligase activity (Bracken et al., 2006; Bracken et al., 2010; Kallin et al., 2009; Li et al., 2006;

M.Sc. Thesis - E. O’Farrell; McMaster University – Neuroscience Graduate Program
10
Schuringa & Vellenga, 2010; Wang et al., 2004). The monoubiquitination of H2A then represses
gene transcription or induces complete silencing by physically blocking RNA Polymerase II
(Bracken et al., 2010; Schuringa & Vellenga, 2010; Zhou et al., 2008).
The monoubiquitination of H2A leaves a uH2A mark which can be detected using chromatin
immunoprecipitation sequencing (ChIP-Seq) technology. Using this technology, it was found
that Bmi1-dependent uH2A marks are increased at genes which are silenced or have low
expression, confirming that Bmi1 represses such genes (Kallin et al., 2009). It was also found
that there was a bias of Bmi1-dependent uH2A marks present at genes which contained
H3K27me3 marks, however, some uH2A marks were still present where no H3K27me4 marks
existed, indicating that there may be other unknown recruitment mechanisms for PRC1 other
than PRC2 (Kallin et al., 2009).
Interestingly, PcG binding and H3K27me3 marks are found to be increased within stem cells and
are associated with self-renewal. During differentiation, binding decreases and repression is
released, allowing the transcription of certain genes. It is also thought that the increased PcG
binding seen in stem cells may be associated with certain cancer causing mutations, such as
overexpression of oncogenes like Bmi1 or silencing of tumour suppressor genes (Bracken et al.,
2006).
1.6 Bmi1 and Cancer
Within normal neural stem cells, Bmi1 has been shown to play a role in self-renewal and
proliferation. Bmi1 overexpression has been demonstrated as resulting in increased self-renewal
and proliferation as well as decreased differentiation, thus making it an excellent target for
potential deregulation within cancer (He et al., 2009; Yadirgi et al., 2011). Bmi1 was first

M.Sc. Thesis - E. O’Farrell; McMaster University – Neuroscience Graduate Program
11
identified as an oncogene which cooperated with the oncogene c-myc within murine
lymphomagenesis (Haupt et al., 1991; van Lohuizen et al., 1991). Bmi1 has since been
demonstrated as being present and often overexpressed in multiple cancers including leukemia,
hepatocellular carcinoma, laryngeal carcinoma, lung cancer, breast cancer, colon cancer, and
brain tumours such as medulloblastoma and glioblastoma (Schuringa & Vellenga, 2010; Chiba et
al., 2008; Chen et al., 2010; Silva et al., 2006; Kim et al., 2004; Leung et al., 2004; Abdouh et
al., 2009; He et al., 2009; Jacobs et al., 1999a; Liu et al., 2006). Interestingly, within
glioblastoma cells, overexpression of Bmi1 is not associated with gene amplification therefore it
is most likely the result of increased transcription (Abdouh et al., 2009).
One of the most studied Bmi1 pathways associated with cancer is the repression of the
INK4A/ARF locus. The INK4A/ARF locus is located on chromosome 9p21, a chromosome whose
short arm is often mutated in human cancers (Sharpless & DePinho, 1999). Within this pathway,
Bmi1 directly or indirectly represses transcription of CDKN2A, which encodes for the two
cyclin dependent kinases INK4A and ARF (Abdouh et al., 2009; Gil et al., 2005; Pardal et al.,
2003). It has been demonstrated that increased Bmi1 levels are associated with low INK4A and
ARF levels indicating a potential regulatory role by Bmi1 (Kim et al., 2004).
The inhibitor of cyclin-dependent kinase 4 (INK4A) family of proteins contains the tumour
suppressor p16 which acts in the retinoblastoma protein (pRB) cellular growth pathway. Within
this pathway, p16 binds to and inhibits CDK4/cyclin D by inhibiting its kinase activity through
the distortion of the cyclin-binding site. This prevents ATP binding and subsequently prevents
the phosphorylation of pRB (Grinstein & Wernet, 2007; Ivanchuk et al., 2001; Sharpless &
DePinho, 1999). This causes an arrest in the cell-cycle progression and senescence in cells.
Interestingly, pRB is essential to this cell cycle arrest, as seen in cells lacking pRB which do not

M.Sc. Thesis - E. O’Farrell; McMaster University – Neuroscience Graduate Program
12
show arrest even when levels of p16 are increased. Clinically, this is seen in many gliomas which
have a loss of pRB but retain p16 (Ivanchuk et al., 2001).
The Alternative Reading Frame (ARF) locus encodes for the protein p14 (p19 in mice) and acts
on the p53-mediated cellular growth pathway. In this pathway, p14 inhibits MDM2, a ubiquitin
ligase responsible for targeting p53 for degradation by displacing it from the nucleus to the
nucleolus. This leaves p53 free to act as a transcription factor for its downstream targets,
resulting in an inhibition of cell cycle progression and the promotion of apoptosis (Grinstein &
Wernet, 2007; Ivanchuk et al., 2001).
Bmi1 regulates INK4A and ARF through transcriptional repression in a dose-dependent manner
(Jacobs et al., 1999b). Through direct or indirect inhibition of CDKN2A transcription, Bmi1
inhibits p16 thus preventing the suppression cyclin D dependent kinases and inducing
phosphorylation of retinoblastoma protein (Rb) resulting in increased cell proliferation. Bmi1
also acts by suppressing p14/p19, through repression of CDKN2A transcription, thus preventing
its binding to MDM2. This subsequently allows MDM2 to bind to and degrade p53 resulting in
decreased apoptosis (Bruggeman et al., 2007; Chen et al., 2010; Jacobs et al., 1999a; Jacobs et
al., 1999b; Pardal et al., 2003). These findings have been verified consistently in mouse
embryonic fibroblasts however, in human embryonic fibroblasts, it has been found that
overexpression of Bmi1 decreases INK4A transcription but not ARF transcription (Bracken et al.,
2010). Further analysis found that the PRC1 and PRC2 combine and “blanket” the INK4A locus,
a 10Kb locus, but do not repress ARF in the same manner as seen by the H2A mark on INK4A
promoter but not on the ARF promoter (Bracken et al., 2010). Importantly, in order for Bmi1 to
continuously repress the INK4A/ARF locus, PRC2 must be continuously associated. If

M.Sc. Thesis - E. O’Farrell; McMaster University – Neuroscience Graduate Program
13
components of PRC2, such as EZH2 or SUZ12, are downregulated, Bmi1 dissociates from the
promoter and transcription is no longer repressed (Bracken et al., 2010).
Many other potential Bmi1 pathways exist which may be involved in cancer progression. One
method of repression may involve the oncogene c-myc, a member of a family of transcription
factors important for cell proliferation and differentiation throughout development.
Overexpression of c-myc has been linked to tumorigenesis through decreased differentiation and
increased self-renewal however when expressed alone, it induces mouse embryonic fibroblast
apoptosis through increased p19 transcription (Jacobs et al., 1999b; Li et al., 2009). When Bmi1
and c-myc are expressed together, however, apoptosis is prevented and proliferation is increased.
When INK4A/ARF is lost, this relationship is not seen, thus it has been speculated that Bmi1
inhibits apoptosis by c-myc through direct inhibition of the INK4A/ARF locus, which results in
increased proliferation and transformation (Alkema et al., 1993; Jacobs et al., 1999b).
Another pathway of repression involves human telomerase reverse transcriptase (hTERT) which
activates telomerase activity, preventing telomere erosion and cellular senescence. It has been
found that Bmi1 may bind to and activate transcription of hTERT, leading to the immortalization
of mammary epithelial cells through telomerase activity; however, this binding appears to be
cell-type specific, as this effect was not seen in human fibroblasts (Dimri et al., 2002).
Another Bmi1 pathway of repression involves the helix-loop-helix inhibitor of differentiation
and DNA binding (Id1). Id1 is a well known oncogene which stimulates cell cycle progression
and cell proliferation. Id1 activates the serine/threonine protein kinase, Akt, pathway and leads to
increased phosphorylation of Akt. The increased phosphorylation of Akt induces the degradation
of Mel-18, a subunit of the PRC1 complex, which leads to the activation of c-myc. C-myc then

M.Sc. Thesis - E. O’Farrell; McMaster University – Neuroscience Graduate Program
14
binds to the E-box in the Bmi1 promoter inducing transcription of Bmi1 in the nucleus. Bmi1
then binds to RING1B and increases its E3 ligase activity subsequently promoting histone H2A
ubiquitination at lysine 119 which leads to the silencing of genes such as p14 and p16 (Qian et
al., 2010).
Together, these pathways reveal several potential targets of Bmi1 mutation which could result in
uncontrolled proliferation and cancer.
1.7 Bmi1 Knockdown
Bmi1 has been found to be essential for the self-renewal and proliferation of both normal neural
and hematopoietic stem cells (Abdouh et al., 2009; Ailles & Weissman, 2007; Bruggeman et al.,
2007; Chen et al., 2010; Fasano et al., 2007; Gil et al., 2005; Lessard & Sauvageau, 2003; Park
et al., 2004). It has been demonstrated as a key component of PRC1, as the loss of Ring1a or
M33 from the complex do not affect self-renewal of neurospheres, while loss of Bmi1 causes
clear deficits in self-renewal (Bruggeman et al., 2005). Bmi1 deficiency has been demonstrated
as having a negative effect on self-renewal, proliferation, and differentiation potential in multiple
cell types including normal murine neural stem cells, hematopoietic stem cells and cancer stem
cells both in vitro and in vivo (Fasano et al., 2009; Molofsky et al., 2003; Bruggeman et al.,
2007; Iwama et al., 2004; Schuringa & Vellenga, 2010; Abdouh et al., 2009; Chen et al., 2010;
Gil et al., 2005; Lessard & Sauvageau, 2003).
Within mouse embryonic fibroblasts, Bmi1 deficiency leads to premature senescence of cells as
compared to wild-type fibroblasts, while overexpression of Bmi1 immortalizes fibroblasts
through increased cell proliferation (Jacobs et al., 1999a). Decreased cell growth and increased
apoptosis is also seen when Bmi1 is knocked down in normal cells and normal stem cells,

M.Sc. Thesis - E. O’Farrell; McMaster University – Neuroscience Graduate Program
15
however the effect is much more acute (Liu et al., 2006). Interestingly, some researchers have
found that when Bmi1 is knocked down in neural stem cells, self-renewal and proliferation
decrease, however survival and differentiation of cells remains similar between control cells and
Bmi1-/- cells (Molofsky et al., 2003).
Bmi1 has been demonstrated as being crucial for self-renewal and proliferation both in vitro as
well as in vivo. In fact, in vivo analyses of GBM cells showed increased caspase-3 activity 10
days post-injection in Bmi1 knockdown cells, indicating increased apoptosis and suggesting that
Bmi1 is necessary for tumour formation in vivo (Abdouh et al., 2009). Also, in vitro studies of
GBM cells indicated that when Bmi1 is knocked down, levels of human leukocyte antigen
(HLA) immune response molecules increase, suggesting that Bmi1 may support tumour evasion
from host immune cells through inhibition of HLA molecules (Abdouh et al., 2009).
When Bmi1 is knocked down in both haematopoietic stem cells and cancer stem cells, levels of
p14 and p16 become upregulated and reactive oxygen species levels increase, resulting in
decreased cell growth and increased apoptosis (Bruggeman et al., 2007; Gil et al., 2005; Jacobs
et al., 1999a; Liu et al., 2006; Molofsky et al., 2003; Schuringa & Vellenga, 2010). Further
studies have indicated that Bmi1 knockdown in GBM cells inhibits cell proliferation and self-
renewal in vitro through increased apoptosis and differentiation, independent of a functional
INK4A/ARF locus, suggesting alternative pathways for Bmi1 repression (Abdouh et al., 2009).
When studied further using microarray and ChIP analysis on INK4A/ARF -/- GBM tumours, it
was determined that in the absence of INK4A/ARF, Bmi1 binds to and inhibits p21, which blocks
cell growth through the inhibition of CDK4 and prevention of Rb phosphorylation and maintains
the Rb-E2F complex required to repress cell-cycle progression (Abdouh et al., 2009; Fasano et
al., 2007). Bmi1 inhibition on p21 has also been demonstrated in normal murine neural stem

M.Sc. Thesis - E. O’Farrell; McMaster University – Neuroscience Graduate Program
16
cells in which Bmi1 knockdown revealed an increase in p21 levels but no change in p16 or p19
levels (Fasano et al., 2007). Furthermore, p18 was found to be increased in INK4A/ARF -/- GBM
tumours and increased further when Bmi1 was knocked down leading investigators to believe
that p18 compensated for p16 deletion in gliomas and was a target of Bmi1 suppression (Abdouh
et al., 2009).
When prostate cancer cells are subjected to Bmi1 knockdown, levels of p53 and PTEN increase,
while levels of cyclin D1 decrease. Of particular interest is phosphatase and tensin homolog
(PTEN), a tumour suppressor which dephosphorylates phosphatidylinositol (3,4,5)-trisphosphate
(PIP3) into phosphatidylinositol 4,5-bisphosphate (PIP2) thus inhibiting phosphoinositide 3-
kinase (PI3K) mediated tumorigenic activity. It has been demonstrated that PTEN binds to and
inhibits Bmi1 in the nucleus of prostate cancer cells thus releasing the suppression of p16 and
p14 and preventing Bmi1-mediated proliferation (Fan et al., 2009; Chen et al., 2010; Schuringa
& Vellenga, 2010). However, PTEN is often inactivated in glioblastoma tumours perhaps
allowing Bmi1 to suppress apoptosis and cell cycle exit (Vescovi et al., 2006).
Through siRNA studies, it was found that depletion of any number of PRC1 or PRC2 members
led to an increase in the other members of the complexes indicating that Polycomb Group genes
autoregulate their synthesis in response to changes in expression of other complex members
(Bracken et al., 2006). Interestingly, when Bmi1 is knocked down in cells, levels of the PRC1
complex member CBX7 increase and rescue senescence of cells and when CBX7 is knocked
down, Bmi1 levels rise and rescue senescence indicating potential autoregulation within the
complex and another potential method of mediating proliferation (Gil et al., 2005).

M.Sc. Thesis - E. O’Farrell; McMaster University – Neuroscience Graduate Program
17
Although Bmi1 is implicated in multiple cancer types, its pathway is not yet fully understood
(Schuringa & Vellenga, 2010). It is well known that Bmi1 binds to and represses p14 and p16
thus leading to decreased apoptosis and increased proliferation respectively, however, the
upstream regulators of Bmi1 have yet to be well defined. It has been demonstrated that the
oncogene SALL4 upregulates Bmi1 through direct binding to its promoter in AML (Schuringa &
Vellenga, 2010). Other genes which increase Bmi1 expression include sonic hedgehog (Shh) and
microRNA 128 (mir128) (Schuringa & Vellenga, 2010). Within the sonic hedgehog pathway,
sonic hedgehog binds to and inhibits Patched which releases inhibition on Smoothened allowing
it to enter the cell. There, it stimulates the Gli1 transcription factor to enter the nucleus and
increase transcription of Bmi1 leading to inhibition of the INK4A/ARF locus and increasing cell
proliferation and inhibiting apoptosis (Bruggeman et al., 2007; Valk-Lingbeek et al., 2004).
However, much work still remains to determine other Bmi1 regulatory mechanisms and
pathways which may influence cancer progression.
The current study aims to investigate the effect of Bmi1 knockdown on glioblastoma stem-like
cells. In vitro as well as in vivo analysis of Bmi1 knockdown will be performed in order to
determine the effect of Bmi1 on self-renewal and proliferation. We hypothesize that the loss of
Bmi1 will result in decreased self-renewal and proliferation in vitro and decreased glioblastoma
brain tumour formation in vivo.

M.Sc. Thesis - E. O’Farrell; McMaster University – Neuroscience Graduate Program
18
Chapter 2.
METHODS

M.Sc. Thesis - E. O’Farrell; McMaster University – Neuroscience Graduate Program
19
All work with live cells, including animal work, was carried out in Class II Biological Safety
hoods.
2.1 Tumour Dissociation, RBC Lysis, Cell Feeding
Primary brain tumour samples were obtained from consenting patients following Hamilton
Health Sciences/McMaster Health Sciences Research Ethics Board guidelines. Samples were
collected from both the Hamilton General Hospital and McMaster University Medical Centre.
Primary brain tumour samples were dissociated in artificial cerebrospinal fluid with 200µL
Liberase Blendzyme3 (0.2 Wünsch units/ml, Roche) and placed on an incubator shaker (VWR)
at 37oC for 15 minutes. The dissociated tissue was then filtered through a 70µm cell strainer
(BD) and the resulting solution was centrifuged at 290 g for 5 minutes. Supernatant was removed
and red blood cells were lysed using ammonium chloride solution (Stem Cell Technology)
previously warmed to 37oC. After 5 minutes of incubation at room temperature, the sample was
centrifuged at 290 g for 5 minutes. Supernatant was removed, and cells were washed once with
PBS (Hyclone). After PBS wash, the pelleted cells were resuspended and plated in an ultra-low
attachment plate (Corning) in serum-free neural stem cell media (Tumour Sphere Medium).
Complete neural stem cell media is composed of neural stem cell basal media (1% N2
supplement (Gibco), 0.2% 60µg/mL N-acetylcystine (Sigma), 2% neural survival factor-1
(Lonza), 1% HEPES (Wisent), and 6mg/mL glucose (Sigma) in 1:1 DMEM:F12 media (Gibco)),
supplemented with human recombinant EGF (20ng/ml; Sigma), bFGF (20ng/ml; Invitrogen),
LIF (10ng/ml; Chemicon), and antibiotic and antimycotic solution (Wisent). Cultures were
incubated at 37oC, 5% CO2 and fed every other day.

M.Sc. Thesis - E. O’Farrell; McMaster University – Neuroscience Graduate Program
20
2.2 Secondary Sphere Formation Assay
A single-cell suspension was prepared by dissociating tumour spheres with 5-10μL of Liberase
Blendzyme3 (0.2 Wünsch units/ml, Roche) in 1mL PBS for 5-10 minutes at 37°C. Cells were
counted using trypan blue exclusion dye (Invitrogen) with the Countess Automated Cell Counter
(Invitrogen). A solution of 2000 live cells/mL of neural stem cell media was used to prepare
dilutions ranging from 200 cells/100μL to 2 cells/100μL; for each dilution, four replicates of
100μL were plated in a 96-well ultra-low attachment plate (Corning). Cultures were left
undisturbed at 37°C for one week, after which the number of spheres per well were counted. The
secondary sphere formation rate was calculated from the number of spheres forming from 2000
dissociated cells to quantify stem cell frequency.
2.3 Sphere Size Assay
Sphere size from the secondary sphere formation assay was used as a measure of cellular
proliferation within cells (Tropepe et al., 1999). Spheres from wells of the secondary sphere
formation assay were imaged using an Olympus IX81 microscope at day 7 post-plating (Model:
IX-1LL100LH) and sphere diameter was measured using the callipers tool on the Metamorph
software. Five sphere diameter measurements were taken and average sphere size was
determined.
2.4 Proliferation Assay
A single-cell suspension was prepared as described previously. Cells were counted as described
previously and 500 live cells/well were plated under two distinct conditions: serum-free neural
stem cell media (Tumour Sphere Medium) and basal neural stem cell media with 10% FBS
(Hyclone) and antibiotics. Triplicates of each condition were plated in 5 plates (Day 0, Day 3,
Day 5, Day 7, and Day 10). On each respective day, plates were centrifuged at 290 g for 5

M.Sc. Thesis - E. O’Farrell; McMaster University – Neuroscience Graduate Program
21
minutes and media was removed from plates. The plates were then frozen at -80oC for a
minimum of 24 hours. Once all plates were frozen down, the cell proliferation assay was
performed using the CyQuant Cell Proliferation Kit (Invitrogen) and 400-fold diluted CyQuant
dye in 1x cell lysis buffer was added to each well and analysed using a FLUOstar Omega
fluorescence Microplate reader (BMG LABTECH) at λEx=485, λEm=525. The proliferation assay
measures cell proliferation through the use of CyQuant dye which binds to nucleic acids and
emits a fluorescent signal which can be detected to determine relative levels of nucleic acids.
2.5 Differentiation Assay and Cell Staining
For flow cytometric analyses of differentiation, cells from cultures were plated in a 6-well flat-
bottom plate (Falcon) in basal neural stem cell media with 20% FBS (Hyclone) and antibiotics.
After 7 days of differentiation, media was removed and wells were washed once with PBS.
Trypsin (0.05% in 0.53mM EDTA; Invitrogen) was added to each well and incubated at 37oC for
5 minutes. PBS was added and cells were collected. Cells were centrifuged at 290 g for 5
minutes and resuspended in fresh PBS. Cells were counted and aliquots of 100,000 cells/100µl
were placed into the appropriate number of flow tubes (BD Falcon) and centrifuged at 290 g for
5 minutes. Cells were resuspended in 100µL of PBS with 2mM EDTA (Sigma). Conjugated
antibodies for CD133 surface staining and isotype control were added in the appropriate
dilutions (Supplementary Table 1). After a 35 minute incubation on ice, cells were washed with
PBS and 200µL of fix-perm solution (BD) was added to each tube. After a 20 minute incubation
on ice, cells were washed with 1mL cytoperm buffer (BD) and resuspended in 100µL of
cytoperm buffer. Intracellular antibodies and the appropriate isotype controls for Bmi1, MAP2
(neuronal marker), and GFAP (glial cell marker) were then added to the cells in the correct

M.Sc. Thesis - E. O’Farrell; McMaster University – Neuroscience Graduate Program
22
concentrations (Supplementary Table 1). Cells were left to incubate with conjugated antibodies
for 45 minutes on ice. Cells were washed with 2mL of cytoperm buffer and resuspended in
250µL of PBS with 2mM EDTA. Stained cells were then analysed using the MoFlo XDP
(Beckman Coulter).
For immunofluorescence staining of differentiated cells, cells from culture were suspended as
single cells and plated on coverslips (Fisher Scientific) (25,000 live cells/coverslip), previously
coated in a 1:10 dilution of Matrigel (BD Biosciences) in a 24-well flat-bottom plate (Falcon), in
basal neural stem cell media with 20% FBS (Hyclone) and antibiotics. After 7 days of
differentiation, a 4% solution of PFA (Falcon) was added to each well and incubated at room
temperature for 10 minutes. The PFA solution was removed and the wells were washed gently
with PBS. A 0.1% Triton X solution (Sigma) was then added to each well as a permeabilisation
buffer for 15 minutes at room temperature. The permeabilisation buffer was removed and the
wells were washed with PBS twice. A 1.5% goat serum solution in PBS (Santa Cruz) was added
to each well as a blocking agent and left to incubate at room temperature for 1 hour. Antibodies
targeting internal antigens MAP2 and GFAP were then added using the appropriate dilutions
(Supplementary Table 1; conjugated MAP2, unconjugated primary GFAP). Plates were covered
with foil and left at 4oC overnight. The following morning, antibodies were removed and cells
were washed using wash buffer (BD Biosciences). Washing was done three times for 5 minutes
each time on an incubator shaker (VWR) which was gently rocking. Secondary antibodies were
added and after 30-45 minutes of incubation in the dark, cells were washed three times for 5
minutes each time on an incubator shaker with wash buffer (BD Bioscience). A Hoechst solution
(1:20,000) was added to each well and incubated in the dark for 10 minutes at room temperature
followed by a PBS wash. Coverslips were removed using forceps, rinsed with water, and

M.Sc. Thesis - E. O’Farrell; McMaster University – Neuroscience Graduate Program
23
mounted on slides using fluorescent mounting media (Dako). Slides were visualized using an
Olympus IX81 fluorescent light microscope (Model: IX-1LL100LH).
2.6 Flow Cytometry and Cell Sorting
Flow cytometry allows us to analyse huge numbers of individual cells as well as recover specific
populations of interest through sorting. The fluidics system of a cytometer is responsible for
aligning the cells in single file. This is achieved through the interaction of sheath fluid moving
through a flow cell at a faster velocity than an injected cellular suspension. This difference in
velocity creates pressure on the cellular suspension and forces it into a stream of single cells.
This process is termed hydrodynamic focusing (Rahman, 2009). After this focusing, the cells
may pass through one or more lasers beams and the scattered laser light and/or fluorescence of
each particle is collected by photomultiplier tube detectors. The laser light scattered in a forward
direction, or Forward Scatter, provides a relative measurement of cell size while scattered light
measured at a 90o angle reveals information about the granular content (Rahman, 2009). These
two parameters are frequently used together to visualise a sample’s distribution and allows
gating out of cellular debris and possible doublets. A series of optical filters separate the
fluorescence light emitted. Fluorescence signals may have a wide distribution of intensity and are
generally displayed on a log scale so that weak signals are expanded and strong signals are
compressed allowing both to be plotted graphically (Rahman, 2009). Once the gates are set, cells
can be analysed and displayed as single-parameter histograms of count versus fluorescence
intensity or two-parameter dot plots, in which each dot represents a single “event” or cell’s
distribution for the staining parameters. For cell sorting, the sheath stream is vibrated so that
droplets are formed. When the desired cell or particle reaches the position of the last attached

M.Sc. Thesis - E. O’Farrell; McMaster University – Neuroscience Graduate Program
24
droplet the fluid stream is electrostatically charged and the charged droplet is directed either left
or right by voltage plates into a collection tube (Rahman, 2009).
For flow cytometry, a single-cell suspension was prepared as described previously and single
cells were suspended in PBS with 2mM EDTA (Sigma). Cells were then stained according to
staining protocol described previously using conjugated antibodies (Supplementary Table 1). For
cell sorting based on GFP expression, a single-cell suspension was prepared and cells were
suspended in complete neural stem cell media for sorting. One hour after sorting, cells were
centrifuged at 244 g for 3 minutes and plated in 24-well ultra-low attachment plate (Corning) in
complete neural stem cell media.
2.7 Viral Knockdown
Lentiviral constructs CS-H1-Bmi1shRNA-EF-1 -EGFP expressing short hairpin RNA (shRNA)
which target Bmi1 1 (Target sequence: 5’-GAGAAGGAATGGTCCACTT-3’) and CS-HI Luc
shRNA-EF-1 –EGFP expressing the targeting sequence for Luciferase (as a negative control),
were a kind gift to the Singh lab from Professor Atsushi Iwama (Chiba et al., 2008).
Knockdown validation was carried out with three lentiviral constructs expressing shRNA
(Genecopoeia). Lentiviral constructs used included shBmi1 2 (Target location: 1015, Target
sequence: 5’-GACTGTGATGCACTTAAGA-3’), shBmi1 3 (Target location: 1091, Target
sequence: 5’-GAGGAGGAACCTTTAAAGG-3’), shBmi1 4 (Target location: 507, Target
sequence: 5’-TGCATCGAACAACGAGAAT-3’), and a scrambled control. Bmi1 DNA targets
can be found in Supplementary Figure 1.
2.7.1 Plasmid DNA Extraction
Plasmid DNA was received from Dr. Iwama (shBmi1 1, shLuc) and from Genecopoeia (shBmi1
2, shBmi1 3, shBmi1 4, shControl (scramble control)) on filter discs. For DNA extraction from

M.Sc. Thesis - E. O’Farrell; McMaster University – Neuroscience Graduate Program
25
the filter discs, 20µL of TE (10:1 Tris:EDTA, pH 8.0; Promega, Sigma) buffer was added to the
finely cut discs and incubated at room temperature for 20 to 30 minutes. The solution was then
vortexed and centrifuged at 580 g for 3 minutes. Supernatant containing plasmid DNA was then
removed and used for transformation. E.coli cells, DH5alpha, (Invitrogen SKU# 18265-017)
were used for transformation. 50µL aliquots of DH5alpha cells were placed in an ice-cold
eppendorf tubes (Fisher Scientific). For each sample, 5µL of extracted plasmid DNA was added
to the DH5alpha cells and mixed gently by tapping the eppendorf tube. The pUC 19 plasmid was
used as a positive control and water was used as a negative control. Cells were incubated on ice
for 30 minutes followed by a heat shock in a 42oC water bath for 20 seconds. Cells were then
placed back on ice for 2 minutes. Next, 950µL of warm super optimal broth with catabolite
repression (SOC) media was added to each eppendorf tube and incubated at 37oC on an
incubator shaker, set to 0.7 g, for one hour. Following incubation, 20-200µL of each transformed
E.coli cells were plated on LB agar plates containing 100µg/mL of ampicillin. The LB agar
plates were incubated at 37oC in an inverted position overnight. The following day, isolated
colonies were inoculated individually in 5 mL LB broth with ampicillin. After 8 hours of
incubation, each culture was transferred to 100 mL LB broth with ampicillin for MaxiPrep of
plasmid DNA. MaxiPrep was carried out using the Plasmid DNA MaxiPrep Kit (Norgen Biotek).
Lysate was prepared by centrifuging 100 mL of the bacterial culture containing the plasmid
DNA at 6000 g for 15 minutes. Supernatant was carefully removed and cells were resuspended
in 6 mL of Resuspension Buffer containing RNAse. The cellular suspension was incubated for
15 minutes at room temperature. Following incubation, 6 mL of lysis solution was added to the
suspension and gently mixed in by inverting the tube repeatedly until the solution turned clear
indicating that the cells had lysed. 6 mL of Neutralization Solution was immediately mixed in.

M.Sc. Thesis - E. O’Farrell; McMaster University – Neuroscience Graduate Program
26
The solution was centrifuged at 14,000 g for 10 minutes to pellet out the insoluble particles and
clarify the lysate. The supernatant containing the lysate was transferred to a filter column
assembly and centrifuged in a swinging bucket rotor centrifuge at 3000 g for 5 minutes to
remove any remaining particles. To the clarified lysate, 2 mL of Binding Solution was added and
mixed well. 200µL of Endotoxin Removal Solution was mixed in well and left to incubate at
room temperature for 5 minutes. Then, 2 mL of Isopropanol was added to the solution and mixed
in by vortexing. The lysate was then applied to the reservoir of the spin column assembly and
centrifuged in a swinging bucket rotor centrifuge at 3000 g for 5 minutes. The flowthrough was
discarded and the spin column was reassembled with the collection tube. To the column
assembly, 15 mL of Wash Solution was added and the assembly was centrifuged at 3000 g for 10
minutes. Then, 0.5 mL of Elution Buffer was added to the column and the unit was centrifuged at
3000 g for 5 minutes. The collection tube was discarded and a small amount of the Elution
Buffer was passed through the column. A fresh 50 mL Elution Tube was attached to the column
containing the resin bound DNA and 2 mL of Elution Buffer was added to the centre of the resin
bed. The column was centrifuged at 3000 g for 5 minutes. The DNA was quantified using
Nanodrop spectrophotometer and 260/280 ratio was noted for purity of the sample. Agarose gel
electrophoresis was performed to verify the DNA.
2.7.2 Production of Virus
Lentiviral constructs were generated using the HEK (Human Embryonic Kidney) 293 FT cell
line. HEK 293 FT cells were plated on seven 100mm tissue culture plates (BD Falcon) and
grown in DMEM high glucose media supplemented with Na pyruvate, NEAA, L-glutamate, 10%
FBS, and 1µL/mL Geneticin antibiotic (500µg/ml, Invitrogen). Cells were passaged twice before
beginning transfection. The DNA concentration (shBmi1 1-4, shLuc or scramble control) used

M.Sc. Thesis - E. O’Farrell; McMaster University – Neuroscience Graduate Program
27
for the constructs for each plate was 3µg. As well, each plate received 9µL of Virapower
Packaging Mix (Invitrogen) containing pLP1, pLP2, and pLP/VSVG packaging plasmids at
1µg/µl in TE buffer and 36µL of Lipofectamine 2000 (Invitrogen) suspended in 3mL of
optiMEM media (Invitrogen). One plate was used as a control plate and no DNA was added.
Plates were then topped up with 7mL of optiMEM media and placed in the BSL2+ lentivirus
incubator (37oC, 5% CO2). Cells were left with constructs overnight (24h) and the media was
removed and replaced with 10ml HEK media without antibiotics. 48-72 hours post-transfection,
the control plate was observed under fluorescence microscope to confirm no GFP present and
discarded. Supernatants were centrifuged at 1811 g for 15 minutes at 4oC to pellet out debris.
Supernatants were then transferred to new Falcon tubes and filtered through a Millex-HV
0.45um PVDF filter. The viral suspension was then centrifuged at 115,993 g and 4oC for 2 hours.
The supernatant was discarded and each pellet was resuspended in 1mL PBS. Each virus type
was then aliquoted into 10 cryovials (100µL/cryovial) and frozen at -80oC in a locked freezer.
2.7.3 Titration of Virus
Transduction of Daoy medulloblastoma cell line was performed in order to determine the
multiplicity of infection (MOI) for each virus. Daoy cells were plated in a regular 6-well tissue
culture plate such that there were 40 000 cells/well in ATCC MEM media. On day 2, the media
was changed on all wells and 10-2
dilutions (10µL) as well as 10-3
dilutions (1µL) of each virus
were used to determine the respective MOIs. Media was changed 24 hours later. On day 4, GFP
expression was analysed by flow cytometry on the MoFlo XDP (Beckman Coulter).
The MOI was calculated based on the 10-3
dilution as follows:
Lentiviral titer (# of Transduction Units/mL) = cell number (on day of transduction) x fraction of
transduced cells x dilution factor

M.Sc. Thesis - E. O’Farrell; McMaster University – Neuroscience Graduate Program
28
2.7.4 Transduction of Cells
Knockdown of cells was carried out using calculated titer for both shLuc and shBmi1.
Common MOI from literature is 1-10 TU/cell (Multiplicity of Infection) – An MOI of 5 was used
for knockdowns using shBmi1 1 and shLuc and an MOI of 2 was used for knockdowns using
shBmi1 2-4 and shControl.
Virus required for knockdown= (MOI x number of cells) ÷ lentiviral titer
Tumour spheres were dissociated with 10μL of Liberase Blendzyme3 (0.2 Wünsch units/ml,
Roche) in 1mL PBS for 10 minutes at 37°C, then plated in single cell suspension on ultra-low
attachment plate (Corning) in serum-free neural stem cell media (Tumour Sphere Medium).
Virus was added drop wise to the cells in the amount calculated using the MOI and the viral titer.
Cells were left to incubate overnight at 37oC, 5% CO2. The following day, the media was
changed and the cells were left for another 24 hours before being analysed for GFP expression
on the MoFlo XDP (Beckman Coulter). If GFP expression was greater than 80% in cells, the
population of cells was considered enriched for transduction and cells were used unsorted. If
GFP expression was less than 80%, cells were sorted for GFP positive cells in order to select for
an enriched population.
2.8 Real-Time Polymerase Chain Reaction
Real-Time Polymerase Chain Reaction was performed by Dr. Chitra Venugopal of the Singh lab.
Briefly, total RNA from samples was isolated using the Qiagen RNeasy Micro kit (Qiagen) and
reverse transcribed using Superscript III First Strand Synthesis kit (Invitrogen). Quantitative
PCR was performed using the Chroma4 (Bio-Rad) with iQSYBR Green qPCR kit (Quanta). Data
are presented as the ratio of the gene of interest to GAPDH (glyceraldehyde-3-phosphate
dehydrogenase) as control.

M.Sc. Thesis - E. O’Farrell; McMaster University – Neuroscience Graduate Program
29
2.9 Western Blot
Western blots were performed by Dr. Chitra Venugopal of the Singh lab. Briefly, denatured total
protein (20 mg) was separated using 10% sodium dodecyl sulphate-polyacrylamide gel
electrophoresis and transferred to polyvinylidene fluoride membrane. Western blots were probed
with monoclonal mouse-anti-human Bmi1antibody (Upstate) and anti-GAPDH antibody
(Abcam). The secondary antibody was horseradish peroxidase-conjugated goat anti-mouse IgG
(HþL) (Bio-Rad) in a dilution of 1:15 000. Bands were visualized using an Immobilon Western
kit (Millipore).
2.10 Intracranial Injection
A single-cell suspension was prepared by dissociating tumour spheres with 5-10μL of Liberase
Blendzyme3 (0.2 Wünsch units/ml, Roche) in 1mL PBS for 5-10mins at 37°C. Cells were
counted using trypan blue exclusion dye (Invitrogen) with the Countess Automated Cell Counter
(Invitrogen). The desired cell number was then aliquoted into eppendorf tubes (Fisher Scientific)
and centrifuged at 10,621 g for 3 minutes. The supernatant was removed and cells were
resuspended in 10µl PBS. Cells were put on ice and brought to the McMaster Stem Cell Unit
(SCU) for intracranial injection.
NOD/SCID gamma (NSG) immunocompromised mice (NOD.Cg-Prkdcscid
Il2rgtm1Wjl
/SzJ) aged
4-8 weeks were weighed and either anaesthetized with the appropriate dosage of tribromoethanol
(Avertin: 0.018ml/g; Sigma) via intraperitoneal injection or anaesthetized using gas anaesthesia
(Isoflurane: 2.5%; Pharmaceutical Partners of Canada). Once unresponsive, mice were
positioned in stereotaxic frame (Stoelting) and the top of the head was swabbed with iodine. A
1.5 cm vertical midline incision was made using a 15-blade knife down to the periosteum. The
knife blade was then used to clear the periosteum. Using a drill held perpendicular to the skull, a

M.Sc. Thesis - E. O’Farrell; McMaster University – Neuroscience Graduate Program
30
small burr hole was created at the point of injection (2-3 mm anterior to coronal suture, 3 mm
lateral to midline). A Hamilton syringe was used to inject 10µl of cell suspension into the frontal
lobe. The syringe was inserted through the burr hole at a 30 degree angle to a 5 mm depth. Once
cells were injected, the injection site was cleared using a gauze square and gentle pressure was
applied to prevent bleeding. The incision was closed using 5.0 dexon (Ethicon) interrupted
stitches and sutures were sealed with Vetbond tissue adhesive (3M). Mice were then injected
subcutaneously with 0.5 mL temgesic (Buprenorphine: 0.3 mg/mL; Schering-Plough) and 1 mL
saline. Mice were identified using ear notches and placed in recovery cages in front of heat
lamps until awake. The following morning, mice were given 0.5 mL temgesic (Buprenorphine:
0.3 mg/mL; Schering-Plough) subcutaneously. Mice were monitored weekly for signs of illness.
2.11 Animal Collection, Sectioning and Staining
Mice were monitored for signs of illness (weight loss, lethargy, ruffled appearance, gray skin
tone, withdrawal from cage mates, etc) and when endpoint appeared imminent, mice were
euthanized and brains were collected via perfusion. The mouse was anaesthetized with the
appropriate dosage of tribromoethanol (Avertin: 0.020ml/g; Sigma) via intraperitoneal injection.
Once unresponsive, the mouse was taped down on an absorbent pad with the thorax and
abdomen exposed. The torso was sprayed with ethanol and the fur was cut away. The abdomen
and thorax were then opened by holding the skin upwards and away from the organs while
cutting. The diaphragm was very carefully cut, exposing the heart. An 18-gauge needle attached
to a gravity feedbag of saline was inserted through the apex of the heart and into the left
ventricle. The tubing valve was opened to allow saline to flow into the heart. The posterior vena
cava was immediately cut to allow blood to escape. The saline was flushed through the system
until the exit fluid was clear, approximately 8 minutes. The saline valve was closed and the

M.Sc. Thesis - E. O’Farrell; McMaster University – Neuroscience Graduate Program
31
needle was switched over to a 30 mL syringe containing 10% formalin. The 10% formalin
solution was slowly injected into the heart and circulated throughout the body. Once perfused,
the head was cut from the body and the brain was carefully removed. First, all skin was cut away
and the skull was carefully peeled away using tissue forceps (Magna). The isolated brain was
then suspended in 10% Formalin for a minimum of 48 hours before sectioning.
After 48 hours, brains were placed in the sectioning frame and the first blade was inserted into
the first slit at the posterior end of the brain. A second blade was then placed in the third slit and
the first blade was removed. The first section of tissue was disposed of and the blade was then
placed in the fifth slit, the blade from the third slit was then removed and the section of tissue
was placed in a tissue cassette. Sectioning continued in this manner, with sections being cut
every 2 slits until the brain was completely sectioned and the 6 sections were in the tissue
cassette. The cassette was then placed in 70% ethanol and sent to histology for paraffin wax
embedding and H&E staining.
2.12 Statistical Analysis
Unless otherwise stated, all comparisons were performed using unpaired, two-tailed student t-
tests or ANOVA tests with Bonferroni Post-Hoc tests. Statistical significance was set at 0.05.
2.13 Sample numbers
Sample numbers (n) represent technical or experimental replicates unless otherwise stated.

M.Sc. Thesis - E. O’Farrell; McMaster University – Neuroscience Graduate Program
32
Chapter 3.
RESULTS

M.Sc. Thesis - E. O’Farrell; McMaster University – Neuroscience Graduate Program
33
3.1 BT 241 Characterization
Brain tumour sample number 241 (BT 241) was received on April 26, 2010 from a female
patient aged 68. Final pathology indicated that the tumour sample was a Glioblastoma which was
post therapy and had radiation effects and atypia (recurrent/residual). Immunohistochemistry
performed by the pathologist showed areas of GFAP positivity, high Ki-67 proliferation (40-
50%) and strong diffuse nuclear positivity of p53. In culture, BT 241 was highly proliferative
and as a result developed into a spontaneous “cell line” which has remained stable after multiple
passages and has been frozen down and revived successfully (Figure 1). BT 241 was the primary
sample used for all in vitro and in vivo work. Stem cell assays were performed on BT 241 in
order to characterize the “cell line” for our use.
Figure 1. BT 241 culture

M.Sc. Thesis - E. O’Farrell; McMaster University – Neuroscience Graduate Program
34
3.1.1 Flow Analysis and Differentiation
Flow cytometry analysis was conducted on BT 241 (n=3) to analyse levels of Bmi1, neural stem
cell marker CD133 ( Singh et al., 2003; Singh et al.,2004a; Tabatabai & Weller, 2011; Uchida et
al., 2000), neuronal marker MAP2, and astrocyte marker GFAP under both neural stem cell
culture conditions as well as differentiation culture conditions. Representative flow plots can be
found in Supplementary Figure 2.
Figure 2. Expression levels (measured as percentage of positive cells) of Bmi1, CD133,
MAP2, and GFAP for BT 241 under neural stem cell culture conditions and differentiation
conditions. Under differentiation conditions, BT 241 showed significantly less Bmi1 expression
than neural stem cell conditions. No differences were seen for CD133, MAP2, or GFAP levels.
Data represented as mean ± SD (n=3).
The results indicated that under differentiation conditions, Bmi1 levels were significantly less
than levels seen under neural stem cell culture conditions (p<0.05, Figure 2). No significant
M.Sc. Thesis - E. O’Farrell; McMaster University – Neuroscience Graduate Program
35
differences were found for CD133, MAP2, or GFAP expression levels under either condition
(Figure 2). MAP2, a marker of mature neurons, expression was 42.72% and 42.07% for NSC and
differentiation conditions, respectively. GFAP, a marker of mature astrocytes, expression was
0.12% 1.33% for NSC and differentiation conditions, respectively. MAP2 expression was much
greater than GFAP expression under both conditions indicating that BT 241 is more neuronal in
phenotype (Figure 2).
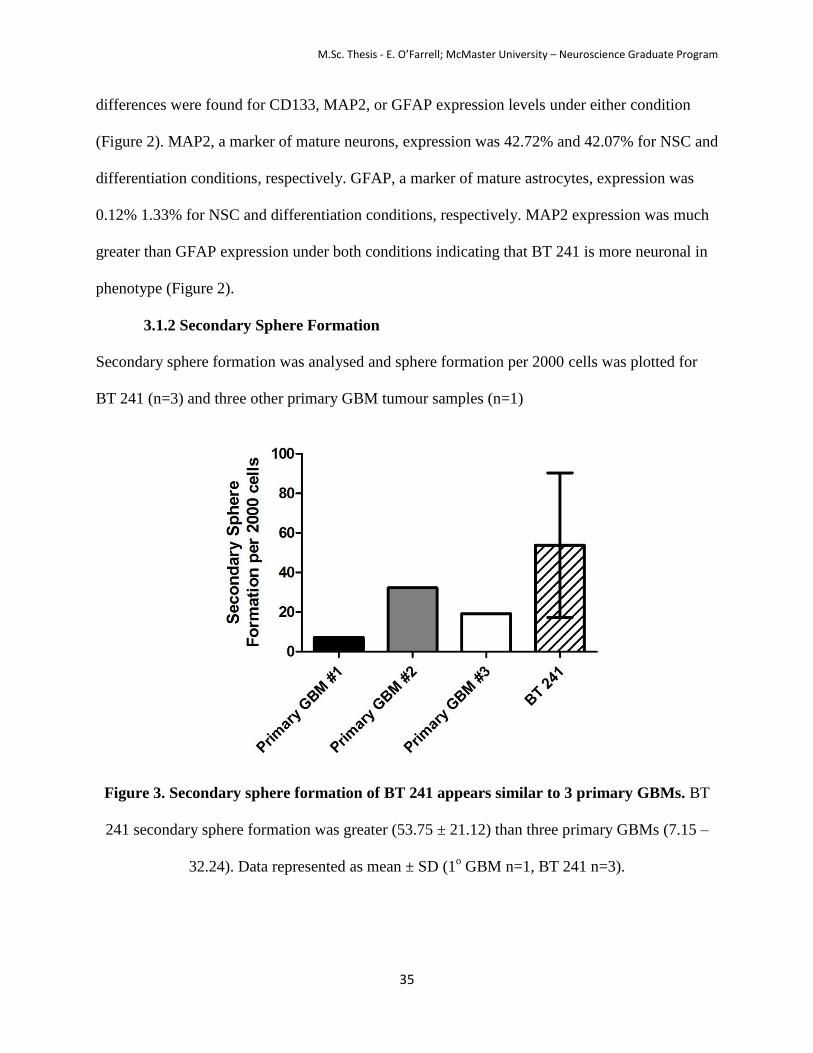
3.1.2 Secondary Sphere Formation
Secondary sphere formation was analysed and sphere formation per 2000 cells was plotted for
BT 241 (n=3) and three other primary GBM tumour samples (n=1)
Figure 3. Secondary sphere formation of BT 241 appears similar to 3 primary GBMs. BT
241 secondary sphere formation was greater (53.75 ± 21.12) than three primary GBMs (7.15 –
32.24). Data represented as mean ± SD (1o GBM n=1, BT 241 n=3).

M.Sc. Thesis - E. O’Farrell; McMaster University – Neuroscience Graduate Program
36
Figure 4. BT 241 sphere. Average sphere size was 119.67 µm.
BT 241 sphere formation was 53.75 ± 21.12 (n=3) while the sphere formation for three other
primary GBMs ranged from 7.15 to 32.24 (n=1). BT 241 spheres were measured as a
representation of proliferation. The average sphere size for BT 241 was 119.67 µm in diameter
(Figure 4).
3.1.3 Proliferation
BT 241 cells (500 cells/well) were plated for proliferation assays (n=3). Proliferation of cells was
analysed at days 0, 3, 5, 7, and 10. Proliferation was assessed under neural stem cell conditions,
in complete neural stem cell media and under serum conditions, in basal media with 10% FBS
(Figure 5).

M.Sc. Thesis - E. O’Farrell; McMaster University – Neuroscience Graduate Program
37
Figure 5. Proliferation of BT 241 cells (500 cells/well). BT 241 cells plates for proliferation
analysis showed increased proliferation from Day 0 to Day 10. No difference was found between
neural stem cell conditions and 10% FBS conditions. Data represented as mean ± SD (n=3).
The proliferation assay measures cell proliferation through the use of CyQuant dye which binds
to nucleic acids and emits a fluorescent signal which can be detected to determine relative levels
of nucleic acids. Proliferation of BT 241 cells appeared to increase over time in both NSC and
serum conditions (Figure 5). Proliferation did not differ significantly between culture conditions
(p>0.05, Figure 5).
3.2 BT 241 Knockdown with shLuc and shBmi1 1
BT 241 tumour spheres were transduced with shLuc and shBmi1 1 lentiviral vectors. Following
the validation of transduction using flow cytometric analysis of GFP expression (Figure 6), in

M.Sc. Thesis - E. O’Farrell; McMaster University – Neuroscience Graduate Program
38
vitro experiments were performed on unsorted, enriched cells to maintain high cell number and
viability.
Figure 6. GFP expression of A: BT 241 shLuc cells, B: BT 241 shBmi1 cells
3.2.1 Knockdown Validation
Lentiviral constructs shLuc and shBmi1 1 were previously validated by the Singh lab in various
cell lines such as U2OS (Human Osteosarcoma) and Daoy (Human Medulloblastoma). Bmi1
knockdown in BT 241 was confirmed through RT-PCR which demonstrated significant
reductions in Bmi1 mRNA in transduced cells (Figure 7). Western blot analysis of BT 241 shLuc
and shBmi1 1 cells further confirmed significant Bmi1 knockdown at the protein level (Figure
8). U20S lysate was used as a positive control.

M.Sc. Thesis - E. O’Farrell; McMaster University – Neuroscience Graduate Program
39
Figure 7. Bmi1 mRNA levels were significantly decreased in cells transduced with shBmi1 1
as compared to cells transduced with shLuc. Data represented as mean ± SD (n=3).
Figure 8. Bmi1 protein levels were decreased in cells transduction with shBmi1 1 as
compared to cells transduced with shLuc.

M.Sc. Thesis - E. O’Farrell; McMaster University – Neuroscience Graduate Program
40
3.2.2 Flow Analysis
Flow cytometric analysis of BT 241 knockdown using shLuc (n=1) and shBmi1 1 (n=1) was
conducted to evaluate the expression levels of Bmi1 and neural stem cell markers CD133 and
CD15. Representative flow plots can be found in Supplementary Figure 3.
Figure 9. Expression levels (measured as percentage of positive cells) of Bmi1, CD133, and
CD15 for BT 241 shLuc and shBmi1 1. BT 241 shBmi1 cells showed less Bmi1 expression
than shLuc cells. CD133 levels appeared decreased in shLuc cells as compared to shBmi1 cells.
CD15 levels appeared similar in both groups. Data represented as mean (n=1).
The flow analysis of BT 241 knockdown cells indicated a decrease in Bmi1 in shBmi1 1 cells as
compared to shLuc cells (Figure 9). An increase in CD133 population within shBmi1 1 cells was
also observed while the CD15 populations in both shLuc and shBmi1 1 appeared very similar

M.Sc. Thesis - E. O’Farrell; McMaster University – Neuroscience Graduate Program
41
(Figure 9). These observed differences were not statistically analysed as this experiment was
only performed once.
3.2.3 Secondary Sphere Formation
Secondary sphere formation of BT 241 cells transduced with shLuc and shBmi1 1 was analysed
(n=3) and sphere formation per 2000 cells was plotted (Figure 10). Average sphere size was also
determined from day 7 spheres and analysed as a measure of proliferation (Figure 11).
Figure 10. BT 241 shBmi1 1 cells exhibited decreased self-renewal compared to shLuc cells.
BT 241 shBmi1 cells showed decreased sphere formation per 2000 cells (32 ± 7.051) than shLuc
cells (146.9 ± 16.53). Data represented as mean ± SD (n=3).

M.Sc. Thesis - E. O’Farrell; McMaster University – Neuroscience Graduate Program
42
Figure 11. Sphere size (µm) was decreased in BT 241 shBmi1 1 spheres compared to shLuc
spheres. (A) BT 241 shLuc spheres were larger (90.84 µm) than (B) shBmi1 spheres (60.68 µm)
and this difference was statistically significant (C). Data represented as mean ± SD (n=3).
Secondary sphere formation analysis revealed that Bmi1 knockdown significantly decreased self-
renewal capacity of BT 241 cells (p=0.0004; Figure 10). The shBmi1 1 spheres were smaller
(60.68µm) than shLuc spheres (90.84µm) throughout the secondary sphere formation assays and
this difference was found to be statistically significant (p=0.0058; Figure 11).
3.2.4 Proliferation
BT 241 shLuc and shBmi1 1 cells (500 cells/well) were plated for proliferation assay (n=3).
Proliferation of cells was analysed at days 0, 3, 5, 7 and 10. Proliferation was assessed under
serum conditions, in basal media with 10% FBS (Figure 12).

M.Sc. Thesis - E. O’Farrell; McMaster University – Neuroscience Graduate Program
43
Figure 12. BT 241 shBmi1 1 cells exhibited decreased proliferation under serum conditions
compared to shLuc cells (500 cells/well). BT 241 shLuc cells plated for proliferation analysis
showed increased proliferation from Day 0 to Day 10. No increase in proliferation was seen in
shBmi1 1 cells from Day 0 to Day 10. Data represented as mean ± SD (n=3).
Proliferation of Bmi1 knockdown cells was significantly decreased as compared to control cells
at Day 3, Day 5, Day 7, and Day 10 (p<0.001, Figure 12). While proliferation of shLuc cells
increased over time, proliferation of Bmi1 knockdown cells appeared relatively equal at all time
points (Figure 12).
3.2.5 Differentiation
BT 241 shLuc and shBmi1 1 cells were plated in single cell suspension in basal neural stem cell
media with 20% FBS and antibiotics for differentiation (n=1). After 7 days of differentiation,

M.Sc. Thesis - E. O’Farrell; McMaster University – Neuroscience Graduate Program
44
cells were analysed qualitatively by immunofluorescence staining using the conjugated antibody
for MAP2 and the unconjugated antibody for GFAP and quantitatively by flow cytometry using
the conjugated antibody for MAP2 and the conjugated antibody for GFAP (Supplementary Table
1).
Figure 13. Neuronal differentiation of A: BT 241 shLuc cells and B: BT 241 shBmi1 1 cells
stained with anti-MAP2
Figure 14. Glial differentiation of A: BT 241 shLuc cells and B: BT 241 shBmi1 1 cells
stained with anti-GFAP

M.Sc. Thesis - E. O’Farrell; McMaster University – Neuroscience Graduate Program
45
Immunofluorescence staining of BT 241 shLuc and shBmi1 1 cells was inconclusive as GFAP
staining appeared to mark all cells, even cells which had a bipolar neuronal morphology (Figure
14). As a result, immunofluorescence staining was not used as a quantitative measure of
differentiation and cells were analysed by flow cytometry for differentiation markers (Figure 15)
using antibodies validated for flow cytometric analysis (Supplementary Table 1).
Figure 15. Differentiation marker expression levels (measured as percentage of positive
cells) for BT 241 shLuc cells and shBmi1 1 cells. BT 241 shBmi1 cells showed increased
neuronal differentiation and decreased glial differentiation compared to shLuc cells. Data
represented as mean ± SD (n=1).
Flow analysis of differentiated BT 241 shLuc cells and shBmi1 1 cells (n=1) indicated greater
neuronal differentiation, marked by MAP2 staining, than glial differentiation, marked by GFAP
staining (Figure 15). Neuronal differentiation appeared greater in shBmi1 1 cells than shLuc cells
while glial differentiation appeared greater in shLuc cells than shBmi1 1 cells (Figure 15). These

M.Sc. Thesis - E. O’Farrell; McMaster University – Neuroscience Graduate Program
46
observed differences were not statistically analysed as this experiment was only performed once.
Representative flow plots can be found in Supplementary Figure 4.
3.3 U-118 MG Knockdown with shLuc and shBmi1 1
The commercial GBM cell line U-118 MG (ATCC, cat. # HTB-15) was used to assess Bmi1
knockdown using shLuc and shBmi1 1 lentiviral vectors. Following the validation of Bmi1
knockdown and validation of an enriched population of GFP positive cells, in vitro experiments
were performed on unsorted cells to maintain high cell number and viability.
3.3.1 Knockdown Validation
Lentiviral constructs shLuc and shBmi1 1 were validated by the Singh lab and Bmi1 knockdown
was confirmed through RT-PCR which demonstrated significant reductions in Bmi1 mRNA in
transduced cells (Figure 16). Untransduced U-118 MG cell mRNA was analysed to confirm that
the shLuc control was a proper control (Figure 16).

M.Sc. Thesis - E. O’Farrell; McMaster University – Neuroscience Graduate Program
47
Figure 16. Bmi1 mRNA levels were significantly decreased in U-118 MG shBmi1 1 cells
compared to untransduced and shLuc cells. Data represented as mean ± SD (n=4).
3.3.2 Secondary Sphere Formation
Secondary sphere formation of U-118 MG transduced with shLuc and shBmi1 1 was analysed
(n=3) and sphere formation per 2000 cells was plotted (Figure 17). Average sphere size was also
determined from day 7 spheres and analysed as a measure of proliferation (Figure 18).

M.Sc. Thesis - E. O’Farrell; McMaster University – Neuroscience Graduate Program
48
Figure 17. U-118 MG shBmi1 1 cells exhibited decreased self-renewal compared to shLuc
cells. U-118 MG shBmi1 cells showed decreased sphere formation per 2000 cells (15.05 ±
9.422) than shLuc cells (58.99 ± 5.625). Data represented as mean ± SD (n=3).
Figure 18. Sphere size (µm) was decreased in U-118 MG shBmi1 1 spheres compared to
shLuc spheres. (A) U-118 MG shLuc spheres were larger (69.65 µm) than (B) shBmi1 spheres
(52.13 µm) and this difference was statistically significant (C). Data represented as mean ± SD
(n=3).

M.Sc. Thesis - E. O’Farrell; McMaster University – Neuroscience Graduate Program
49
Secondary sphere formation analysis revealed that Bmi1 knockdown significantly decreased self-
renewal capacity of U-118 MG cells (p=0.0023; Figure 17). The shBmi1 1 spheres were smaller
(52.13µm) than shLuc spheres (69.65µm) throughout the secondary sphere formation assays and
this difference was found to be statistically significant (p=0.0016; Figure 18).
3.3.3 Proliferation
U-118 MG shLuc and shBmi1 1 cells (500 cells/well) were plated for proliferation assay (n=3).
Proliferation of cells was analysed at days 0, 3, 5, 7 and 10. Proliferation was assessed under
serum conditions, in basal media with 10% FBS (Figure 19).
Figure 19. U-118 MG shBmi1 1 cells exhibited decreased proliferation under serum
conditions compared to shLuc cells (500 cells/well). U-118 MG shLuc cells plated for
proliferation analysis showed increased proliferation from Day 0 to Day 10. No increase in
proliferation was seen in shBmi1 1 cells from Day 0 to Day 10. Data represented as mean ± SD
(n=3).

M.Sc. Thesis - E. O’Farrell; McMaster University – Neuroscience Graduate Program
50
Proliferation of Bmi1 knockdown cells was significantly decreased as compared to control cells
at days 3, 5, 7, and 10 (p<0.001, Figure 19). While proliferation of shLuc cells increased over
time, proliferation of Bmi1 knockdown cells appeared to remain similar at all time points (Figure
19).
3.3.4 Differentiation
U-118 MG shLuc and shBmi1 1 cells were plated in single cell suspension in basal neural stem
cell media with 20% FBS and antibiotics for differentiation (n=1). After 7 days of differentiation,
cells were analysed qualitatively by immunofluorescence staining using the conjugated antibody
for MAP2 and the unconjugated antibody for GFAP and quantitatively by flow cytometry using
the conjugated antibody for MAP2 and the conjugated antibody for GFAP (Supplementary Table
1).
Figure 20. Neuronal differentiation of A: U-118 MG shLuc cells and B: U-118 MG shBmi1
1 cells stained with anti-MAP2

M.Sc. Thesis - E. O’Farrell; McMaster University – Neuroscience Graduate Program
51
Figure 21. Glial differentiation of A: U-118 MG shLuc cells and B: U-118 MG shBmi1 1
cells stained with anti-GFAP
Immunofluorescence staining of U-118 MG shLuc and shBmi1 1 cells was inconclusive as
MAP2 staining did not integrate into cells and GFAP staining appeared to mark all cells, even
cells which had a bipolar, neuronal morphology (Figure 20 & 21).This may have been a result of
unhealthy cells which appeared to be without normal cellular processes (Figure 20 & 21). As a
result, immunofluorescence staining was not used as a quantitative measure of differentiation
and cells were analysed by flow cytometry for differentiation markers (Figure 22) using
antibodies validated for flow cytometric analysis (Supplementary Table 1).

M.Sc. Thesis - E. O’Farrell; McMaster University – Neuroscience Graduate Program
52
Figure 22. Differentiation marker expression levels (measured as percentage of positive
cells) for U-118 MG shLuc cells and shBmi1 1 cells. U-118 MG shBmi1 cells showed
increased neuronal and glial differentiation compared to shLuc cells. Data represented as mean ±
SD (n=1).
Flow analysis of differentiated U-118 MG shLuc cells and shBmi1 1 cells (n=1) indicated greater
glial differentiation marked by GFAP staining than neuronal differentiation marked by MAP2
staining (Figure 22). Both neuronal and glial differentiation appeared greater in shBmi1 1 cells
than shLuc cells (Figure 22). These observed differences were not statistically analysed as this
experiment was only performed once. Representative flow plots can be found in Supplementary
Figure 5.

M.Sc. Thesis - E. O’Farrell; McMaster University – Neuroscience Graduate Program
53
3.4 BT 241 Knockdown with shControl, shBmi1 2, shBmi1 3, and shBmi1 4
To validate Bmi1 knockdown using short-hairpin RNA, three lentiviral constructs expressing
shRNA against Bmi1 (Genecopoeia) were used on BT 241. In vitro experiments using
lentiviruses shBmi1 2-4 and a scrambled control (shControl) were conducted using unsorted BT
241 transduced cells to maintain high cell number and viability. GFP expression for each
construct was analysed by flow cytometry and each population showed greater than 80% GFP
positivity indicating enrichment for Bmi1 knockdown or scrambled control (Supplementary
Figure 6).
3.4.1 Knockdown Validation
Knockdown was validated using the U-118 MG GBM cell line (ATCC, cat. # HTB-15). Bmi1
knockdown was not found to be efficient using any shBmi1 constructs in comparison to the
scrambled control (Figure 23 & 24). To confirm the use of the scrambled control, we compared
mRNA levels against our previously validated shLuc control mRNA (Figure 23). Protein levels
were compared to untransduced U-118 MG cells (Figures 24). Against our validated shLuc
control and untransduced cells, all shBmi1 constructs as well as the scrambled control
(shControl) showed significantly decreased Bmi1 levels (p<0.001, Figure 23; no statistical
analysis, Figure 24). From these observations, we doubted the validity of the scrambled control.
Out of interest, all subsequent results were compared to previously acquired BT 241 shLuc data.

M.Sc. Thesis - E. O’Farrell; McMaster University – Neuroscience Graduate Program
54
Figure 23. Bmi1 mRNA levels were significantly decreased in shControl, shBmi1 2, shBmi1
3, and shBmi1 4 compared to shLuc cells. Data represented as mean ± SD (n=2).
Figure 24. Bmi1 protein levels appeared decreased in shControl, shBmi1 2, shBmi1 3, and
shBmi1 4 compared to untransduced cells. Data represented as mean ± SD (n=1).

M.Sc. Thesis - E. O’Farrell; McMaster University – Neuroscience Graduate Program
55
3.4.2 Secondary Sphere Formation
Secondary sphere formation assays were performed on BT 241 transduced with shControl,
shBmi1 2, shBmi1 3, and shBmi1 4 (n=3) and compared to previously acquired BT 241 shLuc
secondary sphere formation data (n=2). Spheres were measured at day 7 for each population of
cells (shControl, shBmi1 2, shBmi1 3, shBmi1 4) (n=3) and the average sphere size was
determined for each population.
Figure 25. BT 241 shControl, shBmi1 2, shBmi1 3, shBmi1 4 cells exhibited decreased self-
renewal compared to shLuc cells. BT 241 shControl, shBmi1 2, shBmi1 3, and shBmi1 4 cells
showed decreased sphere formation per 2000 cells (72.49 – 125.5) than shLuc cells (281.3). Data
represented as mean ± SD (shLuc n=2; shControl, shBmi1 2-4 n=3).

M.Sc. Thesis - E. O’Farrell; McMaster University – Neuroscience Graduate Program
56
Secondary sphere formation assays indicated an extremely significant effect of Bmi1 knockdown
on secondary sphere formation for lentiviral constructs 2, 3 and 4 (p<0.0001, Figure 25) when
compared to shLuc.
Figure 26. No differences in sphere size were seen between shControl and shBmi1 cells A:
BT 241 shControl sphere, B: BT 241 shBmi1 2 sphere, C: BT 241 shBmi1 3 sphere, D: BT 241
shBmi1 4 sphere, E: Average Sphere Size for BT 241 shControl and shBmi1 2, shBmi1 3,
shBmi1 4. Data represented as mean ± SD (n=3).
Sphere size between each population was not found to be significantly different between
shControl and any of the Bmi1 knockdown groups (p>0.05, Figure 26) with all spheres ranging
from 122 µm to 153 µm (Figure 26).

M.Sc. Thesis - E. O’Farrell; McMaster University – Neuroscience Graduate Program
57
3.4.3 Proliferation
BT 241 cells transduced with shControl, shBmi1 2, shBmi1 3, and shBmi1 4 were plated for
proliferation assays (n=3). Proliferation of cells was analysed at days 0, 3, 5, 7, and 10.
Proliferation was assessed under neural stem cell conditions, in complete neural stem cell media
(Figure 27), and under serum conditions, in basal media with 10% FBS (Figure 28).
Figure 27. Proliferation of BT 241 shControl, shBmi1 2, shBmi1 3, and shBmi1 4 under
neural stem cell conditions. BT 241 shControl and shBmi1 cells plated for proliferation
analysis showed increased proliferation from Day 0 to Day 10. No significant change was found
between shControl cells and shBmi1 cells. Data represented as mean ± SD (n=3).

M.Sc. Thesis - E. O’Farrell; McMaster University – Neuroscience Graduate Program
58
Figure 28. Proliferation of BT 241 shControl, shBmi1 2, shBmi1 3, and shBmi1 4 under
serum conditions. BT 241 shControl and shBmi1 cells plated for proliferation analysis showed
increased proliferation from Day 0 to Day 10. No significant change was found between
shControl cells and shBmi1 cells. Data represented as mean ± SD (n=3).
Proliferation of cells increased from Day 0 to Day 10 for both neural stem cell conditions and
serum conditions. Both conditions showed similar proliferation profiles with no significant
differences found (Figures 27 & 28).
3.4.4 Differentiation
BT 241 shBmi1 2-4 and shControl cells (n=1) were placed under differentiation conditions for
10 days (Figure 29) and evaluated by flow cytometry. Expression levels of differentiation
markers obtained were compared to previously acquired BT 241 shLuc differentiation data
(Figure 30). Representative flow plots can be found in Supplementary Figures 4 & 7.

M.Sc. Thesis - E. O’Farrell; McMaster University – Neuroscience Graduate Program
59
Figure 29. Differentiation of BT 241 cells transduced with A: shControl, B: shBmi1 2, C:
shBmi1 3, D: shBmi1 4

M.Sc. Thesis - E. O’Farrell; McMaster University – Neuroscience Graduate Program
60
Figure 30. Differentiation marker expression levels (measured as percentage of positive
cells) for BT 241 cells transduced with shLuc, shControl, shBmi1 2, shBmi1 3, and shBmi1
4. Neuronal (MAP2) differentiation appeared decreased in shLuc cells compared to shControl,
shBmi1 2-4 cells. Glial (GFAP) differentiation appeared similar in all groups. Data represented
as mean ± SD (n=1).
When analysed by flow cytometry, levels of the neuronal marker MAP2 were extremely high
(70.59%-73.88%) for cells transduced with shControl and shBmi1 2-4 while levels of astrocyte
marker GFAP were fairly low in all transduced cells (15.21%-18.5%) indicating a tendency
towards the neuronal lineage (Figure 30). Interestingly, BT 241 shLuc cells expressed decreased
MAP2 expression (25.33%) indicating less neuronal differentiation (Figure 30).

M.Sc. Thesis - E. O’Farrell; McMaster University – Neuroscience Graduate Program
61
3.5 In vivo injection of BT 241 shLuc and shBmi1 1 cells
BT 241 was transduced with GFP expressing shLuc or shBmi1 1 lentiviral vectors as described
in the Methods section. The enriched transduced cells or GFP positive cells which were sorted
using the MoFlo XDP (Beckman Coulter) were used for in vivo injections in NSG mice as shown
in Table 1. Once animals reached endpoint, they were collected and brains were sent to Dr.
Kwiecien of McMaster University for pathological analysis. Table 1 describes all in vivo
injections performed and the resulting pathology results.
Table 1. Intracranial injections of BT 241 cells transduced with shLuc and shBmi1 1
Number of Cells
Injected
Number of Mice
Injected for each
Treatment
Number of shLuc
Tumours
Number of shBmi1
Tumours
100 2 0 0
1000 2 1 0
5000 1 1 0
10,000 2 2 1
50,000 1 1 1
100 sorted cells 1 1 0
23,000 sorted cells 1 0 1

M.Sc. Thesis - E. O’Farrell; McMaster University – Neuroscience Graduate Program
62
Figure 31. Tumour formation is absent in NSG mice injected with 100 sorted BT 241
shBmi1 1 cells as compared to control cells. A: shLuc cells formed large, infiltrating masses
(H&E stain), as seen in the prefrontal cortex (2X), B: shBmi1 cells formed no apparent tumours,
C: shLuc tumours seen in the prefrontal cortex (10X) were accompanied by edema and
haemorrhages, D: shLuc tumour showing haemorrhagic tissue (40X).

M.Sc. Thesis - E. O’Farrell; McMaster University – Neuroscience Graduate Program
63
Figure 32. Tumour size appears decreased in NSG mice injected with BT 241 shBmi1 1
cells compared to control cells. A: 10,000 BT 241 shLuc cells formed large, infiltrating masses,
as seen in the midbrain (2X), B: 10,000 BT 241 shBmi1 1 cells formed smaller, but still
substantial, masses with moderate infiltration, as seen in the prefrontal cortex (2X), C: 50,000
BT 241 shLuc cells formed large, infiltrating masses as seen in striatum (2X), D: 50,000 BT 241
shBmi1 1 cells formed smaller masses with mild to moderate infiltration, as seen in the fourth
ventricle and medulla (4X).

M.Sc. Thesis - E. O’Farrell; McMaster University – Neuroscience Graduate Program
64
Table 2. Relative tumour size of BT 241 cells transduced with shLuc and shBmi1 1
Number of Cells
Injected
shLuc tumour size
(mm2)
shBmi1 1 tumour size
(mm2)
10,000 18.03 (n=2) 5.3325 (n=2)
50,000 5.621 (n=1) 0.2679 (n=1)
Figure 33. Tumour size (measured as surface area in mm2) appeared smaller in BT 241
shBmi1 1 cells compared to control cells. At both 10,000 and 50,000 cells, tumours formed
from shBmi1 1 cells had smaller surface areas than tumours formed from shLuc cells. Data
represented as mean ± SD (10,000 cells n=2; 50,000 cells n=1).
Tumour formation was found in one NSG mouse injected with as low as 100 sorted BT 241
shLuc cells while no tumour formation was found in the corresponding NSG mouse injected with
100 sorted BT 241 shBmi1 cells (Figure 31). The appearance of tumours increased as cell
number increased (Table 1). Although tumours were found in some mice injected with 10,000
and 50,000 BT 241 shBmi1 1 cells, it was observed that tumours formed from shBmi1 1

M.Sc. Thesis - E. O’Farrell; McMaster University – Neuroscience Graduate Program
65
transduced cells showed moderate to mild infiltration by pleomorphic cells while shLuc
transduced cells showed large tumour masses and increased infiltration (Figure 32). To
determine whether tumour size was affected by Bmi1 knockdown, a relative surface area for
tumours was measured for both shLuc and shBmi1 1 tumours at 10,000 and 50,000 cells.
Tumour size appeared decreased in shBmi1 1 tumours at both cell numbers with tumour size
ranging from 0.2679 mm2 to 5.3325 mm
2 as compared to control tumours which ranged from
5.621 mm2 to 18.03 mm
2 (Table 2). The decrease in shBmi1 1 tumours compared to control
tumours at 10,000 cells was not found to be statistically significant (Figure 33). The decrease in
shBmi11 tumour size as compared to shLuc tumours at 50,000 cells was not statistically
analysed as there were not sufficient replicates (Figure 33).
Pathologically, all tumours were described as highly pleomorphic, with vascular endothelial
hypertrophy, high mitotic index and of epithelial origin, consistent with the primary patient
glioblastoma tumour.

M.Sc. Thesis - E. O’Farrell; McMaster University – Neuroscience Graduate Program
66
Chapter 4.
DISCUSSION

M.Sc. Thesis - E. O’Farrell; McMaster University – Neuroscience Graduate Program
67
Primary brain tumour sample 241, a glioblastoma tumour, was used for experimental conditions
as it showed increased proliferation in culture and allowed for multiple experimental uses
without overall depletion of cell number. Also, this sample did not undergo growth arrest in
culture like most primary brain tumour samples. Flow analysis of BT 241 under neural stem cell
conditions as well as differentiation conditions revealed a significant decrease in Bmi1 levels
under differentiation conditions as compared to neural stem cell conditions (Figure 2). This result
was expected as Bmi1 is a known developmental gene involved in stemness and vital for self-
renewal and proliferation of stem cells (Abdouh et al., 2009; Ailles & Weissman, 2007; Bracken
et al., 2006; Bruggeman et al., 2007; Chen et al., 2010; Fasano et al., 2007; Gil et al., 2005;
Lessard & Sauvageau, 2003; Park et al., 2004). Thus it would be expected that as self-renewal
decreases as a result of induced differentiation, levels of Bmi1 would decrease. It has been
shown that during differentiation, PcG binding and H3K27me3 marks decrease as repression of
gene transcription is released, allowing differentiation to occur (Bracken et al., 2006).
Interestingly, when markers of differentiation, MAP2 and GFAP, were analysed under both
neural stem cell conditions and differentiation conditions, no significant difference was found
between either culture condition (Figure 2). This result was surprising as these differentiation
markers were not expected under stem cell conditions. This may be an effect of long term culture
of BT 241. Long term culture and spontaneous immortalization of cells may lead to
differentiation block and presents a limitation of using cell lines. Furthermore, under both culture
conditions, MAP2 expression was significantly higher than GFAP expression indicating
differentiation was driven towards the neuronal lineage rather than the glial lineage (Figure 2).
This was an unexpected finding as BT 241, a glioblastoma, is a glial tumour thus would be
expected to have more glial differentiation than neuronal (Bonavia et al., 2011; Holland, 2000;

M.Sc. Thesis - E. O’Farrell; McMaster University – Neuroscience Graduate Program
68
Chen et al., 2011; Wen & Kesari, 2008). However, because BT 241 is a long term culture, it is
possible that the clone which is selected for over multiple passages may be more prone to a
neuronal phenotype. This selection phenomenon has been observed in some GBM cell lines
which indicated a predominantly GFAP negative phenotype (Pollard et al., 2009). The current
results still indicate some GFAP expression confirming that the selected subclone is a bipotential
clone which has the ability to differentiate into multiple lineages. This result further shows the
limitations of using cell lines and long term cultures as they select for particular clones which
thrive in culture conditions.
BT 241 was subjected to all stem cell assays including the secondary sphere formation assay.
This assay is used to determine the stem cell frequency within a population of cells through the
analysis of secondary sphere formation which correlates with self-renewal capacity (Singh et
al.,2004; Tropepe et al., 1999). When compared to three primary glioblastoma samples, BT 241
secondary sphere formation did appear higher but did not appear to be extremely different
indicating that this primary sample showed an increased capacity for self-renewal but perhaps
not significantly increased as the standard deviation for BT 241 overlapped with two out of three
primary GBMs analysed (Figure 3).
Proliferation analysis of BT 241 revealed that cell proliferation increased over time as expected
(Figure 5). BT 241 cells appeared to increase from day 0 to day 10 under both neural stem cell
conditions and serum conditions. No significant differences in proliferation profile were found
between culture conditions (p>0.05, Figure 5).

M.Sc. Thesis - E. O’Farrell; McMaster University – Neuroscience Graduate Program
69
BT 241 was subjected to knockdown of Bmi1 using the lentiviral construct shBmi1 1 and shLuc
as a control. These lentiviral constructs had previously been validated both at the mRNA and
protein levels (Figures 7 & 8). Once transduced, BT 241 cells were subjected to flow analysis.
Flow analysis revealed an observed decrease of Bmi1 at the protein level supporting the previous
finding that protein levels had been affected by the shBmi1 1 construct (Figure 9). Interestingly,
when BT 241 shLuc and shBmi1 1 cells were analysed for the brain tumour initiating cell marker
CD133, it was observed that knockdown of Bmi1 appeared to result in an increase in CD133
expression levels (Figure 9). This result is in keeping with previous unpublished findings within
the Singh lab which suggest that Bmi1 epigenetically silences CD133. Previous findings indicate
that when Bmi1 is knocked down, CD133 transcript levels increase. ChIP analysis at the CD133
promoter for the epigenetic activation mark 3meH3K4 as well as the epigenetic inhibition mark
3meH3K27 also revealed that when Bmi1 is knocked down, the activation mark 3meH3K4 is
increased and the inhibition mark 3meH3K27 is decreased (unpublished data). Expression of the
neural stem cell marker CD15 did not differ significantly between shLuc cells and shBmi1 1
cells (Figure 9). This result is in keeping with other reports which indicate that CD15 expression
remains stable in long term serum-free cultures and only decreases under differentiation
conditions (Mao et al., 2009).
Bmi1 knockdown cells (shBmi1 1) and control cells were analysed for self-renewal capacity
using the secondary sphere formation assay. Bmi1 knockdown was found to have a significant
effect on self-renewal when compared to control cells (p=0.0004, Figure 10). As well as
significantly decreasing self-renewal, sphere size, a measure of proliferation (Tropepe et al.,
1999), was affected by Bmi1 knockdown as seen by significantly smaller shBmi1 spheres as
compared to shLuc spheres (p=0.0058, Figure 11). Proliferation of BT 241 shBmi1 1 and shLuc

M.Sc. Thesis - E. O’Farrell; McMaster University – Neuroscience Graduate Program
70
cells was also analysed using the CyQuant proliferation assay and revealed that Bmi1
knockdown cells exhibited significantly decreased proliferation when compared to control cells
(p<0.001, Figure 12). These results are in keeping with previous findings indicating that Bmi1
knockdown has a negative effect on cell self-renewal and proliferation (Fasano et al., 2009;
Molofsky et al., 2003; Bruggeman et al., 2007; Iwama et al., 2004; Schuringa & Vellenga, 2010;
Abdouh et al., 2009; Chen et al., 2010; Gil et al., 2005; Lessard & Sauvageau, 2003). The
proliferation results suggest that the loss of Bmi1 contributed to increased senescence and
apoptosis, possibly as a result of decreased inhibition on p14 and p16 which affects the Rb and
p53 tumour suppressor pathways. It has been shown that when Bmi1 is knocked down in stem
cells, levels of p14arf and p16ink4a become upregulated and reactive oxygen species levels
increase resulting in decreased cell growth and increased apoptosis (Bruggeman et al., 2005;
Jacobs et al., 1999a; Lessard & Sauvageau, 2003; Liu et al., 2006; Molofsky et al., 2005;
Schuringa & Vellenga, 2010; Zencak et al., 2005).
BT 241 shLuc and shBmi1 1 cells were subjected to differentiation and analysed based on the
markers MAP2, a marker of mature neurons, and GFAP, a marker of mature astrocytes.
Immunofluorescence staining of differentiated cells was inconclusive as a result of potential non-
specific binding of the GFAP antibody (Figure 14). Flow cytometric analysis of differentiation
markers indicated higher overall neuronal differentiation than glial differentiation, consistent
with previous BT 241 differentiation analysis (Figure 2). Neuronal differentiation appeared
greater in Bmi1 knockdown cells as compared to control cells (Figure 15). This result was
expected based on previous findings indicating that knockdown of Bmi1 results in increased
differentiation (Abdouh et al., 2009; Ailles & Weissman, 2007; Bracken et al., 2006; Bruggeman
et al., 2007; Chen et al., 2010; Fasano et al., 2007; Gil et al., 2005; Lessard & Sauvageau, 2003;

M.Sc. Thesis - E. O’Farrell; McMaster University – Neuroscience Graduate Program
71
Park et al., 2004). Interestingly, glial differentiation appeared decreased in Bmi1 knockdown
cells compared to control cells (Figure 15). This result was unexpected but may be the result of
low cell number analysed and no technical replicates (Supplementary Figure 4).
To validate the use of BT 241 as a “spontaneous” GBM cell line, knockdown of Bmi1 using the
lentiviral construct shBmi1 1 and shLuc was performed in the commercial GBM cell line U-118
MG and cells were subjected to the same stem cell assays as BT 241. Knockdown of Bmi1 was
validated at the mRNA level (Figure 16).
U-118 MG transduced cells were analysed for self-renewal capacity using the secondary sphere
formation assay. In keeping with BT 241 findings, Bmi1 knockdown in U-118 MG cells was
found to have a significant effect on self-renewal when compared to control cells (p=0.0023,
Figure 17). Sphere size was also significantly decreased in U-118 MG Bmi1 knockdown cells
compared to control cells (p=0.0016, Figure 18), similar to what was found in BT 241 cells.
Proliferation of U-118 MG shLuc and shBmi1 1 cells was analysed using the CyQuant
proliferation assay and revealed that Bmi1 knockdown cells exhibited significantly decreased
proliferation when compared to control cells (p<0.001, Figure 19). These results confirm what
was observed in BT 241 knockdown cells and are in keeping with previous findings indicating
that Bmi1 knockdown has a negative effect on cell self-renewal and proliferation (Fasano et al.,
2009; Molofsky et al., 2003; Bruggeman et al., 2007; Iwama et al., 2004; Schuringa & Vellenga,
2010; Abdouh et al., 2009; Chen et al., 2010; Gil et al., 2005; Lessard & Sauvageau, 2003).
U-118 MG shLuc and shBmi1 1 cells were subjected to differentiation and analysed based on the
markers MAP2 and GFAP to examine neuronal and glial differentiation, respectively.

M.Sc. Thesis - E. O’Farrell; McMaster University – Neuroscience Graduate Program
72
Immunofluorescence staining of differentiated cells was inconclusive as a result of poor MAP2
staining and potential non-specific binding of the GFAP antibody as well as unhealthy cells
(Figures 20 & 21). Flow cytometric analysis of differentiation markers indicated higher overall
glial differentiation than neuronal differentiation (Figure 22). This finding opposed the results
seen in BT 241 knockdown cells which indicated greater neuronal differentiation (Figure 15).
This result is, however, in keeping with the morphology of glioblastoma tumours which arise
from glial cells and show greater astrocytic differentiation (Bonavia et al., 2011; Holland, 2000;
Chen et al., 2011; Wen & Kesari, 2008). Overall differentiation of cells appeared greater in
Bmi1 knockdown cells as compared to control cells (Figure 22). This result was expected based
on previous findings indicating that knockdown of Bmi1 results in increased differentiation
(Abdouh et al., 2009; Ailles & Weissman, 2007; Bracken et al., 2006; Bruggeman et al., 2007;
Chen et al., 2010; Fasano et al., 2007; Gil et al., 2005; Lessard & Sauvageau, 2003; Park et al.,
2004). The differences found between BT 241 and U-118 MG differentiation profiles further
indicate the limitations of using cell lines and long term cultures for experimental analysis as
they select for particular clones which thrive in culture conditions over long periods of time.
To confirm knockdown of Bmi1 and to confirm that the functional results seen using shBmi1 1
were a result of the construct targeting Bmi1 mRNA and not a result of off-target effects, three
shRNAs targeting different areas of Bmi1 mRNA and a scrambled control (shControl) were used
against BT 241 cells and transduced cells were subjected to stem cell assays. We compared all
new constructs to our previously validated shLuc construct as well as untransduced U-118 MG
GBM cells and found that all shBmi1 constructs appeared to knockdown Bmi1 (Figures 23 &
24). To our surprise, the scrambled control showed levels of Bmi1 similar to knockdown levels

M.Sc. Thesis - E. O’Farrell; McMaster University – Neuroscience Graduate Program
73
and we therefore doubted it as a true control. Out of interest, we used previously acquired BT
241 shLuc data as an additional comparative control for subsequent results.
Secondary sphere formation for BT 241 transduced with shBmi1 2-4 was analysed against both
the scrambled control and shLuc. An extremely significant decrease in secondary sphere
formation was found for all shBmi1 cells as well as the scrambled control when compared to
shLuc (Figure 25). These results indicated that all shBmi1 constructs had a negative effect on
self-renewal in BT 241 cells. No significant difference in average sphere size was observed for
any shBmi1 used (Figure 26) however, these results are unreliable since the scrambled control
was found to be affecting Bmi1 levels. Proliferation assays performed on BT 241 shBmi1 2-4
and shControl cells revealed no significant difference in proliferative capacity between Bmi1
knockdown cells and control cells (Figures 27 & 28). This may be the result of the use of the
scrambled control which was demonstrated as yielding Bmi1 levels comparable to all
knockdown constructs. The potentially confounding control resulted in the proliferation assay
being inconclusive, however, as this assay is time sensitive, no comparison to shLuc cells could
be made to confirm these results.
BT 241 shBmi1 2-4 and shControl cells were subjected to differentiation and analysed for MAP2
and GFAP expression levels by flow cytometry (Figure 30). No differences in expression level
were observed between shControl and shBmi1 2-4 for any of the markers examined (Figure 30).
The differentiation profile of shBmi1 2-4 and shControl cells indicated greater neuronal
differentiation, as seen by higher MAP2 expression, and relatively low astrocytic differentiation,
as seen by low GFAP expression (Figure 30). This result was consistent with the shLuc
differentiation profile which indicated greater neuronal differentiation than glial differentiation
(Figure 30). Interestingly, neuronal differentiation appeared dramatically decreased in shLuc

M.Sc. Thesis - E. O’Farrell; McMaster University – Neuroscience Graduate Program
74
cells compared to all other transduced cells (Figure 30). This difference may merely be the result
of one-time analysis of cells and low BT 241 cell number analysed (Supplementary Figure 4),
however, this assumption would need to be confirmed by repeating the analysis.
In vivo analysis of Bmi1 knockdown was performed using BT 241 and the shBmi1 1 and shLuc
lentiviral constructs. Tumour formation was found in one NSG mouse injected with as low as
100 sorted BT 241 shLuc cells while no tumour formation was found in the corresponding NSG
mouse injected with 100 sorted BT 241 shBmi1 cells (Figure 31). However, tumours were not
found in NSG mice injected with 100 enriched cells. This inconsistency may be due to
engraftment differences resulting from the injection of low cell numbers. It may be possible that
some mice injected with 100 enriched cells did not receive all 100 cells as a result of technical
limitations of manual injection of cells. It was observed that at lower cell numbers, Bmi1
knockdown appears to prevent tumour formation while control cells allow tumour formation to
occur. Although tumours were found in mice injected with 10,000 and 50,000 BT 241 shBmi11
cells, it was observed that tumours formed from shBmi1 1 transduced cells showed mild to
moderate infiltration by pleomorphic cells while shLuc transduced cells showed large tumour
masses and increased infiltration (Figure 32). This observation suggests that Bmi1 knockdown
had an effect on proliferation of tumour cells in vivo, resulting in smaller and less invasive
tumours. To determine whether tumour size was affected by Bmi1 knockdown, a relative surface
area for tumours was measured for both shLuc and shBmi1 1 tumours at 10,000 and 50,000 cells.
Tumour size appeared decreased in shBmi1 1 tumours at both cell numbers with tumour size
ranging from 0.2679 mm2 to 5.3325 mm
2 as compared to control cells which had tumour sizes
ranging from 5.621 mm2 to 18.03 mm
2 (Table 1). The decrease in shBmi1 1 tumours compared

M.Sc. Thesis - E. O’Farrell; McMaster University – Neuroscience Graduate Program
75
to control tumours at 10,000 cells was not found to be statistically significant (Figure 33). This
finding may have been the result of so few replicates used. The decrease in shBmi11 tumour size
as compared to shLuc tumours at 50,000 cells was not statistically analysed as there were not
sufficient replicates (Figure 33). Although the results seen were not statistically significant, a
trend indicating that tumours formed from Bmi1 knockdown cells were smaller than control
tumours was observed. This result is in keeping with previous findings in Daoy medulloblastoma
xenografts which displayed a decrease in tumour infiltration upon Bmi1 knockdown (Wang et
al., 2011). Our current in vivo data suggests that at lower cell numbers, rate of tumour formation
is affected by Bmi1 knockdown while at higher numbers, the size and invasiveness of tumour
formation is affected by Bmi1 knockdown.
Tumour formation was seen in the NSG mouse injected with 23,000 sorted shBmi1 cells but not
in control mice (Table 1). This observation may have been a result of cellular health and
survival. For this set of injections, only 23,000 sorted cells were viable for injection. As the cells
did not appear very healthy, tumour formation of shLuc cells may not have been possible as a
result of poor cell survival upon injection. This potential issue is further supported by our
observation that with 5000 cells or more, all mice injected with shLuc cells consistently show
tumour formation (Table 1).
Pathologically, all tumours were described as highly pleomorphic, with vascular endothelial
hypertrophy, high mitotic index and of epithelial origin. This is consistent with the primary
patient glioblastoma tumour suggesting that the tumours formed recapitulated the primary patient
tumour.

M.Sc. Thesis - E. O’Farrell; McMaster University – Neuroscience Graduate Program
76
In conclusion, we find that Bmi1 knockdown has significant effects on self-renewal and
proliferation in both a primary glioblastoma cell line, BT 241, and a commercially available
glioblastoma cell line, U-118 MG. When Bmi1 is knocked down in these cells, we see marked
decreases in self-renewal ability and proliferation over time. In vivo, we observe that at low cell
numbers, Bmi1 knockdown appears to prevent tumour formation while at high cell numbers,
Bmi1 knockdown appears to result in a decreased tumour size and invasiveness. Our
observations both in vitro and in vivo suggest that Bmi1 may serve as a potential therapeutic
target in glioblastoma tumours.
This study determined a significant role of Bmi1 in self-renewal and proliferation of cancer stem
cells and found that Bmi1 is necessary for these stem cell functions. Future work should expand
upon these findings to further determine the in vivo role of Bmi1 knockdown through increased
animal injections. Future studies should also examine whether Bmi1 is sufficient to cause
cancerous mutations and induce tumour initiation. Bmi1 overexpression studies in normal neural
stem cells should be performed to determine whether Bmi1 mutations are sufficient to induce
transformation of normal neural stem cells into cancer stem cells.

M.Sc. Thesis - E. O’Farrell; McMaster University – Neuroscience Graduate Program
77
Chapter 5.
REFERENCES

M.Sc. Thesis - E. O’Farrell; McMaster University – Neuroscience Graduate Program
78
Abdouh M, Facchino S, Chatoo W, Balasingam V, Ferreira J, Bernier G. (2009) BMI1 Sustains
Human Glioblastoma Multiforme Stem Cell Renewal. The Journal of Neuroscience.
29(28):8884-8896.
Ailles LE & Weissman IL. (2007) Cancer stem cells in solid tumors. Current Opinions in
Biotechnology. 18:460-466.
Al-Hajj M, Wicha MS, Benito-Hernandez A, Morrison SJ, Clarke MF. (2003) Prospective
identification of tumorigenic breast cancer cells. PNAS. 100(7):3983-3988.
Alkema MJ, Wiegant J, Raap AK, Berns A, van Lohiuzen M. (1993) Characterization and
chromosomal localization of the human proto-oncogene BMI-1. Human Molecular
Genetics. 2(10):1597-1603.
Bao S, Wu Q, McLendon RE, Hao Y, Shi Q, Hjelmeland AB, Dewhirst MW, Bigner DD, Rich
JN. (2006) Glioma stem cells promote radioresistance by preferential activation of the
DNA damage response. Nature. 444:756-760.
Bracken AP, Dietrich N, Pasini D, Hansen KH, Helin K. (2006) Genome-wide mapping of
Polycomb target genes unravels their roles in cell fate transitions. Genes &
Development. 20:1123-1136.
Bracken AP, Kleine-Kohlbrecher D, Dietrich N, Pasini D, Gargiulo G, Beekman C, Theilgaard-
Monch K, Minucci S, Porse BT, Marine JC, Hansen KH, Helin K. (2007) The Polycomb
group proteins bind throughout the INK4A-ARF locus and are disassociated in
senescent cells. Genes & Development. 21:525-530.
Bonavia R, Inda M, Cavenee WK, Furnari FB. (2011) Heterogeneity Maintenance in
Glioblastoma: A Social Network. Cancer Research. 71(12):1-6.
Bonnet D & Dick JE. (1997) Human acute myeloid leukemia is organized as a hierarchy that
originates from a primitive hematopoietic cell. Nature Medicine. 3(7):730-737.
Bruggeman SW, Hulsman D, Tanger E, Buckle T, Blom M, Zevenhoven J, van Tellingen O, van
Lohuizen M. (2007) Bmi1 controls tumor development in an Ink4a/Arf-independent
manner in a mouse model for glioma. Cancer Cell. 12(4):328-41.
Bruggeman SW, Hulsman D, van Lohuizen M. (2009) Bmi1 deficient neural stem cells have
increased Integrin dependent adhesion to self-secreted matrix. Biochimica et
Biophysica Acta. 1790(5):351-360.
Bruggeman SW, Valk-Lingbeek ME, van der Stoop PP, Jacobs JJL, Keiboom K, Tanger E,
Hulsman D, Leung C, Arsenijevic Y, Marino S, van Lohuizen M. (2005) Ink4a and Arf
differentially affect cell proliferation and neural stem cell self-renewal in Bmi1-
deficient mice. Genes & Development.19(12):1438-43.

M.Sc. Thesis - E. O’Farrell; McMaster University – Neuroscience Graduate Program
79
Chen H, Zhou L, Dou T, Wan G, Tang H, Tian J. (2011) BMI1’s maintenance of the
proliferative capacity of laryngeal cancer stem cells. HEAD & NECK. 33(8):1115-1125.
Chen R, Nishimura MC, Bumbaca SM, Kharbanda S, Forrest WF, Kasman IM, Greve JM,
Soriano RH, Gilmour LL, Rivers CS, Modrusan Z, Nacu S, Guerrero S, Edgar KA, Wallin
JJ, Lamszus K, Westphal M, Heim S, James CD, VandenBerg SR, Costello JF, Moorefield
S, Cowdrey CJ, Prados M, Phillips HS. (2010) A Hierarchy of Self-Renewing Tumor-
Initiating Cell Types in Glioblastoma. Cancer Cell. 17:362-375.
Chiba T, Miyagi S, Saraya A, Aoki R, Seki A, Morita Y, Yonemistsu Y, Yokosuka O, Taniguchi
H, Nakauchi H, Iwama A. (2008) The Polycomb Gene Product BMI1 Contributes to
the Maintenance of Tumor-Initiating Side Population Cells in Hepatocellular
Carcinoma. Cancer Research. 68(19):7742-7749.
Clarke MF, Dick JE, Dirks PB, Eaves CJ, Jamieson CHM, Jones DL, Visvader J, Weissman IL,
Wahl GM. (2006) Cancer Stem Cells – Perspectives on Current Status and Future
Directions: AACR Workshop on Cancer Stem Cells. Cancer Research. 66(19):9339-
9344.
Cohen KJ, Hanna JS, Prescott JE, Dang CV. (1996) Transformation by the Bmi-1
Oncoprotein Correlates with Its Subnuclear Localization but Not Its Transcriptional
Suppression Activity. Molecular and Cellular Biology. 16(10):5527-5535.
Corti S, Locatelli F, Papadimitriou D, Donadoni C, Salani S, Del Bo R, Strazzer S, Bresolin N,
Comi GP. (2006) Identification of a Primitive Brain-Derived Neural Stem Cell
Population Based on Aldehyde Dehydrogenase Activity. Stem Cells. 24:975-985.
Dalerba P, Cho RW, Clarke MF. (2007) Cancer Stem Cells: Models and Concepts. Annual
Review of Medicine. 58:267-284.
Dimri GP, Martinez JL, Jacobs JJL, Keblusek P, Itahana K, van Lohuizen M, Campisi J, Wazer
DE, Band V. (2002) The Bmi-1 Oncogene Induces Telomerase Activity and
Immortalizes Human Mammary Epithelial Cells. Cancer Research. 62:4736-4745.
Emmenegger BA & Wechsler-Reya RJ. (2008) Stem Cells and the Origin and Propagation of
Brain Tumors. Journal of Child Neurology. 23:1172-1178.
Fan C, He L, Kapoor A, Rybak AP, De Melo J, Cutz JC, Tang D. (2009) PTEN inhibits BMI1
function independently of its phosphatise activity. Molecular Cancer. 8:98-112.
Fasano CA, Dimos JT, Ivanova NB, Lowry N, Lemischka IR, Temple S. (2007) shRNA
Knockdown of Bmi-1 Reveals a Critical Role for p21-Rb Pathway in NSC Self-
Renewal during Development. Cell Stem Cell. 1:87-99.
Galli R, Binda E, Orfanelli U, Cipelletti B, Gritti A, De Vitis S, Fiocco R, Foroni C, Dimeco F,
Vescovi A. (2004) Isolation and Characterization of Tumorigenic, Stem-like Neural
Precursors from Human Glioblastoma. Cancer Research. 64:7011-7021.

M.Sc. Thesis - E. O’Farrell; McMaster University – Neuroscience Graduate Program
80
Gil J, Bernard D, Peters G. (2005) Role of Polycomb Group Proteins in Stem Cell Self-
Renewal and Cancer. DNA and Cell Biology. 24(2):117-125.
Ginestier C, Hur MH, Charafe-Jauffret E, Monville F, Dutcher J, Brown M, Jacquemier J, Viens
P, Kleer CG, Liu S, Schott A, Hayes D, Birnbaum D, Wicha MS, Dontu G. (2007)
ALDH1 Is a Marker of Normal and Malignant Human Mammary Stem Cells and a
Predictor of Poor Clinical Outcome. Cell Stem Cell. 1:555-567.
Grinstein E & Wernet P. (2007) Cellular signaling in normal and cancerous stem cells.
Cellular Signalling. 19:2428-2433.
Hadjipanayis CG & Van Meir EG. (2009) Tumor initiating cells in malignant gliomas:
biology and implications for therapy. Journal of Molecular Medicine. 87:363-374.
Haupt Y, Alexander WS, Barri G, Klinken SP, Adams JM. (1991) Novel Zinc Finger Gene
Implicated as myc Collaborator by Retrovirally Accelerated Lymphomagenesis in
Eµ-myc Transgenic Mice. Cell. 65:753-763.
He S, Iwashita T, Buchstaller J, Molofsky AV, Thomas D, Morrison SJ. (2009) Bmi-1 over-
expression in neural stem/progenitor cells increases proliferation and neurogenesis in
culture but has little effect on these functions in vivo. Developmental Biology. 328:257-
272.
Hess DA, Meyerrose TE, Wirthlin L, Craft TP, Herrbrich PE, Creer MH, Nolta JA. (2004)
Functional characterization of highly purified human hematopoietic repopulating
cells isolated according to aldehyde dehydrogenase activity. Blood. 104:1648-1655.
Holland EC. (2000) Glioblastoma multiforme: The terminator. PNAS. 97(12):6242-6244.
Huse JT & Holland EC. (2010) Targeting brain cancer: advances in the molecular pathology
of malignant glioma and medulloblastoma. Nature Reviews. 10:319-331.
Ishizawa K, Rasheed ZA, Karisch R, Wang Q, Kowalski J, Susky E, Pereira K, Karamboulas C,
Mogal N, Rajeshkumar NV, Hidalgo M, Tsao M, Ailles L, Waddell TK, Maitra A, Neel
BG, Matsui W. (2010) Tumor-Initiating Cells Are Rare in Many Human Tumors. Cell
Stem Cell. 7:279-282.
Ivanchuk SM, Mondal S, Dirks PB, Rutka, JT. (2001) The INK4A/ARF locus: Role in cell
cycle control and apoptosis and implications for glioma growth. Journal of Neuro-
Oncology. 51: 219-229.
Iwama A, Oguro H, Negishi M, Kato Y, Morita Y, Tsukui H, Ema H, Kamijo T, Katoh-Fukui T,
Koseki H, van Lohuizen M, Nakauchi H. (2004). Enhanced Self-Renewal of
Hematopoietic Stem Cells Mediated by the Polycomb Gene Product Bmi-1. Immunity.
21: 843-851.

M.Sc. Thesis - E. O’Farrell; McMaster University – Neuroscience Graduate Program
81
Jacobs JJL, Kieboom K, Marino S, DePinho RA, van Lohuizen M. (1999a). The oncogene and
Polycomb-group gene bmi-1 regulates cell proliferation and senescence through the
ink4a locus. Nature. 397:164-168.
Jacobs JJL, Scheijen B, Voncken JW, Kieboom K, Berns A, van Lohuizen M. (1999b). Bmi-1
collaborates with c-Myc in tumorigenesis by inhibiting c-Myc-induced apoptosis via
INK4a/ARF. Genes & Development. 13:2678-2690.
Jiang L, Li J, Song L. (2009) Bmi-1, stem cells and cancer. Acta Biochimica et Biophysica
Sinica. 1-8.
Kallin EM, Cao R, Jothi R, Xia K, Cui K, Zhao K, Zhang Y. (2009) Genome-Wide uH2A
Localization Analysis Highlights Bmi1-Dependent Deposition of the Mark at
Repressed Genes. PLoS Genetics. 5(6):e1000506. doi:10.1371/journal.pgen.1000506.
Kelly PN, Dakic A, Adams JM, Nutt SL, Strasser A. (2007) Tumor Growth Need Not Be
Driven by Rare Cancer Stem Cells. Science. 317:337.
Kim JH, Yoon SY, Kim CN, Joo JH, Moon SK, Choe IS, Choe YK, Kim JW. (2004) The Bmi-1
oncoprotein is overexpressed in human colorectal cancer and correlates with the
reduced p16INK4a/p14ARF proteins. Cancer Letters. 203:217-224.
Lessard J & Sauvageau G. (2003). Bmi-1 determines the proliferative capacity of normal and
leukaemic stem cells. Nature. 423(6937):255-60.
Li Z, Cao R, Wang M, Myers MP, Zhang Y, Xu RM. (2006). Structure of a Bmi-1-Ring1B
Polycomb Group Ubiquitin Ligase Complex. Journal of Biological Chemistry.
281(29):20643-20649.
Li Z, Wang H, Eyler CE, Hjelmeland AB, Rich JN. (2009). Turning Cancer Stem Cells Inside
Out: An Exploration of Glioma Stem Cell Signaling Pathways. The Journal of
Biological Chemistry. 284(25):16705-16709.
Liu L, Andrews LG, Tollefbol, TO. (2006) Loss of the human polycomb group protein BMI1
promotes cancer-specific cell death. Oncogene. 25: 4370-4375.
Mao X, Zhang X, Xue X, Guo G, Wang P, Zhang W, Fei Z, Zhen H, You S, Yang H. (2009)
Brain Tumor Stem-Like Cells Identified by Neural Stem Cell Marker CD15.
Translational Oncology. 2(4):247-257.
Marquardt JU, Factor VM, Thorgeirsson SS. (2010) Epigenetic regulation of cancer stem cells
in liver cancer: Current concepts and clinical implications. Journal of Hepatology.
53:568-577.
Miller CR & Perry A. (2007) Glioblastoma: Morphologic and Molecular Genetic Diversity.
Archives of Pathology & Laboratory Medicine. 131(3):397-406.

M.Sc. Thesis - E. O’Farrell; McMaster University – Neuroscience Graduate Program
82
Molofsky AV, Pardal R, Iwashita T, Park IK, Clarke MF, Morrison SJ. (2003) Bmi-1
dependence distinguishes neural stem cell self-renewal from progenitor proliferation.
Nature. 425(6961): 962-967.
Molofsky AV, He S, Bydon M, Morrison SJ, Pardal R. (2005) Bmi-1 promotes neural stem cell
self-renewal and neural development but not mouse growth and survival by
repressing the p16Ink4a and p19Arf senescence pathways. Genes & Development.
19(12):1432-7.
O’Brien CA, Kreso A, Dick JE. (2009) Cancer Stem Cells in Solid Tumors: An Overview.
Seminars in Radiation Oncology. 19:71-77.
Oliver TG & Wechsler-Reya RJ. (2004) Getting at the Root and Stem of Brain Tumors.
Neuron. 42:885-888.
Pardal R, Clarke MF, Morrison SJ. (2003) Applying the principles of stem-cell biology to
cancer. Nature Reviews Cancer. 3:895-902.
Park IK, Morrison SJ, Clarke MF. (2004) Bmi1, stem cells, and senescence regulation. Journal
of Clinical Investigation. 113:175-179.
Pollard SM, Yoshikawa K, Clarke ID, Danovi D, Stricker S, Russell R, Bayani J, Head R, Lee
M, Bernstein M, Squire JA, Smith A, Dirks P. (2009) Glioma Stem Cell Lines Expanded
in Adherent Culture Have Tumor-Specific Phenotypes and Are Suitable for Chemical
and Genetic Screens. Cell Stem Cell. 4:568-580.
Qian T, Lee J-Y, Park J-H, Kim H-J, Kong G. (2010) Id1 enhances RING1b E3 ubiquitin
ligase activity through the Mel-18/Bmi1 polycomb group complex. Oncogene. 29:5818-
5827.
Rahman M. (2009) Introduction to Flow Cytometry. Oxford: MorphoSys UK Ltd.
Reya T, Morrison SJ, Clarke MF, Weissman IL. (2001) Stem cells, cancer, and cancer stem
cells. Nature. 414:105-111.
Rosen JM & Jordan CT. (2009) The Increasing Complexity of the Cancer Stem Cell
Paradigm. Science. 324:1670-1673.
Sauvageau M & Sauvageau G. (2010) Polycomb Group Proteins: Multi-Faceted Regulators
of Somatic Stem Cells and Cancer. Cell Stem Cell. 7:299-313.
Schuringa JJ & Vellenga E. (2010) Role of the polycomb group gene BMI1 in normal and
leukemic hematopoietic stem and progenitor cells. Current Opinion in Hematology. 17:
294-299.
Shackleton M, Quintana E, Fearon ER, Morrison SJ. (2009) Heterogeneity in Cancer: Cancer
Stem Cells versus Clonal Evolution. Cell. 138:822-829.
Sharpless NE & DePinho RA. (1999) The INK2A/ARF locus and its two gene products.
Current Opinions in Genetics & Development. 9:22-30.

M.Sc. Thesis - E. O’Farrell; McMaster University – Neuroscience Graduate Program
83
Shipitsin M & Polyak K. (2008) The cancer stem cell hypothesis: in search of definitions,
markers, and relevance. Laboratory Investigation. 88:459-463.
Silva J, Garcia JM, Pena C, Garcia V, Dominguez G, Suarez D, Camacho FI, Espinosa R,
Provencio M, Espana P, Bonilla F. (2006) Implication of Polycomb Members Bmi-1,
Mel-18, and Hpc-2 in the Regulation of p16INK4a, p14ARF, h-TERT, and c-MYC
Expression in Primary Breast Carcinomas. Clinical Cancer Research. 12(23):6929-
6936.
Singh SK, Clarke ID, Terasaki M, Bonn VE, Hawkins C, Squire J, Dirks PB. (2003)
Identification of a Cancer Stem Cell in Human Brain Tumors. Cancer Research.
63:5821-5828.
Singh SK, Clarke ID, Hide T, Dirks PB. (2004a) Cancer stem cells in nervous system tumors.
Oncogene. 23:7267-7273.
Singh SK, Hawkins C, Clarke ID, Squire JA, Bayani J, Hide T, Henkelman RM, Cusimano MD,
Dirks PB. (2004b) Identification of human brain tumor initiating cells. Nature.
432(7015):396-401.
Steinbach D, Legrand O. (2007) ABC transporters and drug resistance in leukemia: was P-
gp nothing but the first head of the hydra?. Leukemia. 21:1172-1176.
Tabatabai G & Weller M. (2011) Glioblastoma stem cells. Cell Tissue Research. 343:459-465.
Tan BT, Park CY, Ailles LE, Weissman IL. (2006) The cancer stem cell hypothesis: a work in
progress. Laboratory Investigation. 86:1203-1207.
Tropepe V, Sibilia M, Ciruna BG, Rossant J, Wagner EF, van der Kooy D. (1999) Distinct
neural stem cells proliferate in response to EGF and FGF in the developing mouse
telencephalon. Developmental Biology. 208(1):166-88.
Uchida N, Buck DW, He D, Reitsma MJ, Masek M, Phan TV, Tsukamoto AS, Gage FH,
Weissman IL. (2000) Direct isolation of human central nervous system stem cells.
PNAS. 97(26):14720-14725.
Valk-Lingbeek ME, Bruggeman SW, van Lohuizen M. (2004) Stem Cells and Cancer: The
Polycomb Connection. Cell. 118:409-418.
van Lohuizen M, Verbeek S, Scheijen B, Wientjens E, van der Gulden H, Berns A. (1991)
Identification of Cooperating Oncogenes in Eµ-myc Transgenic Mice by Provirus
Tagging. Cell. 65:737-752.
Verhaak RGW, Hoadley KA, Purdom E, Wang V, Qi Y, Wilkerson MD, Miller CR, Ding L,
Golub T, Mesirov JP, Alexe G, Lawrence M, O'Kelly M, Tamayo P, Weir BA, Gabriel S,
Winckler W, Gupta S, Jakkula L, Feiler HS, Hodgson JG, James CD, Sarkaria JN, Brennan
C, Kahn A, Spellman PT, Wilson RK, Speed TP, Gray JW, Meyerson M, Getz G, Perou
CM, Hayes DN. (2010) Integrated Genomic Analysis Identifies Clinically Relevant
Subtypes of Glioblastoma Characterized by Abnormalities in PDGFRA, IDH1,
EGFR, and NF1. Cancer Cell. 17(1):98-110.

M.Sc. Thesis - E. O’Farrell; McMaster University – Neuroscience Graduate Program
84
Vescovi AL, Galli R, Reynolds BA. (2006) Brain tumour stem cells. Nature Reviews. 6:425-
436.
Visvader JE & Lindeman GL. (2008) Cancer stem cells in solid tumours: accumulating
evidence and unresolved questions. Nature Reviews. 8:755-768.
Voncken JW, Schweizer D, Aagaard L, Sattler L, Jantsch MF, van Lohuizen M. (1999)
Chromatin-association of the Polycomb group protein BMI1 is cell cycle-regulated
and correlates with its phosphorylation status. Journal of Cell Science. 112: 4627-4639.
Wang H, Wang L, Erdjument-Bromage H, Vidal M, Tempst P, Jones RS, Zhang Y. (2004) Role
of histone H2A ubiquitination in Polycomb silencing. Nature. 431:873-878.
Wang X, Venugopal C, Manoranjan B, McFarlane N, O’Farrell E, Nolte S, Gunnarsson T,
Hollenberg R, Kwiecien J, Northcott P, Taylor MD, Hawkins C, Singh SK. (2011) Sonic
hedgehog regulates Bmi1 in human medulloblastoma brain tumor-initiating cells.
Oncogene. 1-13. doi: 10.1038/onc.2011.232.
Wen PY, Kesari S. (2008) Malignant Gliomas in Adults. New England Journal of Medicine.
359:492-507.
Wicha MS, Liu S, Dontu G. (2006) Cancer Stem Cells: An Old Idea – A Paradigm Shift.
Cancer Research. 66(4):1883-1890.
Yadirgi G, Leinster VHL, Acquati S, Bhagat H, Shakhova O, Marino S. (2011) Conditional
Activation of Bmi1 Expression Regulates Self-Renewal, Apoptosis and Differentiation
of Neural Stem/Progenitor Cells In Vitro and In Vivo. Stem Cells. 29(4):700-712.
Yin AH, Miraglia S, Zanjani ED, Almeida-Porada G, Ogawa M, Leary AG, Olweus J, Kearney
J, Buck DW. (1997) AC133, a Novel Marker for Human Hematopoietic Stem and
Progenitor Cells. Blood. 90(12):5002-5012.
Zencak D, Lingbeek M, Kostic C, Tekaya M, Tanger E, Hornfeld D, Jaquet M, Munier FL,
Schorderet DF, van Lohuizen M, Arsenijevic, Y. (2005) Bmi1 Loss Produces an Increase
in Astroglial Cells and a Decrease in Neural Stem Cell Population and Proliferation.
The Journal of Neuroscience. 25(24):5774-5783.

M.Sc. Thesis - E. O’Farrell; McMaster University – Neuroscience Graduate Program
85
SUPPLEMENTARY MATERIALS

M.Sc. Thesis - E. O’Farrell; McMaster University – Neuroscience Graduate Program
86
Supplementary Table 1
Antigen Antibody Company Catalogue
No.
Dilution
CD133 PE M. Bio 130-090-853 1:20
PE Isotype M. Bio 130-092-215 1:20
Bmi1 APC R&D Systems IC33341A 1:100
APC Isotype R&D Systems 130-092-217 1:100
MAP2 AlexaFluor 647 BD
Biosciences
560382 1:10
(Flow cytometry)
1:20
(Immunofluorescence)
Alexa 647 Isotype Invitrogen 06013427 1:10
(Flow cytometry)
1:20
(Immunofluorescence)
GFAP
(conjugated)
PE BD
Biosciences
561483 1:20
PE Isotype M. Bio 130-092-215 1:20
GFAP
(unconjugated)
Rabbit, polyclonal Dako Z0334 1:2000
Rabbit IgG Goat, Alexa-Fluor
647 conjugated
Invitrogen A21245 1:1000

M.Sc. Thesis - E. O’Farrell; McMaster University – Neuroscience Graduate Program
87
Supplementary Figure 1
Genecopoeia vectors
Japan vector
RING finger binding domain

M.Sc. Thesis - E. O’Farrell; McMaster University – Neuroscience Graduate Program
88
Supplementary Figure 2
A) BT 241 under NSC conditions stained for CD133

M.Sc. Thesis - E. O’Farrell; McMaster University – Neuroscience Graduate Program
89
B) BT 241 under NSC conditions stained for Bmi1, MAP2, and GFAP

M.Sc. Thesis - E. O’Farrell; McMaster University – Neuroscience Graduate Program
90
C) BT 241 under Differentiation conditions stained for CD133

M.Sc. Thesis - E. O’Farrell; McMaster University – Neuroscience Graduate Program
91
D) BT 241 under Differentiation conditions stained for Bmi1, MAP2, and GFAP

M.Sc. Thesis - E. O’Farrell; McMaster University – Neuroscience Graduate Program
92
Supplementary Figure 3
A) Scatter plots for BT 241 shLuc cells stained for Bmi1, CD133, and CD15

M.Sc. Thesis - E. O’Farrell; McMaster University – Neuroscience Graduate Program
93
B) Scatter plots for BT 241 shBmi1 1 cells stained for Bmi1, CD133, and CD15

M.Sc. Thesis - E. O’Farrell; McMaster University – Neuroscience Graduate Program
94
Supplementary Figure 4
A) BT 241 shLuc Differentiation
B) BT 241 shBmi1 Differentiation

M.Sc. Thesis - E. O’Farrell; McMaster University – Neuroscience Graduate Program
95
Supplementary Figure 5
A) U-118 MG shLuc Differentiation
B) U-118 MG shBmi1 Differentiation

M.Sc. Thesis - E. O’Farrell; McMaster University – Neuroscience Graduate Program
96
Supplementary Figure 6
A) Flow cytometric analysis of GFP expression in BT 241 shControl cells

M.Sc. Thesis - E. O’Farrell; McMaster University – Neuroscience Graduate Program
97
B) Flow cytometric analysis of GFP expression in BT 241 shBmi1 2 cells
C) Flow cytometric analysis of GFP expression in BT 241 shBmi1 3 cells

M.Sc. Thesis - E. O’Farrell; McMaster University – Neuroscience Graduate Program
98
D) Flow cytometric analysis of GFP expression in BT 241 shBmi1 4 cells

M.Sc. Thesis - E. O’Farrell; McMaster University – Neuroscience Graduate Program
99
Supplementary Figure 7
A) Flow cytometric analysis of differentiation marker expression in BT 241 shControl cells

M.Sc. Thesis - E. O’Farrell; McMaster University – Neuroscience Graduate Program
100
B) Flow cytometric analysis of differentiation marker expression in BT 241 shBmi1 2 cells

M.Sc. Thesis - E. O’Farrell; McMaster University – Neuroscience Graduate Program
101
C) Flow cytometric analysis of differentiation marker expression in BT 241 shBmi1 3 cells

M.Sc. Thesis - E. O’Farrell; McMaster University – Neuroscience Graduate Program
102
D) Flow cytometric analysis of differentiation marker expression in BT 241 shBmi1 4 cells


![PcG Proteins MSI1 and BMI1 Function Upstream of miR156 to ... · PcG Proteins MSI1 and BMI1 Function Upstream of miR156 to Regulate Aerial Tuber Formation in Potato1[OPEN] Amit Kumar,2](https://static.fdocuments.net/doc/165x107/5e55ed860cda997cf77628a1/pcg-proteins-msi1-and-bmi1-function-upstream-of-mir156-to-pcg-proteins-msi1.jpg)