Characterizing Geometrical Anisotropy of Petrophysical ...
22
International Journal of Applied Environmental Sciences ISSN 0973-6077 Volume 11, Number 1 (2016), pp. 89-109 © Research India Publications http://www.ripublication.com Characterizing Geometrical Anisotropy of Petrophysical properties in the middle Shahejie formation, Liaohe Depression, China. * Oluwatosin J. Rotimi 1,2 , Zhenli Wang 2 and Richard O. Afolabi 1 1 Petroleum Engineering Department, Covenant University, Ota, Nigeria. 2 Key Laboratory of Petroleum Resources, Institute of Geology and Geophysics, CAS, Beijing, China. Abstract Knowledge of reservoir body lateral extent is important information for estimation of hydrocarbon initially in place and the recoverable quantity. This study reports a stepwise approach to evaluate geometrical anisotropy of the rapidly changing alluvial fan Shahejie formation of Eocene age. This is towards understanding reservoir geometry of the deposit beneath the flank of Bohai bay, Northern China. Computation of Sand net to gross (Volume of shale), porosity and permeability was done on well logs as an initial analytical step, followed by computation of sample variograms, data transformation and property modeling. Computation of semivariance was based on first geometrical anisotropy for autocorrelation by finding major and minor directions of data consistency. Autocorrelation of data with distance of location made upscaled data useful for stochastic simulation. Minor data direction is almost perpendicular to the major direction with the bandwidth of not less than 4000. In the vertical direction, average bandwidth is 50. Porosity for the modeled zone is consistent with values between 17% and 35%. Permeability is consistent briefly away from well location but higher in shale units. These oil impregnated shale units are laterally consistent in the up-dip portion but were overtaken by the clastic units in the distal portion. This made draining of hydrocarbon better done in the down-dip portion of the area. An excellent comparative analysis was made of the litho- facies model, petrophysical properties, and inversion results obtained from the vintage seismic. This has yielded a good result in characterizing variation in rock properties of the subtle laterally inconsistent synsedimentary lithofacies of this area. Keywords: Petrophysics, Reservoir, Anisotropy, Variogram, Semivariance, Permeability, Alluvial fan, Shale.
Transcript of Characterizing Geometrical Anisotropy of Petrophysical ...

International Journal of Applied Environmental Sciences
ISSN 0973-6077 Volume 11, Number 1 (2016), pp. 89-109
© Research India Publications
http://www.ripublication.com
Characterizing Geometrical Anisotropy of
Petrophysical properties in the middle Shahejie
formation, Liaohe Depression, China.
*Oluwatosin J. Rotimi1,2, Zhenli Wang2 and Richard O. Afolabi1
1Petroleum Engineering Department, Covenant University, Ota, Nigeria.
2Key Laboratory of Petroleum Resources, Institute of Geology and Geophysics, CAS, Beijing, China.
Abstract
Knowledge of reservoir body lateral extent is important information for
estimation of hydrocarbon initially in place and the recoverable quantity. This
study reports a stepwise approach to evaluate geometrical anisotropy of the
rapidly changing alluvial fan Shahejie formation of Eocene age. This is
towards understanding reservoir geometry of the deposit beneath the flank of
Bohai bay, Northern China. Computation of Sand net to gross (Volume of
shale), porosity and permeability was done on well logs as an initial analytical
step, followed by computation of sample variograms, data transformation and
property modeling. Computation of semivariance was based on first
geometrical anisotropy for autocorrelation by finding major and minor
directions of data consistency. Autocorrelation of data with distance of
location made upscaled data useful for stochastic simulation.
Minor data direction is almost perpendicular to the major direction with the
bandwidth of not less than 4000. In the vertical direction, average bandwidth
is 50. Porosity for the modeled zone is consistent with values between 17%
and 35%. Permeability is consistent briefly away from well location but
higher in shale units. These oil impregnated shale units are laterally consistent
in the up-dip portion but were overtaken by the clastic units in the distal
portion. This made draining of hydrocarbon better done in the down-dip
portion of the area. An excellent comparative analysis was made of the litho-
facies model, petrophysical properties, and inversion results obtained from the
vintage seismic. This has yielded a good result in characterizing variation in
rock properties of the subtle laterally inconsistent synsedimentary lithofacies
of this area.
Keywords: Petrophysics, Reservoir, Anisotropy, Variogram, Semivariance,
Permeability, Alluvial fan, Shale.

90 Oluwatosin J. Rotimi et al
Introduction In exploring for oil and gas, a principal interest is in locating producible reservoir and
in other information fundamental to the success of the goal of optimal recovery
(Agrawal, et al., 2012; Boyer, et al., 2006; Cipolla, et al., 2011a; Lash, and Engelder,
2011; Goodway, 2001; Marfurt, 2006; Ogiesoba and Eastwood, 2013). These interests
are based on the characteristics of the reservoir obtainable from investigations carried
out directly or indirectly, that is from either the invasive or non-invasive geophysical
means of investigation. Superb vertical resolutions of the temporal well log data
makes it attractive for use to interpret and generate results that are indispensable
concerning reservoir of interest. Validity of viable hydrocarbon reserve from this
temporal data initiates a strong desire to know the possibility of lateral continuity of
the interpreted properties away from exploration wells (Marfurt, 2006). This informs
the development and use of the seismic method of geophysical exploration for oil and
gas. 3D seismic survey is employed to give a clearer picture of what the subsurface
rock units are (James, et al., 1994;Biondiet al., 1998), and due to the fact that rocks
have elastic properties, the responses of different rock materials to elastic waves is
based on density and the velocity of wave travel which constitute the root of seismic
theories. Seismic records come with attributes that are intrinsic to the investigated
terrain thus there is a desire to know the information shared between wavelet
responses and characteristics of rock units (reservoir). An integrated approach to
characterizing a reservoir is thus the best in resolving the natural and formative
properties of a reservoir (Journel, 1997, 2002; Caers, 2000, 2002; Strebelle, 2000,
2002). The paucity of data and the delicate nature of the few at hand coupled with the
very important need to come out with a valid and unassuming exploration philosophy
for a particular terrainhas informed the need to adequately look inward and properly
take into consideration all the properties of the data point available and judiciously
incorporate one into another. Models that are valid and peculiar to prevalent geology
and depositional environment often result from an interpretation carefully done from a
robust database spanning outcrop, seismic, core, well logs, well test and production
data. This obviously would have taken into consideration the provenance and current
properties of the analyzed rock body. Anisotropy analysis requires evaluating and
understanding rock properties based on intrinsic geometrical qualities. These intrinsic
qualities are those physico-chemical parameters that have been geophysically
measured by various geophysical investigation techniques (Ye, 2010). Physico-
chemical parameters (petrophysical properties) vary from point to point in response to
the formative conditions and post-depositional changes. Identifying the prevalent
variation with direction of deposition is the main interest of anisotropy analysis. An
optimum approach for this will be to have a three dimensional view of it for analytical
and result plausibility. Hence evaluation in major, minor (horizontal/lateral) and
vertical direction becomes indispensable for a robust result.
The Tertiary synsedimentary formations in the Liaohe depression are Kongdian (Ek),
Shahejie (Es) and Dongying (Ed) (Haoet al., 2009) (Figure 1). They are parallic,
siliciclastic and fluvial-lacustrine generated rock types deposited in restricted
environments. Shahejie formation is further divided into four members with their
paleoclimate ranging from arid hot northern subtropical to a milder west northern

Characterizing Geometrical Anisotropy of Petrophysical properties 91
subtropical climate. They essentially consist of sandstone as reservoir rocks and
lithified mud as potential source rocks. There is a remarkable absence of massive
reservoir units in the Liaohe depression because of the environment of deposition.
Gravity driven mass movement of sediment downhill with little time and space for
sediment sorting and consolidation is probably the cause of the heterogeneity and
consequently low permeability recorded for the area especially the distal inclined
cascading end. The main effect of heterogeneity is often observed on permeability.
Presence of fine particle size sediments causes reduction in permeability, blocks
tortuosity path and affects oil recovery.
Figure 1: Stratigraphic column of the Tertiary synsedimentary formation of the study
area with emphasis on the lithological units of the Eocene Shahejie formation.1 is
cross-bedded Sandstone, 2 is mudstone, 3 is friable sand, 4 is medium grained well
sorted sand, 5 is dolomite, 6 is indurated sandstone, 7 is shale and 8 is graded
sandstone. (modified from Yinhuiet al., 2011)

92 Oluwatosin J. Rotimi et al
Figure 2: A hypothetical representation of sag structure with path of fluid and
sediment motion. This occurs as Alluvial fan environment on the continent while its
equivalent is the submarine canyons of the deep sea environment.
The third member of the Shahejie formation (Es3) consist of highly prolific source bed
having little terrigenous organic matter and Total Organic Carbon (TOC) content as
high as 9.19%, Rock-Eval S2 values of up to 63.08 mg HC/g rock. Hydrogen index of
this member is up to 1115 mg/g TOC signifying remarkable variation in organic
matter types (Haoet al., 2009;Gartrellet al., 2003). Expelled oil from within is injected
onto adjacent carrier reservoir bed within the same member and sealed by other
adjoining or overlying argillaceous units with competent sealing integrity. Structurally
induced instability of the area has cause leaking of oil through fault planes (Gartrellet al., 2003, 2006; Rotimi et al., 2014). Organic degradation of oil occurs within the
reservoir thereby reducing rate of loss of oil while more oil is being expelled onto the
carrier beds. This has the tendency to affect petrophysical properties towards
recovery. It confers heterogeneity and results in anisotropy of properties all around
the oil zone. Understanding the geometrical variation (anisotropy) of rock properties
is the main concern of this study.

Characterizing Geometrical Anisotropy of Petrophysical properties 93
Geology of Study Area In Liaohe oilfield, oil and gas exploration began in 1955. The oil flow from well Xin
1 in Liaohe basin revealed the oilfield on 9th September, 1969. As a result of
exploration over more than 30 years, 36 oilfields in various sizes have been found
with 19×108 tonne proven original-oil-in-place (OOIP) and 670×108 m3 original-gas-
in-place (OGIP). There have been 26 oilfields built up and developed and 9
production bases established, including Xinglongtai, Suguang, Huanxiling, Jinzhou,
Gaosheng, Shenyang, Ciyutuo, Lengjia and Kerbqin. Now, Liaohe oilfield has
established an annual oil production capacity of 1500×104 tonne (OilChina Company
Limited).Within the Liaohe depression is the study area Xinglongtai-majuanzi
structure located in the middle of western sag. The area approaches to panshan sag in
the west, Chenjia sag in the north, Qingshui sag in the south, and Lengdong sag,
which promote the formation of oil reservoir (Figure 2). Generally, there are six
recognized formations reserving hydrocarbon, they include; Archean group, Mesozoic
group, Shahejie group and Dongying group of Lower Tertiary of Cenozoic, Guantao
Group of Neogene system, Pingyuan group of Quaternary system. It is known that
proved geological reserves are 8239x104 tonne, and the oil-bearing area is 4.9km2.
Characteristics of major stratigraphical successions on the field and in the region are
also diverse with remarkable variation all across the sub-basins and from the
shoreface to the depocentre (Gong, 1997; Wu et al., 2003).
Methodology Sand tops and horizon interpretation workflow:
Suites of well logs from 6 exploration wells and SEGY 3D post-stack seismic data
obtained from Bohai bay, Northeastern China (Figures3 and 4) were used. Basic log
analysis with emphasis on computations for porosity, saturation, permeability and
impedances (acoustic and elastic) initiated well logs interpretation as shown in figure
5. Corrections were applied with the use of standard logs interpretation chart
(Schlumberger 2009). This ensures that errors associated with raw logs are filtered off
technically, thereby leaving plausible values representing true formation properties.
Hydrocarbon cut-off determination was done based on solving equation 1.
𝑅𝑡 = 𝑎𝑅𝑤
𝜑𝑡𝑚(1−𝑆ℎ𝑐)𝑛 (1)
Where Rt is the resistivity log value, Rw is the interstitial or mud-filtrate resistivity, a
is Archie’s factor, m is porosity exponent and n is the saturation exponent.
This requires Neutron-Density crossplot, Resistivity log and Archie’s exponents
amongst other log types. Hydrocarbon reservoir formation (sand tops) identification
was based on log signatures and petrophysical properties. Lateral identification of
sand tops was done on the seismic workflow through the identification of the
respective reflection pattern that characterizes the earlier picked sand tops from well
logs. These sand tops were tied to seismic data and 2 horizons S2 and S3 were
interpreted.

94 Oluwatosin J. Rotimi et al
Figure 3: Location of study area
Figure 4: Seismic volume with wells and correlation line as continuous black dotted line
Figure 5: Methodology flow chart

Characterizing Geometrical Anisotropy of Petrophysical properties 95
Tracing these sand top formations laterally on seismic data helped in generating the
respective horizons (S2 and S3) that appeared fairly continuous in reflection
amplitudes (Figure 6). They are marked as positive polarity events symmetrical about
the wavelet samples. Depth converting the horizons using check-shot data via velocity
modeling result allowed its use as casing boundaries for modeling. Computed seismic
signal based attribute resulted in clearer reflectors as they are truncated by faulted
regions (Ogiesoba and Eastwood, 2013). Structural spatial smoothing was done based
on the application of gaussian weighted filter. Dip guiding (i.e. cliff edge
enhancement) option was allowed in this process to accentuate the occurrence of
dipping beds and preserve them by marking discontinuities. The gaussian filter
applied operates as two half filters; an initial step of computing chaos attribute is done
to extract variations in amplitude strength continuity. The filter is then applied to the
one of the half segment with the highest semblance (lowest chaos) (Figures 7, 8 and
9). Hence edges of discontinuous amplitudes are enhanced. Consequently, contrast in
amplitude wavelet became a basis for laterally tracking horizons and eventually
defining the containment for simulation operations. Base horizon slope correction for
structural attitude continuity within the prograding structurally complex alluvial fan
environment made layering an easy step. Geological elements modeling employed the
use of formation thicknesses (true/vertical) in defining grid cell designation. Layering
followed the response of seismic reflection pattern and basement architecture that
influenced the subsurface lithological variations (continuity or truncations). This is
due to smoothness or ruggedness, stratigraphically or structurally induced. Similar
variations observed on log data are traced both lateral and vertical and was subject to
1D and 2D transformation prior to autocorrelation computation through variogram
analysis. Sequential indicator simulation was used for facies modeling to populate the
earlier non-partitioned casing built for the zone of interest. The continuous logs
upscaled into the simulation case were used as inputinto the sequential gaussian
simulation algorithms. This made possible multiple equiprobable realization of the
property volume as randomly generated seed number was used for the modeling
operation.
Figure 6: Faults and horizon interpreted seismic line 2125

96 Oluwatosin J. Rotimi et al
Figure 7: Original amplitude seismic data (line 2125) before applying structural
processing via Petrel attribute library
Figure 8: Same seismic line 2125 as in figure 7 after dip guiding edge enhancing
structural attribute computation. Faults are seen and defined clearly on this result line.
Figure 9: Time slice (A) from figure 7 and (B) from figure 8. Clearer depositional
pattern is observed on (B) than (A)
Characterizing Geometrical Anisotropy of Petrophysical properties 97
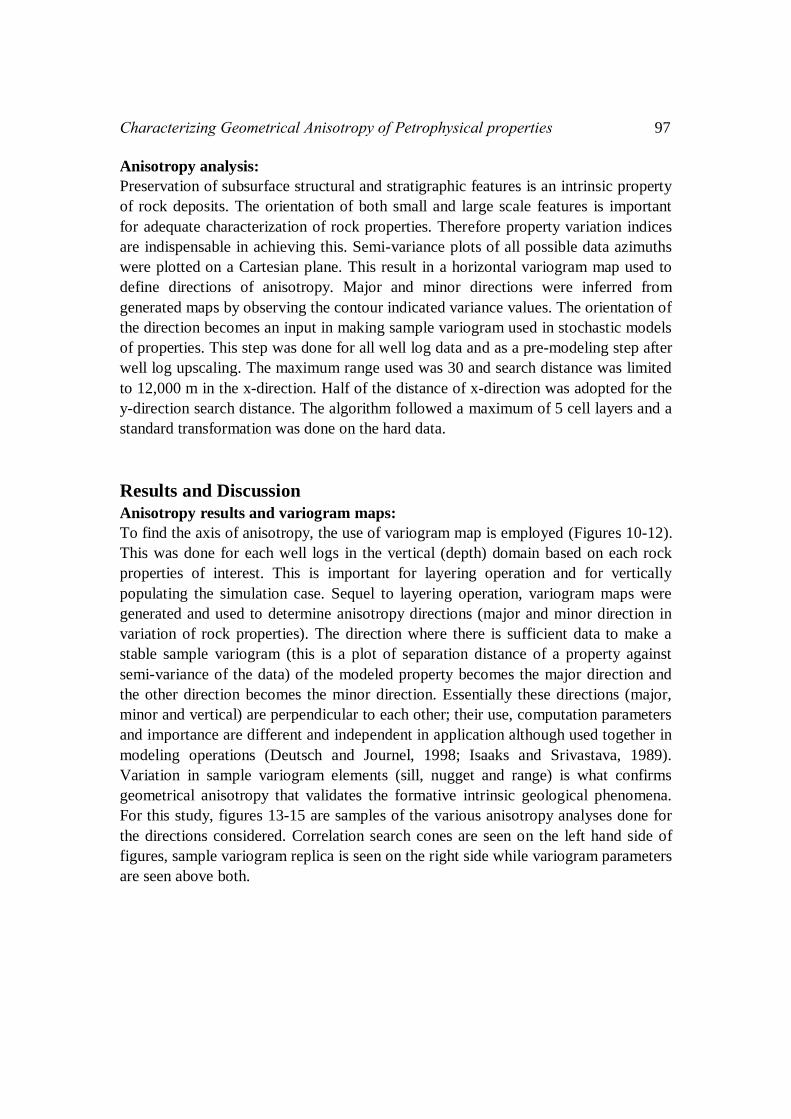
Anisotropy analysis:
Preservation of subsurface structural and stratigraphic features is an intrinsic property
of rock deposits. The orientation of both small and large scale features is important
for adequate characterization of rock properties. Therefore property variation indices
are indispensable in achieving this. Semi-variance plots of all possible data azimuths
were plotted on a Cartesian plane. This result in a horizontal variogram map used to
define directions of anisotropy. Major and minor directions were inferred from
generated maps by observing the contour indicated variance values. The orientation of
the direction becomes an input in making sample variogram used in stochastic models
of properties. This step was done for all well log data and as a pre-modeling step after
well log upscaling. The maximum range used was 30 and search distance was limited
to 12,000 m in the x-direction. Half of the distance of x-direction was adopted for the
y-direction search distance. The algorithm followed a maximum of 5 cell layers and a
standard transformation was done on the hard data.
Results and Discussion
Anisotropy results and variogram maps:
To find the axis of anisotropy, the use of variogram map is employed (Figures 10-12).
This was done for each well logs in the vertical (depth) domain based on each rock
properties of interest. This is important for layering operation and for vertically
populating the simulation case. Sequel to layering operation, variogram maps were
generated and used to determine anisotropy directions (major and minor direction in
variation of rock properties). The direction where there is sufficient data to make a
stable sample variogram (this is a plot of separation distance of a property against
semi-variance of the data) of the modeled property becomes the major direction and
the other direction becomes the minor direction. Essentially these directions (major,
minor and vertical) are perpendicular to each other; their use, computation parameters
and importance are different and independent in application although used together in
modeling operations (Deutsch and Journel, 1998; Isaaks and Srivastava, 1989).
Variation in sample variogram elements (sill, nugget and range) is what confirms
geometrical anisotropy that validates the formative intrinsic geological phenomena.
For this study, figures 13-15 are samples of the various anisotropy analyses done for
the directions considered. Correlation search cones are seen on the left hand side of
figures, sample variogram replica is seen on the right side while variogram parameters
are seen above both.

98 Oluwatosin J. Rotimi et al
Figure 10: A typical variogram map for porosity data
Figure 11: A typical variogram map for permeability data
Figure 12: A typical variogram map for volume of shale data

Characterizing Geometrical Anisotropy of Petrophysical properties 99
Experimental variograms were computed before making the final variogram function
on the autocorrelation spatial dependency for properties analyzed. Results from
variogram data analysis gave different directions for the discrete and continuous log
data. More variation was observed in the various properties modeled because the
major direction was different for all rock properties. This also reflected in the
autocorrelation process computed from the variogram analysis. The spherical
variogram (Figure 16) and the variations observed on the petrophysical models for the
zone of interest seem appropriate for the depositional environment. This is observed
on the result of surfaces rendered to know variations in properties with lithofacies
models. The middle Shahejie deposits are actually heterogeneous continuous
lithological units; they are fairly consolidated lithofacies having intervals of sandy
and shaly sequences within a hydrocarbon prolific zone that is probably structurally
active (Figure 16).
Figure 13: Data analysis panel for major direction
Figure 14: Data analysis panel for minor direction

100 Oluwatosin J. Rotimi et al
Figure 15: Data analysis panel for vertical direction
Figure 16: Above-Heterogeneous and continuous nature of the middle Shahejie
formation from a combination of facies simulation well logs and seismic data. Below-
Experimental variogram computed for the data analysis to observe semivariance all-
round the study area.
The anisotropic analysis made it possible to infer continuity and heterogeneity of rock
units on hard data (well logs) from rock properties. Evaluating variation of log
properties from one location to another vertically and laterally by transforms and
auto-correlation coefficients made this possible. This was restricted to the vicinity of
oil zone having promising petrophysical properties. The bandwidths and range values

Characterizing Geometrical Anisotropy of Petrophysical properties 101
chosen for variogram modeling accounted for the semi-variance between lateral
locations of properties. Variogram maps showed northeast-southwest (NE-SW) major
direction and minor direction perpendicular to it. This shows semivariance of rock
properties located on wells at different levels, thus value dissimilarity on adjacent
wells well handled. It resulted into models that have connectivity in properties seen on
adjacent wells. Cells designation before and after simulation did well in predicting
locations for replicated values as the algorithm progresses successfully to populate the
case. Properties projected on intersection/correlation sections on Figure 17 established
occurrences of both facies and rock properties at various locations beyond their
primary domain as influenced by the various simulation and modeling parameters
adopted.
Structural pattern interpretation: Normal and reverse faults truncates the continuity of rock units on all rock properties
modeled on both sides of the fault blocks which form as fault echelons (Figure 18) all
round the Northeast-Southwest portion of the field. Some faults were delineated based
on subtle reflection discontinuity, marked vertical displacement of adjacent reflection
bands shown by abrupt terminations and some by reflection event pattern change
across faults (Figure 18). The latter characterized the dipping portion of the area. With
the well to well proximity (well offset distance) limited to 300 m taken into
consideration, the possibility of estimating occurrences of lithofacies and rock
properties was adequately achieved with success both for the inter-well position and
also in predicting beyond well location.
Figure 17: Occurrence of facies and rock properties on intersection plane from
correlation line

102 Oluwatosin J. Rotimi et al
Figure 18: Arbitrary omni-directional fault arrangements characteristic of the area
Lithofacies of this hydrocarbon saturated zone are dipping beds characterized by
parallel dipping to sigmoidal reflection patterns on seismic data (Figure 18). Seismic
intersection projection of a correlation line shows discontinuous lithofacies on the up-
dip portion but a bit continuous in the upper part of the middle portion around wells
62 and 45 (Figure 17). The mixed lithology and rumpled nature of the rock units is
observed first on the variations in polarity changing reflection events and amplitude
contrast. This is the prevalent pattern amidst the bumpy structural basement
architecture mapped on the area (Figure 19).
Lithofacies continuity is rather brief in locations predicted between wells m45 and
m54. Sand-shale continuity is obvious between wells m32 and m62. High and low
amplitude reflections seen amidst Vsh values confirm the randomness of the Shahejie
parallic turbidite deposit and the unconsolidated nature of this hydrocarbon bearing
zone. The percentage of shale in the section varies laterally across the zone from one
well to another. Half of the section (western portion) has shale value on the average
between 30% and 50% forming a more homogeneous mix with the reservoir units.
The reservoir sand observed below 2400 m on and around well m54 occurs as
disseminated bodies. This pithy geobodies appear massive and encapsulated on the
facies cross-section around and particularly between wells m45 and m54 (Figures17
and 19).

Characterizing Geometrical Anisotropy of Petrophysical properties 103
Figure 19: Variation in rock properties against faults. Continuity of properties is seen
on both sides of the fault planes
Stratigraphy pattern and lateral continuity on cross-sections:
On well logs correlation panel, stratigraphic patterns range from progradational to
retrogradational with most aggradational patterns consisting of mixed interbeded
highly porous but fairly permeability shale and silty sand units (Figure 20). Permeable
shale is prolific in the area; this is probably because of the poorly consolidated nature
of the deposits (Figure 21 and 22). Some units on well logs exhibit blocky pattern
with serrated edges. Other fairly diagnostic signatures amidst brief coarsening upward
and fining upward lithofacies sequences occurs between some depths (2370m – 2480
m on well m32; 2670 m – 2840 m on well m62) as seen on figure 20. These units
appear as fairly continuous reflection patterns on vintage seismic data characterized
by inconsistent abrupt terminations. These terminations occur against fault planes that
numerously separates trending reflections (Figure 19). Stacks of trending reflection
patterns experiences pull down by gravity drag on the dipping distal portion.
Characterizing this was basically from trace wavelet polarity reversal and attenuation
of amplitude strength. Lithofacies representation for this is clearly shown on cross
sections produced from facies model (Figure 23). The wells studied were overlaid on
the section with volume of shale as the intersection log property.
In the vicinity of the wells along a correlation line, assessing hydrocarbon saturation
against porosity and permeability of rock units shows porous and permeable
lithofacies stacks dipping at about 350 Southeast about well m32 (Figure 23).The
volume of shale associated with the reservoir rocks of interest reduced down dip
towards the toe of the depression. Fluid flow down slope is inevitable in this situation.
The likelihood of fluid retention or trapping may be hampered by the altitude and
obviously influenced by prevalent structures. This makes porosity and permeability

104 Oluwatosin J. Rotimi et al
vary with level of occurrence of different rock types and towards the edge possess
spurious values. This validates the effect of geometrical anisotropy analysis done on
well log data including petrophysical property logs.
Figure 20: Correlation panel for 4 wells. Sand and shale sequences are seen. The
shale units are seen to be quite permeable but impregnated oil not producible with
natural drive. Permeability is on track 3. See figure 4 for location of correlation line
Figure 21: Section of well logs showing portions with high value of shale

Characterizing Geometrical Anisotropy of Petrophysical properties 105
Figure 22: Petrophysical interpretation panel for well m32. Note the lithology mix of
silty sand and shale in the last track (lithology)
Figure 23: Petrophysical interpretation panel for well m32. Note the lithology mix of
silty sand and shale in the last track (lithology)

106 Oluwatosin J. Rotimi et al
Reservoir rock fluid properties:
Sandstone reservoir units traced laterally range in thickness between 0.3m and about
130m. On all wells, there are condensed sand unit in the middle and towards the base
(between 2378 m and 2490 m on well m32). Above it is a thick non-hydrocarbon
bearing formation, and towards the top are other reservoir units of smaller
thicknesses. The reservoir sand unit between 2248 m and 2268 m has average porosity
value of 0.15. All reservoir sand units in the lower, middle and upper portions of the
well extend laterally to the next well 45. This lateral continuity grades into
interfingering of brief and thin sand and shale sequences with varying depths. Their
porosity is between 0.14 and 0.25 (Figures 17, 19, 20, 21, 22 and 23). A different
lithofacies arrangement is observed on the most distal well m54. The middle portion
has massive reservoir unit with fewer intermittent occurrence of shale formations.
This region is observed to be the most hydrocarbon prolific with porosity of above
0.18 and permeability of more than 4mD. The lithofacies pattern on well 62 is more
of graded sand and shale units. This well is in the proximal end of the block, the
reservoir sand unit occurs in massive deposit of about 60 m between 2810 m and 2870
m. Other portions are also consistent with average porosity of 0.14 and appreciable
hydrocarbon saturation (Figures 17, 19 and 22). Common porosity value for these
sandstone units is in the range 0.1 to 0.25; the permeability observed is between 1 and
2.2mD. The volume of shale values is between the range of 0.2 and 0.4 for the sand
zones.
A collective assessment of properties and potentials of the zone for hydrocarbon
accumulation is seen on a group of some subsurface maps produced from seismic
attribute computations and results of rock property model simulations (figure 24).
Root mean square (RMS) amplitude, instantaneous amplitude (reflection strength)
both show gathers of reflection intensity in the vicinity of wells studied. Seismic
attribute maps generated shows realistic variation of rock properties from the analysis
of the subsurface reflection events. Other maps show distribution of porosity and
permeability. This two rock property has given a good match with the lithofacies
distribution on the area with well. Patterns indexed by peak amplitude values on maps
are clearly mimicked by the concentration of porosity in like manner around well
points in response to geometrical anisotropy analysis. Lateral variation on
permeability map follow a fairly uniform lithofacies distribution pattern within the
stratigraphic attitude. This complements the porosity and seismic attribute map
patterns (Figure 24).

Characterizing Geometrical Anisotropy of Petrophysical properties 107
Figure 24: Maps of rock and fluid properties for the area. This is captures between
horizons S2 and S3. Lateral variations in properties are seen in locations around and
beyond well points
Acoustic impedance simulated surface shown in figures 17 and 24 adequately
characterized the lithofacies distribution shown in the facies model surface. This
clearly defines the units designated sand as porous and also indicating same as having
adequate permeability both laterally and vertically.
Conclusion Geometrical anisotropy analysis has been considered in understanding prevalent
variation in petrophysical and rock properties using well logs and seismic data. This
entails computation of both horizontal and vertical autocorrelation coefficient as main
input in modeling operations. Different stochastic algorithms and property collocation
modeling with the a priori based on the autocorrelation tendencies of the pre-
simulated rock properties has been done. Geometric prediction done resulted in both
interpolation and extrapolation of rock properties as an estimate that was initiated
from temporal log data upscaled and allowed to be distributed stochastically. The
non-simbox modeling approach is appropriate for characterizing deposits in terrains
with similar geology and depositional environment. Observed variations are
essentially stratigraphy induced but structurally controlled. It has application in
reserve evaluation when properly done and adequately integrated with production data

108 Oluwatosin J. Rotimi et al
to examine and determine hydrocarbon and recovery potential for unconventional
reserves. It is also a good method for defining stratigraphic continuity and tracing the
distribution of rock properties within an area of interest.
Acknowledgement TWAS-CAS is appreciated for study fellowship granted for this work, we also thank
IGGCAS and Covenant University for their support in the course of this study. Liaohe
oil field is appreciated for the release of data and permission to publish. The China
Ministry of Science and Technology is appreciated for the equipment donation made
available for this research under the CASTEP scheme.
References
[1] Agrawal, A., Wei, Y., and Holditch, S. A., 2012. A technical and economic
study of completion techniques in five emerging US gas shales: A Woodford
Shale example. SPE, 27, 39-49. doi: 10.2118/135396
[2] Biondi, B., Mavko, G., Mukerji, T., Rickett, J., Lumley, D., Deutsch, C.,
Gundeso, R. and Thiele, M., 1998.Reservoir Monitoring: A Multidisciplinary
feasibility study: The Leading Edge, 17, pp 1404-1414.
[3] Boyer, C., Kieschnick, J., Suarez-Rivera, R., Lewis, R. E., and Waters, G.,
2006.Producing gas from its source: Oilfield review/ Schlumberger, 36-49.
[4] Caers, J., 2000.Modeling facies distributions from seismic using neural nets,
Stanford Center for Reservoir Forecasting Annual Report, 1(13), 1-30
[5] Caers, J., 2002.History matching under training-image based geological model
constraints, Stanford Center for Reservoir Forecasting Annual Report, 1(15),
1-19
[6] Cipolla, C., Lewis, R., Maxwell, S., and Mack, M., 2011a. Appraising
unconventional resource plays: Separating reservoir quality from completion
effectiveness: International Petroleum Technology Conference, Paper IPTC
14677.
[7] Clayton V. Deutsch, Andre G. Journel 1998. GSLIB Geostatistical Software
Library and User's Guide, Second Edition.
[8] Edward H. Isaaks, R. Mohan Srivastava 1989.An Introduction to Applied
Geostatistics. Oxford University Press, New York, p. 561.
[9] Goodway, B., 2001.AVO and Lame constant for rock parameterization and
fluid detection. CSEG Recorder, 26(6), 39-60
[10] Gong Z. S., 1997.Giant offshore oil and gas fields in China, Beijing.Petroleum Industry press,pp.396.
[11] Hao F., and J. Y. Chen, 1992.The cause and Mechanism of vitrinite
reflectance anomalies.Journal of Petroleum Geology, 15, 419-434
[12] Hao F., J. Y. Chen and Y. Z. Liu, 1993. Application of organic facies studies
to sedimentary basin analysis-A case study from Yitonggraben, China.
Organic Chemistry,20, 27-43
Characterizing Geometrical Anisotropy of Petrophysical properties 109
[13] Hao F., Zhou X., Zhu Y., Bao X., and Yang Y., 2009.Charging of the
NeogenePenglai 19-3 field, Bohai Bay Basin, China: Oil accumulation in a
young trap in an active fault zone.AAPG Bulletin. 93(2), 155-179.
[14] James, H., Tellez M., Schaetzlein, G., and Stark, J., 1994.Geophysical
Interpretation from Bits and Bytes to the Big Picture.Oil Field Review, 7, 23–
31.
[15] Journel, A. G., 1997.Deterministic geostatistics: a new visit, in Baffi, E. and
Shofield N. eds., Geostatistics-Wollongong, 1, Kluwer Academic Press,
Dordrecht, pp. 174-187.
[16] Journel, A. G., 2002.Combining knowledge from diverse information sources:
an alternative to Bayesian analysis, Journal of Mathematical Geology.pp 639
[17] Lash, G., and Engelder, T., 2011. Thickness trends and sequence stratigraphy
of the middle Devonian Marcellus Formation, Appalachian Basin: Implication
for Acadian foreland basin evolution. AAPG Bulletin, 95, 61-103, doi:
1306/06301009150
[18] Marfurt, K. J., 2006. Seismic attribute mapping of structure and stratigraphy:
Distinguish instructor short course series, SEG, 268.
[19] Ogiesoba, O. C., and Eastwood, R., 2013. Seismic attribute analysis for shale
gas/oil within the Austin Chalk and Eagle Ford Shale in a submarine volcanic
terrain, Maverick Basin, South Texas. Interpretation, 1(2), SB61-SB83.
[20] Rotimi O. J., Ako B. D., Zhenli W., 2014.Application of Rock and Seismic
Properties for Prediction of Hydrocarbon Potential. Journal of Petroleum &
Coal 56 (1), 40-53.
[21] Strebelle, S., 2000.Sequential simulation drawing structure from training
images.Unpublished PhD Thesis, Stanford University, Stanford, CA, USA.
140p
[22] Strebelle, S., 2002.Conditional simulation of complex geological structures
using multiplepoint statistics.Mathematical Geology, 34, 1-22.
[23] Wu, L., H. M., Xu and J. H. Cheng, 2006.Evolution of sedimentary system
and analysis of sedimentary source in paleogene of the Bozhong sag, Bohai
Bay (in Chinese with English abstract).Marine Geology and Quartenary Geology, 26, 81-88.
[24] Ye, F., 2010. Anisotropy of the Bakken Formation, East Williston Basin,
North Dakota: Presented at the UT-Austin Edger Forum
[25] Yinhui, Z., Nansheng, Q., Yuan, Z., Cuicui, L., Jianping, L., Yonghua, G., and
Xiongqi, P., 2011.Geothermal regime and hydrocarbon kitchen evolution of
the offshore Bohai Bay Basin, North China.AAPG Bulletin, 95(5), 749–769

110 Oluwatosin J. Rotimi et al