Characterizing Formaldehyde Emissions from Home … · Characterizing Formaldehyde Emissions from...
97
Characterizing Formaldehyde Emissions from Home Central Heating and Air Conditioning Filters Final Report: Contract No. 14-303 Prepared for the California Air Resources Board and the California Environmental Protection Agency Research Division PO Box 2815 Sacramento CA 95812 Prepared by: Hugo Destaillats (principal investigator), Marion L. Russell and William J. Fisk Indoor Environment Group Energy Analysis and Environmental Impacts Division Energy Technologies Area Lawrence Berkeley National Laboratory 1 Cyclotron Road Berkeley, CA 94720 February 2018
Transcript of Characterizing Formaldehyde Emissions from Home … · Characterizing Formaldehyde Emissions from...
Characterizing Formaldehyde Emissions from Home
Central Heating and Air Conditioning Filters
Final Report: Contract No. 14-303
Prepared for the California Air Resources Board and the California Environmental Protection Agency
Research Division PO Box 2815
Sacramento CA 95812
Prepared by: Hugo Destaillats (principal investigator),
Marion L. Russell and William J. Fisk
Indoor Environment Group
Energy Analysis and Environmental Impacts Division Energy Technologies Area
Lawrence Berkeley National Laboratory 1 Cyclotron Road
Berkeley, CA 94720
February 2018

Formaldehyde emissions from residential HVAC filters Final Report
ii
Disclaimer The statements and conclusions in this Report are those of the contractor and not necessarily those of the California Air Resources Board. The mention of commercial products, their source, or their use in connection with material reported herein is not to be construed as actual or implied endorsement of such products.
Formaldehyde emissions from residential HVAC filters Final Report
iii
Acknowledgments The authors thank Peggy Jenkins and Qunfang (Zoe) Zhang of the Research Division of the Air Resources Board for their input, review and effective technical management of this project. We also acknowledge valuable suggestions from Dr. Brett Singer (LBNL), and the experimental contributions of Toshifumi Hotchi. We also thank Technical Advisors Dr. Wenhao Chen, Mr. Thomas Justice, Prof. Thomas Kuehn, Dr. Drew Williams and Mr. Harinder Singh for their input on filter selection and experimental conditions. We are particularly appreciative of Mr. Justice’s contribution of specimens to be tested and of Dr. Chen’s review of this Final Report. This report was submitted in fulfillment of Contract 14-303, “Reducing Formaldehyde Emissions from Home Central Heating and Air Conditioning Filters” by the Lawrence Berkeley National Laboratory, under the sponsorship of the California Air Resources Board. Work was completed as of December 18, 2017.
Formaldehyde emissions from residential HVAC filters Final Report
iv
Table of Contents List of Figures ........................................................................................................................... vi
List of Tables ............................................................................................................................ viii
Abstract ..................................................................................................................................... ix
Executive Summary ................................................................................................................... x
Background .......................................................................................................................... x Objectives and Methods ....................................................................................................... x Results ................................................................................................................................ xi Conclusions........................................................................................................................ xii
1. INTRODUCTION ................................................................................................................... 1
1.1. Fiberglass filters as a source of formaldehyde .............................................................. 2
1.2. Goals and scope of the study ........................................................................................ 6
MATERIALS AND METHODS .................................................................................................. 8
2. SELECTION AND PROCUREMENT OF RESIDENTIAL FILTERS USED IN THIS STUDY . 9
2.1. Development of selection criteria .................................................................................. 9
2.2. Criteria used for filter selection ...................................................................................... 9
2.3. Filters selected ............................................................................................................ 10
3. PRELIMINARY AND BENCH-SCALE CHAMBER TESTS .................................................. 13
3.1. Preliminary tests .......................................................................................................... 13
3.2. Bench-scale experimental chamber ............................................................................ 15
3.3. Analytical methods for formaldehyde .......................................................................... 19
3.4. Environmental monitoring, data logging and processing ............................................ 19
4. ROOM-SIZED CHAMBER TESTS ...................................................................................... 21
4.1. Room-sized environmental chamber tests .................................................................. 21
4.2. Formaldehyde sampling and analysis ......................................................................... 27
4.3. Environmental monitoring, data logging and processing ............................................ 27
4.4. Determination of emission rate, modeling of indoor formaldehyde concentrations ..... 27
4.5. Quality assurance / quality control .............................................................................. 27
RESULTS AND DISCUSSION ............................................................................................... 29
Formaldehyde emissions from residential HVAC filters Final Report
v
5. BENCH SCALE CHARACTERIZATION OF FILTER EMISSIONS ...................................... 30
5.1. Preliminary tests .......................................................................................................... 30
5.2. Determination of emission rates from newly-purchased filters .................................... 32
5.3. Formaldehyde emissions from aged filters ................................................................. 37
5.4. Formaldehyde emissions from different filter components (media vs frame) .............. 37
6. CHARACTERIZATION OF FORMALDEHYDE EMISSIONS IN ROOM-SIZE TEST CHAMBER ............................................................................................................................... 40
6.1. Determination of chamber formaldehyde concentrations ............................................ 40
6.2. Determination of formaldehyde emission rates with room-sized chamber .................. 43
7. EVALUATING THE IMPACTS OF FIBERGLASS FILTERS ON INDOOR AIR QUALITY ... 48
7.1. Comparison of emission rates between bench scale and room-sized chamber tests 48
7.2. Comparison with other formaldehyde sources ............................................................ 49
7.3. Predicted contributions to indoor formaldehyde levels in CA homes and evaluation of the associated impacts on occupant health ....................................................................... 50
7.4. Predicted effects in different climate zones in California ............................................. 57
8. SUMMARY, CONCLUSIONS AND RECOMMENDATIONS ............................................... 66
References ............................................................................................................................... 68
List of Publications Generated by this Study ........................................................................... 72
Glossary of Terms, Abbreviations and Symbols ...................................................................... 73
APPENDICES .......................................................................................................................... 75
APPENDIX 1. Degree days, average temperature and relative humidity in selected locations at different California climate zones ............................................................................................. 76

Formaldehyde emissions from residential HVAC filters Final Report
vi
List of Figures
Figure 1.1.1: A possible mechanism of reversible hydrolytic depolymerization of urea - formaldehyde resin leading to the release of free formaldehyde
4
Figure 3.1.1. Experimental setup used in preliminary tests 14
Figure 3.2.1. Experimental setup used in bench-scale tests 17
Figure 3.2.2: Illustration of bench-scale test chamber 18
Figure 4.1.1: Experimental setup used in room-sized chamber tests 24
Figure 4.1.2: Exterior of room-sized chamber and recirculation loop 25
Figure 4.1.3: Interior of room-sized chamber 26
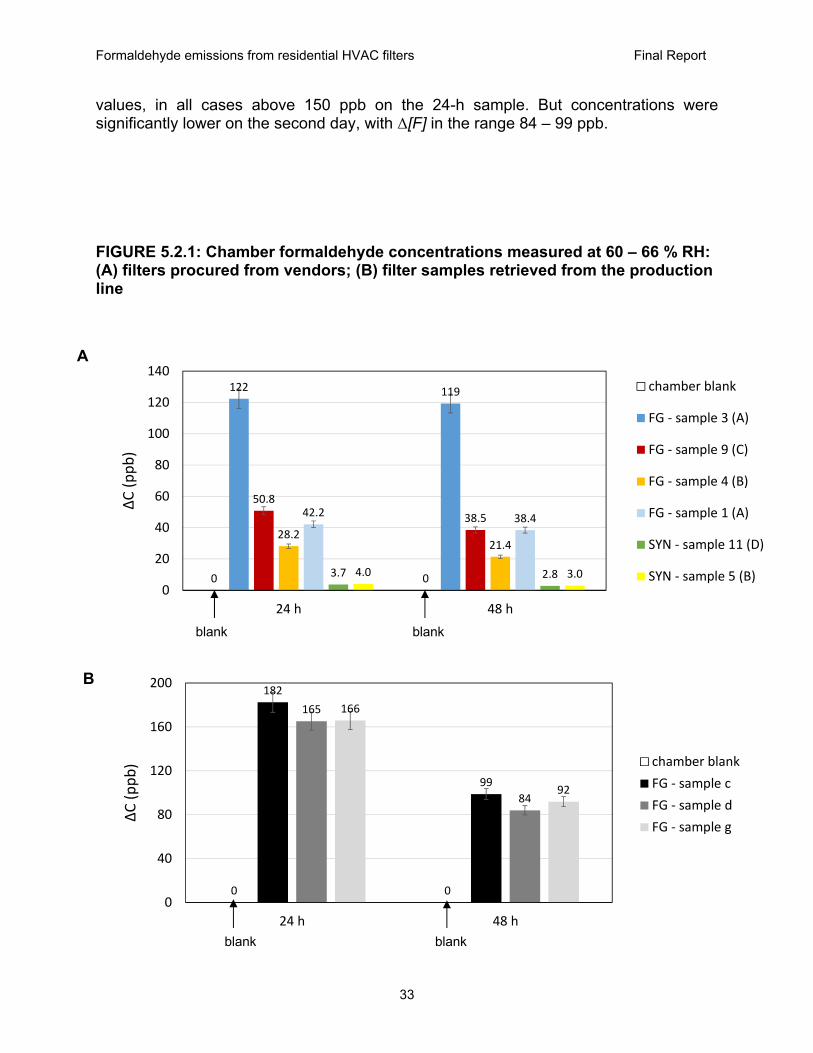
Figure 5.2.1: Chamber formaldehyde concentrations measured at 60 – 66 % RH: (A) filters obtained from retailers; (B) fiberglass filter samples from production line
33
Figure 5.2.2: Relative reduction in formaldehyde concentration change at 60 – 66 % RH between samples collected at 24 and 48 hours ((A) filters obtained from retailers; (B) fiberglass filter samples from production line
34
Figure 5.3.1: Changes in chamber formaldehyde concentrations measured at different times and relative humidity values for three different fiberglass filters
38
Figure 5.4.1: Changes in chamber formaldehyde concentrations measured for different filter components at 63 – 64 % RH
39
Figure 6.1.1: Chamber formaldehyde concentration measured under moderate (36 – 46 %) and high (68 – 72%) relative humidity operating at two recirculation rates: 400 cfm (striped bars) and 1000 cfm (solid bars)
41
Figure 6.1.2: Additional formaldehyde concentration measurements performed for two fiberglass filters at high (69 – 72%) relative humidity, operating at 1000 cfm
42
Figure 6.2.1: Difference in formaldehyde concentrations measured simultaneously upstream and downstream of the filter
45
Figure 6.2.2: Emission rates determined at moderate (36 – 46 %) relative humidity 46
Figure 6.2.3: Emission rates determined at high (68 – 72 %) relative humidity 47
Figure 7.1.1: Formaldehyde emission rates determined in this study in bench-scale chamber tests (low face velocity, left) and in room-sized chamber tests (high face velocity, right)
48

Formaldehyde emissions from residential HVAC filters Final Report
vii
Figure 7.2.1: Formaldehyde emission rates reported in the literature 50
Figure 7.3.1: Formaldehyde concentrations predicted in the house ARB 1 54
Figure 7.3.2: Formaldehyde concentrations predicted in the house ARB 2 55
Figure 7.3.3: Formaldehyde concentrations predicted in the house ARB 3 56
Figure 7.4.1: Correlation between the fraction of time during which the HVAC is operating and the temperature differential between outdoor air and the thermostat setting (adapted from Logue et al, 2012). The data represent old homes (blue), new homes (red) and the average (black).
57
Figure 7.4.2: Locations in which the HVAC duty cycle was evaluated, at eight California climate zones (CZ). Adapted from PG&E, 2017
58
Figure 7.4.3: Psychrometric chart indicating predicted changes in relative humidity associated with heating outdoor air from the corresponding January average values for each city to the thermostat setting of 65 F.
61
Figure 7.4.4: Increase in formaldehyde concentration expected when a 18” x 12” fiberglass filter is used in the ARB 1 home with four occupants, an air exchange of 0.2 h-1 and a thermostat setting of 65 F (winter conditions)
64
Figure 7.4.5: Increase in formaldehyde concentration expected when two fiberglass filters of 12” x 24” and 24” x 24” are used in the ARB 2 home with four occupants, an air exchange of 0.2 h-1 and a thermostat setting of 65 F (winter conditions)
65
Figure A.1.1. Climate Zone 1: Eureka 76
Figure A.1.2. Climate Zone 3: San Francisco 77
Figure A.1.3. Climate Zone 6: Los Angeles (coastal) 78
Figure A.1.4. Climate Zone 10: Riverside 79
Figure A.1.5. Climate Zone 12: Stockton 80
Figure A.1.6: Climate Zone 13: Fresno 81
Figure A.1.7. Climate Zone 15: Browley 82
Figure A.1.8. Climate Zone 16: Bishop 83

Formaldehyde emissions from residential HVAC filters Final Report
viii
List of Tables
Table 1.1.1: Indoor and outdoor temperature and relative humidity reported for California homes and for US homes located in three different IECC climate zones
5
Table 2.1.1: Filters purchased from on-line retailers 11
Table 2.1.2: Fiberglass filter samples retrieved from the production line, used in this study 12
Table 3.2.1: Filters used in bench-scale chamber tests 16
Table 3.4.1: Inter-comparison of RH sensors 20
Table 4.1.1: Filters used in room-sized chamber tests 23
Table 5.1.1: Results of preliminary tests carried out with filters obtained from retailers 30
Table 5.1.2: Results of preliminary tests carried out on additional fiberglass filter samples 31
Table 5.2.1: Change in formaldehyde chamber concentration and emission rates determined at 60 – 66 %RH
36
Table 5.2.2: Change in formaldehyde chamber concentration and emission rates determined at 32 – 34 % RH
36
Table 7.3.1: Determination of the ratio Φ in three reference homes 51
Table 7.3.2: Scenarios selected to model indoor formaldehyde concentrations derived from residential fiberglass filter emissions
53
Table 7.4.1: Extreme and mean monthly temperatures in eight cities corresponding to different CA climate zones during the peak heating and cooling seasons, and the corresponding fraction of time of HVAC operation
59
Table 7.4.2: Contribution of key residential moisture sources estimated for a family of four members (adapted from Trechsel et al, 1994)
62
Table 7.4.3: Indoor relative humidity associated with residential moisture sources 62
Formaldehyde emissions from residential HVAC filters Final Report
ix
Abstract Formaldehyde is a carcinogen and a strong irritant. Residential fiberglass particle filters produce formaldehyde upon decomposition of polymeric additives. This study assessed formaldehyde emissions from residential fiberglass filters relative to synthetic filters, and estimated their contributions to indoor concentrations in California homes. Emission rates were determined for several filters at moderate (33 – 40 %) and elevated (62 – 72 %) relative humidity, and two different flow rates 680 – 1700 m3 h-1 (400 and 1000 cfm). Emission rates from fiberglass filters under moderate RH were between 60 and 240 µg h-1 m-2. At high RH, emission rates from the same filters increased to 500 – 3500 µg h-1 m-2, but from synthetic filters were only 100 – 120 µg h-1 m-2. Great variability in emissions was observed; the length of storage appeared to be the primary factor reducing emissions over time. Both the core filtration media and the glued frame emitted comparable amounts. Contributions to indoor formaldehyde concentrations were predicted for homes of different sizes, with different air exchange rates, using different filter sizes, and in different climate zones. In most conditions, contributions to indoor levels were very small. However, in certain conditions (e.g., an 800 ft2 apartment with a 18”x12” fiberglass filter, 0.2 air exchanges per hour during winter), fiberglass filters increased indoor formaldehyde by 2.5 – 9.3 ppb, sometimes exceeding the California chronic reference exposure level and Proposition 65 no significant risk levels.

Formaldehyde emissions from residential HVAC filters Final Report
x
Executive Summary Background Formaldehyde has been classified as a known human carcinogen by the World Health Organization (WHO)’s International Agency for Research on Cancer and was designated as a toxic air contaminant (TAC) in California by the California Air Resources Board (CARB), with no safe level of exposure. The State of California’s Office of Environmental Health Hazard Assessment (OEHHA) has established relatively low reference exposure levels for chronic (9 g m-3, or 7 ppb) and acute (55 g m-3, or 44 ppb) health effects of formaldehyde. In addition, California’s Safe Drinking Water and Toxic Enforcement Act (“Proposition 65”) lists formaldehyde among other chemicals known to cause cancer, birth defects or other reproductive harm. Based on its cancer risk, it proposes a No Significant Risk Level (NSRL) of 40 µg day-1. Multiple indoor sources contribute to formaldehyde levels that often exceed these guidelines in residences. For example, composite wood products containing urea-formaldehyde resins have been identified as one of the major sources, and have been included in recent regulatory action to limit those emissions. There are many other indoor sources of formaldehyde present in residences, other than composite wood products, which need to be assessed and mitigated in order to effectively reduce occupant exposures to indoor formaldehyde. Various studies have shown that emissions from heating, air conditioning and ventilation (HVAC) filters can be substantial sources of formaldehyde and other pollutants. Studies previously performed at Lawrence Berkeley National Laboratory (LBNL) suggested that the reaction of binders and/or additives present in fiberglass filter media with water vapor and liquid water condensing on the filter surfaces can be a substantial source of formaldehyde through the hydrolysis of formaldehyde-based polymers present on the filter surfaces. Additives such as binders, adhesives and tackifiers are present as coatings on filter fibers to preserve their integrity or increase particle retention. In addition, glues are used to attach the filtration media to the frame. Hence, fiberglass particle filters in central heating and air conditioning systems may be a source of indoor formaldehyde. Such effects were not observed when filters made of synthetic fibers (such as polyester) were used.
Objectives and Methods This study was aimed at quantifying the contributions of residential fiberglass filters to indoor formaldehyde concentrations under a variety of conditions found in California homes, relative to a low-emitting reference, synthetic filters. The contribution of HVAC filter media as a formaldehyde source was assessed in relative terms with respect to known major indoor sources. Filters available from retailers were selected in consultation with ARB, purchased from online vendors and tested in the laboratory. In addition, fiberglass filter samples retrieved from the production line were also tested. Laboratory methods were developed to characterize formaldehyde emissions. An initial preliminary test using a small section of the filtration media was used to evaluate emissions from a large number of fiberglass filters (15 units, comprising 6 from retailers and 9 specimens retrieved from the production line) and synthetic filters (5 units). A

Formaldehyde emissions from residential HVAC filters Final Report
xi
subset of both types of filters was investigated in a bench-scale chamber test that used entire filters at a relatively low air flow rate of 0.3 m3 h-1, corresponding to an equivalent face velocity of 0.02 cm s-1. Seven fiberglass filters (4 from retailers and 3 from the production line) and two synthetic filters were used in bench-scale tests. A smaller subset consisting of three fiberglass and one synthetic filter was subsequently tested in a room-sized chamber setup in which filters were exposed to more realistic airflow conditions of 680 – 1700 m3 h-1 (400 – 1000 cfm), corresponding to a face velocity of 0.5 to 1.3 m s-1. In both bench-scale and room-sized chambers, fiberglass and synthetic filters were exposed to either moderate (33 – 40%) or elevated (62 – 72%) RH conditions at room temperature. Additional tests were carried out in the bench-scale chamber at high RH to assess emissions from the two main components of the filter: the core filtration media vs. the glued cardboard frame. In all experiments, formaldehyde concentration was measured simultaneously upstream and downstream of the filter (or filter media) by collecting integrated samples using dinitrophenyl hydrazine (DNPH)-coated silica cartridges that were subsequently extracted and analyzed by liquid chromatography. These experiments allowed for the determination of the contribution of ventilation filters to formaldehyde concentrations, Δ[F], expressed in ppb or in µg m-3. Those changes in formaldehyde levels were used to calculate emission rates, EF, expressed in µg h-1, and emission rates per unit filter surface area, EF/A, expressed in µg h-1 m-2. In the latter expression, the unit filter surface area refers to the nominal cross-section area, not the total surface of media (these quantities are different for pleated filters). The emission rates determined in the room-sized chamber were used to evaluate the impact of fiberglass filters on indoor air quality (IAQ). Contributions to indoor formaldehyde concentrations were predicted for different scenarios comprising a relatively small 800-ft2 apartment, a mid-size 1,500 ft2 house and a larger 3,500 ft2 house. These homes correspond to indoor space volumes of 180 – 800 m3. Each was assumed to operate at air exchange rates λ = 0.2 h-1 or λ = 0.5 h-1, and with two different filter area-to-home floor area ratios near 0.002 and 0.004. Since the HVAC system operates intermittently during heating and cooling, emissions from filters are expected to take place only during the fraction of time in which humidified air is circulating through the filter. This time fraction was estimated for peak cold and warm seasons for eight cities located in different California climate zones (CZ). The maximum 24-h average time fraction predicted for the heating period was 37 % in Bishop, CA (CZ 16), and for the cooling period was 39% in Browley, CA (CZ 15). Results 1. Influence of relative humidity and face velocity on emission rates. Relatively low formaldehyde emissions for fiberglass filters were observed under moderate RH conditions, in the range 60 – 240 µg h-1 m-2. However, when exposed to high RH, fiberglass filters became a stronger source of formaldehyde, with emission rates in the range 500 – 3500 µg h-1 m-2. Under the same high humidity conditions, synthetic filters remained a low emitter, with 100 – 120 µg h-1 m-2. For each filter type and RH condition, the emission rates measured in the room-sized chamber tests at face velocities of 0.5 to 1.3 m s-1, were roughly one order of magnitude higher than those recorded in bench-scale tests at an equivalent face velocity of 0.02 cm s-1. These results suggested that

Formaldehyde emissions from residential HVAC filters Final Report
xii
RH and face velocity were the key factors that determined formaldehyde emissions from fiberglass filters. Emissions rates showed fluctuations over the duration of the experiments, but there was no consistent downward trend suggesting depletion of the source. Use of pleated filters did not result in increased emission rates. 2. Variability, and the effect of storage time. This study did not identify a single fiberglass filter manufacturer or product with distinct or qualitatively different emission patterns. On the contrary, substantial variability in formaldehyde emissions was observed across all fiberglass filter brand names and models. For products that were tested in both bench scale and room-sized chamber tests, identical packages containing 6-12 filters of each type were purchased at different times, observing significantly different relative source strengths from one package to the other. Fiberglass filter samples retrieved directly from the production line were the highest emitters in bench-scale tests, with EF/A = 156 - 208 µg h-1 m-2. Those levels were considerably higher than values observed for filters obtained from retailers when used under the same conditions (EF/A = 24 - 117 µg h-1 m-2). More evidence of the effect of long-term storage was observed upon testing different fiberglass filters from the same package within a 6 to 8 month time period. For two of the three tested products, Δ[F] decreased by 20 to 35 % after a few months of storage at room temperature and moderate humidity at the laboratory. These observations suggest that filter history, and particularly the length of storage, are factors affecting formaldehyde emission from fiberglass filters at high RH. 3. Media vs. frame emissions. Bench tests comparing emissions from the core filtration media vs. the glued frame revealed that both components contributed to formaldehyde emissions in comparable amounts. 4. Predicted impacts on indoor air. By combining the estimated indoor RH in each home with the HVAC duty cycle for each CZ, the increments in indoor formaldehyde concentrations were calculated for two different scenarios, corresponding to typical and worst-case scenarios. The typical scenario was the 1,500 ft2 home with two fiber glass filters (12”x24” + 24”x24”) operating at λ = 0.2 h-1 during winter, and led to an increase of 0.05 – 0.7 ppb formaldehyde. A high end scenario corresponding to the 800 ft2 apartment with a 18”x12” fiberglass filter, operating at λ = 0.2 h-1 during winter, led to an increase of 2.5 – 9.3 ppb formaldehyde. Conclusions This study demonstrated that residential fiberglass filters emit formaldehyde in contact with humidified air, consistent with previous studies of commercial building filters. It also showed that those emissions increased markedly with RH, leading to potentially substantial contributions to indoor concentrations under certain scenarios. From the range of scenarios considered for this analysis, high indoor formaldehyde was only predicted for a higher end set of conditions, i.e., a small apartment with high occupancy (4 people), low ventilation rates and extreme cold or warm outdoor climates. Under such conditions, predicted indoor concentrations exceeded Proposition 65 NSRL for formaldehyde in all climate zones. They also exceeded the OEHHA REL for chronic exposure of 7 ppb in Bishop (CZ 16), Stockton (CZ 12) and Fresno (CZ 13). Levels were less than 1 ppb below the chronic REL also in Eureka (CZ 1) and San Francisco (CZ 3), where indoor formaldehyde concentrations may also exceed the OEHHA
Formaldehyde emissions from residential HVAC filters Final Report
xiii
chronic REL after adding the background formaldehyde levels. All other scenarios considered in this study led to much lower contributions to indoor formaldehyde concentrations, and the source strength of fiberglass filters in many cases could be considered negligible. However, it should be pointed out that, while most single family homes may not be impacted, small apartments could be, as well as newer homes that use a continuously operating HVAC system (at a lower fan speed) for ventilation. The fact that the glued filter’s frame is a strong source is a finding that has not been yet described in the literature, and is relevant to quantifying emissions more precisely as well as for future efforts to reduce formaldehyde emissions from central air filters.

Formaldehyde emissions from residential HVAC filters Final Report
xiv
[This page is intentionally left blank]
Formaldehyde emissions from residential HVAC filters Final Report
1
1. INTRODUCTION
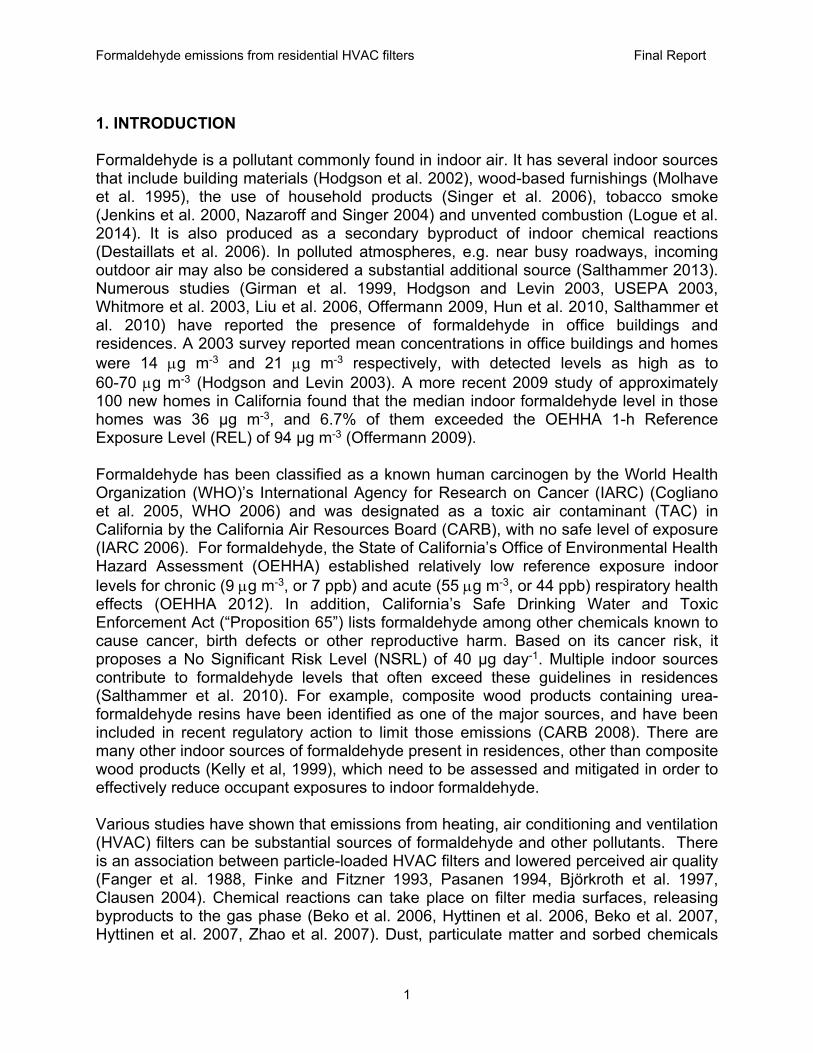
Formaldehyde is a pollutant commonly found in indoor air. It has several indoor sources that include building materials (Hodgson et al. 2002), wood-based furnishings (Molhave et al. 1995), the use of household products (Singer et al. 2006), tobacco smoke (Jenkins et al. 2000, Nazaroff and Singer 2004) and unvented combustion (Logue et al. 2014). It is also produced as a secondary byproduct of indoor chemical reactions (Destaillats et al. 2006). In polluted atmospheres, e.g. near busy roadways, incoming outdoor air may also be considered a substantial additional source (Salthammer 2013). Numerous studies (Girman et al. 1999, Hodgson and Levin 2003, USEPA 2003, Whitmore et al. 2003, Liu et al. 2006, Offermann 2009, Hun et al. 2010, Salthammer et al. 2010) have reported the presence of formaldehyde in office buildings and residences. A 2003 survey reported mean concentrations in office buildings and homes were 14 g m-3 and 21 g m-3 respectively, with detected levels as high as to 60-70 g m-3 (Hodgson and Levin 2003). A more recent 2009 study of approximately 100 new homes in California found that the median indoor formaldehyde level in those homes was 36 µg m-3, and 6.7% of them exceeded the OEHHA 1-h Reference Exposure Level (REL) of 94 μg m-3 (Offermann 2009).
Formaldehyde has been classified as a known human carcinogen by the World Health Organization (WHO)’s International Agency for Research on Cancer (IARC) (Cogliano et al. 2005, WHO 2006) and was designated as a toxic air contaminant (TAC) in California by the California Air Resources Board (CARB), with no safe level of exposure (IARC 2006). For formaldehyde, the State of California’s Office of Environmental Health Hazard Assessment (OEHHA) established relatively low reference exposure indoor levels for chronic (9 g m-3, or 7 ppb) and acute (55 g m-3, or 44 ppb) respiratory health effects (OEHHA 2012). In addition, California’s Safe Drinking Water and Toxic Enforcement Act (“Proposition 65”) lists formaldehyde among other chemicals known to cause cancer, birth defects or other reproductive harm. Based on its cancer risk, it proposes a No Significant Risk Level (NSRL) of 40 µg day-1. Multiple indoor sources contribute to formaldehyde levels that often exceed these guidelines in residences (Salthammer et al. 2010). For example, composite wood products containing urea-formaldehyde resins have been identified as one of the major sources, and have been included in recent regulatory action to limit those emissions (CARB 2008). There are many other indoor sources of formaldehyde present in residences, other than composite wood products (Kelly et al, 1999), which need to be assessed and mitigated in order to effectively reduce occupant exposures to indoor formaldehyde. Various studies have shown that emissions from heating, air conditioning and ventilation (HVAC) filters can be substantial sources of formaldehyde and other pollutants. There is an association between particle-loaded HVAC filters and lowered perceived air quality (Fanger et al. 1988, Finke and Fitzner 1993, Pasanen 1994, Björkroth et al. 1997, Clausen 2004). Chemical reactions can take place on filter media surfaces, releasing byproducts to the gas phase (Beko et al. 2006, Hyttinen et al. 2006, Beko et al. 2007, Hyttinen et al. 2007, Zhao et al. 2007). Dust, particulate matter and sorbed chemicals
Formaldehyde emissions from residential HVAC filters Final Report
2
collected on HVAC filter surfaces are susceptible to attack by ozone and other reactive atmospheric species. Ozone was shown to react with filter materials and with particles and dust deposited on their surface, leading to partial ozone decomposition and to the emission of low to moderate levels of oxidation byproducts (Destaillats et al. 2011). Studies performed at Lawrence Berkeley National Laboratory (LBNL) suggested that the reaction of binders and/or additives present in fiberglass filter media with water vapor and liquid water condensing on the filter surfaces can be a significant source of formaldehyde through the hydrolysis of formaldehyde-based polymers present on the filter surfaces (Destaillats et al. 2011, Sidheswaran et al. 2013). Additives such as binders, adhesives and tackifiers are present as coatings on filter fibers to preserve their integrity or increase particle retention. In addition, glues are used to attach the filtration media to the frame. Hence, fiberglass particle filters in central heating and air conditioning systems may be a source of indoor formaldehyde. In laboratory and field studies, LBNL found that emissions of formaldehyde from fiberglass filters used in commercial buildings increased with increasing relative humidity (RH) (Sidheswaran et al. 2013). On that study, the use of fiberglass filters at 50% RH increased room formaldehyde levels by 18-24%, adding an average 4 µg m-3 to room concentrations. This is significant because median indoor RH levels in California’s homes are close to 50% (Offermann 2009). At 80% RH, room formaldehyde concentrations increased by an average of 6 µg m-3. For comparison, outdoor formaldehyde concentrations in California average 3.2 µg m-3. Such effects were not observed when filters made of synthetic fibers (such as polyester) were used.
The median indoor formaldehyde level found in a 2009 study of new California homes was 36 µg m-3 (Offermann 2009). ARB’s composite wood regulation is expected to reduce new home concentrations by up to 40%, to an expected median formaldehyde level of about 22 µg m-3 in future new homes. The previous LBNL studies suggest that changing filter type from fiberglass filters to synthetic filters could reduce indoor concentrations by about 4-5 µg m-3 in homes. This reduction is about 20% of the expected concentrations in future new homes and is approximately 50% of OEHHA’s non-cancer 8-hour and Chronic Reference Exposure Levels (RELs) for formaldehyde (both set at 9 µg/m3) (OEHHA 2012). These results were based on measurements of emissions from filters used primarily in commercial buildings under a limited number of test conditions. This study is aimed at quantifying the contributions of residential fiberglass filters to indoor formaldehyde concentrations under a variety of conditions found in California homes. It has also evaluated the performance of synthetic filters, used as a low-emitting reference. The contribution of HVAC filter media as a formaldehyde source was assessed in relative terms with respect to known major indoor sources.
1.1. Fiberglass filters as a source of formaldehyde
Several studies have shown an association between particle-loaded HVAC filters and lowered perceived air quality (Fanger et al. 1988, Finke and Fitzner 1993, Pasanen 1994, Björkroth et al. 1997, Clausen 2004), and that perceived air quality improved
Formaldehyde emissions from residential HVAC filters Final Report
3
significantly when filters were removed from the supply duct. Chemical reactions can take place on filter media surfaces, releasing byproducts to the gas phase (Beko et al. 2006, Hyttinen et al. 2006, Beko et al. 2007, Hyttinen et al. 2007, Zhao et al. 2007). For example, dust, particulate matter and sorbed chemicals collected on HVAC filter surfaces are susceptible to attack by ozone and other reactive atmospheric species. This reaction is mostly of concern in commercial buildings, in which HVAC filters are often the first major surface on which these atmospheric species can react during their transit into the indoor environment. Recent California requirements for mechanical ventilation for outdoor air supply in new homes may also expose residential filters to ozone concentrations that are higher than typical indoor levels. When only outdoor air is supplied, the ozone concentration at the filter surface is approximately equal to its outdoor air concentration (up to 50-100 ppbv in some U.S. cities), which is much higher than typical indoor air concentrations (5-30 ppbv). However, when a mixture of outdoor and recirculated indoor air circulates through HVAC filters, the ozone concentration at the filter surface can be significantly lower. In most residential filters, levels of ozone in contact with filters are expected to be low, similar to indoor ozone concentrations. Ozone was shown to react with filter materials and with particles and dust deposited on their surface, leading to partial ozone decomposition and to the emission of low to moderate levels of oxidation byproducts such as formaldehyde (Destaillats et al. 2011).
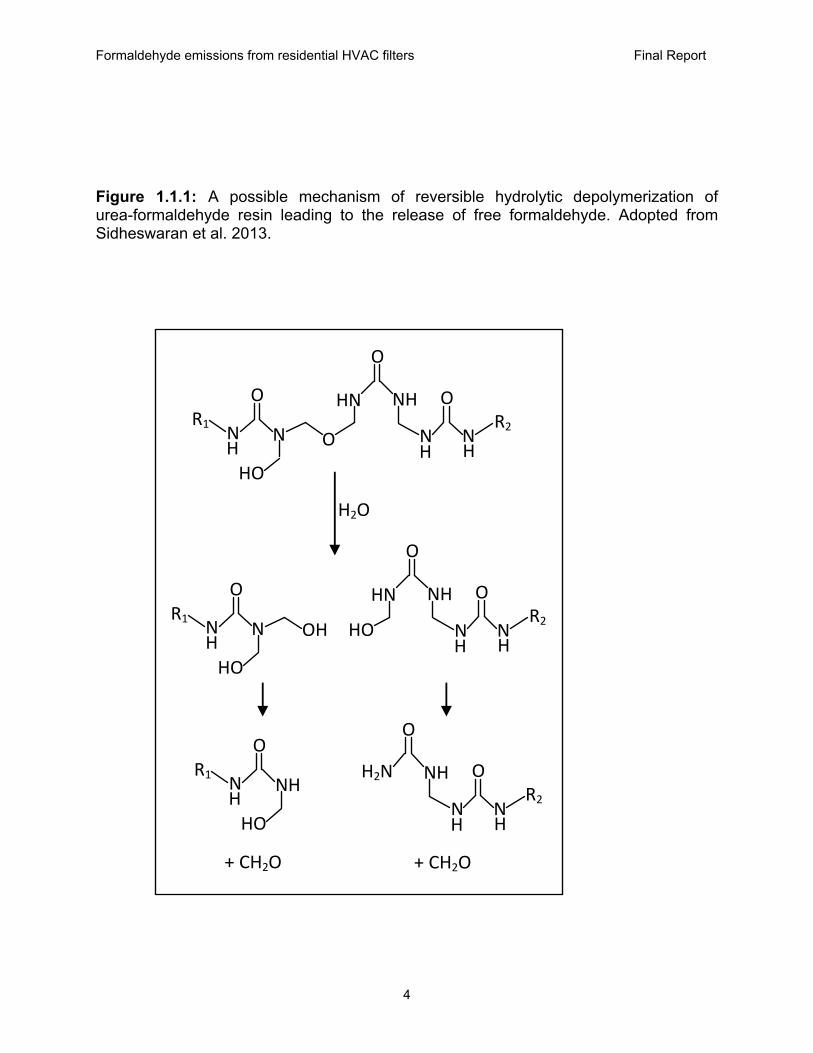
While heterogeneous oxidation on building surfaces has been the chemical process most commonly studied indoors, LBNL’s recent study showed that some filter types may become sources of formaldehyde even in the absence of ozone (Destaillats et al. 2011, Sidheswaran et al. 2013). These results suggested that the reaction involved the decomposition of additives present in the filter media in the presence of water vapor. Fibers used in filtration media are often coated with binders, adhesives and tackifiers that preserve their integrity or increase particle retention. Often, adhesives and binders for nonwoven filtration media include formaldehyde-based polymeric resins in their formulation (Hutten 2007). The functional groups present in these filter additives may undergo reaction with water to give rise to a variety of decomposition products. For example, urea-formaldehyde resins are known for releasing free formaldehyde upon reversible hydrolytic degradation (Park and Jeong 2011), as illustrated in Figure 1.1.1.
Formaldehyde emissions from residential HVAC filters Final Report
4
Figure 1.1.1: A possible mechanism of reversible hydrolytic depolymerization of urea-formaldehyde resin leading to the release of free formaldehyde. Adopted from Sidheswaran et al. 2013.
O
N H
N
O
NH O
NH
N
HO
R1
O
HN
H
R2
H2O
O
N H
N
O
NH O
NH
N
HO
R1 HO
HN
H
R2OH
O
N H
NH
HO
R1
+ CH2O
O
NH O
NH
N
H2N
H
R2
+ CH2O

Formaldehyde emissions from residential HVAC filters Final Report
5
Based on LBNL’s recent research, fiberglass particle filters in central heating and air conditioning systems may be a substantial source of indoor formaldehyde. In laboratory and field studies, LBNL found that emissions of formaldehyde from fiberglass filters with high formaldehyde emission rates increased with increasing relative humidity (RH) (Sidheswaran et al. 2013). At 50% RH the use of fiberglass filters increased room formaldehyde levels by 18-24%, adding an average 4 µg m-3 to room concentrations. At 80% RH, room concentrations increased by an average of 6 µg m-3. For comparison, outdoor formaldehyde concentrations in California average 3.2 µg m-3. These values should be compared with typical indoor air humidity levels in California’s homes. Offermann (2009) reported a 24-h average mean indoor RH of 43.4% and a maximum mean RH of 63.5% for a total of 103 new homes, as reported in Table 1.1.1. Other studies carried out a similar analysis for various US climate zones as defined by the International Energy Conservation Code (IECC), reporting mean indoor RH in the range 40 – 60 % for three different climate zones (Arena et al. 2010). Those results are also presented in Table 1.1.1. Hence, significant increases in formaldehyde concentrations may be found in California and U.S. homes with relative high indoor RH due to the uses of fiberglass particle filters.
Table 1.1.1: Indoor and outdoor temperature and relative humidity reported for California homes and for US homes located in three different IECC climate zones.
Indoor Outdoor mean minimum maximum mean minimum maximum
State of California (1) T (F) 72.4 62.7 82.8 62.4 44.9 82.4 RH (%) 43.4 19.5 63.5 57.0 25.1 93.3 US Climate Zone 2 (IECC) (2) T (F) 75.8 72.8 78.4 72.0 59.0 81.9 RH (%) 49.0 – 53.2 9 - 22 84 - 96 70.8 1 100 US Climate Zone 4 (IECC) (2) T (F) 67.1 62.9 73.2 53.0 39.5 67.2 RH (%) 51.2 – 59.2 1 - 21 81 - 96 73.5 13 98 US Climate Zone 5 (IECC) (2) T (F) 69.0 64.8 75.8 49.1 20.9 73.0 RH (%) 46.7 – 49.6 12 – 17 83 - 97 70.5 17 97
(1) Offermann, 2009 (2) Arena et al, 2010

Formaldehyde emissions from residential HVAC filters Final Report
6
1.2. Goals and scope of the study As described above, the median indoor formaldehyde level found in a comprehensive 2009 study of new California homes was 36 µg m-3 (Offermann 2009). ARB’s composite wood regulation is expected to reduce new home formaldehyde concentrations by up to 40%, to an expected median level of about 22 µg m-3. Our previous study (Sidheswaran et al, 2013) study suggests that changing filter type from fiberglass to synthetic media could reduce indoor concentrations by about 4-5 µg m-3. This reduction is close to 20% of the expected concentrations in future new homes and is approximately 50% of OEHHA’s non-cancer 8-hour and Chronic RELs for formaldehyde (both set at 9 µg/m3) (OEHHA 2012). However, these results were based on limited measurements of emissions from filters used primarily in commercial buildings. The goal of this study was to quantify the contribution of residential fiberglass and synthetic filters to indoor concentrations of formaldehyde under a variety of conditions found in California homes and evaluate the benefits of synthetic filters. These objectives were achieved by:
Evaluating the nature, variability and strength of fiberglass filters as formaldehyde sources, and
Predicting the impact of using formaldehyde ventilation filters in representative scenarios that are relevant for the State of California.
An overall objective of this study was to advance our knowledge on formaldehyde emissions from various filters used in residential central heating and air conditioning systems by exploring emissions from different types of filters used in California homes. More specifically, one key goal was to quantify the impact of fiberglass filters on formaldehyde exposures in California, and to explore the benefits of use of synthetic particle filters to reduce human exposures to this toxic air contaminant. There is relatively little or no information on formaldehyde emissions from residential HVAC filters. This study has been the first to investigate such emissions under typical and elevated relative humidity conditions, at temperature and air flow velocity conditions that are relevant to the State of California. Innovative aspects of this study involve the development of experimental methods to characterize pollutant emissions from residential filters, building upon the previous work performed in this area by LBNL. In particular, the use of a 20-m3 room-sized environmental chamber with very low background formaldehyde concentrations allowed us to validate experiments carried out in a small scale with measurements that reproduce real-world conditions. The contribution of HVAC filter media as a formaldehyde source was assessed in relative terms with respect to known major indoor sources.

Formaldehyde emissions from residential HVAC filters Final Report
7
This study focuses on various fiberglass filters, that are considered the highest source, and includes evaluation of synthetic filters as a reference. The latter are known for generating significantly lower (albeit non-zero) emissions. The technical tasks of this study include:
Selection and procurement of filters to be studied (Section 2)
Development of a laboratory bench-scale laboratory testing setup and protocol to evaluate emissions from a wide range of filters (Section 3)
Development of a room-sized laboratory testing setup and protocol to evaluate a subset of the above tested filters under realistic conditions (Section 4)
Characterizing emissions from fiberglass and synthetic filters in bench-scale tests
to compare across filter type, aging time and constituents (Section 5)
Characterizing emissions from a subset of fiberglass with high formaldehyde emissions and synthetic filters in room-sized chamber (Section 6)
Evaluating the impacts of residential filters on indoor air quality (Section 7),
comprising the following activities:
o Comparison of emission rates between small- and full-scale tests
o Comparison of residential filters with other formaldehyde sources
o Predicting contributions to indoor formaldehyde levels
o Predicting effect in different California climate zones

Formaldehyde emissions from residential HVAC filters Final Report
8
MATERIALS AND
METHODS
MATERIALS
AND METHODS
Formaldehyde emissions from residential HVAC filters Final Report
9
2. SELECTION AND PROCUREMENT OF RESIDENTIAL FILTERS USED IN THIS STUDY 2.1. Development of selection criteria Five experts from diverse disciplines were invited to join the Project Advisory Committee (PAC) with the purpose of discussing and refining the study’s goals and methods. The PAC met with LBNL team members and the ARB management team by teleconference on December 2014, and offered critical advice on filter selection. The following is specific information that was taken into consideration for filter selection:
What are fiber glass filters made of? Fiberglass filters are manufactured through the Modigliani process (Italian and US patents). This process involves a melting furnace feeding molten glass, which discharges fine glass fibers. These fine glass fibers are short in nature, and are wrapped around a rotating drum in a random fashion. Moisture is measured on the fiberglass mat, on which solutions are applied to the surface of the glass media (Modigliani, 1951).
What are synthetic filters made of? Synthetic filters can be thermally bonded (“core & sheet”) or resin-bonded. These two categories can be differentiated by microscopy.
Identify key manufacturers. There are three North American manufacturers of fiberglass filtration media. It was suggested to include materials from all manufacturers.
What are the parts and materials that lead to formaldehyde emissions? In general, low cost MERV 7 or lower filters are resin-bonded, and use urea-formaldehyde (UF) resin. Formaldehyde emissions can be affected by the curing conditions of the UF resin (e.g., manufactured in winter vs summer). High-end fiberglass filter media, microglass media which are mostly for commercial buildings, uses phenol-formaldehyde binders
What parts and materials are unlikely to be a formaldehyde source? Air-laid and wet-laid media, are used for HEPA filters. Cardboard/chipboard frame and glues are not likely a source of formaldehyde. The tackifier used as a coating on the surface of the filter to increase particle arrestance is an unlikely major source of formaldehyde.
2.2. Criteria used for filter selection Following the PAC’s advice, and in consultation with CARB, the following criteria for filter selection were established:

Formaldehyde emissions from residential HVAC filters Final Report
10
Inclusion of at least one fiberglass filter from each of the three North American manufacturers.
Inclusion of synthetic filters from at least two manufacturers with a significant presence in the US market
Inclusion of additional fiberglass filter samples provided by one of the PAC members. These filters were retrieved directly from the production line of several manufacturers. The rational for including these additional samples was that we could more easily identify if one of those was a particularly larger source than the others. The sample also included an imported filter.
2.3. Filters selected A total of six different fiberglass filters and five synthetic filters were procured. The fiberglass filters corresponded to the three main manufacturers present in the US market. Typically, each product brand/type was purchased in boxes containing 6-12 units each. Filters were ordered from online retailers (e.g., Amazon.com), or from specialized distributors, and are listed in Table 2.1.1. In addition, we received from one of the PAC members nine fiberglass filter samples for preliminary evaluation. These filters were retrieved directly from the production line of several media manufacturers, and included one imported filter. One of the media manufacturers (A) was also a manufacturer of the filters, and the other two (X and Z) sell the media to the different filter makers. Table 2.1.2 lists the main characteristics of those additional samples. Preliminary measurements were carried out with both groups of filters to identify those that are more suitable for full-scale measurements. We do not identify the brand names or models for the tested filters. Instead, we use a naming convention by identifying fiberglass filters with “FG” and synthetic filters with “SYN”.

Formaldehyde emissions from residential HVAC filters Final Report
11
Table 2.1.1. Filters purchased from on-line retailers
No. Manufacturer Media MERV Rating
Vendor Description of filtration media
1 A FG na Amazon.com fiberglass media with light adhesive
2 A FG MERV 4 American Filtration fiberglass media with adhesive
3 A FG MERV 4 American Filtration fiberglass media with adhesive
4 B FG MERV 4 Amazon.com fiberglass and polyester fibers with gel adhesive
5 B SYN MERV 11 Amazon.com synthetic filter media, pleated
6 B SYN MERV 4 Manufacturer polyester fibers
7 B SYN MERV 8 Manufacturer synthetic pleated filter media
8 C FG MERV 4 Amazon.com fiberglass media,
continuous filament spun glass
9 C FG na Amazon.com Fiberglass media, continuous filament spun glass
10 D SYN na Amazon.com synthetic media, electrostatic, allergen reduction
filter, pleated
11 D SYN MERV 8 Amazon.com synthetic media, electrostatic, allergen reduction
filter, pleated

Formaldehyde emissions from residential HVAC filters Final Report
12
Table 2.1.2. Fiberglass filter samples retrieved from production line, used in this study
Sample Description
(1) Manufacturer
of filter Manufacturer
of media (2) Comments
a Fiberglass
Pad A A
Thicker fiberglass media than those typically used for residential buildings.
b Fiberglass
Pad A A
Thicker fiberglass media than those typically used for residential buildings.
c Fiberglass
Panel C X Relatively recent production
d Fiberglass
Panel C X Relatively recent production
e Fiberglass
Panel A A Sample is at least 5 years old
f Fiberglass
Panel C Z Relatively recent production
g Fiberglass
Panel C Z Relatively recent production
h Fiberglass
Panel C Z Relatively recent production
i Fiberglass
Pad Unknown Unknown Imported from China
(1) Only panel samples contained a cardboard frame, the pad samples were frame-less (2) The letters X and Z are used to represent media producers that do not manufacture filters
Formaldehyde emissions from residential HVAC filters Final Report
13
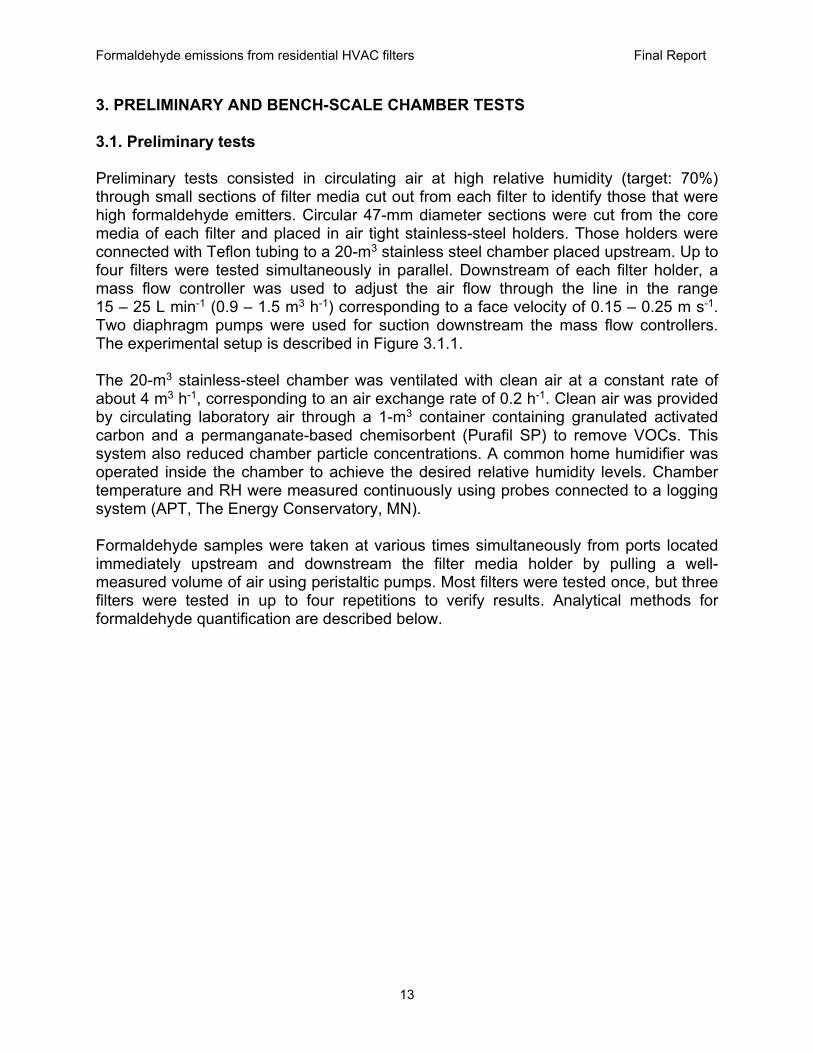
3. PRELIMINARY AND BENCH-SCALE CHAMBER TESTS 3.1. Preliminary tests Preliminary tests consisted in circulating air at high relative humidity (target: 70%) through small sections of filter media cut out from each filter to identify those that were high formaldehyde emitters. Circular 47-mm diameter sections were cut from the core media of each filter and placed in air tight stainless-steel holders. Those holders were connected with Teflon tubing to a 20-m3 stainless steel chamber placed upstream. Up to four filters were tested simultaneously in parallel. Downstream of each filter holder, a mass flow controller was used to adjust the air flow through the line in the range 15 – 25 L min-1 (0.9 – 1.5 m3 h-1) corresponding to a face velocity of 0.15 – 0.25 m s-1. Two diaphragm pumps were used for suction downstream the mass flow controllers. The experimental setup is described in Figure 3.1.1. The 20-m3 stainless-steel chamber was ventilated with clean air at a constant rate of about 4 m3 h-1, corresponding to an air exchange rate of 0.2 h-1. Clean air was provided by circulating laboratory air through a 1-m3 container containing granulated activated carbon and a permanganate-based chemisorbent (Purafil SP) to remove VOCs. This system also reduced chamber particle concentrations. A common home humidifier was operated inside the chamber to achieve the desired relative humidity levels. Chamber temperature and RH were measured continuously using probes connected to a logging system (APT, The Energy Conservatory, MN). Formaldehyde samples were taken at various times simultaneously from ports located immediately upstream and downstream the filter media holder by pulling a well-measured volume of air using peristaltic pumps. Most filters were tested once, but three filters were tested in up to four repetitions to verify results. Analytical methods for formaldehyde quantification are described below.
Formaldehyde emissions from residential HVAC filters Final Report
14
Figure 3.1.1. Experimental setup used in preliminary tests
Upstream sampling port
Vent
Logging system
MFC
Outdoor air
Activated carbon + chemisorbent bed
T, RH sensors
20–m3 chamber
MFC
MFC
MFC
Pump
Filter holder
Downstream sampling port
Humidifier
1
2
3
4
Fan
Chamber exhaust
MFC: mass flow controller

Formaldehyde emissions from residential HVAC filters Final Report
15
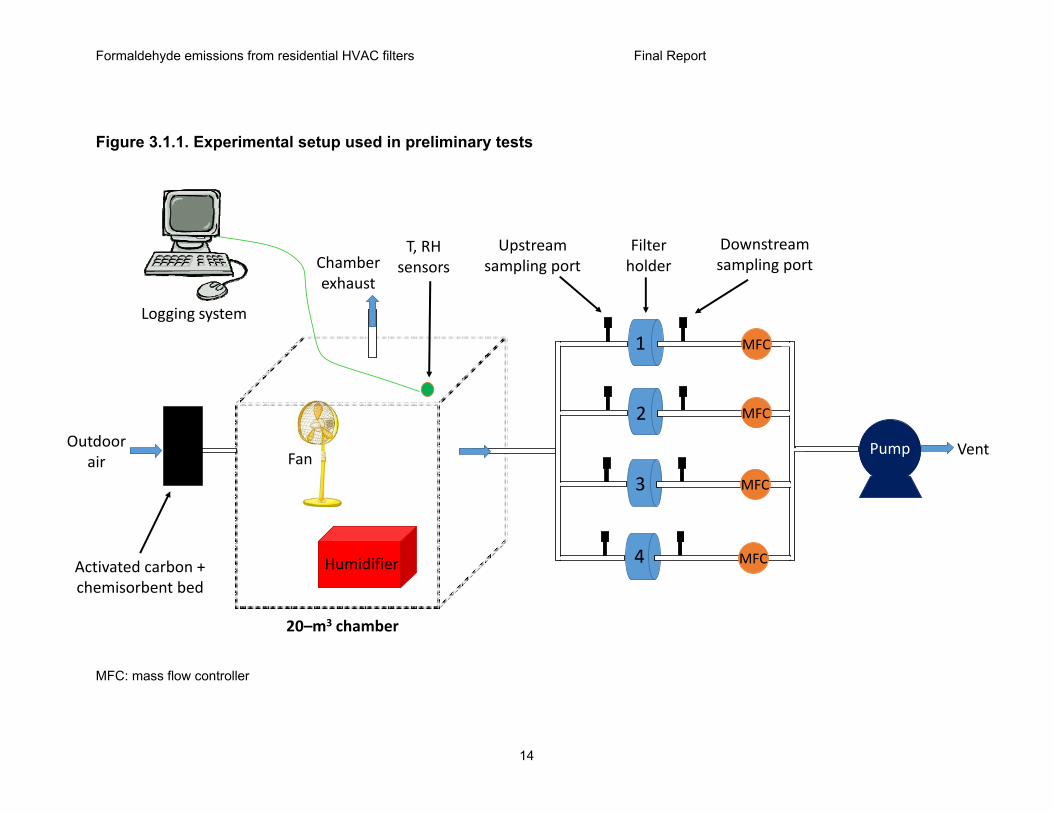
3.2. Bench-scale experimental chamber Emissions from entire filters, comprising core media and the frame, were measured in bench-scale tests. This approach allowed us to evaluate emissions not just from the polymers used to bind the fibers in the core media, but also other glues and binders used to attach the media to the frame, and potentially also emission arising from the frame itself. These tests also allowed to explore the relative contributions of core media and frame by measuring emissions from each of those components separately. In the case of filters procured from retailers, two entire filters of each type were placed inside a 200 L (0.2 m3) cubic stainless steel chamber. Only one filter of each type were used instead for the samples retrieved from the production line, because we only had one specimen of each, of which a small section of media had been cut out for the preliminary tests. All inlet and outlet ports were located on the top of the chamber, which could be removed to access the interior of the chamber and replace filters. Once the filters were in place, the chamber top was sealed with aluminum tape to ensure air tightness. In each test, air tightness was verified by measuring the flows incoming and exiting the chamber. House air was pre-cleaned by removing VOCs using an activated carbon trap (P/N 12011, Pall Life Sciences, NY) and removing particles using a HEPA filter (P/N 12144, Pall Gelman, NY). Clean and relatively dry air (~10% RH) was then split into two lines, one of which provided with a mass flow controller to adjust the air flow. One of the lines was connected to an aluminum bubbler filled with de-ionized water, used to saturate the air with moisture. The incoming RH was adjusted for each filter type around 40% and 70% by combining different amounts from each stream. Tests were run at those two RH levels, corresponding to moderate and high moisture levels. The air flow entering the chamber was 5 L min-1 (0.3 m3 h-1) corresponding to an air exchange rate of 1.5 h-1 and a residence time of 0.67 hours. The inlet port was connected internally to a Teflon tubing that delivered incoming air to one of the bottom corners of the chamber, to ensure that the air was well mixed. The chamber was sitting on a heating plate set at 30 oC, which provided a small temperature gradient inside the chamber to ensure good mixing. This approach enabled mixing without the need to introducing a fan and additional perforations to the chamber walls for fan wiring. The outlet port was drawing air from the top of the chamber, on the opposite side with respect to the inlet. The outlet was connected to a fume hood for venting. A third aperture in the chamber cover was used to introduce a temperature and a relative humidity probe. The filters were equilibrated with incoming air at 20 – 22 oC, and either 33 – 36% or 62 – 66% RH for 24 hours prior to collecting the first sample, and continued to be exposed to the same air over the duration of each test. Formaldehyde samples were taken at 24 and 48 hours of exposure, simultaneously from upstream and downstream

Formaldehyde emissions from residential HVAC filters Final Report
16
ports, by pulling a well-measured volume of air (in the order of 6 L) using peristaltic pumps over a 1-h period. Analytical methods for formaldehyde quantification are described below. The experimental setup described here is presented in Figure 3.2.1. The experiment is also illustrated by photographs presented in Figure 3.2.2. The filters were placed in the middle of the chamber, held in place by contact with internal walls. Table 3.2.1. Filters used in bench-scale chamber tests
(1) Media manufacturer indicated by X and Z (2) Only one filter from each kind was available, and ~5% of the media had been previously removed
to carry out the preliminary tests. Hence, the number of filters is nominally referred to as 0.95
Sample Filter manufacturer Filter type
Dimensions Number of filters used
per test
Filters procured from online retail vendors
1 A FG 12x24x2" 2
3 A FG 12x24x2" 2
4 B FG 12x24x1" 2
5 B SYN 12x24x1" 2
9 C FG 12x24x2" 2
11 D SYN 12x24x1" 2
Filter samples obtained from the production line
c C (X) (1) FG 15x24x1" 0.95 (2)
d C (X) FG 20x24x1" 0.95
g C (Z) FG 15x30x1" 0.95
Formaldehyde emissions from residential HVAC filters Final Report
17
Figure 3.2.1. Experimental setup used in bench-scale tests
Tested filters
Upstream sampling port
Downstream sampling port
Vent
Logging system
Heating plate
Upstream air internal inlet
Teflon tubingDownstream air internal outlet
MFC
MFC
House air
HEPA filter
Activated carbon filter
Water bubbler
T, RH sensors
200–L chamber
MFC: mass flow controller

Formaldehyde emissions from residential HVAC filters Final Report
18
Figure 3.2.2. Illustration of bench-scale test chamber
Air flows from
bottom to top
Air outlet Air inletSampling ports

Formaldehyde emissions from residential HVAC filters Final Report
19
3.3. Analytical methods for formaldehyde The U.S. EPA analytical method used in this project to quantify formaldehyde has been successfully used previously (US EPA, 1999). Formaldehyde and other volatile carbonyl samples were collected using dinitrophenyl hydrazine (DNPH)-coated silica samplers (Waters, MA) simultaneously upstream and downstream the tested materials. The concentration reported in each case corresponds to a time-integrated average over the sampled period. Air was drawn through the aldehyde samplers by means of peristaltic pumps operating at about 1 L min−1. The flow corresponding to each sample was measured using a primary air flow calibrator (BIOS DynaCal) with a precision better than 1%. DNPH cartridges were extracted with 2-mL aliquots of acetonitrile, and the extracts were analyzed by HPLC with UV detection at 360 nm. A calibration curve for quantification was carried out using authentic standards of the DNPH hydrazone of formaldehyde, acetaldehyde and acetone. The detection limit for each volatile carbonyl determined by the DNPH/HPLC method was typically 10 ng or lower, corresponding to chamber concentrations <0.1 μg m−3. 3.4. Environmental monitoring, data logging and processing Sensors for temperature and relative humidity were placed inside the chamber through a central aperture in the top cover. Data were logged continuously using an APT system (The Energy Conservatory, MN). At the end of each experiment results were retrieved from the computer running the APT and evaluated to determine average T and RH values during the tests, and the corresponding standard deviation. Two different RH sensors used for small-scale and room-size chamber tests were compared by operating simultaneously with two NIST-traceable RH sensors for a 12-h period at the end of the small-scale tests and immediately prior to executing the room-size chamber tests. This inter-comparison was carried out in the room-sized chamber with the humidifiers operating and the controller set at 70% RH and an air exchange rate of 0.8 h-1. Results obtained are presented in Table 3.4.1. There was excellent agreement between the two NIST traceable devices, with a gap of only 2%. Similarly, the room-sized chamber probe was very close to the two NIST traceable devices. However, RH determined with the probe used in the small-scale tests was higher by 7% with respect to the average of the two NIST traceable devices. This amount slightly exceeded the typical uncertainty associated with RH probes, which is within ±5%. A correction of –7% was applied to the RH measured with that probe to compensate for this bias.

Formaldehyde emissions from residential HVAC filters Final Report
20
Table 3.4.1. Inter-comparison of RH sensors
RH sensor 12-h average
RH (%) Logging interval
Room-sized chamber probe 72 30 s Small-scale test probe 78 30 s HOBO* 72 1 min Humidity Control* 70 none - set point
*NIST Traceable

Formaldehyde emissions from residential HVAC filters Final Report
21
4. ROOM-SIZED CHAMBER TESTS 4.1. Room-sized environmental chamber tests These tests were carried out in LBNL’s 20-m3 stainless-steel room-sized environmental chamber. The chamber is ventilated continuously with clean air at a stable rate that is representative of air exchange rates found in homes. Clean air was provided by circulating laboratory air through a 1-m3 container containing granulated activated carbon and a chemisorbent (Purafil SP) to remove VOCs. This air cleaning system also reduced chamber particle concentrations. Typical formaldehyde background levels in the chamber are 1-3 ppb. The external chamber fan was adjusted to obtain an air exchange rate of 0.2 h-1. Air exchange rate was determined by injecting CO2 and measuring its concentration decay using a continuous sensor (SBA-5, PP Systems, MA). Two small fans were operated continuously inside the chamber to provide good mixing. The chamber was provided with temperature and relative humidity sensors that were recording continuously on an APT logging system (The Energy Conservatory, MN). An external recirculation loop was built specifically for this project using 10-inch diameter stainless-steel ductwork. The experimental setup is illustrated in Figure 4.1.1, and photos are shown in Figure 4.1.2. A filter holder with the dimensions 12 x 24 inches was placed in the loop to expose the tested filters to recirculating chamber air. The loop was fitted with a variable-speed fan and an iris damper, to adjust and measure the air velocity. The system was adjusted to operate at two different air flows: 400 cfm (680 m3 h-1) and 1000 cfm (1700 m3 h-1). Two sets of sampling ports were placed upstream and downstream of the filter holder. Inside the chamber, the duct was extended using flexible ductwork to ensure that air was removed and re-injected at opposite corners to ensure good mixing, as shown in Figure 4.1.3. For experiments at high relative humidity, three home humidifiers were operated simultaneously. The humidifiers were connected to an RH sensor and controller (Control Company, TX) that was keeping the relative humidity at 70% through the experiment. The device was calibrated by the manufacturer following method ISO/IEC 17025:2005 in the range 30-90% with a tolerance of ±5%. Experiments carried out at moderate RH (40%) did not require the operation of humidifiers. In earlier tests our team observed two unexpected problems associated with the use of the external loop:
1) Heating of chamber air due to the operation of the recirculation fan. Temperature increased by 3-4 degrees, and the increment was higher when the fan was operating at the high-flow setting. The reason for this effect is the fact that the chamber walls are very well insulated and do not allow for thermal equilibration with the laboratory. A mitigating measure implemented was to operate continuously the dedicated air conditioning unit serving that laboratory, in order to improve heat transfer from the chamber to the laboratory. The working

Formaldehyde emissions from residential HVAC filters Final Report
22
temperature achieved was in the range 28 – 30 oC, which is high but still realistic. These relatively high temperatures with respect to typical indoor levels may have led to slightly higher emissions than those expected at 25 oC. However, the relative humidity is expected to be the dominant parameter determining the extent of emissions.
2) The air exchange rate was significantly higher when the loop was operating with respect to when the recirculating fan was turned off. This was attributed to leaks in the ductwork connections, the filter holder and the chamber door. The following mitigating measures were implemented:
a. The system was thoroughly revised and leaks were sealed using adhesive aluminum tape.
b. The chamber door was sealed with aluminum tape after each occasion in which researchers had to open it to access the interior of the chamber (e.g., to refill the humidifiers with water)
c. CO2 concentration decay was measured during each test to obtain a good measure of the air exchange rate in each experiment, to minimize variability and improve data quality.
These measures allowed us to maintain the total air exchange rate (including chamber exhaust and chamber system leakage) at 0.69 – 0.92 ACH during measurements.
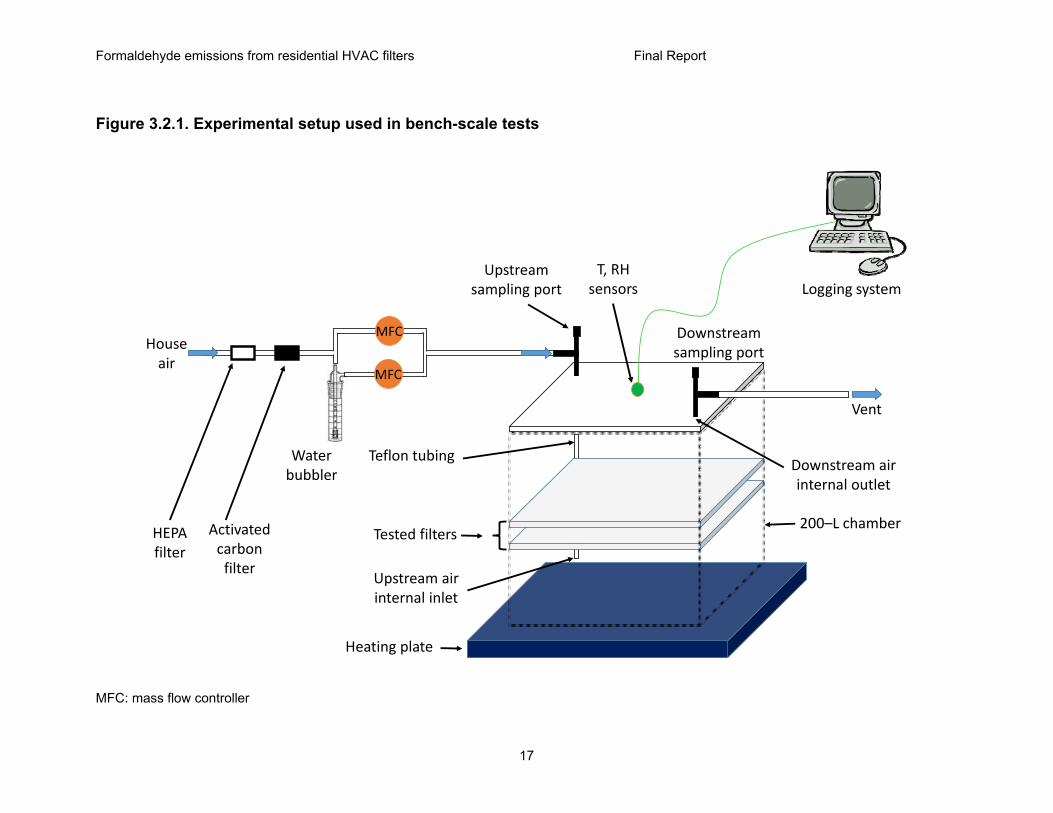
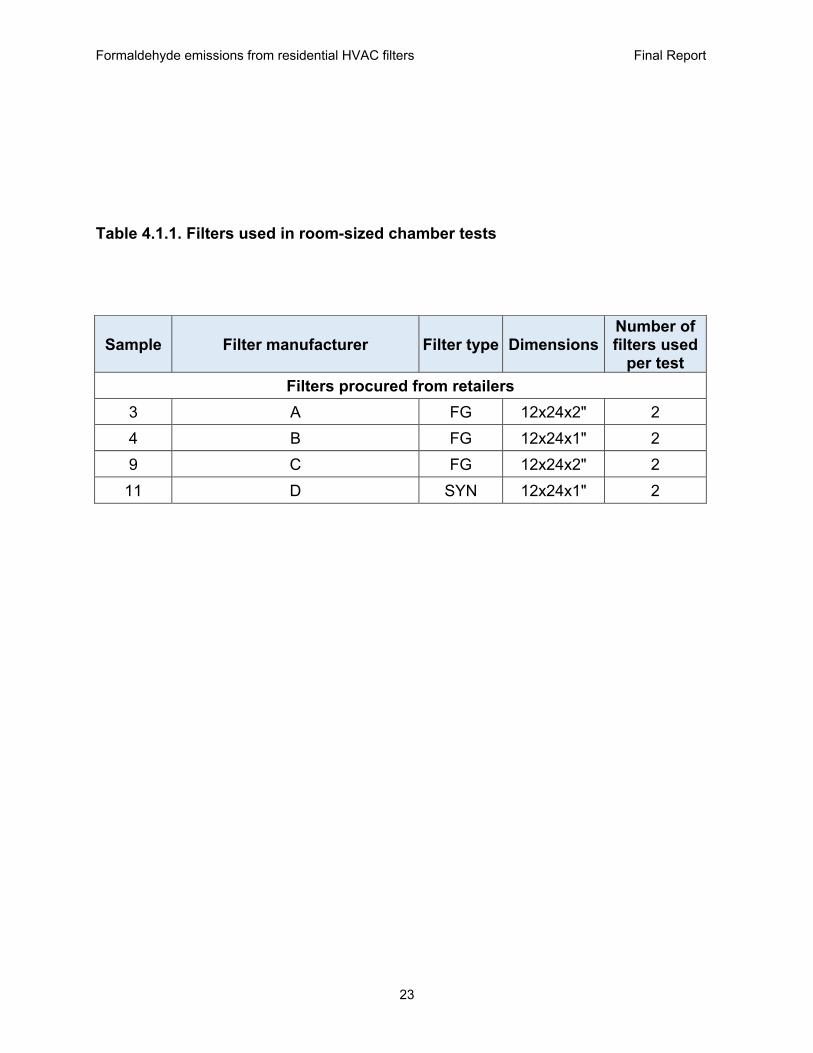
For the room-sized chamber tests, a brand-new set of filters was purchased for four samples that were selected to perform room-scale tests. We did not use filters from the same lots used in bench-scale tests to avoid potential depletion of the formaldehyde due to storage over extended periods of time. One important variable that we could not control was the time passed since manufacturing and the condition of storage (e.g., moist or hot environments), all of which have an effect in the emission rates. Filters for room-sized chamber tests were stored inside their original package (usually containing 12 units) at the laboratory until the moment they were installed in the filter holder. Each test used two filters in series.
Formaldehyde emissions from residential HVAC filters Final Report
23
Table 4.1.1. Filters used in room-sized chamber tests
Sample Filter manufacturer Filter type Dimensions Number of filters used
per test
Filters procured from retailers
3 A FG 12x24x2" 2
4 B FG 12x24x1" 2
9 C FG 12x24x2" 2
11 D SYN 12x24x1" 2

Formaldehyde emissions from residential HVAC filters Final Report
24
Figure 4.1.1. Experimental setup used in room-sized chamber tests
Humidifier #3
Upstream sampling port
Chamber exhaust
Logging system
Outdoor air
Activated carbon + chemisorbent bed
T, RH, CO2
sensors
20–m3 chamber
Custom‐made filter holder
Downstream sampling port
Humidifier #1
Humidifier #2
RH controller
Fan
Recirculation loop
Variable speed fan
Iris damper
Flexible ductwork (ending opposite side of chamber)

Formaldehyde emissions from residential HVAC filters Final Report
25
Figure 4.1.2. Exterior of room-sized chamber and recirculation loop
20‐m3 chamber
upstream
Sampling ports
Variable‐speed fan
Custom‐built filter holder
Iris damper
downstream

Formaldehyde emissions from residential HVAC filters Final Report
26
Figure 4.1.3. Interior of room-sized chamber
From external loop
Three home humidifiers
Fan
To external loop
Humidity Controller
door

Formaldehyde emissions from residential HVAC filters Final Report
27
4.2. Formaldehyde sampling and analysis Formaldehyde samples were taken on DNPH cartridges using peristaltic pumps to circulate a well-measured volume of air. The air volume through the DNPH cartridges was determined as the product of the circulating air flow and the sampling duration. The air flow (in the vicinity of 1 L min-1) was measured with a calibrated flow meter (DryCal Defender, NJ). Parallel upstream and downstream samples were collected over a duration that was typically one hour, at different times during the equilibration of the filter with chamber air. Typical experiments included equilibration of filters with chamber air over several days, with a pair of upstream/downstream formaldehyde samples collected daily. Extraction and analysis of DNPH cartridges was performed off-line as described above. 4.3. Environmental monitoring, data logging and processing Sensors for temperature and relative humidity were placed inside the chamber and connected to an APT system (The Energy Conservatory, MN) that logged the data continuously. The APT system also recorded pressure differential between the chamber and the room and across the iris damper, a value used to calculate the air flow through the filters. At the end of each experiment results were retrieved from the computer running the APT and evaluated to determine average T and RH values during the tests, and the corresponding standard deviation. 4.4. Determination of emission rate and modeling of indoor formaldehyde concentrations The computation of emission rates is described in Sections 5.2 and 6.2 (below), and their use in models predicting the contribution of filters to indoor formaldehyde concentrations is described in Section 7.3. 4.5. Quality assurance / quality control Quality assurance / quality control (QA/QC) plans have been implemented previously at LBNL as part of three recent projects: “Indoor Air Chemistry: Cleaning Agents, Ozone and Toxic Air Contaminants” (CARB Contract 01-336, P.I. W. Nazaroff), “Quantifying Pollutant Emissions from Office Equipment: A Concern in Energy-Efficient Buildings” (CARB/CEC Contract 500-2011-046, P.I.: T. McKone) and “Evaluation of Pollutant Emissions from Portable Air Cleaners” (CARB Contract 10-320, PI: H. Destaillats). In this project, those quality control checks have been applied to all aspects of the project. These included filter selection, chamber design and testing, sample collection, laboratory analyses, and data processing.

Formaldehyde emissions from residential HVAC filters Final Report
28
Samples collected during experiments have not left our laboratory at any time and were handled in most cases by a single operator. Hence, the chain of custody was established by logging each sample on the lab book from the moment the sample was collected, stored in a freezer, until the various steps of analysis. For the sampling and chemical analysis, DNPH cartridge and solvent blanks have been analyzed along with the samples collected in the experiments to identify possible background interferences. Blank samples were generated by deploying unused cartridges next to the experiment during similar periods to those used for sampling, and subsequently extracting and analyzing under identical conditions. Samples collected in the laboratory were stored at low temperature (5 oC) immediately after collection, prior to chemical analysis. For chemical analyses, quantification was based on standard calibration curves, as described above. Experiments included two replicate samples and blanks. A concerted effort was made to assure the reproducibility of all data generated. Differences in concentrations among different samples was analyzed and reported in terms of relative standard deviations.
Formaldehyde emissions from residential HVAC filters Final Report
29
RESULTS AND
DISCUSSION
RESULTS
AND DISCUSSION

Formaldehyde emissions from residential HVAC filters Final Report
30
5. BENCH SCALE CHARACTERIZATION OF FILTER EMISSIONS 5.1. Preliminary tests Preliminary tests consisted in circulating air at high relative humidity (69-85%) to identify those filters that could be considered high formaldehyde emitters. Results are presented in Table 5.1.1 for residential filters procured from retailers, and in Table 5.1.2 for the additional filter samples retrieved directly from the production line. Single-pass formaldehyde emission rates were found to be either very low or negligible for all the tested filters. One of the samples (number 4) was tested twice to evaluate the variability of these determinations. The variability was comparable or larger than most differences recorded between upstream and downstream concentrations. Negative values of the upstream-downstream differences reported in Table 5.1.1 and 5.1.2 were of the same order of magnitude as the experimental error. As a consequence, a different approach was derived for bench-scale characterization, using a 200-L exposure chamber. TABLE 5.1.1: Results of preliminary tests carried out with filters procured from retailers
Sample ID Type
Avg. RH
Avg T
Formaldehyde Concentration (ppb)
(%) (oC) Up Down Difference 1 FG 69 21 3.4 2.9 ‐0.4 2 FG 69 22 2.7 2.6 nd
3 FG 70 19 2.1 1.1 ‐1.0
4 FG 85 20 2.6 2.6 nd 85 20 3.3 2.7 ‐0.6
5 SYN 85 20 4.3 3.6 ‐0.7 6 SYN 83 21 5.3 4.6 ‐0.7 7 SYN 76 20 3.0 3.0 nd 8 FG 69 22 2.8 1.9 ‐0.9 9 FG 70 19 2.3 2.0 nd 10 SYN 84 19 2.4 2.6 nd 11 SYN 84 19 1.8 2.9 1.1
FG: fiberglass media; SYN: synthetic media

Formaldehyde emissions from residential HVAC filters Final Report
31
TABLE 5.1.2: Results of preliminary tests carried out on additional fiberglass filter samples retrieved from the production line.
Sample ID
Avg. RH
Avg T
Formaldehyde Concentration (ppb)
(%) (oC) Up Down Difference a 76 19 2.6 2.5 nd b 76 19 2.6 2.6 nd
c 81 19 3.0 2.4 ‐0.7
d 82 18 2.4 1.5 ‐0.9
e 83 21 6.2 3.3 nd
f 74 20 2.6 2.3 nd
g 82 18 2.3 2.3 nd
h 81 19 3.6 3.3 nd
i 74 20 2.4 3.0 0.6 Based on these results, an alternative plan was developed to further evaluate emissions in a bench-scale setting in order to down-select those filters identified as best suited for room-sized chamber tests. The revised plan for bench-scale tests involved testing whole filters, rather than using a small section of the media. A longer residence time of the air in the chamber was also considered to be necessary to increase the amount of formaldehyde produced by hydrolysis of polymeric additives. An additional benefit of this approach is that tests included not only the core media but also binders and polymers used to attach the media to the frame, and the cardboard frame itself. Results for this alternative approach are described in sections 5.2 – 5.4.
Formaldehyde emissions from residential HVAC filters Final Report
32
5.2. Determination of emission rates from newly-purchased filters
Formaldehyde emissions were evaluated in the 200-L chamber using whole filters, rather than a small section of the media. A total of nine filters were selected for these tests based on the results from preliminary tests. From those, six were filters procured from retailers (four fiberglass and two synthetic), and three were fiberglass filter samples retrieved from the production line, as described in Table 3.2.1 (Section 3). Tests were carried out with two filters placed together inside the chamber in the case of filters procured from retailers, and only one filter sample obtained directly from the production line (because we only had one unit of each on that category). Filters were exposed during 48 hours to a flow of humidified air in the ranges of relative humidity 32 – 34 % (low RH) and 60 – 66 % (high RH). The RH values were corrected based on the outcome of an intercomparison with NIST traceable RH sensors, as described in section 3.4, above. A first set of formaldehyde samples was collected upstream and downstream of the chamber at the end of the first 24-h period, and a second set of samples was collected at the end of the 48 hours of exposure. The experimental temperature was 20 – 22 oC. Figure 5.2.1 illustrates the results obtained in each test carried out at high relative humidity, indicating sample number and manufacturer (in parenthesis). Results are presented as an increment in formaldehyde concentration, Δ[F], with respect to levels measured in upstream air, as defined by: ∆[F] = [F]
downstream – [F]
upstream (5.1)
Upstream formaldehyde concentration was determined as the average of 44 individual measurements carried out with the tested filters, and was [F]upstream = (0.33 ± 0.19) ppb. Upon exposure to high RH conditions, all fiberglass filters exhibited significantly higher Δ[F] values than the synthetic filters. While Δ[F] values for fiberglass filters were in the range 21 – 122 ppb, formaldehyde concentrations increased only by 3 – 4 ppb in the case of synthetic filters. The concentration changes observed for synthetic filters were not negligible with respect to the background, which was an order of magnitude lower. The formaldehyde emissions from synthetic filters are likely attributable to degradation of glues and binders under high humidity conditions. However, in experiments with fiberglass filters, formaldehyde concentrations increased by more than one order of magnitude with respect to those measured with synthetic filters. These results are in line with our previous results for filters used in commercial buildings (Destaillats et al, 2011; Sidheswaran et al, 2013). A significant variability was observed among the different fiberglass filters at high RH. One product procured from a retailer (sample number 3, manufacturer A) was clearly the highest emitter in that category, with Δ[F] in the vicinity of 120 ppb. The other three fiberglass filters procured from vendors were in the range Δ[F] = 21 – 51 ppb. The three fiberglass filter samples retrieved from the production line showed even higher Δ[F]
Formaldehyde emissions from residential HVAC filters Final Report
33
values, in all cases above 150 ppb on the 24-h sample. But concentrations were significantly lower on the second day, with Δ[F] in the range 84 – 99 ppb. FIGURE 5.2.1: Chamber formaldehyde concentrations measured at 60 – 66 % RH: (A) filters procured from vendors; (B) filter samples retrieved from the production line
0 0
122 119
50.8
38.5
28.221.4
42.2 38.4
3.7 2.84.0 3.0
0
20
40
60
80
100
120
140
24 h 48 h
ΔC (ppb)
chamber blank
FG ‐ sample 3 (A)
FG ‐ sample 9 (C)
FG ‐ sample 4 (B)
FG ‐ sample 1 (A)
SYN ‐ sample 11 (D)
SYN ‐ sample 5 (B)
0 0
182
99
165
84
166
92
0
40
80
120
160
200
24 h 48 h
ΔC (ppb) chamber blank
FG ‐ sample c
FG ‐ sample d
FG ‐ sample g
A
B
blank blank
blank blank

Formaldehyde emissions from residential HVAC filters Final Report
34
FIGURE 5.2.2: Relative reduction in formaldehyde concentration change at 60 – 66 % RH between samples collected at 24 and 48 hours (A) from fiberglass filters obtained from retailers; (B) from fiberglass filter samples obtained from the production line
2.5
24 24
9
23
26
0
5
10
15
20
25
30
Decreased
between
24h and 48h sam
ple (%)
FG ‐ sample 3 (A)
FG ‐ sample 9 (C)
FG ‐ sample 4 (B)
FG ‐ sample 1 (A)
SYN ‐ sample 11 (D)
SYN ‐ sample 5 (B)
4649
45
0
10
20
30
40
50
60
Decreased
between
24h and 48h sam
ple (%)
FG ‐ sample c
FG ‐ sample d
FG ‐ sample g
A
B
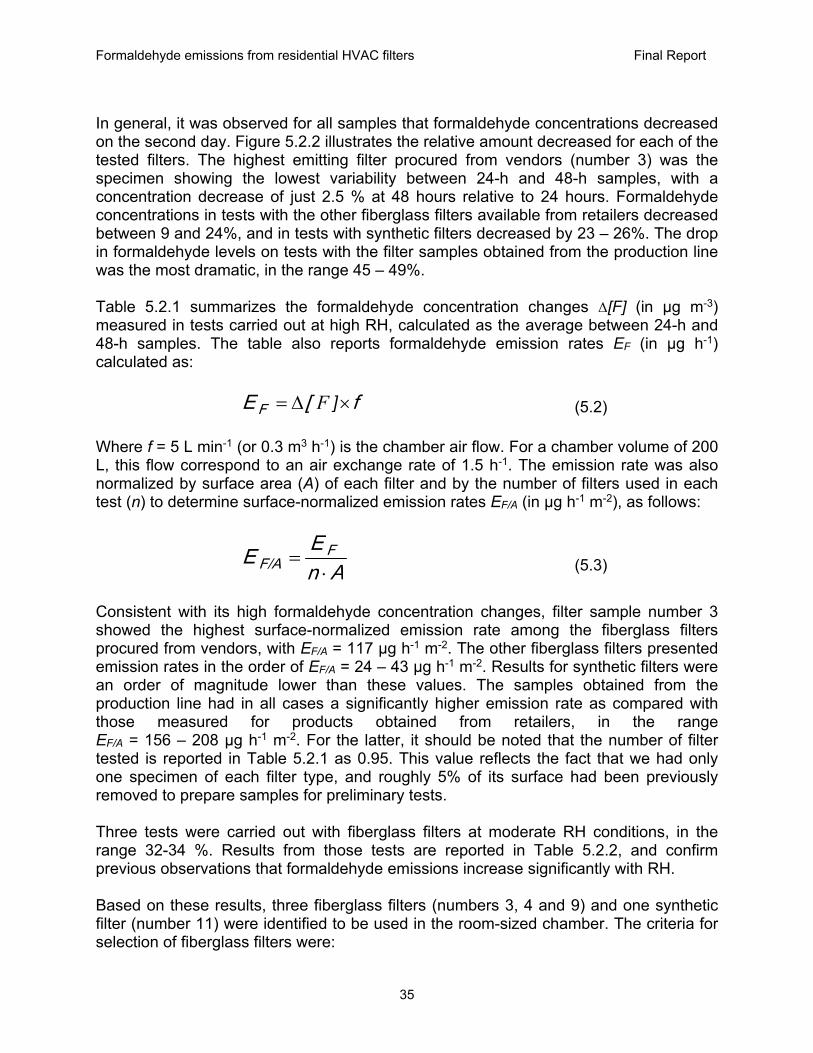
Formaldehyde emissions from residential HVAC filters Final Report
35
In general, it was observed for all samples that formaldehyde concentrations decreased on the second day. Figure 5.2.2 illustrates the relative amount decreased for each of the tested filters. The highest emitting filter procured from vendors (number 3) was the specimen showing the lowest variability between 24-h and 48-h samples, with a concentration decrease of just 2.5 % at 48 hours relative to 24 hours. Formaldehyde concentrations in tests with the other fiberglass filters available from retailers decreased between 9 and 24%, and in tests with synthetic filters decreased by 23 – 26%. The drop in formaldehyde levels on tests with the filter samples obtained from the production line was the most dramatic, in the range 45 – 49%. Table 5.2.1 summarizes the formaldehyde concentration changes Δ[F] (in µg m-3) measured in tests carried out at high RH, calculated as the average between 24-h and 48-h samples. The table also reports formaldehyde emission rates EF (in µg h-1) calculated as:
f[E F ]F (5.2) Where f = 5 L min-1 (or 0.3 m3 h-1) is the chamber air flow. For a chamber volume of 200 L, this flow correspond to an air exchange rate of 1.5 h-1. The emission rate was also normalized by surface area (A) of each filter and by the number of filters used in each test (n) to determine surface-normalized emission rates EF/A (in µg h-1 m-2), as follows:
AnEE F
F/A (5.3)
Consistent with its high formaldehyde concentration changes, filter sample number 3 showed the highest surface-normalized emission rate among the fiberglass filters procured from vendors, with EF/A = 117 µg h-1 m-2. The other fiberglass filters presented emission rates in the order of EF/A = 24 – 43 µg h-1 m-2. Results for synthetic filters were an order of magnitude lower than these values. The samples obtained from the production line had in all cases a significantly higher emission rate as compared with those measured for products obtained from retailers, in the range EF/A = 156 – 208 µg h-1 m-2. For the latter, it should be noted that the number of filter tested is reported in Table 5.2.1 as 0.95. This value reflects the fact that we had only one specimen of each filter type, and roughly 5% of its surface had been previously removed to prepare samples for preliminary tests. Three tests were carried out with fiberglass filters at moderate RH conditions, in the range 32-34 %. Results from those tests are reported in Table 5.2.2, and confirm previous observations that formaldehyde emissions increase significantly with RH. Based on these results, three fiberglass filters (numbers 3, 4 and 9) and one synthetic filter (number 11) were identified to be used in the room-sized chamber. The criteria for selection of fiberglass filters were:
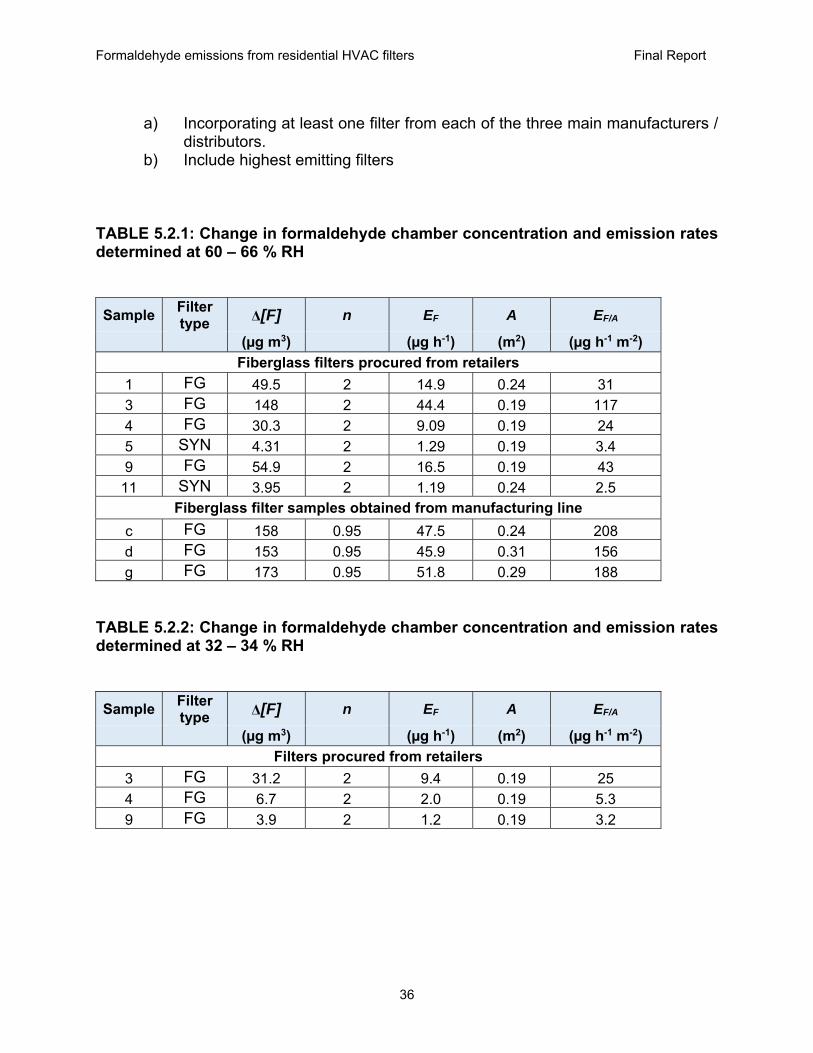
Formaldehyde emissions from residential HVAC filters Final Report
36
a) Incorporating at least one filter from each of the three main manufacturers /
distributors. b) Include highest emitting filters
TABLE 5.2.1: Change in formaldehyde chamber concentration and emission rates determined at 60 – 66 % RH
Sample Filter type Δ[F] n EF A EF/A
(µg m3) (µg h-1) (m2) (µg h-1 m-2)
Fiberglass filters procured from retailers
1 FG 49.5 2 14.9 0.24 31
3 FG 148 2 44.4 0.19 117
4 FG 30.3 2 9.09 0.19 24
5 SYN 4.31 2 1.29 0.19 3.4
9 FG 54.9 2 16.5 0.19 43
11 SYN 3.95 2 1.19 0.24 2.5 Fiberglass filter samples obtained from manufacturing line
c FG 158 0.95 47.5 0.24 208
d FG 153 0.95 45.9 0.31 156
g FG 173 0.95 51.8 0.29 188 TABLE 5.2.2: Change in formaldehyde chamber concentration and emission rates determined at 32 – 34 % RH
Sample Filter type Δ[F] n EF A EF/A
(µg m3) (µg h-1) (m2) (µg h-1 m-2)
Filters procured from retailers
3 FG 31.2 2 9.4 0.19 25
4 FG 6.7 2 2.0 0.19 5.3
9 FG 3.9 2 1.2 0.19 3.2
Formaldehyde emissions from residential HVAC filters Final Report
37
5.3. Formaldehyde emissions from aged filters Additional tests were carried out to assess aging effects due to storage of filters at the Laboratory over a 6 to 8 months period. These tests were carried out with the three fiberglass filters selected for follow-on tests in the room-sized chamber: filters 3, 4 and 9. Results are reported in Figure 5.3.1. Two of the three tested filters showed a significant decrease in formaldehyde emissions at high humidity conditions, between 20 and 35 %, which can be attributed to continuous degradation of the polymers and binders as the materials aged in the laboratory. Figure 5.3.1 includes also measurements carried out at lower RH (24 – 40 %), in which formaldehyde concentration changes were significantly lower than those recorded at 60 – 66 % RH. These results are consistent with previous observations by our group and other authors, reporting a strong effect of humidity on formaldehyde emissions. 5.4. Formaldehyde emissions from different filter components (media vs frame) An additional set of bench-scale tests was carried out to assess the extent to which emissions originated from the core media fibers vs. from degradation of glues and other binders used to attach the media to the cardboard frame. These tests were carried out with the three fiberglass filters selected for follow-on tests in the room-sized chamber: filters 3, 4 and 9. Results are reported in Figure 5.4.1. In all cases it was observed that both media and frame emissions were very significant, amounting to roughly equal contributions to total emissions. Theoretically, the formaldehyde emission from a full filter should roughly equal to the sum of emissions from the media and from the frame. However, in some cases the difference between emissions from a full filter and its constituents was significant (e.g., 14 vs. 19.4 ppb for filter 9(C)). These differences reflect the magnitude of experimental uncertainties. Similarly, in one case (filter 3(A)), emissions from the constituenst at 48 hours were higher than at 24 hours. This could also be attributed to variability among different filters tested and experimental error.
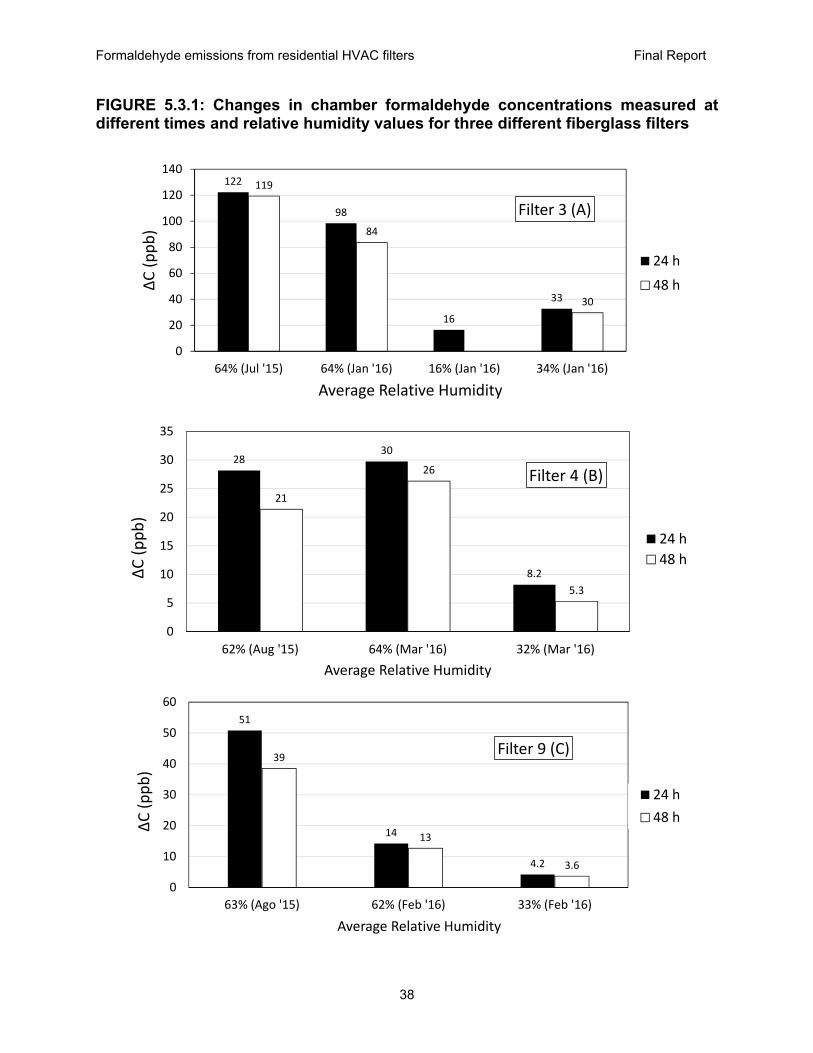
Formaldehyde emissions from residential HVAC filters Final Report
38
FIGURE 5.3.1: Changes in chamber formaldehyde concentrations measured at different times and relative humidity values for three different fiberglass filters
122
98
16
33
119
84
30
0
20
40
60
80
100
120
140
64% (Jul '15) 64% (Jan '16) 16% (Jan '16) 34% (Jan '16)
ΔC(ppb)
Average Relative Humidity
Filter 3 (A)
24 h
48 h
2830
8.2
21
26
5.3
0
5
10
15
20
25
30
35
62% (Aug '15) 64% (Mar '16) 32% (Mar '16)
ΔC(ppb)
Average Relative Humidity
Filter 4 (B)
24 h
48 h
51
14
4.2
39
13
3.6
0
10
20
30
40
50
60
63% (Ago '15) 62% (Feb '16) 33% (Feb '16)
ΔC (ppb)
Average Relative Humidity
Filter 9 (C)
24 h
48 h

Formaldehyde emissions from residential HVAC filters Final Report
39
FIGURE 5.4.1: Changes in chamber formaldehyde concentrations measured for different filter components at 63 – 64 % RH
98
46
34
84
4744
0
10
20
30
40
50
60
70
80
90
100
Full filter Media only Frame only
ΔC (ppb)
Filter 3 (A)
24 h
48 h
30
10.212
26
9.9 9.0
0
5
10
15
20
25
30
35
Full filter Media only Frame only
ΔC(ppb)
Filter 4 (B)
24 h
48 h
14
11
8.4
13
11
7.6
0
2
4
6
8
10
12
14
16
Full filter Media only Frame only
ΔC (ppb)
Filter 9 (C)
24 h
48 h

Formaldehyde emissions from residential HVAC filters Final Report
40
6. CHARACTERIZATION OF FORMALDEHYDE EMISSIONS IN ROOM-SIZE TEST CHAMBER 6.1. Determination of chamber formaldehyde concentrations Formaldehyde concentrations measured in room-sized chamber tests are shown in Figures 6.1.1 and 6.1.2. Four measurements are reported for each filter, corresponding to four consecutive days: the first two days at a lower circulation flow of 400 cfm, and the second two days at the higher air flow setting of 1000 cfm. Consistent with what we observed during the preliminary tests, the difference between upstream and downstream concentrations determined simultaneously was negligible, or difficult to differentiate from the experimental error of individual determinations. For that reason, the data shown in Figures 6.1.1 and 6.1.2 represent the average of simultaneous upstream and downstream determinations made over a 1-h period at the end of each day. The error bars correspond to the absolute difference between those two individual determinations. Since samples were taken in all cases during the afternoon/evening hours, the chamber was operating at steady state of temperature and relative humidity over several hours prior to collecting the sample. In experiments performed at relative humidity in the range 36 – 46 % (nominally, 40% RH), two of the fiberglass filters and the synthetic filter presented minimal emissions, with formaldehyde concentrations near the chamber background levels. However, one of the fiberglass filters, sample 9 (C), produced consistently >3 ppb above chamber background levels. In experiments performed at relative humidity in the range 68 – 72 % (nominally, 70% RH), all three fiberglass filters showed significantly higher formaldehyde concentrations than the synthetic filter, which was still at near-background levels. At 70% RH, one of the fiberglass filters, sample 3 (A), showed near constant formaldehyde concentrations at both face velocities. The other two fiberglass filters showed higher concentrations at the higher face velocity. This effect is relatively small for sample 4 (B), but very significant for sample 9 (C). Additional tests were carried out to further evaluate the performance of these two filters at high relative humidity, as reported in Figure 6.1.2. In the case of filter 4 (B), two additional tests were carried out at the high flow (1000 cfm), confirming chamber concentrations in the range 15-30 ppb. For the sample 9 (C), six additional tests were carried out at the high flow (1000 cfm). This filter seems to take between one and two days before reaching the maximum formaldehyde chamber concentration, which was in the range 50-70 ppb. The figures show the chamber blank or background formaldehyde concentration, which was determined to be 2.4 ± 0.3 ppb for 40% RH and 3.4 ± 0.3 ppb for 70% RH, based on five chamber determinations with an empty filter holder.

Formaldehyde emissions from residential HVAC filters Final Report
41
FIGURE 6.1.1: Chamber formaldehyde concentration measured under moderate (36 – 46 %) and high (68 – 72%) relative humidity operating at two recirculation rates: 400 cfm (striped bars) and 1000 cfm (solid bars)
4.03.6 3.5 3.6
4.03.4
4.1
4.8
6.76.3
6.67.1
3.3
4.0
5.0
3.7
0.0
1.0
2.0
3.0
4.0
5.0
6.0
7.0
8.0
Form
aldehyde concentration (ppb)
36 ‐ 46 % RH
FG ‐ sample 3 (A) FG ‐ sample 4 (B) FG ‐ sample 9 (C)
chamber background
SYN ‐ sample 11 (D)
24.4 25.723.1 23.0
13.316.1
20.322.8 24.3
30.1
51.4 52.4
6.8 5.5 6.8 6.8
0
10
20
30
40
50
60
Form
aldehyde concentration (ppb)
68 ‐ 72 % RH
chamber background
FG ‐ sample 3 (A) FG ‐ sample 4 (B) FG ‐ sample 9 (C) SYN ‐ sample 11 (D)

Formaldehyde emissions from residential HVAC filters Final Report
42
FIGURE 6.1.2: Additional formaldehyde concentration measurements performed for two fiberglass filters at high (69 – 72%) relative humidity, operating at 1000 cfm
13.316.1
20.322.8
18.3
29.7
0
5
10
15
20
25
30
35
Form
aldehyde concentration (ppb)
FG ‐ sample 4 (B), 69 ‐ 72 % RH
original data additional results
chamber background
2430
51 52
26
46
70
62
51 50
0
10
20
30
40
50
60
70
80
Form
aldehyde concentration (ppb)
FG ‐ sample 9 (C), 69 ‐ 72 % RH
original data additional results
chamber background
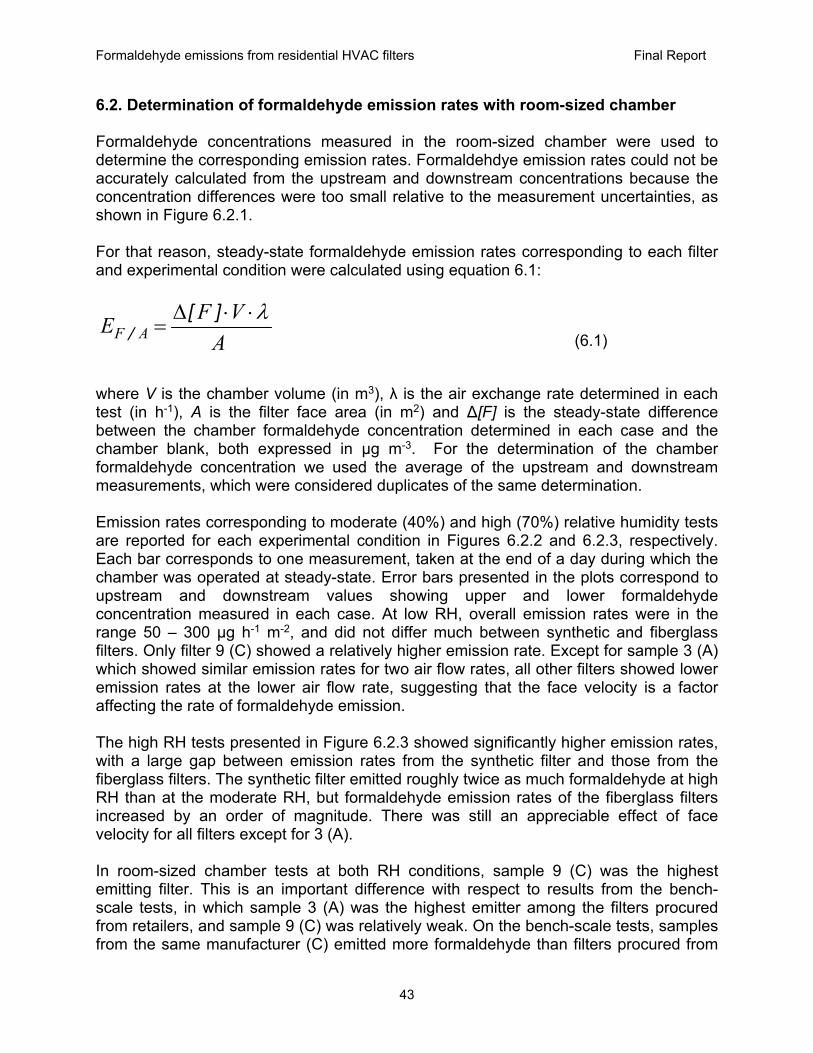
Formaldehyde emissions from residential HVAC filters Final Report
43
6.2. Determination of formaldehyde emission rates with room-sized chamber Formaldehyde concentrations measured in the room-sized chamber were used to determine the corresponding emission rates. Formaldehdye emission rates could not be accurately calculated from the upstream and downstream concentrations because the concentration differences were too small relative to the measurement uncertainties, as shown in Figure 6.2.1. For that reason, steady-state formaldehyde emission rates corresponding to each filter and experimental condition were calculated using equation 6.1:
A
VFE AF
][/ (6.1)
where V is the chamber volume (in m3), λ is the air exchange rate determined in each test (in h-1), A is the filter face area (in m2) and ∆[F] is the steady-state difference between the chamber formaldehyde concentration determined in each case and the chamber blank, both expressed in µg m-3. For the determination of the chamber formaldehyde concentration we used the average of the upstream and downstream measurements, which were considered duplicates of the same determination. Emission rates corresponding to moderate (40%) and high (70%) relative humidity tests are reported for each experimental condition in Figures 6.2.2 and 6.2.3, respectively. Each bar corresponds to one measurement, taken at the end of a day during which the chamber was operated at steady-state. Error bars presented in the plots correspond to upstream and downstream values showing upper and lower formaldehyde concentration measured in each case. At low RH, overall emission rates were in the range 50 – 300 µg h-1 m-2, and did not differ much between synthetic and fiberglass filters. Only filter 9 (C) showed a relatively higher emission rate. Except for sample 3 (A) which showed similar emission rates for two air flow rates, all other filters showed lower emission rates at the lower air flow rate, suggesting that the face velocity is a factor affecting the rate of formaldehyde emission. The high RH tests presented in Figure 6.2.3 showed significantly higher emission rates, with a large gap between emission rates from the synthetic filter and those from the fiberglass filters. The synthetic filter emitted roughly twice as much formaldehyde at high RH than at the moderate RH, but formaldehyde emission rates of the fiberglass filters increased by an order of magnitude. There was still an appreciable effect of face velocity for all filters except for 3 (A). In room-sized chamber tests at both RH conditions, sample 9 (C) was the highest emitting filter. This is an important difference with respect to results from the bench-scale tests, in which sample 3 (A) was the highest emitter among the filters procured from retailers, and sample 9 (C) was relatively weak. On the bench-scale tests, samples from the same manufacturer (C) emitted more formaldehyde than filters procured from
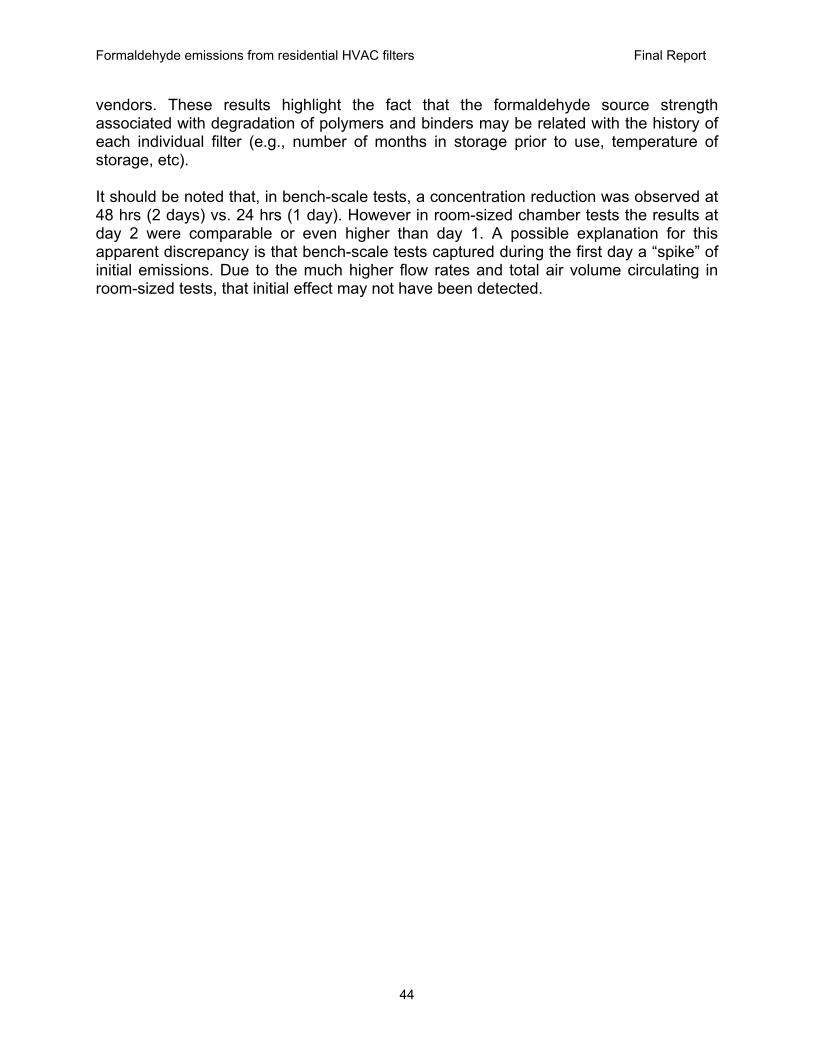
Formaldehyde emissions from residential HVAC filters Final Report
44
vendors. These results highlight the fact that the formaldehyde source strength associated with degradation of polymers and binders may be related with the history of each individual filter (e.g., number of months in storage prior to use, temperature of storage, etc). It should be noted that, in bench-scale tests, a concentration reduction was observed at 48 hrs (2 days) vs. 24 hrs (1 day). However in room-sized chamber tests the results at day 2 were comparable or even higher than day 1. A possible explanation for this apparent discrepancy is that bench-scale tests captured during the first day a “spike” of initial emissions. Due to the much higher flow rates and total air volume circulating in room-sized tests, that initial effect may not have been detected.
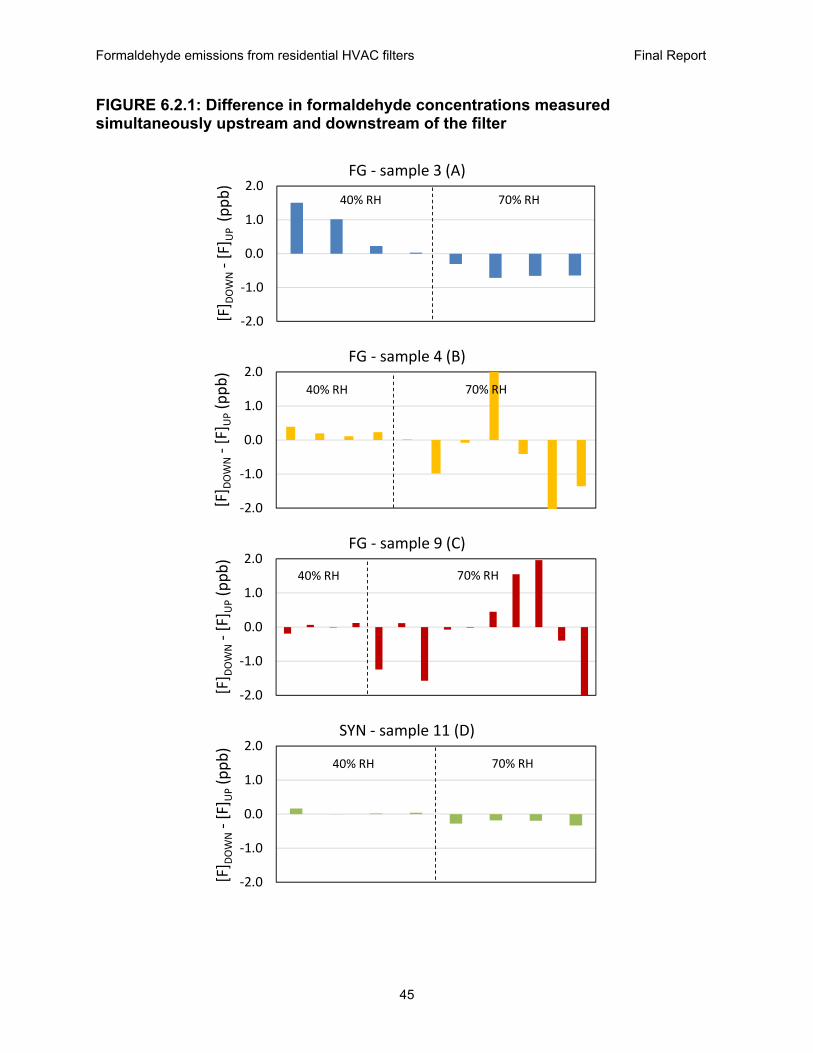
Formaldehyde emissions from residential HVAC filters Final Report
45
FIGURE 6.2.1: Difference in formaldehyde concentrations measured simultaneously upstream and downstream of the filter
‐2.0
‐1.0
0.0
1.0
2.0
[F] D
OWN‐[F] U
P (ppb)
FG ‐ sample 3 (A)
40% RH 70% RH
‐2.0
‐1.0
0.0
1.0
2.0
[F] D
OWN‐[F] U
P(ppb)
FG ‐ sample 4 (B)
40% RH 70% RH
‐2.0
‐1.0
0.0
1.0
2.0
[F] D
OWN‐[F] U
P(ppb)
FG ‐ sample 9 (C)
40% RH 70% RH
‐2.0
‐1.0
0.0
1.0
2.0
[F] D
OWN‐[F] U
P(ppb)
SYN ‐ sample 11 (D)
40% RH 70% RH
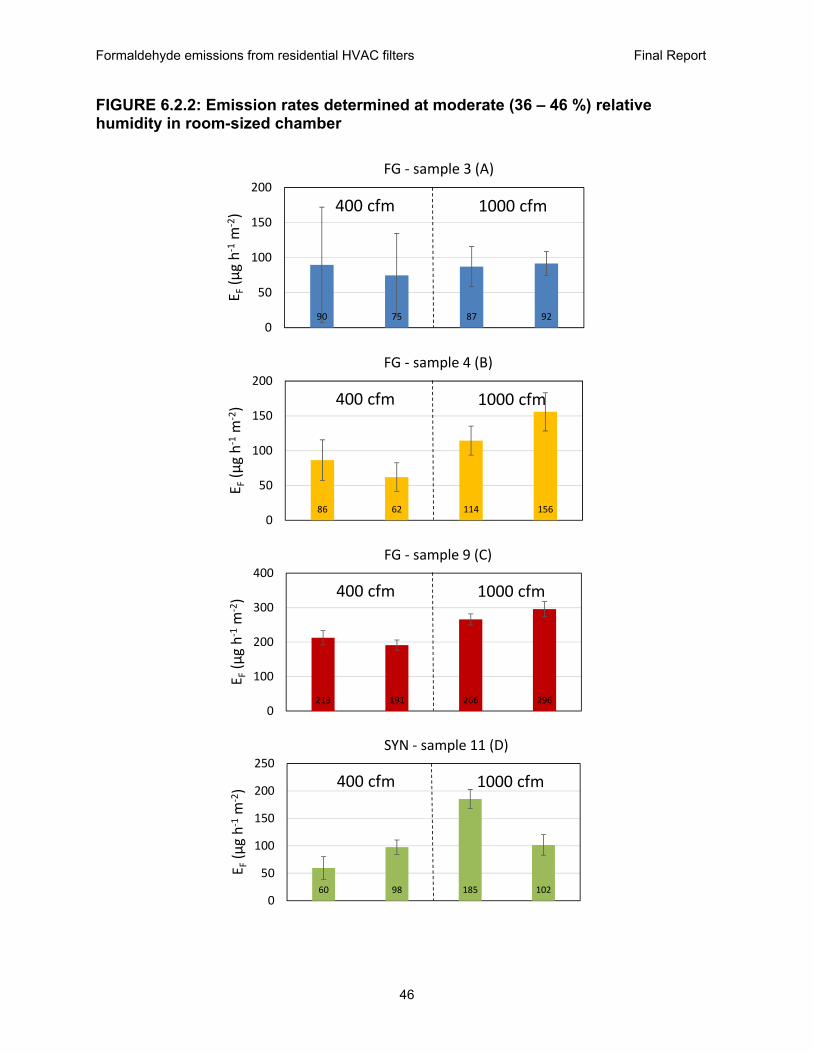
Formaldehyde emissions from residential HVAC filters Final Report
46
FIGURE 6.2.2: Emission rates determined at moderate (36 – 46 %) relative humidity in room-sized chamber
90 75 87 920
50
100
150
200
E F(µg h‐1m
‐2)
FG ‐ sample 3 (A)
400 cfm 1000 cfm
86 62 114 1560
50
100
150
200
E F(µg h‐1m
‐2)
FG ‐ sample 4 (B)
400 cfm 1000 cfm
213 191 266 2960
100
200
300
400
E F(µg h‐1m
‐2)
FG ‐ sample 9 (C)
400 cfm 1000 cfm
60 98 185 1020
50
100
150
200
250
E F(µg h‐1m
‐2)
SYN ‐ sample 11 (D)
400 cfm 1000 cfm
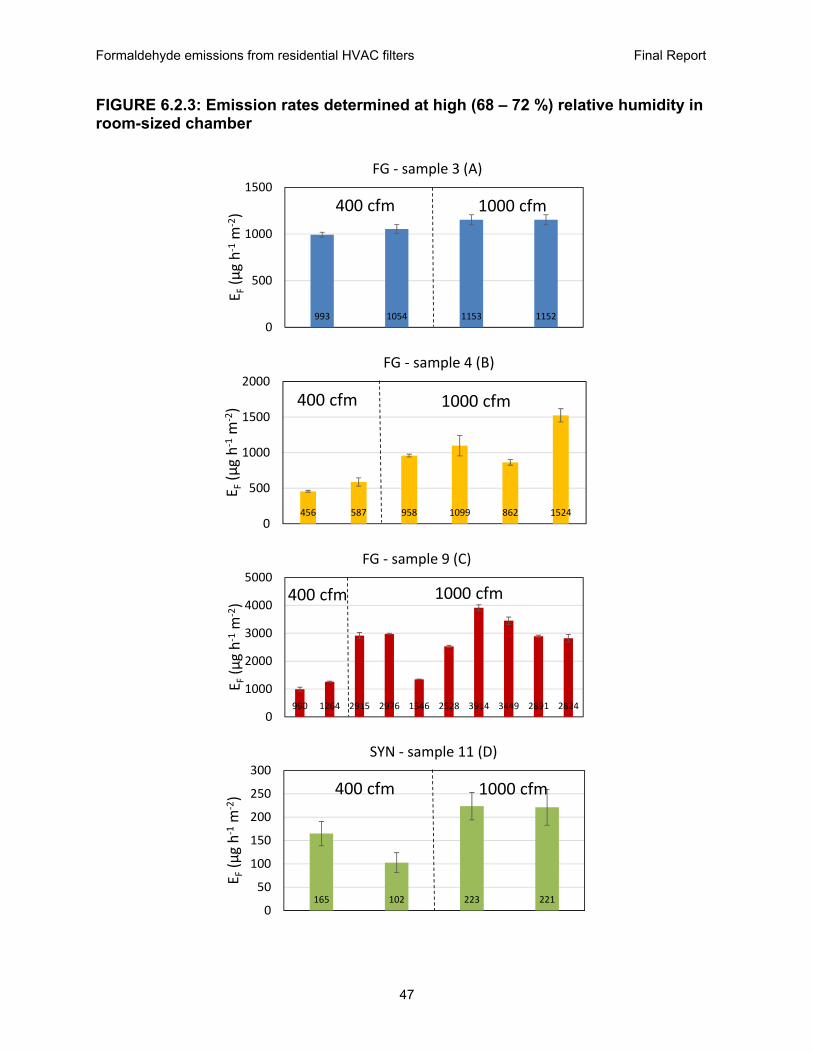
Formaldehyde emissions from residential HVAC filters Final Report
47
FIGURE 6.2.3: Emission rates determined at high (68 – 72 %) relative humidity in room-sized chamber
993 1054 1153 11520
500
1000
1500
E F(µg h‐1m
‐2)
FG ‐ sample 3 (A)
400 cfm 1000 cfm
456 587 958 1099 862 15240
500
1000
1500
2000
E F(µg h‐1m
‐2)
FG ‐ sample 4 (B)
400 cfm 1000 cfm
990 1264 2915 2976 1346 2528 3914 3449 2891 28240
1000
2000
3000
4000
5000
E F(µg h‐1m
‐2)
FG ‐ sample 9 (C)
400 cfm 1000 cfm
165 102 223 2210
50
100
150
200
250
300
E F(µg h‐1m
‐2)
SYN ‐ sample 11 (D)
400 cfm 1000 cfm
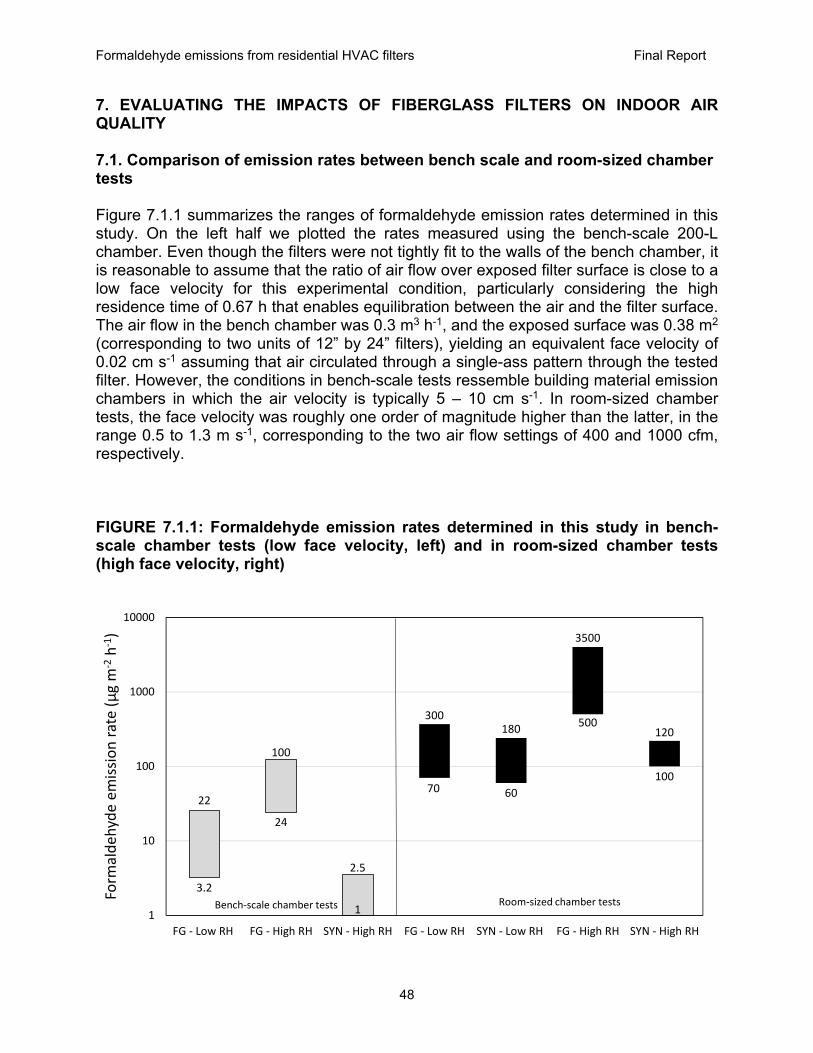
Formaldehyde emissions from residential HVAC filters Final Report
48
7. EVALUATING THE IMPACTS OF FIBERGLASS FILTERS ON INDOOR AIR QUALITY 7.1. Comparison of emission rates between bench scale and room-sized chamber tests Figure 7.1.1 summarizes the ranges of formaldehyde emission rates determined in this study. On the left half we plotted the rates measured using the bench-scale 200-L chamber. Even though the filters were not tightly fit to the walls of the bench chamber, it is reasonable to assume that the ratio of air flow over exposed filter surface is close to a low face velocity for this experimental condition, particularly considering the high residence time of 0.67 h that enables equilibration between the air and the filter surface. The air flow in the bench chamber was 0.3 m3 h-1, and the exposed surface was 0.38 m2 (corresponding to two units of 12” by 24” filters), yielding an equivalent face velocity of 0.02 cm s-1 assuming that air circulated through a single-ass pattern through the tested filter. However, the conditions in bench-scale tests ressemble building material emission chambers in which the air velocity is typically 5 – 10 cm s-1. In room-sized chamber tests, the face velocity was roughly one order of magnitude higher than the latter, in the range 0.5 to 1.3 m s-1, corresponding to the two air flow settings of 400 and 1000 cfm, respectively. FIGURE 7.1.1: Formaldehyde emission rates determined in this study in bench-scale chamber tests (low face velocity, left) and in room-sized chamber tests (high face velocity, right)
3.2
24
1
70 60
500
100
22
100
2.5
300180
3500
120
1
10
100
1000
10000
FG ‐ Low RH FG ‐ High RH SYN ‐ High RH FG ‐ Low RH SYN ‐ Low RH FG ‐ High RH SYN ‐ High RH
Form
aldehyde em
ission rate (µg m
‐2h‐1)
Bench‐scale chamber tests Room‐sized chamber tests

Formaldehyde emissions from residential HVAC filters Final Report
49
Overall, low effective face velocities led to proportionally lower emission rates per unit surface area, between one and two orders of magnitude lower than those measured in the room-sized chamber. Emission rates increased in proportion to the face velocity, suggesting that at high face velocities there was relatively little mass transfer limitation. Measurements using fiberglass filters at high RH led to an order of magnitude higher emission rates than measurements at low RH. Also, measurements using fiberglass filter at high RH led to significantly higher emission rates than those using synthetic filters at high RH. 7.2. Comparison with other formaldehyde sources Our results from this study were compared with those reported in the literature, corresponding to other strong formaldehyde sources in buildings (Kelly et al, 1999), and our previous study on fiberglass filters used in commercial buildings (Sidheswaran et al, 2013). Figure 7.2.1 summarizes results presented in both studies. Considering results from this work on residential filters and results from fiberglass filters used in commercial buildings, it should be noted that overall formaldehyde emission rates per unit surface area of fiberglass filters are high in comparison with other indoor sources. The main reason why some of those other indoor materials are considered the main formaldehyde sources (e.g., those containing urea-formaldehyde binders) is that the amount of those materials and furnishings exposed to indoor air is significantly higher than the amount of material in a filter. It should also be noted that these emission rates were determined in significantly different testing conditions. The Kelly et al (1999) study used equilibration static chambers at a relatively low air flow, while the Sidheswaran study and this study circulated air through the filters, likely reducing the resistance to mass transfer. Another important observation is that emission rates from residential fiberglass filters exposed at high RH were roughly an order of magnitude lower than those from fiberglass filters used in commercial buildings. Assuming that both types of filters are made with the same fiberglass fibers and binders, the possible reason for this difference is the thicker filter media and denser matt of fibers used in the filters for commercial buildings.

Formaldehyde emissions from residential HVAC filters Final Report
50
FIGURE 7.2.1: Formaldehyde emission rates reported in the literature(1, 2)
105
6
60
4
20
6
0.1
10
100
1050
10000
200
24 30 30
10
0.5
400
2000
9000
0.1
1
10
100
1000
10000
100000
BUF CUF PP DL FG BPF P Low RH High RH Low RH High RH
Form
aldehyde em
ission rate (µg m
‐2h‐1)
Kelly et al, 1999 ‐ ES&T Sidheswaran et al, 2013 ‐ ES&T
Low face velocity High face velocity
(1) The dotted box represents the range of values determined in this study for formaldehyde emission rates in the room-sized chamber for all filters and experimental conditions. (2) BUF: bare urea-formaldehyde products; CUF: coated urea-formaldehyde products; PP: permanent press fabrics; DL: decorative laminates; FG: fiberglass products; BPF: bare phenol-formaldehyde products; P: paper goods 7.3. Predicted contributions to indoor formaldehyde levels in CA homes and evaluation of the associated impacts on occupant health Six different scenarios were evaluated to predict the incremental indoor formaldehyde concentrations that could be found in California homes with fiberglass filters under a wide range of conditions. Table 7.3.1 summarizes the home dimensions, number and size of filter used and total filter area in each scenario. We selected a relatively small apartment (ARB 1), a mid-size house (ARB 2) and a larger 2-story house (ARB 3), corresponding indoor space volumes in the range 180 – 800 m3. These are largely representative of most California homes. In each home we evaluated two different scenarios, labeled “A” and “B”, corresponding to two different filter surface areas. The

Formaldehyde emissions from residential HVAC filters Final Report
51
criterion used to establish a suitable range of filter surface area for each home was to compare with values measured in other homes of the ratio Φ, defined as
area floor home
area surfacefilter (7.1)
Three reference homes were used to establish a range of values for the ratio Φ: a 223 m2 (2400 sq. feet) single family house and two unoccupied houses used in scientific studies reported in the literature (Stephens and Siegel, 2013; Singer et al, 2016). The characteristics of each reference house are reported in Table 7.3.1. TABLE 7.3.1: Determination of the ratio Φ in three reference homes
Reference house #
Home floor area (m2)
Home volume (m3)
Filter surface area (m2)
Φ (x103)
References
1 223 500 0.81 3.6 Measured at a 223 m2 house
2 110 250 0.26 2.4 Stephens and Siegel, 2013
3 107 316 0.38 3.6 Singer et al,
2016. (reference system)
The steady-state contribution of each filter (or set of filters) to indoor formaldehyde concentrations, ΔF, was calculated as:
V
AEF filterAF /
(7.2)
where the corresponding values for emission rates per unit filter surface, EF/A, and the total filter area, Afilter, are reported in Table 7.3.2. The volume of the occupied space, V, was calculated in each case by multiplying the floor area by 2.45 m (8 ft), which is a common value for residential room height. Calculations were made for two values of the

Formaldehyde emissions from residential HVAC filters Final Report
52
air exchange rate λ = 0.2 h-1 and λ = 0.5 h-1, using emission rates determined for each filter at 40% RH and 70% RH. Results are shown in Figures 7.3.1 – 7.3.3, where bars represent the range between the minimum and maximum value determined in each case. Contributions to indoor formaldehyde concentrations were compared with the chronic reference exposure level (REL) established by California’s Office of Environmental Health Hazard Assessment (OEHHA) (7 ppb) and with no significant risk level (NSRL, 40 µg day-1) determined under State Proposition 65. For an average breathing rate of 15 m3 day-1, NSRL is equivalent to an indoor formaldehyde concentration of 2.2 ppb. For all three homes, the largest contributions to indoor formaldehyde levels were observed for a combination of high relative humidity (70%), low air exchange rate (0.2 h-1) and the upper end of the ratio (Φ) between filter surface area and floor area. Under those conditions, formaldehyde concentrations in all three homes were expected to increase by between 2.9 and 25 ppb when fiberglass filters were used. Other conditions led to lower formaldehyde increments, but in all cases the presence of fiberglass filters led to measureable increments. By contrast, using synthetic filters led in most cases to formaldehyde concentration increments below 1 ppb. It should be noted that equation 7.2 assumes that a forced-air heating, ventilation and air conditioning (HVAC) system is operating 100% of the time. For that reason, the above mentioned results constitute a scenario only applicable to homes in which the HVAC system is designed to operate continuously to ensure appropriate mechanical ventilation or to provide continuous filtration. However, most homes will be operating the HVAC system only when cooling or heating is necessary. We evaluated typical scenarios in which the HVAC system is operating following different duty cycles depending on the climate, as described in section 7.4, below.

Formaldehyde emissions from residential HVAC filters Final Report
53
TABLE 7.3.2: Scenarios selected to model indoor formaldehyde concentrations derived from residential fiberglass filter emissions
Home
Indoor space
volume (m3)
Filter(s) used
Total filter surface
area (m2)
ARB 1
74 m2 (800 ft2) apartment
182
Smaller filter: 12 x 24 inch filter (Φ = 2.4 x 10 -3)
0.18
Larger filter: 18 x 24 inch filter (Φ = 3.6 x 10 -3)
0.27
ARB 2
140 m2 (1500 ft2) house
343
Smaller filter: 24 x 24 inch filter (Φ = 2.6 x 10 -3)
0.36
Larger filters: One 12 x 24 inch filter and one 24 x 24 inch filter (Φ = 3.9 x 10 -3)
0.54
ARB 3
325 m2 (3500 ft2)
2-story house
796
Smaller filters: Two 24 x 24 inch filters (Φ = 2.4 x 10 -3)
0.72
Larger filters: Three 24 x 24 inch filters (Φ = 3.6 x 10 -3)
1.08
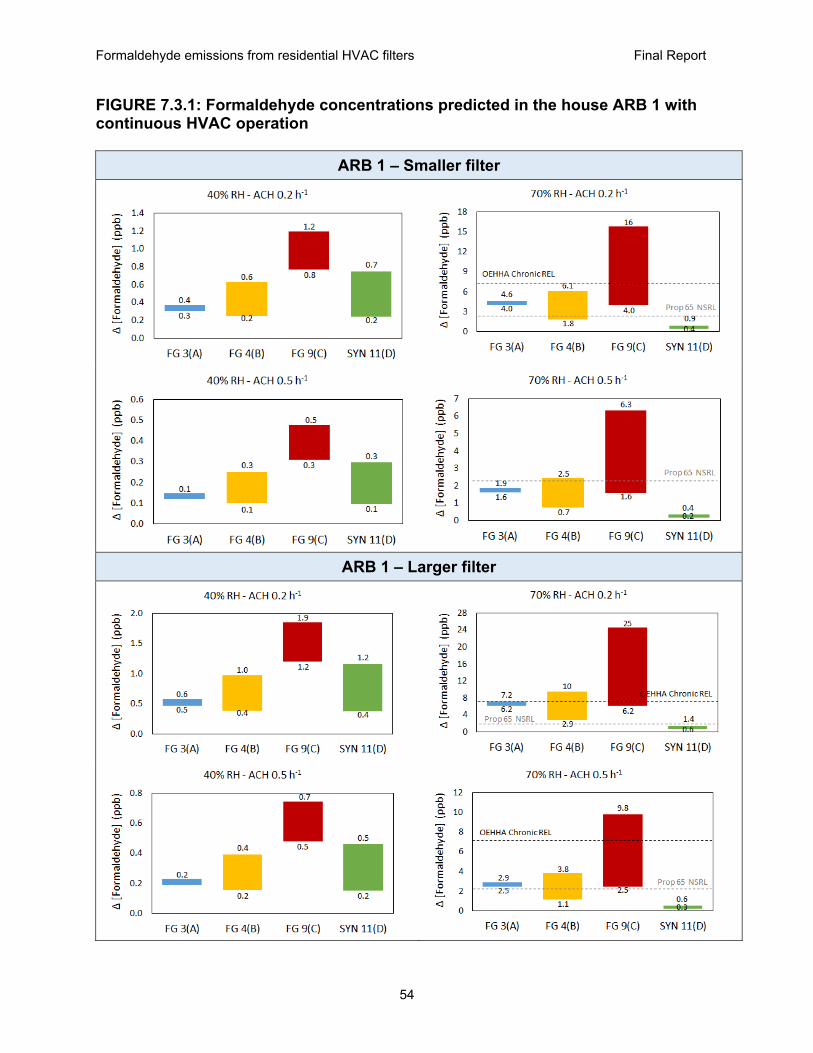
Formaldehyde emissions from residential HVAC filters Final Report
54
FIGURE 7.3.1: Formaldehyde concentrations predicted in the house ARB 1 with continuous HVAC operation
ARB 1 – Smaller filter
ARB 1 – Larger filter

Formaldehyde emissions from residential HVAC filters Final Report
55
FIGURE 7.3.2: Formaldehyde concentrations predicted in the house ARB 2 with continuous HVAC operation
ARB 2 – Smaller filter
ARB 2 – Larger filters
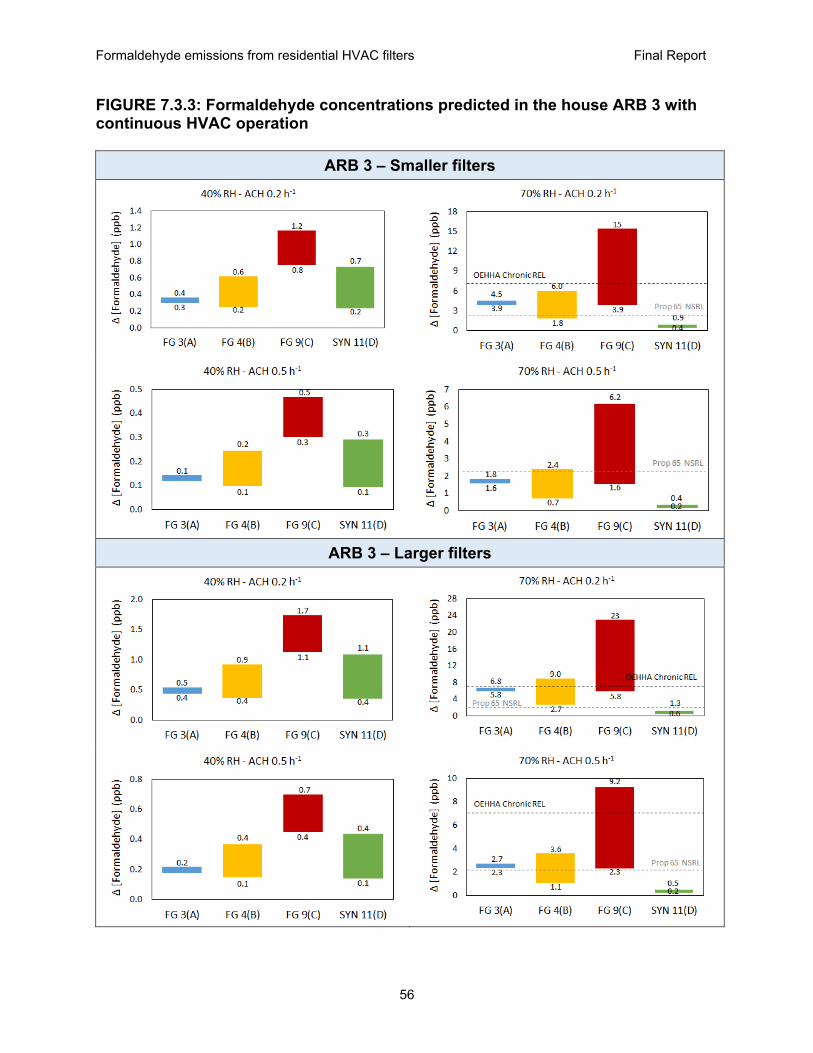
Formaldehyde emissions from residential HVAC filters Final Report
56
FIGURE 7.3.3: Formaldehyde concentrations predicted in the house ARB 3 with continuous HVAC operation
ARB 3 – Smaller filters
ARB 3 – Larger filters

Formaldehyde emissions from residential HVAC filters Final Report
57
7.4. Predicted effects in different climate zones in California Unless house design requires the HVAC system to operate continuously for mechanical ventilation or particle filtration, most common scenarios involve the operation of the HVAC system following duty cycles in which indoor air is circulated through filters intermittently, during only a fraction of the time. We adapted a model to calculate the hourly fraction of time during which the system is operating from a study by Logue et al (2012). In that study, a linear correlation between the fractional of time and the temperature differential ΔT between outdoor air and the thermostat setting was developed for different types of homes, located in different US climate zones as defined in the International Energy Conservation Code (IECC). The thermostat setting used in this modeling exercise was 18 oC (65 F) for heating and 26 oC (78 F) for cooling. An example of the data used to develop these correlations is illustrated in Figure 7.4.1. The IECC climate zones relevant to California used in this exercise were zones 3C, 3A, 2B and 4A. The model was applied to conditions found in eight different locations in the State, corresponding to some of the most relevant climate zones in terms of population density, and/or their extreme temperature and humidity conditions. The eight locations are shown on the map in Figure 7.4.2. FIGURE 7.4.1: Correlation between the fraction of time during which the HVAC is operating and the temperature differential between outdoor air and the thermostat setting (adapted from Logue et al, 2012). The data represent old homes (blue), new homes (red) and the average (black).
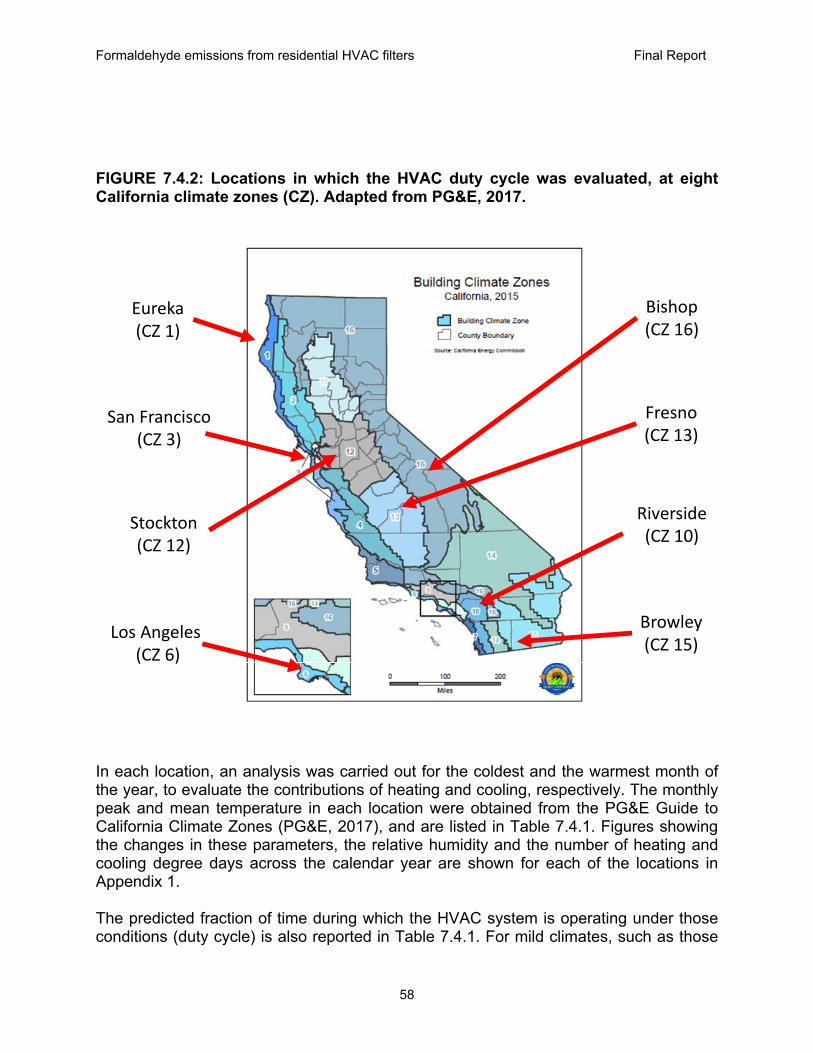
Formaldehyde emissions from residential HVAC filters Final Report
58
FIGURE 7.4.2: Locations in which the HVAC duty cycle was evaluated, at eight California climate zones (CZ). Adapted from PG&E, 2017.
San Francisco(CZ 3)
Los Angeles (CZ 6)
Stockton(CZ 12)
Riverside(CZ 10)
Fresno(CZ 13)
Browley(CZ 15)
Bishop(CZ 16)
Eureka(CZ 1)
In each location, an analysis was carried out for the coldest and the warmest month of the year, to evaluate the contributions of heating and cooling, respectively. The monthly peak and mean temperature in each location were obtained from the PG&E Guide to California Climate Zones (PG&E, 2017), and are listed in Table 7.4.1. Figures showing the changes in these parameters, the relative humidity and the number of heating and cooling degree days across the calendar year are shown for each of the locations in Appendix 1. The predicted fraction of time during which the HVAC system is operating under those conditions (duty cycle) is also reported in Table 7.4.1. For mild climates, such as those

Formaldehyde emissions from residential HVAC filters Final Report
59
in Los Angeles and San Francisco, the HVAC operates only roughly a third of the time under peak heating conditions (e.g., during a winter night), and a quarter of the time or less, on average, during the month of January. In those climate zones, the cooling season is very moderate and leads to an average of 8 – 15 % time fraction of HVAC use during peak conditions. By contrast, the HVAC duty cycle in more extreme cold and warm climates leads to peak time fractions in the range 40 – 80 % in the winter or summer respectively, which can be associated with potentially significant formaldehyde emissions if a fiberglass filter is present and if the relative humidity is elevated. TABLE 7.4.1: Extreme and mean monthly temperatures in eight cities corresponding to different CA climate zones during the peak heating and cooling seasons, and the corresponding fraction of time of HVAC operation.
CA climate zone
City
Heating season Cooling season
Month Temp. (oC) Hourly time
fractional Month Temp. (oC) Hourly time
fractional min mean min mean mean max mean max
1 Eureka JAN 5.0 8.9 41% 26% SEP 13.3 16.7 8%*
3 SF JAN 6.1 8.9 37% 26% SEP 17.8 22.8 8%
6 LA JAN 7.8 12.8 30% 10% AUG 20.5 24.4 15%
10 Riverside JAN 4.4 11.7 44% 15% JUL 20.0 34.4 55%
12 Stockton JAN 2.8 7.2 50% 32% JUL 24.4 35.0 15% 57%
13 Fresno JAN 2.8 7.8 50% 30% JUL 27.2 36.7 26% 63%
15 Browley JAN 3.9 12.8 50% 14% JUL 32.8 42.2 39% 77%
16 Bishop JAN ‐ 6.7 3.3 67% 37% JUL 24.4 36.7 4% 66%
* due to heating during the summer When it is cool outdoors, the moisture in outdoor air, assuming negligible indoor moisture generation, leads to low to moderate indoor RH values. In Figure 7.4.3, the red arrows along the absolute humidity (humidity ratio) lines shown in the psychrometric chart indicate that by heating outdoor air from low temperatures below 7 oC (45 F) to the thermostat setting of 18 oC (65 F), the contribution of the additional moisture to indoor RH was at most 35%, but could be as low as 10%.

Formaldehyde emissions from residential HVAC filters Final Report
60
During the summer, if air conditioning is employed, the air conditioning substantially controls the indoor humidity. As air passes over the cooling coil of the air conditioner, water vapor condenses and the liquid water is removed via a drain. With a temperature of 7 oC (45 F) for air exiting the cooling coil, assuming the air leaving the coil is moisture saturated, this air has a relative humidity of only 30% when it is heated to the indoor temperature of 25.5 oC (78 F). . Higher temperatures for air exiting the coil, incomplete moisture saturation of this air, discontinuous HVAC operation, and indoor moisture generation can lead to higher indoor humidities during the summer, but based on an average of data from a survey (Offermann, 2009), the indoor relative humidity in summer is often on the order 48 % (± 11 % standard deviation). Since outdoor air alone, in California, is unlikely to contribute enough moisture to reach high indoor RH levels in most situations, it is particularly relevant to consider contributions from indoor moisture sources. An estimate of the amount of water emitted during typical activities carried out by a family of four members was adapted from the literature (Trechsel, 1994), and is presented in Table 7.4.2. A near upper limit for the total emission rate EH2O = 12.3 liters of liquid water per day (equivalent to 513 grams per hour) was predicted for this scenario. This emission rate was used to calculate the absolute humidity corresponding to each of the three model homes and the two air exchange rates (λ) used in this study. The increment in indoor concentration of water vapor (CH2O) resulting from indoor moisture generation in each case was calculated as
V
EC OH
OH2
2 (7.3)
where EH2O is the water vapor emission rate in volumetric units, and V is the volume of the indoor space in each home. The associated relative humidity, neglecting moisture in incoming outdoor air, corresponding to the winter thermostat setting temperatures was predicted based on those CH2O values using the psychrometric chart from Figure 7.4.3, and are reported in Table 7.4.3. Just as in the case of outdoor moisture sources described above, these predicted indoor contributions assume that all the emitted water vapor remains in the gas phase, neglecting potential losses to surfaces. In addition, these indoor relative humidity values assume no moisture removal by air conditioning systems.

Formaldehyde emissions from residential HVAC filters Final Report
61
FIGURE 7.4.3: Psychrometric chart indicating predicted changes in relative humidity associated with heating outdoor air from the corresponding January average values for each city to the thermostat setting of 65 F.
Fresno, Stockton
Riverside
Bishop
Browley
Los Angeles, San Francisco
70% RH 40% RH
Eureka
Adapted from: http://alpha.sdsu.edu/testhome/tablesModule/tablesMA/psychro.html

Formaldehyde emissions from residential HVAC filters Final Report
62
TABLE 7.4.2: Contribution of key residential moisture sources estimated for a family of four members (adapted from Trechsel et al, 1994)
Activity EH2O
(L day-1) 5-min shower: 0.25 L (x4) 1.0 Cooking on gas range 2.4 Dishwashing 0.5 Floor mopping: 0.15 m2 (x 20 m2) 3.0 House plants 0.4 Respiration / perspiration: 0.2 L h-1 5.0 TOTAL 12.3
TABLE 7.4.3: Indoor relative humidity associated with indoor residential moisture sources, neglecting the water vapor in the outdoor air that enters the home, and assuming no moisture removal by air conditioning
Home Air exchange
rate (h-1) Relative humidity (%) @ 65 F @ 78 F
ARB 1 0.2 80 50 0.5 32 20
ARB 2 0.2 45 25 0.5 18 10
ARB 3 0.2 20 10 0.5 8 4

Formaldehyde emissions from residential HVAC filters Final Report
63
From the values presented in Table 7.4.3, high relative humidity values leading to significant formaldehyde emissions from fiberglass filters were only observed in the ARB 1 home operating at the low air exchange rate of 0.2 h-1 during the winter (i.e., with a thermostat setting of 18 oC, or 65 F). Under this scenario, fiberglass filters may become a significant source of indoor formaldehyde. We predicted the expected increase in indoor formaldehyde concentrations under this extreme scenario for each climate zone, by applying the corresponding fraction of time during which the HVAC system was operating during January (monthly average) as reported in Table 7.4.1. The results are shown in Figure 7.4.4, where the bars represent the range of values that can be achieved using different fiberglass fibers, from the lowest to the highest emitter, using our chamber values of formaldehyde emission rate measured at high RH. Under these extreme conditions, the Prop 65 NSRL is exceeded in almost all cases at least for the highest emitters, and the OEHHA chronic REL for formaldehyde is exceeded only in Bishop, Stockton and Fresno for the highest emitting filters. A more typical condition was evaluated by considering moisture emissions from a family of four living in the ARB 2 home using two fiberglass filters of 12” by 24” and 24” by 24”. When the air exchange rate was also 0.2 h-1 and the thermostat setting was 65 F, the predicted RH was 45%. Using the formaldehyde emission factors determined in our chamber at the lower RH setting, the contributions of indoor formaldehyde concentrations presented in Figure 7.4.5 were estimated. Under these less extreme conditions, the contributions of fiberglass filters to indoor formaldehyde levels were negligible in all the climate zones.

Formaldehyde emissions from residential HVAC filters Final Report
64
FIGURE 7.4.4: Increase in formaldehyde concentration expected when a 18” x 12” fiberglass filter is used in the ARB 1 home with four occupants, an air exchange of 0.2 h-1 and a thermostat setting of 65 F (winter conditions)
9.3
1.1
8.1
0.94
7.6
0.88
6.4
0.75
6.4
0.75
3.7
0.43
3.6
0.41
2.6
0.30
0.0
1.0
2.0
3.0
4.0
5.0
6.0
7.0
8.0
9.0
10.0
Bishop (37%) Stockton (32%) Fresno (30%) Eureka (26%) San Francisco(26%)
Riverside (15%) Browley (14%) Los Angeles(10%)
Δ[Form
aldehyde] (ppb)
Prop 65 NSRL
OEHHA Chronic REL
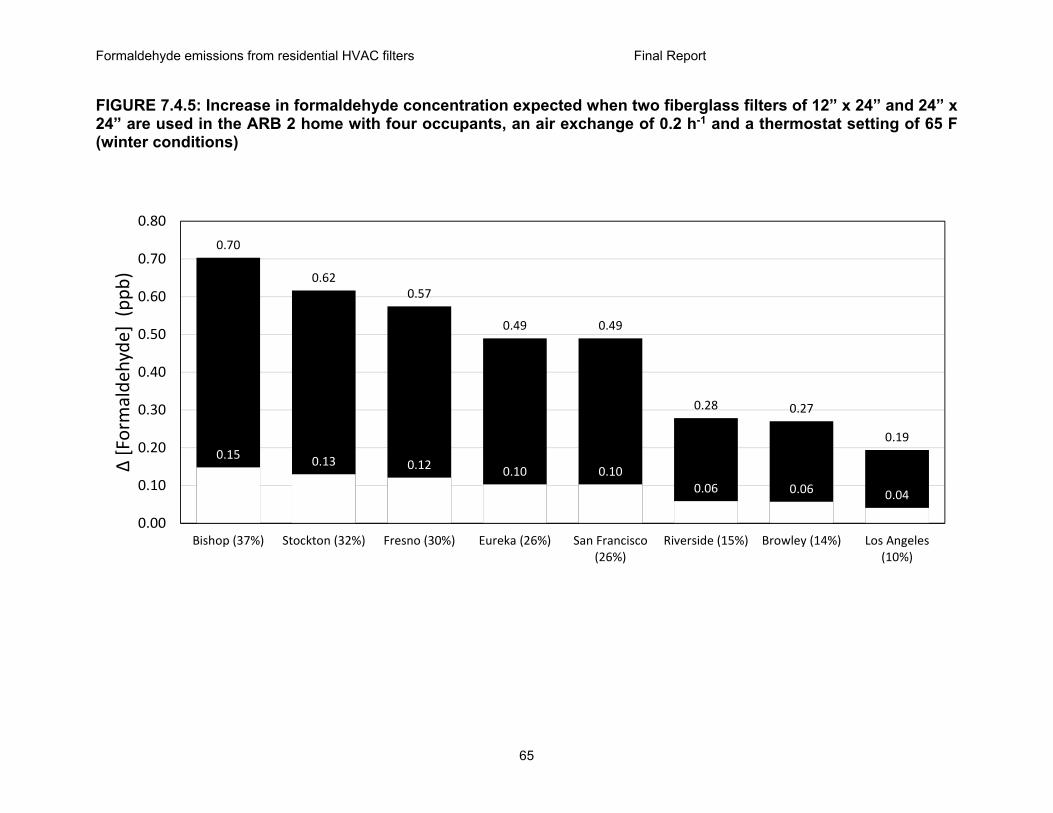
Formaldehyde emissions from residential HVAC filters Final Report
65
FIGURE 7.4.5: Increase in formaldehyde concentration expected when two fiberglass filters of 12” x 24” and 24” x 24” are used in the ARB 2 home with four occupants, an air exchange of 0.2 h-1 and a thermostat setting of 65 F (winter conditions)
0.70
0.15
0.62
0.13
0.57
0.12
0.49
0.10
0.49
0.10
0.28
0.06
0.27
0.06
0.19
0.04
0.00
0.10
0.20
0.30
0.40
0.50
0.60
0.70
0.80
Bishop (37%) Stockton (32%) Fresno (30%) Eureka (26%) San Francisco(26%)
Riverside (15%) Browley (14%) Los Angeles(10%)
Δ[Form
aldehyde] (ppb)
Formaldehyde emissions from residential HVAC filters Final Report
66
8. SUMMARY, CONCLUSIONS AND RECOMMENDATIONS This study demonstrated that residential fiberglass filters emit formaldehyde in contact with humidified air, consistent with previous studies of commercial building filters. It also showed that those emissions increased greatly with RH, leading to potentially substantial contributions to indoor concentrations of this pollutant under certain worst-case scenarios. By contrast, synthetic filters were a much weaker source of formaldehyde under all RH conditions. From the range of scenarios considered for this analysis, high indoor formaldehyde was only predicted for a particular set of conditions, i.e., a small apartment with high occupancy (4 people), low ventilation rates and cold or warm outdoor climates. Under such conditions, the maximum predicted indoor concentrations ranged from 2.6 to 9.3 ppb, which exceeded Proposition 65 NSRL for formaldehyde in all climate zones. They also exceeded the OEHHA chronic REL of 7 ppb in Bishop (CZ 16), Stockton (CZ 12) and Fresno (CZ 13), and were less than 1 ppb below the chronic REL also in Eureka (CZ 1) and San Francisco (CZ 3), where indoor formaldehyde concentrations may also exceed the OEHHA chronic REL after adding the background formaldehyde levels. All other scenarios considered in this study led to much lower contributions to indoor formaldehyde concentrations, and the source strength of fiberglass filters in many cases could be considered negligible. This is particularly the case for coastal areas with milder climates. This study was limited to a few experimental conditions, and the model included only eight California climate zones. Future research could expand the scope by exploring RH conditions not covered here. In particular, more detail on formaldehyde emissions taking place at intermediate values between 40 and 70 % RH could be helpful to better assess conditions that are less extreme but more likely to be found indoors on a larger fraction of homes in the State. Emissions arising from hydrolysis and degradation of polymers on the filter surface are very sensitive to the moisture content of the air, and are not linear, which makes it difficult to interpolate between the emission rates at 40 % and 70 % RH. More information on real-world indoor RH values could be also highly beneficial, to predict not only formaldehyde emissions from fiberglass materials, but also several other indoor air quality problems in which moisture plays a role. It should also be kept in mind that this study was carried out with brand-new filters over short periods of times that did not exceed one or two weeks, and using clean laboratory-controlled air. Operation of these filters over several months in homes leads to buildup of a dust layer (“filter cake”), which may affect polymer degradation and formaldehyde emissions. Tests carried out with residential filters procured from retailers suggest that, if the dust layer serves as a reservoir for moisture, the degradation of binders and glues may be accelerated and formaldehyde emissions may increase (Destaillats et al, 2011). These findings will support ARB’s efforts in curbing indoor formaldehyde levels by identifying the most relevant sources. In particular, this study will help assess the relevance of ventilation filters as a formaldehyde source under the key conditions found

Formaldehyde emissions from residential HVAC filters Final Report
67
indoors at different California climates, and identify approaches to reduce this pollutant source e.g., by switching to synthetic filters or using fiberglass filters with formaldehyde-free binders when appropriate. More broadly, this study can help the State assist the public in making informed decisions when purchasing and using residential filters. It will also contribute to identifying which health and indoor air quality concerns associated with particle filtration need to be further addressed. The results of this study provide information that can be used to support guidance or building codes for filters used in heating and air conditioning systems in California, which would reduce indoor formaldehyde exposures. In a broader sense, information generated in this work will contribute to indoor air quality (IAQ) improvement efforts carried out by ARB. Formaldehyde emissions from building products (e.g., insulation, wood products) containing urea-formaldehyde and phenol-formaldehyde polymers has been identified as a problem decades ago. Emissions from ventilation filters appear to arise from the same chemical processes. Source-control strategies may include changing the polymers used as binders and/or replacing fiberglass with other lower-emitting materials. Fiberglass fibers are at the low end of the price range for residential filters, so implementing these strategies likely involves both technical and cost barriers. This study contributes new information on relative source strength of different filter components. The fact that the filter’s frame is sometimes a major formaldehyde source is a finding that has not been yet described in the literature, and is relevant to fully assess emission. Testing that quantify formaldehyde emissions of only the core media may lead to underestimation of the overall contribution of fiberglass filters to indoor formaldehyde levels.

Formaldehyde emissions from residential HVAC filters Final Report
68
References
Arena, L., P. Mantha and A. N. Karagiozis. 2010. "Monitoring of internal moisture loads in residential buildings." ORNL Report. https://www.huduser.gov/publications/pdf/internalmoistureload.pdf
Beko, G., G. Clausen and C. J. Weschler. 2007. "Ffurther studies of oxidation processes on filter surfaces: Evidence for oxidation products and the influence of time in service." Atmos. Environ. 41: 5202-5212.
Beko, G., O. Halas, G. Clausen and C. J. Weschler. 2006. "Initial studies of oxidation processes on filter surfaces and their impact on perceived air quality." Indoor Air 16: 56-64.
Björkroth, M., A. Torkki and O. Seppänen. 1997. "Effect of particulate filter on perceived air quality." Proceedings of Healthy Buildings’97, vol. 1, Washington, DC, 1997; pp. 557–62.
CARB. 2008. "Airborne Toxic Control Measure (ATCM) to Reduce Formaldehyde Emissions from Composite Wood Products." http://www.arb.ca.gov/regact/2007/compwood07/compwood07.htm.
Clausen, G. 2004. "Ventilation filters and indoor air quality: a review of research from the International Centre for Indoor Environment and Energy." Indoor Air 14, Suppl. 7: 202-207.
Cogliano, V. J., Y. Grosse, R. A. Baan, K. Straif, M. B. Secretan and F. El Ghissassi. 2005. "Meeting Report: summary of IARC Monographs on formaldehyde, 2-butoxyethanol and 1-tert-butoxy-2-propanol." Environ. Health Perspectives 113: 1205-1208.
Destaillats, H., W. Chen, M. G. Apte, N. Li, M. Spears, J. Almosni, G. Brunner, J. Zhang and W. J. Fisk. 2011. "Secondary pollutants from ozone reactions with ventilation filters and degradation of filter media additives." Atmos. Environ. 45: 3561-3568.
Destaillats, H., M. M. Lunden, B. C. Singer, B. K. Coleman, A. T. Hodgson, C. J. Weschler and W. W. Nazaroff. 2006. "Indoor secondary pollutants from household product emissions in the presence of ozone: A bench-scale chamber study." Environmental Science & Technology 40(14): 4421-4428.
Fanger, P. O., J. Lauridsen, P. Bluyssen and G. Clausen. 1988. "Air pollution sources in offices and assembly halls quantified by the olf unit." Energy and Buildings 12: 7-19.
Finke, U. and K. Fitzner (1993). Ventilation and air-conditioning systems—investigations to the odour and possibilities of cleaning. Proceedings of Indoor Air ’93. Indoor Air ’93, Helsinki, Vol. 6, 1993; pp. 279–284. P. Kalliokoski, Jantunen, M., Seppänen, O.,.

Formaldehyde emissions from residential HVAC filters Final Report
69
Girman, J. R., G. E. Hadwen, L. E. Burton, S. E. Womble and J. F. McCarthy. 1999. "Individual volatile organic compound prevalence and concentrations in 56 buildings of the building assessment survey and evaluation (BASE) study. ." Proceedings of the 8th International Conference on Indoor Air Quality and Climate. Edinburgh, Vol. 2, 1999. pp. 460-465.
Hodgson, A. T., D. Beal and J. E. R. McIlyaine. 2002. "Sources of formaldehyde, other aldehydes and terpenes in a new manufactured house." Indoor Air 12: 235-242.
Hodgson, A. T. and H. Levin. 2003. "Classification of measured indoor volatile organic compounds based on noncancer health and comfort considerations. ." LBNL Report 53308, Lawrence Berkeley National Laboratory, Berkeley, California, 2003. .
Hun, D. E., R. L. Corsi, M. T. Morandi and J. A. Siegel. 2010. "Formaldehyde in residences: long-term indoor concentrations and influencing factors." Indoor Air 20: 196-203.
Hutten, I. M. (2007). Handbook of nonwoven filter media. Elsevier Ltd, Oxford, UK, ISBN: 978-1-85617-441-1.
Hyttinen, M., P. Pasanen, M. Bjorkroth and P. Kalliokoski. 2007. "Odors and volatile organic compounds released from ventilation filters." Atmos. Environ. 41: 4029-4039.
Hyttinen, M., P. Pasanen and P. Kalliokoski. 2006. "Removal of ozone on clean, dusty and sooty supply air filters." Atmos. Environ. 40: 315-325.
IARC. 2006. "IARC Monographs on the Evaluation of Carcinogenic Risks to Humans. Formaldehyde, 2-Butoxyethanol and 1-tert-Butoxypropan-2-ol." World Health Organization, International Agency for Research on Cancer Vol. 88.
Jenkins, R. A., B. Tomkins and M. R. Guerin (2000). Chemistry of environmental tobacco smoke: composition and measurement.
Kelly, T. J., D. L. Smith and J. Satola. 1999. "Emission rates of formaldehyde from materials and consumer products found in California homes." Environ. Sci. Technol. 33: 81-88.
Liu, W. L., J. F. Zhang, C. P. Weisel, B. J. Turpin, M. T. Morandi, S. Colome, T. H. Stock and L. Korn. 2006. "Estimating contributions of indoor and outdoor sources to indoor carbonyl concentrations in three urban areas of the United States." Atmos. Environ. 40: 2202-2214.
Logue, J. M., N. E. Klepeis, A. B. Lobscheid and B. C. Singer. 2014. "Pollutant exposures from natural gas cooking burners: a simulation-based assessment for Southern California." Environ. Health Perspectives 122: 43-50.
Logue, J.M., W.J.N. Turner, I.S. Walker, B.C. Singer. 2012. "Evaluation of an incremental ventilation energy model for estimating impacts of air sealing and

Formaldehyde emissions from residential HVAC filters Final Report
70
mechanical ventilation". LBNL Report 5796E. https://indoor.lbl.gov/publications/evaluation-incremental-ventilation
Modigliani P. 1951. "Glass product and methods of making the same". US Patent number US 2546230 https://www.google.com/patents/US2546230
Molhave, L., S. Dueholm and L. K. Jensen. 1995. "Assessment of Exposures and Health Risks Related to Formaldehyde Emissions from Furniture: a Case Study." 5(104-119).
Nazaroff, W. W. and B. C. Singer. 2004. "Inhalation of hazardous air pollutants from environmental tobacco smoke in US residences." J. Exposure Anal. and Environ. Epidemiology 14: S71-S77.
OEHHA. 2012. "California Office of Environmental Health Hazard Assessment. Acute, 8-hour and chronic Reference Exposure Level (REL) summary. http://oehha.ca.gov/air/allrels.html."
Offermann, F. J. 2009. "Ventilation and Indoor Air Quality in New Homes. ." California Air Resources Board and California Energy Commission, PIER Energy‐Related Environmental Research Program. Collaborative Report. CEC‐500‐2009‐085. http://www.arb.ca.gov/research/apr/past/04-310.pdf.
Park, B. D. and H. W. Jeong. 2011. "Hydrolytic stability and crystallinity of cured urea-formaldehyde resin adhesives with different formaldehyde/urea mole ratios." Int. J. Adhes. Adhes. 31: 524-529.
Pasanen, P., Teijonsalo, J., Seppanen, O., Ruuskanen, J. and Kalliokoski, P. 1994. "Increase in perceived odor emissions with loading of ventilation filters " Indoor Air 4: 106-113.
PG&E. 2017. Guide to California Climate Zones https://www.pge.com/myhome/edusafety/workshopstraining/pec/toolbox/arch/climate/index.shtml
Salthammer, T. 2013. "Formaldehyde in the ambient atmosphere: from an indoor pollutant to an outdoor pollutant?" Angew Chem Int Ed Engl. 52 (12): 3320-3327.
Salthammer, T., S. Mentese and R. Marutzky. 2010. "Formaldehyde in the indoor environment." Chem. Rev. 110: 2536-2572.
Sidheswaran, M., W. Chen, A. Chang, R. Miller, S. Cohn, D. Sullivan, W. J. Fisk, K. Kumagai and H. Destaillats. 2013. "Formaldehyde emissions from ventilation filters under different relative humidity conditions." Environ. Sci. Technol. 47: 5336-5343.
Singer, B.C., W.W. Delp, D.R. Black, H. Destaillats, I.S. Walker. 2016. "Reducing in-home exposure to air pollution". Final report to CARB contract number 11-311. https://www.arb.ca.gov/research/apr/past/11-311.pdf

Formaldehyde emissions from residential HVAC filters Final Report
71
Singer, B. C., H. Destaillats, A. T. Hodgson and W. W. Nazaroff. 2006. "Cleaning products and air fresheners: emissions and resulting concentrations of glycol ethers and terpenoids." Indoor Air 16(3): 179-191.
Stephens, B. and J.A. Siegel. 2013. "Ultrafine particle removal by residential heating, ventilating and air-conditioning filters" Indoor Air 23:488-497.
Trechsel, H.R., Editor. 1994. "Moisture Control in Buildings". ASTM Manual Series: MNL 18, American Society for Testing and Materials, Philadelphia, PA.
US EPA. 2003. "A standardized EPA protocol for characterizing indoor air quality in large office buildings". Washington DC.
US EPA. 1999. "Compendium Method TO-11A�Determination of Formaldehyde in Ambient Air Using Adsorbent Cartridge Followed by HPLC [Active Sampling Methodology]". Office of Research and Development, U.S. Environmental Protection Agency (U.S. EPA): Cincinnati, OH, 1999.
Whitmore, R., A. Clayton and G. Akland. 2003. "California portable classrooms study. Phase II: Main study." Contract N. 00-317, California Air Resources Board http://www.arb.ca.gov/research/indoor/pcs/pcs-fr/pcs_v2_ph2_main_03-23-04.pdf.
WHO. 2006. "World Health Organization International Agency for Research on Cancer, IARC monographs on the evaluation of carcinogenic risks to humans. Volume 88. Formaldehyde, 2-butoxyethanol, 1-tert-butoxypropan-2-ol. Summary of data reported and evaluation." http://monographs.iarc.fr/ENG/Monographs/vol88/volume88.pdf.
Zhao, P., J. A. Siegel and R. L. Corsi. 2007. "Ozone removal by HVAC filters." Atmos. Environ. 41: 3151-3160.
Formaldehyde emissions from residential HVAC filters Final Report
72
List of Publications Generated by this Study
A journal articles is currently being prepared that will summarize the findings of this project. It will be submitted for publication at the beginning of 2018:
Tentative title: “Formaldehyde emissions from residential fiberglass HVAC filters. Laboratory measurements and predicted contribution to indoor levels”” Authors: H. Destaillats, M. Russell, W.J. Fisk Target journal: Environ. Sci. Technol.
In addition, an oral presentation will be delivered at Indoor Air 2018, to be held in Philadelphia, PA, in June 2018.
Formaldehyde emissions from residential HVAC filters Final Report
73
Glossary of Terms, Abbreviations and Symbols
A = filter surface area [m2]
ARB = Air Resources Board
BPF = bare phenol-formaldehyde products (formaldehyde source)
BUF = bare urea-formaldehyde products (formaldehyde source)
CDPH = California Department of Public Health
CEC = California Energy Commission
CUF = coated urea-formaldehyde products (formaldehyde source)
CZ = climate zone
DNPH = dinitrophenyl hydrazine
∆[F] = incremental concentration of formaldehyde [μg m-3]
DL = decorative laminates (formaldehyde source)
EF = formaldehyde emission rate [μg h-1]
EF/A = surface-normalized formaldehyde emission rates [μg h-1 m-2]
EH2O = water vapor emission rate [L day-1]
EPA = Environmental Protection Agency
Fupstream = upstream formaldehyde concentration [μg m-3]
Fdownstream = downstream formaldehyde concentration [μg m-3]
f = chamber air flow [m3 h-1]
Φ = ratio of the filter surface area to the home floor area [unitless]
FG = fiberglass filters
HPLC = high pressure (performance) liquid chromatography
HVAC = heating, ventilation and air conditioning system
IAQ = indoor air quality
IARC = International Agency for Research on Cancer
IECC = International Energy Conservation Code
IEC = International Electrotechnical Commission
ISO = International Organization for Standardization
λ = air exchange rate [h-1]
LBNL = Lawrence Berkeley National Laboratory

Formaldehyde emissions from residential HVAC filters Final Report
74
MERV = minimum efficiency reporting value
MFC = mass flow controller
n = number of filters used in each test
NIST = National Institute of Standards and Technology
NSRL = no significant risk level [μg]
OEHHA = Office of Environmental Health Hazard Assessment (California)
P = paper goods (formaldehyde source)
PAC = project advisory committee
PM = particulate matter
PP = permanent press fabrics (formaldehyde source)
REL = reference exposure level [μg m-3]
RH = relative humidity [%]
SOA = secondary organic aerosol
SYN = synthetic filter
T = Temperature [oC]
TD/GC/MS = thermal desorption / gas chromatography / mass spectrometry
UF = urea-formaldehyde resin
V = chamber volume [m3]
VOC = volatile organic compound
WHO = World Health Organization

Formaldehyde emissions from residential HVAC filters Final Report
75
APPENDICES
APPENDICES

Formaldehyde emissions from residential HVAC filters Final Report
76
APPENDIX 1 Degree days, average temperature and relative humidity in selected locations at different California climate zones These figures were adapted from the PG&E Guide to California Climate Zones (PG&E, 2017).
Figure A.1.1 Climate Zone 1: Eureka
DUTYCYCLE
Heating (January)
Cooling (Sept)
Min T 37% ‐
Average T 26% ‐
Max T 10% 8%

Formaldehyde emissions from residential HVAC filters Final Report
77
Figure A.1.2 Climate Zone 3: San Francisco
DUTYCYCLE
Heating (January)
Cooling (Sept)
Min T 37% ‐
Average T 26% ‐
Max T 10% 8%

Formaldehyde emissions from residential HVAC filters Final Report
78
Figure A.1.3 Climate Zone 6: Los Angeles (coastal)
DUTYCYCLE
Heating (January)
Cooling (Aug)
Min T 30% ‐
Average T 10% ‐
Max T ‐ 8%

Formaldehyde emissions from residential HVAC filters Final Report
79
Figure A.1.4 Climate Zone 10: Riverside
DUTYCYCLE
Heating (January)
Cooling (July)
Min T 44% ‐
Average T 15% ‐
Max T ‐ 55%
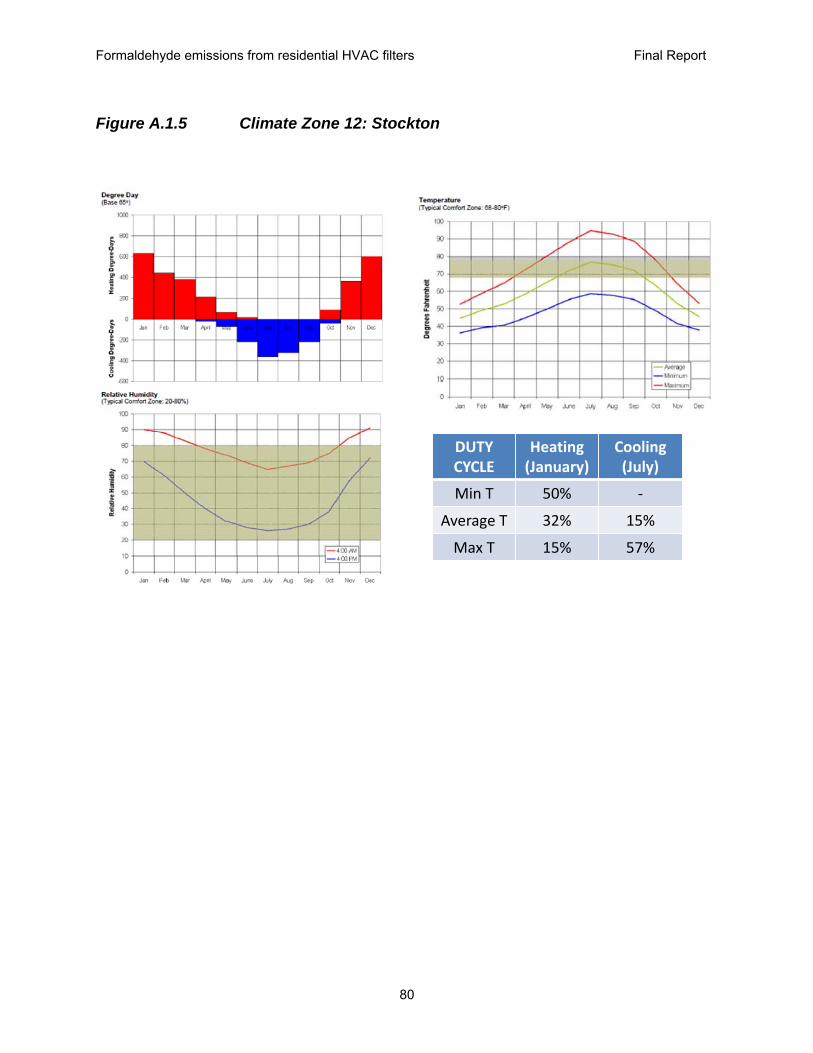
Formaldehyde emissions from residential HVAC filters Final Report
80
Figure A.1.5 Climate Zone 12: Stockton
DUTYCYCLE
Heating (January)
Cooling (July)
Min T 50% ‐
Average T 32% 15%
Max T 15% 57%

Formaldehyde emissions from residential HVAC filters Final Report
81
Figure A.1.6 Climate Zone 13: Fresno
DUTYCYCLE
Heating (January)
Cooling (July)
Min T 50% ‐
Average T 30% 26%
Max T 10% 63%

Formaldehyde emissions from residential HVAC filters Final Report
82
Figure A.1.7 Climate Zone 15: Browley
DUTYCYCLE
Heating (January)
Cooling (July)
Min T 50% 3%
Average T 14% 39%
Max T ‐ 77%

Formaldehyde emissions from residential HVAC filters Final Report
83
Figure A.1.8 Climate Zone 16: Bishop
DUTYCYCLE
Heating (January)
Cooling (July)
Min T 67% ‐
Average T 37% 4%
Max T 10% 66%


