Characterization of User Mobility Trajectories by ...
72
Characterization of User Mobility Trajectories by Implementing Clustering Techniques. A Master's Thesis Submitted to the Faculty of the Escola Tècnica d'Enginyeria de Telecomunicació de Barcelona Universitat Politècnica de Catalunya by Freddy Cróquer In partial fulfilment of the requirements for the degree of MASTER IN TELECOMMUNICATIONS ENGINEERING Advisor: Oriol Sallent Barcelona, 2017
Transcript of Characterization of User Mobility Trajectories by ...

Characterization of User Mobility Trajectories by Implementing Clustering Techniques.
A Master's Thesis
Submitted to the Faculty of the
Escola Tècnica d'Enginyeria de Telecomunicació de Barcelona
Universitat Politècnica de Catalunya
by
Freddy Cróquer
In partial fulfilment
of the requirements for the degree of
MASTER IN TELECOMMUNICATIONS ENGINEERING
Advisor: Oriol Sallent
Barcelona, 2017


1
Abstract
Current and legacy technologies for wireless communications are facing an explosive
demand of capacity and resources, triggered by an exponential growing of traffic, mainly
due to the proliferation of smartphones and the introduction of demanding multimedia and
video applications. There is the anticipation that future generation of wireless
communications systems, 5G, will attend the growing demand on capacity and network
resources, along with the necessity for blending novel technology concepts including
Internet of Things, machine communications, the introduction of heterogeneous network
architectures, massive arrays of antennas and dynamic spectrum allocation, among
others.
Moreover, self-organizing networks (SON) functions incorporated in present mobile
communication standards provide limited levels of proactivity. Therefore, it is foreseen
that future network are required of highly automation and real-time reaction to network
problems, topology changes and dynamic parameterization.
The flexibility to be introduced in 5G networks by incorporating virtualized hardware
architecture and cloud computing, allow the inclusion of big data analytics capabilities for
finding insights and taking advantage of the vast amounts of data generated in the
network system. The full embodiment of big data analytics among the Radio Access
Network optimization and planning processes, allow gathering an end to end knowledge
and reaching the individual user level granularity.
The purpose of this work is to provide a case of study for smartly processing collected
data from mobility traces by using a hierarchical clustering function, an unsupervised
method of data analytics, for characterizing the different user mobility trajectories to
extract an individual user mobility profile.
The methodology proposed references a knowledge discovery framework which uses
Artificial Intelligence processes for finding insights in collected network data and the use
of this knowledge for driving SON functions, other optimization and planning processes,
and novel operator business cases.
Keywords:
RAN planning and optimization, 5G, LTE, SON, Machine Learning, Data Analytics, Big
Data, Hierarchical Agglomerative Clustering, User-Level Knowledge, Knowledge
Discovery.

2
Dedication:
To my mother María González, my grandmother Ramona González Pacheco and my
grandfather Aristómenes Gonzalez for loving me in excess.
To my friends María Alejandra Pérez, Daniel Hernández, Alejandro Padilla and Pol
Alemany who accompanied me in this chapter of my life.
To all the wireless telecommunication professionals for your day by day hard work.

3
Acknowledgments
I would like to thank to all the professors and fellow telecommunication professionals who
lead me to reach this point of my professional career and assisted me in this project: To
Diógenes Marcano, Miguel Diaz, Andrea Marcano, Luis Lago, Neil Fernández, Oriol
Sallent, Ramón Ferrús, Juan Sánchez González and Anna Umbert.

4
Revision history and approval record
Revision Date Purpose
0 23/12/2016 Document creation
1 25/02/2017 Chapter 1 and 2 corrected
2 28/04/2017 Chapter 3 and 4 corrected.
3 8/05/2017 Last version corrected.
Written by: Reviewed and approved by:
Date 08/05/2017 Date 08/05/2017
Name Freddy Cróquer Name Oriol Sallent
Position Project Author Position Project Supervisor

5
Table of contents
Abstract ................................................................................................................................. 1
Acknowledgments ................................................................................................................ 3
List of figures ........................................................................................................................ 7
List of tables ......................................................................................................................... 9
List of Abbreviations ........................................................................................................... 10
1. Introduction .................................................................................................................. 11
1.1. Objectives: ........................................................................................................... 14
1.2. Thesis outline ....................................................................................................... 14
1.3. 1.3 Workflow ........................................................................................................ 15
2. Data analytics and the New Generation of Mobile Communications Network
Technologies Context. ........................................................................................................ 17
2.1. Data analytics and mobile cellular networks scenario ........................................ 17
2.1.1. Big traffic data ............................................................................................... 18
2.1.2. Big location data ........................................................................................... 18
2.1.3. Big heterogeneous data ............................................................................... 19
2.2. 5G networks overview. ........................................................................................ 19
2.2.1. Current and Future Mobile Networks Challenges and Requirements. ........ 20
2.2.2. Network flexibility through virtualized architecture....................................... 21
2.3. SON and data analytics in 5G context. ............................................................... 22
2.4. User-level knowledge discovery through ML techniques.................................... 23
2.5. Previous work on user mobility patterns ............................................................. 25
3. Methodology for Categorizing Mobility Patterns using Clustering Techniques ......... 27
3.1. Data Acquisition and preprocessing stage: ......................................................... 27
3.1.1. Qualipoc software ......................................................................................... 29
3.1.2. NQView software .......................................................................................... 32
3.2. Knowledge Discovery Stage................................................................................ 34
3.2.1. Clustering Algorithms ................................................................................... 34
3.2.2. Data analytics software selection ................................................................. 38
3.2.2.1. RStudio ....................................................................................................... 38
3.2.2.2. RapidMiner ................................................................................................. 42
3.2.2.3. Final selection of data analytics tool. ......................................................... 50
3.3. Knowledge exploitation stage: ............................................................................. 50
4. Results......................................................................................................................... 52

6
4.1. Data acquisition and pre-processing stage. ........................................................ 52
4.2. Knowledge discovery stage: Characterization of user mobility pattern. ............. 55
4.2.1. Weighted edit distance computation. ........................................................... 55
4.2.2. Hierarchical Agglomerative Clustering for mobility routes characterization.57
4.3. Knowledge Explotaition ....................................................................................... 59
4.3.1. SON functions and network performance applications. .............................. 59
4.3.2. OTT services and MNO related business cases ......................................... 60
5. Conclusions and Future Work .................................................................................... 62
5.1. Conclusions ......................................................................................................... 62
5.2. Future Work ......................................................................................................... 62
Bibliography ........................................................................................................................ 64
Appendices ......................................................................................................................... 66
Appendix A. ................................................................................................................. 66
Appendix B .................................................................................................................. 69

7
List of figures
Fig. 1. Gantt chart of this project. ....................................................................................... 16
Fig. 2. AI-SON knowledge based process. [Source: UPC]. .............................................. 27
Fig. 3. Map of Routes ......................................................................................................... 28
Fig. 4. Main Qualipoc Interface .......................................................................................... 29
Fig. 5. Qualipoc actions menu............................................................................................ 30
Fig. 6. Qualipoc job settings. .............................................................................................. 31
Fig. 7. NQView Workspace. ............................................................................................... 33
Fig. 8. NQView Extracted Parameters. .............................................................................. 33
Fig. 9. Dendrogram: Hierarchical clustering representation. [Source:Morgan Kaufmann] 36
Fig. 10. Agglomerative and divisive clustering algorithms [Source:Morgan Kaufmann] ... 36
Fig. 11. Weighted edit distance example. .......................................................................... 38
Fig. 12. RStudio Layout. ..................................................................................................... 39
Fig. 13. RStudio loaded dataset.. ....................................................................................... 40
Fig. 14. Weighed edit distance matrix ................................................................................ 40
Fig. 15. Agnes Dendrogram. .............................................................................................. 41
Fig. 16. General view of Rapidminer’s design perspective. .............................................. 43
Fig. 17. RapidMiner's Repository View. ............................................................................. 43
Fig. 18. RapidMiner Operations View. ............................................................................... 44
Fig. 19. RapidMiner's Process View. ................................................................................. 45
Fig. 20. Dataset loading Rapidminer .................................................................................. 45
Fig. 21. Description view for Hierarchical Cluster. ............................................................. 46
Fig. 22. Folder View for Hierarchical Clustering. ............................................................... 47
Fig. 23. RapidMiner tree cluster representation. ............................................................... 47
Fig. 24. Dendrogram View for Hierarchical Clustering ...................................................... 48
Fig. 25. Description view for Flatten Clustering. ................................................................ 48
Fig. 26. Folder view of Flatten Clustering. ......................................................................... 49
Fig. 27. Graphic view for Flatten Clustering....................................................................... 49
Fig. 28. Weighted edit distance results of “12072016 Home-Work” sequence................. 56
Fig. 29. Weighted edit distance results of an Operator 2 mobility sequence .................... 57
Fig. 30.Hierarchical Agglomerative Clustering dendrogram from route sequencies. ....... 58
Fig. 31. Extract of Dataset1 pre-processed. ...................................................................... 66
Fig. 32. Edit Distance Matrix from Dataset1 ..................................................................... 67
Fig. 33. AGNES dendrogram of Dataset1 in R. ................................................................. 67

8
Fig. 34. DIANA dendrogram of Dataset1 in R. .................................................................. 68
Fig. 35. Dataset2 representing high mobility and non-mobility periods in a normalized
time scale............................................................................................................................ 69
Fig. 36. RStudio Hierarchical Clustering dendrogram with average linkage. .................... 70

9
List of tables
Table 1. Default monitors available in Qualipoc software [Source: SwissQual]. .............. 31
Table 2. Overview of the different clustering methods. [Source: SwissQual]. .................. 35
Table 3. Qualipoc raw data. ............................................................................................... 53
Table 4. Extract from PCI sequence vector Dataset ......................................................... 54
Table 5. Extract of Dissimilarity Matrix D. .......................................................................... 55

10
List of Abbreviations
MNO Mobile Network Operator
RAN Radio Access Network
SON Self-Organized Networks
5G Fifth Generation of Mobile Communications
OPEX Operative Expenditures
CAPEX Capital Expenditures
AI Artificial Intelligence
ML Machine Learning
QoS Quality of Service
QoE Quality of Experience
IoT Internet of Things
IoV Internet of Vehicles
D2D Direct-to-Direct (Communications)
M2M Machine-to-Machine (Communications)
SDN Software Defined Network
NFV Network Function Virtualization
HC Hierarchical Clustering
HAC Hierarchical Agglomerative Clustering
GSM Global System for Mobile communications
UMTS Universal Mobile Telecommunications System
LTE Long Term Evolution
PSC Primary Scrambling Code
RSCP Received Signal Code Power
PCI Physical Cell Identity
RSRP Reference Signal Received Power
RSRQ Reference Signal Received Quality
RSSI Received Signal Strength Indicator
OFDM Orthogonal Frequency Division Multiplexing
CRAN Cloud-RAN

11
1. Introduction
Along with the evolution of the mobile cellular technologies, the demand of data services
keeps increasing. The first generation of mobile networks was meant for providing voice
services through an analog radio access interface; but the big jump came with the
deployment of the second and third generation of digital wireless communications,
introducing Internet data-packet based traffic leading to an exponential increase data
volume processed by the system.
Therefore it was required to exploit the network resources in a more complex way. Some
successful solutions for the capacity problem were implemented including dense
deployment of base stations, improvement of the physical layer with the use of more
advanced digital modulation techniques, efficient frequency reuse, among others
technology improvements.
Nevertheless, when the amount of network elements, data traffic and parameters
considerably surpasses the human talent in charge of the access system configuration,
optimization and management activities, a level of automation on those areas becomes a
necessity.
With the deployment of Long Term Evolution (LTE) standard, based in an all IP
infrastructure, the automation of certain tasks related to Radio Access Network (RAN)
planning and optimization were introduced through self-organizing network (SON)
capabilities. SON allows introducing automatic management algorithms in order to relieve
and help the Mobile Network Operator (MNO) on specific Operation and Management
(O&M) functionalities, reducing the operational expenditures (OPEX) pressure [1].
The SON functionalities include self-configuration, self-optimization and self-healing. Self-
configuration processes are performed in the initial deployment of the nodes, providing
installation parameters on the new nodes. The self-optimization processes are executed
when the network is operational for tuning automatically the parameters of the different
network elements; it also permits detecting and bringing solutions for the network issues
that can be solved through optimization. Self-healing automatic processes localize and
correct network failures, providing a temporary solution for the problem.
Currently, as a consequence of the growth of the smartphone market in past years, an
enormous demand of resources was generated in the mobile communication systems as
never before, mainly due to the introduction of demanding multimedia and video
applications.

12
Therefore, a big data analytics approach is expected to be introduced in the wireless
mobile networks domain, in order to take advantage of those vast amounts of user
generated data by processing and analyzing it for finding insights and for extracting
relevant information in a fast, feasible and efficient way.
The main techniques for data analytics are artificial intelligence (AI) and Machine
Learning (ML). Artificial intelligence is the area of knowledge which studies how to give
devices and machines the ability to learn and have human-like intelligence. ML is a
category of AI, centered in allowing the machine to learn and have human-like
intelligence. ML techniques can be categorized as [2]:
Supervised: these algorithms use a training set of data to create a function for
labeling observed data. In a classification problem, new data is mapped into
classes with a classifier function, obtained of previously observed data.
Unsupervised: these algorithms use unlabeled data to find common patterns
between the objects. A clustering problem is a case of unsupervised learning.
Semi-supervised: these algorithms combine unlabeled and labeled data to
generate mapping function or classifier. Artificial neural networks are a good
example.
Here, future implementations of wireless networks have to support intelligent software
provided of ML capabilities, which allow the system to predict system behavior,
characterize it, find hidden patterns in the data and allowing algorithms continuously learn
about the network processes and providing dynamic responses to network/user demands
[2].
For instance, combining data analytics capabilities with SON functions and processes,
the network generated data can be explored for providing SON algorithms of end-to-end
level of knowledge about the network. This knowledge includes the user specific data
dimension or user-level, to understand the individual user behavior and exploit this
information to take efficient SON decisions related to user performance [3].
Moreover, the fifth generation wireless and mobile communications or 5G, anticipates the
increase of data transmission rates, enormously boost the quantity of wireless devices
connected to the network and reduce latency perception; with an improved quality of
service having an user centered approach [4]. 5G should support novel applications like
direct device to device (D2D) communications, Internet of Things (IoT), Internet of
Vehicles (IoV), e-healthcare and Machine to Machine (M2M) communications. These
applications are foreseen to have a considerable impact on data traffic and connectivity.

13
This introduces additional stress on balancing MNO’s Capital Expenditures (CAPEX) and
OPEX against the foreseen planning and operation requirements to make 5G a profitable
effort, while delivering improved Quality of Service (QoS) and enhanced user experience.
5G networks are required to be focused on providing the best level of individual user
performance. However, it is important on this complex ecosystem to optimize the network
resources available, for fulfilling the demand of individual subscribers for diverse content
applications and trends. Also, novel user centered business models are positioned as an
interesting opportunity for MNO for monetizing the user information hided over different
network databases, including information from user location.
In both technical and business levels the characterization of user behavior, and in
particular the user location, is becoming very important. In the big data era, it is possible
obtain this user level knowledge, by categorizing location data through data analytic
techniques in a very efficient manner. This includes the characterization of the mobility
patterns of the network subscribers which can find a big amount of applications.
The mobility information of the subscribers gathered for predicting the user movement; it
can facilitate network processes including the anticipation of handovers, scheduling data
rate demand, predicting network congestions, acting dynamically over continuous
network issues which might affect individual users and triggering automated SON
functions in a proactive way. On the business side, knowing the mobility information finds
its applications, for example, on designing tailor made promotions, more efficient publicity
campaigns, and third party use of the user information.
Past research work [2, 7, 13-16] have studied methodologies for finding user mobility
patterns through diverse data analytics techniques. Some of them have been performed
with simulation tools that reproduce user mobility transitions. Network location data like
base station identifiers, is processed by using supervised and semi-supervised ML
techniques.
This master project proposes a practical case for implementing data analytics process
into the context of mobile networks for building a mobility profile for categorizing mobility
sequences. The location data used comes from base station registers collected by walk
test. An unsupervised clustering function is executed over data gathered from mobility
traces of a network user. The use of unsupervised ML techniques is suitable for
discovering new clusters of trajectories by grouping together the mobility sequences
according to its similarity. Using unsupervised techniques providing higher levels of

14
scalability compared to supervised functions, because former techniques do not need a
training set of trajectories categorized beforehand.
The outcome of this data analytics process will allow obtaining relevant information by
characterizing and categorizing the different trajectories registered. Finally, it discusses
several possible use cases involved in the mobile networks management and operation,
related to RAN optimization, planning and possible operator business endeavors. The
methodology used in this work references a framework proposed in [5], which describes
an AI based process applied to mobile communication systems, for driving relevant
decisions as input for SON mechanisms. However, in the context of this project, the
outcome of this process can be extended to other applications related to RAN
performance and operator’s business cases.
1.1. Objectives:
This research work has been developed based on following objectives:
Acquire mobility traces by collecting network information through walk tests
and pre-process this data into mobility sequences.
Compare different unsupervised ML clustering techniques and data analytics
tools, in order to select the most adequate for characterizing user mobility
patterns.
Perform an analysis of the pre-processed data, using the selected ML
technique and tool, in order to discover relevant knowledge about user mobility
trajectories.
Discuss use cases related to mobile network automated functions such as
SON and other business services for exploiting the knowledge obtained.
1.2. Thesis outline
This project is divided in the following six chapters:
Chapter 1 presents an introduction of the important topics to be addressed in this
work, including the evolution of the mobile networks technologies, SON
functionalities for planning and optimization of the access system, an overview of

15
data analytics techniques and next generation of mobile network 5G concepts for
justifying the importance and the context of this work.
Chapter 2 explains with more detail the motivation of including data analytic
techniques in mobile network scenarios, by describing the different requirements,
challenges, changes which will be incorporated in 5G, along with referencing
previous work related to characterizing patterns of movements of mobile networks
users by implementing data analytics processes.
Chapter 3 describes the methodology and framework used for characterizing
user mobility patterns according to mobility routes by defining the different
processes implemented in this work, including the description of the data
collection tools, data mining software, and hierarchical clustering processes.
Chapter 4 includes the methodology execution results for discovering the user
mobility profile from characterizing the different user mobility patterns by using
hierarchical clustering function on pre-processed data from registered traces.
Chapter 5 resumes the conclusions from the knowledge obtained in this work
with a summary of different applications and proposals for improving the
efficiency of the algorithm.
1.3. 1.3 Workflow
This project has been developed in the following steps:
Campaign for data collection
Study of data analytics technologies
Comparison of data analytics tools
Research about next generation 5G communications technology
Defining data analytics mechanism implemented
Dataset pre-processing
Knowledge discovery process execution
Results annotation
Document writing
A Gantt chart is presented to put in time perpective the development of these tasks:

16
Fig. 1. Gantt chart of this project.
Jul-16 Aug-16 Oct-16 Dec-16 Jan-17 Mar-17
Campaign for data collection
Study of data analytics technologies
Comparison of data analytics tools
Research about next generation 5G…
Additional campaign for data collection
Dataset pre-processing
Knowledge discovery process execution
Results annotation
Document writing

17
2. Data analytics and the New Generation of Mobile
Communications Network Technologies Context.
In this chapter, the motivation of big data analytics in the context of mobile
communications networks is introduced, emphasizing the need of implementing data
analytics mechanisms in current mobile networks scenario. Then, an overview of future
evolution of 5G wireless communications system is presented, describing its
requirements and challenges to overcome current mobile networks constraints and the
inclusion of data analytics mechanisms as an integral part of network processes. The
motivation for network automation through data analytics-enhanced SON is described,
along with its impact in QoS, and Quality of Experience (QoE) in the context of 5G
systems. The user-level knowledge discovery process and use cases are described later.
Finally, previous research about the use of data analytics techniques for characterizing
mobility patterns from users is described.
2.1. Data analytics and mobile cellular networks scenario
The application of big data analytics in the wireless communication systems is expected
to be a powerful tool for improving the performance of future mobile communications
systems, the user experience and increase effectively the revenue of MNOs.
Nowadays, (O&M) systems are forecasted to show a joint limitation of processing power
and computing capacity, because of the continuous increase in the amounts of data
traffic that is being generated by the network and users [8]. The exponential increment of
mobile data traffic is caused by the proliferation of multimedia, video and other mobile
broadband applications, different performance related metrics registered by the network
and stored on different databases, and the expected increase of network connections due
to the introduction of new technologies such IoT [6].
The introduction of big data analytics can provide a wider view of the whole system, by
making use of the control and traffic data available for gaining meaningful knowledge
about network and user behaviors. Another benefit of the big data analytics is that it
opens the door for real-time processing, allowing operators to monitor the network
conditions in real time for making faster decisions for network optimization and for
improving user experience.

18
Not only the operator’s technical departments can capitalize the usage of big data
analytics in the different network procedures, other important areas such as marketing,
customer support and sales departments can have its own applications for exploiting the
knowledge acquired. For example, data analytics outcome can be used to identify the
target audience for enhancing the effectiveness of publicity, advertisement campaigns
and promotions. MNO can also develop innovative business models, improve user loyalty,
and design new services according to subscriber’s needs.
Big data analytics is based mainly in techniques such as AI and ML. AI is the area of data
science which studies the capabilities of a machine to have human-like intelligence.
However, ML centers its attention in the ability that computer systems and programs have
to learn by themselves, discover patterns in the data and improve program’s reaction to
new data inputs. Big data analytics also offer additional features including efficient
parallel computing, low-cost high-efficiency capabilities and fault tolerant [6].
For the user oriented point of view of this work, three categories of big data in wireless
communication systems can be of interest.
2.1.1. Big traffic data
Huge amounts of traffic data are being carried by operator’s infrastructure. The
employment of big data mechanisms for analyzing big traffic data streams can allow the
operator to obtain highly interesting insights about traffic and subscribers behavior for
improving network performance and take more efficient decisions [6].
Open source tools such as Apache Hadoop, developed by Yahoo!, is widely used for big
data processing with distributed computing features. It was inspired by scalable platforms
like GSF and MapReduce owned by Google. These tools allow handling and processing
big quantities of data using thousands of computer servers. It was demonstrated that a
Hadoop platform implemented in a commercially deployed mobile network, can monitor
and analyze mobile data traffic in orders of Terabytes, showing high efficiency and
reduced cost. [2]
2.1.2. Big location data
Location in the context of mobile communications can bring interesting information about
human activities, providing insights about the behavior and regular habits of the user [6].
This information can be exploited for public planning, transporting, demographic trends,
alerts about crowded places, emergency services, crime analysis, among other use
cases. On the business side, the exploitation is related to mobile advertising and publicity.

19
The source of this data is provided by technologies embedded in mobile devices such as
GPS, WiFi, Bluetooth.
By the incorporation of big data processing capabilities in future wireless network
infrastructure, location data information given by the cell the user is connected to, adds a
an important dimension for mobility analysis and for characterizing mobile subscriber
geographical behavior. This location information can be manipulated with help of big data
analysis and serve as drive decisions for SON algorithms and O&M system in mobility
related use cases for efficient resource allocation.
2.1.3. Big heterogeneous data
Heterogeneous data refers to very diverse network parameters and metrics that network
stores in different databases, including for example system throughput, call drops,
handover failures, etc. It also includes marketing department databases which include
costumer related information such as costumer profile and billing information. This
performance and costumer centric information can be disaggregated and processed with
the use of big data analytics in a very efficient manner for user focused use cases, which
include characterizing individual subscriber performance for improving quality perception.
The next section contains a review of the future generation 5G wireless systems and its
capabilities, where data analytics are integrated and play an important role for processes
such as data for network optimization and capacity planning. Most researchers support
the inclusion of big data analytics through AI and ML capabilities in next generation
networks for building a fully intelligent system that could help to discover, analyze and
take advantage of the big quantities of data available for taking effective actions.
2.2. 5G networks overview.
When we think of a new generation of wireless communications, there is the expectation
for an increase in the network capacity and higher data rates which overcome resource
limitations in the legacy generations deployed. Besides this premise, 5G, the next
generation of mobile communications and wireless systems is being designed from a
wider point of view. This paradigm change includes embracing current and new radio
access concepts, supporting new business models, new services and trending
applications; in order to meet new technology challenges for 2020 and further [9].

20
2.2.1. Current and Future Mobile Networks Challenges and Requirements.
A review of current mobile technology challenges can show the main drivers of 5G
research:
The massive data traffic demand triggered by the use of smartphones, with capabilities
for more demanding multimedia applications, high definition video and other wireless
broadband services; accounted by 2014 the 88% of total data traffic [2]. Intelligent mobile
devices permanently generate data from geo-localization, phone calls, mobile
applications used and air interface measurements.
In addition, it is expected that more than 50 billion of IoT devices with applications such
as smart home, smart cars, smart office, among others, will be connected and operative
by 2020. Also applications like M2M communications consisting of low-power
consumption devices are growing very fast.
Furthermore, it is difficult for 4G to cover the traffic demand with the current base station
centered model; changes are needed in the architecture of RAN for increasing the
capacity of the network. Those changes are expected to be included in 5G, featuring the
implementation of heterogeneous access network architecture with macro and small
cells; moreover, with the use of massive arrays of small size antennas transmitting in
higher frequencies, combined with highly directional beamforming gains that helps to
mitigate the interference while offering a suitable coverage range [12].
Research and efforts of 5G pre-standardization made by projects, institutions, operators,
big telecommunications vendors and academics already defined the requirements for the
new evolution of mobile and wireless technologies in order to accommodate to the
forthcoming demands.
For the high user data rate and capacity demands, 5G has to provide data rates in the
order of Gbps: 1 Gbps in high mobility and peaks of 10 Gbps in low mobility scenarios.
Also, it is expected that the new technologies will deliver around 1000-fold increase of
data bandwidth per area unit, resulting in better user connectivity in crowded scenarios.
[9]
5G requirements also cover new wireless concepts including machine communications
and ubiquitous IoT scenarios. For adapting to the reliability needs of sensors and
communicating machine applications, the latency is expected to be reduced 10 times
compared to 4G, with 1 ms in roundtrip time. Additional requirements include supporting
until 100 times the number of connected devices per cell and more efficient energy

21
saving procedures to increase 10 times battery life; these conditions are needed for
coping the high number of IoT devices that will proliferate in the near future.
2.2.2. Network flexibility through virtualized architecture.
5G will be provided of flexibility for optimizing the network resources, supporting new
business models such as vertical industries, new costumers necessities and facilitate
partnership models through Software Defined Networking (SDN) and Network Function
Virtualization (NFV). This virtualized, software oriented environment, is an opportunity for
introducing big data analytics and automation capabilities in the network operation and
resources management [2].
SDN is envisaged to be a solution for the configuration and maintenance in front of the
required architecture and air interface changes in this heterogeneous, dense small cells
and massive antenna deployment. SDN contemplates a division between control and
data planes through software implementation, allowing the independency of control and
data plane, providing an architectural flexibility into the 5G network. This separation of
control and data plane allows reducing the control overhead; improving the efficiency in
the resource delivery and software oriented implementations for reducing current
hardware limitations.
The NFV separates the network functions in a virtualized manner from lower hardware
resources, in order to divide the management resources from the actual network
functions [10]. NFV permits flexible architecture of the network functions encompassing
Operations Support System (OSS), core and radio edge functions. It can provide cloud
technology services, enabling network scalability and reduced cost solutions for
addressing the traffic variability, through automation of the deployment, configuration,
optimization and repairing mobile network functions.
Along with SDN and NFV, Cloud RAN (C-RAN) will help solving issues and CAPEX and
OPEX constraints, improving system architecture, mobility, coverage performance and
energy efficiency while reducing the network deployment and operation investment.
C-RAN is based on the centralization of Base Band Units (BBU) in remote locations such
as operator central offices and for pooling radio and network resources through
virtualization. In the cell site, the Remote Radio Heads (RRU) includes the transceiver
devices, amplifiers and filters. BBU and RRU are connected through optical fiber. This
virtual environment eases the scalability of the RAN, the integration of different services,
provides efficient resource management and reduces infrastructure costs for MNOs.

22
The 5G challenges, requirements and architecture changes described in this section,
demand an evolution in how to take advantage of the data generated in this diverse new
generation ecosystem, from an optimization and planning point of view. Big data analytics
is envisioned as a tool to obtain full network intelligence and end to end knowledge off
this massive data available from different network source for different network utilities,
and making 5G network deployment a profitable business for network operators.
SON algorithms on top of big data analytics are expected to be fully implemented in the
design of 5G among most of the RAN tasks motivated by a bigger complexity in the future
network topologies, architectures, technologies and parameters to take care of. This
improved conception of SON described in the next section.
2.3. SON and data analytics in 5G context.
MNO’s capital expenditure (CAPEX) and operational expenditures (OPEX) will be
impacted directly as result of the new technologies trends and requirements for 5G
featuring multiple RATs, heterogeneous cell approach, virtualized architecture of network,
an ultra-dense number of network nodes, demanding applications and novel use cases
sharing the new mobile and wireless ecosystem.
In WCDMA and LTE, SON capabilities were introduced to attend these challenges,
alleviating MNO’s complex management procedures and reducing OPEX and CAPEX
stress. The tasks where SON processes intervened were very specific and composed of
automated loops algorithms, triggered by specific network conditions for particular KPI
optimization. Also, SON algorithms are vulnerable to conflicts between the the different
SON functions, and also the possible human intervention on the parameter configuration
[10]. Independent SON functions running at the same time can cause conflicts between
them, adding instability in the network performance. Nevertheless, SON coordination was
later introduced to address those issues with proper limitations.
However, in 5G it is expected a more complicated management scenario with the
introduction of virtualized network elements, C-RAN, very dense cell deployment,
supporting of a great quantity of connections and the support of multiple vertical
industries use cases. Contrary to legacy networks, where SON had a reactive design and
punctual use cases, 5G challenges demand an evolution of SON capabilities for deeper
and more proactive automation to attend all the 5G requirements while making it a
profitable endeavor for MNO’s.

23
Challenges and requirements for future 5G SON implementations are described in [4]. In
legacy systems, the knowledge of possible network states is already or partially known
for triggering specific SON compensation mechanisms. The data for gathering this
knowledge is based on drive test collection, subscriber complaints and network
management KPIs and measurements. This is not compatible with the premise of low
latency and resource efficiency 5G networks need to provide.
5G SON mechanisms require massive intelligence and end-to-end network visibility. This
end-to-end visibility of the network can be achieved by intrinsically enhancing SON with
big data analytics. Big data analytics is expected to provide the knowledge and
intelligence needed by SON to have the global visibility of the network status in real-time,
associating network response with the network parameters and the capability to
understand and to anticipate the subscriber behavior.
The enhanced SON concept is expected to be a primary tool for helping 5G networks to
reach high levels of QoS and QoE [4]. This novel term of QoE refers to the end-to-end
network performance quality perceived by individual subscribers. With the evolution of
network architecture, the physical layer, and control plane, the quality paradigm needs to
evolve along with them for meeting 5G requirements.
The global knowledge acquired by big data analytics allows reaching the individual user
dimension when processing data. With this, the disaggregation of user related
performance metrics measuring individual subscriber experience and enhancing the QoE.
The importance of QoE arises in applications like mobile broadband video. The traffic of
broadband video over internet is forecasted to grow at a very fast pace due to the
increase video applications subscriptions, new advertisements models and content
delivery services. Technical centered QoS metrics (packet loss, loss rate, etc) are not
enough to measure the user satisfaction in this fueled video ecosystem. QoE have to
deal with user perception and there is still open research in how to measure the related
parameters and KPIs in next generation networks. However, QoE can be enhanced by
approaching improvements in SON and big data analytics for 5G systems. [4]
2.4. User-level knowledge discovery through ML techniques
With the inclusion of AI, knowledge models can be obtained for understanding multiple
dimensions of the network. The gathered data is processed using big data analytics
techniques such as AI and ML mechanisms. The latter are based in classification,
24
prediction and clustering, involving supervised, semi-supervised and unsupervised
techniques respectively.
The knowledge models are classified according to the following dimensions: user-level,
which contemplates the characterization of individual user conditions or services; cell
level, where the characterization is related to the conditions around each cell in the
network; and cell cluster level, which characterizes cell groups according to its
similarities.
The inclusion of big data analytics in future mobile networks allows exploiting the user-
level dimension, disaggregating network data until reaching the individual subscriber
level. This work focuses in studying a case for modeling knowledge in the user-level
dimension.
Three use cases for user-level knowledge discovery. The use cases proposed for user
level knowledge modeling includes:
Spatial-domain traffic pattern characterization: this case describes the behavior of
the user in terms of the cells the user was connected to, along with the services
used and the volume generated while being connected. The order of the cells the
user is connected was relevant for predicting future user location and possible
trajectories for dynamic resource allocation.
Time-domain traffic pattern characterization: refers to the characterization of the
user behavior in terms of the mobile services used by an individual along a
defined time span or the traffic generated by those services.
Performance characterization: Describes the performance experienced by users
in terms of the QoS KPIs such as accessibility, mobility, retainability, availability.
Together with the performance at cell level, it can help identifying which actions
are needed in case of individual performance degradation.
The knowledge about user-level dimension can be obtained by the inclusion of big data
analytics in the network O&M processes, and its outcome can be used as input for smart
planning and optimization decisions driven by automated algorithms such as SON and its
use cases. The user focused paradigm to be used in 5G and SON implementations along
with big data analytics, will allow not only measuring technical driven QoS standards, but
also individual user satisfaction and perception about network performance.
Due to method of data collection, only limited metrics are registered from the walk test
perspective; however, location data is available as base stations identifiers, which can be

25
used for characterizing the mobility pattern of the user according to the different
trajectories followed. A clustering technique is applied to base station sequences for
characterizing the individual mobility profile.
A framework knowledge discovery process from data acquired from several sources is
presented in [5]. It will be referenced in this work as a methodology for data collection,
processing and the characterization of the location data. Moreover, use cases will be
discussed for exploiting the user mobility patterns characterization. The next chapter
describes this knowledge discovery process.
2.5. Previous work on user mobility patterns
Research work on mobility patterns is addressed in [2]. Here an algorithm for obtaining
knowledge about user mobility patterns through the application of Hierarchical
Agglomerative Clustering (HAC). It is performed as a function on collected trajectories
from mobile users. The outcome of this function is used for addressing the problem of
location prediction for efficient allocation of resources.
User location knowledge is anticipated to play an important role for cases with dynamic
bandwidth allocation and location management. The importance of recorded user
trajectories for historical movement data is highlighted as main input for the clustering
algorithm. The movement randomness arises as a sensible factor for consideration in the
data processing algorithm, which results in noise and degradation of accuracy in any
predictive model which considers user trajectory patterns.
The methodology in [7] is valuable for the project here presented, especially for the
knowledge discovery process, calculation distances between user sequence vectors,
application of a clustering algorithm to describe similarities among user trajectories, and
the association of additional vectors to one of the groups defined.
The location prediction based on supervised ML was studied in [13]. Here the existence
of a training set based in a semi-Markov process is assumed and it compares the
prediction performance according to different training set sizes, performance with real
data and computation complexity. The dataset used is based on movements over a GSM
network of one unique student stored in a server. There is no explanation in how the data
is collected.
In [14], the problem of localization of mobile devices is approached from the point of view
of sensor and mobile network terminals. This research uses a semi-supervised ML
26
method, combining labeled and unlabeled data; the former is used for estimating the
relative location of the mobile device and the latter is used for model calibration. In case
of indoor coverage, it is mentioned that GPS systems may not work for locating users.
The application of ML in mobile network use cases are mentioned and described in [15].
Here it is explained the necessity of incorporating intelligent hardware and software in the
network system for certain real time applications which require faster response and quick
decision making.
The first use case described prediction based on the link strength and the time during
such strength drops below certain threshold, allowing applications to take actions in
advance. The second use case describes its use for minimal wastage of resources
performing handover predictions. Lastly the use of ML techniques for routing in ad-hoc
networks and intrusion detection is described.
In [16], clustering techniques are combined with the concept of sequential pattern mining
to develop an approach for predicting future movement of mobile users. This paper states
that single user measurements may cause loss of important information on individual
movement history and it is suggested to group similar users that share similar behavior. It
references the work in [2], which takes into account randomness of user movements and
how it provides noise to the prediction model.

27
3. Methodology for Categorizing Mobility Patterns using
Clustering Techniques
The methodology applied in this work for studying mobility patterns of mobile users,
references the framework proposed on [5], for AI based knowledge process for 5G
networks, focused in the specific case for knowledge discovery stage in the user-level
mode. User mobility patterns are obtained as the outcome of knowledge discovery phase
and it will drive the decisions in the SON exploitation.
The AI based knowledge process is composed by the following 3 stages illustrated in Fig.
2:
Fig. 2. AI-SON knowledge based process. [Source: UPC].
3.1. Data Acquisition and preprocessing stage:
In this stage, user data is collected from different sources. Those sources can be
obtained from stored MNO data, including measured network data like typical QoS KPIs,
performance measurements and network counters, customer service databases, etc;
Also, the data from external sources can be used for estimating the user behavior in
extended scenarios which impact network traffic resources; those external sources
include data gathered from installed applications, internet information services, social
media and open databases, among others.
After collecting this raw and heterogeneous data from multiple sources and locations, the
obtained dataset may present vast redundancy, inconsistency and unusable registers.
28
This unpolished dataset needs to be formatted, cleaned, depurated and filtered through
various processes for avoiding unnecessary storage space and reaching the best
possible algorithm efficiency. The pre-processed dataset that will act as input for the ML
functions in the knowledge discovery stage.
In this work, the network data is collected from the user perspective, as there is no
access to the network management system. Mobility parameters are monitored and
collected using the drive test application called Qualipoc, installed on an Android mobile
device with LTE and UMTS connectivity.
Location data such base station registers can be gathered using this walk test collection
method; it can provide enough information for obtaining relevant information about
mobility trajectories of the user.
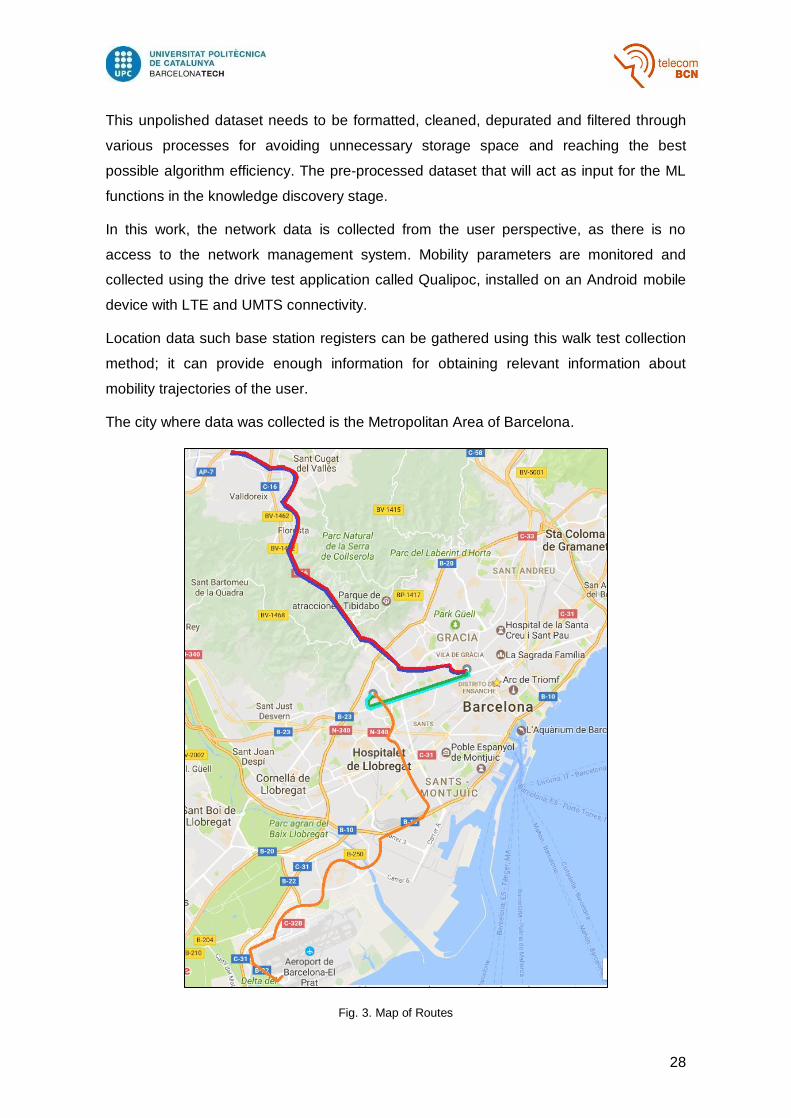
The city where data was collected is the Metropolitan Area of Barcelona.
Fig. 3. Map of Routes

29
The Fig. 3 shows a description of the different trajectories followed, including:
Home-Work: colored in blue. Route from Gràcia to Sant Cugat.
Work-Home: colored in red. Route from Sant Cugat to Gràcia
Home-Univ: colored in light blue. Route from Gràcia to Universitat Politecnica de
Catalunya (UPC)
Univ-Home: colored in dark green.Route from UPC to Gràcia
Univ-Airport: colored in orange. Route from UPC to Airport of Barcelona
However, other routes were considered, but the trajectories followed are highly similar to
the main routes described.
3.1.1. Qualipoc software
QualiPoc (powered by SwissQual) is a smartphone tool for RF optimization which allows
collecting voice and data service measurements and mobile network testing. It supports
most of the mobile networks technologies implemented worldwide, including GSM, UMTS
LTE and WiFi standards, and it covers multiple protocol layers in real-time. The main use
case for this application is testing indoor and outdoor network mobile parameters. For this
project the software was used for monitoring radio parameters and collecting mobile
network data for UMTS and LTE access technologies.
Fig. 4. Main Qualipoc Interface

30
Fig. 4 shows the main Qualipoc interface. The top screen banner displays the connected
cell information including by default the connected channel, the cell ID number, the
received signal power and received signal quality. Depending on the technology, those
parameters have a different name and description:
For UMTS, the connected channel number is called UMTS Absolute Radio Frequency
Channel Number (UARFCN); a number assigned to each radio channel used as defined
in the UMTS specifications [17]. The cell is identified by its Primary Scrambling Code
(PSC), a number between 0 and 512 used for synchronization purposes. The received
signal power is defined by the Access Stratum1 Received Signal Code Power (AS1
RSCP) and refers to the measured received power in the corresponding physical
communication channel in dB units. The measured quality is given by the Ec/Io, defined
as the ratio between energy per code bit and the interference level also in dB units.
In the LTE technology, the connected channel number value in the banner is the
Downlink EUTRA Absolute Radio Frequency Channel Number (DL EARFCN) [18]. The
cell identifier is the Physical cell ID (PCI). The received signal indicator is given by the
Reference Symbol Received Power (RSRP), and is used in LTE for measuring the power
received by the mobile device from the eNodeB. Finally, the Reference Signal Received
Quality (RSRQ) indicates the quality of the signal received from the eNodeB as a ratio
between the RSRP, the Received Signal Strenght Indicator (RSSI) multiplied by the
number of resource blocks delivered where RSSI is measured. The RSSI is defined by
the 3GPP as the the average received power observed in the OFDM reference symbols
for antenna port 0.
Fig. 5 shows the Qualipoc action menus, where band forcing, freeze monitoring option,
screenshot, text marker and photo marker actions can be selected.
Fig. 5. Qualipoc actions menu.

31
Several predefined and customizable monitors can be selected and displayed for
following in real time the measurements. The table 1 describes the content of each
available monitor.
Table 1. Default monitors available in Qualipoc software [Source: SwissQual].
A measurement job can be created by displaying the settings menu on the top right icon
and selecting the Jobs option. In the settings view for measurements job (Fig. 6) options
for band forcing, access points selection and packet capture are available. The forcing
options permit to select the network interface including mobile data; Wi-Fi and a default
setting for mobile phone normal usage; the network type option allows fixing the mobile
technology, including GSM, WCDMA, LTE and free access technology selection,
according to the operator’s RAT settings.
Fig. 6. Qualipoc job settings.

32
The Qualipoc software incorporates the following test functionalities:
“Call”, for voice call connection
“Data”, for data connection to an access point supporting Dropbox, Email, FTP,
HTTP transfer, etc
“Message” for SMS MMS functionality
“Multi-Data, Multi-Mix, Multi-RAB, and Parallel” for data and call test sequentially
or in parallel or random Multi-RAB tests
“Idle Monitoring”, which allows the monitor and collection of network RF
parameters while performing normal use of the smartphone. This test functionality
will be used in this work.
Maximum duration test in seconds is configured as 0, for disabling automatic test time.
3.1.2. NQView software
The data collected was processed with NQview Version 15.0.0.19. NQview is a graphical
user interface for benchmarking and optimization analysis powered also by SwissQual. It
provides a graphical and quick summary of data collected by Qualipoc. It offers
predefined monitors of the radio conditions, custom visualizations workspaces and allows
exporting the parameters registered in a .csv format for posterior analysis.
Files from Qualipoc job measurements can be uploaded into NQview environment, and
be visualized in multiple formats for further analysis. First, the measurements files have to
be extracted from the phone using a USB cable and to be saved in the computer where
NQView installed.
The main layout of NQView is displayed in the Fig 7. This interface allows replaying the
loaded measure and the data can be visualized in the workspace located in the right
center of the main view. The uploaded file name is presented in the lower bar. By default,
the file name displays the date and hour the measures were taken, as well as the code of
Qualipoc software used.

33
Fig. 7. NQView Workspace.
On the left page, different options for monitoring are displayed in the “Pages and
Monitors” field, including table, graph, maps, among others, that can be drag-and-
dropped onto the workspace for previewing the measured data. Also, predefined monitors
and pages for corresponding technology parameters such as GSM, WCDMA, LTE, WiFi,
among others can be displayed in this option.
For this work, NQView will serve as a tool for exporting a data table which contains
different radio parameters like PCI, RSRP, RSRQ, along the instant the measurement
was taken; all LTE parameters. However, only PCI data is considered for characterizing
the differerent mobility trajectory of the user.
Fig. 8. NQView Extracted Parameters.

34
This will be the raw data which will be pre-processed and its outcome will serve as input
of the following Knowledge Discovery Stage.
3.2. Knowledge Discovery Stage
This stage envisions the use of ML mechanisms in order to construct models for
obtaining relevant knowledge about network related subscriber behavior, which can be
used for driving pertinent SON decisions [5]. ML techniques are used for processing the
data collected for obtaining different knowledge models. For this work different mobility
traces can be grouped by using clustering techniques, according to its similarity for
building a mobility pattern footprint.
3.2.1. Clustering Algorithms
Clustering refers to a process for organizing different data objects into groups according
to its similarities. The subsets of grouped dataset objects are called clusters. Data objects
assigned into the same subset group have higher similarity than those who belong to
another group. The similarity and dissimilarity calculations are based on the attributes
which describe the objects according to the pairwise distance between them.
Contrary to supervised ML techniques such as classification algorithms, class labels or
tags are not known beforehand when implementing the clustering algorithm. The process
of clustering, also called clustering analysis, is useful for discovering previously unknown
patterns observed in the dataset and, in the context of this work, can provide higher
scalability for discovering new trajectory groups.
Cluster analysis has multiple use cases which include business intelligence, image
recognition, biology and security. In mobile networks, it is a suitable technique for
discovering and categorizing individual user mobility and traffic behavior.
An overview of different clustering methods is presented in the Table 2

35
Table 2. Overview of the different clustering methods. [Source: SwissQual].
The use of partitioning methods requires knowing from the beginning the numbers of
clusters to be built. In mobile networks, the number of mobility patterns can be huge and
unpredictable; moreover, defining the number of clusters or patterns from the beginning
implies a considerable limitation. Hierarchical methods do not have this limitation and
would be ideal for exploring the different individual user patterns.
Density-based clustering method includes arbitrary shapes for the probabilistic density
regions. The use of complex regions can be a limitation for the analysis of the information
provided by the algorithm
The grid-based method focuses first in summarizing the object space into a finite number
of cells before grouping the objects. Again, the number of cells created is finite and the
algorithm has limitations for processing big datasets.
Therefore, the data characterization through hierarchical clustering methods is selected
because the simplicity and descriptive information it provides, highly useful for posterior
analysis.
Hierarchical clustering is a characterization method for cluster analysis which builds a
hierarchy or tree of groups. The most used way to represent hierarchy of cluster is
dendrograms. A dendrogram is a graphic tree to display the hierarchical sequence of
clusters. An example of this structure is presented in the Fig. 9.

36
Fig. 9. Dendrogram: Hierarchical clustering representation. [Source:Morgan Kaufmann]
Each dendrogram level represents different groups of objects according to a hierarchy
measured by a similarity scale. Data representation through dendrogram is very
descriptive for visualization and analysis. In level l=0 every single dataset object
represents its own cluster. In level l=1, a and b form a first cluster. As the levels goes up,
the objects stay grouped until reaching the highest level. For example, the right branch
starts grouping d and e objects in l=2; then in l=3, c is grouped together with d and e and
finally, all objects form the biggest cluster in l=4, which is the higher level. The similarity
scale quantifies the distance between the different groups.
Hierarchical clustering (HC) algorithms could be classified in two categories: “Bottom-up”
as agglomerative clustering method and “Top-Down” as divisive hierarchical clustering
method. Fig. 10 shows graphically the process of agglomerative (AGNES) and divisive
(DIANA) clustering algorithms on a dataset {a,b,c,d,e}
Fig. 10. Agglomerative and divisive clustering algorithms [Source:Morgan Kaufmann]

37
In agglomerative clustering, each object starts in its own group and then, every two
groups the most similar are merged into bigger clusters as the process moves up in the
hierarchy level, until one cluster is formed including all dataset objects. On the contrary,
in divisive clustering all objects start into one cluster, and the groups are partitioned into
several smaller clusters, with the least dissimilarity between each group, until reaching
the lowest level generates one object clusters.
The dissimilarities in hierarchical clustering are measured by calculating the distance
between the different objects in the dataset. After calculating the dissimilarity, the type of
linkage distance, inherited in the HC algorithm, defines how the links between the
different the cluster groups are joined together in the hierarchy is built.
The linkage distances can be classified into three categories: single linkage, for when the
dissimilarity is the smallest among two objects in opposite groups; complete linkage,
where the calculation takes into account the largest dissimilarity between the grouped
objects and average linkage, where the dissimilarity is the average among all objects in
opposite groups. The use of single and complete linkage portrays the extreme conditions
for distance calculation among cluster groups. Average linkage represents a balance
between the former two techniques, being less sensitive to distortions and noisy data.
Therefore, average linkage techniques are used in this project.
In this project the mobility trajectories are measured by Cell ID registers along an
increasing time scale. Each mobility trajectory is modelled as vector including a sequence
of Cell ID in string format. However, time varying sequences are affected by the
accelerations and decelerations and other uncertainties that the walking path adds; for
instance, if the person registering the data is walking faster or slower, the waiting span for
the bus or a train, the waiting for the traffic lights change, etc.
The problem for calculating the distance between categorical sequences can be solved
by using the weighted edit distance, also called Levenshtein distance, is an algorithm
used in the bioinformatics for DNA, RNA, and aminoacids sequence analysis, and also
finds its application in natural language processing for spelling correction.
The edit distance when comparing two strings, is defined as number of several edit
operations including insertions, deletions and substitutions; that are needed to convert
the first string into the other one. By definition, each operation has a weight or cost when
performed. The delete and insertion operation accounts for a cost equal to 1, the
substitution operation accounts for a cost equal to 2 and a perfect match accounts for a
cost equal to 0. The weighted edit distance algorithm is a special case of edit distance,

38
which counts the minimum total edit operation cost it takes for transforming a string into
another.
Fig. 11. Weighted edit distance example.
The Fig. 11 illustrates an example of the weighted edit distance procedure between the
string sequence and . In (a) the operation substitution of
A per D accounts for a cost of 2. In (b) the C character is deleted with a cost of 1. In the
following step, B is substituted by a C (cost equals to 2) and in the last stage, the
character D is added with a cost of 1, for a total optimal edit cost of 6.
3.2.2. Data analytics software selection
Before performing the knowledge discovery process, a descriptive study between the
data analytics tools RStudio and RapidMiner will be done, in order to highlight the pros
and cons of each software and select the one what better adjust to the project purpose.
One will be selected as main data analysis software in this project for analyzing the
preprocessed data through different ML techniques.
3.2.2.1. RStudio
RStudio is a graphical development interface for R, which is an open source environment
and programming language for statistical analysis and graphics developed by R
Foundation. R is broadly used for data mining, biomedical research and financial fields; it
supports a great quantity of libraries and packets that incorporates functions for data
analytics, mathematics operations and graphics. The R packages can be downloaded
from CRAN (Comprehensive R Archive Network) servers and other websites, such as
Github.
Fig. 12 shows the RStudio main interface which comprises several modules. The edition
console (bottom left) supports direct code programming and execution using R syntax
and also displays coding outputs and system messages. On the top left, a preview of
loaded datasets and scripts files details are shown. On the top right there are the
environment and history panels. In the environment panel, datasets and R objects can be

39
loaded and displayed. The history panel shows the historical of submitted R code. The
bottom left panel is used mainly for plot visualization and summary of loaded packages.
Fig. 12. RStudio Layout.
For the HC study, “Cluster” for R library will be used. It includes clustering functions such
as AGNES (Agglomerative Nesting) and DIANA (Divisive Analysis Clustering). AGNES is
the function for Hierarchical Agglomerative Clustering algorithm. Compared with other R
functions for agglomerative clustering like hclust, AGNES describes additional information
such as agglomerative coefficient, which measures the amount of clustering structure
obtained. AGNES supports the different methods for computing the clustering distance
such as complete linkage, single linkage, average linkage, among others.
DIANA function is used for computing divisive hierarchical clustering of the datasets in a
top-down manner, being the only R implementation of this algorithm. The function builds
a divisive coefficient according to the clustering structure and a graphic display for further
analysis.
Each function computes the clustering hierarchy by computing a dissimilarity matrix using
methods for measuring the distance between numeric sequences such as as Euclidean
and Manhattan. As stated before, the vectors fields studied in this work have string format,
and need to be manipulated as nominal values. Euclidean and Manhattan distance
computing methods are not adequate for measuring distances for nominal values.
Because of this, Levenshtein distance (or edit distance) arises as a method for
calculating the dissimilarity matrix for nominal datasets.
40
There are several R package for computing edit distance for sequence matrix. The most
used are the “stringdist” package and the “cba” packages. The former incorporates a
function called stringdistmatrix, based in Levenshtein distance for building a dissimilarity
matrix between different string sequences; however, it does not incorporates the well-
known weighted edit distance method and just an arbitrary Levenshtein distance
algorithm.
The “cba” (Clustering Business Analysis) package, includes the function sdists() which
stands for Sequence Distance Computation. This function computes a dissimilarity matrix
between vector of strings manipulating them as sequence of symbols, allowing to select
diverse distance calculation methods including the weighted edit distance computation.
The outcome matrix of the sdists() function, can be directly used as input for the AGNES
and DIANA funcions.
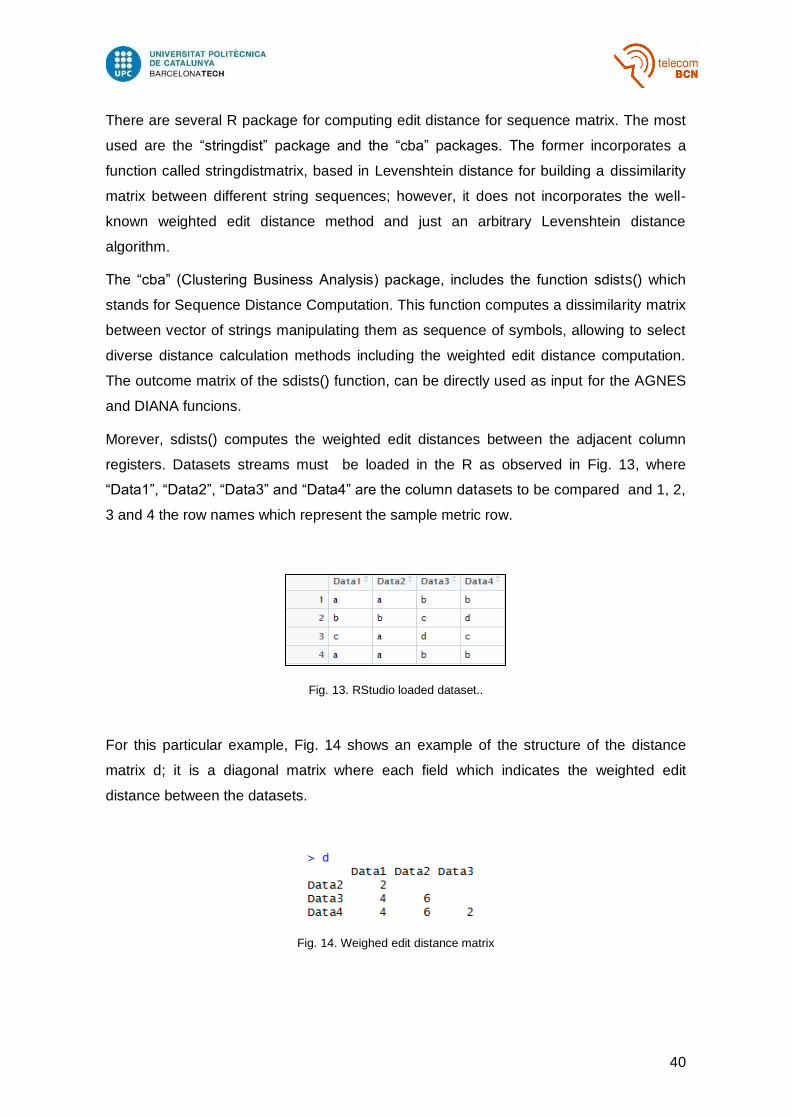
Morever, sdists() computes the weighted edit distances between the adjacent column
registers. Datasets streams must be loaded in the R as observed in Fig. 13, where
“Data1”, “Data2”, “Data3” and “Data4” are the column datasets to be compared and 1, 2,
3 and 4 the row names which represent the sample metric row.
Fig. 13. RStudio loaded dataset..
For this particular example, Fig. 14 shows an example of the structure of the distance
matrix d; it is a diagonal matrix where each field which indicates the weighted edit
distance between the datasets.
Fig. 14. Weighed edit distance matrix

41
Using the plot() function the AGNES dendrogram is created. Fig. 15 shows the
structured HAC dendrogram of the example dataset, joining together the objects in two
groups, one branch including Data 1 and Data 2 and the second branch including Data 3
and Data 4. Each branch groups two objects which have least distance cost, being the
cost in this case equals to 2, according to the computed dissimilarity matrix. The height
scale indicates the distance cost which separates the grouped objects, aligned with the
horizontal line that joins the individual sequences Data1 with Data2 and Data3 with Data4
respectively. In this case, the individual edit cost of Data1 compared with both Data3 and
Data4 is 4, likewise, the distance between Data2 with both Data3 and Data4 is 6. The
upper horizontal line which joins the two groups has a height of 5, being the average
distance between the individual objects belonging to different groups.
Fig. 15. Agnes Dendrogram.
The outcome of both hierarchical clustering techniques, AGNES and DIANA are very
similar. However, the fact that DIANA does not incorporate the option for controlling the
linkage method used for joining the different cluster objects, provides uncertainty on the
manner the cluster structure is built. For this project, only AGNES is used to overcome
this limitation. An example of both clustering techniques implementations is shown in
Appendix A.

42
As summary, the process for performing Hierarchical Agglomerative Clustering is the
following:
Algorithm: HIERARCHICAL AGGLOMERATIVE CLUSTERING/DIVISIVE
CLUSTERING
Input: Outcome dataset from the data acquisition and pre-processing knowledge stage.
Output: User mobility path profile.
1. Load pre-processed dataset in R
2. Compute dissimilarity matrix using sdists() function
3. Applying AGNES/DIANA functions to dissimilarity matrix
4. Plotting dendrogram using plot() function.
3.2.2.2. RapidMiner
RapidMiner is an open source data analytics powered by a graphical user interface for
the creation, delivery and maintenance of data analytics. Scenarios for data analysis are
modeled as a succession of individual stages called processes, which are built for
performing data mining algorithms such as classification, prediction and clustering on
datasets.
In the Fig. 16, a general view of the main interface called Design Perspective is displayed.
This layout processes which involve data mining can be created and executed. There are
three important views in this perspective called Repository, Operation and Process views.

43
Fig. 16. General view of Rapidminer’s design perspective.
The Repository view is used for adding new data, managing and storing databases
connections, local data source files and saved processes. The detail of the repository
view is shown in the Fig. 17.
Fig. 17. RapidMiner's Repository View.
The Operators view allows selecting different operators for data management. The
operators are organized by groups, which include operators for gathering datasets (Data
Access group), data format pre-processing (Blending and Cleansing groups), data mining
(Modeling group), process performance measuring and validation (Scoring and Validation
groups); auxiliary, logging, scripting and subprocess grouping operators (Utility group);

44
and operators for reading and writing data, and objects from external sources and
formats (Extension group).
Fig. 18. RapidMiner Operations View.
In the Modeling group the data analytics processes can be found including classification
methods, regression methods, clustering and weightings among others; those processes
can be applied to a selected dataset.
The process view is the main layout of RapidMiner, where the data analytics processes
can be built. An analysis process can be structured by selecting several objects from the
operators view and dropping it into the project view dashboard and connecting them in a
successive manner. RapidMiner, being an object oriented tool, its way of building the
process scenario for Hierarchical Agglomerative Clustering is intuitive.
The operators are provided by an input port in the left side or an output port in the right
side, as describes Fig. 19, except for the Retrieve operator, which gathers data loaded in
the application.

45
Fig. 19. RapidMiner's Process View.
Fig. 20 shows the process built for agglomerative clustering, where the dataset is
gathered through the Retrieve operator. It incorporates the Data Import wizard, where a
preview of the loaded data and its attributes is shown
Fig. 20. Dataset loading Rapidminer
As stated previously, Cell IDs in mobile networks are represented as numeric labels,
being Cell IDs nominal variables composed of numeric characters. When the dataset is
uploaded and displayed, the Cell IDs are recognized as numeric variables. However,
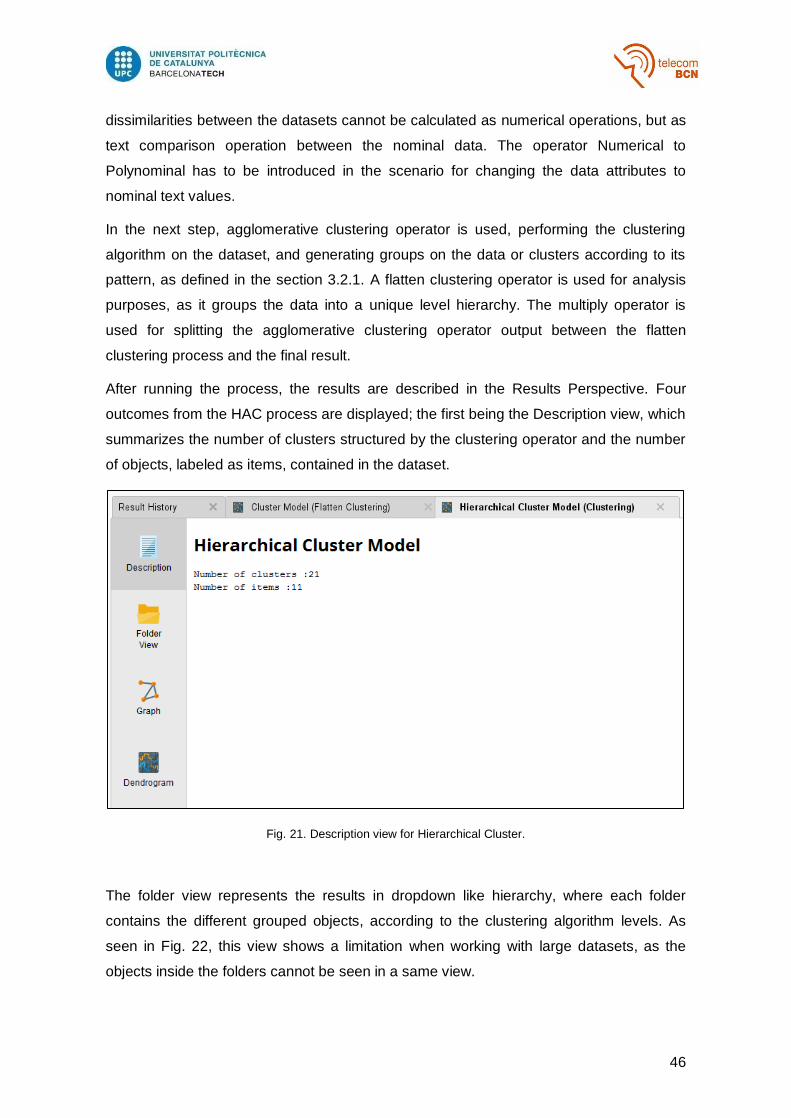
46
dissimilarities between the datasets cannot be calculated as numerical operations, but as
text comparison operation between the nominal data. The operator Numerical to
Polynominal has to be introduced in the scenario for changing the data attributes to
nominal text values.
In the next step, agglomerative clustering operator is used, performing the clustering
algorithm on the dataset, and generating groups on the data or clusters according to its
pattern, as defined in the section 3.2.1. A flatten clustering operator is used for analysis
purposes, as it groups the data into a unique level hierarchy. The multiply operator is
used for splitting the agglomerative clustering operator output between the flatten
clustering process and the final result.
After running the process, the results are described in the Results Perspective. Four
outcomes from the HAC process are displayed; the first being the Description view, which
summarizes the number of clusters structured by the clustering operator and the number
of objects, labeled as items, contained in the dataset.
Fig. 21. Description view for Hierarchical Cluster.
The folder view represents the results in dropdown like hierarchy, where each folder
contains the different grouped objects, according to the clustering algorithm levels. As
seen in Fig. 22, this view shows a limitation when working with large datasets, as the
objects inside the folders cannot be seen in a same view.

47
Fig. 22. Folder View for Hierarchical Clustering.
The graphic view represents the groups of objects in a hierarchical tree manner. Fig 23
shows how clustered objects are described in the successive leaves of the tree through
the different branches.
Fig. 23. RapidMiner tree cluster representation.

48
However, once the cluster tree is built, there is no way for measuring the distances
between the objects. The same happen in the Dendrogram view (Fig. 24), where there is
no label for identifying the objects or distance scale.
Fig. 24. Dendrogram View for Hierarchical Clustering
The Descriptive view for Flatten Clustering shows the 3 main grups of the hierarchies
built, and how many dataset objects are included in each branch.
Fig. 25. Description view for Flatten Clustering.

49
The Folder view describes the content of each cluster in a simpler manner than in
Hierarchical Clustering results, as the number of grouped objects is reduced into the
upper level of the hierarchy.
Fig. 26. Folder view of Flatten Clustering.
The Graphic view shows a tree with the main branches and a bigger cluster called root,
which contains all the objects of the datasets. The way of displaying the objects
contained in each cluster is the same as in Hierarchical Clustering results, by selecting
each leaf the objects included in the group are described in the right view.
Fig. 27. Graphic view for Flatten Clustering.

50
3.2.2.3. Final selection of data analytics tool.
After performing the clustering process in both tools, RapidMiner shows several flaws
compared with RStudio. It is worth to mention that RapidMiner only allows following the
agglomerative clustering process from a higher level and does not let the user to select
the distance method for computing the dissimilarity between the dataset objects.
Secondly, the tree and the dendrogram obtained after running the HAC process does not
provide the distance cost of the cluster structure, being a big limitation to quantify the
dissimilarity between the different sequences. Finally, the dendrogram obtained lacks of
labels for identifying the different objects at the end of the branches, only showing the
labels on the graphic view. However, the way the graphic view displays the objects
belonging to a cluster is not optimal for big datasets, difficulting the final qualitative
analysis of the cluster structure.
On the contrary, RStudio permits to follow the process with more detail, starting from the
weighted edit distance cost matrix, the execution of the clustering functions such as
AGNES and DIANA with more detail, and finally a very descriptive dendrogram for
qualitative and quantitative analysis of the structure, showing the objects labels in the
dendrogram leaves and the cost scale in every level of the branches.
RStudio is selected as the most adequate data analytics tool for this work, being the most
descriptive, quantitative and qualitatively along the whole process; permitting a deeper
analysis of the results in all the stages of knowledge discovery.
The case presented in this work as application for smartly processing the network data,
specifically the different Cell ID sequences registered along different mobility periods. The
different mobility paths are characterized according to the registered base station traces.
Different routes are grouped and categorized by using HAC considering the base stations
registered when the user is in mobility states with a granularity of 1 minute.
3.3. Knowledge exploitation stage:
In this stage, the knowledge obtained in the knowledge discovery stage is used in order
to smartly triggering different SON functions in a proactive manner. However, in the
context of this work, the exploitation of the knowledge gathered, can be extended to
relevant business cases, that will be discussed later in the next chapter
With the mobility profile obtained in the knowledge discovery stage, a database can be
built by the network management system containing subscriber mobility behavior, and

51
can be used by the relevant SON algorithm or business process for preparing different
mobility and traffic resources for the individual subscriber
As result and conclusion of this work several use cases for SON related RAN
optimization and planning procedures are discussed for exploiting the knowledge models
extracted from the knowledge discovery stage.

52
4. Results
This chapter explains how the methodology proposed in Chapter 3 is executed, following
the analytical process for finding user mobility patterns through knowledge discovery
process. In the first section, describes the data acquisition and pre-processing stage,
where the different datasets are prepared for the different knowledge discovery stage
cases. On the second, the knowledge discovery stage is described; in this stage the
sequence vectors representing the mobility trajectories are characterized by using the
HAC technique for building the mobility user profile. Finally in the last section, use cases
for exploiting the knowledge obtained are discussed.
4.1. Data acquisition and pre-processing stage.
Network data collection was made using Qualipoc software along several days with
different mobility trajectories. The Qualipoc software was configured as follows:
The radio technology selection was configured in free mode, allowing the mobile
connect to the radio access technology according to operators configuration.
For starting and stopping the recording periods were manually configured,
disabling the timer for automatic test time.
Test functionality was set to Idle Monitoring.
Every measure was registered two times per second approximately.
All measurements were taken with a SIM card of the same operator (Operator 1),
excepting five, which were taken using a SIM card from another operator
(Operator 2).
Using NQView processing software, a raw table, shown in Fig. was extracted. As Inter-
RAT handover to WCDMA occurred in very few points of the path, only LTE Cell ID, the
PCIs are used for the mobility characterization purpose of this project.

53
Table 3. Qualipoc raw data.
In the pre-processing stage, the dataset is prepared for using it as input in the knowledge
discovery stage processes. For modelling the mobility trajectory sequences, a dataset
composed of PCI vectors is constructed; each vector contains the sequence of PCIs
registered along the mobility routes.
First, the data files are manipulated separately. As raw data includes registers taken
every 2 milliseconds, it contains highly redundant PCI information. The criterion used in
this study for reducing the PCI redundancy is decreasing the vector granularity to the
order of minutes.
Working with fields in time format is difficult for selecting the time granularity, because
most of the time formats do not allow sorting the second and millisecond level. To
overcome this limitation, a new column field was added on each raw data table,
containing a numeric value with the hour and the minute of the measure as integer and
decimal respectively by using an excel time conversion function.

54
However, the minute granularity vectors is obtained by constructing a pivot table which
includes a column with the numeric time field and another column the most common PCI
registered in every minute.
Once the minute scale and PCI is constructed in the different files, the mobility traces are
built together. Mobility PCI sequences are grouped into an unique dataset as column
vectors. The sdist() only allows matrices which contains vectors of the same length;
because of this, the length of each mobility vector is fixed to 45 PCI registers field, which
represents sequences of 45 minutes. In total, 29 mobility vector sequences representing
29 routes are put together in the dataset.
Table 4. Extract from PCI sequence vector Dataset
Finally, each column is named using a label consisting of the date where the data was
collected and the description of the mobility route. The mobility routes included are:
Home-Work: Route from Gràcia to Sant Cugat.
Work-Home: Route from Sant Cugat to Gràcia
Work-Other: Route from Sant Cugat to city center
Univ-SagFam: Route from UPC to Sagrada Familia
Home-Univ: Route from Gràcia to UPC
Univ-Home: Route from UPC to Gràcia
Univ-Airport: Route from University to Airport
Route 1 Vodafone and Route 2 Vodafone: routes followed using another operator
SIM card

55
4.2. Knowledge discovery stage: Characterization of user mobility pattern.
The knowledge discovery stage is the next step, where data analytics functions are used
for finding insights about the mobility behaviour of the user. In the context of this project,
the knowledge discovery stage includes the application of the weighted edit distance
function for quantifying the dissimilarities between the mobility vector sequences and
HAC technique for categorizing the different movement routes.
4.2.1. Weighted edit distance computation.
For quantifying the dissimilarity among the several sequences of user mobility, the R
function sdists() for computing the weighted edit distance between the vector matrix will
be applied to the dataset.
The outcome of this function is a dissimilarity matrix D, a symmetric matrix where each
field represents the total weighted edit distance cost between the different PCI sequences,
where each route is compared individually with the others one by one. For space reasons,
an extract of the D matrix can be observed in the Table 6.
Table 5. Extract of Dissimilarity Matrix D.

56
The dissimilarity increases when comparing sequences from different routes. For
instance, the Fig. 28 displays a graphic description of this trend.
Fig. 28. Weighted edit distance results of “12072016 Home-Work” sequence
When comparing the trajectory sequence “12072016 Home-Work” with another one, the
magnitude of the distance is higher compared to trajectory sequence from a totally
different route.
Also, return routes (i.e. routes from home to workplace and route from workplace to
home) are less dissimilar than when the weighted edit distance is computed with another
route totally different (i.e. routes from home to workplace and route from home to
University).
The total dissimilarity between two completely different PCI sequences is equal to the
double of the number of registers, because when the weighted edit distance is calculated,
the substitution operation sums a cost of two units. This premise is presented in this
example, where the highest cost observed is 90, since the number of PCI registers per
vector sequence is 45.
Most data was collected with the SIM card of the same operator (Operator 1) so, the PCI
sequences between the different routes are more similar. Five mobility vectors are
constructed with data collected with a SIM card of another operator (Operator 2).
The Fig. 29 shows the weighted edit distance of one vector sequence from Operator 2.
The maximum dissimilarity between sequences from different operators is present, as

57
PCI arrangements from Operator 2 are totally different from Operator 1. It can be seen
that the distance with the vector sequences from Operator 1 tends to be 90.
Fig. 29. Weighted edit distance results of an Operator 2 mobility sequence
4.2.2. Hierarchical Agglomerative Clustering for mobility routes characterization.
Once the dissimilarity matrix D is computed by performing weighted edit distance, D is
passed as input for HAC function AGNES for mobility route characterization. AGNES
function processes the different distance costs in order to build a clustering structure with
the respective relations between the different routes, which is displayed for descriptive
analysis into a dendrogram.
Fig. 30 displays the dendrogram of this clustering structure. Evaluating this cluster in top
level of the hierarchy, 6 different groups of routes are shaped:
The Cluster1 groups all the routes from Home to Workplace
The Cluster2 groups the registered sequences from Workplace to home
The Cluster3 joins the routes from university to home and university to home, to
Sagrada Familia neighbours and city center
The Cluster4 includes the all the sequences from Home to University
The Cluster5 groups the routes registered with Operator 2 SIM card and its
different mobility routes.
Finally, a sole object cluster includes a totally different path sequence from
University to Airport.

58
Fig. 30.Hierarchical Agglomerative Clustering dendrogram from route sequencies.
As can be observed in Fig. 30, the HAC algorithm smartly groups routes of the same
trajectory into bigger clusters, achieving the main goal of this project which is
characterizing the subscriber mobility pattern according to the different routes registered.
For descriptive purposes, the color labels of the first four clusters are associated to those
used in Fig. 3
However, subgroups of sequence vectors inside the bigger clusters present dissimilarity
due to changes on the PCI configuration, the velocity the user is moving, minor changes
in the route, the waiting time of the public transport, traffic, etc.
In the Cluster1, a subgroup of two trajectories, “22032017 Home-Work” and “23032017
Home-Work”, is more dissimilar to the rest of the group with an average cost of 66,
therefore, they are joined together in the right part of this branch with a cost of 62. These
two sequences are taken several months after the initial collecting campaign, because of
this, changes in the network configuration have been performed and detected by this
algorithm. However, even if few changes occur, the PCI sequences remain more similar
compared to other trajectories, as generally PCI configuration remains the same.

59
The same happens in the Cluster 2, where sequences taken in the same month are
grouped in different branches than other routes registered in different months. However, it
is observed that the route “19072016 Work-Other”, is highly different from the rest of the
cluster with an average distance of 72. Excluding this route, the other ones in this cluster
have an average cost of 67, therefore are grouped together. This is because more than
half of the path is the same as the others, but the end of the route changes.
In Cluster3, the data was collected at different times all days with different vehicle traffic.
This implies a higher impact on the computed cost between trajectory vectors compared
to other clusters. Therefore, in the Cluster 4 the traces were collected around the same
time, from 7 to 8 am, reducing the distance cost between the mobility sequences.
The Cluster5, a group which contains registers with Operator 2 SIM card, the sequences
from route 1 are put together in the same branch as expected, presenting dissimilarity
compared to route 2, and the registers of a home sequence.
The sequence from University to Barcelona Airport is an unique sequence registered,
exposing higher dissimilarity with the rest of the clusters.
Finally, there is some relativity in calling this cluster structure built a 6 group cluster, as it
depends on the height level where the branches are observed. A Grouping Threshold is
proposed in this project, which defines the division of the different branches according to
the height scale. This Grouping Threshold, in practice, can be configured as a dynamic
parameter for categorizing the different routes registered by the network subscribers and
creating a mobility profile for every user.
4.3. Knowledge Explotaition
Using HAC for characterizing the mobile user trajectories can provide real time learning
and categorization of the prototype trajectories with high level of scalability, as new routes
can be added to the mobility profile of the user. Once the mobility profile of the user is
built, it can be used for different use cases related to SON, Over The Top (OTT) services
and novel MNO business cases.
4.3.1. SON functions and network performance applications.
The scalability that provides HAC to discover and group user movement trajectories
through the algorithms proposed, is compatible with the real-time and proactive
processing requirements expected from future SON evolution

60
The user mobility profile obtained from knowledge discovery can be used to complement
several legacy SON function in related mobility domains, including RF configuration
planning in the Self-Configuration domain; along with Coverage and Capacity
Optimization, Mobility Robustness Optimization (MRO) and Mobility Load Balancing
(MLB) functions in the Self-optimization domain.
For instance, in future 5G networks handover transitions may occur faster due to higher
densification of small cells. Therefore, the user mobility profiles can be aggregated and
gathered by the MLB and MRO functions for modifying dynamically different handover
parameters and resource scheduling at the cell level. On the other hand, mobility profiles
of the users are obtained with historic data from the user. This can help the MLB
algorithm for scheduling and coordinating resource allocation with adjacent cells.
Also, along with other network performance parameters, mobility profiles can help
improving user specific QoE along with performance related KPIs by detecting and
correct specific degradations that happen to certain users.
4.3.2. OTT services and MNO related business cases
The use of cognitive platforms is a novel MNO business case based on providing
additional data processing services to customers, partners and OTT developers.
Operators are evaluating future application services which include user generated data
combined with cognitive intelligence. [19]
Since several years ago, telecommunications providers started to digitalize information
from different levels into intelligent platforms. The intelligent platforms already structured
include data from company assets, IT systems, and the different commercialized services
the operator provides to the users.
Now, with all this information digitalized into cloud services, the next step is to make use
of network data through big data analytics capabilities and developing the concept of
Cognitive Intelligence, this concept of user knowledge is used for customizing solutions
for managing their data and the interaction with operators.
For example, Telefonica presented in 2017 a cognitive solution called AURA. This user
centered solution provides an interface where each subscriber can interact with their own
data. This kind of solutions permits the user to decide if the operators can share with third
party companies the knowledge and insights obtained off their data. Institutions like
UNICEF are testing the platform for improving their predictive models related to natural
disasters and sanitary incidences. Other institutions related to educational area, are

61
interested in the platform for constructing interest maps for various government projects
and humanitary agencies looking to address educational challenges in a more efficient
manner. [19]
A partnership with OTT service provider Facebook is also foreseeable, in order to
improve their Safety Check applications for emergency cases, where location data and
mobility behaviour can be used for contacting users in specific zones. [20]
Therefore, intelligent solutions can include the characterization of mobility profiles from
each user obtained from first hand by using the procedures presented in this work.
For instance, the mobility profiles delivered, previous user agreement, to third party
companies or institutions such as Insurance Companies, security institutions, public
administration and retail stores. Insurance companies can incorporate to their billing
platforms the different mobility trajectories and contrast it with historic of crimes occurred
in each neighbours, for evaluating in a more precise manner the services cost offered to
individual users. Also, stores from several categories can offer the users individual
promotions based on their mobility traces.

62
5. Conclusions and Future Work
5.1. Conclusions
The mobility profile of an individual user was generated by implementing data analytics
processes for discovering insights about raw data collected from drive-test. By using the
HAC method, 29 mobility sequences taken in five routes were classified accurately into 5
groups of trajectories, plus one additional group where mobility sequences were
registered with a SIM card of a different operator. The process implemented in this work
is scalable, allowing discovering, learning and categorizing new routes when new mobility
sequences are added, opposed to classification methods, where categories of data have
to be known in advance.
Dissimilarity calculations between data sequences have to be performed as part of the
knowledge discovery processes. For instance, when manipulating categorical data, edit
distance methods provides the best outcome compared with numerical distance functions
based on Euclidean or Manhattan distances. Moreover, as data collected from mobile
networks is time variable, it is needed to combine distance calculation methods with
dynamic programing such as sequence alignment techniques, for taking into account the
changes in the velocity and path uncertainty added by events like road traffic, public
transport waiting, etc.
The number of groups generated is given by the dissimilarity level where the clustering
structure is observed. Because of this, a grouping threshold parameter is proposed in this
work, for tuning the identification of the different groups of trajectories discovered.
Finally, the framework for AI based knowledge process for radio access optimization and
planning was effective for methodology execution of this work, and can drive decisions
that can find applications in future 5G, enhanced SON proposals and for improving new
business use cases such as cognitive intelligence platforms and OTT support.
5.2. Future Work
The algorithm proposed in this work can be more efficient if different methods for distance
calculation are adapted and evaluated for constructing the dissimilarity matrix between
categorical sequences. Dynamic Time Warping is a method for calculating dissimilarity
between time varying sequences, detecting stretches in the data given by events such as
obstacles, minor route changes among other uncertainties in the walking path. However,
it is designed for numerical sequences only. The adaptation of dynamic time warping

63
algorithm to categorical sequences like the mobility vector sequences proposed, can
improve the accuracy in the dissimilarity computation.
Once the routes are discovered and categorized into the mobility pattern profile, it can be
used of training set to ML classification algorithms. However, the HAC also classifies by
itself the different groups without perceptible computing effort.
Also, mobility behaviour can be characterized according to the states of mobility of the
user, for instance, the periods where the user is in movement or in low mobility. In the
early stages of research for this work, an approximation for this case using hierarchical
clustering functions was studied and is described in the Appendix A and Appendix B. It
can be of interest, combined with the results obtained in this work, for resource
scheduling and for finding further applications in RAN automation.

64
Bibliography
[1] S. Feng; E. Seidel. “Self-Organizing Networks (SON) in 3GPP Long Term Evolution”.
Nomor Research GmbH; Munich, Germany, 2008.
[2] G. Bhutani. “Application of Machine-Learning Based Prediction Techniques in
Wireless Networks”. Int. J. Communications, Network and System Sciences, n.o. 7, 131-
140, 2014
[3] A. Imran, A. Zoha, and A. Abu-Dayya. “Challenges in 5G: How to Empower SON with
Big Data for Enabling 5G”. IEEE Network., pp 27-33, 2017.
[4] M. Agiwal, A. Roy, N. Saxena. “Next Generation 5G Wireless Networks:
A Comprehensive Survey”. IEEE Communications Surveys & Tutorials. Vol 18, n.o. 3;
Third Quarter 2016, pp 1617-1655.
[5] J. Perez-Romero, O. Sallent, R. Ferrus, and R. Agusti.. “Knowledge-based 5G Radio
Access Network Planning and Optimization”. 2016.
[6] He, Y., et al. “Big Data Analytics in Mobile Cellular Networks”. IEEE Access., Vol 4, pp
1985-1994, 2016.
[7] D. Katsaros, et al. “Clustering Mobile Trajectories for Resource Allocation in Mobile
Environments”. in Advances in Intelligent Data Analysis V., Springer Berlin Heidelberg,
2003, pp. 319–329.
[8] S. Bi; R. Zhang; Z. Ding and S. Cui. “Wireless Communications in the Era of Big
Data”. IEEE Communications Magazine. October 2015. p 190.
[9] A. Osseiran; et al. “Scenarios for 5G Mobile and Wireless Communications: The
Vision of the METIS Project”. IEEE Communications Magazine. May 2014. p 26.
[10] S. Mwanje,et al; “Network Management Automation in 5G: Challenges and
Opportunities”. IEEE 27th Annual International Symposium on Personal, Indoor, and
Mobile Radio Communications (PIMRC): Workshop: 6th International Workshop on Self-
Organizing Networks (IWSON); Munich, Germany. 2016.
[11] E. Dahlman; et al. “5G Wireless Access: Requirements And Realization”. IEEE
Communications Magazine — Communications Standards Supplement. December 2014.
pp 42-47.
[12] C. Wan; et al. “Cellular Architecture and Key Technologies for 5G Wireless
Communication Networks”. IEEE Communications Magazine. February 2014. pp 112-130
[13] Anagnostopoulos Theodoros, et al. “Mobility Prediction based on Machine Learning”.
IEEE International Conference on Mobile Data Management. 2011

65
[14] J. Pan; et al. “Tracking Mobile Users in Wireless Networks via Semi-Supervised
Colocalization”. IEEE Transactions On Pattern Analysis And Machine Intelligence. Vol 34,
n.o. 3; March 2012, p587
[15] T. Duong and D. Tranm. “A Fusion of Data Mining Techniques for Predicting
Movement of Mobile Users”. Journal Of Communications And Networks, Vol. 17, No. 6,
December 2015. pp 568 – 580.
[18] 3rd Generation Partnership Project(3GPP), ed. (16 de enero de 2013). Technical
Specification 25.101 V11.4.0
[19] 3GPP TS 36.101 E-UTRA: User Equipment (UE) radio transmission and reception
[20] https://www.telefonica.com/es/web/press-office/-/telefonica-presents-aura-a-
pioneering-way-in-the-industry-to-interact-with-customers-based-on-cognitive-intelligence

66
Appendices
Appendix A.
Hierarchical clustering techniques comparison.
For testing and the Hierarchical Clustering functions, two datasets “Dataset 1” and
“Dataset 2” were prepared, where only mobility states are represented.
For building the datasets, data vectors of the same size were needed. Therefore, a time
scale of one day divided in time spans of 15 minutes were selected. For each 15 minutes
time span a PCI evaluation was evaluated according to the following mobility criteria:
If a PCI was stable for more than 60% of each time span, this PCI was chosen as
the dominant PCI. This case was considered as a low mobility scenario.
On the contrary, if no PCI was stable for more than 60% of the time, this case was
considered as a medium-high mobility scenario, and therefore, no dominant PCI
was chosen.
According to the mobility criteria, a dataset table was built as shown in Fig.
Fig. 31. Extract of Dataset1 pre-processed.
The time scale was arranged as columns. In the Dataset 1, the 15 minute frames were
labelled and ordered from 0 to 23.45, being 0 the time 00:00 and 23.45 as the time 23:45.
For calculating the edit distance between the mobility sequences the R library “stringdist”
is used. The function stringdistmatrix() builds a dissimilarity matrix by comparing the
hamming distance between the different sequence vectors. The resultant distance matrix
“D” has the following structure where each coordinate is the distance cost between the
column and row datasets.

67
Fig. 32. Edit Distance Matrix from Dataset1
This distance matrix is passed as input for AGNES and DIANA functions for building the
cluster structure. The first cluster build is the HAC with average distance method:
Fig. 33. AGNES dendrogram of Dataset1 in R.
The HDC dendrogram is also generated for this Dataset1:

68
Fig. 34. DIANA dendrogram of Dataset1 in R.
The outcome of both hierarchical clustering techniques, AGNES and DIANA are highly
similar. However, the fact that DIANA does not incorporate the option for controlling the
linkage method used for joining the different cluster objects, provides uncertainty on the
manner the cluster structure is built. For this project, only AGNES is used to overcome
this limitation.

69
Appendix B
Hierarchical agglomerative clustering for characterizing mobility periods.
The Dataset 2, shown in Fig. 35 takes into account only the high mobility sequences
along a normalized time scale. For the dataset preparation, only high mobility periods of
ten registers labelled from 1 to 10, each one representing 15 minutes spans. The same
criterion for PCI evaluation and high mobility periods used for the first dataset was used.
Fig. 35. Dataset2 representing high mobility and non-mobility periods in a normalized time scale.
This case focuses in characterizing the different mobility states described in the Dataset 2
by implementing HAC technique through AGNES function in RStudio.
After calculating the edit distance on the dataset, the AGNES algorithm smartly
characterizes the different mobility routines in two big groups: morning and afternoon.
The algorithm also subclassifies into both groups the changes in the summer routine.

70
Fig. 36. RStudio Hierarchical Clustering dendrogram with average linkage.
The HAC algorithm is capable of classifying the mobility behavior according to the
mobility periods of the user and the base station registered in the low mobility state. As
the Fig. 36 shows three main groups including the morning branch, morning summer
branch and the afternoon branch.
However, it can be extended for characterizing the mobility periods in of full days, helping
to identify if one day is a labor day, weekend and vacation season.