Characterization of Triggerable Quinones for the ...
178
Louisiana State University LSU Digital Commons LSU Doctoral Dissertations Graduate School 2011 Characterization of Triggerable Quinones for the Development of Enzyme-Responsive Liposomes Maria Fabiana Mendoza Louisiana State University and Agricultural and Mechanical College, [email protected] Follow this and additional works at: hps://digitalcommons.lsu.edu/gradschool_dissertations Part of the Chemistry Commons is Dissertation is brought to you for free and open access by the Graduate School at LSU Digital Commons. It has been accepted for inclusion in LSU Doctoral Dissertations by an authorized graduate school editor of LSU Digital Commons. For more information, please contact[email protected]. Recommended Citation Mendoza, Maria Fabiana, "Characterization of Triggerable Quinones for the Development of Enzyme-Responsive Liposomes" (2011). LSU Doctoral Dissertations. 1173. hps://digitalcommons.lsu.edu/gradschool_dissertations/1173
Transcript of Characterization of Triggerable Quinones for the ...

Louisiana State UniversityLSU Digital Commons
LSU Doctoral Dissertations Graduate School
2011
Characterization of Triggerable Quinones for theDevelopment of Enzyme-Responsive LiposomesMaria Fabiana MendozaLouisiana State University and Agricultural and Mechanical College, [email protected]
Follow this and additional works at: https://digitalcommons.lsu.edu/gradschool_dissertations
Part of the Chemistry Commons
This Dissertation is brought to you for free and open access by the Graduate School at LSU Digital Commons. It has been accepted for inclusion inLSU Doctoral Dissertations by an authorized graduate school editor of LSU Digital Commons. For more information, please [email protected].
Recommended CitationMendoza, Maria Fabiana, "Characterization of Triggerable Quinones for the Development of Enzyme-Responsive Liposomes" (2011).LSU Doctoral Dissertations. 1173.https://digitalcommons.lsu.edu/gradschool_dissertations/1173

CHARACTERIZATION OF TRIGGERABLE QUINONES FOR THE DEVELOPMENT OF ENZYME-RESPONSIVE LIPOSOMES
A Dissertation
Submitted to the Graduate Faculty of the Louisiana State University and
Agricultural and Mechanical College in partial fulfillment of the
Requirements for the degree of Doctor of Philosophy
In
The Department of Chemistry
by Maria Fabiana Mendoza
B.S., Missouri Baptist University, 2005 May 2012

ii
DEDICATION
This dissertation is dedicated to my loving grandmother:
Mabel Cerri Burgantis de Mendoza
And to
My Mom, Ibis Elizabeth Paris Bargas
My Dad, Hector Eduardo Mendoza Cerri
My Brother, Facundo Horacio Jesus Mendoza Paris
My Brother, Jose Hector Mendoza Paris
My Partner, Dayna Tatiana Pastorino Martinez

iii
ACKNOWLEDGMENTS
I would like to thank my advisor, Dr. Robin L. McCarley, for his extraordinarily
guidance and support through all these years in graduate school. I still remember my visit to
LSU and how from the moment I interacted with his graduate students and met him I knew that I
would like to be a part of his group. I feel so lucky in having an advisor who I admired as a
scientist and as a person. He will be definitely missed and I will always be grateful to God for
putting him in my life.
To the McCarley research group, thank you for your support and friendship. It was the
collection of people from different background and cultures that made this group very special. It
has been a pleasure to work with each of you and I wish you all the best in life.
To my committee members, Dr. Doug Gilman, Dr. Carol Taylor, and Dr. Grover
Waldrop, I would like to thank you all for always having your door open for me. To my Dean’s
representative, Dr. Jin-Woo Choi and his substitute Dr. Dorel Moldovan, thank you for being in
my general exam and final examination, respectively.
I would also like to give special thanks to my colleagues Nicole Carrier, Jennifer De
Guzman, Jeremiah Forsythe, and Elisabeta Mitran and to the Post-doctoral fellows in the
McCarley group, Sreelatha Balamurugan, Winston Ong, and Martin Loew for their scientific
discussions and proofreading of my documents. Nikki, Jenny, Eli and Sreelatha thanks for your
friendship and I hope that we can continue to remain in touch for the rest of our lives.
I appreciate my dear friends, Nadya Braida, Leila Juan, Florencia Belo, Victoria Garcia,
Andres Vidal-Gadea and Santiago Claramunt for being there when I needed someone to cheer
me up or just to listen. As a foreign person in the United State it has not always been easy and
having friends willing to share some time and a word of encouragement has been of great help.
To my family, and to those that have known me since I was a little girl, thank you for
helping me to mature and giving me strength to continue on this journey. Mom, dad, Facundo

iv
and Jose thank you for helping me become into the person that I am today. I want to give a very
special thanks to the most wonderful person in this world, my grandmother Mabel Cerri, whose
unconditional love is greater than my words can express. She is definitely my heart and soul.
I would also especially like to thank my partner Taty, for being there for me at all times.
You provided the peace that allowed me to focus on writing and to complete this process in a
timely manner. You have taken care of me and everything else around me, I am so grateful to
have you in my life.
Lastly, I would like to give thanks to all of the other the people that helped me through
my graduate career here at LSU and especially those in the Department of Chemistry.

v
TABLE OF CONTENTS
DEDICATION ................................................................................................................................ ii
ACKNOWLEDGMENTS ............................................................................................................. iii
LIST OF TABLES ....................................................................................................................... viii
LIST OF FIGURES ....................................................................................................................... ix
LIST OF SCHEMES.................................................................................................................... xiv
LIST OF ABBREVIATIONS AND SYMBOLS ..........................................................................xv
ABSTRACT ...................................................................................................................................xx
CHAPTER 1. INTRODUCTION ....................................................................................................1 1.1 Research Goals and Aims ....................................................................................................1 1.2 Prodrugs Activated by Endogenous Oxidoreductase Enzymes Other Than NQO1 ...........4
1.2.1 Aldehyde Oxidase ....................................................................................................5 1.2.2 Amino Acid Oxidases ..............................................................................................5 1.2.3 NADPH-Cytochrome P450 Reductase ....................................................................6 1.2.4 Cytochrome P450s ...................................................................................................8 1.2.5 Tyrosinase ..............................................................................................................10
1.3 Enzyme-Activated Liposomes ..........................................................................................12 1.3.1 Elastase ..................................................................................................................12 1.3.2 Alkaline Phosphatase .............................................................................................13 1.3.3 Phospholipase C .....................................................................................................14 1.3.4 Phospholipase A2 (PLA2) ......................................................................................15 1.3.5 Matrix Metalloproteinase (MMP) ..........................................................................18
1.4 NAD(P)H:Quinone Oxidoreductase Type-1 (NQO1) ......................................................21 1.4.1 Origin, Types, Structure, Mechanism, Location and Over Expression .................21 1.4.2 Inhibitors of Human NQO1 ...................................................................................24 1.4.3 Bioreductive Drugs Activated by Human NQO1 ..................................................27 1.4.4 Prodrugs Presenting the Trimethyl-lock System Activated by Human NQO1 .....31
1.5 References ..........................................................................................................................32
CHAPTER 2. ELECTROCHEMICAL BEHAVIOR OF QUINONE DERIVATIVES POTENTIALLY USABLE FOR DRUG DELIVERY APPLICATIONS ....................................53
2.1 Introduction ........................................................................................................................53 2.2 Experimental Section .........................................................................................................55
2.2.1 Materials and Methods ...........................................................................................55 2.3 Results and Discussion .....................................................................................................56
2.3.1 Thermodynamic Parameters of Naked Quinones ..................................................56 2.3.2 Thermodynamic Parameters of Propionic Acid Quinones and QMe-ETA .............59

vi
2.3.3 Propionic Acid Quinones and Their Cyclization Behavior ...................................65 2.4 Conclusions ........................................................................................................................67 2.5 References ..........................................................................................................................68
CHAPTER 3. TRIGGERABLE QUINONES ACTIVATED BY NAD(P)H:QUINONE OXIDOREDUCTASE TYPE-1 (HNQO1) FOR POTENTIAL DRUG DELIVERY APPLICATIONS ...........................................................................................................................72
3.1 Introduction ........................................................................................................................72 3.2 Experimental Section ........................................................................................................74
3.2.1 Materials ................................................................................................................74 3.2.2 Enzyme Kinetic Assay ...........................................................................................74 3.2.3 Molecular Docking ................................................................................................75
3.3 Results and Discussion ......................................................................................................77 3.3.1 Kinetic Studies on Triggerable Quinones ..............................................................77 3.3.2 Docking Studies on Triggerable Quinones ............................................................82
3.4 Conclusions ........................................................................................................................90 3.5 References ..........................................................................................................................91
CHAPTER 4. QUINONE TRIGGER-BASED LIPIDS FOR FORMING ENZYME-RESPONSIVE LIPOSOMES AND THEIR RESPONSE TOWARD HNQO1 ASSAY CONDITIONS .............................................................................................................................100
4.1 Introduction ......................................................................................................................100 4.2 Experimental Section ......................................................................................................101
4.2.1 Materials ..............................................................................................................101 4.2.2 Calcein-loaded Liposome Preparation .................................................................102 4.2.3 Characterization of Calcein-loaded Liposomes ...................................................103 4.2.4 Stability and Calcein Release Experiments .........................................................103
4.2.4.1 Bovine Serum Albumin .........................................................................104 4.2.4.2 Reduced Nicotine Adenine Dinucleotide...............................................104 4.2.4.3 Human NAD(P)H:Quinone Oxidoreductase Type-1 (hNQO1) and Type-
2 (hNQO2) ............................................................................................105 4.2.4.4 Sodium Dithionite ..................................................................................105
4.3 Results and Discussion ....................................................................................................106 4.3.1 Stability and Calcein Release for Q-DOPE Liposome Systems ..........................106
4.3.1.1 Liposomes Composed of 100% QMe-DOPE .........................................106 4.3.1.2 Liposomes Composed of 97% QMe-DOPE/3% PEG2000-DOPE ...........108 4.3.1.3 DOPC Liposomes ..................................................................................113 4.3.1.4 Liposomes Composed of 90% QMe-DOPE/10% DOPC and 80% QMe-
DOPE/20% DOPC .................................................................................116 4.3.1.5 Liposomes Composed of 70% QMe-DOPE/30% Cholesterol (CHO) ....119
4.3.2 DLS and Zeta Potential of Q-DOPE Liposome Systems ....................................126 4.4 Conclusions ......................................................................................................................127 4.5 References ........................................................................................................................128

vii
CHAPTER 5. CONCLUSIONS AND OUTLOOK ....................................................................133 5.1 Summary ..........................................................................................................................133 5.2 Conclusions ......................................................................................................................136 5.3 Outlook ............................................................................................................................136 5.4 References ........................................................................................................................137
APPENDIX A: SUPPLEMENTAL INFORMATION ................................................................139
APPENDIX B: PERMISSIONS ..................................................................................................149
VITA ............................................................................................................................................156

viii
LIST OF TABLES
Table 2.1 Thermodynamic results for naked quinones. Potential scans were conducted at a rate of V s–1 at 22±2 °C in a pH 7.1 0.1 M PB/0.1 M KCl buffer solution. A three-electrode cell was used containing a glassy carbon electrode, a platinum counter electrode, and an Ag/AgCl (3M KCl) reference electrode. Potentials were converted to values versus the standard hydrogen electrode (SHE) by adding 0.210 V. Results are reported as the mean of 4 replicates ± one standard deviation ................................57
Table 2.2 Thermodynamic results for propionic acid quinones. Potential scans were conducted at a rate of 0.1 V s–1 at 22±2 °C in a pH 7.1 0.1 M PB/0.1 M KCl buffer solution. A three-electrode cell was used containing a glassy carbon electrode, a platinum counter electrode, and an Ag/AgCl (3M KCl) reference electrode. Potentials were converted to standard hydrogen electrode (SHE) by adding 210 mV. Results are reported as the mean of 4 replicates ± one standard deviation. The anodic peak potential of lactone oxidation, Ep,l, is reported for those propionic acid quinones that exhibit this voltammetric feature .........................................................................................61
Table 2.3 Rate constant for the disappearance of propionic acid hydroquinones. Ratio measured between peaks current where the potential scan was conducted at a rate of 0.1 V s–1 at 22±2 °C in a pH 7.1 0.1 M PB/0.1 M KCl buffer solution. Ratio measured between peaks current where the potential scan was conducted at a rate of 1 V s–1 22±2 °C in a 0.1 M PBS / 0.1 M KCl pH 7.1 buffer solution. A three-electrode cell was used containing a glassy carbon electrode, a platinum counter electrode, and an Ag/AgCl (3M KCl) reference electrode ..................................................................66
Table 3.1 Kinetic parameters for the reduction of quinone derivatives by hNQO1. Values are the mean ± one standard deviation for three independent determinations ..........................................................................................................78
Table 3.2 Energy score and distance from N5 of FAD to the possible hydride transfer atoms. Atoms closer in distance to N5 are highlighted in red. ..................88
Table 4.1 Average diameters and zeta potentials of QMe-DOPE liposome systems. Experiments performed at 25 °C in pH 7.1 0.1M PB/0.1M KCl. Results are the average of 3 determinations ± one standard deviation. Polydispersity indexes ≤ 0.3 are considered acceptable. Reference 2; pH 7.4 0.05 M PB/0.075 M KCl. Measurement done by Dr. Martin Loew ................126
Table 4.2 Summarized results from calcein release, DLS, and zeta potential experiments performed on QMe-DOPE liposome systems at 25 °C in pH 7.1 0.1 M PB/0.1 M KCl. Reference 2; pH 7.4 0.05 M PB/0.075 M KCl. Measurement done by Dr. Martin Loew .................................................................129

ix
LIST OF FIGURES
Figure 1.1 Illustration of quinone derivatives investigated in this dissertation..........................2
Figure 1.2 Mechanism of action of D-amino acid oxidase. Adapted from Pollegioni (2007) ........................................................................................................................6
Figure 1.3 Reductive activation of TPZ. Adapted from Chen (2009) .......................................8
Figure 1.4 Reductive activation of AQ4N. Adapted from Chen (2009) ..................................10
Figure 1.5 Catalytic mechanism of tyrosinase. Adapted from Matoba (2006) ........................11
Figure 1.6 Cleavage of peptide-DOPE structure by elastase. Adapted from Pak (1998) .......................................................................................................................13
Figure 1.7 Mode of action of PLA2 versus other phospholipases. AA = arachidonic acid. Adapted from Kaiser (1999) ..........................................................................15
Figure 1.8 ProAELs structures and mechanism of AELs release in the presence of PLA2. Adapted from Andresen (2005) ...................................................................18
Figure 1.9 Schematic representation of FAD interactions with rat NQO1 (A) and human NQO1 (B). A) Shows hydrogen bonds of FAD with residues. W means water. B) Shows hydrogen bonds and van der Waals interactions of FAD with hNQO1. Open radiated circles indicate hydrophobic interactions. Hydrogen bonds are represented by dashed green lines; water molecules are shown as blue filled circles. Adapted from Li (1995) and Faig (2000) ........................................................................................................22
Figure 1.10 Mechanism of action of antitumor agents after bioreductive activation by human NQO1. Adapted from Siegel (2008) ...........................................................58
Figure 2.1 Cyclic voltammograms of naked quinones. Potential scans were conducted at a rate of 0.1 V s–1 at room temperature (22±2 °C) in a pH 7.1 0.1 M PB/0.1 M KCl buffer solution. A three-electrode cell was used containing a glassy carbon electrode (A=0.07 cm2), a platinum counter electrode, and an Ag/AgCl (3M KCl) reference electrode (0.210 V vs. SHE). Potential sweeps started at 0.6 V to –0.6 and back to 0.6 V. Positive current peak corresponds to the reduction peak (Ep,c) and negative current corresponds to oxidation peak (Ep,a). Colored lines represent 4 trials performed on each quinone and dashed line represents the buffer solution .....................................................................................................................12
Figure 2.2 Cyclic voltammograms of quinones with a propionic acid side chain. Potential scans were conducted at a rate of 0.1 V s–1 at 22±2 °C in a pH 7.1 0.1 M PB/0.1 M KCl buffer solution. A three-electrode cell was used containing a glassy carbon electrode (A=0.07 cm2), a platinum counter electrode, and an Ag/AgCl (3M KCl) reference electrode (0.210 V vs. SHE). Potential sweeps started at 0.6 V to –0.6 and back to 0.6 V. Positive current peak corresponds to the reduction peak (Ep,c) and negative

x
current corresponds to oxidation peak (Ep,a). Colored lines represent 4 trials performed on each quinone and dashed lines represent the buffer solution .....................................................................................................................63
Figure 2.3 Cyclic voltammograms of QMe-COOH. Potential scans were conducted at a rate of 0.1 V s–1 at 22±2 °C in the specified buffer solution. A three-electrode cell was used containing a glassy carbon electrode (A=0.07 cm2), a platinum counter electrode, and an Ag/AgCl (3M KCl) reference electrode (0.210 V vs. SHE). Potential sweeps started at 0.6 V to –0.6 and back to 0.6 V. Positive current peak corresponds to the reduction peak (Ep,c) and negative current corresponds to oxidation peak (Ep,a), and to the anodic peak of the lactone (Ep,l) ..............................................................................66
Figure 3.1 Best prediction for the docked duroquinone in receptor 1 compared with the position of the duroquinone in the original crystal structure. Docked duroquinone (pink) differ from the original duroquinone (yellow) by 0.4530 Å. Representation of amino acids (stick display; color by atom type, carbon atoms colored in purple) and FAD (sticks display; color by atom type, carbon atoms colored in cyan) in receptor 1 ..........................................82
Figure 3.2 Structural frames of FlexX-docked quinones in the active site of hNQO1. Stick display in all the frames, FAD (color by atom type; carbon atoms colored in cyan), amino acids (color by atom type, carbon atoms colored in purple) and docked-quinones (color by atom type, carbon atoms in pink): (A) QBr-COOH, (B) QH-COOH, (C) QMe-COOH, (D) QMeO-COOH, (E) QdiMeO-COOH, (F) Q'-COOH, (G) QnogemMe-COOH, (H) QMe-ETA, (I) Q(Me-N)-COOH, and (J) Q(n-pr-NH)-COOH ..................................................86
Figure 3.3 Correlation between the log (distance of the closer atom on the quinone ring with respect to N5 of FAD) and the log (kcat/Km) ............................................89
Figure 4.1 UV-vis absorbance spectrum of 100% QMe-DOPE liposomes in pH 7.1 0.1 M PB/0.1 M KCl at room temperature. λmax = 264.9 nm corresponds to the QMe headgroup and λmax = 497 nm corresponds to the encapsulated calcein .....................................................................................................................106
Figure 4.2 Stability of 100 µM 100% QMe-DOPE liposomes in the presence of 100 μM NADH. (↑) the time for addition of 300 µL of 1 mM NADH solution. No leakage was observed as noted by the lack of increase in fluorescence intensity with time. (●) time at which 100% QMe-DOPE liposomes were lysed with the addition of 15 µL of 30% (v/v) Triton X-100. ( ) Instrument stopped by itself and was started again by me; no consequences observed on the measurement ..........................................................107
Figure 4.3 Instability of 100 µM 100% QMe-DOPE liposomes in the presence of 0.007% BSA. (↑) the time for addition of 300 µL of 0.07% BSA solution into liposome solution. (↑) the addition time for 100% QMe-DOPE liposomes into 0.007% BSA solution. (●) time at which 100% QMe-DOPE liposomes were lysed with the addition of 15 µL of 30% (v/v) Triton X-100 ...........................................................................................................108

xi
Figure 4.4 UV-vis absorbance spectrum of 97% QMe-DOPE/3% PEG2000-DOPE liposomes in pH 7.1 0.1 M PB/0.1 M KCl at room temperature. λmax = 264.9 nm corresponds to the QMe headgroup and λmax = 497 nm corresponds to the encapsulated calcein .................................................................109
Figure 4.5 Instability of 100 µM 97% QMe-DOPE/3% PEG2000-DOPE liposomes in the presence of 0.007% BSA. (↑) the time for addition of 300 µL of 0.07% BSA solution into liposome solution. (●) time at which 97% QMe-DOPE/3% PEG2000-DOPE liposomes were lysed with the addition of 15 µL of 30% (v/v) Triton X-100 ................................................................................110
Figure 4.6 Instability of 100 µM 97% QMe-DOPE/3% PEG2000-DOPE liposomes in the presence of 0.5 μM hNQO1. (↑) the time for addition of 300 µL of 5 µM hNQO1 solution into liposome solution. (●) time at which 97% QMe-DOPE/3% PEG2000-DOPE liposomes were lysed with the addition of 15 µL of 30% (v/v) Triton X-100 ................................................................................111
Figure 4.7 Instability of 100 µM 97% QMe-DOPE/3% PEG2000-DOPE liposomes in the presence of 100 μM NADH and 0.5 µM hNQO1. (↑) the addition time for 300 µL of 5 µM hNQO1 solution into liposome/NADH solution. (●) time at which 97% QMe-DOPE/3% PEG2000-DOPE liposomes were lysed with the addition of 15 µL of 30% (v/v) Triton X-100 ...........................................112
Figure 4.8 Overlap of the calcein release curves for 100 µM 97% QMe-DOPE/3% PEG2000-DOPE liposomes in the presence of 0.5 µM hNQO1 (red line) and 100 µM 97% QMe-DOPE/3% PEG2000-DOPE liposomes containing 100 µM NADH in the presence of 0.5 µM hNQO1 (blue line). (↑) the addition time for 300 µL of 5 µM hNQO1 solution into liposome/NADH solution. (●) time at which 97% QMe-DOPE/3% PEG2000-DOPE liposomes were lysed with the addition of 15 µL of 30% (v/v) Triton X-100. Times were offset to compare the curves ......................................................112
Figure 4.9 Structure of DOPE and DOPC lipids ......................................................................113
Figure 4.10 UV-vis absorbance spectrum of DOPC liposomes in pH 7.1 0.1 M PB/0.1 M KCl at room temperature. The peak of λmax = 497 nm corresponds to the encapsulated calcein ..........................................................................................114
Figure 4.11 Stability of 100 µM DOPC liposomes in the presence of 0.007% BSA. (↑) the addition time for 300 µL of 0.07% BSA solution into liposome solution. No leakage was observed as noted by the lack of increase in fluorescence intensity with time. (●) time at which DOPC liposomes were lysed with the addition of 15 µL of 30% (v/v) Triton X-100 .................................115
Figure 4.12 Stability of 100 µM DOPC liposomes in the presence of 0.5 µM hNQO1. (↑) the addition time for 300 µL of 5 µM hNQO1 solution into liposome solution. No leakage was observed as noted by the lack of increase in fluorescence intensity with time. (●) time at which DOPC liposomes were lysed with the addition of 15 µL of 30% (v/v) Triton X-100 .................................115

xii
Figure 4.13 UV-vis absorbance spectrum of 90% QMe-DOPE/10% DOPC (blue line) and 80% QMe-DOPE/20% DOPC (red line) liposomes in pH 7.1 0.1 M PB/0.1 M KCl at room temperature. λmax = 264.9 nm corresponds to the QMe headgroup and λmax = 497 nm corresponds to the encapsulated calcein .........117
Figure 4.14 Unstable behavior of 100 µM 90% QMe-DOPE/10% DOPC and 100 µM 80% QMe-DOPE/20% DOPC liposomes in the presence of 0.007% BSA. (↑) the time for addition of 300 µL of 0.07% BSA solution into the 90% QMe-DOPE/10% DOPC liposome solution. (↑) the addition time for 80% QMe-DOPE/20% DOPC liposomes into 0.007% BSA solution. (●) time at which 90% QMe-DOPE/10% DOPC and 80% QMe-DOPE/20% DOPC liposomes were lysed with the addition of 15 µL of 30% (v/v) Triton X-100...........................................................................................................................117
Figure 4.15 Instability of 100 µM 80% QMe-DOPE/20% DOPC liposomes in the presence of 0.5 µM hNQO1. (↑) the addition time for 300 µL of 5 µM hNQO1 solution into liposome solution. (●) time at which 80% QMe-DOPE/20% DOPC liposomes were lysed with the addition of 15 µL of 30% (v/v) Triton X-100 ..........................................................................................118
Figure 4.16 Calcein release curves of 100 µM 90% QMe-DOPE/10% DOPC and 100 µM 80% QMe-DOPE/20% DOPC by chemical reduction using 5 eq. of sodium dithionite. (↑) the time for addition of sodium dithionite solution into the 90% QMe-DOPE/10% DOPC liposome solution. (↑) the time for addition of sodium dithionite solution into the 80% QMe-DOPE/20% DOPC liposome solution. (●) time at which 90% QMe-DOPE/10% DOPC and 80% QMe-DOPE/20% DOPC liposomes were lysed with the addition of 15 µL of 30% (v/v) Triton X-100 .......................................................................119
Figure 4.17 UV-vis absorbance spectrum of 70% QMe-DOPE/30% CHO liposomes in pH 7.1 0.1 M PB/0.1 M KCl at room temperature. λmax = 264.9 nm corresponds to the QMe headgroup and λmax = 497 nm corresponds to the encapsulated calcein................................................................................................120
Figure 4.18 Calcein release curves of 100 µM 70% QMe-DOPE/30% CHO by chemical reduction using 5 eq. of sodium dithionite. The arrows (↑ and ↑) depict the time for addition of sodium dithionite solution into the 70% QMe-DOPE/30% CHO liposome solution for each trial. (●) time at which 70% QMe-DOPE/30% CHO liposomes were lysed with the addition of 15 µL of 30% (v/v) Triton X-100 ................................................................................121
Figure 4.19 Instability of 100 µM 70% QMe-DOPE/30% CHO liposomes in the presence of 0.007% BSA. (↑) the time for addition of liposome solution into the 0.007% BSA solution. (●) time at which 70% QMe-DOPE/30% CHO liposomes were lysed with the addition of 15 µL of 30% (v/v) Triton X-100 ......................................................................................................................122
Figure 4.20 Instability of 100 µM 70% QMe-DOPE/30% CHO liposomes in the presence of 0.5 µM hNQO1. (↑) the addition time for 300 µL of 5 µM hNQO1 solution into liposome solution. (●) time at wich 70% QMe-

xiii
DOPE/30% CHO liposomes were lysed with the addition of 15 µL of 30% (v/v) Triton X-100...................................................................................................122
Figure 4.21 UV-vis spectra for hNQO1 assay (A) and hNQO1 inhibition assay (B). A) QMe-COOH and NADH (blue line) and QMe-COOH and NADH and hNQO1 after 1 min (pink line). B) QMe-COOH and NADH (blue line) and QMe-COOH and NADH and hNQO1 after 30 min (pink line), after 1 hour (green line) and after 4 hours (cyan line) .......................................................123
Figure 4.22 Instability of 100 µM 100% QMe-DOPE liposomes in the presence of 0.25 µM hNQO1 (red line) and 0.25 µM inhibited hNQO1 (blue line). (↑) the addition time for 300 µL of 2.5 µM hNQO1 or inhibited hNQO1 solution into liposome solution. (●) time at which 100% QMe-DOPE liposomes were lysed with the addition of 15 µL of 30% (v/v) Triton X-100 ........................124
Figure 4.23 Instability of 100 µM 100% QMe-DOPE liposomes in the presence of 0.25 µM hNQO1 (red line) and 0.25 µM hNQO2 (blue line). (↑) the addition time for 300 µL of 2.5 µM hNQO1 or hNQO2 solution into liposome solution. (●) time at which 100% QMe-DOPE liposomes were lysed with the addition of 15 µL of 30% (v/v) Triton X-100 ...................................................125
Figure 4.24 Stability of 100 µM 100% QMe-DOPE liposomes in the presence of 0.25 µM heat inactivated hNQO1. (↑) the addition time for 300 µL of 2.5 µM heat inactivated hNQO1 solution into liposome solution. (●) time at which 100% QMe-DOPE liposomes were lysed with the addition of 15 µL of 30% (v/v) Triton X-100 ......................................................................................125

xiv
LIST OF SCHEMES
Scheme 2.1 Reduction of 1,4-benzoquinone to 1,4-hydroquinone .............................................54
Scheme 2.2 Cyclization process of trimethyl-lock propionic acid 1,4-benzoquinones ...............55
Scheme 3.1 Reduction and cyclization process on quinone propionic acid triggers (QPA) .......................................................................................................................73
Scheme 3.2 Hydride transfer mechanism on all possible atom sites on QPAs ...........................83
Scheme 4.1 Proposed enzyme-responsive liposome system ......................................................101

xv
LIST OF ABBREVIATIONS AND SYMBOLS AAO Amino acid oxidases
AELs Anticancer ether lipids
AO Aldehyde oxidase
AQ4N 1,4-bis [2-(dimethylamino-N-oxide) ethyl] amino-5,8-
dihydroxyanthracene-9,10-dione
ARH019 3-hydroxymethyl-5-(2-methylaziridin-1-yl)-1-methyl-2-phenylindole-4,7-
dione
AZQ 2,5-bis(carboethoxyamino)-3,6-diazirdinyl-1,4-benzoquinone
β-lap β-lapachone
BSA Bovine serum albumin
CHO Cholesterol
CPR Cytochrome P450 reductase
CSD Cambridge Structural Database
CV Cyclic voltammetry
CYPs Cytochrome P450s
DAG Diacylglycerol
DLS Dynamic light scattering
DMXAA 5,6-dimethylxanthenone-4-acetic acid
DOPC 1,2-dioleoyl-sn-glycero-3-phosphocholine
DOPE 1,2-dioleoyl-sn-glycero-3-phosphoethanolamine
DPPC 1,2-dihexadecanoyl-sn-glycero-3-phosphocholine
DPPIsCho 1,2-dihexadec-1’-enyl-sn-glycero-3-phosphocholine

xvi
DPPC/DPPE-PEG2000 1,2-dihexadecanoyl-sn-glycero-3-phosphocholine/1,2-dihexadecanoyl-sn-
glycero-3-phosphoethanolamine-N-[methoxy(polyethylene glycol)-2000]
DTIC Dacarbazine
ECM Extracellular matrix
EPR Enhanced permeability and retention
EO9 3-hydroxy-5-aziridinyl-1-methyl-2(1H-indole-4,7-indione)-propenol
ES936 5-methoxy-1,2-dimethyl-3-[(4-nitrophenoxy)methyl]indole-4,7-dione
FAA flavone-8-acetic acid
FAD Flavin adenine dinucleotide
FADH2 Reduced flavin adenine dinucleotide
FMN Flavin mononucleotide
GDEPT Gene directed enzyme prodrug therapy
IUdR 5-Iodo-2'-deoxyuridine
MeDZQ 2,5-diaziridinyl-3,6-dimethyl-1,4-benzoquinone
MeO-suc-AAPV N-methoxy-succinyl-Ala-Ala-Pro-Val
MMC Mitomycin C
MME Methylester of melphalan
MPPs Matrix metalloproteinases
MMP–2 Gelatinase A
MMP–9 Gelatinase B
N-Ac-4-S-CAP N-acetyl-4-S-cysteaminylphenol
NADH Reduced nicotinamide adenine dinucleotide
NADPH Reduced nicotinamide adenine dinucleotide phosphate
NQO NAD(P)H:quinone oxidoreductase
hNQO1 Human NAD(P)H:quinone oxidoreductase type-1
xvii
hNQO2 Human NAD(P)H:quinone oxidoreductase type-2
mNQO1 Mouse NAD(P)H:quinone oxidoreductase type-1
rNQO1 Rat NAD(P)H:quinone oxidoreductase type-1
rhNQO1 Recombinant human NAD(P)H:quinone oxidoreductase type-1
NQO3 Bacteria NAD(P)H:quinone oxidoreductase
NQO4 Fungi NAD(P)H:quinone oxidoreductase
NQO5 Archaebacteria NAD(P)H:quinone oxidoreductase
PB Phosphate buffer
PC Phosphatidylcholine
PC-PLC Phospholipase C
PE Phosphatidylethanolamine
PEG Poly(ethylene glycol)
PEG2000-DOPE 1,2-dioleoyl-sn-glycero-3-phosphoethanolamine-N-
[methoxy(polyethyleneglycol)-2000]
PLA2 Phospholipase A2
PLA2-I PLA2 secretory pancreatic type
PLA2-II PLA2 non-pancreatic
cPLA2 PLA2 cytosolic
i PLA2 PLA2 cytosolic independent of Ca2+
POPC 1-palmitoyl-2-oleoy-sn-glycero-3-phosphocholine
proAELs AELs prodrugs
PS Phosphatidylserine
QPAs Quinone propionic acid triggers
Q-DOPE Quinone attached to a DOPE lipid
QMe-DOPE Methyl-substituted Q-DOPE

xviii
Q-liposomes Quinone-based liposomes
RH1 2,5-diaziridinyl-3-(hydroxymethyl)-6-methyl-1,4-benzoquinone
RMSD Root mean square deviation
SeCys selenocysteine
SHE Standard hydrogen electrode
SN Streptonigrin
S-ProAEL thio-ester anticancer ether lipid
SU5416 Melphalan semaxanib
TPZ Tirapazamine
VDEPT Virus directed enzyme prodrug therapy
Na2S2O4 Sodium dithionite
1,2-di-O-SPC 1,2-O-octadecyl-sn-glycero-3-phosphocholine
4-S-CAP 4-S-Cysteaminylphenol
5-FU 5-fluorouracil
17AG 17-amino-17-demethoxygeldanamycin
17-AAG 17-Allylamino-17-demethoxygeldanamycin
17-DMAG 17-demthoxy-17-[[2-(dimethylamino)ethyl]amino]-geldanamycin
ɛ Molar extinction coefficient
ip,a Anode current peak
ip,c Cathode current peak
ΔEp Distance between cathode peak and anode peak
E1/2 Half-wave potential
E°' Formal potential
Ep,c Cathodic reduction peak
Ep,a Anodic oxidation peak

xix
λex Excitation wavelength
λem Emission wavelength
Tm Temperature at which lipids undergo phase transition from gel to liquid
Km Michaelis constant
Vmax Maximum velocity
kcat Catalytic constant
kcat/Km Enzyme efficiency

xx
ABSTRACT
For decades, there has been a lot of focus on the development of new carriers for drug
delivery applications. From all of the carriers, stimuli-responsive liposomes have been studied
extensively, but only a handful have been enzyme-responsive liposomes. Therefore, the field of
endogenous proteins as activators of liposomes is a fertile field worthy of exploration.
The research described in this dissertation involves how structural changes on the
quinone moiety altered their electronic properties, as well as their behavior toward the human
enzyme NAD(P)H:quinone oxidoreductase type-1 (hNQO1, over expressed in certain tumor
tissues), thus yielding a series of triggerable quinones to be used in the formation of enzyme-
activated liposomes. The step-wise process to achieve the ultimate research objective includes:
(1) measurement by cyclic voltammetry of–the electronic properties of naked, propionic acid
quinones and those attached to an ethanolamine handle, (2) detailed kinetics (Michaelis constant
(Km), maximum velocity (Vmax), catalytic constant (kcat), enzyme efficiency (kcat/Km)) and
computational docking studies for a series of quinone derivatives against hNQO1, and (3)
preparation of quinone-based liposomes and evaluation in the presence of the different
components included in an hNQO1 assay.
Structural alterations on the quinone ring had an effect on their reduction behavior.
Electrochemical studies exposed a trend in reduction potential; quinones with electron-
withdrawing groups were easy to be reduced and the opposite happens to quinones with electron-
donating groups. Enzyme and docking studies showed the different quinone responses obtained
from the interaction of hNQO1 with structural-altered quinones. Liposome experiments
provided all the obstacles that need to be overcome when designing an enzyme-responsive
liposome system. The inclusion of 1,2-dioleoyl-sn-glycero-3-phosphocholine (DOPC) or
cholesterol decreased the leakage of contents from the liposome systems. Gathering all this

xxi
information provided me a strong background on the fundamentals of structure-reactivity
relationships between quinones and hNQO1 and their importance toward the design of a
triggerable drug delivery system.

1
CHAPTER 1
INTRODUCTION
1.1 Research Goals and Aims
The goal of the research presented in this dissertation is the characterization of quinone
trigger groups that are to be used to further develop enzyme-responsive liposomes. In particular,
liposomes activated by human NAD(P)H:quinone oxidoreductase type-1 (hNQO1), an
over-expressed enzyme in certain solid tumors (e.g. non-small cell lung, colon and pancreas
tumors),1-5 are targeted because they are expected to selectively deliver to the desired site more
drug units per carrier than will a prodrug system.
The challenge of producing a prodrug or drug delivery system that actively releases its
contents at the desired site but maintains its integrity in the bloodstream for long periods of time
has been a continuing issue for researchers around the world over the past 30 years. Liposomes
have been able to address one of those issues as a result of the addition of lipids possessing
poly(ethylene glycol) chains (PEG) that have led to increased liposome circulation times in the
body.6 PEGylated liposomes are able to circulate in the bloodstream for sufficient periods of
times that they are able to accumulate at tumor sites via the enhanced permeability and retention
(EPR) effect.7,8 Nevertheless, while drug-loaded PEGylated liposomes are in the circulatory
system, non-specific interactions still occur, resulting in drug leakage from liposomes, an event
that impacts healthy cells. Also, due to the slow nature of drug delivery at the target site, high
concentration of liposomes is required, causing side effects, such as mucositis and hand-foot
syndrome.9 In today’s market, there are 11 approved liposomal formulations and 6 more
currently in clinical development;10 however, none of those 17 liposomal formulations deliver
their contents as a result of enzyme triggering. Therefore, the use of endogenous enzymes as an
active stimulus for liposome contents release is a fertile field worthy of exploration.

2
Currently, extensive literature for enzyme-activated prodrugs is available;11 this
information has been an important contribution in the design of enzyme-responsive liposomes.
However, the design and formulation of enzyme-responsive liposomes is still in the early stages.
Only a few research groups have explored endogenous enzymes (e.g. elastase, alkaline
phosphatase, phospholipase C, phospholipase A2 (PLA2) and matrix metalloproteinases
(MMPs)) as trigger stimuli for liposome contents release.9,12,13
The design of a liposome with triggerable groups that can be activated by an enzyme will
allow for selective and site-specific controlled delivery of the liposomal contents. This scenario
results in a lower frequency of drug administration and minimizes systemic side effects. The
McCarley research group developed a redox-responsive liposome that contains a quinone head
group and a fusogenic lipid, 1,2-dioleoyl-sn-glycero-3-phosphoethanolamine (DOPE).14 It was
demonstrated that the liposomes are able to be opened and then release their contents as a result
of a two-electron/two-proton chemical reduction, but their contents release has yet to be explored
by a reductive enzyme.15 Among the different reductive enzymes used as stimuli for prodrug
activation,16,17 NQO1 is an enzyme that specifically reduces quinones to hydroquinones by a
two-electron/two-proton process.18 NQO1 has also been studied for bioreductive activation of
anticancer drugs19 and prodrugs16,17 but to date has been investigated as a trigger for liposome
contents release.
Figure 1.1. Illustration of quinone derivatives investigated in this dissertation.
The first aim of this research was the electrochemical characterization of a series of
quinone derivatives: naked quinones (no propionic acid side chain), quinones containing a

3
propionic acid side chain, and quinones containing a trimethyl-lock motif (R3 = Y = methyl),
Figure 1.1. All quinones used underwent a two-electron/two-proton reduction process in
aqueous media, and their electronic properties were measured by cyclic voltammetry (CV).
Cyclic voltammetry is an electrochemical technique that provides information regarding the
reduction potential and cyclization kinetics of the quinone derivatives. The main advantage of
tuning the reduction potential of quinones is that these compounds can undergo reduction in a
particular environment such as where a high concentration of NQO1 is available but remain
inactive in healthy cells. It is crucial for the stability of quinone-based liposomes that their
quinone derivatives have a reduction potential that can only be reduced by human NQO1, thus
avoiding any non-specific reduction by other reducing species present inside the human body.
Furthermore, the reduction/cyclization process resulting from quinone derivatives possessing the
trimethyl-lock system is also believed to be dependent on the electronic properties of the
quinones.
The second aim of this research was the characterization of quinone derivatives by
enzyme assays and docking studies using the human enzyme NQO1. Enzyme kinetic assays
gathered information on how structural changes of the quinone moiety affected the interaction
between recombinant human NQO1 (rhNQO1) and the quinone derivatives. This information
was based on the kinetic parameters Km (Michaelis constant), Vmax (maximum velocity), kcat
(catalytic constant), and kcat/Km (enzyme efficiency) extracted from the rhNQO1 assays. In
addition, molecular docking studies were used to determine the possible interaction and optimum
orientations between quinone derivatives and human NQO1.
The ultimate goal was the preparation of quinone-based liposome systems and
observations of their behavior under rhNQO1 assay conditions. A variety of quinone-based
liposome systems were prepared following a modified version of the well-known “lipid thin-film
and extrusion” method.20,21 The stability of the quinone-liposome systems in the presence of

4
bovine serum albumin (BSA), reduced nicotinamide adenine dinucleotide (NADH) and rhNQO1
were investigated by fluorescence spectroscopy. As a probe, the self-quenching dye calcein was
loaded into the liposome systems at concentrations where the dye is non-fluorescent. Liposome
leakage caused by the introduction of BSA, NADH, or rhNQO1 to the liposome solution will
result in the dilution of calcein and consequently a fluorescent signal is observed. In addition,
chemical release curves for the new liposome formulations were investigated using the reducing
agent sodium dithionite (Na2S2O4). Calcein-loaded liposome formulations were characterized
with UV-vis spectroscopy, dynamic light scattering (DLS) and zeta potential.
From the results in this work, there is a clear understanding of the structure-activity
relationship of quinone derivatives with recombinant human NQO1 and the interaction between
rhNQO1 assay contents and quinone-based liposome systems. These nanosizes structures are a
promising tool as triggered release carriers because they hold potential for selectively unload
their contents in a controlled manner at the desired site.
1.2 Prodrugs Activated by Endogenous Oxidoreductase Enzymes Other Than NQO1
Conventional chemotherapeutic drugs have been limited in their use due to low
therapeutic index, and poor selectivity for tumor cells.11 One of the most promising technologies
to overcome this issue is the use of prodrugs where nontoxic drugs are carried and activated at
the specific tumor site by over-expressed enzymes. Numerous tumor-associated enzymes have
been exploited for prodrug activation in the field of gene- and virus-directed enzyme prodrug
therapy (GDEPT, VDEPT), but effectiveness has been limited by insufficient transduction of
tumor cells in vivo.11,22 Endogenous enzymes such as transferases, phosphorylases, kinases,
hydrolases and oxidoreductases have also been investigated as a strategy to achieve local
activation of prodrugs.11 In the section that follows, the characteristics, localization and prodrug
developments towards human oxidoreductases (except NQO1 that will be detailed reviewed in
the last section) will be discussed.

5
1.2.1 Aldehyde Oxidase
Aldehyde oxidase (AO) is a homodimeric enzyme with a molecular mass of 300 kDa
containing 1338 amino acids.23-25 Its structure contains flavin adenine dinucleotide (FAD),
molybdenum, and heme-iron groups.11,23,25 This cytosolic protein is present in high levels in
human liver, lung, adrenal, testis and prostate tissue; however, little is known about the
difference in the concentration levels of AO between normal and tumor tissues.26 AO oxidizes
aldehydes to the corresponding acids using molecular oxygen, and it catalyzes the oxidation of
pyrroles, pyridines, purines, pterins, and pyrimidines.11
AO has been used in an attempt to increase organ selectivity of 5-ethynyluracil, a
compound that prevents the rapid breakdown of 5-fluorouracil (5-FU), a well-known anticancer
agent. Porter and co-workers assayed the 5-ethynyl-2(1H)-pyrimidinone as a potential liver-
specific prodrug; however, their results showed lack of liver selectivity.27 Later, Guo et al.
synthesized a 5-fluoro-2-pyrimidinone prodrug to increase organ selectivity towards the liver.
Even though the authors succeeded in their task, this prodrug had similar cytostatic activity as
the conventional drug 5-FU.28 AO has also been explored as an enzyme to increase the
bioavailability of drugs. In this matter, a prodrug of the radiosensitizer 5-iodo-2'-deoxyuridine
(IUdR) was developed; it exhibited promising results and is currently under phase I clinical
trials.29-31 Few attempts have been made to target AO as an enzyme that activates prodrugs, due
to the wide distribution of this enzyme in humans.27 Moreover, AO differs greatly in substrate
specificity between species, and what may be promising in animal models is not always
successful in humans.11
1.2.2 Amino Acid Oxidases
Amino acid oxidases (AAO) are dimeric flavoproteins that contain FAD as a prosthetic
group, and they stereoselectively catalyze the oxidative deamination (loss of an amine group) of
amino acids to the corresponding α-keto acids, ammonia and hydrogen peroxide, as noted in

6
Figure 1.2.11,32-34 These enzymes also catalyze the β-elimination reactions of β-chloroalanine, β-
cyanoalanine, and selenocysteine Se-conjugates (SeCys conjugates) that result in the production
of chloride, cyanide, and selenols, along with the formation of pyruvate and ammonia.11
Figure 1.2. Mechanism of action of D-amino acid oxidase. Adapted from Pollegioni (2007).32
LAAO (catalyzes the oxidative deamination of L-amino acids) has a molecular mass between 85
and 150 kDa, while the molecular mas range of DAAO (catalyzes the oxidative deamination of
D-amino acids) is between 38 and 125 kDa.11 High levels of AAO have been found in human
tissues such as those of the kidney and liver, while low levels of AAO were found in brain
tissue.33
SeCys conjugates have been the most studied approach in the targeting of AAO.11
Several Se-conjugates have been shown to possess chemopreventive and antitumor
properties.34,35 So far, investigations on the β-elimination mechanism of Se-conjugates have
been done with rat renal cytosol, rat and human kidney cytosol but targeting β-lyse enzymes.36,37
Later, Rooseboom et. al. demonstrated the activation of Se-conjugates by purified LAAO from
Crotalus adamanteous and by DAAO from porcine kidney.38 The activation of Se-conjugates is
stereoselective, thus, it needs to be taken into account when designing a prodrug to activate
DAAO or LAAO.
1.2.3 NADPH-Cytochrome P450 Reductase
Cytochrome P450 reductase (CPR) is a NADPH-ferrihemoprotein that catalyzes the
reduction of cytochrome P450s, as well as the reduction of aldehydes (to form alcohols) and

7
quinones (to form semiquinone free radicals).11 Human CPR is localized in the endoplasmic
reticulum and has a molecular mass of approximately 82 kDa that includes 676 amino acids.39,40
CPR is a multidomain protein divided into a hydrophobic N-terminal domain, a flavin
mononucleotide-binding (FMN) domain, and a FAD/NADPH binding domain (flavin adenine
dinucleotide/nicotinamide adenine dinucleotide phosphate).41,42 The mechanism of this enzyme
consists of accepting a pair of electrons from NADPH as a hydride ion, with FAD and FMN
being the points of entry and exit, respectively. Then, these electrons are transferred to
cytochrome P450s, or to aldehydes or quinones.43 High levels of CPR were found in liver, lung,
and small intestine based on immunohistochemical staining of human tissues.44 CPR was also
found in a variety of tumor cells, such as lung, breast, and liver.45 However, only liver tumor
cells were shown to have a significant increase in activity (2-fold) of CPR versus normal
tissue.46,47 Moreover, in general, CPR activity is lower in tumor tissue than in the corresponding
normal tissue.48
CPR has been explored as a target for prodrug activation under hypoxic conditions (low
oxygen levels) where the one-electron reduction of substrates by CPR generates toxic free
radicals that cause cell damage. Studies on Chinese hamster ovary cells demonstrate CPR is the
major enzyme that activates mitomycin C (MMC) and its analog porfiromycin under hypoxic
conditions.49,50 In those studies, the hamster ovary cells where transfected with human CPR and
compared with the parental cells. The authors found that porfiromycin exhibited greater
cytotoxicity under hypoxic conditions than under aerobic conditions, while MMC had the same
toxicity regardless of the oxygenation state.49,50 RH1 (2,5-diaziridinyl-3-(hydroxymethyl)-6-
methyl-1,4-benzoquinone) prodrug was also demonstrated to be reduced by CPR of pig liver
origin.51 However, studies in human cancer cell lines (T47D human breast cancer cells and
T47D-P450 transfected with P450 Red gene) did not demonstrate any significant increase in

8
cytotoxicity after treatment with RH1.52 Therefore, human CPR does not appear to have a
substantial contribution in the activation of RH1.
To date, the major focus on CPR-targeted prodrugs has been the bioreductive agent
tirapazamine (TPZ). In the late 1980s, it was demonstrated that TPZ could be activated by CPR
leading to DNA cleavage, as noted in Figure 1.3.11,17,53 Several in vitro investigations led to
promising clinical trials; however, those results did not translate into in vivo success. It is
believed poor drug penetration through the extravascular tumor was the key factor in affecting in
vivo activity.11,17,53
Figure 1.3. Reductive activation of TPZ. Adapted from Chen (2009).17
1.2.4 Cytochrome P450s
Cytochrome P450s (CYPs) consist of a family of several isoenzymes containing a heme
prosthetic group that catalyzes the monooxygenation of a variety of substrates (from small
molecules to large antibiotics) by incorporating one atom of molecular oxygen into a substrate
and reducing the other oxygen atom to water.11 CYPs accept electrons from either the enzyme
CPR or from NADPH and use them in its catalytic cycle.11 Human CYPs encoded by 57 genes
are divided into families based on their homology in amino acid sequence identity.54 The most
important human isoenzymes are CYP1A1/2, 2C9/19, 2D6, 2E1 and 3A4.11 Based on the three-
dimensional structure availability, Johnson and Stout compared the structure of CYP2A6, 2C8,
2C9, and 3A4.55 The investigation revealed that 3A4 and 2A6 share less than 40% amino acid
CPR

9
identity, whereas the active site of 2A6 is one-sixth the volume of that for 3A4. The authors also
reported that 3A4 and 2C8 active sites are similar in size but different in shape, while the active
site of 2C9 is larger than 2A6, but smaller than 2C8. The difference in active site architecture
and chemical properties of the amino acids involved are probably the reasons why for all the
CYPs, CYP3A4 contributes to over 60% of the metabolism of drugs reported to date.54
Human CYPs are located in the endoplasmic reticulum, mainly in liver and adrenal gland
tissues; however, low concentrations of CYPs were also found in kidney and testis tissues.56
CYPs in general have lower levels in tumor tissues than in normal tissue,11 yet higher levels of
the enzyme isoforms CYP1A and CYP3A were found in tumors versus their corresponding
normal tissues.56
Most CYPs chemotherapeutic agents were not initially designed as prodrugs to target
CYPs; however, later investigations demonstrated that they could be activated by CYPs.11 That
was the case for the example of 4-ipomeanol (1-(3-furyl)-4-hydroxy-1-pentanone) which is
metabolized by CYP1A2, 3A3, and 3A4. Although bioactivation was demonstrated, 4-
ipomeanol failed in clinical trials towards lung cancer.11 Another example is Tegafur, a prodrug
of 5-FU (anticancer drug) that was initially thought to be activated by thymidine phosphorylase
and CYPs, but later it was demonstrated that Tegafur was mainly activated by CYPs.11
Investigations revealed that the isoenzymes responsible for its activation are CYP1A2, 2A6, and
2C8/9.57,58 Dacarbazine (DTIC) is another CYP-activated prodrug used in the treatment of
malignant melanoma and Hodgkin’s lymphoma.59 It has been demonstrated that isoforms
CYP1A1, 1A2, and 2E1 account for the activation of DTIC.11 However, in spite of the
successful antitumor effect in rodents, an insufficient amount of antitumor activity was exhibited
in humans.11
To date, the major prodrug compounds activated by CYPs are oxazaphosphorines and
1,4-bis [2-(dimethylamino-N-oxide) ethyl] amino-5,8-dihydroxyanthracene-9,10-dione

10
(AQ4N).11 Oxazaphosphorines, in particular cyclophosphamide, is the most used alkylating
agent with widespread application in cancer therapy. This prodrug and its isomer are activated
by the isoforms CYP2B6 and 3A4. Cyclophosphamide, along with its isomer ifosfamide,
presented issues because of the high concentration of CYPs in liver and low levels in tumor
cells.11 Those obstacles were overcome by gene-directed enzyme prodrug therapy (GDEPT).60
AQ4N is converted into a potent topoisomerase II inhibitor after bioreduction by CYPs
(in particular the isoform 3A4) to AQ4, Figure 1.4.11 AQ4 is also a high-affinity DNA-binding
agent where its tertiary amine side chains ensure good uptake of the compound into the cells.17
AQ4 is currently in phase-2 clinical trials for brain tumor, chronic lymphocytic leukemia, and
non-Hodgkin’s lymphoma.17
Figure 1.4. Reductive activation of AQ4N. Adapted from Chen (2009).17
The major drawbacks on targeting CYPs are their high concentration levels in liver and
adrenal glands, their low turnover rates resulting in generally slow drug formation, and their low
activity in tumors cells compared with normal cells. However, several prodrugs activated by
CYPs are successfully used in the clinic.11
1.2.5 Tyrosinase
Tyrosinase is a copper enzyme (two copper ions per enzyme molecule) that catalyzes the
oxidation of L-tyrosine to the corresponding o-quinone dopaquinone as well as the oxidation of
phenols and catechols to o-diphenols and o-quinones, respectively.11,61 This enzyme was found
to have an approximate molecular mass of 67 kDa by SDS electrophoresis.61 The X-ray

11
structure of human tyrosinase has not yet been determined; however, the three-dimensional
structure from Streptomyces castaneoglobisporus (gram-positive bacteria) has been solved, and
it has been useful to describe in detail the tyrosinase catalytic mechanism, Figure 1.5.62 The
authors proposed that first a peroxide ion is bridged to copper ions following a proton extraction
from the phenolic hydroxyl to later have the deprotonated oxygen atom bound to copper. At this
point, copper is hexa-coordinated and an ortho-carbon of the substrate is approached by the
peroxide ion which adds one of the peroxide oxygens to the ortho-carbon of monophenol.
Figure 1.5. Catalytic mechanism of tyrosinase. Adapted from Matoba (2006).62
Tyrosinase is responsible for skin pigmentation abnormalities and has the very peculiar
property that it is only located in melanoma cells, making this enzyme a very attractive target for
treatment of the cancer, melanoma.63 The first prodrug dependent on tyrosinase activity was 2,4-
dihydroxyphenylalanine.64 This prodrug showed good selectivity towards tyrosinase-containing
cells versus tyrosinase-lacking cells. In spite of these findings, the potential of 2,4-
dihydroxyphenylalanine as a prodrug was not further evaluated.11 4-S-Cysteaminylphenol (4-S-
CAP) and N-acetyl-4-S-cysteaminylphenol (N-Ac-4-S-CAP) are other two prodrugs that showed
tyrosine-mediated cytotoxicity.11 Later, analogs of N-Ac-4-S-CAP were synthesized and
presented activities comparable to that of cisplatin, a well-known chemotherapy drug.65 Phenyl-

12
and urea- mustard prodrugs were also synthesized and assayed for tyrosinase activity.66,67 The
authors found a positive correlation between prodrug toxicity and tyrosinase activity. More
recently, the stability of these prodrugs in the presence of phosphate buffer and bovine serum
were evaluated;68 the authors identified the urea prodrugs as the lead compounds for further
studies.
1.3 Enzyme-Activated Liposomes
Currently marketed drug delivery systems based on liposomes and polymeric materials
rely on passive diffusion or slow non-specific degradation of the liposomal carrier.9 To improve
therapeutic efficiency, scientists have been putting their effort in designing carriers for active
targeting (e.g. ligands on carrier surface) and active triggering (e.g. hyperthermia) to safely
deliver carrier cargo to and at the desired site.9 These systems are composed of nanosize
particles, ranging from liposomes to macromolecular dendrimers.6,13,69-71 It is not the intent of
this dissertation to focus on each of these systems, but rather the few ones so far published that
correspond to enzyme-responsive liposomes. The activation of liposomes by the endogenous
enzymes elastase, alkaline phosphatase, phospholipase C, phospholipase A2 and
metalloproteinase, and their characteristics will be discussed below.
1.3.1 Elastase
Elastase is an enzyme released from the azurophil granules (cytoplasmic small particles
in white blood cells) of activated neutrophils (50–70% of all white blood cells). Human
neutrophil elastase has an approximate molecular mass of 30 kDa that includes 218 amino acids
with two asparagine-linked carbohydrate side chains and four disulfide bonds.72 This enzyme
became of particular interest in the activation of liposomes because it is ubiquitously present in
inflammatory (e.g. rheumatoid arthritis,73,74 acute respiratory distress syndrome,75 emphysema,76
cystic fibrosis77,78) and tumor (e.g. breast,79 skin80) tissues. Elastase has been used to activate
enzyme-triggered liposomes where DOPE is capped with a short peptide sequence (e.g. N-Ac-

13
ala-ala) that is a substrate for the enzyme, Figure 1.6; stable non-fusogenic liposomes can be
formed from N-Ac-ala-ala-DOPE.81 The stable peptide-DOPE liposome system became unstable
upon cleavage of the peptide by elastase, resulting in liposome fusion with cells.
Figure 1.6. Cleavage of peptide-DOPE structure by elastase. Adapted from Pak (1998).81
This liposome system was further improved by attachment of a different peptide named
N-methoxy-succinyl-ala-ala-pro-val (MeO-suc-AAPV) to the DOPE lipid that exhibited greater
sensitivity and selectivity towards elastase than the previous peptide N-Ac-ala-ala. MeO-suc-
AAPV-DOPE liposomes (250 μM) were proved to be activated by 0.42 μM elastase, an amount
that is between 3 and 20 fold less than the amount found in cystic fibrosis tissue, with subsequent
transfer of their aqueous content probes into adherent cells.82 The authors also observed that
heat-inactivated elastase (95 °C for 1h) did not activate the MeO-suc-AAPV-DOPE liposomes.
Other potential elastase substrates have been designed and are currently under development.12
1.3.2 Alkaline Phosphatase
Alkaline phosphatase is a non-specific phosphomonoesterase enzyme that is present in
serum and on the cell membrane, as well as over-expressed in certain tumor tissues (e.g.
testicular and ovarian).83,84 Its structure is the one of a dimeric metalloprotein with two Zn2+ ions
and a Mg2+ ion in each active site.85 The earlier demonstration on the ability of alkaline

14
phosphatase to activate prodrugs86 and remove the phosphate group from a polysaccharide,87
suggested the application of the enzyme to activate liposomes composed of phospholipid
derivatives. Szoka and co-workers have been the only ones that took advantage of those results
to design an alkaline phosphatase-sensitive liposome system composed of DOPE lipid and
cholesterol phosphate derivatives.88 They found that the liposome with the most sensitive
behavior towards the enzyme exhibited a leakage of encapsulated fluorophore of 40% in 24
hours, while no leakage was observed in the presence of heat-inactivated enzyme.88 The nature
of the enzyme after being inactivated by heat could not be established because of the lack in
information about the time and temperature at what the procedure was performed. The wide
distribution of this enzyme in the body limited its use, unless the enzyme is directed to activate
conjugated prodrugs (e.g. antibody).11
1.3.3 Phospholipase C
Phospholipase C (PC-PLC) is an enzyme found in human gallbladder bile.89,90 High
levels of PC-PLC have been found in rheumatoid arthritis tissues as well as in epithelial ovarian
cancer cells and breast tumor cells.91-93 The molecular mass of PC-PLC found in human
monocytic U937 cell lines was 40kDa as determined by SDS gel electrophoresis.91 Later, a
study on natural killer cells (NK cells) demonstrated the presence and subcellular localization of
two PC-PLC isoforms with molecular masses of 40 and 66 kDa, respectively.94 PC-PLC
requires the presence of calcium ion as cofactor for its catalytic function for the hydrolysis of the
phosphoester bond of lecithin to yield the amphiphile diacylglycerol (DAG) and the headgroup
phosphocholine.95-97
This enzyme was the first catalytic agent to induce fusion of liposomes, an investigation
done by Nieva and co-workers in the late 1980s.95 The same investigation demonstrated that
bilayer composition is critical. Phosphatidylethanolamine (PE) and cholesterol are essential, in
addition to phosphatidylcholine (PC), for significant liposome fusion to occur at low levels of

15
phospholipase C.95 In addition, it was later found that PC-PLC becomes inhibited by DAG, the
end product, when DAG concentration is over 20 mol% in the liposome bilayer.96 Contrary to
the observation of Nieva, pure lecithin liposomes underwent aggregation and fusion with
concomitant leakage of vesicle contents in the presence of PC-PLC, as reported by Luk.98
However, in the fusion process described by Nieva, no leakage was observed.95 In summary,
PC–PLC-induced liposome fusion may be considered to happen in three steps: generation of
DAG in the bilayer, aggregation of liposomes, and fusion of apposed membranes.96
1.3.4 Phospholipase A2 (PLA2)
Phospholipase A2 (PLA2) and metalloproteinases have been the two enzymes most
widely studied for liposome activation;13 the latter will be discussed in the next section. PLA2 is
an enzyme present in a wide variety of mammalian cells,99,100 and it hydrolyzes
phosphoglycerides–such as phosphatidylcholine (PC), phosphatidylethanolamine (PE), and
phosphatidylserine (PS)–at the acyl ester bond at the sn-2 position, yielding the corresponding
lysophospholipid and fatty acid, as described in Figure 1.7.101
Figure 1.7. Mode of action of PLA2 versus other phospholipases. AA = arachidonic acid. Adapted from Kaiser (1999).101
16:0
P–CHOLINE
PHOSPHATIDYL CHOLINE
AA HO
16:0
P–CHOLINE
+ AAP–CHOLINE
OH
AA16:0 +
AA
16:0
CHOLINEAA
16:0
O-P
P–CHOLINE16:0
OH
AA
PHOSPHOLIPASE A2PHOSPHOLIPASE A1
PHOSPHOLIPASE DPHOSPHOLIPASE C

16
Mammalian PLA2 is composed of three distinct isozymes: group I (PLA2-I), group II
(PLA2-II), and cytosolic PLA2 (cPLA2).102 Group I is the secretory pancreatic type, with a
molecular mass of approximately 14 kDa, and it requires millimolar amounts of Ca2+ for
activation.101 The complete sequence of PLA2-I consists of a single polypeptide chain of 125
amino acids with seven cross-linked disulfide bridges.103 Group II is the non-pancreatic PLA2
that can be further subdivided into secretory enzymes and membrane-associated enzymes.102
PLA2-II has the same molecular mass and requirements of activation as PLA2-I. The major
difference is the absence of cysteine residues at position 11 and 77, along with the corresponding
disulfide bridge in PLA2-II. In spite of these differences, their respective active sites and
hydrophobic regions are similar.101 Cytosolic PLA2 enzymes have a molecular mass of
approximately 80 kDa, with some being Ca2+ dependent (c PLA2) enzymes and others are Ca2+
independent (i PLA2) enzymes.101 An 85 kDa cPLA2 was purified from human monocytic cell
line (U937) and sequenced.104 This cPLA2 consisted of 749 amino acids and had no apparent
disulfide bonds, in contrast to the PLA2 enzymes found in Group I and II.104 PLA2 has been a
target for cancer therapy because of its over expression in various types of cancer, such as
pancreatic, breast, lung, stomach, and prostate; PLA2-II is found in elevated concentrations in all
types of cancer.9,101,105 In addition, high amounts of PLA2-II in blood have been associated with
systemic bacterial infections and malaria.101 Furthermore, it has been reported that elevated
serum levels of PLA2-II has been found in effusions from 47 patients with various cancers.102
It has been essential to gain knowledge about the physical properties of liposomes (e.g.
charge) and how that affects the substrate specificity towards PLA2 for the rational design of a
degradable drug delivery system. It was reported in the early 1990s that pig PLA2 had a slight
preference for anionic phospholipids (2–3 fold).106 This preference was confirmed later by
various investigations on the interaction of PLA2-II and anionic membranes.107-111 Those
investigations reported that the specificity of the enzyme for anionic membranes is a result of the

17
electrostatic nature of the active site of PLA2-II that is high in cationic residues that provides
non-specific electrostatic interactions that in turn promote surface binding. This specificity
prevents PLA2-II from interacting with unperturbed mammalian cells that are composed mostly
of neutral lipids such as sphingomyelin, phosphatidylcholines, and cholesterol.110
PLA2 has a fascinating feature of preference for aggregated lipid substrates, such as
liposomes over lipid monomers.9 Thus, the design of liposomes with appropriate lipid
composition will maximize PLA2-II activity.112 In addition, it has been proved that the addition
of PEG modified lipids into the liposomal formulation did not preclude PLA2 from binding to
the liposome surface. On the contrary, PEG-lipid addition enhanced PLA2 activity due to the
anionic headgroup of the PEG-lipid.112-114
So far, the literature has presented two liposome designs: one is composed of different
lipids and the other is formed by prodrug-lipid conjugates. Thompson and co-workers designed
a cascade liposomal system that utilizes liposome photooxidation and contents release to activate
PLA2.115 This method employs a mixture of two liposomes, one composed of a photosensitive
synthetic lipid, namely 1,2-dihexadec-1’-enyl-sn-glycero-3-phosphocholine (DPPIsCho) in
conjunction with Ca2+, and the other composed of 1,2-dihexadecanoyl-sn-glycero-3-
phosphocholine (DPPC) with the DPPC liposome containing the encapsulated fluorophore
calcein. Upon light irradiation at 800 nm, the photosensitive liposome released Ca2+ ions thereby
promoting PLA2 activation which lead to a 50% calcein release in 40 min. A few years later,
Davidsen et al. developed an experimental model using liposomes composed of 1,2-
dihexadecanoyl-sn-glycero-3-phosphocholine/1,2-dihexadecanoyl-sn-glycero-3-
phosphoethanolamine-N-[methoxy(poly(ethylene glycol))-2000], (DPPC/DPPE-PEG2000); these
were activated by PLA2 that caused destabilization of a second type of liposome inert to PLA2
activity (mimicking stability of a target cell).116 Specifically, the generation of lysolipids and
fatty acids by PLA2 from a DPPC/DPPE-PEG2000 liposome caused cargo leakage from the inert

18
liposomes 1,2-O-octadecyl-sn-glycero-3-phosphocholine (1,2-di-O-SPC) that were in close
proximity to the DPPC/DPPE-PEG2000 liposomes.
Anticancer ether lipids (AELs) are a class of drugs that inhibit tumor cell growth without
causing mutagenic or myelosuppressive effects.9 However, the use of AELs was limited by
severe hemolysis.9 In order to circumvent this issue, Andresen and co-workers synthesized AEL
prodrugs (proAELs) to be included into a liposomal formulation sensitive to PLA2.117,118
ProAEL liposomes successfully delivered the AELs into tumor cells showing no hemolytic
toxicity.117-119 Very recently, Andresen et al. reported the synthesis of retinoid phospholipid
prodrugs and proved that those pro-lipids can form liposomes sensitive to PLA2. The ProAEL
structures and their mechanism of release are represented in Figure 1.8. In addition to the work
made by the Andresen group, Linderoth and co-workers reported the synthesis of a thio-ester
anticancer ether lipid (S-ProAEL) and subsequent liposome formulations that were also sensitive
to the enzyme PLA2.120
Figure 1.8. ProAELs structures and mechanism of AELs release in the presence of PLA2. Adapted from Andresen (2005).9 1.3.5 Matrix Metalloproteinase (MMP)
Matrix metalloproteinases (MPPs) are zinc-dependent endopeptidases (they break peptide
bonds of nonterminal amino acids) that together can degrade all components of the extracellular
matrix (ECM).121 There are 21 members of the MMP family located in the membrane, as well as
in the extracellular environment.121 Most of the MMPs secreted by cells are inactive zymogens

19
(or proenzyme, inactive enzyme precursors) that require proteolytical activation by tissue or
plasma proteinases, bacterial proteinases or others MMPs.121 From the 21 MMPs known, MMP–
2 (Gelatinase A) and MMP–9 (Gelatinase B) have been exploited for prodrug and liposome
activation, because high levels of these enzymes are present in a variety of tumor cells, such as
bladder, colorectal, gastric, lung, and ovarian with all of these causing poor prognosis and
survival rate.121 MMP–2 has a molecular mass of 72 kDa in the inactive form and 62 kDa in the
active form, while MMP–9 has a molecular mass of 92 kDa in the inactive form and 82 kDa in
the active form.122 X-ray structures for both proenzymes have been reported.123,124 The
structures of MMP–2 and MMP–9 are very similar; they both have two zinc ions in the catalytic
site and three calcium ions in different parts of the enzyme.123,124 They also share the same
number of domains consisting of the N-terminal propeptide domain (where the enzyme is
activated), the catalytic domain (S1' pocket), the C-terminal domain and an additional three-
tandem fibronectin type II (FnII) domain (4 versus 3 in the other MMPs).124 The major
differences between MMP–2 and MMP–9 rely on the side chain of Arg424 in MMP–9 that is
angled slightly away from the S1' pocket when compared with the corresponding residue in
MMP–2 (Thr424) and on the position of the second FnII domain.124
The mode of action of the MMPs is cleavage of the peptide sequence, acetyl-L-prolyl-L-
leucyl-glycyl-L-leucine (Ac-Pro-Leu-Gly-Leu), at the Gly-Leu bond.125 Thus, prodrugs
derivatized with that peptide should be substrates for MMP–2 and MMP–9, as envisioned by
Kline and co-workers, who synthesized four peptides and four peptidomimetic compounds.
From the 8 molecules synthesized, only two peptides were substrates for the enzymes, with one
having higher cleavage rates for MMP–9.125 Likewise, Chau et al. synthesized dextran-peptide-
methotrexate conjugates for drug delivery in tumors that expressed MMP–2 and MMP–9. Pro-
Val-Gly-Leu-Ile-Gly was the optimal peptide linker between the fully neutralized dextran and

20
the methotrexate drug.126 This new peptide prodrug exhibited a bimolecular rate constant
(kcat/Km) of 1.21 × 10⁵ M–1 s–1 for MMP–2 and 3.60 × 10³ M–1 s–1 for MMP–9.
Prodrug activation by MMPs gave the precedent for the design of triggerable liposomes
capable of releasing their contents via MMP activation. Triple helical collagen-mimetic peptides
conjugated to stearic acid (lipopeptides), along with 1,2-distearoyl-sn-glycero-3-phosphocholine
(DSPC), were used to form the first liposomal formulation to be activated by MMP-9 which
causes bilayer destabilization and release of liposomal contents.127 In a later paper, the authors
showed the mechanistic studies of liposomal formulations composed of three different
lipopeptides integrated with 1-palmitoyl-2-oleoy-sn-glycero-3-phosphocholine (POPC), 1,2-
dioleoyl-sn-glycero-3-phosphocholine (DOPC) or DSPC lipids.128 Those studies concluded that
the rate and extent of leakage was dependent on MMP–9 concentration, and that upon MMP–9
activation, release of contents occurs due to lipid mismatch between the lipopeptide and the other
lipids present in the liposome. Moreover, they proved that the lipopeptide liposomes did not
release their contents in the presence of trypsin, even though the individual peptide is a substrate
of the enzyme.129 Recently, the same research group reported the release profile of liposome-
encapsulated carboxyfluorescein in the presence of cancer cells.130 They observed a 40% release
in the presence of MCF7 cells (high levels of MMP–9) in 30 min versus a 10% release when
liposomes where incubated with HT-29 cells (low levels of MMP–9) in the same amount of time.
In addition to the release mechanisms mentioned above, a different research group
investigated the interactions between PEG-peptide-DOPE-liposomes and MMP–2.131 They
found that MMP–2 hydrolyzed the peptide between PEG and DOPE. This indicates that the
inclusion of PEG in the liposomal system to increase circulation time in vivo did not prevent
MMP–2 from accessing the peptide substrate.

21
1.4 NAD(P)H:Quinone Oxidoreductase Type-1 (NQO1)
Prodrug activation by oxidoreductase enzymes other than NQO1, as well as enzyme-
responsive liposomes, were discussed previously. This section will review NQO1
characteristics, as well as the different approaches to target NQO1 for cancer treatment.
1.4.1 Origin, Types, Structure, Mechanism, Location and Over Expression
NAD(P)H:quinone oxidoreductase Type-1 (NQO1, DT-diaphorase, EC 1.6.99.2) was
accidentally discovered in 1955 and 1956 by Drs. Lars Ernster and Franco Navazio.132,133 The
first published report (1958) of NQO1 described the enzyme as a soluble diaphorase found in
animal tissue.134 The term DT-diaphorase came later in order to differentiate NQO1 from other
diaphorases specific to NADH135 or NADPH.18 DT-diaphorase (NQO1) has the ability to accept
electrons from the cofactors NADH (initially called DPNH) and NADPH (initially called
TPNH).136 Today, DT-diaphorase officially corresponds to NQO Type 1 (NQO1).137 NQO has
five genetic loci: NQO1 and NQO2 correspond to the human genes, as well as other mammals;
NQO3 belongs to eubacteria; NQO4 belongs to fungi; and NQO5 belongs to archaebacteria.137
NQO1 is a homodimeric flavoprotein of 62 kDa containing 273 amino acids; each of the
monomers has a non-covalently but tightly-attached FAD prosthetic group that remains bound
during the catalytic cycle.138,139 The amino acid sequences and crystal structures of rat,138
mouse139 and human139 NQO1s have been determined and are an important tool in identifying
the similarities and differences among them.
In 1995, Li and co-workers reported the crystal structure of rat NQO1 (rNQO1)
complexes with duroquinone and cibacron blue (2.1 Å resolution), where each subunit was
shown to contain two separate domains: a major, catalytic domain (residues 1-220) folded in a
predominantly α/β structure, and a small, C-terminal domain (residues 221-273).138 The
isoalloxazine moiety of the FAD interacts with different enzyme residues; the major interactions
are those with aromatic residues Tyr104, Trp105, Phe106 and Leu103.138 The oxygen atoms on

22
the isoalloxazine ring form hydrogen bonds with the –NH of Phe106 and Gly150, whereas the
nitrogen atoms of the isoalloxazine ring form hydrogen bonds with the –NH of Gly149 and
Trp105 as described in Figure 1.9.138 The nicotinamide of NADP+ is stacked on top of the ring
that contains the methyl groups of the isoalloxazine at a distance of approximately 3.4 Å. The
nitrogen atom on the amine attached to the carbonyl group on the NADP+ makes hydrogen bonds
with the –OHs (hydroxyl groups) of Tyr126 and Tyr128.138
Fifteen years later, the crystal structure of human NQO1 (hNQO1) containing only the
FAD prosthetic group (1.7 Å resolution), as well as the crystal structure of mouse NQO1
(mNQO1, 2.8 Å resolution) revealed that most of the FAD-enzyme interactions in human and
mouse NQO1 are highly homologous to those described in the structure of rat NQO1, Figure
1.9.139 The residues' interaction with the cofactor of NQO1 were identified in the
rNQO1/NADP+ structure; however, in human and mouse NQO1s, residues in loop 9 shift their
positions by several Å, thereby closing the cleft. Moreover, Tyr128 retrocedes from the cleft,
resulting in widening of the cleft by 0.5 Å in hNQO1 relative to rNQO1. 139
Figure 1.9. Schematic representation of FAD interactions with rat NQO1 (A) and human NQO1 (B). A) Shows hydrogen bonds of FAD with residues. W means water. B) Shows hydrogen bonds and van der Waals interactions of FAD with hNQO1. Open radiated circles indicate hydrophobic interactions. Hydrogen bonds are represented by dashed green lines; water molecules are shown as blue filled circles. Adapted from Li (1995)138 and Faig (2000).139
Overall, the sequence and structural similarities between hNQO1 and mNQO1 and
hNQO1 and rNQO1 are both 86%, while it is 94% between mNQO1 and rNQO1.139 The 86%
similarity between rat and human NQO1 accounts for a difference of 37 amino acids.140 The
A B

23
major differences involve the replacement of Tyr104 present in the rNQO1 with Gln104 in the
hNQO1 and mNQO1 structures, along with the absence of several water molecules in the
rNQO1.139 Comparison of the X-ray structures of hNQO1 and mNQO1 versus rNQO1 shows
replacement of the bulky aromatic residue (Tyr104) with a smaller aliphatic residue (Gln104)
increases the space in the binding pocket of hNQO1 and mNQO1, thus allowing the
dimethylbenzene ring of the FAD (ring C in Figure 1.9 (B)) to be located 0.5–0.7 Å deeper in the
enzyme cavity.139,140 Those differences are reflected by the ability of NQO1 to activate different
antitumor compounds, such as Mitomycin C and Streptonigrin (both with 5-fold lower rates for
hNQO1 versus rNQO1).141 In addition, Walton et al. have found that rNQO1 and hNQO1
catalyzed the reduction of menadione with a similar Km (1.4–3.1 µM) but the Vmax was 7 to 8-
fold lower for hNQO1.142 The same authors found that rNQO1 readily reduced the antitumor
agent, EO9; however, no activity could be detected with hNQO1.142 Mutation studies replacing
residues in rNQO1 with the human sequence and residues in hNQO1 with the rat sequence have
shown that amino acid 104 (Tyr in rat and Gln in human) accounts for the catalytic differences
between hNQO1 and rNQO1.143 Therefore, it is important to assay quinoid substrates with
human NQO1 and not to rely on the data described for rat NQO1.
The catalytic site has three distinct regions in all types of NQO1: one that binds to FAD,
one that binds to the adenine ribose portion of NAD(P), and one that binds to either the hydride
acceptor (substrate) or the hydride donor (NADH or NADPH).139 The binding pocket where the
substrate and the cofactor bind has an internal wall (Phe106, Gly174, Phe178, Trp105), a floor
(isoalloxazine ring), a roof (Tyr126, Tyr128) and an entrance (Gly149, Gly150, His194,
Pro68).139 The non-occupied substrate binding pocket is 10 Å wide, 9 Å deep and 4 Å high.139
Comparison of the X-ray structure of apo-hNQO1 (no quinone substrate present) with that of the
hNQO1/duroquinone complex shows that duroquinone binds to the enzyme mainly by
hydrophobic interactions, and that the plane of the quinone ring stacks 3.5 Å from the

24
isoalloxazine ring of hNQO1.139 It also revealed that Tyr128 adopts different conformations,
resulting in opening and closing of the binding site.139
NQO1 follows a ping-pong mechanism where the cofactor (NADH or NADPH) binds to
NQO1 and donates a hydride to reduce FAD to FADH2. Then, the cofactor leaves the binding
pocket and a quinone binds to NQO1 and gets reduced to hydroquinone.18 This direct two-
electron reduction of quinones is unique among the reductive enzymes.18,144 In the X-ray
structure of the hNQO1/duroquinone complex, it is shown that the closest distances from the
flavin N5 (hydride donor) to the possible atom acceptors (of the hydride ion) in the quinone are
4.5 Å to oxygen, 4.1 Å to carbon, and 3.55 Å to the other carbon.139 The details of the reduction
of quinone to hydroquinone by the NQO1 mechanism are not fully understood, but it is believed
residues Tyr155 and His161 play an important role in the charge stabilization of NQO1 during
the hydride transfer process.138,145
For the most part, NQO1 is located in the cytosol of cells, but it has also been found in
the nucleus,146 membrane,147 endoplasmic reticulum,148 mitochondria,18,149 and in the
extracellular environment.150 In human tissue, NQO1 has been primarily detected in epithelial
and endothelial cells,3,4,151 and it is over expressed in various solid tumors, such as those of the
liver (20 to 50-fold),1 lung (12 to 18-fold),3,11 pancreas,152 colon (3 to 4-fold)11 and breast (3-
fold).11 For that reason, hNQO1 is a promising target for bioreductive activation of therapeutic
agents.
1.4.2 Inhibitors of Human NQO1
NQO1 is considered a detoxifying enzyme because it prevents superoxide formation by
reducing quinone radicals (before they react with molecular oxygen to form superoxides) to the
less damaging hydroquinone compounds.153,154 Therefore, deactivation of NQO1 will lead to
superoxide accumulation and cell death. Dicoumarol is the best known competitive inhibitor for
NQO1 with respect to the cofactors NADH and NADPH.18 The major problem with the use of

25
dicoumarol is its non-specific nature and ability to inhibit other enzymes besides hNQO1.155,156
In addition, the effective concentration of dicoumarol that is required to inhibit NQO1 depends
on the efficiency of the second substrate based on the NQO1 ping-pong mechanism.155 Few
research groups have been investigating different quinone derivatives as inhibitors of NQO1 to
use them as a possible route for cancer treatment.
The tumor blood-flow inhibitors flavone-8-acetic acid (FAA) and 5,6-
dimethylxanthenone-4-acetic acid (DMXAA) were reported by Phillips as competitive inhibitors
of hNQO1 with respect to NADH.157 DMXAA and FAA presented relatively high Ki values (20
µM and 75 µM); however, therapeutically-achievable levels of DMXAA and FAA would be
sufficient to inhibit hNQO1 activity in vivo (IC50 of 49.6 µM and 110.9 µM).157 It was also
reported that 3.55 mM of FAA exhibited only 6.51% inhibition on cytochrome b5 activity while
DMXAA was found to partially inhibit cytochrome b5 (25% inhibition). The authors also found
that 1.77 mM of FAA partially inhibited cytochrome P450 while 2 mM of DMXAA had only an
8.9% inhibition on the same enzyme.157
Ross and collaborators reported in 2001 a more specific inhibitor (ES936) for hNQO1.158
ES936 is a mechanism-based inhibitor that depends on NADH to deactivate hNQO1.158
Incubation of ES936 (2 µM) with NADH (100 µM) and hNQO1 (2 µg·mL–1) resulted in more
than 99% inhibition of enzyme activity in less than 5 min.158 X-ray, ESI-LC/MS/MS and
MALDI-TOFMS analysis confirmed alkylation on one of the tyrosine residues (Tyr126 or
Tyr128) in the active site of hNQO1.158 Later, ES936 analogs were investigated by Ross and
coworkers as possible inhibitors of hNQO1.159 Growth inhibition activity in MIA PaCa-2 cells
and computational-based molecular docking simulations revealed that ES936 and analog 2 were
the best inhibitors of hNQO1 (~95% inhibition) and they stopped cell growth (IC50 of
approximately 0.63 µM and 0.64 µM).159 Analogs 5, 6, and 7 were found to be good inhibitors
(~90% inhibition) of hNQO1, but they were not effective in stopping cell growth.159

26
In 2006, Bryce et al. identified novel inhibitors of hNQO1 from the National Cancer
Institute (NCI) compound database.160 They applied a virtual screening on thousands of
compounds and narrowed them down to 28 for biological activity testing towards recombinant
human NQO1. From those 28 compounds, only the most potent inhibitor (NSC645827) had an
observed IC50 of 0.7 µM that was comparable with that of dicoumarol (IC50 = 0.45 µM in the
presence of BSA).160 In 2007, the same research group investigated 26 coumarin analogs as
inhibitors of hNQO1 from the NCI database.161 Analogs were assayed in the presence and
absence of BSA, providing information on the effect of nonspecific protein binding. In the case
of dicoumarol, it was found that the IC50 = 0.45 µM in the presence of BSA and IC50 = 0.005
µM in the absence of BSA towards recombinant human NQO1, confirming its non-specific
nature.161 The best inhibitors in the presence of BSA towards recombinant human NQO1
comparable to dicoumarol were compound 2, 22, and 23 having IC50 values of 0.35 µM, 0.65
µM and 0.60 µM, respectively.161 Cell growth inhibition studies on MIA PaCa-2 cell lines in the
presence of dicoumarol, compound 2, 22 and 23 gave IC50 values of 75, 190, 150 and 140 µM,
respectively.161 A few years later in a continued study on coumarin analogs, Bryce and
collaborators investigated 29 dicoumarol analogs (with greater water solubility) as potential
hNQO1 inhibitors.162 From those 29 analogs, several of them had IC50 values comparable or
even better than the IC50 value of dicoumarol towards recombinant human NQO1; however,
none of the analogs were as toxic as dicoumarol when incubated with MIA PaCa-2 or HCT116
cell lines.162 More recently, Bryce and colleagues reported a range of triazoloacridin-6-ones
(structurally related to NSC645827) as novel inhibitors of hNQO1.163 In this work, all of the
fifteen compounds were assayed in the absence of BSA and had an IC50 far from dicoumarol’s
IC50 value of 0.005 µM towards recombinant hNQO1.163
In summary, ES936 and analog 2 have been the only reported mechanism inhibitors of
hNQO1, with IC50 values comparable to that of dicoumarol. In spite of the effort made by

27
research groups to find better inhibitors on structurally similar dicoumarol compounds,
dicoumarol is still the most potent inhibitor of hNQO1. Today, there are a handful of X-ray
structures of hNQO1/inhibitor complexes that has been solved to gain an understanding of the
mechanism of action of the different inhibitors and for the development and identification of
additional potent inhibitors of hNQO1.158,162,164
1.4.3 Bioreductive Drugs Activated by Human NQO1
NQO1 is known to reductively activate anticancer agents, such as mitomycins (MMC),
aziridinyl benzoquinones (AZQ, MeDZQ, RH1), indolequinone EO9, streptonigrin, β-lapachone
and benzoquinone ansamycins.19,43,154,165,166 The mechanism of action of those antitumor agents
depends on the reactivity of the corresponding hydroquinone, Figure 1.10.43
Figure 1.10. Mechanism of action of antitumor agents after bioreductive activation by human NQO1. Adapted from Siegel (2008).43
Mitomycin C (MMC) is one of a series of mitomycin antibiotics isolated in the late
1950s.167 It was found to be effective towards different human tumors,168 but there has been
controversy with respect to hNQO1 activation of MMC. In the presence of air, hNQO1 activates
MMC in a pH-dependent manner;169,170 however, under hypoxic conditions, hNQO1 detoxifies
the drug.165 Despite this controversy, there is agreement that hNQO1 is the enzyme that
activates MMC which in turn results in DNA crosslinking. Experiments with HT-29 (high

28
hNQO1 expression) and BE (deficient hNQO1 expression) cells have shown that cells with high
expression of hNQO1 are about 6-fold more sensitive to MMC.170 However, it has become
evident that superior substrates for hNQO1 exist, and that the response to MMC in vivo cannot
be predicted on the basis of hNQO1 activity.19,171,172
EO9 is an indolequinone antitumor drug developed to undergo bioreductive activation
similar to MMC.43,173 Beall et al. found that EO9 was a good substrate for hNQO1, having a Km
value of 13.6 µM and a kcat value of 778 min–1. They also observed that the reduction rate of
EO9 by hNQO1 was 50% faster than that of MMC at a 50 µM quinone concentration.172
However, EO9 failed to demostrate a significant antitumor response in clinical trials because its
poor pharmacokinetics properties, such as short half-life and poor tissue penetration.17,174,175
Aziridinylbenzoquinones are another class of DNA alkylating quinones. In this series,
MeDZQ was found to have a better response than AZQ toward killing HT-29 human cell (high
hNQO1 expression) with IC50 values of 0.075 and 7.6 µM, respectively.176 The same
compounds were tested later against recombinant hNQO1. It was observed that MeDZQ was an
excellent substrate with a reduction rate of 860 µmol·min–1·µmol–1, while the AZQ reduction
rate was 160 µmol·min–1·µmol–1, both at a 100 µM quinone concentration.141 However,
MeDZQ’s use was limited by its poor solubility.19 A few years later, Ross and coworkers
identified a new azidinybenzoquinone, RH1, as an NQO1-directed antitumor agent.177 RH1 had
an increased solubility versus MeDZQ and was found to be more effective than MeDZQ towards
recombinant human NQO1 at a 50 µM quinone concentration (NADH oxidation rates RH1 =
45.2 µmol·min–1·mg–1 and MeDZQ = 21.6 µmol·min–1·mg–1).177 RH1 toxicity was confirmed
toward high expression NQO1 human cell lines (H460 and HT29), with IC50 values of 0.002 and
0.011 µM, respectively.177 It was also reported that bioreductive activation of RH1 by other
reductive enzymes would be unlikely because high concentrations of RH1 (0.5 µM) will be
required for that to happen, while 0.05 µM of RH1 is already enough to produce 100% DNA

29
cross-linking on human blood mononuclear cells.178 RH1 has also proven to be efficient against
paediatric tumor cell lines.179 Furthermore, RH1 has recently completed Phase I trials in adults
in the United Kingdom and further clinical evaluation is ongoing.179
Streptonigrin (SN) and β-lapachone (β-lap) are examples of redox-cycling quinones.43
Streptonigrin was found to be the best substrate when compared to MeDZQ and EO9 towards
recombinant hNQO1 with a Km value of 35.6 µM and a kcat value of 7,320 min–1 (MeDZQ
values were 33.2 µM and 3940 min–1 and EO9 values were 13.6 µM and 778 min–1).172 The
same study reported SN as the antitumor agent with better selectivity ratios (86-fold more toxic)
when compared with the IC50 of human cell lines H596 (deficient in NQO1) with H460 (high
NQO1 expression).172 In addition, it was reported that SN was much more cytotoxic towards
human colon carcinoma cell line HT-29 with high NQO1 expression than human colon
carcinoma BE (deficient NQO1 activity).180 In the 1960s, clinical use of SN was limited by
myelotoxicity.181,182 β-lap was found to have enhanced cytotoxicity towards breast cancer cells
expressing NQO1 versus deficient NQO1 cell line. It was determined that 4 µM of β-lap was
sufficient to kill over 99% of the cells with high NQO1 content.183 β-lap was also found to be an
efficient cytotoxic compound towards human pancreatic cancer cells (MIA PaCa-2) that over-
express NQO1.184,185
Benzoquinone ansamycin compounds such as geldanamycin, 17-AAG, 17-DMAG, and
17AG have been identified as substrates for hNQO1; these compounds generate a hydroquinone
that inhibits the heat shock protein 90 (HSP90), causing degradation of several important
oncogenic client proteins.43,186 In two independent in vitro studies between the lead
geldanamycin derivative 17-AAG and human cancer cell lines, a positive relationship was
observed between hNQO1 expression level and growth inhibition by 17-AAG.187 Moreover,
Guo and coworkers have reported a detailed study of the reduction of 17-AAG to 17-AAGH2 by
hNQO1 and its 12-fold increase in growth inhibition towards MDA468/NQ16 cells (high

30
hNQO1 content) versus MDA468 cells (deficient hNQO1 content) based on its IC50 values.188 A
year later, Guo and coworkers extended their detailed study to the reduction 17-AAG analogs by
hNQO1 and found that these analogs also presented higher sensitivity towards MDA468/NQ16
cells versus MDA468 cells.189 17-AAG and 17-DMAG (a more water soluble derivative of 17-
AAG) were found to be the most sensitive compounds in the series and are currently in clinical
trials.189
Out of all the bioreductive drugs mentioned above, just a few like RH1 are still in clinical
trials. The structures of the different bioreductive drugs that did not make it out of the clinical
trials have been taken as models to design analogs that could have better response in cancer
treatments.190 In the last 15 years, several research groups have emphasized their work on the
structure–activity relationships between antitumor agents such as indolequinones,191-195
benzoquinone mustards,196,197 benzimidazoles,198 quinolinequinones,199 lavendamycins200 and
human NQO1 with the aim of finding new therapeutic agents. Among the antitumor compounds,
indolequinone analogs received the most attention as a possible prodrug system.16,190 Following
this strategy, Borch et al. examined the delivery of phosphoramide mustards attached to
indolequinones by hNQO1 activation. The authors found that compounds substituted at the 2-
position were excellent substrates for hNQO1 (kcat/Km = (2–5) × 106 M–1·s–1) and potent
inhibitors of cell growth with GI50 (growth inhibition) values in the low micromolar to
nanomolar range.201 To date, none of the analogs developed have been approved for clinical
use.17 In addition, the X-ray structure of three antitumor quinones (ARH019, RH1, EO9)
complexed with human NQO1 were reported to improve the knowledge regarding the interaction
of model compounds and hNQO1.202

31
1.4.4 Prodrugs Presenting the Trimethyl-Lock System Activated by Human NQO1
This section will focus on the quinone moieties, which after being reduced by hNQO1;
release their cytotoxic agents by intramolecular cyclization facilitated by the presence of the
trimethyl-lock system.
Chikhale et al. investigated benzoquinone-prodrugs (TDDS) that can selectively deliver
the anticancer drug methylester of melphalan (MME) based on their electronic nature.203,204 The
authors found that TDDS presenting less negative reduction potential had a higher amount of
TDDS reduced under reductive chemical conditions and the extent of drug-delivery was
proportional to the amount of TDDS reduced.203 In their follow up paper, they reported TDDS
reduction by purified hNQO1 and found that the H-TDDS analog had the fastest rate of
reduction followed by the Br-TDDS analog based on their t1/2 values of 3 min and 15 min,
respectively.204
In 2007, Volpato et al. reported the human NQO1 activation of a benzoquinone prodrug
conjugated to a 4-aminophenyl nitrogen mustard with a Km value of ~ 3 µM and a Vmax value of
~ 12 µmol·min–1·mg–1.205 The authors identified the formation of lactone and 4-aminophenyl
nitrogen mustard using LC/MS after the prodrug was reduced by hNQO1 in a cell free assay. In
addition, chemosensitivities studies show the prodrug is selectively toxic to cells that have
elevated levels of NQO1 (H460) versus cells that are NQO1-deficient (BE) with IC50 values of
36 µM and greater than a 100 µM, respectively.205
More recently, Moody and colleagues reported a benzoquinone prodrug conjugated to an
antiangiogenic agent (SU5416) derivative as a potent inhibitor of the vascular endothelial growth
factor (VEGF).206 The authors proved 100% inhibition of VEGF-stimulated angiogenesis in
HUEVs (human umbilical vein endothelial cells with NQO1 expression) by addition of 10 µM of
two different benzoquinone prodrugs conjugated with SU5416.

32
1.5 References
(1) Cresteil, T.; Jaiswal, A. K., High-Levels of Expression of the Nad(P)H-Quinone Oxidoreductase (Nqo1) Gene in Tumor-Cells Compared to Normal-Cells of the Same Origin. Biochem. Pharmacol. 1991, 42 (5), 1021-1027.
(2) Fitzsimmons, S. A.; Workman, P.; Grever, M.; Paull, K.; Camalier, R.; Lewis, A. D., Reductase Enzyme Expression across the National Cancer Institute Tumor Cell Line Panel: Correlation with Sensitivity to Mitomycin C and E09. J. Natl. Cancer Inst. 1996, 88 (5), 259-269.
(3) Siegel, D.; Franklin, W. A.; Ross, D., Immunohistochemical Detection of Nad(P)H : Quinone Oxidoreductase in Human Lung and Lung Tumors. Clin. Cancer Res. 1998, 4 (9), 2065-2070.
(4) Siegel, D.; Ross, D., Immunodetection of Nad(P)H : Quinone Oxidoreductase 1 (Nqo1) in Human Tissues. Free Radical Biol. Med. 2000, 29 (3-4), 246-253.
(5) Jamieson, D.; Wilson, K.; Pridgeon, S.; Margetts, J. P.; Edmondson, R. J.; Leung, H. Y.; Knox, R.; Boddy, A. V., Nad(P)H : Quinone Oxidoreductase1 and Nrh : Quinone Oxidoreductase 2 Activity and Expression in Bladder and Ovarian Cancer and Lower Nrh : Quinone Oxidoreductase 2 Activity Associated with an Nqo2 Exon 3 Single-Nucleotide Polymorphism. Clin. Cancer Res. 2007, 13 (5), 1584-1590.
(6) Kaasgaard, T.; Andresen, T. L., Liposomal Cancer Therapy: Exploiting Tumor Characteristics. Expert Opin. Drug Deliv. 2010, 7 (2), 225-243.
(7) Maeda, H.; Wu, J.; Sawa, T.; Matsumura, Y.; Hori, K., Tumor Vascular Permeability and the Epr Effect in Macromolecular Therapeutics: A Review. J. Controlled Release 2000, 65 (1-2), 271-284.
(8) Maeda, H., Tumor-Selective Delivery of Macromolecular Drugs Via the Epr Effect: Background and Future Prospects. Bioconjugate Chem. 2010, 21 (5), 797-802.
(9) Andresen, T. L.; Jensen, S. S.; Jorgensen, K., Advanced Strategies in Liposomal Cancer Therapy: Problems and Prospects of Active and Tumor Specific Drug Release. Prog. Lipid Res. 2005, 44 (1), 68-97.
(10) Zhang, L.; Gu, F. X.; Chan, J. M.; Wang, A. Z.; Langer, R. S.; Farokhzad, O. C., Nanoparticles in Medicine: Therapeutic Applications and Developments. Clin. Pharmacol. Ther. 2008, 83 (5), 761-769.

33
(11) Rooseboom, M.; Commandeur, J. N. M.; Vermeulen, N. P. E., Enzyme-Catalyzed Activation of Anticancer Prodrugs. Pharmacol. Rev. 2004, 56 (1), 53-102.
(12) Meers, P., Enzyme-Activated Targeting of Liposomes. Advanced Drug Delivery Reviews 2001, 53 (3), 265-272.
(13) Andresen, T. L.; Thompson, D. H.; Kaasgaard, T., Enzyme-Triggered Nanomedicine: Drug Release Strategies in Cancer Therapy (Invited Review). Mol. Membr. Biol. 2010, 27 (7), 353-363.
(14) Hafez, I. M.; Cullis, P. R., Roles of Lipid Polymorphism in Intracellular Delivery. Advanced Drug Delivery Reviews 2001, 47 (2-3), 139-148.
(15) Ong, W.; Yang, Y. M.; Cruciano, A. C.; McCarley, R. L., Redox-Triggered Contents Release from Liposomes. J. Am. Chem. Soc. 2008, 130 (44), 14739-14744.
(16) Jaffar, M.; Abou-Zeid, N.; Bai, L.; Mrema, I.; Robinson, I.; Tanner, R.; Stratford, I. J., Quinone Bioreductive Prodrugs as Delivery Agents. Curr. Drug Delivery 2004, 1, 345-350.
(17) Chen, Y.; Hu, L. Q., Design of Anticancer Prodrugs for Reductive Activation. Med. Res. Rev. 2009, 29 (1), 29-64.
(18) Ernster, L., Dt-Diaphorase - a Historical Review. Chem. Scripta 1987, 27A, 1-13.
(19) Danson, S.; Ward, T. H.; Butler, J.; Ranson, M., Dt-Diaphorase: A Target for New Anticancer Drugs. Cancer Treatment Reviews 2004, 30 (5), 437-449.
(20) Szoka, F.; Papahadjopoulos, D., Comparative Properties and Methods of Preparation of Lipid Vesicles (Liposomes). Annu. Rev. Biophys. Bio. 1980, 9, 467-508.
(21) Avanti Polar Lipids. http://avantilipids.com/.
(22) de Groot, F. M. H.; Damen, E. W. P.; Scheeren, H. W., Anticancer Prodrugs for Application in Monotherapy: Targeting Hypoxia, Tumor-Associated Enzymes, and Receptors. Curr. Med. Chem. 2001, 8 (9), 1093-1122.
(23) Moriwaki, Y.; Yamamoto, T.; Higashino, K., Distribution and Pathophysiologic Role of Molybdenum-Containing Enzymes. Histol. Histopathol. 1997, 12 (2), 513-524.

34
(24) Alfaro, J. F.; Joswig-Jones, C. A.; Ouyang, W.; Nichols, J.; Crouch, G. J.; Jones, J. P., Purification and Mechanism of Human Aldehyde Oxidase Expressed in Escherichia Coli. Drug Metab. Dispos. 2009, 37 (12), 2393-2398.
(25) Al-Salmy, H. S., Individual Variation in Hepatic Aldehyde Oxidase Activity. Iubmb Life 2001, 51 (4), 249-253.
(26) Moriwaki, Y.; Yamamoto, T.; Takahashi, S.; Tsutsumi, Z.; Hada, T., Widespread Cellular Distribution of Aldehyde Oxidase in Human Tissues Found by Immunohistochemistry Staining. Histol. Histopathol. 2001, 16 (3), 745-753.
(27) Porter, D. J. T.; Harrington, J. A.; Almond, M. R.; Lowen, G. T.; Zimmerman, T. P.; Spector, T., 5-Ethynyl-2(1h)-Pyrimidinone - Aldehyde Oxidase-Activation to 5-Ethynyluracil, a Mechanism-Based Inactivator of Dihydropyrimidine Dehydrogenase. Biochem. Pharmacol. 1994, 47 (7), 1165-1171.
(28) Guo, X.; Lernertung, M.; Chen, H. X.; Chang, C. N.; Zhu, J. L.; Chang, C. P.; Pizzorno, G.; Lin, T. S.; Cheng, Y. C., 5-Fluoro-2-Pyrimidinone, a Liver Aldehyde Oxidase-Activated Prodrug of 5-Fluorouracil. Biochem. Pharmacol. 1995, 49 (8), 1111-1116.
(29) Kinsella, T. J.; Kunugi, K. A.; Vielhuber, K. A.; Mcculloch, W.; Liu, S. H.; Cheng, Y. C., An in-Vivo Comparison of Oral 5-Iodo-2'-Deoxyuridine and 5-Iodo-2-Pyrimidinone-2'-Deoxyribose Toxicity, Pharmacokinetics, and DNA Incorporation in Athymic Mouse-Tissues and the Human Colon-Cancer Xenograft, Hct-116. Cancer Res. 1994, 54 (10), 2695-2700.
(30) Kinsella, T. J.; Kunugi, K. A.; Vielhuber, K. A.; Potter, D. M.; Fitzsimmons, M. E.; Collins, J. M., Preclinical Evaluation of 5-Iodo-2-Pyrimidinone-2 '-Deoxyribose as a Prodrug for 5-Iodo-2 '-Deoxyuridine-Mediated Radiosensitization in Mouse and Human Tissues. Clin. Cancer Res. 1998, 4 (1), 99-109.
(31) Kinsella, T. J.; Schupp, J. E.; Davis, T. W.; Berry, S. E.; Hwang, H. S.; Warren, K.; Balis, F.; Barnett, J.; Sands, H., Preclinical Study of the Systemic Toxicity and Pharmacokinetics of 5-Iodo-2-Deoxypyrimidinone-2 '-Deoxyribose as a Radiosensitizing Prodrug in Two, Non-Rodent Animal Species: Implications for Phase I Study Design. Clin. Cancer Res. 2000, 6 (9), 3670-3679.
(32) Pollegioni, L.; Piubelli, L.; Sacchi, S.; Pilone, M. S.; Molla, G., Physiological Functions of D-Amino Acid Oxidases: From Yeast to Humans. Cell Mol. Life Sci. 2007, 64 (11), 1373-1394.

35
(33) Holme, D. J.; Goldberg, D. M., Development of a Fluorometric Assay for Amino-Acid Oxidase Activity and Its Application to the Study of Human-Tissues. Biochem. Med. 1982, 28 (1), 51-61.
(34) Ip, C., Lessons from Basic Research in Selenium and Cancer Prevention. J. Nutr. 1998, 128 (11), 1845-1854.
(35) Ip, C.; Zhu, Z. J.; Thompson, H. J.; Lisk, D.; Ganther, H. E., Chemoprevention of Mammary Cancer with Se-Allylselenocysteine and Other Selenoamino Acids in the Rat. Anticancer Res. 1999, 19, 2875-2880.
(36) Andreadou, I.; Menge, W. M. P. B.; Commandeur, J. N. M.; Worthington, E. A.; Vermeulen, N. P. E., Synthesis of Novel Se-Substituted Selenocysteine Derivatives as Potential Kidney Selective Prodrugs of Biologically Active Selenol Compounds: Evaluation of Kinetics of Beta-Elimination Reactions in Rat Renal Cytosol. J. Med. Chem. 1996, 39 (10), 2040-2046.
(37) Rooseboom, M.; Vermeulen, N. P. E.; Andreadou, I.; Commandeur, J. N. M., Evaluation of the Kinetics of Beta-Elimination Reactions of Selenocysteine Se-Conjugates in Human Renal Cytosol: Possible Implications for the Use as Kidney Selective Prodrugs. J. Pharmacol. Exp. Ther. 2000, 294 (2), 762-769.
(38) Rooseboom, M.; Vermeulen, N. P. E.; van Hemert, N.; Commandeur, J. N. M., Bioactivation of Chemopreventive Selenocysteine Se-Conjugates and Related Amino Acids by Amino Acid Oxidases Novel Route of Metabolism of Selenoamino Acids. Chem. Res. Toxicol. 2001, 14 (8), 996-1005.
(39) Haniu, M.; Mcmanus, M. E.; Birkett, D. J.; Lee, T. D.; Shively, J. E., Structural and Functional-Analysis of Nadph-Cytochrome-P-450 Reductase from Human-Liver - Complete Sequence of Human Enzyme and Nadph-Binding Sites. Biochemistry 1989, 28 (21), 8639-8645.
(40) Osawa, Y.; Higashiyama, T.; Nakamura, T., Species Specificity of Estrogen Biosynthesis in Pregnancy - Immunochemical Difference of Placental Nadph-Cytochrome C (P-450) Reductase in Human, Baboon and Horse. J. Steroid Biochem. Mol. Biol. 1981, 15, 449-452.
(41) Zhao, Q.; Modi, S.; Smith, G.; Paine, M.; McDonagh, P. D.; Wolf, C. R.; Tew, D.; Lian, L. Y.; Roberts, G. C. K.; Driessen, H. P. C., Crystal Structure of the Fmn-Binding Domain of Human Cytochrome P450 Reductase at 1.93 Angstrom Resolution. Protein Sci. 1999, 8 (2), 298-306.

36
(42) Aigrain, L.; Pompon, D.; Morera, S.; Truan, G., Structure of the Open Conformation of a Functional Chimeric Nadph Cytochrome P450 Reductase. EMBO Reports 2009, 10 (7), 742-747.
(43) Siegel, D.; Reigan, P.; Ross, D., One- and Two-Electron-Mediated Reduction of Quinones: Enzymology and Toxicological Implications. Biotechnology: Pharmaceutical Aspects 2008, 9, 169-197.
(44) Hall, P. D.; Stupans, I.; Burgess, W.; Birkett, D. J.; Mcmanus, M. E., Immunohistochemical Localization of Nadph-Cytochrome-P450 Reductase in Human-Tissues. Carcinogenesis 1989, 10 (3), 521-530.
(45) Yu, L. J.; Matias, J.; Scudiero, D. A.; Hite, K. M.; Monks, A.; Sausville, E. A.; Waxman, D. J., P450 Enzyme Expression Patterns in the Nci Human Tumor Cell Line Panel. Drug Metab. Dispos. 2001, 29 (3), 304-312.
(46) de Cerain, A. L.; Marin, A.; Idoate, M. A.; Tunon, M. T.; Bello, J., Carbonyl Reductase and Nadph Cytochrome P450 Reductase Activities in Human Tumoral Versus Normal Tissues. Eur. J. Cancer 1999, 35 (2), 320-324.
(47) Plewka, D.; Plewka, A.; Nowaczyk, G.; Kaminski, M.; Rutlowski, T.; Ludyga, T.; Ziaja, K., Neoplastic Lesions of the Human Liver in Relation to the Activity of the Cytochrome P-450 Dependent Monooxygenase System. Med. Sci. Monit. 2000, 6 (2), 244-248.
(48) Forkert, P. G.; Lord, J. A.; Parkinson, A., Alterations in Expression of Cyp1a1 and Nadph-Cytochrome P450 Reductase During Lung Tumor Development in Swr/J Mice. Carcinogenesis 1996, 17 (1), 127-132.
(49) Belcourt, M. F.; Hodnick, W. F.; Rockwell, S.; Sartorelli, A. C., Differential Toxicity of Mitomycin C and Porfiromycin to Aerobic and Hypoxic Chinese Hamster Ovary Cells Overexpressing Human Nadph:Cytochrome C (P-450) Reductase. Proc. Natl. Acad. Sci. U. S. A. 1996, 93 (1), 456-460.
(50) Belcourt, M. F.; Hodnick, W. F.; Rockwell, S.; Sartorelli, A. C., Exploring the Mechanistic Aspects of Mitomycin Antibiotic Bioactivation in Chinese Hamster Ovary Cells Overexpressing Nadph : Cytochrome C (P-450) Reductase and Dt-Diaphorase. Adv. Enzyme Regul. 1998, 38, 111-133.
(51) Nemeikaite-Ceniene, A.; Sarlauskas, J.; Anusevicius, Z.; Nivinskas, H.; Cenas, N., Cytotoxicity of Rh1 and Related Aziridinylbenzoquinones: Involvement of Activation by Nad(P)H : Quinone Oxidoreductase (Nqo1) and Oxidative Stress. Arch. Biochem. Biophys. 2003, 416 (1), 110-118.

37
(52) Begleiter, A.; Leith, M. K.; Patel, D.; Hasinoff, B. B., Role of Nadph Cytochrome P450 Reductase in Activation of Rh1. Cancer Chemother. Pharmacol. 2007, 60 (5), 713-723.
(53) McKeown, S. R.; Cowent, R. L.; Williams, K. J., Bioreductive Drugs: From Concept to Clinic. Clin. Oncol. 2007, 19 (6), 427-442.
(54) Cashman, J. R., Some Distinctions between Flavin-Containing and Cytochrome P450 Monooxygenases. Biochem. Biophys. Res. Commun. 2005, 338 (1), 599-604.
(55) Johnson, E. F.; Stout, C. D., Structural Diversity of Human Xenobiotic-Metabolizing Cytochrome P450 Monooxygenases. Biochem. Biophys. Res. Commun. 2005, 338 (1), 331-336.
(56) Patterson, L. H.; McKeown, S. R.; Robson, T.; Gallagher, R.; Raleigh, S. M.; Orr, S., Antitumour Prodrug Development Using Cytochrome P450 (Cyp) Mediated Activation. Anti-Cancer Drug Des. 1999, 14 (6), 473-486.
(57) Komatsu, T.; Yamazaki, H.; Shimada, N.; Nakajima, M.; Yokoi, T., Roles of Cytochromes P450 1a2, 2a6, and 2c8 in 5-Fluorouracil Formation from Tegafur, an Anticancer Prodrug, in Human Liver Microsomes. Drug Metab. Dispos. 2000, 28 (12), 1457-1463.
(58) Ikeda, K.; Yoshisue, K.; Matsushima, E.; Nagayama, S.; Kobayashi, K.; Tyson, C. A.; Chiba, K.; Kawaguchi, Y., Bioactivation of Tegafur to 5-Fluorouracil Is Catalyzed by Cytochrome P-450 2a6 in Human Liver Microsomes in Vitro. Clin. Cancer Res. 2000, 6 (11), 4409-4415.
(59) Kopf, D.; Goretzki, P. E.; Lehnert, H., Clinical Management of Malignant Adrenal Tumors. J. Cancer Res. Clin. Oncol. 2001, 127 (3), 143-155.
(60) Patterson, A. V.; Saunders, M. P.; Greco, O., Prodrugs in Genetic Chemoradiotherapy. Curr. Pharm. Des. 2003, 9 (26), 2131-2154.
(61) Nishioka, K., Particulate Tyrosinase of Human Malignant-Melanoma - Solubilization, Purification Following Trypsin Treatment, and Characterization. Eur. J. Biochem. 1978, 85 (1), 137-146.
(62) Matoba, Y.; Kumagai, T.; Yamamoto, A.; Yoshitsu, H.; Sugiyama, M., Crystallographic Evidence That the Dinuclear Copper Center of Tyrosinase Is Flexible During Catalysis. J. Biol. Chem. 2006, 281 (13), 8981-8990.

38
(63) Pawelek, J.; Korner, A.; Bergstrom, A.; Bologna, J., New Regulators of Melanin Biosynthesis and the Auto-Destruction of Melanoma-Cells. Nature 1980, 286 (5773), 617-619.
(64) Morrison, M. E.; Yagi, M. J.; Cohen, G., Invitro Studies of 2,4-Dihydroxyphenylalanine, a Prodrug Targeted against Malignant-Melanoma Cells. Proc. Natl. Acad. Sci. U. S. A. 1985, 82 (9), 2960-2964.
(65) Lant, N. J.; McKeown, P.; Kelland, L. R.; Rogers, P. M.; Robins, D. J., Synthesis and Antimelanoma Activity of Analogues of N-Acetyl-4-S-Cysteaminylphenol. Anti-Cancer Drug Des. 2000, 15 (4), 295-302.
(66) Jordan, A. M.; Khan, T. H.; Osborn, H. M. I.; Photiou, A.; Riley, P. A., Melanocyte-Directed Enzyme Prodrug Therapy (Mdept): Development of a Targeted Treatment for Malignant Melanoma. Bioorg. Med. Chem. 1999, 7 (9), 1775-1780.
(67) Jordan, A. M.; Khan, T. H.; Malkin, H.; Osborn, H. M. I.; Photiou, A.; Riley, P. A., Melanocyte-Directed Enzyme Prodrug Therapy (Mdept): Development of Second Generation Prodrugs for Targeted Treatment of Malignant Melanoma. Bioorg. Med. Chem. 2001, 9 (6), 1549-1558.
(68) Knaggs, S.; Malkin, H.; Osborn, H. M. I.; Williams, N. A. O.; Yaqoob, P., New Prodrugs Derived from 6-Aminodopamine and 4-Aminophenol as Candidates for Melanocyte-Directed Enzyme Prodrug Therapy (Mdept). Org. Biomol. Chem. 2005, 3 (21), 4002-4010.
(69) Tarahovsky, Y. S., "Smart" Liposomal Nanocontainers in Biology and Medicine. Biochemistry (Moscow) 2010, 75 (7), 811-824.
(70) Danhier, F.; Feron, O.; Preat, V., To Exploit the Tumor Microenvironment: Passive and Active Tumor Targeting of Nanocarriers for Anti-Cancer Drug Delivery. J. Controlled Release 2010, 148 (2), 135-146.
(71) Zhang, H. B.; Wang, G. J.; Yang, H. A., Drug Delivery Systems for Differential Release in Combination Therapy. Expert Opin. Drug Deliv. 2011, 8 (2), 171-190.
(72) Sinha, S.; Watorek, W.; Karr, S.; Giles, J.; Bode, W.; Travis, J., Primary Structure of Human Neutrophil Elastase. Proc. Natl. Acad. Sci. U. S. A. 1987, 84 (8), 2228-2232.
(73) Alhaik, N.; Lewis, D. A.; Struthers, G., Neutral Protease, Collagenase and Elastase Activities in Synovial-Fluids from Arthritic Patients. Agents Actions 1984, 15 (3-4), 436-442.

39
(74) Gysen, P.; Malaise, M.; Gaspar, S.; Franchimont, P., Measurement of Proteoglycans, Elastase, Collagenase and Protein in Synovial-Fluid in Inflammatory and Degenerative Arthropathies. Clin. Rheumatol. 1985, 4 (1), 39-50.
(75) Tate, R. M.; Repine, J. E., Neutrophils and the Adult Respiratory-Distress Syndrome. Am. Rev. Respir. Dis. 1983, 128 (3), 552-559.
(76) Janoff, A., Elastases and Emphysema - Current Assessment of the Protease-Antiprotease Hypothesis. Am. Rev. Respir. Dis. 1985, 132 (2), 417-433.
(77) Suter, S.; Schaad, U. B.; Roux, L.; Nydegger, U. E.; Waldvogel, F. A., Granulocyte Neutral Proteases and Pseudomonas Elastase as Possible Causes of Airway Damage in Patients with Cystic-Fibrosis. J. Infect. Dis. 1984, 149 (4), 523-531.
(78) Birrer, P.; Mcelvaney, N. G.; Rudeberg, A.; Sommer, C. W.; Liechtigallati, S.; Kraemer, R.; Hubbard, R.; Crystal, R. G., Protease-Antiprotease Imbalance in the Lungs of Children with Cystic-Fibrosis. Am J. Resp. Crit. Care 1994, 150 (1), 207-213.
(79) Yamashita, J. I.; Ogawa, M.; Ikei, S.; Omachi, H.; Yamashita, S. I.; Saishoji, T.; Nomura, K.; Sato, H., Production of Immunoreactive Polymorphonuclear Leukocyte Elastase in Human Breast-Cancer Cells - Possible Role of Polymorphonuclear Leukocyte Elastase in the Progression of Human Breast-Cancer. Br. J. Cancer 1994, 69 (1), 72-76.
(80) Starcher, B.; ONeal, P.; Granstein, R. D.; Beissert, S., Inhibition of Neutrophil Elastase Suppresses the Development of Skin Tumors in Hairless Mice. J. Invest. Dermatol. 1996, 107 (2), 159-163.
(81) Pak, C. C.; Ali, S.; Janoff, A. S.; Meers, P., Triggerable Liposomal Fusion by Enzyme Cleavage of a Novel Peptide-Lipid Conjugate. Biochim. Biophys. Acta 1998, 1372 (1), 13-27.
(82) Pak, C. C.; Erukulla, R. K.; Ahl, P. L.; Janoff, A. S.; Meers, P., Elastase Activated Liposomal Delivery to Nucleated Cells. Biochim. Biophys. Acta 1999, 1419 (2), 111-126.
(83) Simopoulos, T. T.; Jencks, W. P., Alkaline-Phosphatase Is an Almost Perfect Enzyme. Biochemistry 1994, 33 (34), 10375-10380.
(84) Millan, J. L.; Fishman, W. H., Biology of Human Alkaline-Phosphatases with Special Reference Ts Cancer. Crit. Rev. Clin. Lab. Sci. 1995, 32 (1), 1-39.

40
(85) Sowadski, J. M.; Handschumacher, M. D.; Murthy, H. M. K.; Foster, B. A.; Wyckoff, H. W., Refined Structure of Alkaline-Phosphatase from Escherichia-Coli at 2.8-a Resolution. J. Mol. Biol. 1985, 186 (2), 417-433.
(86) Deonarain, M. P.; Epenetos, A. A., Targeting Enzymes for Cancer-Therapy - Old Enzymes in New Roles. Br. J. Cancer 1994, 70 (5), 786-794.
(87) Poelstra, K.; Bakker, W. W.; Klok, P. A.; Hardonk, M. J.; Meijer, D. K. F., A Physiologic Function for Alkaline Phosphatase: Endotoxin Detoxification. Lab. Invest. 1997, 76 (3), 319-327.
(88) Davis, S. C.; Szoka, F. C., Cholesterol Phosphate Derivatives: Synthesis and Incorporation into a Phosphatase and Calcium-Sensitive Triggered Release Liposome. Bioconjugate Chem. 1998, 9 (6), 783-792.
(89) Pattinson, N. R., Identification of a Phosphatidylcholine Active Phospholipase-C in Human Gallbladder Bile. Biochem. Biophys. Res. Commun. 1988, 150 (2), 890-896.
(90) Pattinson, N. R.; Willis, K. E., Effect of Phospholipase-C on Cholesterol Solubilization in Model Bile - a Concanavalin-a Binding Nucleation-Promoting Factor from Human Gallbladder Bile. Gastroenterology 1991, 101 (5), 1339-1344.
(91) Clark, M. A.; Shorr, R. G. L.; Bomalski, J. S., Antibodies Prepared to Bacillus-Cereus Phospholipase-C Cross-React with a Phosphatidylcholine Preferring Phospholipase-C in Mammalian-Cells. Biochem. Biophys. Res. Commun. 1986, 140 (1), 114-119.
(92) Spadaro, F.; Ramoni, C.; Mezzanzanica, D.; Miotti, S.; Alberti, P.; Cecchetti, S.; Iorio, E.; Dolo, V.; Canevari, S.; Podo, F., Phosphatidylcholine-Specific Phospholipase C Activation in Epithelial Ovarian Cancer Cells. Cancer Res. 2008, 68 (16), 6541-6549.
(93) Glunde, K.; Jie, C.; Bhujwalla, Z. M., Molecular Causes of the Aberrant Choline Phospholipid Metabolism in Breast Cancer. Cancer Res. 2004, 64 (12), 4270-4276.
(94) Ramoni, C.; Spadaro, F.; Menegon, M.; Podo, F., Cellular Localization and Functional Role of Phosphatidylcholine-Specific Phospholipase C in Nk Cells. J. Immunol. 2001, 167 (5), 2642-2650.
(95) Nieva, J. L.; Goni, F. M.; Alonso, A., Liposome Fusion Catalytically Induced by Phospholipase-C. Biochemistry 1989, 28 (18), 7364-7367.

41
(96) Nieva, J. L.; Goni, F. M.; Alonso, A., Phospholipase C-Promoted Membrane-Fusion - Retroinhibition by the End-Product Diacylglycerol. Biochemistry 1993, 32 (4), 1054-1058.
(97) Goni, F. M.; Alonso, A., Membrane Fusion Induced by Phospholipase C and Sphingomyelinases. Biosci. Rep. 2000, 20 (6), 443-463.
(98) Luk, A. S.; Kaler, E. W.; Lee, S. P., Phospholipase-C-Induced Aggregation and Fusion of Cholesterol Lecithin Small Unilamellar Vesicles. Biochemistry 1993, 32 (27), 6965-6973.
(99) Van den Bosch, H., Intracellular Phospholipases A. Biochim. Biophys. Acta 1980, 604 (2), 191-246.
(100) Takayama, K.; Kudo, I.; Kim, D. K.; Nagata, K.; Nozawa, Y.; Inoue, K., Purification and Characterization of Human Platelet Phospholipase-A2 Which Preferentially Hydrolyzes an Arachidonoyl Residue. FEBS Lett. 1991, 282 (2), 326-330.
(101) Kaiser, E., Phospholipase a(2): Its Usefulness in Laboratory Diagnostics. Crit. Rev. Clin. Lab. Sci. 1999, 36 (2), 65-163.
(102) Abe, T.; Sakamoto, K.; Kamohara, H.; Hirano, Y.; Kuwahara, N.; Ogawa, M., Group Ii Phospholipase A2 Is Increased in Peritoneal and Pleural Effusions in Patients with Various Types of Cancer. Int. J. Cancer 1997, 74 (3), 245-250.
(103) Verheij, H. M.; Westerman, J.; Sternby, B.; Dehaas, G. H., The Complete Primary Structure of Phospholipase-A2 from Human-Pancreas. Biochim. Biophys. Acta 1983, 747 (1-2), 93-99.
(104) Sharp, J. D.; White, D. L.; Chiou, X. G.; Goodson, T.; Gamboa, G. C.; Mcclure, D.; Burgett, S.; Hoskins, J.; Skatrud, P. L.; Sportsman, J. R.; Becker, G. W.; Kang, L. H.; Roberts, E. F.; Kramer, R. M., Molecular-Cloning and Expression of Human Ca2+-Sensitive Cytosolic Phospholipase-A2. J. Biol. Chem. 1991, 266 (23), 14850-14853.
(105) Laye, J. P.; Gill, J. H., Phospholipase a(2) Expression in Tumours: A Target for Therapeutic Intervention? Drug Discov. Today 2003, 8 (15), 710-716.
(106) Ghomashchi, F.; Yu, B. Z.; Berg, O.; Jain, M. K.; Gelb, M. H., Interfacial Catalysis by Phospholipase-A2 - Substrate-Specificity in Vesicles. Biochemistry 1991, 30 (29), 7318-7329.

42
(107) Buckland, A. G.; Wilton, D. C., Anionic Phospholipids, Interfacial Binding and the Regulation of Cell Functions. Biochim. Biophys. Acta 2000, 1483 (2), 199-216.
(108) Canaan, S.; Nielsen, R.; Ghomashchi, F.; Robinson, B. H.; Gelb, M. H., Unusual Mode of Binding of Human Group Iia Secreted Phospholipase a(2) to Anionic Interfaces as Studied by Continuous Wave and Time Domain Electron Paramagnetic Resonance Spectroscopy. J. Biol. Chem. 2002, 277 (34), 30984-30990.
(109) Bezzine, S.; Bollinger, J. G.; Singer, A. G.; Veatch, S. L.; Keller, S. L.; Gelb, M. H., On the Binding Preference of Human Groups Iia and X Phospholipases a(2) for Membranes with Anionic Phospholipids. J. Biol. Chem. 2002, 277 (50), 48523-48534.
(110) Leidy, C.; Linderoth, L.; Andresen, T. L.; Mouritsen, O. G.; Jorgensen, K.; Peters, G. H., Domain-Induced Activation of Human Phospholipase a(2) Type Iia: Local Versus Global Lipid Composition. Biophys. J. 2006, 90 (9), 3165-3175.
(111) Gadd, M. E.; Biltonen, R. L., Characterization of the Interaction of Phospholipase a(2) with Phosphatidylcholine-Phosphatidylglycerol Mixed Lipids. Biochemistry 2000, 39 (32), 9623-9631.
(112) Jorgensen, K.; Davidsen, J.; Mouritsen, O. G., Biophysical Mechanisms of Phospholipase A2 Activation and Their Use in Liposome-Based Drug Delivery. FEBS Lett. 2002, 531 (1), 23-27.
(113) Jorgensen, K.; Vermehren, C.; Mouritsen, O. G., Enhancement of Phospholipase a(2) Catalyzed Degradation of Polymer Grafted Peg-Liposomes: Effects of Lipopolymer-Concentration and Chain-Length. Pharm. Res. 1999, 16 (9), 1491-1493.
(114) Davidsen, J.; Vermehren, C.; Frokjaer, S.; Mouritsen, O. G.; Jorgensen, K., Drug Delivery by Phospholipase a(2) Degradable Liposomes. Int. J. Pharm. 2001, 214 (1-2), 67-69.
(115) Wymer, N. J.; Gerasimov, O. V.; Thompson, D. H., Cascade Liposomal Triggering: Light-Induced Ca2+ Release from Diplasmenylcholine Liposomes Triggers Pla(2)-Catalyzed Hydrolysis and Contents Leakage from Dppc Liposomes. Bioconjugate Chem. 1998, 9 (3), 305-308.
(116) Davidsen, J.; Jorgensen, K.; Andresen, T. L.; Mouritsen, O. G., Secreted Phospholipase a(2) as a New Enzymatic Trigger Mechanism for Localised Liposomal Drug Release and Absorption in Diseased Tissue. Biochim. Biophys. Acta 2003, 1609 (1), 95-101.

43
(117) Andresen, T. L.; Davidsen, J.; Begtrup, M.; Mouritsen, O. G.; Jorgensen, K., Enzymatic Release of Antitumor Ether Lipids by Specific Phospholipase A2 Activation of Liposome-Forming Prodrugs. J. Med. Chem. 2004, 47 (7), 1694-1703.
(118) Jensen, S. S.; Andresen, T. L.; Davidsen, J.; Hoyrup, P.; Shnyder, S. D.; Bibby, M. C.; Gill, J. H.; Jorgensen, K., Secretory Phospholipase a(2) as a Tumor-Specific Trigger for Targeted Delivery of a Novel Class of Liposomal Prodrug Anticancer Etherlipids. Mol. Cancer Ther. 2004, 3 (11), 1451-1458.
(119) Andresen, T. L.; Jensen, S. S.; Kaasgaard, T.; Jorgensen, K., Triggered Activation and Release of Liposomal Prodrugs and Drugs in Cancer Tissue by Secretory Phospholipase A2. Curr. Drug Delivery 2005, 2, 353-362.
(120) Linderoth, L.; Fristrup, P.; Hansen, M.; Melander, F.; Madsen, R.; Andresen, T. L.; Peters, G. H., Mechanistic Study of the Spla(2)-Mediated Hydrolysis of a Thio-Ester Pro Anticancer Ether Lipid. J. Am. Chem. Soc. 2009, 131 (34), 12193-12200.
(121) Vihinen, P.; Kahari, V. M., Matrix Metalloproteinases in Cancer: Prognostic Markers and Therapeutic Targets. Int. J. Cancer 2002, 99 (2), 157-166.
(122) Olson, M. W.; Gervasi, D. C.; Mobashery, S.; Fridman, R., Kinetic Analysis of the Binding of Human Matrix Metalloproteinase-2 and -9 to Tissue Inhibitor of Metalloproteinase (Timp)-1 and Timp-2. J. Biol. Chem. 1997, 272 (47), 29975-29983.
(123) Morgunova, E.; Tuuttila, A.; Bergmann, U.; Isupov, M.; Lindqvist, Y.; Schneider, G.; Tryggvason, K., Structure of Human Pro-Matrix Metalloproteinase-2: Activation Mechanism Revealed. Science 1999, 284 (5420), 1667-1670.
(124) Elkins, P. A.; Ho, Y. S.; Smith, W. W.; Janson, C. A.; D'Alessio, K. J.; McQueney, M. S.; Cummings, M. D.; Romanic, A. M., Structure of the C-Terminally Truncated Human Prommp9, a Gelatin-Binding Matrix Metalloproteinase. Acta Crystallogr D 2002, 58, 1182-1192.
(125) Kline, T.; Torgov, M. Y.; Mendelsohn, B. A.; Cerveny, C. G.; Senter, P. D., Novel Antitumor Prodrugs Designed for Activation by Matrix Metalloproteinases-2 and-9. Mol. Pharmaceut. 2004, 1 (1), 9-22.
(126) Chau, Y.; Tan, F. E.; Langer, R., Synthesis and Characterization of Dextran-Peptide-Methotrexate Conjugates for Tumor Targeting Via Mediation by Matrix Metalloproteinase Ii and Matrix Metalloproteinase Ix. Bioconjugate Chem. 2004, 15 (4), 931-941.

44
(127) Sarkar, N. R.; Rosendahl, T.; Krueger, A. B.; Banerjee, A. L.; Benton, K.; Mallik, S.; Srivastava, D. K., "Uncorking" of Liposomes by Matrix Metalloproteinase-9. Chem. Commun. 2005, (8), 999-1001.
(128) Elegbede, A. I.; Banerjee, J.; Hanson, A. J.; Tobwala, S.; Ganguli, B.; Wang, R. Y.; Lu, X. N.; Srivastava, D. K.; Mallik, S., Mechanistic Studies of the Triggered Release of Liposomal Contents by Matrix Metalloproteinase-9. J. Am. Chem. Soc. 2008, 130 (32), 10633-10642.
(129) Sarkar, N.; Banerjee, J.; Hanson, A. J.; Elegbede, A. I.; Rosendahl, T.; Krueger, A. B.; Banerjee, A. L.; Tobwala, S.; Wang, R. Y.; Lu, X. N.; Mallik, S.; Srivastava, D. K., Matrix Metalloproteinase-Assisted Triggered Release of Liposomal Contents. Bioconjugate Chem. 2008, 19 (1), 57-64.
(130) Banerjee, J.; Hanson, A. J.; Gadam, B.; Elegbede, A. I.; Tobwala, S.; Ganguly, B.; Wagh, A. V.; Muhonen, W. W.; Law, B.; Shabb, J. B.; Srivastava, D. K.; Mallik, S., Release of Liposomal Contents by Cell-Secreted Matrix Metalloproteinase-9. Bioconjugate Chem. 2009, 20 (7), 1332-1339.
(131) Terada, T.; Iwai, M.; Kawakami, S.; Yamashita, F.; Hashida, M., Novel Peg-Matrix Metalloproteinase-2 Cleavable Peptide-Lipid Containing Galactosylated Liposomes for Hepatocellular Carcinoma-Selective Targeting. J. Controlled Release 2006, 111 (3), 333-342.
(132) Ernster, L.; Navazio, F., Studies on Tpn-Linked Oxidations .1. Pathways of Isocitrate Oxidation in Rat Liver Mitochondria. Biochim. Biophys. Acta 1957, 26 (2), 408-415.
(133) Navazio, F.; Ernster, B. B.; Ernster, L., Studies on Tpn-Linked Oxidations .2. The Quantitative Significance of Liver Lactic Dehydrogenase as a Catalyzer of Tpnh-Oxidation. Biochim. Biophys. Acta 1957, 26 (2), 416-421.
(134) Ernster, L.; Navazio, F., Soluble Diaphorase in Animal Tissues. Acta Chem. Scand. 1958, 12 (3), 595-595.
(135) Straub, F. B., Isolation and Properties of a Flavoprotein from Heart Muscle Tissue. Biochem. J. 1939, 33, 787-792.
(136) Ernster, L.; Ljunggren, M.; Danielson, L., Purification and Some Properties of a Highly Dicumarol-Sensitive Liver Diaphorase. Biochem. Biophys. Res. Commun. 1960, 2 (2), 88-92.

45
(137) Vasiliou, V.; Ross, D.; Nebert, D. W., Update of the Nad(P)H:Quinone Oxidoreductase (Nqo) Gene Family. Human Genomics 2006, 2, 329-335.
(138) Li, R.; Bianchet, M. A.; Talalay, P.; Amzel, L. M., The Three-Dimensional Structure of Nad(P)H:Quinone Reductase, a Flavoprotein Involved in Cancer Chemoprotection and Chemotherapy: Mechanism of the Two-Electron Reduction. Proceedings of the National Academy of Science 1995, 92, 8846-8850.
(139) Faig, M.; Bianchet, M. A.; Talalay, P.; Chen, S.; Winski, S.; Ross, D.; Amzel, L. M., Structures of Recombinant Human and Mouse Nad(P)H : Quinone Oxidoreductases: Species Comparison and Structural Changes with Substrate Binding and Release. Proc. Natl. Acad. Sci. U. S. A. 2000, 97 (7), 3177-3182.
(140) Skelly, J. V.; Sanderson, M. R.; Suter, D. A.; Baumann, U.; Read, M. A.; Gregory, D. S. J.; Bennett, M.; Hobbs, S. M.; Neidle, S., Crystal Structure of Human Dt-Diaphorase: A Model for Interaction with the Cytotoxic Prodrug 5-(Aziridin-1-Yl)-2,4-Dinitrobenzamide (Cb1954). J. Med. Chem. 1999, 42 (21), 4325-4330.
(141) Beall, H. D.; Mulcahy, R. T.; Siegel, D.; Traver, R. D.; Gibson, N. W.; Ross, D., Metabolism of Bioreductive Antitumor Compounds by Purified Rat and Human Dt-Diaphorases. Cancer Res. 1994, 54 (12), 3196-3201.
(142) Walton, M. I.; Smith, P. J.; Workman, P., The Role of Nad(P)H - Quinone Reductase (Ec 1.6.99.2, Dt-Diaphorase) in the Reductive Bioactivation of the Novel Indoloquinone Antitumor Agent Eo9. Cancer Communications 1991, 3 (7), 199-206.
(143) Chen, S.; Knox, R.; Wu, K.; Deng, P. S. K.; Zhou, D. J.; Bianchet, M. A.; Amzel, L. M., Molecular Basis of the Catalytic Differences among Dt-Diaphorase of Human, Rat, and Mouse. J. Biol. Chem. 1997, 272 (3), 1437-1439.
(144) Iyanagi, T.; Yamazaki, I., One-Electron-Transfer Reactions in Biochemical Systems .5. Difference in Mechanism of Quinone Reduction by Nadh Dehydrogenase and Nad(P)H Dehydrogenase (Dt-Diaphorase). Biochim. Biophys. Acta 1970, 216 (2), 282-294.
(145) Bianchet, M. A.; Erdemli, S. B.; Amzel, L. M., Structure, Function, and Mechanism of Cytosolic Quinone Reductases. Vitam Horm 2008, 78, 63-84.
(146) Winski, S. L.; Koutalos, Y.; Bentley, D. L.; Ross, D., Subcellular Localization of Nad(P)H : Quinone Oxidoreductase 1 in Human Cancer Cells. Cancer Res. 2002, 62 (5), 1420-1424.

46
(147) Villalba, J. M.; Navarro, F.; Arroyo, A.; Martin, S. F.; Bello, R. I.; de Cabo, R.; Burgess, J. R.; Navas, P., Protective Role of Ubiquinone in Vitamin E and Selenium-Deficient Plasma Membranes. Biofactors 1999, 9 (2-4), 163-170.
(148) Dallner, G.; Orrenius, S.; Bergstrand, A., Isolation and Properties of Rough and Smooth Vesicles from Rat Liver. J. Cell Biol. 1963, 16 (2), 426-430.
(149) Ernster, L., Dt Diaphorase. Methods Enzymol. 1967, 10, 309-317.
(150) Sreerama, L.; Hedge, M. W.; Sladek, N. E., Identification of a Class 3 Aldehyde Dehydrogenase in Human Saliva and Increased Levels of This Enzyme, Glutathione S-Transferases, and Dt-Diaphorase in the Saliva of Subjects Who Continually Ingest Large Quantities of Coffee or Broccoli. Clin. Cancer Res. 1995, 1 (10), 1153-1163.
(151) Siegel, D.; Ryder, J.; Ross, D., Nad(P)H: Quinone Oxidoreductase 1 Expression in Human Bone Marrow Endothelial Cells. Toxicol. Lett. 2001, 125 (1-3), 93-98.
(152) Awadallah, N. S.; Dehn, D.; Shah, R. J.; Nash, S. R.; Chen, Y. K.; Ross, D.; Bentz, J. S.; Shroyer, K. R., Nqo1 Expression in Pancreatic Cancer and Its Potential Use as a Biomarker. Appl. Immunohistochem. Mol. Morphol. 2008, 16 (1), 24-31.
(153) Dinkova-Kostova, L. T.; Talalay, P., Persuasive Evidence That Quinone Reductase Type 1 (Dt Diaphorase) Protects Cells against the Toxicity of Electrophiles and Reactive Forms of Oxygen. Free Radical Biol. Med. 2000, 29 (3-4), 231-240.
(154) Ross, D., Quinone Reductases Multitasking in the Metabolic World. Drug Metab. Rev. 2004, 36 (3-4), 639-654.
(155) Preusch, P. C.; Siegel, D.; Gibson, N. W.; Ross, D., A Note on the Inhibition of Dt-Diaphorase by Dicoumarol. Free Radical Biol. Med. 1991, 11 (1), 77-80.
(156) Ross, D.; Siegel, D.; Beall, H.; Prakash, A. S.; Mulcahy, R. T.; Gibson, N. W., Dt-Diaphorase in Activation and Detoxification of Quinones - Bioreductive Activation of Mitomycin-C. Cancer Metast. Rev. 1993, 12 (2), 83-101.
(157) Phillips, R. M., Inhibition of Dt-Diaphorase (Nad(P)H : Quinone Oxidoreductase, Ec 1.6.99.2) by 5,6-Dimethylxanthenone-4-Acetic Acid (Dmxaa) and Flavone-8-Acetic Acid (Faa): Implications for Bioreductive Drug Development. Biochem. Pharmacol. 1999, 58 (2), 303-310.

47
(158) Winski, S. L.; Faig, M.; Bianchet, M. A.; Siegel, D.; Swann, E.; Fung, K.; Duncan, M. W.; Moody, C. J.; Amzel, L. M.; Ross, D., Characterization of a Mechanism-Based Inhibitor of Nad(P)H: Quinone Oxidoreductase 1 by Biochemical, X-Ray Crystallographic, and Mass Spectrometric Approaches. Biochemistry 2001, 40 (50), 15135-15142.
(159) Reigan, P.; Colucci, M. A.; Siegel, D.; Chilloux, A.; Moody, C. J.; Ross, D., Development of Indolequinone Mechanism-Based Inhibitors of Nad(P)H : Quinone Oxidoreductase 1 (Nqo1): Nqo1 Inhibition and Growth Inhibitory Activity in Human Pancreatic Mia Paca-2 Cancer Cells. Biochemistry 2007, 46 (20), 5941-5950.
(160) Nolan, K. A.; Timson, D. J.; Stratford, I. J.; Bryce, R. A., In Silico Identification and Biochemical Characterization of Novel Inhibitors of Nqo1. Bioorg. Med. Chem. Lett. 2006, 16 (24), 6246-6254.
(161) Nolan, K. A.; Zhao, H.; Faulder, P. F.; Frenkel, A. D.; Timson, D. J.; Siegel, D.; Ross, D.; Burke, T. R.; Stratford, I. J.; Bryce, R. A., Coumarin-Based Inhibitors of Human Nad(P)H : Quinone Oxidoreductase-1. Identification, Structure-Activity, Off-Target Effects and in Vitro Human Pancreatic Cancer Toxicity. J. Med. Chem. 2007, 50 (25), 6316-6325.
(162) Nolan, K. A.; Doncaster, J. R.; Dunstan, M. S.; Scott, K. A.; Frenkel, A. D.; Siegel, D.; Ross, D.; Barnes, J.; Levy, C.; Leys, D.; Whitehead, R. C.; Stratford, I. J.; Bryce, R. A., Synthesis and Biological Evaluation of Coumarin-Based Inhibitors of Nad(P)H: Quinone Oxidoreductase-1 (Nqo1). J. Med. Chem. 2009, 52 (22), 7142-7156.
(163) Nolan, K. A.; Humphries, M. P.; Barnes, J.; Doncaster, J. R.; Caraher, M. C.; Tirelli, N.; Bryce, R. A.; Whitehead, R. C.; Stratford, I. J., Triazoloacridin-6-Ones as Novel Inhibitors of the Quinone Oxidoreductases Nqo1 and Nqo2. Bioorg. Med. Chem. 2010, 18, 696-706.
(164) Asher, G.; Dym, O.; Tsvetkov, P.; Adler, J.; Shaul, Y., The Crystal Structure of Nad(P)H Quinone Oxidoreductase 1 in Complex with Its Potent Inhibitor Dicoumarol. Biochemistry 2006, 45 (20), 6372-6378.
(165) Gutierrez, P. L., The Role of Nad(P)H Oxidoreductase (Dt-Diaphorase) in the Bioactivation of Quinone-Containing Antitumor Agents: A Review. Free Radical Biol. Med. 2000, 29 (3-4), 263-275.
(166) Asche, C., Antitumour Quinones. Mini-Rev. Med. Chem. 2005, 5 (5), 449-467.
(167) Hata, T.; Sano, Y.; Sugawara, R.; Matsumae, A.; Kanamori, K.; Shima, T.; Hoshi, T., Mitomycin, a New Antibiotic from Streptomyces .1. J. Antibiot. 1956, 9 (4), 141-146.

48
(168) Crooke, S. T.; Bradner, W. T., Mitomycin-C - Review. Cancer Treatment Reviews 1976, 3 (3), 121-139.
(169) Pan, S. S.; Akman, S. A.; Forrest, G. L.; Hipsher, C.; Johnson, R., The Role of Nad(P)H - Quinone Oxidoreductase in Mitomycin C-Resistant and Porfiromycin-Resistant Hct 116 Human Colon-Cancer Cells. Cancer Chemother. Pharmacol. 1992, 31 (1), 23-31.
(170) Siegel, D.; Gibson, N. W.; Preusch, P. C.; Ross, D., Metabolism of Mitomycin-C by Dt-Diaphorase - Role in Mitomycin-C-Induced DNA Damage and Cytotoxicity in Human Colon-Carcinoma Cells. Cancer Res. 1990, 50 (23), 7483-7489.
(171) Phillips, R. M.; Burger, A. M.; Loadman, P. M.; Jarrett, C. M.; Swaine, D. J.; Fiebig, H. H., Predicting Tumor Responses to Mitomycin C on the Basis of Dt-Diaphorase Activity or Drug Metabolism by Tumor Homogenates: Implications for Enzyme-Directed Bioreductive Drug Development. Cancer Res. 2000, 60 (22), 6384-6390.
(172) Beall, H. D.; Murphy, A. M.; Siegel, D.; Hargreaves, R. H. J.; Butler, J.; Ross, D., Nicotinamide Adenine-Dinucleotide (Phosphate)Quinone Oxidoreductase (Dt-Diaphorase) as a Target for Bioreductive Antitumor Quinones - Quinone Cytotoxicity and Selectivity in Human Lung and Breast-Cancer Cell-Lines. Mol. Pharmacol. 1995, 48 (3), 499-504.
(173) Oostveen, E. A.; Speckamp, W. N., Mitomycin Analogs .1. Indoloquinones as (Potential) Bisalkylating Agents. Tetrahedron 1987, 43 (1), 255-262.
(174) Dirix, L. Y.; Tonnesen, F.; Cassidy, J.; Epelbaum, R.; Huinink, W. W. T.; Pavlidis, N.; Sorio, R.; Gamucci, T.; Wolff, I.; TeVelde, A.; Lan, J.; Verweij, J., Eo9 Phase Ii Study in Advanced Breast, Gastric, Pancreatic and Colorectal Carcinoma by the Eortc Early Clinical Studies Group. Eur. J. Cancer 1996, 32A (11), 2019-2022.
(175) Pavlidis, N.; Hanauske, A. R.; Gamucci, T.; Smyth, J.; Lehnert, M.; teVelde, A.; Lan, J.; Verweij, J., A Randomized Phase Ii Study with Two Schedules of the Novel Indoloquinone Eo9 in Non-Small-Cell Lung Cancer: A Study of the Eortc Early Clinical Studies Group (Ecsg). Ann Oncol 1996, 7 (5), 529-531.
(176) Gibson, N. W.; Hartley, J. A.; Butler, J.; Siegel, D.; Ross, D., Relationship between Dt-Diaphorase-Mediated Metabolism of a Series of Aziridinylbenzoquinones and DNA Damage and Cytotoxicity. Mol. Pharmacol. 1992, 42 (3), 531-536.
(177) Winski, S. L.; Hargreaves, R. H. J.; Butler, J.; Ross, D., A New Screening System for Nad(P)H : Quinone Oxidoreductase (Nqo1)-Directed Antitumor Quinones: Identification of a New Aziridinylbenzoquinone, Rh1, as a Nqo1-Directed Antitumor Agent. Clin. Cancer Res. 1998, 4 (12), 3083-3088.

49
(178) Yan, C.; Kepa, J. K.; Siegel, D.; Stratford, I. J.; Ross, D., Dissecting the Role of Multiple Reductases in Bioactivation and Cytotoxicity of the Antitumor Agent 2,5-Diaziridinyl-3-(Hydroxymethyl)-6-Methyl-1,4-Benzoquinone (Rh1). Mol. Pharmacol. 2008, 74 (6), 1657-1665.
(179) Hussein, D.; Holt, S. V.; Brookes, K. E.; Klymenko, T.; Adamski, J. K.; Hogg, A.; Estlin, E. J.; Ward, T.; Dive, C.; Makin, G. W. J., Preclinical Efficacy of the Bioreductive Alkylating Agent Rh1 against Paediatric Tumours. Br. J. Cancer 2009, 101 (1), 55-63.
(180) Beall, H. D.; Liu, Y. F.; Siegel, D.; Bolton, E. M.; Gibson, N. W.; Ross, D., Role of Nad(P)H:Quinone Oxidoreductase (Dt-Diaphorase) in Cytotoxicity and Induction of DNA Damage by Streptonigrin. Biochem. Pharmacol. 1996, 51 (5), 645-652.
(181) Hackethal, C.; Burchenal, J. H.; Golbey, R. B.; Tan, C. T. C.; Karnofsky, D. A., Clinical Observations on Effects of Streptonigrin in Patients with Neoplastic Disease. Antibiot. Chemother. 1961, 11 (3), 178-183.
(182) Humphrey, E. W.; Blank, N., Clinical Experience with Streptonigrin. Cancer Chemother. Rep. 1961, (12), 99-103.
(183) Pink, J. J.; Planchon, S. M.; Tagliarino, C.; Varnes, M. E.; Siegel, D.; Boothman, D. A., Nad(P)H : Quinone Oxidoreductase Activity Is the Principal Determinant of Beta-Lapachone Cytotoxicity. J. Biol. Chem. 2000, 275 (8), 5416-5424.
(184) Ough, M.; Lewis, A.; Bey, E. A.; Gao, J. M.; Ritchie, J. M.; Bornmann, W.; Boothman, D. A.; Oberley, L. W.; Cullen, J. J., Efficacy of Beta-Lapachone in Pancreatic Cancer Treatment - Exploiting the Novel, Therapeutic Target Nqo1. Cancer Biol. Ther. 2005, 4 (1), 95-102.
(185) Li, L. S.; Bey, E. A.; Dong, Y.; Meng, J. R.; Patra, B.; Yan, J. S.; Xie, X. J.; Brekken, R. A.; Barnett, C. C.; Bornmann, W. G.; Gao, J. M.; Boothman, D. A., Modulating Endogenous Nqo1 Levels Identifies Key Regulatory Mechanisms of Action of Beta-Lapachone for Pancreatic Cancer Therapy. Clin. Cancer Res. 2011, 17 (2), 275-285.
(186) Workman, P., Overview: Translating Hsp90 Biology into Hsp90 Drugs. Curr. Cancer Drug Targets 2003, 3, 297-300.
(187) Kelland, L. R.; Sharp, S. Y.; Rogers, P. M.; Myers, T. G.; Workman, P., Dt-Diaphorase Expression and Tumor Cell Sensitivity to 17-Allylamino,17-Demethoxygeldanamycin, an Inhibitor of Heat Shock Protein 90. J. Natl. Cancer Inst. 1999, 91 (22), 1940-1949.

50
(188) Guo, W. C.; Reigan, P.; Siegel, D.; Zirrolli, J.; Gustafson, D.; Ross, D., Formation of 17-Allylamino-Demethoxygeldanamycin (17-Aag) Hydroquinone by Nad(P)H : Quinone Oxidoreductase 1: Role of 17-Aag Hydroquinone in Heat Shock Protein 90 Inhibition. Cancer Res. 2005, 65 (21), 10006-10015.
(189) Guo, W. C.; Reigan, P.; Siegel, D.; Zirrolli, J.; Gustafson, D.; Ross, D., The Bioreduction of a Series of Benzoquinone Ansamycins by Nad(P)H : Quinone Oxidoreductase 1 to More Potent Heat Shock Protein 90 Inhibitors, the Hydroquinone Ansamycins. Mol. Pharmacol. 2006, 70 (4), 1194-1203.
(190) Colucci, M. A.; Moody, C. J.; Couch, G. D., Natural and Synthetic Quinones and Their Reduction by the Quinone Reductase Enzyme Nqo1: From Synthetic Organic Chemistry to Compounds with Anticancer Potential. Org. Biomol. Chem. 2008, 6 (4), 637-656.
(191) Phillips, R. M., Bioreductive Activation of a Series of Analogues of 5-Aziridinyl-3-Hydroxymethyl-1-Methyl-2-[1h-Indole-4,7-Dione] Prop-Beta-En-Alpha-Ol (Eo9) by Human Dt-Diaphorase. Biochem. Pharmacol. 1996, 52 (11), 1711-1718.
(192) Beall, H. D.; Winski, S.; Swann, E.; Hudnott, A. R.; Cotterill, A. S.; O'Sullivan, N.; Green, S. J.; Bien, R.; Siegel, D.; Ross, D.; Moody, C. J., Indolequinone Antitumor Agents: Correlation between Quinone Structure, Rate of Metabolism by Recombinant Human Nad(P)H : Quinone Oxidoreductase, and in Vitro Cytotoxicity. J. Med. Chem. 1998, 41 (24), 4755-4766.
(193) Phillips, R. M.; Naylor, M. A.; Jaffar, M.; Doughty, S. W.; Everett, S. A.; Breen, A. G.; Choudry, G. A.; Stratford, I. J., Bioreductive Activation of a Series of Indolequinones by Human Dt-Diaphorase: Structure-Activity Relationships. J. Med. Chem. 1999, 42 (20), 4071-4080.
(194) Swann, E.; Barraja, P.; Oberlander, A. M.; Gardipee, W. T.; Hudnott, A. R.; Beall, H. D.; Moody, C. J., Indolequinone Antitumor Agents: Correlation between Quinone Structure and Rate of Metabolism by Recombinant Human Nad(P)H : Quinone Oxidoreductase. Part 2. J. Med. Chem. 2001, 44 (20), 3311-3319.
(195) Newsome, J. J.; Swann, E.; Hassani, M.; Bray, K. C.; Slawin, A. M. Z.; Beall, H. D.; Moody, C. J., Indolequinone Antitumour Agents: Correlation between Quinone Structure and Rate of Metabolism by Recombinant Human Nad(P)H : Quinone Oxidoreductase. Org. Biomol. Chem. 2007, 5 (10), 1629-1640.
(196) Fourie, J.; Oleschuk, C. J.; Guziec, F.; Guziec, L.; Fiterman, D. J.; Monterrosa, C.; Begleiter, A., The Effect of Functional Groups on Reduction and Activation of Quinone Bioreductive Agents by Dt-Diaphorase. Cancer Chemother. Pharmacol. 2002, 49 (2), 101-110.

51
(197) Begleiter, A.; El-Gabalawy, N.; Lange, L.; Leith, M. K.; Guziec, L. J.; Guziec Jr, F. S., A Model for Nad(P)H:Quinoneoxidoreductase 1 (Nqo1) Targeted Individualized Cancer Chemotherapy. Drug Target Insights 2009, 4, 1-8.
(198) Suleman, A.; Skibo, E. B., A Comprehensive Study of the Active Site Residues of Dt-Diaphorase: Rational Design of Benzimidazolediones as Dt-Diaphorase Substrates. J. Med. Chem. 2002, 45 (6), 1211-1220.
(199) Fryatt, T.; Pettersson, H. I.; Gardipee, W. T.; Bray, K. C.; Green, S. J.; Slawin, A. M. Z.; Beall, H. D.; Moody, C. J., Novel Quinolinequinone Antitumor Agents: Structure-Metabolism Studies with Nad(P)H : Quinone Oxidoreductase (Nqo1). Bioorg. Med. Chem. 2004, 12 (7), 1667-1687.
(200) Hassani, M.; Cai, W.; Koelsch, K. H.; Holley, D. C.; Rose, A. S.; Olang, F.; Lineswala, J. P.; Holloway, W. G.; Gerdes, J. M.; Behforouz, M.; Beall, H. D., Lavendamycin Antitumor Agents: Structure-Based Design, Synthesis, and Nad(P)H : Quinone Oxidoreductase 1 (Nqo1) Model Validation with Molecular Docking and Biological Studies. J. Med. Chem. 2008, 51 (11), 3104-3115.
(201) Hernick, M.; Flader, C.; Borch, R. F., Design, Synthesis, and Biological Evaluation of Indolequinone Phosphoramidate Prodrugs Targeted to Dt-Diaphorase. J. Med. Chem. 2002, 45 (16), 3540-3548.
(202) Faig, M.; Bianchet, M. A.; Winski, S.; Hargreaves, R.; Moody, C. J.; Hudnott, A. R.; Ross, D.; Amzel, L. M., Structure-Based Development of Anticancer Drugs: Complexes of Nad(P)H : Quinone Oxidoreductase 1 with Chemotherapeutic Quinones. Structure 2001, 9 (8), 659-667.
(203) Gharat, L.; Visser, P.; Brummelhuis, M.; Guiles, R.; Chikhale, P., Reductive Activation of Conformationally-Constrained, Anticancer Drug Delivery Systems. Med. Chem. Res. 1998, 8 (7), 444-456.
(204) Weerapreeyakul, N.; Visser, P.; Brummelhuis, M.; Gharat, L.; Chikhale, P. J., Reductive and Bioreductive Activation Is Controlled by Electronic Properties of Substituents in Conformationally-Constrained Anticancer Drug Delivery Systems. Med. Chem. Res. 2000, 10 (3), 149-163.
(205) Volpato, M.; Abou-Zeid, N.; Tanner, R. W.; Glassbrook, L. T.; Taylor, J.; Stratford, I.; Loadman, P.; Jaffar, M.; Phillips, R. M., Chemical Synthesis and Biological Evaluation of a Nad(P)H:Quinone Oxidoreductase-1-Targeted Tripartite Quinone Drug Delivery System. Mol. Cancer Ther. 2007, 6 (12), 3122-3130.

52
(206) Moody, C. J.; Maskell, L.; Blanche, E. A.; Colucci, M. A.; Whatmore, J. L., Synthesis and Evaluation of Prodrugs for Anti-Angiogenic Pyrrolylmethylidenyl Oxindoles. Bioorg. Med. Chem. Lett. 2007, 17 (6), 1575-1578.

53
CHAPTER 2
ELECTROCHEMICAL BEHAVIOR OF QUINONE DERIVATIVES POTENTIALLY USABLE FOR DRUG DELIVERY APPLICATIONS
2.1 Introduction
Quinones are known to be electrochemically active and undergo a two-electron, two-
proton reduction in aqueous media where the pH is below the pKa of the corresponding
hydroquinone1 as presented in Scheme 2.1. Electrochemical techniques, such as cyclic
voltammetry (CV), can provide important thermodynamic as well as kinetic information on
quinone-related compounds.2 The electrochemical properties of quinones can be tuned by subtle
structural changes of the quinone moiety by adding a functional group or a handle, such as a
propionic acid chain; in that way, the electronic properties of these compounds can be affected
and a change in their reduction potential is possible.
The goal of this work is to construct a series of quinone derivatives with various
electronic properties that will be later tested with the human enzyme NAD(P)H:quinone
oxidoreductase type 1 (hNQO1), which is known to reduce quinones to hydroquinones;3-5 thus
these quinones may be used as triggers for endogenous target activation. More explicitly, the
research in the McCarley group focusses on the use of quinone triggers in the formation of
enzyme-responsive liposomes for drug delivery applications. It is known that the half-wave
reduction potential of the flavin adenine dinucleotide (FAD) center of rat NQO1 is –0.159 V vs.
the standard hydrogen electrode (SHE).6 This enzyme follows a ping-pong mechanism using
reduced nicotinamide adenine dinucleotide (NADH) or reduced nicotinamide adenine
dinucleotide phosphate (NADPH) as the electron source. It is also known that the reduction
potentials of NADH/NAD+ and NADPH/NADP+ are –0.310 V and –0.320 V versus SHE,
respectively.7,8

54
To successfully assess the quinones as substrates of hNQO1, it is necessary that their
reduction potential be more positive than –0.159 V, but not so positive that the quinone substrate
is possibly reduced directly by NADH or NADPH, as previously demonstrated in the literature
for simple quinones.8 In addition, it is important to tune the reduction potential of quinone
triggers to prevent non-specific interactions with potential reducing species that are endogenous
in biological environments, such as glutathione (E1/2 = –0.22 V vs. SHE)9 and ascorbate (E1/2 =
0.051 vs. SHE),10 so as to avoid the opening of liposomes at undesired locations. The
thermodynamic parameters of cathodic reduction peak (Ep,c), anodic oxidation peak (Ep,a) and
half-wave potential (E1/2) of quinone derivatives were measured. The half-wave potentials
were calculated using Equation 2.1.
𝐸12
= �∆𝐸p2� + 𝐸p, c Equation 2.1
Moreover, it has been well established in earlier works that quinones possessing a
trimethyl-lock system (R3 = R4 = R5 = CH3) experience an intramolecular cyclization passing
through a tetrahedral intermediate after being reduced to the corresponding hydroquinone and
forming the lactone compound as is depicted in Scheme 2.2.11 Such a reduction/cyclization
process for propionic acid quinones is also thought to be dependent on the reduction potential
(electronic properties) of the corresponding quinone; thus, the rate constant for the disappearance
of hydroquinone was calculated using the peak current ratios (ip,a/ip,c) and their evaluation by the
Nicholson and Shain method.12,13 Therefore, it may be possible to estimate the time for release
of a target, such as a drug to be delivered after reduction occurs on the quinone moiety.
O
O
OH
OH
+ +2 H+ 2 e-
Scheme 2.1. Reduction of 1,4-benzoquinone to 1,4-hydroquinone.

55
Scheme 2.2. Cyclization process of trimethyl-lock propionic acid 1,4-benzoquinones. 2.2 Experimental Section
2.2.1 Materials and Methods
Quinone synthesis was previously described by a colleague in our group.14 Cyclic
voltammetry (CV) experiments were performed with a computer-controlled EG&G PAR model
273 A potentiostat (Princeton, NJ). The electrochemical cell was composed of three electrodes:
a (pretreated) glassy-carbon working electrode (A=0.07 cm2, CH Instruments, Austin, TX), a
homemade 99.9 % platinum counter electrode (d=0.05 cm), and an Ag/AgCl (3.0 M KCl, CH
Instruments) reference electrode. The procedure starts with the polishing of the carbon electrode
on a Buehler microcloth with 1 micron alpha alumina slurry micropolish, followed by
pretreatment of this electrode by applying +1.5 V for 10 minutes while the electrode is immersed
in the buffer solution used for the evaluation of the quinones. Polishing the working electrode
eliminates any species that the electrode may absorb, and pretreatment activates the surface of
the electrode, permitting a reproducible electron transfer at the working electrode surface.15
Scans were conducted at a rate of 0.1 V s–1 at room temperature (22±2 °C) in a degassed 0.1 M
phosphate buffer (PB)/0.1 M KCl (pH=7.1). Each solution was degassed with nitrogen for 10
min before obtaining the voltammogram. Before the quinone was tested, the buffer was scanned
to confirm a clear background with no unexpected peaks present. Each individual quinone was
tested on a different day, with 4 replicates per day. Between replicates, no polishing or cleaning
of the electrodes was performed. Quinone solutions contained 1% ethanol or where sufficiently

56
soluble, solutions were sonicated for 30 min to ensure complete dissolution in the buffer
solution; quinone concentrations ranged from 0.3 to 1 × 10⁻³ M.
2.3 Results and Discussion
2.3.1 Thermodynamic Parameters of Naked Quinones
In Table 2.1 are summarized the thermodynamic results for six naked (not containing
propionic acid) quinones whose voltammograms are presented in Figure 2.1. It can be noted that
all of the naked quinones, except the QBr, deviated from the ideal peak separation (ΔEp) of 30
mV that corresponds to a total two proton/two electron reversible system.16 Instead, these
compounds follow the behavior of a quasireversible system, which may be due to the slow
electron transfer kinetics at the electrode surface.17-19 Therefore, the half-wave potential (E1/2) of
each of the naked quinones was used as an approximation of the formal potential (E°') in these
systems.
Theoretically, quinones with electron withdrawing groups (EWG) attached to the ring
will possess a more positive reduction potential (easier to reduce); while for quinones with
electron donating groups (EDG), the opposite should happen. In Table 2.1, it can be seen that
1,4-benzoquinone is the easiest quinone to be reduced with a peak cathodic potential (Ep,c) of
0.286 V and an E1/2 of 0.326 V. When functional groups are added to the benzoquinone, its
potential changes following a trend close to our expectations with E1/2 values of 0.220 V for QBr,
0.212 V for QH, 0.196 V for QdiMeO, 0.155 V for QMe, and 0.078 V for DQ. QBr, where bromine
has the property of withdrawing electron density from the quinone moiety by the inductive
effect, has a more positive Ep,c and E1/2 than the hydrogen, methoxy and methyl analogs, as I
anticipated. Even though the trend was clear, when comparing the QBr to the QH, the difference
in the half-way potential was only 0.008 V more positive for the bromine analog. This similarity
of potential between QH and QBr may be explained by the inductive effect of the bromine being
counteracted by a resonance effect and a lone pair contribution to the electron density of the

57
quinone moiety by the halogen as reported in earlier work.20 Another interesting observation
was the dimethoxy substituted quinone case; QdiMeO was expected to be more negative than the
methyl analog due to its strong resonance effect; however, the opposite was observed. A
colleague in our group determined the crystal structure of QdiMeO and observed that one of the
methoxy groups is twisted from the quinone plane when two methoxy groups are adjacent on the
quinone ring.14 Such a conformation for the QdiMeO results in a decrease of the resonance effect.
This finding was supported by previous research groups that came to the same conclusion for
quinones where two adjacent methoxy groups are present.21,22
Table 2.1. Thermodynamic results for naked quinones. Potential scans were conducted at a rate of 0.1 V s–1 at 22±2 °C in a pH 7.1 0.1 M PB/0.1 M KCl buffer solution. A three-electrode cell was used containing a glassy carbon electrode, a platinum counter electrode, and an Ag/AgCl (3M KCl) reference electrode. Potentials were converted to values versus the standard hydrogen electrode (SHE) by adding 0.210 V.23 Results are reported as the mean of 4 replicates ± one standard deviation.
Quinone Ep,c (V) vs. SHE Ep,a (V) vs. SHE ΔEp (V) E1/2 (V) vs. SHE
O
O BQ
0.286±0.001 0.365±0.001 0.079±0.001 0.326±0.001
O
O
Br
QBr
0.202±0.000 0.239±0.001 0.037±0.001 0.220±0.001
O
O QH
0.176±0.000 0.249±0.000 0.073±0.000 0.212±0.001
O
OO
O
QdiMeO
0.143±0.000 0.249±0.003 0.106±0.003 0.196±0.002
O
O QMe
0.107±0.001 0.204±0.000 0.097±0.001 0.155±0.001
O
O DQ
0.033±0.001 0.123±0.001 0.090±0.000 0.078±0.001

58
Figure 2.1. Cyclic voltammograms of naked quinones. Potential scans were conducted at a rate of 0.1 V s–1 at room temperature (22±2 °C) in a pH 7.1 0.1 M PB/0.1 M KCl buffer solution. A three-electrode cell was used containing a glassy carbon electrode (A=0.07 cm2), a platinum counter electrode, and an Ag/AgCl (3M KCl) reference electrode (0.210 V vs. SHE).23 Potential sweeps started at 0.6 V to –0.6 and back to 0.6 V. Positive current peak corresponds to the reduction peak (Ep,c) and negative current corresponds to oxidation peak (Ep,a). Colored lines represent 4 trials performed on each quinone and dashed line represents the buffer solution.
-8.0E-5
-6.0E-5
-4.0E-5
-2.0E-5
0.0E+0
2.0E-5
4.0E-5
6.0E-5
8.0E-5
-0.6-0.4-0.200.20.40.6
I (A
)
Potential (V)
BQ BufferT1T2T3T4
-3.0E-5
-2.0E-5
-1.0E-5
0.0E+0
1.0E-5
2.0E-5
3.0E-5
-0.6-0.4-0.200.20.40.6
I (A
)
Potential (V)
QBr
BufferT1T2T3T4
-6.0E-5
-4.0E-5
-2.0E-5
0.0E+0
2.0E-5
4.0E-5
6.0E-5
8.0E-5
-0.6-0.4-0.200.20.40.6
I (A
)
Potential (V)
QH
BufferT1T2T3T4
-6.0E-5
-4.0E-5
-2.0E-5
0.0E+0
2.0E-5
4.0E-5
6.0E-5
8.0E-5
-0.6-0.4-0.200.20.40.6
I (A
)
Potential (V)
QdiMeO
BufferT1T2T3T4
-6.0E-5
-4.0E-5
-2.0E-5
0.0E+0
2.0E-5
4.0E-5
6.0E-5
8.0E-5
-0.6-0.4-0.200.20.40.6
I (A
)
Potential (V)
QMe
BufferT1T2T3T4
-3.0E-5
-2.0E-5
-1.0E-5
0.0E+0
1.0E-5
2.0E-5
3.0E-5
4.0E-5
5.0E-5
-0.6-0.4-0.200.20.40.6
I (A
)
Potential (V)
DQ BufferT1T2T3T4

59
2.3.2 Thermodynamic Parameters of Propionic Acid Quinones and QMe-ETA
In Table 2.2 are shown the thermodynamic values for eleven propionic acid quinones and
one quinone propionic acid derivatized with an ethanolamine group. In Figure 2.2 are contained
the voltammograms for each of the quinone compounds mentioned above. All the quinones in
Table 2.2, with the only exception being NQ-COOH, had a ΔEp ranging between 0.242 V and
0.446 V meaning, that these systems are electron-transfer irreversible. This is not surprising, as
the quinone propionic units have disturbed benzoquinone rings,14 while the conversely
hydroquinone rings are expected to be planar.24 Thus, there is a significant change in ring
geometry during the electron-transfer process that should lead to kinetics sluggishness.
To compare the electronic properties of the various quinones, the reduction peak (Ep,c)
was selected, as it is a better approximation for the reduction potential than E1/2 for this type of
system. In Table 2.2, the first 10 quinones are subdivided into two groups: quinones without a
trimethyl lock system (quinones 1–3) and quinones possessing it (quinone 4–10). In the first
group (NQ-COOH, Q’-COOH, QnogemMe-COOH), the Ep,c decreases from 0.249 V to 0.004 V
when methyl groups are added to the quinone ring, as expected because methyl functions as an
electron donating group and will provide electron density to the ring, resulting in a lower
reduction potential for the quinone (harder to be reduced). In the second group are quinones
where the only difference is the functional group at the 2-position on the ring. How much an
electron donating or withdrawing group affects the reduction of quinones is represented clearly
in this series. When a halogen (Br or I) is attached to the quinone propionic acid, the Ep,c is –
0.026 V and –0.047 V, respectively, and thus are the easier quinones to reduce in the series.
When an electron donating group, such as methoxy or methyl, is present, the Ep,c value shifts
negatively to –0.107 V and –0.125 V, respectively. It is interesting to observe that the more
negative value of Ep,c between QMeO-COOH and QMe-COOH, corresponds to the methyl analog
and not to the methoxy analog, as it was expected. This result, opposite to what it was

60
anticipated, may be due to the not planar conformation that a methoxy group (hindered by a
methyl at the 3-position) can acquired with respect to the quinone ring which will decrease the
electron density contribution that the methoxy group can bring to the quinone.22 Moreover,
when the functional group at the 2-position on the quinone ring is an n-propyl amine or a methyl
amine, the reduction peak shifts even further negative achieving a value of –0.188 V and –0.219
V respectively. Such a strong electron density on the quinone moiety makes them the hardest in
this series to be reduced. The last quinones in Table 2.2 are QdiMeO-COOH and QMe-ETA. The
Ep,c of QdiMeO-COOH differs by only 0.012 V from QMeO-COOH, meaning that addition of an
adjacent methoxy group does not alter the electronic properties, probably because the quinone
can receive electron density from just one methoxy group, as stated before for the naked
quinones. In the case of QMe-ETA, the electronics are virtually the same as QMe-COOH,
meaning that the nature of the propionic acid side change (neutral or anionic at pH 7.1) does not
impact electronic properties of the quinone moiety, as judged by voltammetry.
Finally, when comparing the naked quinone, such is duroquinone, to the QnogemMe-COOH
with a propionic acid handle, the reduction peak moves to the negative side by 0.029 V.
Likewise, when compared QMe to Q’-COOH, having a propionic acid handle that include the
presence of germinal methyls, the reduction peak moves to the negative side by 0.085 V.
Moreover, the reduction peak of QMe-COOH, presenting the trimethyl-lock, compared with the
reduction peak of duroquinone, is 0.158 V more negative. This confirms the fact that the
addition of a handle makes the quinones more difficult to be reduced and that this difficulty
increases as the handle includes germinal methyls or the whole trimethyl-lock system is present.
The reason for the furthest shift of Ep,c to the negative side, is that the trimethyl-lock induces
conformational strain onto the quinone ring, resulting in a deviation from a typical planar
conformation by roughly 20°. These observations were made from X-ray crystallography on

61
each of these compounds14 and supported by a previous study by Wang et al. that also described
the strain caused by the trimethyl-lock system.25
Table 2.2. Thermodynamic results for propionic acid quinones. Potential scans were conducted at a rate of 0.1 V s–1 at 22±2 °C in a pH 7.1 0.1 M PB/0.1 M KCl buffer solution. A three-electrode cell was used containing a glassy carbon electrode, a platinum counter electrode, and an Ag/AgCl (3M KCl) reference electrode. Potentials were converted to standard hydrogen electrode (SHE) by adding 210 mV.23 Results are reported as the mean of 4 replicates ± one standard deviation. aThe anodic peak potential of lactone oxidation, Ep,l, is reported for those propionic acid quinones that exhibit this voltammetric feature.
Quinone Ep,c (V) vs. SHE
Ep,a (V) vs. SHE ΔEp (V) E1/2 (V) vs.
SHE Ep,l (V) vs.
SHEa
O
O
OH
O
NQ-COOH
0.249±0.002 0.321±0.001 0.072±0.003 0.285±0.001 N/A
O
O
OH
O
Q’-COOH
0.022±0.001 0.267±0.001 0.245±0.001 0.144±0.001 N/A
O
O
OH
O
QnogemMe-COOH
0.004±0.002 0.281±0.002 0.277±0.003 0.143±0.002 N/A
O
O
OH
O
QH-COOH
–0.019±0.002 0.253±0.002 0.272±0.001 0.117±0.002 0.659±0.002
O
O
OH
O
Br
QBr-COOH
–0.026±0.001 0.216±0.003 0.242±0.004 0.095±0.001 0.706±0.002
O
O
OH
O
I
QI-COOH
–0.047±0.003 0.289±0.005 0.336±0.008 0.121±0.001 0.711±0.003

62
Table 2.2 continued.
Quinone Ep,c (V) vs. SHE
Ep,a (V) vs. SHE ΔEp (V) E1/2 (V) vs.
SHE Ep,l (V) vs.
SHE
O
O
OH
O
O
QMeO-COOH
–0.107±0.002 0.303±0.002 0.410±0.003 0.098±0.001 0.612±0.003
O
O
OH
O
QMe-COOH
–0.125±0.001 0.218±0.005 0.343±0.007 0.047±0.002 0.615±0.003
O
O
OH
O
HN
Qn-pr-NH-COOH
–0.188±0.001 0.144±0.002 0.332±0.003 –0.022±0.001 0.640±0.004
O
O
OH
O
HN
QMe-N-COOH
–0.219±0.002 0.165±0.002 0.384±0.005 –0.027±0.001 0.618±0.003
O
O
OH
O
O
O
QdiMeO-COOH
–0.095±0.000 0.351±0.002 0.446±0.002 0.128±0.001 0.694±0.004
O
O
NH
OOH
QMe-ETA
–0.118±0.002 0.199±0.000 0.317±0.002 0.041±0.001 0.640±0.003

63
Figure 2.2. Cyclic voltammograms of quinones with a propionic acid side chain. Potential scans were conducted at a rate of 0.1 V s–1 at 22±2 °C in a pH 7.1 0.1 M PB/0.1 M KCl buffer solution. A three-electrode cell was used containing a glassy carbon electrode (A=0.07 cm2), a platinum counter electrode, and an Ag/AgCl (3M KCl) reference electrode (0.210 V vs. SHE).23 Potential sweeps started at 0.6 V to –0.6 and back to 0.6 V. Positive current peak corresponds to the reduction peak (Ep,c) and negative current corresponds to oxidation peak (Ep,a). Colored lines represent 4 trials performed on each quinone and dashed lines represent the buffer solution.
-4.0E-5
-3.0E-5
-2.0E-5
-1.0E-5
0.0E+0
1.0E-5
2.0E-5
3.0E-5
4.0E-5
-0.6-0.4-0.200.20.40.6
I (A
)
Potential (V)
NQ-COOH
BufferT1T2T3T4
-2.5E-5
-1.5E-5
-5.0E-6
5.0E-6
1.5E-5
2.5E-5
3.5E-5
4.5E-5
-0.6-0.4-0.200.20.40.6
I (A
)
Potential (V)
Q'-COOH BufferT1T2T3T4
-2.0E-5
-1.0E-5
0.0E+0
1.0E-5
2.0E-5
3.0E-5
-0.6-0.4-0.200.20.40.6
I (A
)
Potential (V)
QnogemMe-COOH BufferT1T2T3T4
-2.0E-5
-1.0E-5
0.0E+0
1.0E-5
2.0E-5
3.0E-5
4.0E-5
-0.6-0.4-0.200.20.40.6
I (A
)
Potential (V)
QH-COOH BufferT1T2T3T4
-2.0E-5
-1.0E-5
0.0E+0
1.0E-5
2.0E-5
3.0E-5
4.0E-5
5.0E-5
-0.6-0.4-0.200.20.40.6
I (A
)
Potential (V)
QBr-COOH
BufferT1T2T3T4
-4.0E-5
-2.0E-5
0.0E+0
2.0E-5
4.0E-5
6.0E-5
8.0E-5
1.0E-4
-0.6-0.4-0.200.20.40.6
I (A
)
Potential (V)
QI-COOH BufferT1T2T3T4

64
Figure 2.2 continued.
-2.0E-5
-1.0E-5
0.0E+0
1.0E-5
2.0E-5
3.0E-5
4.0E-5
5.0E-5
-0.6-0.4-0.200.20.40.6
I (A
)
Potential (V)
QMeO-COOH BufferT1T2T3T4
-1.5E-5
-5.0E-6
5.0E-6
1.5E-5
2.5E-5
3.5E-5
4.5E-5
-0.6-0.4-0.200.20.40.6
I (A
)
Potential (V)
QMe-COOH BufferT1T2T3T4
-2.0E-5
-1.0E-5
0.0E+0
1.0E-5
2.0E-5
3.0E-5
4.0E-5
-0.6-0.4-0.200.20.40.6
I (A
)
Potential (V)
Qn-Pr-NH-COOH
BufferT1T2T3T4
-2.0E-5
-1.0E-5
0.0E+0
1.0E-5
2.0E-5
3.0E-5
4.0E-5
5.0E-5
-0.6-0.4-0.200.20.40.6
I (A
)
Potential (V)
QMe-N-COOH BufferT1T2T3T4
-1.5E-5
-1.0E-5
-5.0E-6
0.0E+0
5.0E-6
1.0E-5
1.5E-5
2.0E-5
2.5E-5
-0.6-0.4-0.200.20.40.6
I (A
)
Potential (V)
QdiMeO-COOH BufferT1T2T3T4
-2.0E-5
-1.0E-5
0.0E+0
1.0E-5
2.0E-5
3.0E-5
4.0E-5
5.0E-5
-0.6-0.4-0.200.20.40.6
I (A
)
Potential (V)
QMe-ETA
BufferT1T2T3T4

65
2.3.3 Propionic Acid Quinones and Their Cyclization Behavior
Earlier voltammograms of propionic acid quinones containing the trimethyl-lock system
dissolved in 50% acetonitrile/buffer solutions, showed a lactone peak appearing when QH-
COOH is reduced to its corresponding hydroquinone.26 The cyclic voltammetry data obtained
here in aqueous buffer electrolyte on our trimethyl-lock quinones, led to observation of a lactone
peak (Ep,l) when these quinones were reduced to their hydroquinones under the experimental
conditions used here. However, quinone propionic acid where the trimethyl-lock is absent (NQ-
COOH, Q’-COOH, QnogemMe-COOH) does not present a lactone peak. Such a difference
between the quinone propionic acid is due to the fact that when the trimethyl-lock system is
absent, the cyclization rate is significantly slower, as was reported previously in our group and in
earlier works.24,27-30 In Scheme 2.2 is presented the reaction sequence for the lactone formation.
It is important to our final goal not only to determine the ease of reduction of our quinones but
also to find the rate at what hydroquinone disappear to become a lactone. In this matter, the peak
current ratio for quinone reduction and hydroquinone oxidation was measured for all the
propionic acid quinone and subsequently predicted according to Nicholson and Shain for a
chemical step following electron transfer.13 As a result, the rate constant for the disappearance
of hydroquinone, called kf was obtained. In Table 2.3 are presented the rate for the
disappearance of hydroquinone after reduction of the quinone. The results from Table 2.3
revealed that quinones with no trimethyl-lock have the slowest rate among the propionic acid
series (NQ-COOH = 0.02 s–1, QnogemMe-COOH = 0.08 s–1, Q’-COOH = 0.13 s–1). Those values
confirm the rate enhancement produced by the trimethyl-lock presence when lactone is form by
the cyclization of propionic acid quinones.

66
Table 2.3. Rate constant for the disappearance of propionic acid hydroquinones. aRatio measured between peaks current where the potential scan was conducted at a rate of 0.1 V s–1 at 22±2 °C in a pH 7.1 0.1 M PB/0.1 M KCl buffer solution. bRatio measured between peaks current where the potential scan was conducted at a rate of 1 V s–1 22±2 °C in a 0.1 M PBS / 0.1 M KCl pH 7.1 buffer solution. A three-electrode cell was used containing a glassy carbon electrode, a platinum counter electrode, and an Ag/AgCl (3M KCl) reference electrode.
Quinone kf (s-1)
NQ-COOH 0.02a
QnogemMe-COOH 0.08a
Q’-COOH 0.13a
QH-COOH 0.19a
QMeO-COOH 0.27a
QdiMeO-COOH 0.29a
QMe-N-COOH 0.37a
Qn-pr-NH-COOH 0.39a
QMe-COOH 1.0b
QI-COOH 1.8b
QBr-COOH 2.4b
Figure 2.3. Cyclic voltammograms of QMe-COOH. Potential scans were conducted at a rate of 0.1 V s–1 at 22±2 °C in the specified buffer solution. A three-electrode cell was used containing a glassy carbon electrode (A=0.07 cm2), a platinum counter electrode, and an Ag/AgCl (3M KCl) reference electrode (0.210 V vs. SHE).23 Potential sweeps started at 0.6 V to –0.6 and back to 0.6 V. Positive current peak corresponds to the reduction peak (Ep,c) and negative current corresponds to oxidation peak (Ep,a), and to the anodic peak of the lactone (Ep,l).
-4.0E-01
-2.0E-01
0.0E+00
2.0E-01
4.0E-01
6.0E-01
8.0E-01
1.0E+00
-0.6-0.4-0.200.20.40.6
i(E)/i
p,c
Potential (V)
Normalized 0.5 M KCl/0.05 M PB pH7.4
Normalized 0.075 M KCl/0.05 M PB pH7.4
Normalized 0.1 M KCl/0.1 M PB pH7.1

67
To conclude the study on the cyclization rate of propionic acid quinones, the influence of
buffer catalysis and salt concentration was investigated for QMe-COOH. In Figure 2.3 is clearly
shown that the increase in buffer concentration increases the rate of cyclization as seen by the
bigger size on the lactone peak and the change on the current peak ratio. On the other hand,
adding more salt does not have an effect on the current ratio peak, thus, no impact is seen in the
cyclization rate.
2.4 Conclusions
The electronic properties of six naked quinones, eleven propionic acid quinones, and a
quinone propionic acid with an ethanolamine handle were characterized by cyclic voltammetry.
In all cases, it was demonstrated that structural changes on the quinone moiety altered their
reduction behavior. In the case of naked and trimethyl-lock propionic acid quinones, their
reduction potentials were changed by addition of different functional groups to the benzoquinone
moiety. Both type of quinones followed the same trend where quinones with a halogen had the
more positive (or less negative) reduction potential, and quinones with a group that donates
electron density to the ring, such as methyl, methoxy or amine, had more negative reduction
potentials. However, it seems that halogens donate some electron density to the quinone ring
because their reduction potentials with respect to their hydrogen variant were very close (–0.026
V vs. –0.019 V). A similar conclusion was reached for iodo, chloride and bromine substituted
quinones in Novak work.20 I also observed that propionic acid quinones without the presence of
the trimethyl-lock system had a more positive reduction potential and more easily reduced than
those where the trimethyl-lock system is present. The contorted strain produced onto the
quinone ring by the trimethyl-lock makes the transfer of electrons more difficult. Although,
quinone derivatives are harder to reduce when the trimethyl lock is present, its inclusion is
fundamental to create quinones that can have a fast cyclization, as seen previously by in our
group and by other research groups.24,27-30 In Figure 2.3, it is stated that an increase in buffer

68
concentration increases the cyclization rate but that no impact is seen when more salt is present
into the solution. As shown in Table 2.3, quinone propionic acids without the presence of
trimethyl lock had the slowest rate for the disappearance of the hydroquinone after reduction of
the quinone moiety occurred. It is important to mention that the nature of the handle does not
alter the reduction potential of the quinone as seen when comparing QMe-COOH versus QMe-
ETA. From our summarized results, I can conclude that halogen, hydrogen, methyl, and
methoxy trimethyl-lock propionic acid quinones can be assayed against the human enzyme
NQO1 without further concerns of non-enzymatic reduction with the aim of finding possible
trigger-quinones for enzyme activation.
2.5 References
(1) Bailey, S. I.; Ritchie, I. M., A Cyclic Voltammetric Study of the Aqueous Electrochemistry of Some Quinones. Electrochim. Acta 1985, 30 (1), 3-12.
(2) Goulart, M. O. F.; Hillard, E. A.; de Abreu, F. C.; Ferreira, D. C. M.; Jaouen, G.; Amatore, C., Electrochemical Parameters and Techniques in Drug Development, with an Emphasis on Quinones and Related Compounds. Chem. Commun. 2008, (23), 2612-2628.
(3) Ernster, L.; Ljunggren, M.; Danielson, L., Dt Diaphorase .1. Purification from Soluble Fraction of Rat-Liver Cytoplasm, and Properties. Biochim. Biophys. Acta 1962, 58 (2), 171-188.
(4) Ernster, L., Dt Diaphorase. Methods Enzymol. 1967, 10, 309-317.
(5) Lind, C.; Cadenas, E.; Hochstein, P.; Ernster, L., Dt-Diaphorase: Purification, Properties, and Function. Methods Enzymol. 1990, 186, 287-301.
(6) Tedeschi, G.; Chen, S.; Massey, V., Dt-Diaphorase - Redox Potential, Steady-State, and Rapid Reaction Studies. J. Biol. Chem. 1995, 270 (3), 1198-1204.
(7) Carlson, B. W.; Miller, L. L., Mechanism of the Oxidation of Nadh by Quinones - Energetics of One-Electron and Hydride Routes. J. Am. Chem. Soc. 1985, 107 (2), 479-485.

69
(8) Butler, J.; Hoey, B. M., The One-Electron Reduction Potential of Several Substrates Can Be Related to Their Reduction Rates by Cytochrome-P-450 Reductase. Biochim. Biophys. Acta 1993, 1161 (1), 73-78.
(9) Reipa, V., Direct Spectroelectrochemical Titration of Glutathione. Bioelectrochemistry 2004, 65 (1), 47-49.
(10) Ball, E. G., Studies on Oxidation-Reduction Xxiii. Ascorbic Acid. J. Biol. Chem. 1937, 118 (1), 219-239.
(11) Carpino, L. A.; Triolo, S. A.; Berglund, R. A., Reductive Lactonization of Strategically Methylated Quinone Propionic-Acid Esters and Amides. J. Org. Chem. 1989, 54 (14), 3303-3310.
(12) Nicholson, R. S.; Shain, I., Theory of Stationary Electrode Polarography - Single Scan and Cyclic Methods Applied to Reversible, Irreversible, and Kinetic Systems. Anal. Chem. 1964, 36 (4), 706-723.
(13) Nicholson, R. S., Semiempirical Procedure for Measuring with Stationary Electrode Polarography Rates of Chemical Reactions Involving Product of Electron Transfer. Anal. Chem. 1966, 38 (10), 1406.
(14) Carrier, N. H. Redox-Active Liposome Delivery Agents with Highly Controllable Stimuli-Responsive Behavior. Ph.D. Dissertation, Louisiana State University, Baton Rouge, LA, 2011.
(15) Engstrom, R. C., Electrochemical Pretreatment of Glassy-Carbon Electrodes. Anal. Chem. 1982, 54 (13), 2310-2314.
(16) Mabbott, G. A., An Introduction to Cyclic Voltammetry. J. Chem. Educ. 1983, 60 (9), 697-702.
(17) Smith, D. K.; Quan, M.; Sanchez, D.; Wasylkiw, M. F., Voltammetry of Quinones in Unbuffered Aqueous Solution: Reassessing the Roles of Proton Transfer and Hydrogen Bonding in the Aqueous Electrochemistry of Quinones. J. Am. Chem. Soc. 2007, 129 (42), 12847-12856.
(18) Tommos, C.; Hay, S.; Westerlund, K., Redox Characteristics of a De Novo Quinone Protein. J. Phys. Chem. B 2007, 111 (13), 3488-3495.

70
(19) Rich, P. R., The Quinone Chemistry of Bc Complexes. Bba-Bioenergetics 2004, 1658 (1-2), 165-171.
(20) Novak, I.; Kovac, B., Electronic Structure of Substituted Benzoquinones and Quinonechloroimides. J. Phys. Chem. A 2008, 112 (14), 3061-3065.
(21) Silverman, J.; Stam-Thole, I.; Stam, C. H., Crystal and Molecular Structure of 2-Methyl-4,5-Dimethoxy Para Quinone (Fumigatin Methyl Ether), C9h10o4. Acta Cryst. B-Struc. 1971, B 27 (Oct15), 1846-1851.
(22) Burie, J. R.; Boullais, C.; Nonella, M.; Mioskowski, C.; Nabedryk, E.; Breton, J., Importance of the Conformation of Methoxy Groups on the Vibrational and Electrochemical Properties of Ubiquinones. J. Phys. Chem. B 1997, 101 (33), 6607-6617.
(23) Friis, E. P.; Andersen, J. E. T.; Madsen, L. L.; Bonander, N.; Moller, P.; Ulstrup, J., Dynamics of Pseudomonas Aeruginosa Azurin and Its Cys3ser Mutant at Single-Crystal Gold Surfaces Investigated by Cyclic Voltammetry and Atomic Force Microscopy. Electrochim. Acta 1998, 43 (9), 1114-1122.
(24) Karaman, R., A New Mathematical Equation Relating Activation Energy to Bond Angle and Distance: A Key for Understanding the Role of Acceleration in Lactonization of the Trimethyl-Lock System. Bioorg. Chem. 2009, 37, 11-25.
(25) Wang, B.; Nicolaou, M. G.; Liu, S.; Borchardt, R. T., Structural Analysis of a Facile Lactonization System Facilitated by a ''Trimethyl Lock''. Bioorg. Chem. 1996, 24 (1), 39-49.
(26) Amsberry, K. L.; Borchardt, R. T., Amine Prodrugs Which Utilize Hydroxy Amide Lactonization .1. A Potential Redox-Sensitive Amide Prodrug. Pharm. Res. 1991, 8 (3), 323-330.
(27) Ong, W.; Yang, Y. M.; Cruciano, A. C.; McCarley, R. L., Redox-Triggered Contents Release from Liposomes. J. Am. Chem. Soc. 2008, 130 (44), 14739-14744.
(28) Amsberry, K. L.; Borchardt, R. T., The Lactonization of 2'-Hydroxyhydrocinnamic Acid-Amides: A Potential Prodrug for Amines. J. Org. Chem. 1990, 55 (23), 5867-5877.
(29) Milstien, S.; Cohen, L. A., Stereopopulation Control .1. Rate Enhancement in Lactonizations of Ortho-Hydroxyhydrocinnamic Acids. J. Am. Chem. Soc. 1972, 94 (26), 9158-9165.

71
(30) Caswell, M.; Schmir, G. L., Formation and Hydrolysis of Lactones of Phenolic-Acids. J. Am. Chem. Soc. 1980, 102 (14), 4815-4821.

72
CHAPTER 3
TRIGGERABLE QUINONES ACTIVATED BY NAD(P)H:QUINONE OXIDOREDUCTASE TYPE I (HNQO1) FOR POTENTIAL DRUG DELIVERY
APPLICATIONS
3.1 Introduction
In the last two decades, there has been remarkable interest in the activation of drug
delivery systems and cellular process by enzymes associated with inflammatory diseases and
cancer.1 The latter has been addressed in two ways: 1) using such endogenous, unregulated
proteins to selectively activate antitumor compounds,2 prodrugs,3-6 and very recently liposomes7-
13 and 2) deactivating the enzyme which causes cell death through accumulation of damaged
species, such as superoxide.14 Among the enzymes used as stimuli for these therapeutic routes, a
significant research effort has been directed at a subgroup of reductase enzymes, of which
NAD(P)H: quinone oxidoreductase-1 (NQO1, DT-diaphorase, EC 1.6.99.2)15,16 has become of
great interest.17 This homodimeric flavoprotein is unique among reductases, as it catalyzes the
direct two-electron reduction of a wide variety quinones using NADH or NADPH as cofactor 15.
NQO1 is located mainly in the cytosol of cells, but can also be found in the nucleus, endoplasmic
reticulum, membrane and mitochondria, as well as extracellularly.15,18-24 The over-expression of
human NQO1 in certain tumor tissues (e.g. non-small cell lung, pancreas and colon)25-29 makes it
a valuable target for activating stimuli-responsive drug delivery systems based on quinone
derivatives. As a result, many groups have been actively studying its molecular structure using
crystallography methods so as to improve our understanding about its nature (e.g. human code
1D4A),30 as well as its behavior with substrates or inhibitors (e.g. duroquinone-enzyme code
1DXO).30-35 Importantly, the ability of NQO1 to reductively activate sophisticated quinone and
quinoidal compounds such as antitumor compounds36 and prodrugs37 has been studied a great
deal in the past. However, the interaction of rhNQO1 with simple quinones or quinones useful
for trigger groups in prodrugs and delivery vehicles, has to date not been studied.

73
Trigger groups that upon activation by a reductive stimulus are subsequently cleaved
from a targeted group,6 hold much promise in the development of endogenously-triggered
prodrugs and drug delivery vehicles, such as liposomes. Our group has shown that reductively-
activated liposomes can have their contents delivered upon self-cleavage of the reduced quinone
headgroup of the fusogenic lipids composing the liposomes.38 The key step of this delivery
process is the initial reduction of the cleavable quinone head group, which should be controlled
by the structure of the trimethyl-locked quinone propionic acid trigger (QPA), Scheme 3.1.
Scheme 3.1. Reduction and cyclization process on quinone propionic acid triggers (QPA).
Variants of the QPA trigger groups have also been investigated for prodrugs, such those
based on mustard39 and oxindoles.40 Tunability in the reductive triggering of QPA groups for
either prodrug or liposome delivery applications will be achieved by substituent variation at R1,
R2, and R3 (Scheme 3.1). Although others groups have previously demonstrated that simple
quinones can be tuned for better interaction with rat NQO1,41-43 and there exist a good number of
reports on structure-relationship activity44-51 and docking studies of NQO1 inhibitors and
substrates for anticancer therapy,14,32,52-56 there is little data in the literature for the interaction of
simple quinones with recombinant human NQO1. Volpato et al. found that rhNQO1 activated
an aromatic nitrogen mustard prodrug containing the QPA group with R1=R2=R3=R4=CH3.39 In
this paper, we examine a good number of QPA derivatives as potential substrates for human
NQO1. We report detailed solution-phase kinetic parameters, as well as molecular docking
studies, to help understand how these quinones interact with hNQO1. Using the known crystal

74
structure of the hNQO1-duroquinone complex (1DXO),30 six different receptors (changing
interface radius, oxidation state of cofactor, and method to define active site) were defined.
Quinone derivatives were docked in each receptor to see if there was any difference on the
outcomes and to have a better prediction for the orientation of our quinones into the active site of
hNQO1. Furthermore, we intended to correlate the experimental free energies extracted from the
kinetic assays with the theoretical free energies from the docking studies.
3.2 Experimental Section
3.2.1 Materials
Recombinant human enzyme NAD(P)H:quinone oxidoreductase-1 (EC 1.6.99.2)
(rhNQO1), nicotinamide adenine dinucleotide reduced (β-NADH) and bovine serum albumin
(BSA) were purchased from Sigma (D1315, N8129, A3294). Potassium dihydrogen phosphate
(KH2PO4, Fluka 60219), dipotassium hydrogen phosphate (K2HPO4, Fisher P288), potassium
chloride (KCl, Sigma P9541) and potassium hydroxide pellets (KOH, Mallinckrodt) were used to
make the buffer. Ethyl alcohol (200 Proof-Absolute-Anhydrous) was purchased from Pharmaco-
AAPER. Nanopure water was obtained from a Nanopure Diamond Barnstead System (18.2 MΩ-
cm). Quinone substrates were synthesized as previously described or as outlined in the
Appendix.57 The quartz 96-well microplate used in the enzyme assays was purchased from
Hellma (730.009-QG). FLUOstar Optima plate reader from BMG Labtech was used to follow
NADH consumption during the enzyme assay.
3.2.2 Enzyme Kinetic Assay
Enzyme activities were determined using UV-vis spectroscopy by adapting a previous
assay58 to a 96-well plate reader. The oxidation of NADH at 340 nm was measured using an
experimental determined extinction coefficient of 4390 M–1cm–1 (Table A.1 and Figure A.1).
Kinetic experiments were performed on three different days with at least three replicates of each
condition performed. The assay solution consisted of 0.1 M PB/0.1 M KCl buffer solution at pH

75
7.10 containing 0.007% of bovine serum albumin, 100 µL of appropriate concentration of
quinone substrate, 50 µL of a 400 µM NADH solution, and 50 µL of enzyme solution (0.11–3.00
µg). The total assay volume was 200 µL. All stock quinone solutions were prepared by
dissolving each quinone in ethanol (100 µL) with subsequent dilution to 10.00±0.02 mL with
0.007% BSA solution. Quinone solutions of the desired concentrations were made by taking the
appropriate volume from the quinone stock solution and diluting it to 10.00±0.02 mL in a
volumetric flask. The solutions were kept at room temperature (22±2 °C), in the dark, for
approximately 2 hours before the experiments were started. Once the 96-well plate was filled
with the assay solutions, except the NADH solution, it was placed into the instrument and left to
sit for 5 min before starting the measurements. The enzyme reaction was started by automated
dispensing of the NADH solution, and the absorbance change at 340 nm was measured for 1.6
min at room temperature (22 to 26 °C). The linear portion of the absorbance vs. time graphs (the
first 20 seconds to 1 min) were fitted and slopes were calculated. The average slopes from the
replicates was used to calculate the kinetic parameters, with the Q–test being applied so as to
reject values outside of the 90% confidence level.59 Plots of velocity versus quinone
concentration were used to obtain Km and Vmax values from non-linear least squares analysis.60
T-test was applied to the close values in the kinetic parameters so as to see if they were
statistically different at the 95% confidence level.61 Due to instrument sensitivity, quinones with
Km values lower than 15 µM could only be estimated.
3.2.3 Molecular Docking
Docking studies were performed using FlexX from LeadIT (1.3.0 version).62-69 Quinone
structures were prepared in Chemdraw3D and subsequently minimized using Sybyl-X (Version
1.1.1) using the Tripos force field for suitable bond distances and angles and the Gasteiger-
Hückel method for charge calculation. Enzyme coordinates used in the FlexX software were
obtained from The Protein Data Bank (code: 1DXO). A molecular visualization system called

76
PyMOL was used to prepare the docking frames. Construction of six different receptors was
done with the FlexX software by selecting the active site containing amino acids from monomer
A and C of the enzyme crystal structure. Two water molecules were present in each of the
receptors. Receptor 1 includes FAD (as it is in the X-ray coordinates) as a cofactor with
duroquinone as the reference ligand (X-ray coordinates edited by FlexX for correct atom
hybridization and bond type) and the binding site is defined within an interface of 6 Å
encompassing the reference ligand. Receptor 2 includes FADH2 (FAD X-ray coordinates
modified) as a cofactor with duroquinone as the reference ligand (X-ray coordinates edited by
FlexX for correct atom hybridization and bond type) and the binding site is defined within an
interface of 6 Å encompassing the reference ligand. Receptor 3 is the same as Receptor 1 but
has an interface radius of 8 Å. Receptor 4 is the same as Receptor 2 but has an interface radius
of 8 Å. Receptor 5 includes FAD as a cofactor with the active site defined by a sphere of 8.5 Å
with N5 from FAD as its center. Receptor 6 includes FADH2 as a cofactor with the active site
defined by a sphere of 8.5 Å with N5 from FADH2 as its center.
In FlexX flexible docking calculations, the initial position of the substrate is outside the
active site. Then, an algorithm for fragmenting the quinone substrate is executed, and a base
fragment is automatically selected and placed in the active site on which an incremental
construction algorithm is performed. From these calculations, each substrate examined using
different receptors, has a set of solutions where the closest poses (based on score, position and
interactions with the protein) were selected for detailed investigation. On these selected poses,
the influence of the cofactor state (oxidized FAD or reduced FADH2 form), receptor radius, and
the inclusion or not of a reference ligand was studied. In addition, the total score was used as an
estimate of the free energy of binding and was subsequently used to plot theoretical free energies
of binding versus experimental free energies of binding (ΔG = –RTLnKm).63

77
The docking method is based on the experimental observed range of nonbonded contact
geometries revealed by statistical analysis of the Cambridge Structural Database (CSD), the
analysis of the CSD is used to define the range of allowed angles and dihedrals describing the
nonbonded contact geometry.70 The program discards any solution with electrostatic repulsion
(based on a threshold limit distance). The scoring function accounts for hydrogen bonds, ionic
interactions, hydrophobic contact surface, and the number of rotatable bonds in the substrate.
The limitations of the scoring function is that it does not account for differences in binding
strengths between various neutral hydrogen bonds or ionic interactions, and it does not include
the conformational energy of the substrate.63,70 The FlexX algorithm breaks down the substrate
into fragments where one is automatically elected as the base fragment,66 and then the fragments
are connected flexibly during docking in an incremental way.65 In the triangle algorithm,
triangles of interaction centers are formed using the base fragment, and those are mapped onto
triangle points lying on the receptor’s surface. As an alternative to the triangle algorithm, a line
algorithm is used when only two interactions exist simultaneously between the substrate and the
enzyme. The receptor is rigid and the ligand is flexible for both algorithms. The scoring
function is a modification of Böhm’s function.66-68
3.3 Results and Discussion
3.3.1 Kinetic Studies on Triggerable Quinones
All the rhNQO1 kinetic parameters for the different quinone derivatives studied here are
presented in Table 3.1. To compare our data, we divided our complete list of quinone
derivatives into 3 groups: a) changing the substituents at the 2-position (R1) on the quinone ring
for the trimethyl lock series (R3=R4=CH3), b) presence versus absence of the trimethyl lock
system, and c) charged versus neutral quinone propionic acid.

78
Table 3.1. Kinetic parameters for the reduction of quinone derivatives by hNQO1. Values are the mean ± one standard deviation for three independent determinations.
Quinone Km (µM) Vmax (µmol·min–1·mg–1
of hNQO1) kcat (min–1) kcat/Km (min–1·µM–1)
O
O
OH
O
Br
QBr-COOH
41±8 88±7 5500±400
133±28
O
O
OH
O
QH-COOH
50±11 83±8 5100±500 103±25
O
O
OH
O
QMe-COOH
158±41 38±5 2400±300 15±4
O
O
OH
O
O
QMeO-COOH
447±102 42±5 2600±300 6±1
O
O
OH
O
Q’-COOH
20±3 78±3 4800±200 242±37
O
O
OH
O
QnogemMe-COOH
5±1 66±4 4100±200 853±178
O
O
OH
O
O
O
QdiMeO-COOH
376±87 14±1 800±100 2±0.5
O
O
NH
OOH
QMe-ETA
132±32 60±7 3700±400 28±7

79
• Changing the Substituent at the 2-position on the Quinone Ring–Trimethyl Lock Series.
We obtained the kinetic parameters for four quinones that differ in their functional group
at the 2-position on the quinone ring (bromine, hydrogen, methyl, methoxy). Of this group, QBr-
COOH (R1=Br) and QH-COOH (R1=H) appear to be the best substrates based on its Km, Vmax
and kcat/Km values. The Michaelis constant values of Km = 41 µM (QBr-COOH) and Km = 50
µM (QH-COOH), as well as, the maximum velocity values of Vmax = 88 µmol·min–1·mg–1 (QBr-
COOH) and Vmax = 83 µmol·min–1·mg–1 (QH-COOH) were found to be statistically equal at the
95% confidence level. Both QBr-COOH and QH-COOH are efficient substrates for rhNQO1,
based on their kcat/Km values of 133 min–1·µM–1 and 103 min–1·µM–1, respectively. In the case
of QMe-COOH, there are two clear effects on the kinetic parameters as a consequence of the
presence of a methyl group at the 2-position of the quinone ring. First, the presence of the
methyl group increases the electron density of the quinone core (due to its electron donating
character) possibly making the analog less wishful to accept the electrons that come from the
enzyme cofactor FADH2. Second and more prominent, the methyl substituent causes steric
interactions between the quinone ring and the hNQO1 active site, resulting in an unfavorable
alignment and position of the quinone, causing lower binding, thus lowering the reduction rate.
Steric hindrance at R1 position on the quinone ring has been previously observed to be an
important factor in changing the rate of reduction between human NQO1 and structures such as
indolequinones and benzoquinone mustard compounds.48,51,56 Lastly, QMeO-COOH has a very
similar turnover rate compared to its methyl analog, and even though the methoxy group has a
higher electron-donating ability, the alignment of this group with respect to the quinone ring
reduces its power and make it behaves as a methyl. The alignment distortion is caused by the
methyl group at the 3-position of the quinone ring, because when a hydrogen is placed instead,
the methoxy group adopt a coplanar conformation with the quinone ring that permits fully
contribution of the electron density.71,72 However, the Km value of the QMeO-COOH differs from

80
that of its methyl analog because the methoxy group is a bulkier substituent than methyl.
Consequently, steric interactions between the quinone and the hNQO1 active site, lead to
decreased QMeO-COOH binding affinity, resulting in it being the worst substrate for hNQO1 in
this series. To complete the enzyme kinetic analysis of different functional groups at R1 position
on the quinone rings, attempts were made to investigate QMe-N-COOH and Qn-pr-NH-COOH
responses toward rhNQO1 but the results obtained are not reliable because both substrates
absorb at the wavelength (340 nm) that NADH consumption is measured.
• Special Note to QdiMeO-COOH.
Although this analog possesses the trimethyl-lock structural motif, QdiMeO-COOH does
not fall into the category discussed above, because it does not have a methyl group at the 3-
position on the quinone ring. However, it was synthetically readily achievable and so it was
investigated. The pressure of one more methoxy group versus QMeO-COOH does not alter the
Km value, which are statistically equal. However, the Vmax value of QdiMeO-COOH is 1/3 times
that of the quinone with only one methoxy group, QMeO-COOH (Vmax=42 µmol·min–1·mg–1).
The cause associated with the rate difference, may be the presence of adjacent methoxy groups in
the QdiMeO-COOH analog. It has been reported before that when methoxy groups are in adjacent
locations on the quinone ring, one of them is coplanar to the quinone ring, and the other one is
not.71,72 Therefore, the quinone ring will receives full electron density contribution from the
coplanar methoxy group making the quinone not as happy to receive electrons. Moreover, the
steric hindrance caused by the second methoxy group, which is a bulkier group than a methyl at
R2 position on the quinone ring, could also affect the reduction rate of the quinone by hNQO1.
• The Presence versus the Absence of the Trimethyl-Lock Motif in the Quinone.
QBr-COOH, QH-COOH, QMe-COOH and QMeO-COOH all contain the trimethyl-lock
motif, whereas Q’-COOH and QnogemMe-COOH do not. All quinone structures are shown in
Table 3.1. In Q’-COOH, a hydrogen is present (instead of a methyl) at the 5-position on the

81
quinone ring and its observed Michaelis constant of 20 µM, it is substantially lower than that of
QMe-COOH that possesses the trimethyl-lock motif (158 µM). In addition, QH-COOH and Q’-
COOH, both have a hydrogen group on the quinone ring but the difference in position of that
hydrogen at R1 and R3, respectively, make QH-COOH a trimethyl-lock derivative and Q’-
COOH not. This difference is reflected on the Km value of 50 µM for QH-COOH and 20 µM
for Q’-COOH, resulting the last one a better substrate toward the hNQO1 enzyme. This change
in affinity can be explained by the ease of the trimethyl-lock strain when hydrogen is placed on
the quinone ring on the same side as the propionic acid chain. To further probe the effect of the
trimethyl-lock motif, a quinone with no germinal methyl groups on the propionic side chain was
examined, QnogemMe-COOH. It was found that QnogemMe-COOH was even more specific
toward the enzyme, as stated by its Km value of roughly 5 µM (Km values lower than 15 µM
could only be estimated).
• The Role of Charged Quinone versus Neutral Quinone.
To investigate the effect of a neutral quinone in the active site, versus a negatively-
charged quinone, we studied a quinone with an ethanolamine (QMe-ETA) attached to the
propionic acid group via an amide bond (with a pKa around 10)73 and compared its hNQO1
values obtained for the QMe-COOH that is anionic at physiological pH.74 QMe-ETA presents a
higher maximum velocity; however, the Michaelis constant values (Km) are statistically equal,
therefore, no significant difference is presented in binding affinity. The increase of 22
µmol·min–1·mg–1 in maximum velocity for the QMe-ETA could be due to the absence of charge
on the molecule or to the longer extended chain that QMe-ETA presents, that permits a different
arrangement of the quinone-ethanolamine derivative into the active site of the enzyme. This
hypothesis will be later discussed by analysis of the docking outcomes.

82
3.3.2 Docking Studies on Triggerable Quinones
In order to validate the docking methods used for the various quinone propionic acids, we
examined docking results for duroquinone. It was found that excellent results were achieved
with all of the receptors, with an observed root mean square deviation (RMSD) < 0.5 Å for the
best prediction and a RMSD < 1.34 Å for the lowest score. In all of these outcomes, it was
found that the orientation of the duroquinone was very similar, with differences of less than 1.2
kJ·mol–1 from the lowest energy to the 20th lowest energy in each receptor. In Figure 3.1, the
best pose for duroquinone is shown and compared with the original crystal structure.
Figure 3.1. Best prediction for the docked duroquinone in receptor 1 compared with the position of the duroquinone in the original crystal structure. Docked duroquinone (pink) differ from the original duroquinone (yellow) by 0.4530 Å. Representation of amino acids (stick display; color by atom type, carbon atoms colored in purple) and FAD (sticks display; color by atom type, carbon atoms colored in cyan) in receptor 1.
• Which Receptor Gives the Best Prediction?
In docking, the way in which a receptor is defined affects in different ways the
predictions of substrate interactions. It is important to know what amino acids are to be included
(defined by the radius of interaction), and the cofactor oxidation state must also be selected. For
the catalyzed NQO1 reduction of quinones with NADH, there is still much debate as to where

83
the negative charge stays after the first hydride transfer happens. The most prominent proposal
is that in which the negative charge stays on O2 and then this oxygen gets protonated to become
an OH and the hydride is transferred to form FADH2.37,75,76 Scheme 3.2 represents the charge
relay process and the possible atom sites on the quinone moiety where the hydride can be
transferred to.
HN3
N1 N10
N5
O4
O2
R
+
NADHFAD
N
NH2
O
R
HH
O H
Tyr 155
NR
NH2
O
NAD+
HN3
N1 N10
N5
O4
O2
R
H
H
FADH2
O
Tyr 155
CCO
O
OR1H
O
N NH
H
OR1H
OH
OH
H
His 161
O
OH
N NH
H
His 161
OHH
R1
R2 R3
Z
O
R4
R4R'
H-
H-
OR2 R3
R4
R4Z R'
O
R2
R1
R3
Z
O
R'
R4
R4
OHR1
R2 R3
Z
R4
R4
O
R'
R2 R3
Z
R4
R4
O
R'
N NH
H
His 161
OH
OH
R1
R2 R3
Z
O
R4
R'
Scheme 3.2. Hydride transfer mechanism on all possible atom sites on QPAs.

84
There are also concerns about the geometry of FAD versus FADH2 and how the
protonation can affect its conformation. In the literature, it is reported that the conformation of
FADH2 changes to a butterfly-like shape in solution (versus planar for FAD), but in most
modeling structures FADH2 retains its planar conformation.30,75 To elucidate the possible
influence of all these factors on the computed interactions between the QPAs and hNQO1, a
variety of receptors were defined and evaluated. All the QPAs tested in the kinetic assays were
docked in the active site of hNQO1. In addition, the QPA amine derivatives, QN-Me-COOH and
Qn-pr-NH-COOH, were also docked in the active site of hNQO1with the aim of predicting their
position and binding energy because of the lack of kinetic data for them.
• FAD (Oxidized) versus FADH2 (Reduced).
The outcome solutions from docking the quinone analogs in different receptors, having
the active site FAD or FADH2 as cofactor, were examined. For this, we compared the results
from receptor 1 versus receptor 2, receptor 3 versus receptor 4, and receptor 5 versus receptor 6.
In all cases, the positions of the quinones were the same. The only slight difference was the
energy score. For the lowest energy score a slight increase of 0.6 kJ·mol–1 was observed for the
outcome solution of the receptor containing FAD versus the receptor containing FADH2 and for
the best prediction energy the increase was of 0.8 kJ·mol–1.
• Interface Radius of 6 Å versus Interface Radius of 8 Å.
The binding conformations of the quinone analogs were examined where the only
difference was the interface radius of the active site. We compared receptor 1 versus receptor 3
and receptor 2 versus receptor 4. In this case, the orientation of the quinone analogs in all the
receptors mentioned above were the same, and the outcome solution with the lowest score
energy for the duroquinone in each receptor differ by only 1 kJ·mol–1.

85
• Defining Active Site (Reference Ligand versus Sphere).
The binding conformations of the quinone analogs were examined by defining the active
site differently. In the case of receptor 3 and 4, the ligand bound to the enzyme was used as
reference ligand (duroquinone) and had an interface radius of 8 Å defined from its position. In
the case of receptor 5 and 6, the nitrogen N5 from the cofactor FAD or FADH2 was used as the
sphere center and had an interface radius of 8.5 Å defined from it. We compared receptor 3
versus receptor 5 and receptor 4 versus receptor 6. In these scenarios, the outcome with the
lowest score and the best prediction differ in their orientations only for duroquinone but not for
the other quinone analogs. However, the outcome for the lowest energy value and the one
associated with the best orientation is different for all of the quinones. The lower energy score is
smaller by 1 kJ·mol–1 in the receptors where the active site is defined by the 8.5 Å radius sphere.
The best prediction corresponds to the quinone located deeper in the receptors 5 and 6. In this
case the energy is 0.6 kJ·mol–1 lower than in receptors 3 and 4. We conclude that in this case for
quinone analogs, even though there is a difference in score energy, this difference is minimal and
does not affect the outcome. Therefore, there is no apparent effect of active site definition on
quinone positions or score energies.
After comparing all the receptors, we observed that there is no effect of the oxidation
state of the cofactor or of the interface radius in the docking outcomes. There is little influence
on the docking solutions when the active site was defined in different ways. While the observed
difference in the docking outcomes was major for duroquinone, the rest of the quinone analogs
were unaffected. In Figures A.5 and A.6 are represented the lower score frame of QBr-COOH
(representative example of outcomes for all of the quinone analogs) in each of the receptors, and
its corresponding poseview so as to help to visually support the conclusions made above. These
conclusions are also based on data in Table A.2 that contains the lowest score energies for QBr-
COOH in all the receptors.

86
The docking solutions of receptor 1 were used to compare the quinone analogs among
themselves, and those outcomes are an accurate representation of what happened in all the
receptors, Figure 3.2.
Figure 3.2. Structural frames of FlexX-docked quinones in the active site of hNQO1. Stick display in all the frames, FAD (color by atom type; carbon atoms colored in cyan), amino acids (color by atom type, carbon atoms colored in purple) and docked-quinones (color by atom type, carbon atoms in pink): (A) QBr-COOH, (B) QH-COOH, (C) QMe-COOH, (D) QMeO-COOH, (E) QdiMeO-COOH, (F) Q'-COOH, (G) QnogemMe-COOH, (H) QMe-ETA, (I) Q(Me-N)-COOH, and (J) Q(n-pr-NH)-COOH.
C D
E F
G H
B A

87
Figure 3.2 continued.
It was observed that QBr-COOH, QH-COOH and QMe-COOH all lay parallel to the
isoalloxazine ring of the FAD cofactor, but the carbon site of the quinone for the possible
hydride transfer is different due to the slight variance in the binding orientation with respect to
FAD. In the case of the methoxy and amine quinone derivatives, they do not bind as tightly as
the other quinone analogs. The obvious possible explanation for this is that the bulky
substituents on the ring need more space, thereby preventing these analogs from venturing as
deeply into the active site. Other research groups reported in the past that a bulky amine at 2-
position of the quinone ring for indolequinones and quinolinequinones, decreased tremendously
the reduction rate of these compounds with hNQO1 making them not a good substrate for this
enzyme.46,47,49
Furthermore, the theoretical binding energies from these docking outcomes were used in
an attempted correlation with the experimental binding affinities. The experimental binding
energies were calculated using the free energy equation ΔG = RTlnK,63 so as to plot |ΔG
(experimental)| versus |ΔG (theoretical)|. To our disappointment, there was no clear correlation
between these values (Figure A.7). However, this is not surprising based on the controversy that
exist in the literature about whether or not docking binding energies can be correlated with
experimental reactivity.35,53-55,77 In addition, other attempts were made to correlate reactivity
with the information extracted from the docking outcomes. The only correlation observed was
the one between the log (atom distance) and the log (kcat/Km) as seen in Figure 3.3. The atom
distance corresponds to the distance between the closer atom on the quinone ring and the N5
I J

88
atom of FAD. This correlation indicates that the closer the atoms on the quinone are to receive a
hydride from the N5 of FAD, the more reactive the quinone derivative will be with hNQO1.
Based on this observation, the reactivity of the amine derivatives with hNQO1 should be similar
to the one observed for the methoxy analogs.
Energy results for the more accurate score of each quinone and the distance from N5 of
the FAD center in hNQO1 to the possible hydride transfer atoms of the quinone substrates78 are
presented in Table 3.2. It can be deduced that the hydride transfer for most of the quinones will
be accepted by the carbon atom, except in the case of the quinones containing methoxy groups
where the orientation favors a hydride transfer to the carbonyl oxygen. In the case of the amine-
quinone derivatives, no conclusion can be made because the preferred site for Q(N-Me)-COOH is
the oxygen and the preferred site for Q(n-pr-NH)-COOH is the carbon.
Table 3.2. Energy score and distance from N5 of FAD to the possible hydride transfer atoms. Atoms closer in distance to N5 are highlighted in red.
Quinone Score (kJ·mol–1) d [N5-C](Å) d [N5-C=O](Å) d [N5-O](Å)
QBr-COOH - 25.2018 3.25 3.47 3.58
QH-COOH - 24.0028 3.40 4.11 4.50
QMe-COOH -26. 4276 3.58 3.54 3.71
QMeO-COOH -20.3317 3.83 3.90 3.50
QdiMeO-COOH -28.3849 4.05 4.05 3.68
Q’-COOH -26.9646 3.18 3.81 3.92
QnogemMe-COOH -25.8435 3.22 3.49 3.68
QMe-ETA -28.4801 3.43 3.73 3.81
Q(N-Me)-COOH -24.8434 3.95 3.90 3.45
Q(n-pr-NH)-COOH -20.9808 3.68 4.36 4.32

89
Figure 3.3. Correlation between the log (distance of the closer atom on the quinone ring with respect to N5 of FAD) and the log (kcat/Km).
Superimposed images of the quinones containing trimethyl-lock motif (Figure A.2),
quinones with the trimethyl-lock motif present and absent (Figure A.3) and quinones differing on
the molecule charge (Figure A.4), were prepared to see if there was any correlation between the
kinetic results and the docking studies. In Figure A.2, it was found that QBr-COOH holds the
deepest location into the active site, whereas QMeO-COOH penetrates the least deep. These
observations are in accordance with the kinetic data for these quinone series. In Figure A.3,
QnogemMe-COOH is the closest to the FAD and QMe-COOH the one located further from the
isoalloxazine ring. These observations agree with the order of reactivity of these compounds
with hNQO1. In Figure A.4, the longer chain present in the QMe-ETA permits the quinone to
accede to a deeper location in the active site of the enzyme. This could be the cause for the
increase of 22 µmol·min–1·mg–1 in maximum velocity for the QMe-ETA.
y = -0.0237x + 0.5699 R² = 0.8742
0.49
0.5
0.51
0.52
0.53
0.54
0.55
0.56
0.57
0 0.5 1 1.5 2 2.5 3 3.5
Log
(ato
m d
ista
nce)
Log (kcat/Km)
QdiMeO-COOH
QMeO-COOH
QMe-COOH
QMe-ETA QH-COOH
QBr-COOH
Q'-COOH
QnogemMe-COOH

90
3.4 Conclusions
In conclusion, we studied the reduction of eight quinone derivatives by human
recombinant NQO1 using a 96-well microplate enzyme assay and obtained kinetic parameters
Km and Vmax having excellent reproducibility. Minor alterations in structure resulted in
significant changes in the kinetic parameters; for example QBr-COOH is much more active at a
low concentration than is QMe-COOH, and so is the case for QMe-COOH versus QMeO-COOH,
and QMeO-COOH versus QdiMeO-COOH. QBr-COOH appears to be the preferred substrate
among the quinones containing the trimethyl-lock system based on its higher kcat/Km value of
133 min–1·µM–1. It is also notable that sterics seems to predominate over electronic effects
among the trimethyl-lock series, an outcome similar in nature for the benzoquinone mustards.48,51
As far as the best substrate in Table 3.1, the quinone without the geminal methyls is the most
efficient of all with the highest product formation at small concentration of reactant (kcat/Km =
853 min–1·µM–1). This conclusion guides us to believe that the presence of the trimethyl-lock
affects the geometry of the quinone ring, which has somewhat of an effect on the interaction of
the quinone with the active site of the enzyme.
The docking studies completed on ten quinone derivatives suggested that small
modifications of the quinone core alter the ability of the quinone to be reduced by the enzyme,
results that are in agreement with those of indolequinones.56 Based on the kinetic and modeling
studies with the QPAs, hNQO1 can accommodate a range of quinones having characteristics
binding affinities. The unsuccessful correlation between experimental binding energy versus
theoretical binding energy makes us think that, in order to quantitatively analyze the influence of
a functional group in the quinone core, experimental assays are required. However, we were
able to qualitatively visualize the different positions of the quinone trimethyl-lock series in the
active site, and our results are in qualitative agreement with the experimental binding values
(strongest toward weakest QBr > QH > QMe > QMeO). In the same manner, we obtained the same

91
qualitative correlation for quinones either containing or lacking the trimethyl-lock (QnogemMe > Q’
> QMe). Lastly, docking and kinetics studies revealed that the presence of a longer side chain
attached to the quinone (i.e. QMe-ETA versus QMe-COOH) can cause the quinone core to
penetrate deeper into the active site. This suggest that addition of spacers to the quinone
derivatives79 may increase quinone-enzyme binding and perhaps the enzyme rate of conversion.
The combination of the experimental kinetic and theoretical docking data support our
predictions: changing functional groups on the quinone ring affects how deep the quinone is
located in the active site of the enzyme, and this difference in position has consequences on the
binding affinity and on the hydride transfer rate. Overall, this analysis will enrich the knowledge
for simple quinones and hNQO1 interactions, providing valuable information for the design of
enzyme triggerable systems.
3.5 References
(1) Andresen, T. L.; Jensen, S. S.; Jorgensen, K., Advanced Strategies in Liposomal Cancer Therapy: Problems and Prospects of Active and Tumor Specific Drug Release. Prog. Lipid Res. 2005, 44 (1), 68-97.
(2) Asche, C., Antitumour Quinones. Mini-Rev. Med. Chem. 2005, 5 (5), 449-467.
(3) de Groot, F. M. H.; Damen, E. W. P.; Scheeren, H. W., Anticancer Prodrugs for Application in Monotherapy: Targeting Hypoxia, Tumor-Associated Enzymes, and Receptors. Curr. Med. Chem. 2001, 8 (9), 1093-1122.
(4) Jaffar, M.; Abou-Zeid, N.; Bai, L.; Mrema, I.; Robinson, I.; Tanner, R.; Stratford, I. J., Quinone Bioreductive Prodrugs as Delivery Agents. Curr. Drug Delivery 2004, 1, 345-350.
(5) Rooseboom, M.; Commandeur, J. N. M.; Vermeulen, N. P. E., Enzyme-Catalyzed Activation of Anticancer Prodrugs. Pharmacol. Rev. 2004, 56 (1), 53-102.
(6) Chen, Y.; Hu, L. Q., Design of Anticancer Prodrugs for Reductive Activation. Med. Res. Rev. 2009, 29 (1), 29-64.

92
(7) Davis, S. C.; Szoka, F. C., Cholesterol Phosphate Derivatives: Synthesis and Incorporation into a Phosphatase and Calcium-Sensitive Triggered Release Liposome. Bioconjugate Chem. 1998, 9 (6), 783-792.
(8) Davidsen, J.; Vermehren, C.; Frokjaer, S.; Mouritsen, O. G.; Jorgensen, K., Drug Delivery by Phospholipase a(2) Degradable Liposomes. Int. J. Pharm. 2001, 214 (1-2), 67-69.
(9) Jorgensen, K.; Davidsen, J.; Mouritsen, O. G., Biophysical Mechanisms of Phospholipase A2 Activation and Their Use in Liposome-Based Drug Delivery. FEBS Lett. 2002, 531 (1), 23-27.
(10) Davidsen, J.; Jorgensen, K.; Andresen, T. L.; Mouritsen, O. G., Secreted Phospholipase a(2) as a New Enzymatic Trigger Mechanism for Localised Liposomal Drug Release and Absorption in Diseased Tissue. Biochim. Biophys. Acta 2003, 1609 (1), 95-101.
(11) Meers, P., Enzyme-Activated Targeting of Liposomes. Advanced Drug Delivery Reviews 2001, 53 (3), 265-272.
(12) Sarkar, N.; Banerjee, J.; Hanson, A. J.; Elegbede, A. I.; Rosendahl, T.; Krueger, A. B.; Banerjee, A. L.; Tobwala, S.; Wang, R. Y.; Lu, X. N.; Mallik, S.; Srivastava, D. K., Matrix Metalloproteinase-Assisted Triggered Release of Liposomal Contents. Bioconjugate Chem. 2008, 19 (1), 57-64.
(13) Banerjee, J.; Hanson, A. J.; Gadam, B.; Elegbede, A. I.; Tobwala, S.; Ganguly, B.; Wagh, A. V.; Muhonen, W. W.; Law, B.; Shabb, J. B.; Srivastava, D. K.; Mallik, S., Release of Liposomal Contents by Cell-Secreted Matrix Metalloproteinase-9. Bioconjugate Chem. 2009, 20 (7), 1332-1339.
(14) Reigan, P.; Colucci, M. A.; Siegel, D.; Chilloux, A.; Moody, C. J.; Ross, D., Development of Indolequinone Mechanism-Based Inhibitors of Nad(P)H : Quinone Oxidoreductase 1 (Nqo1): Nqo1 Inhibition and Growth Inhibitory Activity in Human Pancreatic Mia Paca-2 Cancer Cells. Biochemistry 2007, 46 (20), 5941-5950.
(15) Ernster, L., Dt-Diaphorase - a Historical Review. Chem. Scripta 1987, 27A, 1-13.
(16) Ernster, L.; Navazio, F., Soluble Diaphorase in Animal Tissues. Acta Chem. Scand. 1958, 12 (3), 595-595.
(17) Siegel, D.; Reigan, P.; Ross, D., One- and Two-Electron-Mediated Reduction of Quinones: Enzymology and Toxicological Implications. Biotechnology: Pharmaceutical Aspects 2008, 9, 169-197.

93
(18) Winski, S. L.; Koutalos, Y.; Bentley, D. L.; Ross, D., Subcellular Localization of Nad(P)H : Quinone Oxidoreductase 1 in Human Cancer Cells. Cancer Res. 2002, 62 (5), 1420-1424.
(19) Villalba, J. M.; Navarro, F.; Arroyo, A.; Martin, S. F.; Bello, R. I.; de Cabo, R.; Burgess, J. R.; Navas, P., Protective Role of Ubiquinone in Vitamin E and Selenium-Deficient Plasma Membranes. Biofactors 1999, 9 (2-4), 163-170.
(20) Ernster, L., Dt Diaphorase. Methods Enzymol. 1967, 10, 309-317.
(21) Nakamura, M.; Hayashi, T., One-Electron and 2-Electron Reduction of Quinones by Rat-Liver Subcellular-Fractions. J. Biochem.-Tokyo 1994, 115 (6), 1141-1147.
(22) Siegel, D.; McGuinness, S. M.; Winski, S. L.; Ross, D., Genotype-Phenotype Relationships in Studies of a Polymorphism in Nad(P)H : Quinone Oxidoreductase 1. Pharmacogenetics 1999, 9, 113-121.
(23) Sreerama, L.; Hedge, M. W.; Sladek, N. E., Identification of a Class 3 Aldehyde Dehydrogenase in Human Saliva and Increased Levels of This Enzyme, Glutathione S-Transferases, and Dt-Diaphorase in the Saliva of Subjects Who Continually Ingest Large Quantities of Coffee or Broccoli. Clin. Cancer Res. 1995, 1 (10), 1153-1163.
(24) Reicks, M. M.; Appelt, L. C., Soy Induces Phase Ii Enzymes but Does Not Inhibit Dimethylbenz[a]Anthracene-Induced Carcinogenesis in Female Rats. J. Nutr. 1999, 129 (10), 1820-1826.
(25) Cresteil, T.; Jaiswal, A. K., High-Levels of Expression of the Nad(P)H-Quinone Oxidoreductase (Nqo1) Gene in Tumor-Cells Compared to Normal-Cells of the Same Origin. Biochem. Pharmacol. 1991, 42 (5), 1021-1027.
(26) Fitzsimmons, S. A.; Workman, P.; Grever, M.; Paull, K.; Camalier, R.; Lewis, A. D., Reductase Enzyme Expression across the National Cancer Institute Tumor Cell Line Panel: Correlation with Sensitivity to Mitomycin C and E09. J. Natl. Cancer Inst. 1996, 88 (5), 259-269.
(27) Siegel, D.; Franklin, W. A.; Ross, D., Immunohistochemical Detection of Nad(P)H : Quinone Oxidoreductase in Human Lung and Lung Tumors. Clin. Cancer Res. 1998, 4 (9), 2065-2070.
(28) Siegel, D.; Ross, D., Immunodetection of Nad(P)H : Quinone Oxidoreductase 1 (Nqo1) in Human Tissues. Free Radical Biol. Med. 2000, 29 (3-4), 246-253.

94
(29) Jamieson, D.; Wilson, K.; Pridgeon, S.; Margetts, J. P.; Edmondson, R. J.; Leung, H. Y.; Knox, R.; Boddy, A. V., Nad(P)H : Quinone Oxidoreductase1 and Nrh : Quinone Oxidoreductase 2 Activity and Expression in Bladder and Ovarian Cancer and Lower Nrh : Quinone Oxidoreductase 2 Activity Associated with an Nqo2 Exon 3 Single-Nucleotide Polymorphism. Clin. Cancer Res. 2007, 13 (5), 1584-1590.
(30) Faig, M.; Bianchet, M. A.; Talalay, P.; Chen, S.; Winski, S.; Ross, D.; Amzel, L. M., Structures of Recombinant Human and Mouse Nad(P)H : Quinone Oxidoreductases: Species Comparison and Structural Changes with Substrate Binding and Release. Proc. Natl. Acad. Sci. U. S. A. 2000, 97 (7), 3177-3182.
(31) Li, R.; Bianchet, M. A.; Talalay, P.; Amzel, L. M., The Three-Dimensional Structure of Nad(P)H:Quinone Reductase, a Flavoprotein Involved in Cancer Chemoprotection and Chemotherapy: Mechanism of the Two-Electron Reduction. Proceedings of the National Academy of Science 1995, 92, 8846-8850.
(32) Faig, M.; Bianchet, M. A.; Winski, S.; Hargreaves, R.; Moody, C. J.; Hudnott, A. R.; Ross, D.; Amzel, L. M., Structure-Based Development of Anticancer Drugs: Complexes of Nad(P)H : Quinone Oxidoreductase 1 with Chemotherapeutic Quinones. Structure 2001, 9 (8), 659-667.
(33) Winski, S. L.; Faig, M.; Bianchet, M. A.; Siegel, D.; Swann, E.; Fung, K.; Duncan, M. W.; Moody, C. J.; Amzel, L. M.; Ross, D., Characterization of a Mechanism-Based Inhibitor of Nad(P)H: Quinone Oxidoreductase 1 by Biochemical, X-Ray Crystallographic, and Mass Spectrometric Approaches. Biochemistry 2001, 40 (50), 15135-15142.
(34) Asher, G.; Dym, O.; Tsvetkov, P.; Adler, J.; Shaul, Y., The Crystal Structure of Nad(P)H Quinone Oxidoreductase 1 in Complex with Its Potent Inhibitor Dicoumarol. Biochemistry 2006, 45 (20), 6372-6378.
(35) Nolan, K. A.; Doncaster, J. R.; Dunstan, M. S.; Scott, K. A.; Frenkel, A. D.; Siegel, D.; Ross, D.; Barnes, J.; Levy, C.; Leys, D.; Whitehead, R. C.; Stratford, I. J.; Bryce, R. A., Synthesis and Biological Evaluation of Coumarin-Based Inhibitors of Nad(P)H: Quinone Oxidoreductase-1 (Nqo1). J. Med. Chem. 2009, 52 (22), 7142-7156.
(36) Danson, S.; Ward, T. H.; Butler, J.; Ranson, M., Dt-Diaphorase: A Target for New Anticancer Drugs. Cancer Treatment Reviews 2004, 30 (5), 437-449.
(37) Colucci, M. A.; Moody, C. J.; Couch, G. D., Natural and Synthetic Quinones and Their Reduction by the Quinone Reductase Enzyme Nqo1: From Synthetic Organic Chemistry to Compounds with Anticancer Potential. Org. Biomol. Chem. 2008, 6 (4), 637-656.

95
(38) Ong, W.; Yang, Y. M.; Cruciano, A. C.; McCarley, R. L., Redox-Triggered Contents Release from Liposomes. J. Am. Chem. Soc. 2008, 130 (44), 14739-14744.
(39) Volpato, M.; Abou-Zeid, N.; Tanner, R. W.; Glassbrook, L. T.; Taylor, J.; Stratford, I.; Loadman, P.; Jaffar, M.; Phillips, R. M., Chemical Synthesis and Biological Evaluation of a Nad(P)H:Quinone Oxidoreductase-1-Targeted Tripartite Quinone Drug Delivery System. Mol. Cancer Ther. 2007, 6 (12), 3122-3130.
(40) Moody, C. J.; Maskell, L.; Blanche, E. A.; Colucci, M. A.; Whatmore, J. L., Synthesis and Evaluation of Prodrugs for Anti-Angiogenic Pyrrolylmethylidenyl Oxindoles. Bioorg. Med. Chem. Lett. 2007, 17 (6), 1575-1578.
(41) Anusevicius, Z.; Sarlauskas, J.; Cenas, N., Two-Electron Reduction of Quinones by Rat Liver Nad(P)H : Quinone Oxidoreductase: Quantitative Structure-Activity Relationships. Arch. Biochem. Biophys. 2002, 404 (2), 254-262.
(42) Cenas, N.; Anusevicius, Z.; Nivinskas, H.; Miseviciene, L.; Sarlauskas, J., Structure-Activity Relationship in Two-Electron Reduction of Quinones. Methods Enzymol. 2004, 382, 258-277.
(43) Zhou, Z. G.; Fisher, D.; Spidel, J.; Greenfield, J.; Patson, B.; Fazal, A.; Wigal, C.; Moe, O. A.; Madura, J. D., Kinetic and Docking Studies of the Interaction of Quinones with the Quinone Reductase Active Site. Biochemistry 2003, 42 (7), 1985-1994.
(44) Beall, H. D.; Murphy, A. M.; Siegel, D.; Hargreaves, R. H. J.; Butler, J.; Ross, D., Nicotinamide Adenine-Dinucleotide (Phosphate)Quinone Oxidoreductase (Dt-Diaphorase) as a Target for Bioreductive Antitumor Quinones - Quinone Cytotoxicity and Selectivity in Human Lung and Breast-Cancer Cell-Lines. Mol. Pharmacol. 1995, 48 (3), 499-504.
(45) Phillips, R. M., Bioreductive Activation of a Series of Analogues of 5-Aziridinyl-3-Hydroxymethyl-1-Methyl-2-[1h-Indole-4,7-Dione] Prop-Beta-En-Alpha-Ol (Eo9) by Human Dt-Diaphorase. Biochem. Pharmacol. 1996, 52 (11), 1711-1718.
(46) Beall, H. D.; Winski, S.; Swann, E.; Hudnott, A. R.; Cotterill, A. S.; O'Sullivan, N.; Green, S. J.; Bien, R.; Siegel, D.; Ross, D.; Moody, C. J., Indolequinone Antitumor Agents: Correlation between Quinone Structure, Rate of Metabolism by Recombinant Human Nad(P)H : Quinone Oxidoreductase, and in Vitro Cytotoxicity. J. Med. Chem. 1998, 41 (24), 4755-4766.
(47) Swann, E.; Barraja, P.; Oberlander, A. M.; Gardipee, W. T.; Hudnott, A. R.; Beall, H. D.; Moody, C. J., Indolequinone Antitumor Agents: Correlation between Quinone Structure

96
and Rate of Metabolism by Recombinant Human Nad(P)H : Quinone Oxidoreductase. Part 2. J. Med. Chem. 2001, 44 (20), 3311-3319.
(48) Fourie, J.; Oleschuk, C. J.; Guziec, F.; Guziec, L.; Fiterman, D. J.; Monterrosa, C.; Begleiter, A., The Effect of Functional Groups on Reduction and Activation of Quinone Bioreductive Agents by Dt-Diaphorase. Cancer Chemother. Pharmacol. 2002, 49 (2), 101-110.
(49) Fryatt, T.; Pettersson, H. I.; Gardipee, W. T.; Bray, K. C.; Green, S. J.; Slawin, A. M. Z.; Beall, H. D.; Moody, C. J., Novel Quinolinequinone Antitumor Agents: Structure-Metabolism Studies with Nad(P)H : Quinone Oxidoreductase (Nqo1). Bioorg. Med. Chem. 2004, 12 (7), 1667-1687.
(50) Newsome, J. J.; Swann, E.; Hassani, M.; Bray, K. C.; Slawin, A. M. Z.; Beall, H. D.; Moody, C. J., Indolequinone Antitumour Agents: Correlation between Quinone Structure and Rate of Metabolism by Recombinant Human Nad(P)H : Quinone Oxidoreductase. Org. Biomol. Chem. 2007, 5 (10), 1629-1640.
(51) Begleiter, A.; El-Gabalawy, N.; Lange, L.; Leith, M. K.; Guziec, L. J.; Guziec Jr, F. S., A Model for Nad(P)H:Quinoneoxidoreductase 1 (Nqo1) Targeted Individualized Cancer Chemotherapy. Drug Target Insights 2009, 4, 1-8.
(52) Skelly, J. V.; Sanderson, M. R.; Suter, D. A.; Baumann, U.; Read, M. A.; Gregory, D. S. J.; Bennett, M.; Hobbs, S. M.; Neidle, S., Crystal Structure of Human Dt-Diaphorase: A Model for Interaction with the Cytotoxic Prodrug 5-(Aziridin-1-Yl)-2,4-Dinitrobenzamide (Cb1954). J. Med. Chem. 1999, 42 (21), 4325-4330.
(53) Suleman, A.; Skibo, E. B., A Comprehensive Study of the Active Site Residues of Dt-Diaphorase: Rational Design of Benzimidazolediones as Dt-Diaphorase Substrates. J. Med. Chem. 2002, 45 (6), 1211-1220.
(54) Hassani, M.; Cai, W.; Koelsch, K. H.; Holley, D. C.; Rose, A. S.; Olang, F.; Lineswala, J. P.; Holloway, W. G.; Gerdes, J. M.; Behforouz, M.; Beall, H. D., Lavendamycin Antitumor Agents: Structure-Based Design, Synthesis, and Nad(P)H : Quinone Oxidoreductase 1 (Nqo1) Model Validation with Molecular Docking and Biological Studies. J. Med. Chem. 2008, 51 (11), 3104-3115.
(55) Nolan, K. A.; Humphries, M. P.; Barnes, J.; Doncaster, J. R.; Caraher, M. C.; Tirelli, N.; Bryce, R. A.; Whitehead, R. C.; Stratford, I. J., Triazoloacridin-6-Ones as Novel Inhibitors of the Quinone Oxidoreductases Nqo1 and Nqo2. Bioorg. Med. Chem. 2010, 18, 696-706.

97
(56) Phillips, R. M.; Naylor, M. A.; Jaffar, M.; Doughty, S. W.; Everett, S. A.; Breen, A. G.; Choudry, G. A.; Stratford, I. J., Bioreductive Activation of a Series of Indolequinones by Human Dt-Diaphorase: Structure-Activity Relationships. J. Med. Chem. 1999, 42 (20), 4071-4080.
(57) Carrier, N. H. Redox-Active Liposome Delivery Agents with Highly Controllable Stimuli-Responsive Behavior. Ph.D. Dissertation, Louisiana State University, Baton Rouge, LA, 2011.
(58) Osman, A. M.; Boeren, S., Studies on the Dt-Diaphorase-Catalysed Reaction Employing Quinones as Substrates: Evidence for a Covalent Modification of Dt-Diaphorase by Tetrachloro-P-Benzoquinone. Chem.-Biol. Interact. 2004, 147 (1), 99-108.
(59) Harris, D. C., Statistics. In Quantitative Chemical Analysis, 7th ed.; Byrd, M. L., Ed. W. H. Freeman and Company, New York: 2007; p 65.
(60) Cleland, W. W., Statistical Analysis of Enzyme Kinetic Data. Methods Enzymol. 1979, 63, 103-138.
(61) Harris, D. C., Statistics. In Quantitative Chemical Analysis, 7th ed.; Byrd, M. L., Ed. W. H. Freeman and Company, New York: 2007; p 59.
(62) Bohm, H. J., The Computer-Program Ludi - a New Method for the Denovo Design of Enzyme-Inhibitors. J. Comput. Aid. Mol. Des. 1992, 6 (1), 61-78.
(63) Bohm, H. J., The Development of a Simple Empirical Scoring Function to Estimate the Binding Constant for a Protein Ligand Complex of Known 3-Dimensional Structure. J. Comput. Aid. Mol. Des. 1994, 8 (3), 243-256.
(64) Rarey, M.; Wefing, S.; Lengauer, T., Placement of Medium-Sized Molecular Fragments into Active Sites of Proteins. J. Comput. Aid. Mol. Des. 1996, 10 (1), 41-54.
(65) Rarey, M.; Kramer, B.; Lengauer, T.; Klebe, G., A Fast Flexible Docking Method Using an Incremental Construction Algorithm. J. Mol. Biol. 1996, 261 (3), 470-489.
(66) Rarey, M.; Kramer, B.; Lengauer, T., Multiple Automatic Base Selection: Protein-Ligand Docking Based on Incremental Construction without Manual Intervention. J. Comput. Aid. Mol. Des. 1997, 11 (4), 369-384.
(67) Kramer, B.; Rarey, M.; Lengauer, T., Casp2 Experiences with Docking Flexible Ligands Using Flexx. Proteins 1997, 221-225.

98
(68) Kramer, B.; Rarey, M.; Lengauer, T., Evaluation of the Flexx Incremental Construction Algorithm for Protein-Ligand Docking. Proteins 1999, 37 (2), 228-241.
(69) Rarey, M.; Kramer, B.; Lengauer, T., Docking of Hydrophobic Ligands with Interaction-Based Matching Algorithms. Bioinformatics 1999, 15 (3), 243-250.
(70) Bohm, H. J., Ludi - Rule-Based Automatic Design of New Substituents for Enzyme-Inhibitor Leads. J. Comput. Aid. Mol. Des. 1992, 6 (6), 593-606.
(71) Burie, J. R.; Boullais, C.; Nonella, M.; Mioskowski, C.; Nabedryk, E.; Breton, J., Importance of the Conformation of Methoxy Groups on the Vibrational and Electrochemical Properties of Ubiquinones. J. Phys. Chem. B 1997, 101 (33), 6607-6617.
(72) Silverman, J.; Stam-Thole, I.; Stam, C. H., Crystal and Molecular Structure of 2-Methyl-4,5-Dimethoxy Para Quinone (Fumigatin Methyl Ether), C9h10o4. Acta Cryst. B-Struc. 1971, B 27 (Oct15), 1846-1851.
(73) Robitaille, P. M. L.; Robitaille, P. A.; Brown, G. G.; Brown, G. G., An Analysis of the Ph-Dependent Chemical-Shift Behavior of Phosphorus-Containing Metabolites. J. Magn. Reson. 1991, 92 (1), 73-84.
(74) Milstien, S.; Cohen, L. A., Stereopopulation Control .1. Rate Enhancement in Lactonizations of Ortho-Hydroxyhydrocinnamic Acids. J. Am. Chem. Soc. 1972, 94 (26), 9158-9165.
(75) Cavelier, G.; Amzel, L. M., Mechanism of Nad(P)H : Quinone Reductase: Ab Initio Studies of Reduced Flavin. Proteins 2001, 43 (4), 420-432.
(76) Deller, S.; Macheroux, P.; Sollner, S., Flavin-Dependent Quinone Reductases. Cell Mol. Life Sci. 2008, 65 (1), 141-160.
(77) Nolan, K. A.; Timson, D. J.; Stratford, I. J.; Bryce, R. A., In Silico Identification and Biochemical Characterization of Novel Inhibitors of Nqo1. Bioorg. Med. Chem. Lett. 2006, 16 (24), 6246-6254.
(78) Carlson, B. W.; Miller, L. L., Mechanism of the Oxidation of Nadh by Quinones - Energetics of One-Electron and Hydride Routes. J. Am. Chem. Soc. 1985, 107 (2), 479-485.

99
(79) Tranoy-Opalinski, I.; Fernandes, A.; Thomas, M.; Gesson, J. P.; Papot, S., Design of Self-Immolative Linkers for Tumour-Activated Prodrug Therapy. Anti-Cancer Agent Me 2008, 8 (6), 618-637.

100
CHAPTER 4
QUINONE TRIGGER-BASED LIPIDS FOR FORMING ENZYME-RESPONSIVE LIPOSOMES AND THEIR RESPONSE TOWARD HNQO1 ASSAY CONDITIONS
4.1 Introduction
In general, quinones have been applied to different systems with the aim of improving
therapeutic responses in the area of targeting cancer, such is the case for antitumor compounds
and prodrugs; both being activated by reductive enzymes.1-3 The McCarley research group went
a step further from prodrugs and designed a quinone-based liposome system to be specifically
activated by the human reductive enzyme NAD(P)H:quinone oxidoreductase type-1 (hNQO1),
which is over-expressed in certain solid tumors,4-7 with the objective of adding more deliverable
drug units per delivery carrier. Such liposome systems have been proved by the McCarley group
to open by chemical reduction under bench-top conditions.8 However, these liposomes still need
to be assayed against the human enzyme NQO1 for the development of enzyme-responsive
liposomes. Initial information was extracted from the characterization of trimethyl-lock quinone
derivatives by cyclic voltammetry (chapter 2), enzyme assays and docking (chapter 3). With
such knowledge in hand, it was expected that contents release would occur for quinone-based
liposomes (Q-liposomes) upon hNQO1 activation (reduction) of the quinone headroup to the
hydroquinone, and as a result, destabilization of the liposome bilayer would lead to cargo
release, Scheme 4.1. In order to clearly demonstrate liposome opening through this enzyme
mechanism, first proper control experiments needed to be done wherein in the dye-containing
liposomes are examined in the sole presence of bovine serum albumin (BSA), reduced nicotine
adenine dinucleotide (NADH), and hNQO1, common components of the NQO1 assay.9 Those
control experiments will provide knowledge on the interaction between quinone-liposome
systems and hNQO1 assay components.

101
Scheme 4.1. Proposed enzyme-responsive liposome system.
4.2 Experimental Section
4.2.1 Materials
Potassium dihydrogen phosphate (KH2PO4, Fluka 60219), dipotassium hydrogen
phosphate (K2HPO4, Fisher P288), potassium chloride (KCl, Sigma P9541) and potassium
hydroxide pellets (KOH, Mallinckrodt) were used to make the buffer. Recombinant human
enzyme NAD(P)H:quinone oxidoreductase type 1 and type 2 (rhNQO1 and rhNQO2 ),
nicotinamide adenine dinucleotide reduced (β-NADH) and bovine serum albumin (BSA) were
purchased from Sigma Aldrich (D1315, Q0380, N8129, A3294). Triton X-100 (> 99% pure,
Sigma T8787) was also purchased from Sigma Aldrich. Calcein (85% pure, Acros Organics)
was purchased from Fisher Scientific. 1,2-dioleoyl-sn-glycero-3-phosphoethanolamine (DOPE),
1,2-dioleoyl-sn-glycero-3-phosphoethanolamine-N-[methoxy(polyethyleneglycol)-2000]
(PEG2000-DOPE), 1,2-dioleoyl-sn-glycero-3-phosphocholine (DOPC), and cholesterol (CHO)
were purchased from Avanti Polar Lipids and used without further purification. Sephadex Fine
G-50 was purchased from GE Healthcare. NORM-JECT syringes were purchased from Fisher
Scientific. Nanopure water was obtained from a Nanopure Diamond Barnstead system (18.2
MΩ·cm). Q-DOPE syntheses and characterizations were published previously.10 The
Over-expressed in some tumors
hNQO1
O
O
R1
R2 R3
Lipid
O
Quinone-liposome
OH
OH
R1
R2 R3
Lipid
O
Activated-liposome
O
OH
R1
R2 R3
O
Inverted Micelles
Lactone
CargoAssembly
View
Molecular View

102
instrument used was a Perkin-Elmer LS 55 Fluorescence Spectrometer with a PTP-1
Fluorescence Peltier System and PCB 1500 Water Peltier System (PerkinElmer, Waltham, MA).
4.2.2 Calcein-loaded Liposome Preparation
Liposomes were prepared using a modified version of the well-known lipid thin-film and
extrusion method.11,12 Around 20 mL of pH 7.1 0.1M phosphate buffer (PB)/0.1 M KCl was
placed under argon to degas. 1–3 mg of quinone-DOPE (taken out of the freezer 20 min before
weighing) was dissolved in a minimal amount of chloroform (approximately 1 mL). Depending
on the liposome system to be prepared, appropriate amounts of PEG2000-DOPE, DOPC, or
cholesterol were weighed, and subsequently dissolved in certain volume of chloroform to reach
the desired concentration for later addition to the Q–DOPE solution. Then, the solution was
transferred into a 10-mL (14/20) ground joint test tube. Chloroform was removed by rotary
evaporation for 15 min, and a thin film layer was formed at the bottom of the tube. The lipid
film was further dried under high vacuum for 1 hour. While the lipid was drying, a 40 mM
calcein solution in degassed buffer was prepared. Approximately 248 mg of calcein and 70 mg
of potassium hydroxide were added into a vial followed by addition of 8 mL of degassed pH 7.1
0.1 M PB/0.1 M KCl buffer solution. The mixture was sonicated to help dissolve the solids,
yielding an orange solution. Titration with KOH solution (KOH pellets and pH 7.1 0.1 M PB/0.1
M KCl buffer) gave the desired pH of 7.1. The calcein solution was transferred to a 10-mL
volumetric flask and filled with degassed buffer to the calibration mark. Dried lipids were
hydrated in 1 mL of calcein solution by vortexing the mixture for 30 seconds and allowed to
stand every 2 min for a total of 30 min. The hydrated lipids went through six-freeze thaw cycles
using an acetone/dry ice bath and a warm water-bath. At this point, an Avanti Mini-Extruder
(Avanti Polar Lipids, Alabaster, AL) was assembled and rinsed with buffer and then with calcein
solution before injection of the lipid solution into the extruder. A total of 19 extrusions were
performed at room temperature (22±2 °C) using one 100-nm diameter pore Whatman

103
Nucleopore polycarbonate track-etched membrane. Free calcein was separated from liposome-
encapsulated calcein by column centrifugation method, as follows 100–250 µL of solution was
added to a 3-mL syringe with glass-cotton frit, packed with Sephadex Fine G-50 and then
centrifuged for 3 min at 500 x g. Solutions of liposome-encapsulated calcein were stored in an
amber vial under argon and then placed in the refrigerator at 8 °C for subsequent experiments.
Liposome-encapsulated calcein solutions are stable for up to 5 days.
4.2.3 Characterization of Calcein-loaded Liposomes
Liposome sizes (diameters) were measured using dynamic light scattering from
backscattered light intensities (173°, 633-nm red laser) at 25 °C in a Zetasizer Nano ZS (Malvern
Instruments, Worcestershire, U. K.) particle analyzer. No significant size differences were found
previously between calcein-loaded liposomes and calcein-free liposomes.8 Liposome charge was
obtained by measuring the zeta potential at 25 °C in a folded capillary zeta potential cell using a
Smoluchowski model.
4.2.4 Stability and Calcein Release Experiments
10 µL of calcein-loaded liposomes and 990 µL of pH 7.1 0.1 M PB/0.1 M KCl buffer
solution were added to a 1-cm quartz cuvette, and an absorbance scan was performed at room
temperature from 200 to 600 nm in a Varian Cary 50 Bio UV-Visible Spectrophotometer. The
peak at 497 nm corresponds to the encapsulated calcein, and its absorbance ranged from 0.06 to
0.1 a.u. depending on the liposome system. The peak at 264.9 nm corresponded to the QMe
headgroup absorbance, when it was equal to 0.55 a.u., meant that the lipid concentration was 100
µM based on a ɛ265 = 5500 M–1 for the QMe headgroup.13 A ratio between this value and the
absorbance value measured for a particular experiment containing QMe-DOPE gave the
corresponding amount of liposome solution needed to have 100 µM liposome in a 3-mL volume.
In these liposome stability experiments, different assay components were present in the 4-sided
transparent cuvette by the time the fluorescent experiment start. All fluorescence intensity

104
experiments were performed at 25 °C on a Perkin-Elmer LS 55 Fluorescence Spectrometer with
a PTP-1 Fluorescence Peltier System and PCB 1500 Water Peltier System. The excitation
wavelength was λex = 490 nm, and the emission wavelength was λem = 515 nm, both with a slit
width of 2.5 nm. Data was acquired every 1 min with a 0.1 second integration time; the total
experimental time varied from 1 hour to 24 hours. To avoid detector saturation, two neutral
density filters (ND 0.3 and ND 0.5, Omega Optics, Brattleboro, VT) were placed inside the
instrument so as to reduce the total transmission to 16% of the original intensity. The percent of
calcein release was calculated as follows:
% 𝐿𝑒𝑎𝑘𝑎𝑔𝑒 = (𝐹𝑡−𝐹0)(𝐹100−𝐹0)
∗ 100 Equation 4.1
F0 is the intensity value that corresponds to the point before addition of the assay component
(BSA, NADH, hNQO1, dithionite, liposomes) where there is a 0% leakage. Ft corresponds to
the fluorescence intensity observed at the point in time after addition of the assay component.
F100 is the fluorescence intensity observed after addition of 15 µL of 30% (v/v) Triton X-100 that
ensures lysing of the liposomes for release of all calcein.
4.2.4.1 Bovine Serum Albumin
When BSA was tested with the different liposome systems, the concentration of
liposomes was calculated as described in Section 4.2.4. BSA solutions were made using a 10-
mL volumetric flask containing pH 7.1 0.1 M PB/0.1 M KCl and 0.7 mg or 7 mg of BSA,
corresponding to a 1 µM or 10 µM BSA solutions. The experiment started by addition of
liposome solution to the already present BSA solution in the cuvette or the other way around. In
both cases the same result was observed, reaffirming that the addition order had no effect on the
outcome. Fluorescence at 515 nm was recorded upon addition of either component.
4.2.4.2 Reduced Nicotine Adenine Dinucleotide
When NADH was tested with the different liposome systems, the concentration of
liposomes was calculated as described in Section 4.2.4. NADH solutions were made using a 10-

105
mL volumetric flask containing pH 7.1 0.1 M PB/0.1 M KCl and 7.25 mg of NADH,
corresponding to a 1 mM solution. 300 µL of 1 mM NADH solution were added to the cuvette
and fluorescence as a function of time was recorded.
4.2.4.3 Human NAD(P)H:Quinone Oxidoreductase Type 1 (hNQO1) and Type 2 (hNQO2)
The reaction started when 300 µL of hNQO1 solution were added to the liposome
solution in the 4-sided transparent cuvette. The amount of enzyme used in the experiment was
calculated based on hNQO1 enzyme kinetics assays carried out previously on QMe-COOH.
Enzyme solutions were prepared from a 50 µL frozen enzyme aliquot (2 mg·mL–1) added to 275
µL of pH 7.1 0.1 M PB/0.1 M KCl buffer to yield a 5 µM solution. For inhibition experiments,
599 µL of pH 7.1 0.1 M PB/0.1 M KCl buffer containing NADH (100 µM) and ES936 (30 µM)
were added to the hNQO1 enzyme (50 µL frozen aliquot), and this solution was incubated at
room temperature for 30 min prior to its addition to the 4-sided transparent cuvette. For heat
inactivation of hNQO1, the enzyme was heated at 85 °C for 25 min, and then 300 µL were added
to the liposome solution. hNQO2 experiments were performed as described for hNQO1 but
using an enzyme concentration of 2.5 µM. Fluorescence at 515 nm was recorded upon addition
of either component
4.2.4.4 Sodium Dithionite
Around 15 mL of buffer was purged with argon for 20 min. The appropriate amount of
liposome solution and degassed buffer were mixed to yield a total volume of 3 mL and then
added to a 4-sided cuvette with a screw-cap septum; the solution was purged with argon for 10
min. The cuvette was taken to the room where the fluorescence instrument is located, and the
experiment was started. Approximate 5.3 mg of dithionite was added to an amber-septum vial
and then purged with argon for 1 min. To the degassed vial containing dithionite, 1 mL of
degassed buffer was added. The oxygen-free dithionite solution was taken to the fluorometer
room and an appropriate amount of this solution was injected into the cuvette using a 50-µL

106
Gastight syringe (Hamilton, Reno, NV). After injection, the cuvette was shaken, and then the
time-dependent fluorescence was recorded.
4.3 Results and Discussion
4.3.1 Stability and Calcein Release for Q-DOPE Liposome Systems
4.3.1.1 Liposomes Composed of 100% QMe-DOPE
QMe-DOPE liposomes have been extensively studied in the McCarley group, and their
contents release curves were reported previously upon addition of dithionite.8,10,13 Therefore,
there was an imminent curiosity to see how they will behave under hNQO1 assay conditions.
The appropriate amounts of QMe-DOPE liposome, NADH and BSA solutions were calculated as
outlined in Section 4.2. The absorbance spectrum of 100% QMe-DOPE liposomes is presented in
Figure 4.1. In this spectrum is clearly observed the quinone headgroup peak (λmax = 264.9 nm)
used to calculate the liposome concentration as well as the necessary value for the encapsulated
calcein peak (λmax = 497 nm) to avoid detector saturation.
Figure 4.1. UV-vis absorbance spectrum of 100% QMe-DOPE liposomes in pH 7.1 0.1 M PB/0.1 M KCl at room temperature. λmax = 264.9 nm corresponds to the QMe headgroup and λmax = 497 nm corresponds to the encapsulated calcein.
The first experiment intended to verify if the presence of NADH, an hNQO1 electron
donor during the ping-pong mechanism,9 has any impact on the liposome stability. In Figure 4.2
0
0.1
0.2
0.3
0.4
0.5
0.6
200 300 400 500 600
Abs
orba
nce
Wavelength (nm)
264.9 nm
497 nm
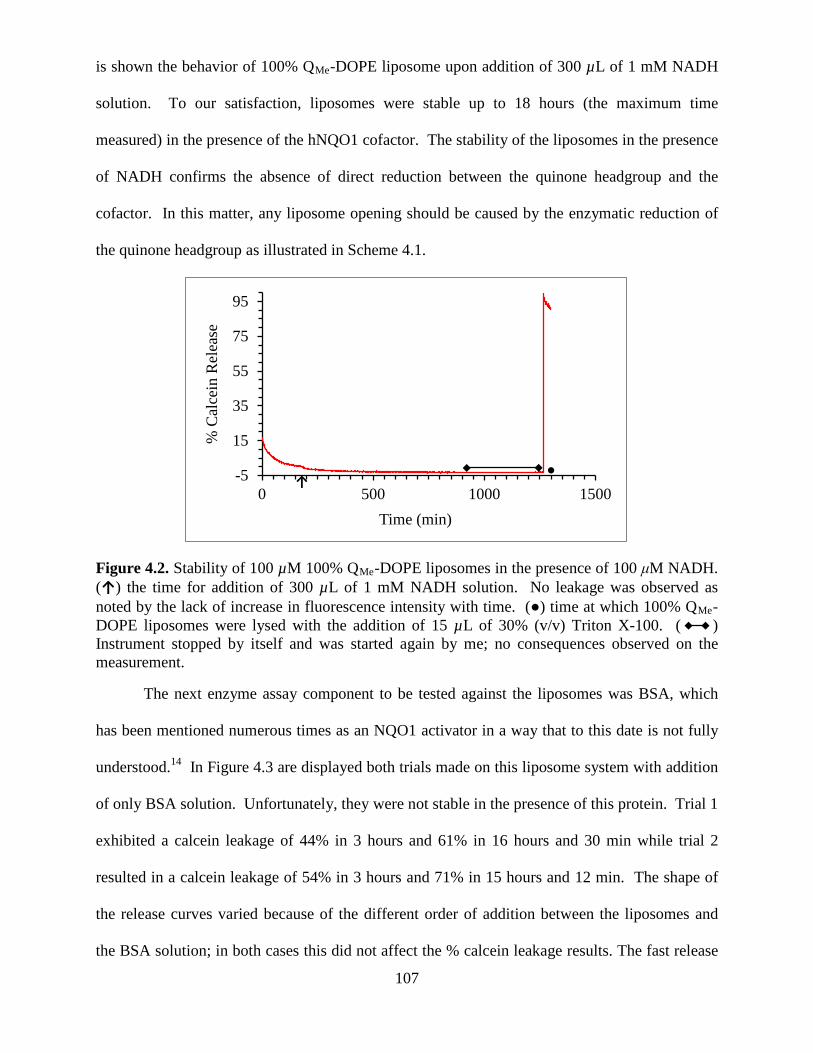
107
is shown the behavior of 100% QMe-DOPE liposome upon addition of 300 µL of 1 mM NADH
solution. To our satisfaction, liposomes were stable up to 18 hours (the maximum time
measured) in the presence of the hNQO1 cofactor. The stability of the liposomes in the presence
of NADH confirms the absence of direct reduction between the quinone headgroup and the
cofactor. In this matter, any liposome opening should be caused by the enzymatic reduction of
the quinone headgroup as illustrated in Scheme 4.1.
Figure 4.2. Stability of 100 µM 100% QMe-DOPE liposomes in the presence of 100 μM NADH. (↑) the time for addition of 300 µL of 1 mM NADH solution. No leakage was observed as noted by the lack of increase in fluorescence intensity with time. (●) time at which 100% QMe-DOPE liposomes were lysed with the addition of 15 µL of 30% (v/v) Triton X-100. ( ) Instrument stopped by itself and was started again by me; no consequences observed on the measurement.
The next enzyme assay component to be tested against the liposomes was BSA, which
has been mentioned numerous times as an NQO1 activator in a way that to this date is not fully
understood.14 In Figure 4.3 are displayed both trials made on this liposome system with addition
of only BSA solution. Unfortunately, they were not stable in the presence of this protein. Trial 1
exhibited a calcein leakage of 44% in 3 hours and 61% in 16 hours and 30 min while trial 2
resulted in a calcein leakage of 54% in 3 hours and 71% in 15 hours and 12 min. The shape of
the release curves varied because of the different order of addition between the liposomes and
the BSA solution; in both cases this did not affect the % calcein leakage results. The fast release
-5
15
35
55
75
95
0 500 1000 1500
% C
alce
in R
elea
se
Time (min)
↓ ●

108
rate of contents for the 100% QMe-DOPE system took us by surprise based on the previous
knowledge of the interaction of liposomes with BSA solutions.
Figure 4.3. Instability of 100 µM 100% QMe-DOPE liposomes in the presence of 0.007% BSA. (↑) the time for addition of 300 µL of 0.07% BSA solution into liposome solution. (↑) the addition time for 100% QMe-DOPE liposomes into 0.007% BSA solution. (●) time at which 100% QMe-DOPE liposomes were lysed with the addition of 15 µL of 30% (v/v) Triton X-100.
Kim and co-workers described that egg phosphatidylcholine (PC) liposomes had a percent
leakage of ca. 13% in 5 hours and ca. 18% in 10 hours when incubated with approximate 8 µM
BSA solution (in TES buffer pH 7.4) at 37 °C.15 In addition, Guo and Szoka depicted their
liposome system (DSPE-PEG/DOPE 1:9) to have a leakage of 13% in 4 hours and 20% in 12
hours in the presence of 75% of fetal serum albumin (in pH 7.4 0.05 M PB/0.1 M NaCl).16
Because of the instability of the 100% QMe-DOPE liposomes toward the protein BSA, other
liposome formulations were investigated with the objective of finding the system that would be
assay against hNQO1.
4.3.1.2 Liposomes Composed of 97% QMe-DOPE/3% PEG2000-DOPE
Based on the previous results with 100% QMe-DOPE liposomes, the liposome
formulation was adjusted by including 3% of a lipid attached to poly(ethylene glycol), PEG-
DOPE in the mixture. It is well known that PEG lipids stabilize liposomes containing PEGs of
2,000 MW with respect to non-specific protein absorption and disruption. Due to the properties
0
20
40
60
80
100
0 200 400 600 800 1000 1200
% C
alce
in R
elea
se
Time (min)
T1T2
↓
● ●
71% Release 61% Release

109
of PEG lipids, long-circulation liposomes, known as “Stealth Liposomes,” have helped improved
the therapeutic efficiency of liposomes as drug delivery carriers with reported circulatory half-
lives of up to 45 hours.17,18 QMe-DOPE, BSA, NADH and hNQO1 solutions were prepared as
described in Section 4.2. PEG2000-DOPE was obtained from Avanti Polar Lipids and dissolved
in an appropriate amount of chloroform previous to its addition to chloroform solutions of QMe-
DOPE solution. The absorbance spectrum of 97% QMe-DOPE/3% PEG2000-DOPE liposomes is
presented in Figure 4.4 and look exactly as the one in Figure 4.1. Thus, as expected, the addition
of PEG2000-DOPE did not introduce extra peak that could interfere with the fluorescence
experiments. The quinone headgroup peak as well as the encapsulated calcein peak is observed
as seen previously for 100% QMe-DOPE liposomes. The new formulation was tested with BSA
to see its impact on liposome stability. In Figure 4.5 is shown the behavior of 97% QMe-
DOPE/3% PEG2000-DOPE liposomes upon addition of BSA solution. Even with 3%
polyethylene glycol in the liposome formulation, the liposomes were not stable when they came
in contact with BSA. The calcein leakage was 59% in 3 hours and 77% in 15 hours and 45 min.
Figure 4.4. UV-vis absorbance spectrum of 97% QMe-DOPE/3% PEG2000-DOPE liposomes in pH 7.1 0.1 M PB/0.1 M KCl at room temperature. λmax = 264.9 nm corresponds to the QMe headgroup and λmax = 497 nm corresponds to the encapsulated calcein.
0
0.1
0.2
0.3
0.4
0.5
0.6
200 300 400 500 600
Abs
orba
nce
Wavelength (nm)
264.9 nm
497 nm

110
Figure 4.5. Instability of 100 µM 97% QMe-DOPE/3% PEG2000-DOPE liposomes in the presence of 0.007% BSA. (↑) the time for addition of 300 µL of 0.07% BSA solution into liposome solution. (●) time at which 97% QMe-DOPE/3% PEG2000-DOPE liposomes were lysed with the addition of 15 µL of 30% (v/v) Triton X-100.
At this point, two hypotheses can be presented for the way that BSA interacts with the Q-DOPE
liposomes: 1) the attraction of BSA to the liposomes is based on surface-charge interactions
or/and 2) the attraction of BSA to the liposomes is based on hydrophobic interactions between
the protein and the lipid bilayer. Hypothesis 1 is less feasible based on the fact that BSA is a
negatively charged protein at pH 7.1 (isoelectric point between 4.5–4.9)19-21 and the liposomes
also present a highly negative surface charge (Table 4.1), thus, electrostatic interactions at pH 7.1
should be minimal or none. Sweet and Zull indicated that other factors, besides electrostatic
interactions, are involved in the interaction of BSA with phospholipid membranes.21 The same
authors later stated that electrostatic interactions between negatively charged membranes and
BSA would be more probably near or below the isoelectric point of BSA (4.5–4.9).19 In
addition, Kim and co-workers came to the conclusion that BSA attacks the lipid bilayer whether
it is at the inner or at the outer phase of the bilayer and induces leakage of the entrapped
materials.15 Therefore, it is more probable that BSA caused the release of calcein from the
liposomes by penetrating into the lipid bilayer. The observations that Sweet and Zull found for
-5
15
35
55
75
95
0 200 400 600 800 1000 1200
% C
alce
in R
elea
se
Time (min)
●
↓
77% Release

111
their systems19 made me think of the possibility that hNQO1, with an isoelectric point of 8.91,22
could have electrostatic interactions with our negative liposomes and induce leakage of contents
by a different mechanism that the one proposed on Figure 4.1. Therefore, the 97% QMe-
DOPE/3% PEG2000-DOPE liposomes were evaluated in the presence of only hNQO1.
Figure 4.6. Instability of 100 µM 97% QMe-DOPE/3% PEG2000-DOPE liposomes in the presence of 0.5 μM hNQO1. (↑) the time for addition of 300 µL of 5 µM hNQO1 solution into liposome solution. (●) time at which 97% QMe-DOPE/3% PEG2000-DOPE liposomes were lysed with the addition of 15 µL of 30% (v/v) Triton X-100.
Upon inspection of Figure 4.6, a calcein release of 80% was observed in 70 min and 91%
in 2 hours and 36 min after exposure of 97% QMe-DOPE/3% PEG2000-DOPE liposomes to
hNQO1. In fact, the calcein release rate provoked by hNQO1 was faster than the one caused by
BSA. Such a difference in the release rate could be a consequence of the apparent different
mechanisms for the proteins acting on the liposomes. Human NQO1 seems to interact by surface
charge attractions that would disrupt the liposomes (faster release), while on the other hand, BSA
seems to interact by penetrating the lipid bilayer (slower release).
At this moment, the attention was focused on the fact that the liposome opened by the
sole presence of the enzyme by a path different from the one proposed in Scheme 4.1. In this
regard, another experiment using hNQO1 and NADH was performed to see if the rate of leakage
-5
15
35
55
75
95
0 100 200 300 400
% C
alce
in R
elea
se
Time (min)
↓
● 91% Release

112
was increased from the results obtained in Figure 4.6. The addition of NADH provides the
necessary component for the enzyme to act through its ping-pong mechanism.9
Figure 4.7. Instability of 100 µM 97% QMe-DOPE/3% PEG2000-DOPE liposomes in the presence of 100 μM NADH and 0.5 µM hNQO1. (↑) the addition time for 300 µL of 5 µM hNQO1 solution into liposome/NADH solution. (●) time at which 97% QMe-DOPE/3% PEG2000-DOPE liposomes were lysed with the addition of 15 µL of 30% (v/v) Triton X-100.
Figure 4.8. Overlap of the calcein release curves for 100 µM 97% QMe-DOPE/3% PEG2000-DOPE liposomes in the presence of 0.5 µM hNQO1 (red line) and 100 µM 97% QMe-DOPE/3% PEG2000-DOPE liposomes containing 100 µM NADH in the presence of 0.5 µM hNQO1 (blue line). (↑) the addition time for 300 µL of 5 µM hNQO1 solution into liposome/NADH solution. (●) time at which 97% QMe-DOPE/3% PEG2000-DOPE liposomes were lysed with the addition of 15 µL of 30% (v/v) Triton X-100. Times were offset to compare the curves.
-5
15
35
55
75
95
0 100 200 300 400
% C
alce
in L
eaka
ge
Time (min)
-5
15
35
55
75
95
0 100 200
% C
alce
in R
elea
se
Time (min)
hNQO1hNQO1 and NADH
●
↓
85% Release
↓
● ●

113
In Figure 4.7 is displayed the behavior of 97% QMe-DOPE/3% PEG2000-DOPE liposomes
in the presence of NADH and hNQO1, showing minimal difference with respect to Figure 4.6.
In fact, both curves can be almost overlapped as shown in Figure 4.8.
The instability of 97% QMe-DOPE/3% PEG2000-DOPE liposomes in the presence of
bovine serum albumin and hNQO1 lead me to investigate more liposome formulations with the
aim of finding one that is stable under hNQO1 assay conditions.
4.3.1.3 DOPC Liposomes
The new liposome formulation described in this section is devoid of the QMe-DOPE lipid;
no quinone headgroup is present in this liposome system. In that way, I could investigate how
much the presence of the QMe headgroup affected liposome leakage when they came in contact
with BSA or hNQO1. Unfortunately, DOPE lipids do not form stable liposomes at pH 7.1,23,24
therefore, DOPC lipids where used instead. DOPC has a similar structure to DOPE, with the
difference being the polar group as illustrated in Figure 4.9; therefore, the fluidity of the bilayer
is not changed because the transition temperature of the lipids are very similar (Tm DOPE = –16
°C and Tm DOPC = –20 °C).
HP
-OO
O
NH3+OO
O
O
O
P-O
O
O
N+OH
O
O
O
O
DOPE
DOPC
Figure 4.9. Structure of DOPE and DOPC lipids.
In Figure 4.10 is presented the absorbance spectrum of DOPC liposomes containing
calcein. As can be seen, the quinone peak at 264.9 nm is absent, as expected, and the peak at
497 nm corresponds to the encapsulated calcein. In effect, the encapsulated calcein peak was

114
used to approximate the concentration of this liposome formulation to be 100 µM as it was for
our previous experiments. DOPC liposomes were tested in the presence of BSA and also with
hNQO1.
Figure 4.10. UV-vis absorbance spectrum of DOPC liposomes in pH 7.1 0.1 M PB/0.1 M KCl at room temperature. The peak of λmax = 497 nm corresponds to the encapsulated calcein.
In Figure 4.11 is shown the stable behavior of DOPC liposomes with BSA for almost 17
hours. The lack of interaction between BSA and DOPC liposomes, lead me to believe that the
QMe headgroup played an important role in liposome leakage. In the previous section, I referred
to BSA as a protein that interacts with liposomes through the lipid bilayer; it could happen that in
the QMe-DOPE liposome systems, the hydrophobic quinone mediated the interaction between
BSA and the liposome membrane, permitting the protein to penetrate the QMe-DOPE liposome
system.
In Figure 4.12 is displayed the stability of DOPC liposomes in the presence of hNQO1
for approximately 15 hours. The absence of interaction between DOPC liposomes and hNQO1
could be credited to two things: 1) the almost neutral surface charge of DOPC liposomes (Table
4.1) and/or 2) the absence of the QMe headgroup in the liposome formulation. The first one
would definitely decrease any electrostatic interaction that the positively charged enzyme could
have with the slightly negative charge liposomes, and the second one would lead me to the
0
0.1
0.2
0.3
200 300 400 500 600
Abs
orba
nce
Wavelength (nm)
497 nm

115
option that hNQO1could just embrace the quinone headgroup of the liposomes inducing bilayer
destabilization and liposome leakage.
Figure 4.11. Stability of 100 µM DOPC liposomes in the presence of 0.007% BSA. (↑) the addition time for 300 µL of 0.07% BSA solution into liposome solution. No leakage was observed as noted by the lack of increase in fluorescence intensity with time. (●) time at which DOPC liposomes were lysed with the addition of 15 µL of 30% (v/v) Triton X-100.
Figure 4.12. Stability of 100 µM DOPC liposomes in the presence of 0.5 µM hNQO1. (↑) the addition time for 300 µL of 5 µM hNQO1 solution into liposome solution. No leakage was observed as noted by the lack of increase in fluorescence intensity with time. (●) time at which DOPC liposomes were lysed with the addition of 15 µL of 30% (v/v) Triton X-100.
The stability of DOPC liposomes toward both proteins proved the fact that QMe
headgroup played a significant role in the instability of Q-DOPE liposomes toward BSA and
hNQO1. For the development of enzyme-responsive liposomes the presence of quinone
-5
15
35
55
75
95
0 200 400 600 800 1000 1200
% C
alce
in R
elea
se
Time (min)
-5
15
35
55
75
95
0 200 400 600 800 1000 1200
% C
alce
in R
elea
se
Time (min) ↓ ●
↓ ●

116
headgroups into the liposome formulation is essential because of the inherent substrate affinity of
hNQO1 towards quinones.9 Therefore, a potential solution for liposome stability is to create
liposomes based on mixtures of QMe-DOPE and DOPC lipids.
4.3.1.4 Liposomes Composed of 90% QMe-DOPE/10% DOPC and 80% QMe-DOPE/20% DOPC
With the intent of finding a stable system that contains QMe-DOPE, two different
formulations that included DOPC were prepared as described in Section 4.2. Those formulations
were intended to decrease the amount of QMe-DOPE and consequently decrease the leakage of
liposomes when they come in contact with BSA or hNQO1. In addition, a calcein release
experiment initiated by chemical reduction using dithionite (which resembles the reduction by
hNQO1) was also performed with the aim to demonstrate that these liposome formulations also
follow the proposed mechanism illustrated in Scheme 4.1. In Figure 4.13 is shown the
absorbance spectrum for 90% QMe-DOPE/10% DOPC and 80% QMe-DOPE/20% DOPC
liposomes. It is observed that both liposome formulations exhibited the peak at 264.9 nm that
corresponds to the quinone head group and the peak at 497 nm that corresponds to the calcein
encapsulated in the liposomes. In Figure 4.14 is revealed the behavior of 90% QMe-DOPE/10%
DOPC and 80% QMe-DOPE/20% DOPC liposomes in the presence of BSA. The 90% QMe-
DOPE/10% DOPC system had a calcein leakage of 40% in 66 min while 80% QMe-DOPE/20%
DOPC liposomes had a calcein leakage of 13% in 3 hours and 31% in 11 hours and 24 min.
Both examples show that decreasing the amount of QMe-DOPE helps to slow down the leakage
process when BSA is present. The reasonable stability observed for 80% QMe-DOPE/20%
DOPC liposomes in the presence of BSA, provides hope for testing the same system with
hNQO1.

117
Figure 4.13. UV-vis absorbance spectrum of 90% QMe-DOPE/10% DOPC (blue line) and 80% QMe-DOPE/20% DOPC (red line) liposomes in pH 7.1 0.1 M PB/0.1 M KCl at room temperature. λmax = 264.9 nm corresponds to the QMe headgroup and λmax = 497 nm corresponds to the encapsulated calcein.
Figure 4.14. Unstable behavior of 100 µM 90% QMe-DOPE/10% DOPC and 100 µM 80% QMe-DOPE/20% DOPC liposomes in the presence of 0.007% BSA. (↑) the time for addition of 300 µL of 0.07% BSA solution into the 90% QMe-DOPE/10% DOPC liposome solution. (↑) the addition time for 80% QMe-DOPE/20% DOPC liposomes into 0.007% BSA solution. (●) time at which 90% QMe-DOPE/10% DOPC and 80% QMe-DOPE/20% DOPC liposomes were lysed with the addition of 15 µL of 30% (v/v) Triton X-100.
In Figure 4.15 is displayed the behavior of 80% QMe-DOPE/20% DOPC liposomes in the
presence of hNQO1. These liposomes experienced a calcein release of 48% in 70 min and 68%
in 3 hours. Although these liposomes are not stable in the sole presence of the enzyme, the rate
of leakage is decreased when compared with the previous liposome formulations that contained
0
0.1
0.2
0.3
0.4
0.5
200 300 400 500 600
Abs
orba
nce
Wavelength (nm)
90%QMe-DOPE/10%DOPC Lipo80%QMe-DOPE/20%DOPC Lipo
-5
15
35
55
75
95
0 100 200 300 400 500 600 700
% C
alce
in R
elea
se
Time (min)
90%QMe-DOPE/10%DOPC Lipo80%QMe-DOPE/20%DOPC Lipo
497 nm
264.9 nm
● ●
↓
31% Release 40% Release

118
QMe-DOPE. The inclusion of DOPC lipids in the liposome formulation resulted in reduced
leakage in an inverse relationship, with more DOPC being present leading to less calcein release.
Figure 4.15. Instability of 100 µM 80% QMe-DOPE/20% DOPC liposomes in the presence of 0.5 µM hNQO1. (↑) the addition time for 300 µL of 5 µM hNQO1 solution into liposome solution. (●) time at which 80% QMe-DOPE/20% DOPC liposomes were lysed with the addition of 15 µL of 30% (v/v) Triton X-100.
After performing the stability experiments, it was important to see how the QMe-
DOPE/DOPC liposomes behave when they are opened by chemical reduction. In that way, I
could predict the time that liposomes will take to open and deliver their cargo by the proposed
mechanism, and see if adding more DOPC lipids to the liposome mixture was feasible. The
calcein release curves for both formulations for sodium dithionite addition are shown in Figure
4.16. Upon introduction of the reducing agent into the liposome solution, a “lag” phase
happened that corresponds to the reduction of the QMe headgroup and its detachment from the
DOPE lipid. Such action initiates a bilayer destabilization (as labeled in Scheme 4.1), and
subsequent opening of the liposome occurred as noticed by the increase in fluorescence intensity.
The 90% QMe-DOPE/10% DOPC liposomes exhibited a lag time of 31 minutes, and
reached a maximum in 20 min, with a total calcein release of 63%. However, the 80%QMe-
DOPE/20% DOPC liposomes experienced a lag time of 38 min and took 3 hours to reach the
maximum with a total calcein release of 55%.
-5
15
35
55
75
95
0 100 200
% C
alce
in R
elea
se
Time (min)
●
↓
68% Release

119
Figure 4.16. Calcein release curves of 100 µM 90% QMe-DOPE/10% DOPC and 100 µM 80% QMe-DOPE/20% DOPC by chemical reduction using 5 eq. of sodium dithionite. (↑) the time for addition of sodium dithionite solution into the 90% QMe-DOPE/10% DOPC liposome solution. (↑) the time for addition of sodium dithionite solution into the 80% QMe-DOPE/20% DOPC liposome solution. (●) time at which 90% QMe-DOPE/10% DOPC and 80% QMe-DOPE/20% DOPC liposomes were lysed with the addition of 15 µL of 30% (v/v) Triton X-100.
The increase in DOPC content from 10% to 20% in the liposome formulation caused the lag time
to rise by 7 minutes and the time to reach maximum contents release to be reached 160 min later.
The important decrease in the rate at which calcein is released required me to take a different
approach for the formulation of QMe-DOPE liposomes, because it was anticipated that the
amount of DOPC content necessary to make the system more stable toward proteins will create
liposomes not suitable for hNQO1 enzyme assay (too slow to open).
4.3.1.5 Liposomes Composed of 70% QMe-DOPE/30% Cholesterol (CHO)
The results in Section 4.3.1.4 directed me to look for a new liposome system that is stable
in the presence of BSA and hNQO1. A review by Pagano and Weinstein published in 1978
described that up to 50% of cholesterol can be added to liposomes to decrease their leakage.25 It
was also mentioned in the literature that the addition of CHO decreases liposome fluidity and
permeability of contents across the membrane.25,26 CHO-containing liposomes were prepared as
described in Section 4.2. In Figure 4.17 is shown the absorbance spectrum for 70% QMe-
DOPE/30% CHO liposomes and as seen previously no unpredicted peaks are present.
-10
10
30
50
70
90
0 50 100 150 200 250
% C
alce
in R
elea
se
Time (min)
90%QMe-DOPE/10%DOPC Lipo80%QMe-DOPE/20%DOPC Lipo
↓ ↓
● ● 63% Release
55% Release
Lag Lag

120
Figure 4.17. UV-vis absorbance spectrum of 70% QMe-DOPE/30% CHO liposomes in pH 7.1 0.1 M PB/0.1 M KCl at room temperature. λmax = 264.9 nm corresponds to the QMe headgroup and λmax = 497 nm corresponds to the encapsulated calcein.
To make sure that CHO does not prevent liposomes from opening, the calcein release
profile of 70% QMe-DOPE/30% CHO liposomes opened by chemical reduction was investigated.
In Figure 4.18 are presented the calcein release curves for 70% QMe-DOPE/30% CHO liposomes
caused by sodium dithionite. Upon introduction of the reducing agent into the liposomes
solution, a “lag” phase is noted where the reduction of the QMe headgroup and its detachment
from the DOPE lipid occurs. Such action initiates bilayer destabilization (as labeled in Scheme
4.1) and opening of the liposome as noticed by the increase in fluorescence intensity. The
current liposome system exhibited a lag time of 27 min and took 12 min to reach the
fluorescence maximum with an average calcein release of 71%. It is interesting to notice that
when cholesterol was included in the mixture, the release of contents happened much faster than
when DOPC was present at the same level in the formulation. In addition, the “lag” phase
differed a little in shape from the one observed for QMe-DOPE/DOPC liposomes in Figure 4.16.
0
0.1
0.2
0.3
0.4
0.5
200 300 400 500 600
Abs
orba
nce
Wavelength (nm)
264.9 nm
497 nm

121
Figure 4.18. Calcein release curves of 100 µM 70% QMe-DOPE/30% CHO by chemical reduction using 5 eq. of sodium dithionite. The arrows (↑ and ↑) depict the time for addition of sodium dithionite solution into the 70% QMe-DOPE/30% CHO liposome solution for each trial. (●) time at which 70% QMe-DOPE/30% CHO liposomes were lysed with the addition of 15 µL of 30% (v/v) Triton X-100.
After confirming that the CHO-containing liposomes opened upon chemical reduction,
stability experiments were performed on these systems. As a rule, the first experiment made on
the new liposome system was to test the integrity of it in the presence of BSA. In Figure 4.19 is
shown the behavior of 70% QMe-DOPE/30% CHO liposomes in the presence of BSA. As it was
expected, calcein leakage was lower than in the other formulations with a 15% in 1 hour and
20% in 3 hours and 10 min. The favorable results with liposomes containing CHO agreed with
the statement previously made on the mechanism of action of cholesterol by other scientists
because its inclusion diminished the penetration of the BSA molecules into the lipid bilayer
resulting in less leakage of liposome contents.26
After the satisfactory behavior of the liposomes with BSA, the next obvious step was to
test them with hNQO1. Displayed in Figure 4.20 is presented the behavior of 70% QMe-
DOPE/30% CHO liposomes with hNQO1. Unfortunately, the enzyme still caused a liposome
leakage of 47% in 1 hour and 61% in 3 hours.
-35
-15
5
25
45
65
85
0 20 40 60 80
% C
alce
in R
elea
se
Time (min)
T1T2
↓ ↓
Lag Lag
● ● 70% Release 72% Release

122
Figure 4.19. Instability of 100 µM 70% QMe-DOPE/30% CHO liposomes in the presence of 0.007% BSA. (↑) the time for addition of liposome solution into the 0.007% BSA solution. (●) time at which 70% QMe-DOPE/30% CHO liposomes were lysed with the addition of 15 µL of 30% (v/v) Triton X-100.
Figure 4.20. Instability of 100 µM 70% QMe-DOPE/30% CHO liposomes in the presence of 0.5 µM hNQO1. (↑) the addition time for 300 µL of 5 µM hNQO1 solution into liposome solution. (●) time at wich 70% QMe-DOPE/30% CHO liposomes were lysed with the addition of 15 µL of 30% (v/v) Triton X-100.
The difference in observed behavior between BSA and hNQO1 with the CHO-liposomes
confirmed the previous hypothesis of the mechanisms in which the proteins interact with the
liposome system. For BSA, it is clear that hydrophobic interactions are the driving force in the
BSA-liposome contact. On the other hand, hNQO1 attacks the liposomes by electrostatic
-5
15
35
55
75
95
0 50 100 150 200 250
% C
alce
in R
elea
se
Time (min)
-5
15
35
55
75
95
0 50 100 150 200 250
% C
alce
in R
elea
se
Time (min)
●
↓
20% Release
61% Release ●
↓

123
interactions or by just embracing the quinone headgroup which causes bilayer destabilization and
liposome leakage.
A series of 3 experiments was performed on 100% QMe-DOPE liposomes to have more
knowledge about the mode of interaction between hNQO1 and the liposomes. The first
experiment corresponds to the interaction of inhibited hNQO1 with the liposomes. 100% QMe-
DOPE liposomes were assayed with 0.25 µM hNQO1 and also with inhibited 0.25 µM hNQO1.
Human NQO1 is known to be completely inhibited by ES936, an inhibitor that alkylates one of
the tyrosine residues in the active site of the enzyme.27,28 The results of UV-vis experiments for
QMe-COOH (quinone headgroup of the QMe-DOPE lipid), hNQO1, NADH and ES936
confirmed the mode of action of ES936, as seen in Figure 4.21. If hNQO1 inhibition prevents
liposome leakage, then it will be clear that the mechanism of action of hNQO1 is the embracing
of the quinone headgroup by the enzyme.
Figure 4.21. UV-vis spectra for hNQO1 assay (A) and hNQO1 inhibition assay (B). A) QMe-COOH and NADH (blue line) and QMe-COOH and NADH and hNQO1 after 1 min (pink line). B) QMe-COOH and NADH (blue line) and QMe-COOH and NADH and hNQO1 after 30 min (pink line), after 1 hour (green line) and after 4 hours (cyan line).
The behavior of 100% QMe-DOPE liposomes with inhibited hNQO1 is shown in Figure
4.22. It is clear that inhibition of hNQO1 by ES936 did not preclude the enzyme from causing a
liposome leakage as noted by the observed 56% release of contents in 2 hours and 3 min, while
54% calcein leakage was seen with the non-inhibited hNQO1.
0
1
2
3
200 300 400 500 600
Abs
orba
nce
Wavelength (nm)
hNQO1 Assay
QMe-COOH + NADHAfter 1 min E added
0
1
2
3
200 300 400 500 600
Abs
orba
nce
Wavelength (nm)
hNQO1 inhibition
QMe-COOH + NADHAfter 30 min inhibited E addedAfter 1h inhibited E addedAfter 4h inhibited E added
A B

124
Figure 4.22. Instability of 100 µM 100% QMe-DOPE liposomes in the presence of 0.25 µM hNQO1 (red line) and 0.25 µM inhibited hNQO1 (blue line). (↑) the addition time for 300 µL of 2.5 µM hNQO1 or inhibited hNQO1 solution into liposome solution. (●) time at which 100% QMe-DOPE liposomes were lysed with the addition of 15 µL of 30% (v/v) Triton X-100.
A second experiment to see if electrostatic interaction was the factor of attraction
between hNQO1 (isoelectric point of 8.91)22 and the 100% QMe-DOPE liposomes was
performed using the human enzyme NQO2 with an isoelectric point of 5.87 that will have a
negative charge under the experimental conditions.22 The protein sequences of hNQO1 and
hNQO2 can be aligned without insertions or deletions, and are 49% identical over their shared
length.29,30 The major differences are that hNQO2 is 43 amino acids shorter than hNQO1 at the
C-terminal domain and 10 amino acids present at the C-terminal domain of hNQO2 have no
sequence homology with the corresponding residues in hNQO1.29,30 Also hNQO2 uses
dihydronicotinamide riboside (NRH) instead of NAD(P)H as an electron donor.29,30 Therefore,
the active sites of hNQO1 and hNQO2, both having the FAD prosthetic group are very similar in
nature. If hNQO2 provokes liposome leakage, then electrostatic interactions would not be the
driving force for the hNQO1-liposome interactions.
In Figure 4.23 is shown the behavior of hNQO2 versus hNQO1 in the presence of 100%
QMe-DOPE liposomes. HNQO1 caused a calcein leakage of 54% in 2 hours and 3 min while
hNQO2 caused a calcein leakage of 37% in the same amount of time. It is clear that hNQO2
-5
15
35
55
75
95
0 50 100 150
% C
alce
in R
elea
se
Time (min)
hNQO1Inhibited hNQO1
●
↓
56% Release 54% Release

125
caused liposome leakage in a very similar manner to that of hNQO1, indicating that the quinone
is the reason why liposomes open in the presence of these enzymes and not surface charge
interactions.
Figure 4.23. Instability of 100 µM 100% QMe-DOPE liposomes in the presence of 0.25 µM hNQO1 (red line) and 0.25 µM hNQO2 (blue line). (↑) the addition time for 300 µL of 2.5 µM hNQO1 or hNQO2 solution into liposome solution. (●) time at which 100% QMe-DOPE liposomes were lysed with the addition of 15 µL of 30% (v/v) Triton X-100.
Figure 4.24. Stability of 100 µM 100% QMe-DOPE liposomes in the presence of 0.25 µM heat inactivated hNQO1. (↑) the addition time for 300 µL of 2.5 µM heat inactivated hNQO1 solution into liposome solution. (●) time at which 100% QMe-DOPE liposomes were lysed with the addition of 15 µL of 30% (v/v) Triton X-100.
The last experiment of the series of 3 performed on the 100% QMe-DOPE liposomes was
heat inactivation of hNQO1 and its behavior with the liposomes. In Figure 4.24 is shown no
-5
15
35
55
75
95
0 50 100 150
% C
alce
in R
elea
se
Time (min)
hNQO1hNQO2
-10
10
30
50
70
90
0 50 100 150
% C
alce
in R
elea
se
Time (min)
↓
●
● 54% Release
37% Release
● ↓

126
content release for Q-DOPE liposomes in the presence of heat-inactivated hNQO1, indicating
that the active site of the enzyme is the one responsible for the calcein leakage from the 100%
QMe-DOPE liposomes. These three experiments performed on 100% QMe-DOPE liposomes
demonstrate that the mechanism of interaction between hNQO1 and quinone-based liposomes is
through the quinone head group.
In summary, after examining all the quinone-based liposome formulations, there is still
the need of a stable system in the sole presence of hNQO1.
4.3.2 DLS and Zeta Potential of Q-DOPE Liposome Systems
Liposome diameters and surface charge were measured for each of the liposome systems
to help me understand the interaction of BSA and hNQO1 with liposomes. In Table 4.1 are
presented the average values of diameter and zeta potential for each system.
In general, the QMe-DOPE liposome systems fall in the expected range of 100–120 nm,
as previously reported in the McCarley group.10,13 DOPC liposomes are almost identical in
diameter to the 100% QMe-DOPE liposomes, with values that overlap considering the error
associated with them. The equal value in diameter between the liposome systems indicates that
the size of the liposomes has no effect on their interaction with the proteins.
Table 4.1 Average diameters and zeta potentials of QMe-DOPE liposome systems. Experiments performed at 25 °C in pH 7.1 0.1M PB/0.1M KCl. Results are the average of 3 determinations ± one standard deviation. aPolydispersity indexes ≤ 0.3 are considered acceptable. bReference 2; pH 7.4 0.05 M PB/0.075 M KCl. cMeasurement done by Dr. Martin Loew.
Liposome System Avg. Diameter (nm) Avg. PDIa Avg. Zeta Potential (mV) 100% QMe-DOPE 123±1 0.06±0.02 –60±3b 97% QMe-DOPE /
3% PEG2000-DOPE 117±1c 0.12±0.01c not measured
100% DOPC 126±3 0.06±0.02 –7±2 90% QMe-DOPE /
10% DOPC 112±1 0.08±0.02 –48±4
80% QMe-DOPE / 20% DOPC 119±1 0.09±0.01 –52±2
70% QMe-DOPE / 30% CHO 119±2 0.20±0.05 –50±3

127
The surface charge values for all the QMe-DOPE liposome systems measured in pH 7.1
0.1 M PB/0.1 M KCl ranged between –44 to –53 mV. The zeta potential of 100% QMe-DOPE
liposome system (–60 mV) was measured by a colleague in 0.05 M PB/0.075 M KCl pH 7.4.10
The surface charge of DOPC was measured to be –7 mV, much less negative than the systems
that included QMe-DOPE. The consistency of negative surface charge in all QMe-DOPE
liposome systems is an indicative of the potent attraction of hNQO1 (isoelectric point 8.91)22 at
pH 7.1 to those liposomes; interaction that is not observed with DOPC liposomes. It also
supports the hypothesis that BSA (isoelectric point 4.5–4.7)19,20 would rather interact with the
QMe-DOPE liposome systems by penetrating into the lipid bilayer (hydrophobic interactions)
than by surface charge interactions.
4.4 Conclusions
Five different liposome formulations containing QMe-DOPE and one containing 100%
DOPC were tested against the common components of an hNQO1 assay. To my disappointment,
none of the formulations were completely stable in the presence of BSA or hNQO1. However,
important conclusions can be made from the results obtained, and they are summarized in Table
4.2. All the liposomes systems had an average diameter between 100 and 130 nm as previously
seen in the McCarley group for similar systems.10 Also, the liposome systems containing QMe-
DOPE lipids experienced a negative surface charge between –44 and –53 mV, while 100%
DOPC liposomes presented an almost neutral surface charge of –7 mV. After examining the
stability experiments, it is clear that the inclusion of the QMe headgroup facilitates the interaction
of BSA with the lipid membrane as seen by the absence of leakage of DOPC liposomes.
Likewise, the interaction of hNQO1 with the liposomes is also mediated by the presence of QMe
headgroup as seen by the different experiments performed on the quinone based liposome
systems. The chemical release profiles of new quinone-based liposome systems were
investigated and different results were seen depending on the nature of the liposome components.

128
The liposomal formulation with 10% DOPC and 90% QMe-DOPE presented a much faster
calcein release rate than the formulation with 20% DOPE and 80% QMe-DOPE (63% in 20 min
versus 55% in 3 hours). From these results I can infer that only a 10% increase in DOPC content
caused significant changes on the mechanism of release of the liposomes. On the other hand, the
inclusion of 30% of cholesterol in the liposome mixture did not decrease the rate of calcein
release (71% in 12 min) but did affect the mechanism of release as concluded by comparing
these release profiles versus the chemical release profile for 100% QMe-DOPE liposomes
performed by a colleague in the McCarley group at pH 7.4 0.05 M PB/0.075 M KCl.13 The
examination of a variety of liposome formulations reflected the important quality of liposome
that it is its versatility to change the outcome by incorporation of different lipids. This versatility
can be explored further with the aim of finding a liposomal formulation that would only open by
the mechanism described in Scheme 4.1.
4.5 References
(1) Asche, C., Antitumour Quinones. Mini-Rev. Med. Chem. 2005, 5 (5), 449-467.
(2) Jaffar, M.; Abou-Zeid, N.; Bai, L.; Mrema, I.; Robinson, I.; Tanner, R.; Stratford, I. J., Quinone Bioreductive Prodrugs as Delivery Agents. Curr. Drug Delivery 2004, 1, 345-350.
(3) Chen, Y.; Hu, L. Q., Design of Anticancer Prodrugs for Reductive Activation. Med. Res. Rev. 2009, 29 (1), 29-64.
(4) Cresteil, T.; Jaiswal, A. K., High-Levels of Expression of the Nad(P)H-Quinone Oxidoreductase (Nqo1) Gene in Tumor-Cells Compared to Normal-Cells of the Same Origin. Biochem. Pharmacol. 1991, 42 (5), 1021-1027.
(5) Siegel, D.; Franklin, W. A.; Ross, D., Immunohistochemical Detection of Nad(P)H : Quinone Oxidoreductase in Human Lung and Lung Tumors. Clin. Cancer Res. 1998, 4 (9), 2065-2070.

129
Table 4.2. Summarized results from calcein release, DLS, and zeta potential experiments performed on QMe-DOPE liposome systems at 25 °C in pH 7.1 0.1 M PB/0.1 M KCl. aReference 2; pH 7.4 0.05 M PB/0.075 M KCl. bMeasurement done by Dr. Martin Loew.
100%QMe-DOPE 97%QMe-DOPE
3%PEG2000 100%DOPC
90%QMe-DOPE 10% DOPC
80%QMe-DOPE 20% DOPC
70%QMe-DOPE 30% CHO
0.007%BSA 50% in 3h 60% in 3h Stable for 17 h 40% in 1h 6 min 13% in 3 h 20% in 3h 10 min
100 µM NADH Stable for 18 h
0.5 µM hNQO1 80% in 1h 10 min Stable for 15 h 48% in 1h 10 min 47% in 1h
0.5 µM hNQO1 100 µM NADH
77% in 1h 10 min
0.25 µM hNQO1 54% in 2h 3 min
0.25 µM hNQO2 37% in 2h 3 min
0.25 µM inhibited hNQO1
56% in 2h 3 min
5 eq. Na2S2O4
31 min lag time
20 min reach max
63% in 20 min
38 min lag time
3h reach max
55% in 3h
27 min lag time
12 min reach max
71% in 12 min
Diameter (nm) 123±1 (n=3) 117±1b (n=3) 126±3 (n=3) 112±1 (n=3) 119±1 (n=3) 119±2 (n=3)
Zeta Pot. (mV) –60±3a (n=3) –7±2 (n=3) –48±4 (n=3) –52±2 (n=3) –50±3 (n=3)

130
(6) Siegel, D.; Ross, D., Immunodetection of Nad(P)H : Quinone Oxidoreductase 1 (Nqo1) in Human Tissues. Free Radical Biol. Med. 2000, 29 (3-4), 246-253.
(7) Jamieson, D.; Wilson, K.; Pridgeon, S.; Margetts, J. P.; Edmondson, R. J.; Leung, H. Y.; Knox, R.; Boddy, A. V., Nad(P)H : Quinone Oxidoreductase1 and Nrh : Quinone Oxidoreductase 2 Activity and Expression in Bladder and Ovarian Cancer and Lower Nrh : Quinone Oxidoreductase 2 Activity Associated with an Nqo2 Exon 3 Single-Nucleotide Polymorphism. Clin. Cancer Res. 2007, 13 (5), 1584-1590.
(8) Ong, W.; Yang, Y. M.; Cruciano, A. C.; McCarley, R. L., Redox-Triggered Contents Release from Liposomes. J. Am. Chem. Soc. 2008, 130 (44), 14739-14744.
(9) Ernster, L., Dt-Diaphorase - a Historical Review. Chem. Scripta 1987, 27A, 1-13.
(10) Carrier, N. H. Redox-Active Liposome Delivery Agents with Highly Controllable Stimuli-Responsive Behavior. Ph.D. Dissertation, Louisiana State University, Baton Rouge, LA, 2011.
(11) Szoka, F.; Papahadjopoulos, D., Comparative Properties and Methods of Preparation of Lipid Vesicles (Liposomes). Annu. Rev. Biophys. Bio. 1980, 9, 467-508.
(12) Avanti Polar Lipids. http://avantilipids.com/.
(13) Forsythe, J. Kinetics and Mechanisms of Release by Redox-Active Liposomes in Drug Delivery. Ph.D. Dissertation, Louisiana State University, Baton Rouge, LA, 2011.
(14) Ernster, L.; Ljunggren, M.; Danielson, L., Dt Diaphorase .1. Purification from Soluble Fraction of Rat-Liver Cytoplasm, and Properties. Biochim. Biophys. Acta 1962, 58 (2), 171-188.
(15) Kim, C.-K.; Kim, H.-S.; Lee, B.-J.; Han, J.-H., Effect of Bovine Serum Albumin on the Stability of Methotrexate-Encapsulated Liposomes. Arch. Pharm. Res. 1991, 14 (4), 336-341.
(16) Szoka, F. C.; Guo, X., Steric Stabilization of Fusogenic Liposomes by a Low-Ph Sensitive Peg-Diortho Ester-Lipid Conjugate. Bioconjugate Chem. 2001, 12 (2), 291-300.
(17) Lasic, D. D.; Needham, D., The “Stealth” Liposome: A Prototypical Biomaterial. Chem. Rev. 1995, 95 (8), 2601-2628.

131
(18) Moghimi, S. M.; Szebeni, J., Stealth Liposomes and Long Circulating Nanoparticles: Critical Issues in Pharmacokinetics, Opsonization and Protein-Binding Properties. Prog. Lipid Res. 2003, 42 (6), 463-478.
(19) Sweet, C.; Zull, J. E., The Binding of Serum Albumin to Phospholipid Liposomes. Biochim. Biophys. Acta 1970, 219, 253-262.
(20) Wilkins, D. J.; Ottewill, R. H., On the Flocculation of Sheep Leucocytes: 1. Electrophoretic Studies. J. Theor. Biol. 1962, 2 (2), 165-175.
(21) Sweet, C.; Zull, J. E., Activation of Glucose Diffusion from Egg Lecithin Liquid Cyrystals by Serum Albumin. Biochim. Biophys. Acta 1969, 173 (1), 94-103.
(22) Phosphositeplus Homepage. http://www.phosphosite.org/proteinAction.do?id=14721.
(23) Hafez, I. M.; Cullis, P. R., Roles of Lipid Polymorphism in Intracellular Delivery. Advanced Drug Delivery Reviews 2001, 47 (2-3), 139-148.
(24) Pak, C. C.; Ali, S.; Janoff, A. S.; Meers, P., Triggerable Liposomal Fusion by Enzyme Cleavage of a Novel Peptide-Lipid Conjugate. Biochim. Biophys. Acta 1998, 1372 (1), 13-27.
(25) Pagano, R. E.; Weinstein, J. N., Interactions of Liposomes with Mammalian Cells. Annu. Rev. Biophys. Bio. 1978, 7, 435-468.
(26) Kim, C.-K.; Park, D.-K., Stability and Drug Release Properties of Liposomes Containing Cytarabine as a Drug Carrier. Arch. Pharm. Res. 1987, 10 (2), 75-79.
(27) Winski, S. L.; Faig, M.; Bianchet, M. A.; Siegel, D.; Swann, E.; Fung, K.; Duncan, M. W.; Moody, C. J.; Amzel, L. M.; Ross, D., Characterization of a Mechanism-Based Inhibitor of Nad(P)H: Quinone Oxidoreductase 1 by Biochemical, X-Ray Crystallographic, and Mass Spectrometric Approaches. Biochemistry 2001, 40 (50), 15135-15142.
(28) Reigan, P.; Colucci, M. A.; Siegel, D.; Chilloux, A.; Moody, C. J.; Ross, D., Development of Indolequinone Mechanism-Based Inhibitors of Nad(P)H : Quinone Oxidoreductase 1 (Nqo1): Nqo1 Inhibition and Growth Inhibitory Activity in Human Pancreatic Mia Paca-2 Cancer Cells. Biochemistry 2007, 46 (20), 5941-5950.

132
(29) Wu, K. B.; Knox, R.; Sun, X. Z.; Joseph, P.; Jaiswal, A. K.; Zhang, D.; Deng, P. S. K.; Chen, S., Catalytic Properties of Nad(P)H:Quinone Oxidoreductase-2 (Nqo2), a Dihydronicotinamide Riboside Dependent Oxidoreductase. Arch. Biochem. Biophys. 1997, 347 (2), 221-228.
(30) Foster, C. E.; Bianchet, M. A.; Talalay, P.; Zhao, Q. J.; Amzel, L. M., Crystal Structure of Human Quinone Reductase Type 2, a Metalloflavoprotein. Biochemistry 1999, 38 (31), 9881-9886.

133
CHAPTER 5
CONCLUSIONS AND OUTLOOK
5.1 Summary
The ultimate goal of this research was the development of an enzyme-responsive
liposome system composed of a fusogenic lipid, DOPE, capped with a quinone headgroup that is
potentially capable of selectively delivering its contents at a desired tumor site. In this system,
the stimulus was the human reductive enzyme NAD(P)H:quinone oxidoreductase type-1
(hNQO1) that is over-expressed in certain tumor tissues.1-4 The hypothesized mechanism
involves the interaction of hNQO1 with the liposomes via initial reduction of the quinone
headgroup (quinone triggers), followed by cyclization of the corresponding hydroquinone
moiety, subsequent bilayer destabilization, and contents release. Characterization of the quinone
trigger groups was important to elucidate the electronic properties, kinetic profiles, and active
site orientation of these triggers before attachment to the lipid that would be used to form
liposomes.
An electrochemical technique named cyclic voltammetry was used to determine the
reduction potential and cyclization rates of electrochemically-active quinones in aqueous media.
It was found that naked quinones (no propionic acid handle) are electrochemically
quasireversible systems because the difference in the anodic and cathodic peak potentials
deviates from the ideal value of 30 mV. It was also observed that benzoquinone was the naked
quinone easiest to be reduced (most positive reduction potential), whereas in the substituted
benzoquinone series, addition of electron-withdrawing groups resulted in more positive
reduction potentials, while addition of electron-donating groups resulted in more negative
potentials. In the propionic acid quinone series, most of the systems were found to be electron-
transfer irreversible with peak separations over 200 mV. As observed for the naked quinones,
propionic acid quinones with electron-withdrawing groups displayed a less negative reduction

134
potential, while the inverse happened when electron-donating groups were present. It was also
elucidated that the presence of a propionic acid handle on the quinone moiety made the reduction
of the quinone more difficult (more negative reduction potential), and that difficulty increased as
geminal methyls were added or when the whole trimethyl-lock unit was present. Interestingly,
the nature of the propionic acid handle did not affect the electronic properties of the quinone
derivatives based on the results obtained for QMe-COOH and QMe-ETA. In addition to the
thermodynamic parameters of quinones, the cyclization rate for the disappearance of the
corresponding hydroquinone after quinone reduction was determined. The higher cyclization
rates corresponded to the quinones containing the trimethyl-lock moiety, in particular the ones
with a methyl, an iodine or a bromine group at the 2-position of the quinone ring. Moreover, an
enhancement in the cyclization rate was observed when buffer concentration was increased.
Cyclic voltammetry studies on QMe-COOH at various salt concentrations revealed no change in
the cyclization rate.
Solution-phase enzyme kinetics and molecular docking studies were applied to a variety
of quinone propionic acid derivatives with the aim of establishing quinone-hNQO1 interactions.
These quinone derivatives were divided in three groups: 1) trimethyl-lock quinones varying the
functional group at the 2-position on the quinone, 2) quinones not possessing the trimethyl-lock
unit vs. quinones with the trimethyl-lock unit, and 3) charged versus neutral quinones. In the
first group, it was found that quinones with a hydrogen or halogen group presented higher
affinity and faster turnover rates toward the enzyme, while quinones with an electron-donating
group (methyl or methoxy) presented lower affinity and slower turnover rates. Docking studies
in this group revealed that all quinones laid parallel to the isoalloxazine ring, with a slight
variance in orientation and that the bromine analog was positioned deepest in the enzyme active
site. In the second group, it was clear that quinones with no trimethyl-lock unit presented higher
affinity and good turnover rates. Moreover, QnogemMe-COOH, which is in this group, was the

135
best substrate for hNQO1 among all the quinone derivatives studied. It was found that QnogemMe-
COOH was the one quinone located closest to the isoalloxazine ring in the enzyme active site.
In the third group, no change in binding affinity was observed between quinones. However, the
neutral quinone exhibited a higher turnover rate with respect to the charged quinone.
Superimposed images of these two derivatives exposed that the neutral quinone is located deeper
in the enzyme active site than the charged quinone. In addition, from all the quinone derivatives
analyzed with docking, the preferable atom acceptor for hydride transfer appears to be the carbon
atom (next to the carbonyl on the opposite side of the propionic acid handle) based on the
distance measured from the N5 atom of FAD and the closer atoms in the quinone ring. Docking
studies also unveiled no strong correlation between the theoretical binding energies and the
experimental binding affinities.
Finally, quinone triggers were characterized and ready to use in the design of enzyme-
responsive liposomes. QMe-COOH was the only quinone trigger group used to form a variety of
liposome systems. Stability studies on five quinone-based liposome formulations and one DOPC
liposome formulation in the presence of hNQO1 common assay components were accomplished.
DLS, zeta potential and chemical release curves on the liposome formulations were also
performed. The liposomal formulation containing only QMe-DOPE was stable in the presence of
NADH. None of the quinone-based liposomal formulations designed to date were stable under
the individual presence of BSA or hNQO1. Conversely, liposomes composed of only DOPC
were stable in the presence of BSA and hNQO1. Inclusion of DOPC lipids or cholesterol in the
quinone-based liposome formulation resulted in alterations of their chemical release profiles
compared with the chemical release profile for a 100% QMe-DOPE liposome reported
previously. All quinone-based liposomes had an average diameter between 110 and 124 nm and
a zeta potential between –48 and –60 mV. The diameter of the DOPC liposomes was 126 nm,
and its zeta potential was –7 mV.

136
5.2 Conclusions
The results of this research demonstrated that the electronic properties of quinone
derivatives can successfully be tuned by addition of various functional groups, as well as by
inclusion of structural changes such as a handle. Quinone triggers followed a qualitative trend
where electron-donating groups retarded the turnover rate with respect to hNQO1 while the
opposite happened with the inclusion of electron-withdrawing groups. Docking studies
qualitatively predicted the position of the quinone triggers, and the trend was in agreement with
the kinetic outcomes. The best substrate for hNQO1 corresponds to the quinone located closer to
the isoalloxazine ring of FAD in the active site of hNQO1. All quinone-based liposomes were
destabilized and leaky after addition of BSA or hNQO1. It is believed that the key factor for the
leakage of liposomes is the quinone headgroup. Modifying quinone-based liposomes by
inclusion of other lipid components can result in a formulation able to release its contents in a
controllable manner.
5.3 Outlook
Carving through the last 20 years of literature, it is clear that a great deal of research is
focused on prodrugs and carriers for triggerable drug release. Also there is extensive literature
on the structure-activity relationships between antitumor quinones and NQO1 for the
development of new prodrug systems. Nevertheless, few prodrugs are currently being marketed
and no triggerable drug delivery liposomal system has made it to clinical use.5-9
The detailed information provided in this dissertation on simple quinone triggers could be
useful in the design of new quinone-based prodrugs for fast or slow release as well as for the
development of carriers where combination of both is also possible. However, further studies
need to be performed in order to optimize the quinone-based liposome formulations described in
this research document. The optimized formulation would lead to a system that is stable in the
presence of BSA and hNQO1 (at low concentrations) but unstable at the concentrations were

137
hNQO1 is over expressed in the human body. This ideal situation has a key piece that is still
unknown in the hNQO1 field and corresponds to the quantitative information on the
concentration of hNQO1 in the body.2,10,11 In the absence of that information, it is important to
investigate the behavior of quinone-based liposomes at various hNQO1 concentrations to obtain
a correlation between calcein release rates and hNQO1 activity. Moreover, quinone-based
liposome stability could be increased by: 1) addition of other lipids such of those with higher Tm
values than DOPE (1,2-distearoyl-sn-glycero-3-phosphoethanolamine (DSPE Tm = 74 °C)12 or
1,2-dielaidoyl-sn-glycero-3-phosphoethanolamine (DEPE Tm = 38 °C))12 that could form more
rigid bilayers, 2) reduction of the quinone-DOPE content in the liposomal formulation to
investigate if dilution of the quinone prevent the liposomes from leaking, and 3) attach a positive
charged quinone to decrease the negative surface charge of liposomes.
The optimized triggerable system will selectively release their contents at the desired site,
thus maximizing efficacy and reducing unwanted release on healthy cells. The versatility of
these systems allow them to be loaded with a variety of units such as drugs, probes, genes and
virus for application in drug delivery, cell imaging or gene and virus therapy.
5.4 References
(1) Cresteil, T.; Jaiswal, A. K., High-Levels of Expression of the Nad(P)H-Quinone Oxidoreductase (Nqo1) Gene in Tumor-Cells Compared to Normal-Cells of the Same Origin. Biochem. Pharmacol. 1991, 42 (5), 1021-1027.
(2) Siegel, D.; Franklin, W. A.; Ross, D., Immunohistochemical Detection of Nad(P)H : Quinone Oxidoreductase in Human Lung and Lung Tumors. Clin. Cancer Res. 1998, 4 (9), 2065-2070.
(3) Rooseboom, M.; Commandeur, J. N. M.; Vermeulen, N. P. E., Enzyme-Catalyzed Activation of Anticancer Prodrugs. Pharmacol. Rev. 2004, 56 (1), 53-102.
(4) Awadallah, N. S.; Dehn, D.; Shah, R. J.; Nash, S. R.; Chen, Y. K.; Ross, D.; Bentz, J. S.; Shroyer, K. R., Nqo1 Expression in Pancreatic Cancer and Its Potential Use as a Biomarker. Appl. Immunohistochem. Mol. Morphol. 2008, 16 (1), 24-31.

138
(5) Zhang, L.; Gu, F. X.; Chan, J. M.; Wang, A. Z.; Langer, R. S.; Farokhzad, O. C., Nanoparticles in Medicine: Therapeutic Applications and Developments. Clin. Pharmacol. Ther. 2008, 83 (5), 761-769.
(6) Kaasgaard, T.; Andresen, T. L., Liposomal Cancer Therapy: Exploiting Tumor Characteristics. Expert Opin. Drug Deliv. 2010, 7 (2), 225-243.
(7) Khan, D. R., The Use of Nanocarriers for Drug Delivery in Cancer Therapy. J. Cancer Sci. Ther. 2010, 2 (3), 58-62.
(8) Patterson, A. V.; Saunders, M. P.; Greco, O., Prodrugs in Genetic Chemoradiotherapy. Curr. Pharm. Des. 2003, 9 (26), 2131-2154.
(9) McKeown, S. R.; Cowent, R. L.; Williams, K. J., Bioreductive Drugs: From Concept to Clinic. Clin. Oncol. 2007, 19 (6), 427-442.
(10) Siegel, D.; Ross, D., Immunodetection of Nad(P)H : Quinone Oxidoreductase 1 (Nqo1) in Human Tissues. Free Radical Biol. Med. 2000, 29 (3-4), 246-253.
(11) Siegel, D.; Ryder, J.; Ross, D., Nad(P)H: Quinone Oxidoreductase 1 Expression in Human Bone Marrow Endothelial Cells. Toxicol. Lett. 2001, 125 (1-3), 93-98.
(12) Forsythe, J. Kinetics and Mechanisms of Release by Redox-Active Liposomes in Drug Delivery. Ph.D. Dissertation, Louisiana State University, Baton Rouge, LA, 2011.

139
APPENDIX A: SUPPLEMENTAL INFORMATION
Table A.1. Extinction coefficient values for NADH in a 96-well plate. Experiments performed at 22±2 °C in 0.007% BSA solution.
Trial 1 Trial 2 Trial 3 NADH (µM) Abs. (a.u.) Abs. (a.u.) Abs. (a.u.) Average (a.u) St. Dev.
10 0.0304 0.0192 0.0112 0.0203 0.0096 30 0.1232 0.11105 0.1062 0.1135 0.0088 50 0.1866 0.2258 0.2128 0.2084 0.0200 80 0.3336 0.3412 0.3264 0.3337 0.0074
100 0.3873 0.4078 0.4058 0.4003 0.0113 120 0.4828 0.5258 0.5028 0.5038 0.0215 150 0.597 0.6348 0.598 0.6099 0.0215 200 0.84255 0.8534 0.8306 0.8422 0.0114 250 1.0858 1.10255 1.0726 1.0870 0.0150 300 1.3153 1.3058 1.276 1.2990 0.0205
Figure A.1. Calibration curve for NADH in a 96-well plate. Experiments performed at 22±2 °C in 0.007% BSA solution.
y = 0.00439x - 0.02414 R² = 0.99911
0.0
0.2
0.4
0.6
0.8
1.0
1.2
1.4
0 100 200 300 400
Abs
(a.u
.)
[NADH] (µM)
Calibration Curve NADH in Quartz Microplate
[NADH] vs Abs

140
Figure A.2. Superposition of trimethyl-lock quinones in the active site of hNQO1. Representation of QBr-COOH (sky blue), QH-COOH (magenta), QMe-COOH (yellow), QMeO-COOH (light pink); amino acids (lines display; color by atom type, carbon atoms colored green); Tyr 155, His 161 and FAD (stick display; color by atom type, carbon atoms colored green). The figure was created using PyMOL.
Figure A.3. Superposition of quinones with and without presence of trimethyl-lock in the active site of hNQO1. Representation of QnogemMe-COOH (sky blue), Q’-COOH (magenta), QMe-COOH (yellow); amino acids (lines display; color by atom type, carbon atoms colored green); Tyr 155, His 161 and FAD (stick display; color by atom type, carbon atoms colored green). The figure was created using PyMOL.

141
Figure A.4. Superposition of charged quinone versus neutral quinone in the active site of hNQO1. Representation of QMe-ETA (sky blue), QMe-COOH (magenta); amino acids (lines display; color by atom type, carbon atoms colored green); Tyr 155, His 161 and FAD (stick display; color by atom type, carbon atoms colored green). The figure was created using PyMOL. Table A.2. Associated energies for QBr-COOH when docked in hNQO1 active site. Above is the lowest score energy for each receptor and the components of the Böhm scoring function.
Receptor Score (kJ·mol–1) Match Lipo Ambig Clash Rot 1 -25.2018 -19.7347 -12.0594 -6.8892 3.8815 4.2000 2 -24.7270 -19.0412 -11.8116 -7.0926 3.6185 4.2000 3 -24.1662 -18.5762 -12.2120 -6.9455 3.9675 4.2000 4 -23.6224 -17.8762 -11.8138 -7.4545 3.9220 4.2000 5 -24.1743 -19.7347 -11.2013 -6.7019 3.8636 4.2000 6 -23.6994 -19.0412 -10.9535 -6.9053 3.6006 4.2000
R1 R2

142
Figure A.5. Lowest score frames of QBr-COOH in all the receptors. Representation of QBr-COOH (stick display; color by atom type, carbon atoms colored grey); amino acids and FAD (lines display; color by atom type, carbon atoms colored grey). Dashed purple lines corresponded to hydrophobic interactions.
R3 R4
R5 R6
Receptor 1

143
Receptor 2
Receptor 3
Receptor 4

144
Figure A.6. Poseview frames of QBr-COOH in all the receptors. Representation of a 2D view of the docked pose of QBr-COOH (line display; color by atom type, carbon atoms colored black); amino acids and FAD label in green or structure line display; color by atom type, carbon atoms colored black. Hydrophobic interactions are displayed as green contact curves with only the names of the interacting residues attached to these lines. Dashed lines corresponded to hydrogen bond interactions.
Receptor 5
Receptor 6

145
Figure A.7. Correlation of estimated theoretical and experimental free energies of binding.
Chemical Synthesis and Characterization of QMe-ETA.
Preparation of N-(2-hydroxyethyl)-3-methyl-3-(2,4,5-trimethyl-3,6-dioxocyclohexa-1,4-
dien-1-yl)butanamide (QMe-ETA). The quinone amine derivative was prepared by adding QMe-
NHS1 (150 mg, 0.4328 mmol) into a 25 mL round bottom flask and letting the solid dry under
high vacuum for 15 minutes. Then argon was purged through the flask to have it under inert
atmosphere; the flow was stopped for two minutes to add 4.5 mL of dichloro methane. Continue
argon flow and cooled the mixture to 0 °C. Then add dropwise triethylamine (310 µL, 2.2241
mmol) followed by ethanolamine (40 µL, 0.6647 mmol) using glass syringes. Stopped the argon
flow and sealed the round bottom flask. Let the mixture stir for 4 hours. Reaction was followed
by TLC (3:1:2 DCM/MeOH/Hex) until no QMe-NHS was present. After the reaction was
completed, the mixture was diluted with 50 mL of dichloro methane and washed with 5 % of
sodium bicarbonate (2 X 100 mL). Organic layer was dried over sodium sulfate, and evaporated
to yield 87.8 mg of a yellow solid (75 %).
15
20
25
30
35
15 20 25 30 35
|ΔG
(the
oret
ical
)|
|ΔG (experimental)|
Estimated Free Energy Correlation
QnogemMe-COOH Q'-COOH
QBr-COOH QH-COOH
QMe-ETA
QMe-COOH
QMeO-COOH
QdiMeO-COOH

146
1H NMR (400 MHz, CDCl3): δ 1.44 (s, 6H), 1.95-1.97 (d, 6H), 2.14 (s, 3H), 2.85 (s, 2H), 3.32-
3.33 (q, 2H), 3.65 (t, 2H), 5.82 (s, 1H).
13C NMR (400 MHz, CDCl3): δ 12.13, 12.68, 14.15, 28.98, 38.34, 42.20, 49.14, 62.48, 137.95,
138.09, 143.45, 153.12, 173.06, 187.54, 191.35.
HRMS (ESI+) m/z [M+H]+, calcd = 294.1706 (calcd for C16H24NO4), obsd = 294.1709, 0.9 ppm
error.
Figure A.8. 1H NMR for QMe-ETA (CDCl3, 400 MHz)

147
Figure A.9. 13C NMR for QMe-ETA (CDCl3, 400 MHz)
Figure A.10. High resolution mass spectrum (positive ion, electrospray ionization) for QMe-ETA.
[M+H]+
[M+Na]+ [2M+Na]+
294.1709

148
References
(1) Carrier, N. H. Redox-Active Liposome Delivery Agents with Highly Controllable Stimuli-Responsive Behavior. Ph.D. Dissertation, Louisiana State University, Baton Rouge, LA, 2011.

149
APPENDIX B: PERMISSIONS

150

151

152

153

154

155

156
VITA
Maria Fabiana Mendoza Paris was born in Montevideo, Uruguay. She spent her
elementary, middle and high school years at Escuela Parque Posadas, Liceo 18 and Liceo
Miranda, respectively. She started her studies to be a pharmacist at the Facultad de Quimica in
Montevideo. While she pursued her degree, she obtained a full soccer scholarship to continue
her studies in the U.S.A. She received her Bachelor of Science degree in chemistry with a minor
in biology from Missouri Baptist University in 2005 and graduated cum laude. She enrolled in
the doctoral program in the Department of Chemistry at Louisiana State University in the fall of
2006. In the summer of 2007, she joined the research group of Prof. Robin L. McCarley. The
degree of Doctor of Philosophy will be conferred at the Spring 2012 Commencement.