Identification and characterization of potential compost ...

Characterization of Potential Adverse Health Effects Associated
with Consuming Fish from
Galveston Bay
Brazoria, Chambers, Galveston, and Harris Counties, Texas
2013
Department of State Health Services
Division for Regulatory Services
Policy, Standards, and Quality Assurance Unit
Seafood and Aquatic Life Group
Austin, Texas

2
INTRODUCTION On September 13, 2008, Hurricane Ike made landfall on the north end of Galveston Island, Texas
as a strong Category 2 hurricane.1 The expansive storm surge associated with Hurricane Ike
caused significant flooding spanning over 200 miles of coastline from Galveston Island into
Louisiana.2 Catastrophic flooding occurred along the Texas coastline from Galveston Island to
the Texas-Louisiana border. The Galveston Bay and Sabine Lake estuaries received floodwaters
from some of the most populated and industrialized coastal areas in the United States. Run-off
during the flood and receding storm surge waters contained industrial pollutants, household
chemicals and waste, and sediment from inland areas. Since Hurricane Ike, the Department of
State Health Services (DSHS) Seafood and Aquatic Life Group (SALG) and the Texas Parks and
Wildlife Department (TPWD) Coastal Fisheries Division (CFD) have received many inquiries
from the public regarding the safety of consuming fish from Galveston Bay and the Sabine Lake
estuaries. To this end, the DSHS has not been able to assure the public that fish are safe to eat
following Hurricane Ike. In January 2010, the DSHS SALG acquired project funding through the
Social Services Block Grant to assess the potential health risks associated with consuming fish
from Galveston Bay and the Sabine Lake estuaries post Hurricane Ike.
Description of the Galveston Bay Estuary
Galveston Bay, the largest estuary on the Texas coast (600 square miles or 384,000 acres; 232
miles of shoreline) and the seventh largest in the United States, is a shallow bar-built estuary in a
drowned river delta.3 The average depth of the bay is 7 feet, the maximum non-dredged depth
approximately 10 feet.4 Galveston Bay is composed of four major sub-bays: Galveston Bay,
Trinity Bay, East Bay, and West Bay.5 The Galveston Bay watershed encompasses
approximately 33,000 square miles comprised of three main drainages: the Trinity River
watershed, the San Jacinto River watershed, and the coastal bayou watershed. The Trinity River
basin provides about 51% of the freshwater inflow into Galveston Bay.5
The Galveston Bay watershed includes all or portions of 44 Texas counties; five counties
surround the estuary: Brazoria, Chambers, Galveston, Harris, and Liberty. The watershed also
includes the two largest metropolitan areas in Texas: Houston and Dallas–Fort Worth.4 To lend
perspective to the size of this watershed, note that the city of Houston lies approximately 250
miles south-southeast of Dallas-Fort Worth.
Galveston Bay, Texas’ largest fishery resource, contributes approximately one third of the state=s
commercial fishing income.6 Commercial and recreational fishing on Galveston Bay generates
over one billion dollars per year; over one-half of the state=s expenditures for recreational fishing
go directly or indirectly to Galveston Bay.6 The areas around the Galveston Bay system are also
home to one of the nation’s largest petrochemical and industrial complexes7. Nearly half of all
U.S. petrochemical production occurs in the greater Houston area. The Port of Houston is the
second largest port (by tonnage shipment) in the United States, and is the eighth largest in the
world.8 As a result, industrial and municipal point source discharges contribute to the bay's major
pollution. Non-point source pollution remains the bay's top water quality problem, with much
originating from storm water runoff generated by agricultural, urban, suburban, and rural land
users near the bay. Some 90% of the oil and grease loading, for instance, originate in sub-

3
watersheds with high-density urban land use. Much of the oil and grease flows from the surfaces
of roadways.5
History of DSHS Monitoring of Chemical Contaminants in Fish and Shellfish from the
Galveston Bay Estuary
The United States Environmental Protection Agency’s (USEPA or EPA) National Dioxin Study 9
was a nationwide investigation of 2,3,7,8- tetrachlorodibenzo-p-dioxin (2,3,7,8-TCDD)
contamination of soil, water, sediment, air, and fish. In 1986, as a part of the National Study of
Chemical Residues in Fish (NSCRF - formerly the National Bioaccumulation Study) 10
that grew
out of the USEPA's National Dioxin Study,9 the EPA conducted a one-time nationwide survey of
contaminant residues in fish. In the report of that evaluation of fish-borne contaminants, the EPA
described the presence of dioxin congeners in samples of fish and some shellfish (e.g., blue crab)
from 11 sites within its Region 6. These sites were almost invariably located downstream of
"bleach Kraft" pulp and paper mill discharges.10
In 1990, the Texas Department of Health (TDH)a – in its first detailed evaluation of the Texas
sites reported in the National Dioxin Study 9 to harbor dioxin-contaminated fish or shellfish –
collected 12 fish and composite blue crab samples from the Houston Ship Channel and from
Upper Galveston Bay. The 1990 DSHS study confirmed polychlorinated dibenzofurans (PCDFs)
and polychlorinated dibenzo-p-dioxins (PCDDs) in catfish species and blue crab at
concentrations that could pose a risk to human health. As a result, the TDH issued Fish and
Shellfish Consumption Advisory 3 (ADV-3), a consumption advisory for Upper Galveston Bay.
The advisory covered Upper Galveston Bay to the north of a line connecting Red Bluff Point to
Houston Point (by way of the Five Mile Cut marker) along with the Houston Ship Channel and
its contiguous waters. ADV-3 recommended that adult recreational and/or subsistence fishers
limit consumption of [any species of] catfish and/or blue crab to no more than one eight-ounce
meal per month. In addition, the TDH advised that children whose age is less than 12 years and
women of childbearing age not consume catfish or blue crab from these waters.11
Furthermore, fish and blue crab samples collected in 1993 from Clear Creek contained several
volatile organic compounds – including dichloroethane and trichloroethane at concentrations
that, if consumed, constituted an apparent risk to public health. To address the public health
hazard introduced by consumption of fish and blue crab from Clear Creek – which empties into
Upper Galveston Bay – the TDH issued Fish and Shellfish Consumption Advisory 7 (ADV-7) on
November 18, 1993. ADV-7 recommended that persons should not consume any fish or blue
crab from Clear Creek upstream and West of Texas Highway 3.11
In 1994, through its Near Coastal Water Grant (NCWG), the USEPA funded the TDH to
investigate chemical contaminants in fish and shellfish from four locations along the Texas coast.
As part of the NCWG study, the DSHS collected and analyzed five samples from the Houston
Ship Channel and Upper Galveston Bay for PCDDs/PCDFs. Results from the NCWG study
showed what could have been a slight decrease in average PCDF/PCDD concentrations in
catfish, blue crab, and oysters when compared to the 1990 data. However, the small number of
samples limited conclusions, and made it impossible for the TDH to reassess the health risks
a Now the Department of State Health Services (DSHS)

4
from consumption of fish, blue crab, or oysters from the Houston Ship Channel and Upper
Galveston Bay or to revise risk management decisions for the area. Consequently, the TDH
continued unchanged ADV-3, the consumption advisory issued in 1990 for these areas.
In 1996, the TDH collected 10 fish, four composite oyster samples, and 10 composite blue crab
samples from the Houston Ship Channel and Upper Galveston Bay to re-evaluate ADV-3, the
aforementioned 1990 consumption advisory. The results of the 1996 study also suggested that
the 1990 advisory limiting consumption of catfish species and blue crab should continue
unchanged. Again, the TDH continued ADV-3 in its original form.
Between 1997 and 2000, the USEPA funded three grants to the TDH for study of the Galveston
Bay system. (1) The USEPA Children’s Uses of Galveston Bay grant; (2) a Texas Commission
on Environmental Quality (TCEQ)b Total Maximum Daily Load (TMDL) program grant and (3)
a grant from the Galveston Bay Estuary Program (GBEP)12
The three studies allowed the TDH
to more comprehensively evaluate chemical contaminants in fish and shellfish from the
Galveston Bay Estuary. During these studies, the TDH collected more than 400 fish and blue
crab samples from East and West Galveston Bay, Lower Galveston Bay, Trinity Bay, Upper
Galveston Bay, and the Houston Ship Channel (including the Lower San Jacinto River and
Tabbs Bay). In addition to these major bay areas, the TDH surveyed the Christmas Bay system
(Bastrop, Christmas, and Drum Bays), Clear Creek (for which ADV-7 was issued in 1993), and
Clear Lake.
The Galveston Bay studies conducted from 1997 to 2000 revealed that – with few exceptions –
fish and blue crab from the Christmas Bay system, East Bay, West Bay, Lower Galveston Bay,
Trinity Bay, Clear Creek, and Clear Lake showed little evidence of contamination with
pollutants capable of causing adverse human health effects. None of these contaminants
exceeded the health-based assessment comparison values (HAC values) TDH used at the time to
evaluate the likelihood of adverse human health effects from consumption of chemically
contaminated fish and shellfish. The TDH concluded from these investigations that eating fish
and blue crab from the named portions of the Galveston Bay Estuary posed no apparent public
health hazard. Furthermore, on October 9, 2001, as a direct result of these studies – which
showed that fish and shellfish from Clear Creek no longer contained chemical contaminants at
levels likely to pose an apparent human health hazard, the TDH rescinded the 1993 advisory
(ADV-7) that had suggested no consumption of any fish or blue crab taken from Clear Creek.
On the other hand, the same studies (1997-2000) yielded other data that prompted the DSHS to
modify ADV-3. That modification, embodied in Fish and Shellfish Consumption Advisory 20
(ADV-20), extended ADV-3 to the upper Houston Ship Channel (including the Lower San
Jacinto River). ADV-20 recommended that adults eat no more than one eight-ounce meal per
month of blue crab or any fish species from the Houston Ship Channel upstream of the
Lynchburg Ferry crossing and from the San Jacinto River downstream of the bridge at U.S.
Highway 90. ADV-20 further stressed that children and women who were nursing an infant, who
were pregnant, or who might become pregnant should eat no fish or blue crab from the above-
described areas.13
b Formerly the Texas Natural Resource Conservation Commission (TNRCC)

5
In 1987, the U.S. Congress had established the National Estuary Program (NEP) to promote
long-term planning and management of nationally significant estuaries.14
Early on, the NEP
identified 28 nationally significant estuaries, of which Galveston Bay was one (the other Texas
estuary identified by the NEP was the Coastal Bend Bays and Estuaries system). The Galveston
Bay Estuary Program (GBEP), formed as a state-supported program from the NEP in 1989, is
one of two such programs in Texas.15
The GBEP is a non-regulatory program administered by
the TCEQ. Working with local governments, businesses, ports, commercial fisheries,
recreational anglers, environmental organizations, and state and federal natural resource
agencies, the GBEP implements the Galveston Bay Plan (GBP), a comprehensive conservation
management plan for Galveston Bay.12
The GBEP provides ecosystem management through
collaborative partnerships and ensures preservation of Galveston Bay's multiple uses. The GBEP
has enhanced water quality through promotion of reduction of pollutants in bayous, creeks, and
Galveston Bay, and has established a seafood-safety monitoring program to assist the state to
protect the health of those who consume fish and shellfish from the Galveston Bay Estuary.
In 2003-2004, the GBEP received a grant from the USEPA under Section 104(b)(3) of the Clean
Water Act. That grant provided funds to demonstrate implementation of Action PH-1: Develop a
Seafood Consumption Safety Program for the Galveston Bay Plan. This project constituted the
first phase of the Seafood Consumption Safety Monitoring Program for Galveston Bay, a project
that evaluated the following areas of the Galveston Bay Estuary: Upper Galveston Bay near
LaPorte, Texas, the Houston Ship Channel, and the Lower San Jacinto River. The objectives of
the Seafood Consumption Safety Monitoring Program, as set forth in the Galveston Bay Plan,
are to regularly characterize and monitor potential health risks associated with consumption of
seafood from the Galveston Bay Estuary and to inform the public of seafood consumption risks
identified by the monitoring program.
The results of the 2004 characterization of the health risks of consuming fish and blue crab tissue
from the study area showed unequivocally that ADV-3, issued in 1990 and modified with ADV-
20 in 2001 should continue. Those results also revealed that spotted seatrout contained
polychlorinated biphenyls (PCBs) at levels exceeding the DSHS’ HAC values for PCBs in fish.
The presence of PCBs in spotted seatrout at the observed levels caused concern among public
health officials. The DSHS thus issued Fish and Shellfish Consumption Advisory 28 (ADV-28)
on January 25, 2005 for the Houston Ship Channel and Upper Galveston Bay. ADV-28
recommended that adults limit consumption of spotted seatrout from the Houston Ship Channel –
including the tidal portion of the San Jacinto River below the U.S. Highway 90 bridge, Tabbs
Bay and its contiguous waters, and Upper Galveston Bay north of a line drawn from Red Bluff
Point to Five Mile Cut Marker to Houston Point – to no more than one eight-ounce meal per
month. Children and women who were nursing, pregnant, or who may have become pregnant
were advised not to consume spotted seatrout from these waters.16
The 2004 risk characterization also recommended additional fish tissue monitoring to determine
if spotted seatrout collected from the Galveston Bay system contain PCBs at concentrations of
concern to public health. Tagging data from the TPWD indicate that spotted seatrout tend to
move around the entire Galveston Bay Estuary. Spotted seatrout are a top predator fish found
throughout the entire United States Gulf Coast waters. The species is one of the most sought
after sport fishes along the Texas coast. Because spotted seatrout are a primary target for

6
recreational anglers, determining the extent of PCB contamination has public health, regulatory,
and economic implications for the Galveston Bay system.
The DSHS acquired two grants in 2005 and 2006 to evaluate the extent of spotted seatrout PCB
contamination and continue seafood contaminant monitoring in the Galveston Bay Estuary.
These two grants provided funding to collect 204 fish and blue crab samples from the Galveston
Bay Estuary in 2006 and 2007.
The results of the 2006 and 2007 study revealed that gafftopsail catfish and spotted seatrout
collected from the Galveston Bay Estuary contain dioxins and PCBs at concentrations that
exceed DSHS guidelines for protection of human health. Based on these results, the DSHS
issued Fish and Shellfish Consumption Advisory 35 (ADV-35) on July 8, 2008 that extended the
extant Houston Ship Channel and Upper Galveston Bay fish consumption advisory to the
remainder of the Galveston Bay Estuary. ADV-35 advised that persons should limit consumption
of catfish and spotted seatrout from this area to no more than one eight-ounce meal per month.
Women who are nursing, pregnant, or who may become pregnant and children were advised not
to consume catfish or spotted seatrout from these waters.
Demographics of the Five Texas Counties (Brazoria, Chambers, Galveston, Harris, and
Liberty) Surrounding the Galveston Bay Estuary
The estimated population in 2010 of the five counties bordering the Galveston Bay Estuary –
Brazoria (313,166), Chambers (35,096), Galveston (291,309), Harris (4,092,459), and Liberty
(75,643) – was 4,807,673 people.17
The Galveston Bay Estuary is adjacent to one of the most
urbanized and industrialized areas in Texas and in the United States. In comparison to suburban
communities in the five-county area, the larger central cities, such as Houston, TX (2010
estimated population 2,099,451)17
– the fourth largest city in the United States and the Harris
County seat – and Galveston (2010 estimated population 47,743)17
experienced little or no
population growth during the recent past. The City of Galveston experienced a slight population
decline following Hurricane Ike in September 2008. According to the United States Census
Bureau, Harris County is the most populous county in Texas. The Houston-Galveston Area
Council calculated that 70% of the Galveston County population and almost 45% of the
Chambers County population (or approximately 20 % of the 4.5 million people in the five
counties bordering Galveston Bay) reside within a two-mile buffer zone around Galveston Bay
and its tidally influenced tributaries.5
Subsistence Fishing in the Galveston Bay Estuary
The USEPA suggests that, along with ethnic characteristics and cultural practices of an area’s
population, the poverty rate could contribute to any determination of the rate of subsistence
fishing in an area.18
The USEPA and the Texas Department of State Health Services (DSHS)
find, in concert with the USEPA, it is important to consider subsistence fishing to occur at any
water body because subsistence fishers (as well as recreational anglers and certain tribal and
ethnic groups) usually consume more locally caught fish than the general population. These
groups sometimes harvest fish or shellfish from the same water body over many years to
supplement caloric and protein intake. Should local water bodies contain chemically

7
contaminated fish or shellfish, people who routinely eat fish from the water body or those who
eat large quantities of fish from the same waters, could increase their risk of adverse health
effects. The USEPA suggests that states assume that at least 10% of licensed fishers in any area
are subsistence fishers. Subsistence fishing, while not explicitly documented by the DSHS, likely
occurs. The DSHS assumes the rate of subsistence fishing to be similar to that estimated by the
USEPA.
METHODS
Fish Sampling, Preparation, and Analysis
The DSHS Seafood and Aquatic Life Group (SALG) collects and analyzes edible fish from the
state’s public waters to evaluate potential risks to the health of people consuming contaminated
fish or shellfish. Fish tissue sampling follows standard operating procedures from the DSHS
Seafood and Aquatic Life Group Survey Team Standard Operating Procedures and Quality
Control/Assurance Manual.19
The SALG bases its sampling and analysis protocols, in part, on
procedures recommended by the USEPA in that agency’s Guidance for Assessing Chemical
Contaminant Data for Use in Fish Advisories, Volume 1.20
Advice and direction are also
received from the legislatively mandated State of Texas Toxic Substances Coordinating
Committee (TSCC) Fish Sampling Advisory Subcommittee (FSAS).21
Samples usually represent
species, trophic levels, and legal-sized specimens available for consumption from a water body.
When practical, the DSHS collects samples from two or more sites within a water body to better
characterize geographical distributions of contaminants.
Fish Sampling Methods and Description of the Galveston Bay 2010 Sample Set
In February through April 2010, the SALG and TPWD CFD collected 133 fish samples from the
Galveston Bay Estuary (Table 1). The SALG requested fish collection assistance from the CFD
for spotted seatrout and gafftopsail catfish because of the short sample collection opportunity due
to the grant contract timeline associated with this project. The SALG staff collected 108 fish
samples and the TPWD CFD staff collected 18 spotted seatrout and seven gafftopsail catfish
samples. The DSHS risk assessors used data from these fish to assess the potential for adverse
human health outcomes from consuming fish from this estuary.
The SALG and CFD collected fish samples from 19 general sample areas or sites to provide
spatial coverage of the study area (Figures 1a–1b). Species collected represent distinct ecological
groups (i.e. predators and bottom-dwellers) that have some potential to bio-accumulate chemical
contaminants, have a wide geographic distribution, are of local recreational fishing value, and/or
that anglers and their families commonly consume. Spotted seatrout comprised 50% of the fish
tissue samples collected for this study. Target species and number collected are listed in
descending order: spotted seatrout (66), gafftopsail catfish (18), sand trout (17), red drum (10),
black drum (9), southern flounder (9), striped bass (2), and alligator gar (2).
The SALG survey team set gill nets at 11 of 19 sample sites (Figure 1a and 1b). All gill nets
were set in late afternoon, fished overnight, and retrieved early the following morning. The
SALG gill nets were set at locations to maximize available cover and habitat within the general

8
sample areas. During gill net retrieval and sample collection, to keep specimens from different
sample sites separated, the survey team placed samples from each site into mesh bags labeled
with the site number. The survey team immediately stored fish samples on wet ice in large
coolers to ensure interim preservation. Survey team members returned to the bay any live fish
culled from the catch and properly disposed of samples found dead in the gill nets.
Due to the low gill net catch rate for spotted seatrout, the survey team also utilized hook and line
techniques to increase spotted seatrout catch. The survey team targeted habitats (e.g., oyster
reefs, oil and gas rigs, bayou cuts, piers, pilings, channel breaks, and schooling fish under
feeding birds) likely to harbor spotted seatrout, with live shrimp and artificial baits. The survey
team fished these habitats with the boat anchored near the above-itemized structures or drifting
with the wind or tide.
The CFD provided SALG with spotted seatrout and gafftopsail catfish samples from gill net sets
at four of 19 samples sites (Figures 1a–1b). Standardized gill net sampling is part of the CFD’s
resource monitoring program. Each spring and fall over a 10-week period, the CFD perform 45-
gill net sets at randomly selected locations in every major bay system. The CFD stored fish
samples on wet ice in a cooler to ensure interim preservation. The SALG coordinated with the
CFD to pick-up fish samples either on the bay or at the TPWD CFD office in Dickinson, Texas.
The SALG staff processed all fish samples onsite at the SALG field office in Bacliff, Texas.
Staff weighed each sample to the nearest gram (g) on an electronic scale and measured total
length (tip of nose to tip of tail fin) to the nearest millimeter (mm). After weighing and
measuring a fish, staff used a cutting board covered with aluminum foil and a fillet knife to
prepare two skin-off fillets from each fish. The foil was changed and the knife cleaned with
distilled water after each sample was processed. The team wrapped fillet(s) in two layers of fresh
aluminum foil, placed in an unused, clean, pre-labeled plastic freezer bag, and stored on wet ice
in an insulated chest until further processing. The SALG staff transported tissue samples on wet
ice to their Austin, Texas, headquarters, where the samples were stored temporarily at -5°
Fahrenheit (-20° Celsius) in a locked freezer. The freezer key is accessible only to authorized
SALG staff members to ensure the chain of custody remains intact while samples are in the
possession of agency staff. The week following the collection trip, the SALG delivered the
frozen fish tissue samples to the Geochemical and Environmental Research Group (GERG)
Laboratory, Texas A&M University, College Station, Texas, for contaminant analysis.
Additional Fish Tissue Samples
In November 2010 and January 2011, the SALG collected 45 fish and blue crab samples from
the San Jacinto River and Houston Ship Channel (part of the Galveston Bay Estuary, Figure 1c)
following collection and processing procedures described above. Because of the extant
Galveston Bay Estuary spotted seatrout fish consumption advisory, SALG risk assessors
recommended inclusion of the six-spotted seatrout collected from this sampling event to increase
sample size and confidence in the spotted seatrout data set for this risk assessment.

9
Fish Age Estimation
The DSHS SALG staff removed sagittal otoliths from 60 spotted seatrout samples for age
estimation and identified the sex of each fish sample (Figure 2). The DSHS SALG staff followed
otolith extraction procedures recommended by the Gulf States Marine Fisheries Commission
(GSMFC) for spotted seatrout.22
Staff performed all otolith extractions on each fish sample after
the preparation of the two skin-off fillets for chemical contaminant analyses. Following
extraction, staff placed otoliths in an individually labeled vial and then stored the vials in a
plastic freezer bag to transport to their Austin, Texas headquarters. Staff processed otoliths and
estimated ages according to procedures recommended by the TPWD and GSMFC.22, 23
Analytical Laboratory Information
Upon arrival of the fish samples at the laboratory, GERG personnel documented receipt of the
133 Galveston Bay fish samples plus six additional spotted seatrout samples collected from the
San Jacinto River / Houston Ship Channel and recorded the condition of each sample along with
its DSHS identification number.
Using established USEPA methods, the GERG laboratory analyzed fish fillets from Galveston
Bay for inorganic and organic contaminants commonly identified in polluted environmental
media. Analyses included seven metals (arsenic, cadmium, copper, lead, total mercury, selenium,
and zinc), 123 semivolatile organic compounds (SVOCs), 70 volatile organic compounds
(VOCs), 34 pesticides, 209 polychlorinated biphenyls (PCBs) congeners, and 17 polychlorinated
dibenzofurans and/or dibenzo-p-dioxins (PCDDs/PCDFs) congeners. The laboratory analyzed all
133 samples for metals, PCBs, and PCDDs/PCDFs and a subset of 20 (GAL01, GAL02, GAL04,
GAL14, GAL15, GAL32, GAL50, GAL54, GAL55, GAL61, GAL65, GAL74, GAL79, GAL80,
GAL85, GAL87, GAL107, GAL130, GAL139, and GAL218) of the original 133 samples for
pesticides, SVOCs, and VOCs.24
The laboratory analyzed all six spotted seatrout samples
collected from the San Jacinto / Houston Ship Channel for mercury, 209 PCB congeners, and
PCDDs/PCDFs and a subset of three (SJR34, SJR43, and SJR45) of the original six samples for
metals, pesticides, SVOCs, and VOCs.
Details of Some Analyses with Explanatory Notes
Arsenic
The GERG laboratory analyzed all fish for total (inorganic arsenic + organic arsenic = total
arsenic) arsenic. Although the proportions of each form of arsenic may differ among fish species,
under different water conditions, and, perhaps, with other variables, the literature suggests that
well over 90% of arsenic in fish is likely organic arsenic – a form of arsenic that is virtually non-
toxic to humans.25
DSHS, taking a conservative approach, estimates 10% of the total arsenic in
any fish is inorganic arsenic, deriving estimates of inorganic arsenic concentration in each fish
by multiplying reported total arsenic concentration in the sample by a factor of 0.1.

10
Mercury
Nearly all mercury in upper trophic level fish three years of age or older is methylmercury.
26
Thus, the total mercury concentration in a fish of legal size for possession in Texas serves well as
a surrogate for methylmercury concentration. Because methylmercury analyses are difficult to
perform accurately and are more expensive than total mercury analyses, the USEPA
recommends that states determine total mercury concentration in a fish and that – to protect
human health – states conservatively assume that all reported mercury in fish or shellfish is
methylmercury. The GERG laboratory thus analyzed fish tissues for total mercury. In its risk
characterizations, the DSHS compares mercury concentrations in tissues to a comparison value
derived from the Agency for Toxic Substances and Disease Registry’s (ATSDR) minimal risk
level (MRL) for methylmercury.27
(In these risk characterizations, the DSHS may
interchangeably utilize the terms “mercury,” “methylmercury,” or “organic mercury” to refer to
methylmercury in fish).
Polychlorinated Biphenyls (PCBs)
For PCBs, the USEPA suggests that each state measures congeners of PCBs in fish and shellfish
rather than homologs or Aroclors®
because the USEPA considers congener analysis the most
sensitive technique for detecting PCBs in environmental media.24
Although only about 130 PCB
congeners were routinely present in PCB mixtures manufactured and commonly used in the
United States (US), the GERG laboratory analyzes and reports the presence and concentrations
of all 209 possible PCB congeners. From the congener analyses, the laboratory also computes
and reports concentrations of PCB homologs and of Aroclor®
mixtures. Despite the USEPA’s
suggestion that the states utilize PCB congeners rather than Aroclors®
or homologs for toxicity
estimates, the toxicity literature does not reflect state-of-the-art laboratory science. To
accommodate this inconsistency, the DSHS utilizes recommendations from the National Oceanic
and Atmospheric Administration (NOAA),28
from McFarland and Clarke,29
and from the
USEPA’s guidance documents for assessing contaminants in fish and shellfish20, 24
to address
PCB congeners in fish and shellfish samples, selecting the 43 congeners encompassed by the
McFarland and Clark and the NOAA articles. The referenced authors chose to use congeners that
were relatively abundant in the environment, were likely to occur in aquatic life, and likely to
show toxic effects. SALG risk assessors summed the 43 congeners to derive “total” PCB
concentration in each sample. SALG risk assessors then averaged the summed congeners within
each group (e.g., fish species, sample site, or combination of species and site) to derive a mean
PCB concentration for each group.
Using only a few PCB congeners to determine total PCB concentrations could underestimate
PCB levels in fish tissue. Nonetheless, the method complies with expert recommendations on
evaluation of PCBs in fish or shellfish. Therefore, SALG risk assessors compare average PCB
concentrations of the 43 congeners with health assessment comparison (HAC) values derived
from information on PCB mixtures held in the USEPA’s Integrated Risk Information System
(IRIS) database.30
IRIS currently contains systemic toxicity information for five Aroclor®
mixtures: Aroclors®
1016, 1242, 1248, 1254, and 1260. IRIS does not contain all information for
all mixtures. For instance, only one other reference dose (RfD) occurs in IRIS – the one derived
for Aroclor 1016, a commercial mixture produced in the latter years of commercial production of

11
PCBs in the United States. Aroclor 1016 was a fraction of Aroclor 1254 that was supposedly
devoid of dibenzofurans, in contrast to Aroclor 1254.31
Systemic toxicity estimates in the present
document reflect comparisons derived from the USEPA’s RfD for Aroclor 1254 because Aroclor
1254 contains many of the 43 congeners selected by McFarland and Clark and NOAA. As of yet,
IRIS does not contain information on the systemic toxicity of individual PCB congeners.
For assessment of cancer risk from exposure to PCBs, the SALG uses the USEPA's highest slope
factor of 2.0 milligram per kilogram per day (mg/kg/day) to calculate the probability of lifetime
excess cancer risk from PCB ingestion. The SALG based its decision to use the most restrictive
slope factor available for PCBs on factors such as food chain exposure; the presence of dioxin-
like, tumor-promoting, or persistent congeners; and the likelihood of early-life exposure.30
Calculation of Toxicity Equivalent Quotients (TEQs) for Dioxins
PCDDs/PCDFs are families of aromatic chemicals containing one to eight chlorine atoms. The
molecular structures differ not only with respect to the number of chlorines on the molecule, but
also with the positions of those chlorines on the carbon atoms of the molecule. The number and
positions of the chlorines on the dibenzofuran or dibenzo-p-dioxin nucleus directly affects the
toxicity of the various congeners. Toxicity increases as the number of chlorines increases to four
chlorines, then decreases with increasing numbers of chlorine atoms - up to a maximum of eight.
With respect to the position of chlorines on the dibenzo-p-dioxin/dibenzofuran nucleus, it
appears that those congeners with chlorine substitutions in the 2, 3, 7, and 8 positions are more
toxic than congeners with chlorine substitutions in other positions. To illustrate, the most toxic of
PCDDs is 2,3,7,8–tetrachlorodibenzo-p-dioxin (2,3,7,8–TCDD), a 4-chlorine molecule having
one chlorine substituted for hydrogen at each of the 2, 3, 7, and 8 carbon positions on the
dibenzo-p-dioxin. To gain some measure of toxic equivalence, 2,3,7,8–TCDD – assigned a
toxicity equivalency factor (TEF) of 1.0 – is the standard against which other congeners are
measured. Other congeners are given weighting factors or TEFs of 1.0 or less based on
experiments comparing the toxicity of the congener relative to that of 2,3,7,8-TCDD.32, 33
Using this technique, risk assessors from the DSHS converted PCDF or PCDD congeners in each
tissue sample from the present survey to TEQs by multiplying each congener’s concentration by
its TEF, producing a dose roughly equivalent in toxicity to that of the same dose of 2,3,7,8-
TCDD. The total TEQ for any sample is the sum of the TEQs for each of the congeners in the
sample, calculated according to the following formula.34
n
Total TEQs = ∑(CI x TEF)
i=1
CI = concentration of a given congener
TEF = toxicity equivalence factor for the given congener
n = # of congeners
i = initial congener
∑ = sum

12
Derivation and Application of Health-Based Assessment Comparison Values for Systemic
Effects (HACnonca) of Consumed Chemical Contaminants
The effects of exposure to any hazardous substance depend, among other factors, on the dose, the
route of exposure, the duration of exposure, the manner in which the exposure occurs, the genetic
makeup, personal traits, habits of the exposed, or the presence of other chemicals.35
People who
regularly consume contaminated fish or shellfish conceivably suffer repeated low-dose exposures
to contaminants in fish or shellfish over extended periods (episodic exposures to low doses).
Such exposures are unlikely to result in acute toxicity but may increase risk of subtle, chronic,
and/or delayed adverse health effects that may include cancer, benign tumors, birth defects,
infertility, blood disorders, brain damage, peripheral nerve damage, lung disease, and kidney
disease.35
If diverse species of fish or shellfish are available, the SALG presumes that people eat a variety
of species from a water body. Further, SALG risk assessors assume that most fish species are
mobile. SALG risk assessors may combine data from different fish species and/or sampling sites
within a water body to evaluate mean contaminant concentrations of toxicants in all samples as a
whole. This approach intuitively reflects consumers’ likely exposure over time to contaminants
in fish or shellfish from any water body but may not reflect the reality of exposure at a specific
water body or a single point in time. The DSHS reserves the right to project risks associated with
ingestion of individual species of fish or shellfish from separate collection sites within a water
body or at higher than average concentrations (e.g. the upper 95 percent confidence limit on the
mean). The SALG derives confidence intervals from Monte Carlo simulations using software
developed by a DSHS medical epidemiologist.36
The SALG evaluates contaminants in fish or
shellfish by comparing the mean or the 95% upper confidence limit on the mean concentration of
a contaminant to its HAC value (in mg/kg) for non-cancer or cancer endpoints.
In deriving HAC values for systemic (HACnonca) effects, the SALG assumes a standard adult
weighs 70 kilograms (kg) and consumes 30 g of fish or shellfish per day (about one 8-ounce
meal per week) and uses the USEPA’s RfD37
or the ATSDR’s chronic oral MRLs.38
The USEPA
defines an RfD as
An estimate of a daily oral exposure for a given duration to the human population
(including susceptible subgroups) that is likely to be without an appreciable risk
of adverse health effects over a lifetime.39
The USEPA also states that the RfD
… is derived from a BMDL (benchmark dose lower confidence limit), a NOAEL (no
observed adverse effect level), a LOAEL (lowest observed adverse effect level), or
another suitable point of departure, with uncertainty/variability factors applied to
reflect limitations of the data used. [Durations include acute, short-term, subchronic,
and chronic and are defined individually in this glossary] and RfDs are generally
reserved for health effects thought to have a threshold or a low dose limit for
producing effects.39

13
The ATSDR uses a similar technique to derive its MRLs.38
The DSHS divides the estimated
daily dose derived from the measured concentration in fish tissue by the contaminant’s RfD or
MRL to derive a hazard quotient (HQ). The USEPA defines a HQ as
…the ratio of the estimated exposure dose of a contaminant (mg/kg/day) to the
contaminant’s RfD or MRL (mg/kg/day).40
Note that, according to the USEPA, a linear increase in the HQ for a toxicant does not imply a
linear increase in the likelihood or severity of systemic adverse effects. Thus, a HQ of 4.0 does
not mean the concentration in the dose will be four times as toxic as that same substance would
be if the HQ were equal to 1.0. A HQ of 4.0 also does not imply that adverse events will occur
four times as often as if the HQ for the substance in question were 1.0. Rather, the USEPA
suggests that a HQ or a hazard index (HI) – defined as the sum of HQs for contaminants to
which an individual is exposed simultaneously – that computes to less than 1.0 should be
interpreted as "no cause for concern" whereas, a HQ or HI greater than 1.0 "should indicate some
cause for concern.”
The SALG does not utilize HQs to determine the likelihood of occurrence of adverse systemic
health effects. Instead, in a manner similar to the USEPA's decision process, the SALG may
utilize computed HQs as a qualitative measurement. Qualitatively, HQs less than 1.0 are unlikely
to be an issue while HQs greater than 1.0 might suggest a regulatory action to ensure protection
of public health. Similarly, risk assessors at the DSHS may utilize a HQ to determine the need
for further study of a water body's fauna. Notwithstanding the above discussion, the oral RfD
derived by the USEPA represents chronic consumption. Thus, regularly eating fish containing a
toxic chemical, the HQ of which is less than 1.0 is unlikely to cause adverse systemic health
effects, whereas routine consumption of fish or shellfish in which the HQ exceeds 1.0 represents
a qualitatively unacceptable increase in the likelihood of systemic adverse health outcomes.
Although the DSHS utilizes chemical specific RfDs when possible, if an RfD is not available for
a contaminant, the USEPA advises risk assessors to consider evaluating the contaminant by
comparing it to the published RfD (or the MRL) of a contaminant of similar molecular structure
or one with a similar mode or mechanism of action. For instance, Aroclor®
1260 has no RfD, so
the DSHS uses the reference dose for Aroclor 1254 to assess the likelihood of systemic
(noncarcinogenic) effects of Aroclor 1260.38
In developing oral RfDs and MRLs, federal scientists review the extant literature to devise
NOAELs, LOAELs, or benchmark doses (BMDs) from experimental studies. Uncertainty factors
are then utilized to minimize potential systemic adverse health effects in people who are exposed
through consumption of contaminated materials by accounting for certain conditions that may be
undetermined by the experimental data. These include extrapolation from animals to humans
(interspecies variability), intra-human variability, and use of a subchronic study rather than a
chronic study to determine the NOAEL, LOAEL, or BMD, and database insufficiencies.37,39
Vulnerable groups such as women who are pregnant or lactating, women who may become
pregnant, infants, children, people with chronic illnesses, those with compromised immune
systems, the elderly, or those who consume exceptionally large servings are considered sensitive

14
populations by risk assessors and USEPA and also receive special consideration in calculation of
a RfD.39
The primary method for assessing the toxicity of component-based mixtures of chemicals in
environmental media is the HI. The USEPA recommends HI methodology for groups of
toxicologically similar chemicals or chemicals that affect the same target organ. The HI for the
toxic effects of a chemical mixture on a single target organ is actually a simulated HQ calculated
as if the mixture were a single chemical. The default procedure for calculating the HI for the
exposure mixture is to add the hazard quotients (the ratio of the external exposure dose to the
RfD) for all the mixture’s component chemicals that affect the same target organ (e.g., the liver).
The toxicity of a particular mixture on the liver represented by the HI should approximate the
toxicity that would have occurred were the observed effects caused by a higher dose of a single
toxicant (additive effects). The components to be included in the HI calculation are any chemical
components of the mixture that show the effect described by the HI, regardless of the critical
effect from which the RfD came. Assessors should calculate a separate HI for each toxic effect.
Because the RfD is derived for the critical effect (the "toxic effect occurring at the lowest dose of
a chemical"), a HI computed from HQs based on the RfDs for the separate chemicals may be
overly conservative. That is, using RfDs to calculate HIs may exaggerate health risks from
consumption of specific mixtures for which no experimentally derived information is available.
The USEPA states that
the HI is a quantitative decision aid that requires toxicity values as well as
exposure estimates. When each organ-specific HI for a mixture is less than one
and all relevant effects have been considered in the assessment, the exposure
being assessed for potential systemic toxicity should be interpreted as unlikely to
result in significant toxicity.
And
When any effect-specific HI exceeds one, concern exists over potential toxicity. As
more HIs for different effects exceed one, the potential for human toxicity also
increases.
Thus,
Concern should increase as the number of effect-specific HI's exceeding one
increases. As a larger number of effect-specific HIs exceed one, concern over
potential toxicity should also increase. As with HQs, this potential for risk is not
the same as probabilistic risk; a doubling of the HI does not necessarily indicate
a doubling of toxic risk.

15
Derivation and Application of Health-Based Assessment Comparison Values for Application
to the Carcinogenic Effects (HACca) of Consumed Chemical Contaminants
The DSHS calculates cancer-risk comparison values (HACca) from the USEPA’s chemical-
specific cancer potency factors (CPFs), also known as cancer slope factors (CSFs), derived
through mathematical modeling from carcinogenicity studies. For carcinogenic outcomes, the
DSHS calculates a theoretical lifetime excess risk of cancer for specific exposure scenarios for
carcinogens, using a standard 70-kg body weight and assuming an adult consumes 30 grams of
edible tissue per day. The SALG risk assessors incorporate two additional factors into
determinations of theoretical lifetime excess cancer risk: (1) an acceptable lifetime risk level
(ARL)39
of one excess cancer case in 10,000 persons whose average daily exposure is equivalent
and (2) daily exposure for 30 years, a modification of the 70-year lifetime exposure assumed by
the USEPA. Comparison values used to assess the probability of cancer do not contain
“uncertainty” factors. However, conclusions drawn from probability determinations infer
substantial safety margins for all people by virtue of the models utilized to derive the slope
factors (cancer potency factors) used in calculating the HACca.
Because the calculated comparison values (HAC values) are conservative, exceeding a HAC
value does not necessarily mean adverse health effects will occur. The perceived strict
demarcation between acceptable and unacceptable exposures or risks is primarily a tool used by
risk managers along with other information to make decisions about the degree of risk incurred
by those who consume contaminated fish or shellfish. Moreover, comparison values for adverse
health effects do not represent sharp dividing lines (obvious demarcations) between safe and
unsafe exposures. For example, the DSHS considers it unacceptable when consumption of four
or fewer meals per month of contaminated fish or shellfish would result in exposure to
contaminant(s) in excess of a HAC value or other measure of risk. The DSHS also advises
people who wish to minimize exposure to contaminants in fish or shellfish to eat a variety of fish
and/or shellfish and to limit consumption of those species most likely to contain toxic
contaminants. The DSHS aims to protect vulnerable subpopulations with its consumption advice,
assuming that advice protective of vulnerable subgroups will also protect the general population
from potential adverse health effects associated with consumption of contaminated fish or
shellfish.
Children’s Health Considerations
The DSHS recognizes that fetuses, infants, and children may be uniquely susceptible to the
effects of toxic chemicals and suggests that exceptional susceptibilities demand special attention. 41, 42
Windows of special vulnerability (known as “critical developmental periods”) exist during
development. Critical periods occur particularly during early gestation (weeks 0 through 8) but
can occur at any time during development (pregnancy, infancy, childhood, or adolescence) at
times when toxicants can impair or alter the structure or function of susceptible systems.43
Unique early sensitivities may exist after birth because organs and body systems are structurally
or functionally immature at birth, continuing to develop throughout infancy, childhood, and
adolescence. Developmental variables may influence the mechanisms or rates of absorption,
metabolism, storage, or excretion of toxicants. Any of these factors could alter the concentration
of biologically effective toxicant at the target organ(s) or could modulate target organ response to

16
the toxicant. Children’s exposures to toxicants may be more extensive than adults’ exposures
because children consume more food and liquids in proportion to their body weights than adults
consume. Infants can ingest toxicants through breast milk, an exposure pathway that often goes
unrecognized. Nonetheless, the advantages of breastfeeding outweigh the probability of
significant exposure to infants through breast milk and women are encouraged to continue
breastfeeding and to limit exposure of their infants by limiting intake of the contaminated
foodstuff. Children may experience effects at a lower exposure dose than might adults because
children’s organs may be more sensitive to the effects of toxicants. Stated differently, children’s
systems could respond more extensively or with greater severity to a given dose than would an
adult organ exposed to an equivalent dose of a toxicant. Children could be more prone to
developing certain cancers from chemical exposures than are adults.44
In any case, if a chemical
or a class of chemicals is observed to be, or is thought to be, more toxic to fetuses, infants, or
children, the constants (e.g., RfD, MRL, or CPF) are usually modified further to assure the
immature systems’ potentially greater susceptibilities are not perturbed.37
Additionally, in
accordance with the ATSDR’s Child Health Initiative45
and the USEPA’s National Agenda to
Protect Children’s Health from Environmental Threats,46
the DSHS further seeks to protect
children from the possible negative effects of toxicants in fish by suggesting that this potentially
sensitive subgroup consume smaller quantities of contaminated fish or shellfish than adults
consume. Thus, the DSHS recommends that children weighing 35 kg or less and/or who are 11
years of age or younger limit exposure to contaminants in fish or shellfish by eating no more
than four ounces per meal of the contaminated species. The DSHS also recommends that
consumers spread these meals over time. For instance, if the DSHS issues consumption advice
that recommends consumption of no more than two meals per month of a contaminated species,
those children should eat no more than 24 meals of the contaminated fish or shellfish per year
and should not eat such fish or shellfish more than twice per month.
Data Analysis and Statistical Methods
The SALG risk assessors imported Excel
© files into SPSS
® statistical software, version 13.0
installed on IBM-compatible microcomputers (Dell, Inc), using SPSS®
to generate descriptive
statistics (mean, standard deviation, median, minimum and maximum concentrations, and range)
on measured compounds.47
In computing descriptive statistics, SALG risk assessors utilized ½
the reporting limit (RL) for analytes designated as not detected (ND) or estimated (J-values)c.
PCDDs/PCDFs descriptive statistics are calculated using estimated concentrations (J-values) and
assuming zero for PCDDs/PCDFs designated as ND.d The change in methodology for computing
PCDDs/PCDFs descriptive statistics is due to the proximity of the reporting limits to the HAC
value. Assuming ½ the RL for PCDDs/PCDFs designated as ND or J-values would unnecessarily
overestimate the concentration of PCDDs/PCDFs in each fish tissue sample. The SALG used the
descriptive statistics from the above calculations to generate the present report. The SALG
c “J-value” is standard laboratory nomenclature for analyte concentrations that are detected and reported below
the reporting limit (<RL). The reported concentration is considered an estimate, quantitation of which may be
suspect and may not be reproducible. The DSHS treats J-Values as “not detected” in its statistical analyses of a
sample set. d The SALG risk assessors’ rationale for computing PCDDs/PCDFs descriptive statistics using the aforementioned
method is based on the proximity of the laboratory reporting limits and the health assessment comparison value for
PCDDs/PCDFs. Thus, applying the standard SALG method utilizing ½ the reporting limit for analytes designated as
not detected (ND) or estimated (J) will likely overestimate the PCDDs/PCDFs fish tissue concentration.

17
employed Microsoft Excel®
spreadsheets to generate figures, to compute HACnonca and HACca
values for contaminants, and to calculate HQs, HIs, cancer risk probabilities, and meal
consumption limits for fish from Galveston Bay Estuary.48
When lead concentrations in fish or
shellfish are high, SALG risk assessors may utilize the EPA’s Interactive Environmental Uptake
Bio-Kinetic (IEUBK) model to determine whether consumption of lead-contaminated fish could
cause a child’s blood lead (PbB) level to exceed the Centers for Disease Control and
Prevention’s (CDC) lead concentration of concern in children’s blood (10 mcg/dL).49,50
RESULTS
The GERG laboratory completed the contaminant analyses and electronically transmitted the
results of the Galveston Bay samples collected in February through April 2010 to the SALG in
September 2010. The laboratory reported the analytical results for metals, pesticides, PCBs,
PCDDs/PCDFs, SVOCs, and VOCs. The GERG laboratory reported metals, pesticides, PCBs,
PCDDs/PCDFs, SVOCs, and VOCs results for six additional spotted seatrout samples collected
from the San Jacinto River / Houston Ship Channel in November 2010 and January 2011 to the
SALG in October 2011.
For reference, Tables 1a and 1b contain the total number of samples collected. Tables 2a through
2d present the results of metals analyses. Table 3 contains summary results for selected pesticide
analyses. Tables 4a through 4f summarize the PCB analyses. Tables 5a through 5f summarize
PCDDs/PCDFs analyses. Table 6 contains summary results for selected VOC analyses. This
paper does not display SVOC data because these contaminants were not present at
concentrations of interest in fish collected from Galveston Bay during the described survey.
Unless otherwise stated, table summaries present the number of samples containing a specific
contaminant/number tested, the mean concentration ± 1 standard deviation (68% of samples
should fall within one standard deviation of the arithmetic mean in a sample from a normally-
distributed population), and, in parentheses under the mean and standard deviation, the minimum
and the maximum detected concentrations. Those who prefer to use the range may derive this
statistic by subtracting the minimum concentration of a given contaminant from its maximum
concentration. In the tables, results may be reported as ND, below detection limit (BDL) for
estimated concentrations, or as reported concentrations. According to the laboratory's quality
control/quality assurance materials, estimated concentrations reported as BDL rely upon the
laboratory’s method detection limit (MDL) or its reporting limit (RL). The MDL is the minimum
concentration of an analyte that is reported with 99% confidence that the analyte concentration is
greater than zero, while the RL is the concentration of an analyte reliably achieved within
specified limits of precision and accuracy during routine analyses. Contaminant concentrations
reported below the RL are qualified as “J-values” in the laboratory data report.51
Inorganic Contaminants
Arsenic, Cadmium, Copper, Lead, Mercury, Selenium, and Zinc
All 136 fish tissue samples from the Galveston Bay Estuary contained concentrations of copper,
selenium, and zinc (Tables 2b-2d). All 139 fish tissue samples from Galveston Bay and the San
Jacinto River / Houston Ship Channel contained concentrations of mercury (Table 2c).

18
Three of the metalloids analyzed are essential trace elements: copper, selenium, and zinc. All
136 fish tissue samples contained copper (Table 2b). The mean copper concentration in fish
sampled from the Galveston Bay Estuary was 0.233±0.215 mg/kg. Gafftopsail catfish had the
highest average concentration of copper (0.346±0.104 mg/kg). All fish tissue samples contained
selenium. The average selenium concentration in fish from the Galveston Bay Estuary was 0.607
mg/kg with a standard deviation of ±0.244 mg/kg (Table 2d). Selenium in fish from Galveston
Bay Estuary ranged from 0.124 to 1.263 mg/kg. All samples also contained zinc (Table 2d). The
mean zinc concentration in fish tissue samples from Galveston Bay Estuary was 3.134±1.148
mg/kg (Table 2d).
The SALG evaluated four toxic metalloids having no known human physiological function
(arsenic, cadmium, lead, and mercury) in the samples collected from the Galveston Bay Estuary.
One hundred thirty-five of 136 samples assayed contained arsenic ranging from ND-7.951 mg/kg
(Table 2a). Seventy-nine of 136 samples analyzed contain cadmium (Table 2b). All species of
fish assayed had at least one sample that contained lead at concentrations greater than the RL
except striped bass (Table 2c). The average lead concentration in all fish combined was
0.048±0.055 mg/kg (Table 2c).
All species of fish collected in 2010–2011 from the Galveston Bay Estuary contained mercury
(Table 2c). A black drum contained the lowest concentration of mercury (0.043 mg/kg), while
the highest concentration occurred in a spotted seatrout (0.825 mg/kg). The mean mercury
concentration in fish (all species and all sites) was 0.155±0.128 mg/kg (Table 2c).
Organic Contaminants
Pesticides
The GERG laboratory analyzed 23 fish for 34 pesticides. All 23 samples examined contained
concentrations of chlordane and 4,4′-DDE (Table 3a). Chlordane concentrations ranged from
BDL-0.059 mg/kg in fish (Table 3; n=23). A striped bass contained the highest concentration of
4,4′-DDE (0.116 mg/kg). The mean 4,4′-DDE concentration in fish (n=23) was 0.013±0.026
mg/kg. Several fish samples contained tracee to low concentrations of 1,2,3,4 tetrachlorobenzene,
1,2,4,5 tetrachlorobenzene, pentachlorobenzene, hexachlorobenzene, alpha HCH, delta HCH,
gamma HCH, heptachlor, heptachlor epoxide, dieldrin, pentachloroanisole, mirex, endosulfan II,
2,4′-DDD, 2,4′-DDE, 2,4′-DDT , 4,4′-DDT, alachlor, endosulfan sulfate, ethyl parathion,
malathion, and methoxychlor (data not presented).
PCBs
All fish tissue samples contained concentrations of one or more PCB congeners (Table 4a–4f).
No fish tissue sample contained all PCB congeners (data not shown). Across all sample sites and
e Trace: in analytical chemistry, a trace is an extremely small amount of a chemical compound, one present in a
sample at a concentration below a standard limit. Trace quantities may be designated with the “less than” (<) sign
or may also be represented by the alpha character “J” – called a “J-value” defining the concentration of a
substance as near zero or one that is detected at a low level but that is not guaranteed quantitatively replicable.

19
species, PCB concentrations ranged from BDL to 0.255 mg/kg (Table 4e). Gafftopsail catfish
contained the highest mean concentration of PCBs (0.073±0.060 mg/kg). One (gafftopsail
catfish) of eight fish species evaluated had mean PCB congener concentrations across all sample
sites that exceeded the DSHS HACnonca value for PCBs (0.047 mg/kg; Table 4e). Southern
flounder contained the lowest mean concentration of PCBs (Tables 4e). The mean PCB
concentration in the 139 fish tissue samples assayed was 0.036±0.039 mg/kg (Table 4e).
Assessment of PCB concentrations in gafftopsail catfish by sampling event indicate that the
2005–2006 and 2010–2011 data do not statistically differ by sampling event (2005–2006, n = 24
and 2010, n = 18; t [40] = 1.414, p = 0.165). Further comparison of PCB concentrations in
gafftopsail catfish from the 2005–2006 and 2010–2011 assessments by subdivided Galveston
Bay Estuary section or bay could not be performed because of insufficient sample size.
The SALG risk assessors evaluated the 2010–2011 spotted seatrout PCB data by subdividing the
Galveston Bay Estuary into five sections: Section 1 delineates an area of the estuary north of a
line from Red Bluff Point to Five-Mile Cut Marker to Houston Point (Sample sites 1, 2, and
additional spotted seatrout samples from the San Jacinto River / Houston Ship Channel; n = 16);
Section 2 delineates an area south of a line from Red Bluff Point to Five-Mile Cut Marker to
Houston Point and north of a line from Eagle Point to Smith Point including Trinity Bay (Sample
sites 3, 5, and 16; n = 21); Section 3 delineates an area south of a line from Eagle Point to Smith
Point excluding East Bay and West Bay (Sample sites 6, 12, 14, and 15; n = 8); Section 4
delineates East Bay east of a line from Smith Point to Bolivar Peninsula (Sample sites 8, 17, and
18; N = 19); and Section 5 delineates Christmas Bay, Cold Pass, and San Luis Pass (Sample
Sites 10 and 19; n = 8). The SALG risk assessors visually examined the spotted seatrout PCB
summary data subdivided into five sections noting that PCBs appeared to break naturally
between Section 1 and Sections 2, 3, 4, and 5 (Figure 3). Univariate analysis of variance showed
that the mean PCB concentrations in spotted seatrout differed significantly across the five
Galveston Bay Estuary sections (F [4, 67] = 11.698, p <0.0005). The SALG risk assessors
condensed the five sections into two composite sites based on the results of the univariate
analysis of variance and apparent natural break in the data: Composite Area 1 delineates an area
north of a line from Red Bluff Point to Five-Mile Cut Marker to Houston Point (spotted seatrout
samples from sample sites 1 and 2 including the additional spotted seatrout samples from the San
Jacinto River / Houston Ship Channel; n = 16) and Composite Area 2 delineates an area south of
a line from Red Bluff Point to Five-Mile Cut Marker to Houston Point (spotted seatrout samples
from sample sites 3, 5, 6, 8, 10, 12, 14, 15, 16, 17, 18, and 19; n = 56). The mean PCB
concentration for spotted seatrout at Composite Area 1 was 0.081±0.060 mg/kg while, at
Composite Area 2, the mean PCB concentration was 0.026±0.015 mg/kg (Table 4f). The
minimum and maximum concentrations for spotted seatrout at Composite Area 1 and Composite
Area 2 were 0.019-0.237 mg/kg and BDL- 0.064 mg/kg, respectively (Table 4f).
The SALG risk assessors performed statistical analyses to assess the relationship between
spotted seatrout age and PCB concentration and to determine if there were differences in PCB
concentration by sex. The data were not subdivided into Galveston Bay Estuary sections for
these analyses. A Pearson product-moment correlation coefficient was computed to assess the
relationship between the age of spotted seatrout and their PCB concentration within the
Galveston Bay Estuary (Figure 2). There was no correlation between the two variables (r =

20
0.086, n = 60, p = 0.512). The mean PCB concentration (mg/kg) for female spotted seatrout was
0.034±0.026, whereas the mean PCB concentration for males was 0.030±0.015. There was not a
significant difference between female and male spotted seatrout PCB concentrations (female, n =
39; male, n = 20; t [57] = -0.648, p = 0.520).
Evaluation of PCB concentrations in spotted seatrout by sampling event indicate that the 2005–
2006 and 2010–2011 data do not statistically differ by sampling event (2005–2006; n = 118;
2010-2011, n = 72; t [188] = 1.550, p = 0.123). Comparison of PCB concentrations in spotted
seatrout from the 2005–2006 and 2010–2011 assessments by subdivided Galveston Bay Estuary
section, as discussed above, are difficult to perform because the samples sizes are remarkably
unequal by section and no spotted seatrout were collected in 2005–2006 from Sections 4 and 5.
Although discussed in different ways from summary data tables showing the spotted seatrout
data in various cuts, the SALG used the data sets from the two composite areas to recommend
advisory or regulatory action to protect public health.
PCDDs/PCDFs
The GERG laboratory analyzed all fish tissue samples for 17 of the 210 possible PCDD/PCDF
(75 PCDDs + 135 PCDFs) congeners from the Galveston Bay Estuary. The congeners examined
consist of 7 PCDDs and 10 PCDFs that contain chlorine substitutions in, at a minimum, the 2, 3,
7, and 8 positions on the dibenzo-p-dioxin or dibenzofuran nucleus and are the only congeners
reported to pose dioxin-like adverse human health effects.52
Although 12 of the 209 PCB
congeners – those often referred to as "coplanar PCBs," meaning the molecule can assume a flat
configuration with both phenyl rings in the same plane – may also have dioxin-like toxicity, the
SALG does not assess PCBs for dioxin-like qualities because the dioxin-like behavior has been
less extensively evaluated. Tables 5a through 5f contain site and species-specific summary
statistics for PCDDs/PCDFs in fish collected from Galveston Bay Estuary. Before generating
summary statistics for PCDDs/PCDFs, the SALG risk assessors converted the reported
concentration of each PCDD or PCDF congener reported present in a tissue sample to a
concentration equivalent in toxicity to that of 2,3,7,8-TCDD (a TEQ concentration - expressed as
picogram per gram [pg/g]or nanogram per kilogram [ng/kg]). Sixty-eight of 139 fish tissue
samples contained at least one of the 17 congeners assayed (minimum – to – maximum
concentration after conversion: ND-6.487 pg/g–or ng/kg; Table 5e). No samples contained all 17
congeners (data not shown). Gafftopsail catfish contained the highest mean PCDD/PCDF TEQ
concentration (0.695±1.776 pg/g).
Assessment of PCDD/PCDF TEQ concentrations in gafftopsail catfish by sampling event
indicate that the 2005–2006 and 2010–2011 data do not statistically differ by sampling event
(2005–2006, n = 24; 2010, n = 18; t [34] = 1.710, p = 0.096). Further comparison of
PCDD/PCDF TEQ concentrations in gafftopsail catfish from the 2005–2006 and 2010–2011
assessments by subdivided Galveston Bay Estuary section or bay could not be performed
because of insufficient sample size.
The SALG risk assessors evaluated the spotted seatrout PCDD/PCDF data by subdivided section
as described in the PCBs results above. Visual examination of the PCDD/PCDF data revealed

21
that the data did not break naturally or statistically as the PCB data did (Figure 4). Univariate
analysis of variance showed that the PCDD/PCDF TEQ concentration in spotted seatrout
differed significantly across the five Galveston Bay Estuary sections (F [4, 67] = 4.236, p =
0.004). Although, the PCDD/PCDF data did not break similar to the PCB data, SALG risk
assessors condensed the data into the two composite areas discussed in the PCB results to
facilitate consistency for spotted seatrout samples assessed, concerning single and multiple
contaminant exposures. The mean PCDD/PCDF TEQ concentration for spotted seatrout at
Composite Area 1 was 0.066±0.183 pg/g while, at Composite Area 2, the mean PCDD/PCDF
TEQ concentration was 0.154±0.314 (Table 5f). The minimum and maximum concentrations for
spotted seatrout at Composite Area 1 and Composite Area 2 were ND–0.668 and ND–1.407
pg/g, respectively (Table 5f).
The SALG risk assessors performed statistical analyses to determine if a relationship existed
between spotted seatrout age and PCDD/PCDF TEQ concentration and to determine if there
were differences in PCDD/PCDF TEQ concentration by sex. The data were not subdivided into
Galveston Bay Estuary sections for these analyses. A Pearson product-moment correlation
coefficient was computed to assess the relationship between the age of spotted seatrout and their
PCDD/PCDF TEQ concentration within the Galveston Bay Estuary. There was no significant
correlation between the two variables (r = 0.234, n = 60, p = 0.072). The mean PCDD/PCDF
TEQ concentration (pg/g) for female spotted seatrout was 0.151±0.282, whereas the mean
PCDD/PCDF TEQ concentration for males was 0.136±0.360. There was not a significant
difference between female and male spotted seatrout PCDD/PCDF TEQ concentrations. (female,
n = 39; male, n = 20; t [57] = -0.177, p = 0.860).
Evaluation of PCDD/PCDF TEQ concentrations in spotted seatrout by sampling event indicate
that the 2005–2006 mean PCDD/PCDF TEQ concentration was significantly higher than the
2010–2011 mean PCDD/PCDF TEQ concentration (2005–2006, n = 17; 2010, n = 72); t [87] =
6.256, p <0.0005). Comparison of PCB concentrations in spotted seatrout from the 2005–2006
and 2010–2011 assessments by subdivided Galveston Bay Estuary section, as discussed above,
could not be performed because of insufficient sample size.
Although discussed in different ways from summary data tables showing the spotted seatrout
data in various cuts, the SALG used the data sets from the two composite areas to recommend
advisory or regulatory action to protect public health.
SVOCs
The GERG laboratory analyzed a subset of 23 Galveston Bay Estuary fish tissue samples for
SVOCs. The laboratory reported quantifiable concentrations (≥RL) and/or trace concentrations
of the following SVOCs in one or more fish samples: benzo(b)fluoranthene,
benzo(g,h,i)perylene, benzo(k)fluoranthene, benzyl alcohol, dibenz(a,j)acridine, bis (2-
ethylhexyl) phthalate, diethyl phthalate, and phenol. These concentrations did not pose a threat to
human health (data not presented). The laboratory detected no other SVOCs in fish from the
Galveston Bay Estuary.

22
VOCs
The GERG laboratory reported the 23 fish tissue samples selected for analysis from the
Galveston Bay Estuary to contain quantifiable concentrations >RL of one or more VOCs:
acetone, carbon disulfide, methylene chloride, 2-butanone (MEK), methyl methacrylate, and 1,4-
dichlorobenzene (data not presented). Trace quantities of many VOCs were also present in one
or more fish tissue samples assayed from the Galveston Bay Estuary (data not presented). The
Seafood and Aquatic Life Group Survey Team Standard Operating Procedures and Quality
Control/Assurance Manual contain a complete list of the 70 VOCs selected for analysis.
Numerous VOCs were also identified in one or more of the procedural blanks, indicating the
possibility that these compounds were introduced during sample preparation. VOC
concentrations <RL are difficult to interpret due to their uncertainty and may represent a false
positive. The presence of many VOCs at concentrations <RL may be the result of incomplete
removal of the calibration standard from the adsorbent trap, so they are observed in the blank.
VOC analytical methodology requires that the VOCs be thermally released from the adsorbent
trap, transferred to the gas chromatograph (GC), and into the GC/mass spectrometer (MS) for
quantification.
DISCUSSION
Risk Characterization
Because variability and uncertainty are inherent to quantitative assessment of risk, the calculated
risks of adverse health outcomes from exposure to toxicants can be orders of magnitude above or
below actual risks. Variability in calculated and in actual risk may depend upon factors such as
the use of animal instead of human studies, use of subchronic rather than chronic studies,
interspecies variability, intra-species variability, and database insufficiency. Since most factors
used to calculate comparison values result from experimental studies conducted in the laboratory
on nonhuman subjects, variability and uncertainty might arise from the study chosen as the
"critical" one, the species/strain of animal used in the critical study, the target organ selected as
the "critical organ," exposure periods, exposure route, doses, or uncontrolled variations in other
conditions.37
Despite such limitations, risk assessors must calculate parameters to represent
potential toxicity to humans who consume contaminants in fish and other environmental media.
The DSHS calculated risk parameters for systemic and carcinogenic endpoints in those who
would consume fish from the Galveston Bay Estuary. Conclusions and recommendations
predicated upon the stated goal of the DSHS to protect human health follow the discussion of the
relevance of findings to risk.
Characterization of Systemic (Noncancerous) Health Effects from Consumption of Fish from
the Galveston Bay Estuary
One (alligator gar) of 136 fish samples evaluated contained arsenic exceeding the HACnonca for
arsenic (0.700 mg/kg; Tables 2a and 7a). The mean arsenic concentrations of the eight fish
species evaluated and the all fish combined mean concentration did not exceed the arsenic
HACnonca value nor did the HQs exceed 1.0. PCBs were observed in fish from the Galveston Bay
Estuary that equaled or exceeded its HACnonca (0.047 mg/kg; Tables 4a–4f and 8a–8c). Two

23
(gafftopsail catfish) of 139 fish samples assayed contained PCDDs/PCDFs exceeding the
HACnonca for PCDDs/PCDFs (2.330 pg/g; Tables 5a–5f and Tables 8a–8c). The mean
PCDD/PCDF concentrations of the eight fish species evaluated and the all fish combined mean
concentration did not exceed the PCDDs/PCDFs HACnonca value nor did the HQs exceed 1.0. No
species of fish collected contained any other inorganic or organic contaminants at concentrations
that equaled or exceeded the DSHS guidelines for protection of human health or would likely
cause systemic risk to human health from consumption of fish from the Galveston Bay Estuary.
Potential systemic health risks related to the consumption of fish from the Galveston Bay Estuary
containing inorganic and organic contaminants (other than PCBs) are not of public health
concern. Consequently, this risk characterization concentrates on assessing the likelihood of
adverse health outcomes that could occur from consumption of the Galveston Bay Estuary PCB-
contaminated fish. Tables 8a through 8c provide HQs for PCBs in each species of fish from the
Galveston Bay Estuary and the recommended weekly consumption rate for each species.
PCBs
One hundred thirty nine of 139 fish collected from the Galveston Bay Estuary contained PCBs
(Tables 4a–4e). Twenty four percent of all samples (n = 139) analyzed contained PCB
concentrations that equaled or exceeded the HACnonca for PCBs (0.047 mg/kg). PCB
concentrations that equaled or exceeded the HACnonca for PCBs (0.047 mg/kg) were observed in
one or more samples of the following species: gafftopsail catfish, sand trout, spotted seatrout,
and striped bass. The gafftopsail catfish was the only species of fish examined from the
Galveston Bay Estuary that had an overall mean PCB concentration exceed the HACnonca for
PCBs or a HQ of 1.0 (Tables 4e and 8a). The consumption of gafftopsail catfish from the
Galveston Bay Estuary may pose potential systemic health risks.
Figure 3 and Table 4f show that PCBs in spotted seatrout from Composite Area 1 contain higher
concentrations of PCBs than spotted seatrout from Composite Area 2. The mean PCB
concentration for spotted seatrout at Composite Area 1 exceeded the HACnonca for PCBs or a HQ
of 1.0 (Table 4f and 8c) suggesting that consumption of spotted seatrout from Composite Area 1
may pose potential systemic health risks. The mean PCB concentration for spotted seatrout at
Composite Area 2 does not exceed the HACnonca for PCBs or a HQ of 1.0.
Meal consumption calculations may be useful for decisions about consumption advice or
regulatory actions. The SALG risk assessors calculated the number of 8-ounce meals from the
Galveston Bay Estuary that healthy adults could consume without significant risk of adverse
systemic effects (Table 8a-8c). The SALG estimated this group could consume 0.6 (8-ounce)
meals per week of gafftopsail catfish containing PCBs (Table 8a) or 0.5 (8-ounce) meals per
week of spotted seatrout from Composite Area 1 (Table 8c). Therefore, SALG risk assessors
suggest that people should limit their consumption of gafftopsail catfish from the Galveston Bay
Estuary and that people should limit their consumption of spotted seatrout from the area
delineated as Composite Area 1 of the Galveston Bay Estuary. Because the developing nervous
system of the human fetus may be especially susceptible to these effects, the SALG risk
assessors recommend more conservative consumption guidance for this sensitive subpopulation.

24
Characterization of Theoretical Lifetime Excess Cancer Risk from Consumption of Fish from
Galveston Bay Estuary
The USEPA classifies arsenic, most chlorinated pesticides, PCBs, and PCDDs/PCDFs as
carcinogens. The mean arsenic concentration observed in alligator gar samples assayed exceeds
the DSHS guideline for protection of human health of one excess cancer in 10,000 equally
exposed individuals (Tables 2a and 9a); albeit, the arsenic concentration observed in one of two
alligator gar samples assayed exceeded the DSHS ARL. Arsenic, chlorinated pesticides, PCBs,
and PCDDs/PCDFs were present in most other fish samples from the Galveston Bay Estuary, but
none of these contaminants evaluated singly by species or all fish combined had mean
contaminant concentrations that would be likely to increase the risk of cancer to exceed the
DSHS guideline for protection of human health of one excess cancer in 10,000 equally exposed
individuals (Tables 2a–9d).
Characterization of Calculated Cumulative Systemic Health Effects and of Cumulative Excess
Lifetime Cancer Risk from Consumption of Fish from Galveston Bay Estuary
Cumulative systemic effects of toxicants may occur if more than one contaminant acts upon the
same target organ or acts by the same mode or mechanism of action. PCBs and PCDDs/PCDFs
in the Galveston Bay Estuary fish could have these properties, especially with respect to effects
on the immune system. Multiple inorganic or organic contaminants in the Galveston Bay Estuary
samples did not significantly increase the likelihood of systemic adverse health outcomes from
consuming any species of fish from the Galveston Bay Estuary.
The SALG also queried the probability of increasing lifetime excess cancer risk from consuming
fish containing multiple inorganic and organic contaminants. In most assessments of cancer risk
from environmental exposures to chemical mixtures, researchers have considered any increase in
cancerous or benign growths in one or more organs as cumulative, no matter the mode or
mechanism of action of the contaminant. In this assessment, risk assessors added the calculated
carcinogenic effect of arsenic, chlorinated pesticides, PCBs, and PCDFs/PCDDs (all data not
presented; Tables 9a–9d). In each instance, addition of the cancer risk numbers for these
chemicals increased the theoretical lifetime excess cancer risk, albeit the cancer risk increase did
not elevate lifetime excess cancer risk to a level greater than the DSHS guideline for protection
of human health of one excess cancer in 10,000 persons equivalently exposed.
CONCLUSIONS The SALG risk assessors prepare risk characterizations to determine public health hazards from
consumption of fish and shellfish harvested from Texas water bodies by recreational or
subsistence fishers. If necessary, the SALG may suggest strategies for reducing risk to the health
of those who may eat contaminated fish or seafood to risk managers at the DSHS, including the
Texas Commissioner of Health.
This study addressed the public health implications of consuming fish from the Galveston Bay
Estuary, located in Chambers, Galveston, and Harris Counties, Texas. Risk assessors from the

25
SALG conclude from the present characterization of potential adverse health effects from
consuming fish from the Galveston Bay Estuary that:
1. Black drum, red drum, sand trout, southern flounder, and striped bass do not contain any
mean inorganic or organic contaminant concentrations, either singly or in combination,
that exceed the DSHS guidelines for protection of human health. Therefore, consumption
of these fish species poses no apparent risk to human health.
2. One of two alligator gar samples assayed contains arsenic at a concentration exceeding
the DSHS guidelines for protection of human health of one excess cancer in 10,000
equally exposed individuals. Due to the small sample size and the variability of the
arsenic concentrations reported in the two alligator gar samples, the SALG risk assessors
are unable to characterize adequately health risks associated with consuming alligator gar
from the Galveston Bay Estuary. Therefore, the SALG characterizes the likelihood of
adverse health effects from regular consumption of alligator gar from the Galveston Bay
Estuary as of unknown significance to human health.
3. Spotted seatrout collected from the portion of the Galveston Bay Estuary delineated as
Composite Area 1 contain PCBs at concentrations exceeding the DSHS guidelines for
protection of human health. Regular or long-term consumption of spotted seatrout may
result in adverse systemic health effects. Therefore, consumption of spotted seatrout from
the portion of the Galveston Bay Estuary delineated as Composite Area 1 poses an
apparent risk to human health. Consumption advice issued in July 2008 for spotted
seatrout was predicated on multiple contaminant exposure (i.e. PCBs and
PCDDs/PCDFs) and movement of the species throughout the Galveston Bay Estuary
(unpublished TPWD spotted seatrout tagging data). Evaluation of 2010-2011 spotted
seatrout data indicate that PCDD/PCDF TEQ concentrations have decreased to an
acceptable level of risk and that there are differences in PCB concentrations by Galveston
Bay Estuary section or bay.
4. Gafftopsail catfish contain PCBs at concentrations exceeding the DSHS guidelines for
protection of human health. Regular or long-term consumption of gafftopsail catfish may
result in adverse systemic health effects. Therefore, consumption of gafftopsail catfish
from the Galveston Bay Estuary poses an apparent risk to human health.
5. Consumption of multiple inorganic or organic contaminants in fish does not significantly
increase the likelihood of systemic or carcinogenic health risks observed in fish from the
Galveston Bay Estuary. Therefore, SALG risk assessors conclude that consuming fish
containing multiple contaminants at concentrations near those observed in fish from the
Galveston Bay Estuary does not significantly increase the risk of adverse health effects.
It is important to note that this study and the 2005–2006 study represent a “snapshot” of risk
throughout the Galveston Bay Estuary on the day(s) of sampling. Both of these studies do not
account for potential PCB and PCDD/PCDF concentration variation in fish tissue due to
environmental variables (i.e. seasonal fish movement, freshwater inflow, salinity, etc.). For this
26
assessment, SALG risk assessors based its conclusions and recommendations solely on the
evaluation of the 2010–2011 data.
RECOMMENDATIONS
Risk managers at the DSHS have established criteria for issuing fish consumption advisories
based on approaches suggested by the EPA.20, 24, 53
Risk managers at the DSHS may decide to
take some action to protect public health if a risk characterization confirms that people can eat
only four or fewer meals per month (adults: eight ounces per meal; children: four ounces per
meal) of fish or shellfish from a water body under investigation. Risk management
recommendations may be in the form of consumption advice or a ban on possession of fish from
the affected water body. Fish or shellfish possession bans are enforceable under Subchapter D of
the Texas Health and Safety Code, part 436.061(a).54
Declarations of prohibited harvesting areas
are enforceable under the Texas Health and Safety Code, Subchapter G, part 436.091 and
Subchapter H, part 436.101.54
The DSHS consumption advice carries no penalty for
noncompliance. Consumption advisories, instead, inform the public of potential health hazards
associated with consuming contaminated fish or shellfish from Texas waters. With this
information, members of the public can make informed decisions about whether and/or how
much – contaminated fish or shellfish they wish to consume. The SALG concludes from this risk
characterization that consuming gafftopsail catfish and spotted seatrout from the Galveston Bay
Estuary poses an apparent hazard to public health. Therefore, SALG risk assessors
recommend that:
1. The DSHS continue the extant consumption guidance for gafftopsail catfish as
recommended by Fish Consumption Advisory 35 (ADV-35). ADV-35 advised persons to
limit consumption of all catfish species from Galveston Bay to no more than one eight-
ounce meal per month and women who are nursing, pregnant, or who may become
pregnant and children less than 12 years of age or who weigh less than 75 pounds should
not consume catfish from Galveston Bay.
2. The DSHS continue the extant meal consumption guidance for spotted seatrout as
recommended by Fish Consumption Advisory 35 (ADV-35). ADV-35 advised persons to
limit consumption of spotted seatrout to no more than one eight-ounce meal per month
and women who are nursing, pregnant, or who may become pregnant and children less
than 12 years of age or who weigh less than 75 pounds should not consume spotted
seatrout. The DSHS modify the spotted seatrout advisory area to include the portion of
the Galveston Bay Estuary north of a line from Red Bluff Point to Five-Mile Cut Marker
to Houston Point.
3. As resources become available, the DSHS should continue to monitor fish from the
Galveston Bay Estuary for changes or trends in contaminants of concern or contaminant
concentrations that would necessitate a change in consumption advice.

27
PUBLIC HEALTH ACTION PLAN
Communication to the public of new and continuing possession bans or consumption
advisories, or the removal of either, is essential to effective management of risk from consuming
contaminated fish. In fulfillment of the responsibility for communication, the DSHS takes
several steps. The agency publishes fish consumption advisories and bans in a booklet available
to the public through the SALG. To receive the booklet and/or the data, please contact the SALG
at 512-834-6757.55
The SALG also posts the most current information about advisories, bans,
and the removal of either on the Internet at http://www.dshs.state.tx.us/seafood.56
The SALG
regularly updates this Web site. The DSHS also provides EPA
(http://epa.gov/waterscience/fish/advisories/), the TCEQ (http://www.tceq.state.tx.us), and the
TPWD (http://www.tpwd.state.tx.us) with information on all consumption advisories and
possession bans. Each year, the TPWD informs the fishing and hunting public of consumption
advisories and fishing bans on its Web site and in an official downloadable PDF file containing
general hunting and fishing regulations booklet available at
http://www.tpwd.state.tx.us/publications/nonpwdpubs/media/regulations_summary_2009_2010.
pdf. 57
A booklet containing this information is available at all establishments selling Texas
fishing licenses.58
Readers may direct questions about the scientific information or
recommendations in this risk characterization to the SALG at 512-834-6757 or may find the
information at the SALG’s Web site (http://www.dshs.state.tx.us/seafood). Secondarily, one may
address inquiries to the Environmental and Injury Epidemiology and Toxicology Branch of
DSHS (512-458-7269). The EPA’s IRIS Web site (http://www.epa.gov/iris/) contains
information on environmental contaminants found in food and environmental media. The
ATSDR, Division of Toxicology (888-42-ATSDR or 888-422-8737 or the ATSDR’s Web site
(http://www.atsdr.cdc.gov) supplies brief information via ToxFAQs.™ ToxFAQs™ are available
on the ATSDR Web site in either English (http://www.atsdr.cdc.gov/toxfaq.html) or Spanish
(http://www.atsdr.cdc.gov/es/toxfaqs/es _toxfaqs.html). The ATSDR also publishes more in-
depth reviews of many toxic substances in its Toxicological Profiles (ToxProfilesTM
). To request
a copy of the ToxProfilesTM
CD-ROM, PHS, or ToxFAQsTM
call 1-800-CDC-INFO (800-232-
4636) or email a request to [email protected].

28
Figure 1a. Galveston Bay Estuary Sample Sites

Figure 1b. Galveston Bay Estuary Sample Sites

Figure 1c. San Jacinto River / Houston Ship Channel Sample Sites

31
Figure 2. Length at age for spotted seatrout collected from the Galveston Bay Estuary, Texas, 2010.
300
350
400
450
500
550
600
650
700
750
0 1 2 3 4 5 6 7 8
Age (Years)
Length
(m
m)

32
Figure 3. Means plot of PCBs (mg/kg wet weight) in spotted seatrout tissue collected from the Galveston Bay Estuary in 2010–
2011. The error bars denote the 95% confidence interval of the mean.
0.000
0.020
0.040
0.060
0.080
0.100
0.120
1 2 3 4 5
Subdivided Sections of the Galveston Bay Estuary**
Mean
PC
B C
on
cen
traio
n (
mg
/kg
)
Composite Area 2
Composite Area 1
**Section 1 delineates an area of Galveston Bay north of a line from Red Bluff Point to Five-mile Cut Marker to Houston Point (Sample sites 1 and 2 and additional spotted seatrout samples from the
San Jacinto River / Houston Ship Channel; N = 16). Section 2 delineates an area south of a line from Red Bluff Point to Five-mile Cut Marker to Houston Point and north of a line from Eagle Point to
Smith Point including Trinity Bay (Sample sites 3, 5, and 16; N = 21). Section 3 delineates an area south of a line from Eagle Point to Smith Point excluding East Bay and West Bay (Sample sites 6, 12,
14, and 15; N = 8). Section 4 delineates East Bay east of a line from Smith Point to Bolivar Peninsula (Sample sites 8, 17, and 18; N = 19). Section 5 delineates Christmas Bay, Cold Pass, and San Luis
Pass (Sample Sites 10 and 19; N = 8).

33
Figure 4. Means plot of PCDDs/PCDFs (pg/g wet weight) in spotted seatrout tissue collected from the Galveston Bay Estuary
in 2010–2011. The error bars denote the 95% confidence interval of the mean.
-0.1
0
0.1
0.2
0.3
0.4
0.5
0.6
1 2 3 4 5
Subdivided Sections of the Galveston Bay Estuary
Mean
PC
DD
/PC
DF
Co
ncen
trati
on
(p
g/g
)
**Section 1 delineates an area of Galveston Bay north of a line from Red Bluff Point to Five-mile Cut Marker to Houston Point (Sample sites 1 and 2 and additional spotted seatrout samples from the
San Jacinto River / Houston Ship Channel; N = 16). Section 2 delineates an area south of a line from Red Bluff Point to Five-mile Cut Marker to Houston Point and north of a line from Eagle Point to
Smith Point including Trinity Bay (Sample sites 3, 5, and 16; N = 21). Section 3 delineates an area south of a line from Eagle Point to Smith Point excluding East Bay and West Bay (Sample sites 6, 12,
14, and 15; N = 8). Section 4 delineates East Bay east of a line from Smith Point to Bolivar Peninsula (Sample sites 8, 17, and 18; N = 19). Section 5 delineates Christmas Bay, Cold Pass, and San Luis
Pass (Sample Sites 10 and 19; N = 8).

34
TABLES
Table 1a. Fish samples collected from the Galveston Bay Estuary from
February 9, 2010 through April 27, 2010. Sample number, species, length,
and weight are recorded for each sample.
Sample Number Species Length
(mm)
Weight
(g)
Site 1 Galveston Bay at Tabbs Bay
GAL103 Spotted seatrout 593 2403
GAL104 Spotted seatrout 592 2374
GAL105 Spotted seatrout 411 840
GAL107 Gafftopsail catfish 601 1942
GAL109 Gafftopsail catfish 587 1751
GAL111 Gafftopsail catfish 606 1931
GAL116 Black drum 598 3217
Site 2 Galveston Bay at Yacht Club Marina
GAL117 Spotted seatrout 629 3056
GAL118 Spotted seatrout 470 1081
GAL119 Spotted seatrout 511 1394
GAL120 Spotted seatrout 440 1006
GAL121 Spotted seatrout 467 1022
GAL122 Spotted seatrout 412 779
GAL124 Spotted seatrout 392 675
GAL128 Sand trout 306 265
GAL130 Gafftopsail catfish 610 1854
GAL131 Gafftopsail catfish 490 1050
GAL132 Gafftopsail catfish 495 1053
Site 3 Galveston Bay at Houston Light and Power
GAL133 Spotted seatrout 460 1001
GAL134 Spotted seatrout 540 1836
GAL136 Spotted seatrout 398 739
GAL137 Spotted seatrout 490 1223
GAL138 Southern flounder 471 1273
GAL139 Gafftopsail catfish 630 2567
GAL142 Gafftopsail catfish 586 2012
GAL144 Gafftopsail catfish 578 1921
GAL145 Gafftopsail catfish 602 2008

35
Table 1a cont. Fish samples collected from the Galveston Bay Estuary
from February 9, 2010 through April 27, 2010. Sample number, species,
length, and weight are recorded for each sample.
Sample Number Species Length
(mm)
Weight
(g)
Site 4 Galveston Bay at Pine Gulley
GAL1 Striped bass 594 3118
GAL2 Striped bass 672 4608
GAL3 Red drum 660 2748
GAL4 Red drum 635 2466
GAL5 Sand trout 370 534
GAL6 Sand trout 383 624
GAL7 Black drum 610 3197
Site 5 at Redfish Island/Bayshore Park
GAL12 Spotted seatrout 442 880
GAL13 Spotted seatrout 481 1090
GAL14 Spotted seatrout 620 2858
GAL15 Spotted seatrout 645 3031
GAL16 Spotted seatrout 580 2249
GAL17 Spotted seatrout 575 2218
GAL18 Spotted seatrout 544 1798
GAL19 Spotted seatrout 573 2009
GAL20 Spotted seatrout 511 1511
GAL21 Spotted seatrout 462 909
GAL22 Spotted seatrout 571 2159
GAL23 Spotted seatrout 481 1085
GAL26 Red drum 676 2897
GAL28 Black drum 799 8978
GAL39 Spotted seatrout 620 2209
GAL40 Spotted seatrout 639 2118
GAL41 Spotted seatrout 457 912
GAL42 Spotted seatrout 440 805
Site 6 Galveston Bay at Campbell Bayou
1778 GAL29 Red drum 680 3261
GAL30 Red drum 700 3518
GAL31 Sand trout 360 534
GAL32 Black drum 801 12825
GAL34 Southern flounder 450 928
GAL36 Southern flounder 429 861
GAL37 Southern flounder 410 735
GAL77 Spotted seatrout 388 532
GAL78 Spotted seatrout 351 385
GAL79 Spotted seatrout 407 713

36
Table 1a cont. Fish samples collected from the Galveston Bay Estuary
from February 9, 2010 through April 27, 2010. Sample number, species,
length, and weight are recorded for each sample.
Sample Number Species Length
(mm)
Weight
(g)
Site 7 Galveston Bay at Stephenson Point
GAL55 Red drum 680 3270
GAL58 Black drum 587 2840
GAL59 Southern flounder 383 613
GAL61 Alligator gar 1244 12144
Site 8 Galveston Bay at Marsh Point/Rollover Pass
GAL62 Black drum 622 3731
GAL65 Red drum 645 2727
GAL67 Southern flounder 416 952
GAL68 Southern flounder 402 785
GAL69 Spotted seatrout 366 423
GAL70 Spotted seatrout 389 577
GAL71 Spotted seatrout 543 1601
GAL72 Spotted seatrout 425 726
GAL73 Spotted seatrout 523 1352
GAL74 Spotted seatrout 648 2701
GAL75 Spotted seatrout 529 1369
GAL76 Spotted seatrout 510 1261
Site 9 Galveston Bay at Alligator Point
GAL50 Black drum 738 6599
GAL52 Red drum 710 3843
GAL53 Southern flounder 435 920
GAL54 Alligator gar 1397 20203
Site 10 Galveston Bay at Cold Pass/San Luis Pass
GAL8 Southern flounder 412 770
GAL10 Red drum 890 6749
GAL11 Black drum 480 1779
GAL84 Sand trout 298 226
GAL92 Spotted seatrout 345 398
GAL93 Spotted seatrout 425 733
Site 11 Galveston Bay at Carancahua Reef/Shell Island
GAL45 Red drum 725 3886
GAL48 Black drum 632 3578
Site 12 Galveston Bay at the Galveston Causeway
GAL80 Spotted seatrout 480 1149
GAL81 Spotted seatrout 474 1058
GAL82 Spotted seatrout 381 527
GAL83 Sand trout 329 321

37
Table 1a cont. Fish samples collected from the Galveston Bay Estuary
from February 9, 2010 through April 27, 2010. Sample number, species,
length, and weight are recorded for each sample.
Sample Number Species Length
(mm)
Weight
(g)
Site 13 Galveston Bay at Offatts Bayou
GAL147 Gafftopsail catfish 557 1802
Site 14 Galveston Bay at Galveston Island West
GAL146 Spotted seatrout 450 925
Site 15 Galveston Bay at Galveston Ship Channel/Yacht Basin
GAL94 Spotted seatrout 427 710
GAL95 Sand trout 292 222
GAL96 Sand trout 311 315
GAL97 Sand trout 294 195
GAL98 Sand trout 297 224
GAL99 Sand trout 282 217
GAL100 Sand trout 275 194
GAL101 Sand trout 277 230
GAL102 Sand trout 282 195
GAL148 Sand trout 288 236
GAL149 Sand trout 269 211
GAL150 Sand trout 294 244
Site 16 Galveston Bay at Houston Point
GAL200 Spotted seatrout 423 907
GAL201 Gafftopsail catfish 582 2106
GAL202 Gafftopsail catfish 410 619
GAL203 Gafftopsail catfish 389 488
Site 17 Galveston Bay at Hanna Reef
GAL211 Spotted seatrout 420 NA
GAL212 Spotted seatrout 452 NA
GAL213 Spotted seatrout 396 NA
GAL215 Spotted seatrout 440 NA
GAL217 Spotted seatrout 447 NA
Site 18 Galveston Bay at East Bay/North Shore
GAL218 Spotted seatrout 683 3753
GAL220 Spotted seatrout 578 2076
GAL224 Spotted seatrout 615 2359
GAL225 Spotted seatrout 576 2029
GAL226 Spotted seatrout 602 2170
GAL227 Spotted seatrout 454 901
Site 19 Galveston Bay at Christmas Bay
GAL85 Gafftopsail catfish 580 NA
GAL86 Spotted seatrout 389 NA

38
Table 1a cont. Fish samples collected from the Galveston Bay Estuary
from February 9, 2010 through April 27, 2010. Sample number, species,
length, and weight are recorded for each sample.
Sample Number Species Length
(mm)
Weight
(g)
Site 19 Galveston Bay at Christmas Bay (cont.)
GAL87 Spotted seatrout 593 NA
GAL88 Spotted seatrout 560 NA
GAL89 Spotted seatrout 508 NA
GAL90 Spotted seatrout 312 NA
GAL91 Spotted seatrout 550 NA
GAL204 Gafftopsail catfish 526 1393
GAL205 Gafftopsail catfish 511 1329
GAL206 Gafftopsail catfish 420 589
Table 1b. Spotted seatrout samples collected from the San Jacinto River
and Houston Ship Channel in January 2011. Sample number, species,
length, and weight are recorded for each sample.
Sample Number Species Length
(mm)
Weight
(g)
San Jacinto River / Houston Ship Channel
SJR15 Spotted seatrout 500 1301
SJR16 Spotted seatrout 410 706
SJR31 Spotted seatrout 387 660
SJR34 Spotted seatrout 451 1060
SJR43 Spotted seatrout 617 2400
SJR45 Spotted seatrout 549 1559

39
Table 2a. Arsenic (mg/kg) in fish collected from the Galveston Bay Estuary, 2010–2011.
Species
# Detected/
# Sampled
Total Arsenic
Mean Concentration
±±±± S.D.
(Min-Max)
Inorganic Arsenic
Mean
Concentration*
Health Assessment
Comparison Value
(mg/kg)†
Basis for Comparison
Value
Alligator gar 2/2 5.350±3.679
(2.748-7.951) 0.535‡*
0.7
0.363
EPA chronic oral RfD for
Inorganic arsenic: 0.0003
mg/kg–day
EPA oral slope factor for
inorganic arsenic: 1.5 per
mg/kg–day
Black drum 9/9 2.137±1.119
(0.377-4.077) 0.214
Gafftopsail catfish 18/18 1.581±0.701
(0.326-2.622) 0.158
Red drum 10/10 1.075±0.932
(0.334-2.909) 0.108
Sand trout 16/17 0.393±0.576
(ND-2.303) 0.040
Southern flounder 9/9 0.966±0.529
(0.261-1.834) 0.097
Spotted seatrout 69/69 0.680±0.978
(BDL-4.117) 0.068
Striped bass 2/2 0.146±0.032
(0.123-0.168) 0.015
All fish combined 135/136 0.969±1.163
(ND-7.951) 0.097
* Most arsenic in fish and shellfish occurs as organic arsenic, considered virtually nontoxic. For risk assessment
calculations, DSHS assumes that total arsenic is composed of 10% inorganic arsenic in fish and shellfish tissues. † Derived from the MRL or RfD for noncarcinogens or the EPA slope factor for carcinogens; assumes a body weight
of 70 kg, and a consumption rate of 30 grams per day, and assumes a 30-year exposure period for carcinogens and
an excess lifetime cancer risk of 1x10⁻⁴
. ‡ Emboldened numbers denote that arsenic concentrations equaled or exceeded the DSHS HAC value for arsenic.

40
Table 2b. Inorganic contaminants (mg/kg) in fish collected from the Galveston Bay
Estuary, 2010–2011.
Species # Detected/
# Sampled
Mean Concentration
±±±± S.D.
(Min-Max)
Health Assessment
Comparison Value
(mg/kg)
Basis for Comparison Value
Cadmium
Alligator gar 2/2 BDL*
0.47 ATSDR chronic oral MRL:
0.0002 mg/kg–day
Black drum 6/9 BDL
Gafftopsail catfish 7/18 BDL
Red drum 6/10 0.023±0.013
(ND-0.060)
Sand trout 7/17 BDL
Southern flounder 6/9 BDL
Spotted seatrout 44/69 0.031±0.036
(ND-0.262)
Striped bass 1/2 BDL
All fish combined 79/136 0.027±0.031
(ND†-0.262)
Copper
Alligator gar 2/2 0.076±0.001
(0.075-0.077)
334 National Academy of Science Upper Limit:
0.143 mg/kg–day
Black drum 9/9 0.244±0.083
(0.171-0.413)
Gafftopsail catfish 18/18 0.346±0.104
(0.175-0.600)
Red drum 10/10 0.218±0.058
(0.145-0.319)
Sand trout 17/17 0.173±0.041
(0.078-0.239)
Southern flounder 9/9 0.119±0.010
(0.104-0.134)
Spotted seatrout 69/69 0.238±0.283
(0.087-2.043)
Striped bass 2/2 0.274±0.072
(0.223-0.325)
All fish combined 136/136 0.233±0.215
(0.075-2.043)
* BDL: “Below Detection Limit” – Concentrations were reported as less than the laboratory’s reporting limit (“J”
values). In some instances, a “J” value was used to denote the discernable presence in a sample of a contaminant at
concentrations estimated as different from the sample blank. † ND: “Not Detected” was used to indicate that a compound was not present in a sample at a level greater than the
reporting limit.

41
Table 2c. Inorganic contaminants (mg/kg) in fish collected from the Galveston Bay
Estuary, 2010–2011.
Species # Detected/
# Sampled
Mean Concentration
±±±± S.D.
(Min-Max)
Health Assessment
Comparison Value
(mg/kg)
Basis for Comparison Value
Lead
Alligator gar 2/2 0.038±0.023
(BDL-0.054)
NA EPA IEUBKwin32 Version 1.1 Build 9
Black drum 7/9 0.070±0.057
(ND-0.190)
Gafftopsail catfish 17/18 0.027±0.012
(ND-0.054)
Red drum 5/10 0.060-0.063
(ND-0.223)
Sand trout 14/17 0.025±0.019
(ND-0.095)
Southern flounder 8/9 0.074±0.080
(ND-0.253)
Spotted seatrout 60/69 0.052±0.061
(ND-0.423)
Striped bass 2/2 BDL
All fish combined 115/136 0.048±0.055
(ND-0.423)
Mercury
Alligator gar 2/2 0.197±0.061
(0.154-0.240)
0.7 ATSDR chronic oral MRL: 0.0003 mg/kg–day
Black drum 9/9 0.228±0.201
(0.043-0.607)
Gafftopsail catfish 18/18 0.292±0.135
(0.127-0.626)
Red drum 10/10 0.161±0.121
(0.074-0.485)
Sand trout 17/17 0.074±0.023
(0.046-0.121)
Southern flounder 9/9 0.064±0.013
(0.049-0.090)
Spotted seatrout 72/72 0.134±0.104
(0.048-0.825*)
Striped bass 2/2 0.346±0.151
(0.239-0.453)
All fish combined 139/139 0.155±0.128
(0.043-0.825)
*Emboldened numbers denote that mercury concentrations equaled or exceeded a DSHS HAC value for mercury.

42
Table 2d. Inorganic contaminants (mg/kg) in fish collected from the Galveston Bay
Estuary, 2010–2011.
Species # Detected/
# Sampled
Mean Concentration
±±±± S.D.
(Min-Max)
Health Assessment
Comparison Value
(mg/kg)
Basis for Comparison Value
Selenium
Alligator gar 2/2 0.349±0.167
(0.231-0.467)
6
EPA chronic oral RfD: 0 .005 mg/kg–day
ATSDR chronic oral MRL: 0.005 mg/kg–day
NAS UL: 0.400 mg/day (0.005 mg/kg–day)
RfD or MRL/2: (0.005 mg/kg –day/2= 0.0025
mg/kg–day) to account for other sources of
selenium in the diet
Black drum 9/9 0.846±0.137
(0.628-1.041)
Gafftopsail catfish 18/18 0.202±0.058
(0.124-0.323)
Red drum 10/10 0.587±0.148
(0.366-0.807)
Sand trout 17/17 0.605±0.163
(0.470-1.107)
Southern flounder 9/9 0.597±0.067
(0.490-0.720)
Spotted seatrout 69/69 0.696±0.208
(0.151-1.263)
Striped bass 2/2 0.525±0.218
(0.371-0.679)
All fish combined 136/136 0.607±0.244
(0.124-1.263)
Zinc
Alligator gar 2/2 2.629±0.049
(2.594-2.663)
700 EPA chronic oral RfD: 0.3 mg/kg–day
Black drum 9/9 3.392±0.660
(2.579-4.440)
Gafftopsail catfish 18/18 5.059±1.260
(3.112-7.691)
Red drum 10/10 2.701±0.283
(2.179-3.055)
Sand trout 17/17 2.825±0.810
(2.018-5.420)
Southern flounder 9/9 2.658±0.824
(1.982-4.787)
Spotted seatrout 69/69 2.820±0.862
(1.220-6.843)
Striped bass 2/2 2.933±0.428
(2.630-3.235)
All fish combined 136/136 3.134±1.148
(1.220-7.691)

43
Table 3. Pesticides (mg/kg) in fish collected from the Galveston Bay Estuary, 2010–2011.
Species # Detected /
# Sampled
Mean Concentration
±±±± S.D.
(Min-Max)
Health
Assessment
Comparison
Value (mg/kg)
Basis for Comparison
Value
Chlordane
Alligator gar 2/2 0.002±0.0003
(0.001-0.002)
1.167
1.556
EPA chronic oral RfD: 0.0005 mg/kg–day
EPA slope factor 0.35 per mg/kg - day
Black drum 2/2 0.002±0.002
(BDL-0.028)
Gafftopsail catfish 4/4 0.017±0.028
(0.001-0.059)
Red drum 3/3 0.006±0.006
(BDL-0.012)
Spotted seatrout 10/10 0.013±0.008
(BDL-0.031)
Striped bass 2/2 0.010±0.008
(0.005-0.016)
All fish combined 23/23 0.011±0.013
(BDL-0.059)
4,4′-DDE
Alligator gar 2/2 0.004±0.004
(0.001-0.007)
1.167
1.601
EPA chronic oral RfD: 0.0005 mg//kg–day
EPA slope factor 0.34 per mg/kg–day
Black drum 2/2 BDL
Gafftopsail catfish 4/4 0.021±0.028
(0.005-0.063)
Red drum 3/3 0.0007±0.0004
(BDL-0.001)
Spotted seatrout 10/10 0.009±0.007
(BDL-0.023)
Striped bass 2/2 0.062±0.075
(0.009-0.116)
All fish combined 23/23 0.013±0.026
(BDL-0.116)
4,4′-DDD
Alligator gar 2/2 BDL
1.167
2.269
EPA chronic oral RfD: 0.0005 mg//kg–day
EPA slope factor 0.24 per mg/kg–day
Black drum 1/2 BDL
Gafftopsail catfish 4/4 0.006±0.010
(BDL-0.020)
Red drum 2/3 BDL
Spotted seatrout 9/10 0.003±0.003
(ND-0.011)
Striped bass 2/2 0.002±0.002
(BDL-0.003)
All fish combined 20/23 0.002±0.004
(ND-0.020)

44
Table 4a. PCBs (mg/kg) in fish collected from the Galveston Bay Estuary, 2010–2011.
Species # Detected /
# Sampled
Mean Concentration
±±±± S.D.
(Min-Max)
Health
Assessment
Comparison
Value (mg/kg)
Basis for Comparison Value
Site 1 Galveston Bay at Tabbs Bay
Black drum 1/1 0.010
0.047
0.272
EPA chronic oral RfD: 0.00002 mg/kg–day
EPA slope factor: 2.0 per mg/kg–day
Gafftopsail catfish 3/3 0.166*±0.083
(0.092-0.255)
Spotted seatrout 3/3 0.103±0.035
(0.081-0.143)
All fish combined 7/7 0.117±0.077
(0.010-0.255)
Site 2 Galveston Bay at Yacht Club Marina
Gafftopsail catfish 3/3 0.075±0.029
(0.047-0.104)
0.047
0.272
EPA chronic oral RfD: 0.00002 mg/kg–day
EPA slope factor: 2.0 per mg/kg–day
Sand trout 1/1 0.015
Spotted seatrout 7/7 0.044±0.011
(0.023-0.056)
All fish combined 11/11 0.050±0.024
(0.015-0.104)
Site 3 Galveston Bay at Houston Light and Power
Gafftopsail catfish 4/4 0.074±0.043
(0.037-0.137)
0.047
0.272
EPA chronic oral RfD: 0.00002 mg/kg–day
EPA slope factor: 2.0 per mg/kg–day
Southern flounder 1/1 0.010
Spotted seatrout 4/4 0.028±0.013
(0.013-0.041)
All fish combined 9/9 0.047±0.039
(0.010-0.137)
Site 4 Galveston Bay at Pine Gulley
Black drum 1/1 0.013
0.047
0.272
EPA chronic oral RfD: 0.00002 mg/kg–day
EPA slope factor: 2.0 per mg/kg–day
Red drum 2/2 0.021±0.011
(0.013-0.028)
Sand trout 2/2 0.065±0.005
(0.061-0.068)
Striped bass 2/2 0.033±0.019
(0.019-0.047)
All fish combined 7/7 0.036±0.023
(0.013-0.068)
*Emboldened numbers denote that PCB concentrations equaled or exceeded the DSHS HAC value for PCBs.

45
Table 4b. PCBs (mg/kg) in fish collected from the Galveston Bay Estuary, 2010–2011.
Species # Detected /
# Sampled
Mean Concentration
±±±± S.D.
(Min-Max)
Health
Assessment
Comparison
Value (mg/kg)
Basis for Comparison Value
Site 5 Galveston Bay at Redfish Island/Bayshore Park
Black drum 1/1 0.037
0.047
0.272
EPA chronic oral RfD: 0.00002 mg/kg–day
EPA slope factor: 2.0 per mg/kg–day
Red drum 1/1 0.034
Spotted seatrout 16/16 0.039±0.014
(0.019-0.064*)
All fish combined 18/18 0.039±0.013
(0.019-0.064)
Site 6 Galveston Bay at Campbell Bayou
Black drum 1/1 0.022
0.047
0.272
EPA chronic oral RfD: 0.00002 mg/kg–day
EPA slope factor: 2.0 per mg/kg–day
Red drum 2/2 0.020±0.002
(0.019-0.022)
Sand trout 1/1 0.083
Southern flounder 3/3 0.013±0.003
(0.010-0.016)
Spotted seatrout 3/3 0.042±0.019
(0.028-0.064)
All fish combined 10/10 0.031±0.024
(0.010-0.083)
Site 7 Galveston Bay at Stephenson Point
Alligator gar 1/1 0.020
0.047
0.272
EPA chronic oral RfD: 0.00002 mg/kg–day
EPA slope factor: 2.0 per mg/kg–day
Black drum 1/1 0.009
Red drum 1/1 BDL
Southern flounder 1/1 0.020
All fish combined 4/4 0.015±0.006
(BDL-0.020)
Site 8 Galveston Bay at Marsh Point/Rollover Pass
Black drum 1/1 BDL
0.047
0.272
EPA chronic oral RfD: 0.00002 mg/kg–day
EPA slope factor: 2.0 per mg/kg–day
Red drum 1/1 BDL
Southern flounder 2/2 BDL
Spotted seatrout 8/8 0.014±0.005
(BDL-0.023)
All fish combined 12/12 0.013±0.005
(BDL-0.023)
*Emboldened numbers denote that PCB concentrations equaled or exceeded the DSHS HAC value for PCBs.

46
Table 4c. PCBs (mg/kg) in fish collected from the Galveston Bay Estuary, 2010–2011.
Species # Detected /
# Sampled
Mean Concentration
±±±± S.D.
(Min-Max)
Health
Assessment
Comparison
Value (mg/kg)
Basis for Comparison Value
Site 9 Galveston Bay at Alligator Point
Alligator gar 1/1 0.019
0.047
0.272
EPA chronic oral RfD: 0.00002 mg/kg–day
EPA slope factor: 2.0 per mg/kg–day
Black drum 1/1 0.010
Red drum 1/1 0.011
Southern flounder 1/1 BDL
All fish combined 4/4 0.012±0.005
(BDL-0.019)
Site 10 Galveston Bay at Cold Pass/San Luis Pass
Black drum 1/1 BDL
0.047
0.272
EPA chronic oral RfD: 0.00002 mg/kg–day
EPA slope factor: 2.0 per mg/kg–day
Red drum 1/1 0.015
Sand trout 1/1 0.013
Southern flounder 1/1 0.010
Spotted seatrout 2/2 0.013±0.001
(0.012-0.014)
All fish combined 6/6 0.012±0.002
(BDL-0.015)
Site 11 Galveston Bay at Carancahua Reef/Shell Island
Black drum 1/1 BDL
0.047
0.272
EPA chronic oral RfD: 0.00002 mg/kg–day
EPA slope factor: 2.0 per mg/kg–day
Red drum 1/1 BDL
All fish combined 2/2 BDL
Site 12 Galveston Bay at Galveston Causeway
Sand trout 1/1 0.012
0.047
0.272
EPA chronic oral RfD: 0.00002 mg/kg–day
EPA slope factor: 2.0 per mg/kg–day
Spotted seatrout 3/3 0.027±0.021
(0.013-0.050*)
All fish combined 4/4 0.023±0.018
(0.012-0.050)
Site 13 Galveston Bay at Offatts Bayou
Gafftopsail catfish 1/1 0.083 0.047
0.272
EPA chronic oral RfD: 0.00002 mg/kg–day
EPA slope factor: 2.0 per mg/kg–day All fish combined 1/1 0.083
*Emboldened numbers denote that PCB concentrations equaled or exceeded the DSHS HAC value for PCBs.

47
Table 4d. PCBs (mg/kg) in fish collected from the Galveston Bay Estuary, 2010–2011.
Species # Detected /
# Sampled
Mean Concentration
±±±± S.D.
(Min-Max)
Health
Assessment
Comparison
Value (mg/kg)
Basis for Comparison Value
Site 14 Galveston Bay at Galveston Island West
Spotted seatrout 1/1 0.024 0.047
0.272
EPA chronic oral RfD: 0.00002 mg/kg–day
EPA slope factor: 2.0 per mg/kg–day All fish combined 1/1 0.024
Site 15 Galveston Bay at Galveston Ship Channel/Yacht Basin
Sand trout 11/11 0.019±0.011
(BDL-0.043) 0.047
0.272
EPA chronic oral RfD: 0.00002 mg/kg–day
EPA slope factor: 2.0 per mg/kg–day
Spotted seatrout 1/1 0.013
All fish combined 12/12 0.018±0.010
(BDL-0.043)
Site 16 Galveston Bay at Houston Point
Gafftopsail catfish 3/3 0.036±0.011
(0.028-0.048*) 0.047
0.272
EPA chronic oral RfD: 0.00002 mg/kg–day
EPA slope factor: 2.0 per mg/kg–day
Spotted seatrout 1/1 0.025
All fish combined 4/4 0.033±0.010
(0.025-0.048)
Site 17 Galveston Bay at Hanna Reef
Spotted seatrout 5/5 0.022±0.005
(0.016-0.029) 0.047
0.272
EPA chronic oral RfD: 0.00002 mg/kg–day
EPA slope factor: 2.0 per mg/kg–day All fish combined 5/5 0.022±0.005
(0.016-0.029)
Site 18 Galveston Bay at East Bay/North Shore
Spotted seatrout 6/6 0.023±0.010
(0.014-0.039) 0.047
0.272
EPA chronic oral RfD: 0.00002 mg/kg–day
EPA slope factor: 2.0 per mg/kg–day All fish combined 6/6 0.023±0.010
(0.014-0.039)
Site 19 Galveston Bay at Christmas Bay
Gafftopsail catfish 4/4 0.028±0.020
(0.011-0.056) 0.047
0.272
EPA chronic oral RfD: 0.00002 mg/kg–day
EPA slope factor: 2.0 per mg/kg–day
Spotted seatrout 6/6 0.012±0.003
(BDL-0.016)
All fish combined 10/10 0.018±0.014
(BDL-0.056)
*Emboldened numbers denote that PCB concentrations equaled or exceeded the DSHS HAC value for PCBs.

48
Table 4e. PCBs (mg/kg) in fish collected from the Galveston Bay Estuary, 2010–2011.
Species # Detected /
# Sampled
Mean Concentration
±±±± S.D.
(Min-Max)
Health
Assessment
Comparison
Value (mg/kg)
Basis for Comparison Value
San Jacinto River / Houston Ship Channel
Spotted seatrout 6/6 0.114*±0.081
(0.019-0.237)
0.047
0.272
EPA chronic oral RfD: 0.00002 mg/kg–day
EPA slope factor: 2.0 per mg/kg–day
All fish combined 6/6 0.114±0.081
(0.019-0.237)
All Sample Sites
Alligator gar 2/2 0.020±0.0007
(0.019-0.020)
0.047
0.272
EPA chronic oral RfD: 0.00002 mg/kg–day
EPA slope factor: 2.0 per mg/kg–day
Black drum 9/9 0.015±0.009
(BDL-0.037)
Gafftopsail catfish 18/18 0.073±0.060
(0.011-0.255)
Red drum 10/10 0.017±0.009
(BDL-0.034)
Sand trout 17/17 0.027±0.023
(BDL-0.083)
Southern flounder 9/9 0.012±0.004
(BDL-0.020)
Spotted seatrout 72/72 0.038±0.038
(BDL-0.237)
Striped bass 2/2 0.033±0.019
(0.019-0.047)
All fish combined 139/139 0.036±0.039
(BDL-0.255)
*Emboldened numbers denote that PCB concentrations equaled or exceeded the DSHS HAC value for PCBs.

49
Table 4f. PCBs (mg/kg) in spotted seatrout collected from the Galveston Bay Estuary,
2010–2011.
# Detected /
# Sampled
Mean Concentration
±±±± S.D.
(Min-Max)
Health Assessment
Comparison Value
(mg/kg)
Basis for Comparison Value
Composite Area 1 Galveston Bay System (North of line from Red Bluff Point to Five-Mile Cut Marker to
Houston Point)
16/16 0.081±0.060
(0.019-0.237)
0.047
0.272
EPA chronic oral RfD: 0.00002 mg/kg–day
EPA slope factor: 2.0 per mg/kg–day
Composite Area 2 Galveston Bay System (South of line from Red Bluff Point to Five-Mile Cut Marker to
Houston Point)
56/56 0.026±0.015
(BDL-0.064)
0.047
0.272
EPA chronic oral RfD: 0.00002 mg/kg–day
EPA slope factor: 2.0 per mg/kg–day
All Sample Sites
72/72 0.038±0.038
(BDL-0.237)
0.047
0.272
EPA chronic oral RfD: 0.00002 mg/kg–day
EPA slope factor: 2.0 per mg/kg–day

50
Table 5a. PCDDs/PCDFs toxicity equivalent (TEQ) concentrations (pg/g) in fish collected
from the Galveston Bay Estuary, 2010–2011.
Species # Detected /
# Sampled
Mean Concentration
±±±± S.D.
(Min-Max)
Health
Assessment
Comparison
Value (pg/kg)
Basis for Comparison Value
Site 1 Galveston Bay at Tabbs Bay
Black Drum 0/1 ND
2.33
3.49
ATSDR chronic oral MRL: 1.0 x 10⁻⁹
mg/kg/day
EPA slope factor: 1.56 x 10⁵ per
mg/kg/day
Gafftopsail catfish 1/3 1.352±2.342
(ND-4.056*)
Spotted seatrout 1/3 0.00006±0.0001
(ND-0.0002
All fish combined 2/7 0.579±1.533
(ND-4.056)
Site 2 Galveston Bay at Yacht Club Marina
Gafftopsail catfish 3/3 2.163±3.745
(0.0003-6.487)
2.33
3.49
ATSDR chronic oral MRL: 1.0 x 10⁻⁹
mg/kg/day
EPA slope factor: 1.56 x 10⁵ per
mg/kg/day
Sand trout 0/1 ND
Spotted seatrout 3/7 0.0002±0.0004
(ND-0.001)
All fish combined 6/11 0.590±1.956
(ND-6.487)
Site 3 Galveston Bay at Houston Light and Power
Gafftopsail catfish 1/4 0.0003±0.0006
(ND-0.001)
2.33
3.49
ATSDR chronic oral MRL: 1.0 x 10⁻⁹
mg/kg/day
EPA slope factor: 1.56 x 10⁵ per
mg/kg/day
Southern flounder 0/1 ND
Spotted seatrout 1/4 0.0001±0.0002
(ND-0.0005)
All fish combined 2/9 0.0002±0.0004
(ND-0.001)
Site 4 Galveston Bay at Pine Gulley
Black drum 1/1 0.297
2.33
3.49
ATSDR chronic oral MRL: 1.0 x 10⁻⁹
mg/kg/day
EPA slope factor: 1.56 x 10⁵ per
mg/kg/day
Red drum 1/2 0.625±0.884
(ND-1.251)
Sand trout 2/2 1.711±0.198
(1.571-1.851)
Striped bass 2/2 0.002±0.001
(BDL-0.003)
All fish combined 6/7 0.711±0.818
(ND-1.851)
.
*Emboldened numbers denote that PCDD/PCDF concentrations equaled or exceeded the DSHS HAC value for
PCDDs/PCDFs.

51
Table 5b. PCDDs/PCDFs toxicity equivalent (TEQ) concentrations (pg/g) in fish collected
from the Galveston Bay Estuary, 2010–2011.
Species # Detected /
# Sampled
Mean Concentration
±±±± S.D.
(Min-Max)
Health
Assessment
Comparison
Value (pg/kg)
Basis for Comparison Value
Site 5 Galveston Bay at Redfish Island/Bayshore Park
Black drum 1/1 0.0005
2.33
3.49
ATSDR chronic oral MRL: 1.0 x 10⁻⁹
mg/kg/day
EPA slope factor: 1.56 x 10⁵ per
mg/kg/day
Red drum 1/1 1.678
Spotted seatrout 11/16 0.434±0.424
(ND-1.407)
All fish combined 13/18 0.479±0.509
(ND-1.678)
Site 6 Galveston Bay at Campbell Bayou
Black drum 0/1 ND
2.33
3.49
ATSDR chronic oral MRL: 1.0 x 10⁻⁹
mg/kg/day
EPA slope factor: 1.56 x 10⁵ per
mg/kg/day
Red drum 0/2 ND
Sand Trout 1/1 0.0003
Southern flounder 1/3 0.00004±0.00006
(ND-0.00001)
Spotted seatrout 0/3 ND
All fish combined 2/10 0.00004±0.00009
(ND-0.0003)
Site 7 Galveston Bay at Stephenson Point
Alligator gar 0/1 ND
2.33
3.49
ATSDR chronic oral MRL: 1.0 x 10⁻⁹
mg/kg/day
EPA slope factor: 1.56 x 10⁵ per
mg/kg/day
Black drum 0/1 ND
Red drum 1/1 0.00007
Southern flounder 0/1 ND
All fish combined 1/4 0.00002±0.00004
(ND-0.00007)

52
Table 5c. PCDDs/PCDFs toxicity equivalent (TEQ) concentrations (pg/g) in fish collected
from the Galveston Bay Estuary, 2010–2011.
Species # Detected /
# Sampled
Mean Concentration
±±±± S.D.
(Min-Max)
Health
Assessment
Comparison
Value (pg/kg)
Basis for Comparison Value
Site 8 Galveston Bay at Marsh Point/Rollover Pass
Black drum 0/1 ND
2.33
3.49
ATSDR chronic oral MRL: 1.0 x 10⁻⁹
mg/kg/day
EPA slope factor: 1.56 x 10⁵ per
mg/kg/day
Red drum 0/1 ND
Southern flounder 1/2 0.033±0.046
(ND-0.066)
Spotted seatrout 4/8 0.033±0.092
(ND-0.260)
All fish combined 5/12 0.028±0.076
(ND-0.260)
Site 9 Galveston Bay at Alligator Point
Alligator gar 0/1 ND
2.33
3.49
ATSDR chronic oral MRL: 1.0 x 10⁻⁹
mg/kg/day
EPA slope factor: 1.56 x 10⁵ per
mg/kg/day
Black Drum 0/1 ND
Red drum 0/1 ND
Southern flounder 0/1 ND
All fish combined 0/4 ND
Site 10 Galveston Bay at Cold Pass/San Luis Pass
Black drum 1/1 0.020
2.33
3.49
ATSDR chronic oral MRL: 1.0 x 10⁻⁹
mg/kg/day
EPA slope factor: 1.56 x 10⁵ per
mg/kg/day
Red drum 1/1 0.451
Sand trout 0/1 ND
Southern flounder 1/1 0.377
Spotted seatrout 1/2 0.00008±0.0001
(ND-0.0002)
All fish combined 4/6 0.141±0.212
(ND-0.451)
Site 11 Galveston Bay at Carancahua Reef/Shell Island
Black drum 1/1 0.003 2.33
3.49
ATSDR chronic oral MRL: 1.0 x 10⁻⁹
mg/kg/day
EPA slope factor: 1.56 x 10⁵ per
mg/kg/day
Red drum 1/1 0.040
All fish combined 2/2 0.022±0.026
(0.003-0.040)

53
Table 5d. PCDDs/PCDFs toxicity equivalent (TEQ) concentrations (pg/g) in fish collected
from the Galveston Bay Estuary, 2010–2011.
Species # Detected /
# Sampled
Mean Concentration
±±±± S.D.
(Min-Max)
Health
Assessment
Comparison
Value (pg/kg)
Basis for Comparison Value
Site 12 Galveston Bay at Galveston Causeway
Sand trout 0/1 ND 2.33
3.49
ATSDR chronic oral MRL: 1.0 x 10⁻⁹
mg/kg/day
EPA slope factor: 1.56 x 10⁵ per
mg/kg/day
Spotted seatrout 3/3 0.0004±0.0003
(0.00005-0.0006)
All fish combined 3/4 0.0003±0.0003
(ND-0.0006)
Site 13 Galveston Bay at Offatts Bayou
Gafftopsail catfish 1/1 1.943 2.33
3.49
ATSDR chronic oral MRL: 1.0 x 10⁻⁹
mg/kg/day
EPA slope factor: 1.56 x 10⁵ per
mg/kg/day All fish combined 1/1 1.943
Site 14 Galveston Bay at Galveston Island West
Spotted seatrout 0/1 ND 2.33
3.49
ATSDR chronic oral MRL: 1.0 x 10⁻⁹
mg/kg/day
EPA slope factor: 1.56 x 10⁵ per
mg/kg/day All fish combined 0/1 ND
Site 15 Galveston Bay at Galveston Ship Channel/Yacht Basin
Sand trout 3/11 0.0002±0.0004
(ND-0.001) 2.33
3.49
ATSDR chronic oral MRL: 1.0 x 10⁻⁹
mg/kg/day
EPA slope factor: 1.56 x 10⁵ per
mg/kg/day
Spotted seatrout 0/1 ND
All fish combined 3/12 0.0001±0.0004
(ND-0.001)
Site 16 Galveston Bay at Houston Point
Gafftopsail catfish 2/3 0.007±0.011
(ND-0.020) 2.33
3.49
ATSDR chronic oral MRL: 1.0 x 10⁻⁹
mg/kg/day
EPA slope factor: 1.56 x 10⁵ per
mg/kg/day
Spotted seatrout 0/1 ND
All fish combined 2/4 0.006±0.010
(ND-0.020)
Site 17 Galveston Bay at Hanna Reef
Spotted seatrout 1/5 0.00004±0.00009
(ND-0.0002) 2.33
3.49
ATSDR chronic oral MRL: 1.0 x 10⁻⁹
mg/kg/day
EPA slope factor: 1.56 x 10⁵ per
mg/kg/day All fish combined 1/5 0.00004±0.00009
(ND-0.0002)

54
Table 5e. PCDDs/PCDFs toxicity equivalent (TEQ) concentrations (pg/g) in fish collected
from the Galveston Bay Estuary, 2010–2011.
Species # Detected /
# Sampled
Mean Concentration
±±±± S.D.
(Min-Max)
Health
Assessment
Comparison
Value (pg/kg)
Basis for Comparison Value
Site 18 Galveston Bay at East Bay/North Shore
Spotted seatrout 5/6 0.231±0.357
(ND-0.707) 2.33
3.49
ATSDR chronic oral MRL: 1.0 x 10⁻⁹
mg/kg/day
EPA slope factor: 1.56 x 10⁵ per
mg/kg/day All fish combined 5/6 0.231±0.357
(ND-0.707)
Site 19 Galveston Bay at Christmas Bay
Gafftopsail catfish 1/4 0.0005±0.001
(ND-0.002) 2.33
3.49
ATSDR chronic oral MRL: 1.0 x 10⁻⁹
mg/kg/day
EPA slope factor: 1.56 x 10⁵ per
mg/kg/day
Spotted seatrout 4/6 0.0002±0.0002
(ND-0.0004)
All fish combined 5/10 0.0004±0.0007
(ND-0.002)
San Jacinto River / Houston Ship Channel
Spotted seatrout 5/6 0.176±0.278
(ND-0.667) 2.33
3.49
ATSDR chronic oral MRL: 1.0 x 10⁻⁹
mg/kg/day
EPA slope factor: 1.56 x 10⁵ per
mg/kg/day
All fish combined 5/6 0.176±0.278
(ND-0.667)
All Sample Sites
Alligator gar 0/2 ND
2.33
3.49
ATSDR chronic oral MRL: 1.0 x 10⁻⁹
mg/kg/day
EPA slope factor: 1.56 x 10⁵ per
mg/kg/day
Black drum 4/9 0.036±0.098
(ND-0.297)
Gafftopsail catfish 9/18 0.695±1.776
(ND-6.487*)
Red drum 5/10 0.342±0.616
(ND-1.678)
Sand trout 6/17 0.201±0.570
(ND-1.851)
Southern flounder 3/9 0.049±0.125
(ND-0.377)
Spotted seatrout 39/72 0.134±0.291
(ND-1.407)
Striped bass 2/2 0.002±0.001
(0.001-0.003)
All fish combined 68/139 0.214±0.732
(ND-6.487)
*Emboldened numbers denote that PCDD/PCDF concentrations equaled or exceeded the DSHS HAC value for
PCDDs/PCDFs

55
Table 5f. PCDDs/PCDFs toxicity equivalent (TEQ) concentrations (pg/g) in spotted
seatrout collected from the Galveston Bay Estuary, 2010–2011.
# Detected /
# Sampled
Mean Concentration
±±±± S.D.
(Min-Max)
Health Assessment
Comparison Value
(mg/kg)
Basis for Comparison Value
Composite Area 1 Galveston Bay System (North of line from Red Bluff Point to Five-Mile Cut Marker to
Houston Point)
9/16 0.066±0.183
(ND-0.667)
2.33
3.49
ATSDR chronic oral MRL: 1.0 x 10⁻⁹
mg/kg/day
EPA slope factor: 1.56 x 10⁵ per
mg/kg/day
Composite Area 2 Galveston Bay System (South of line from Red Bluff Point to Five-Mile Cut Marker to
Houston Point)
30/56 0.154±0.314
(ND-1.407)
2.33
3.49
ATSDR chronic oral MRL: 1.0 x 10⁻⁹
mg/kg/day
EPA slope factor: 1.56 x 10⁵ per
mg/kg/day
All Sampling Sites
39/72 0.134±0.291
(ND-1.407)
2.33
3.49
ATSDR chronic oral MRL: 1.0 x 10⁻⁹
mg/kg/day
EPA slope factor: 1.56 x 10⁵ per
mg/kg/day
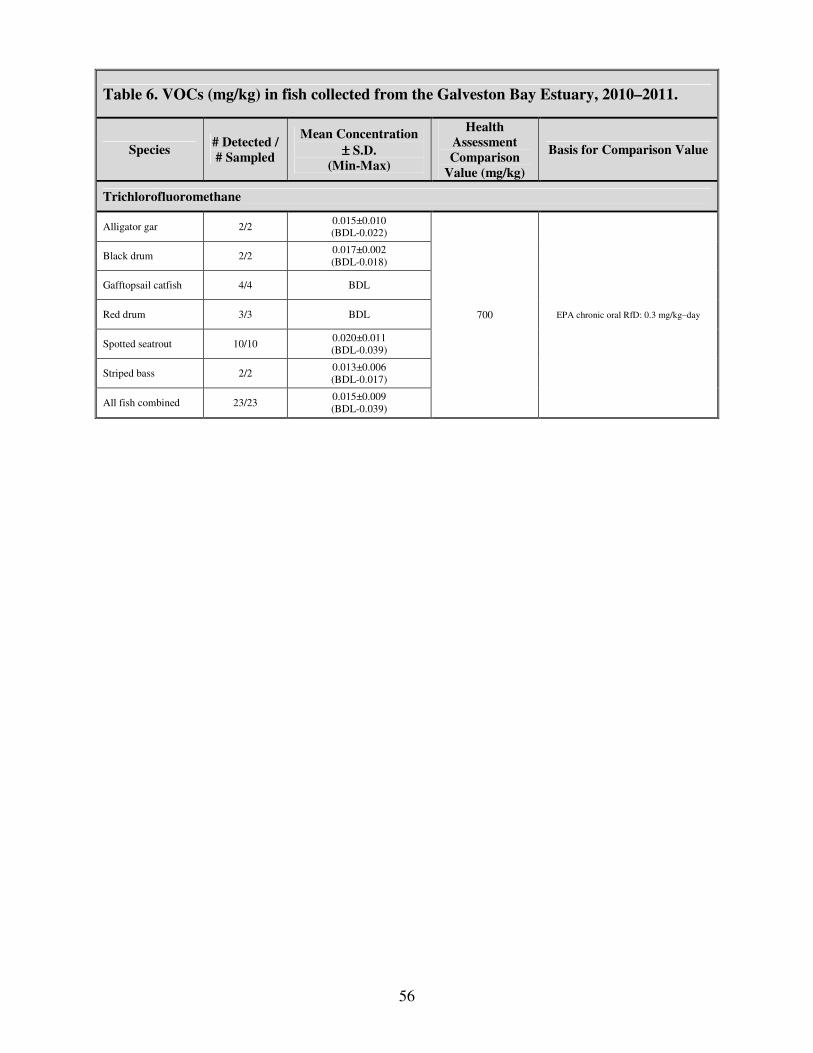
56
Table 6. VOCs (mg/kg) in fish collected from the Galveston Bay Estuary, 2010–2011.
Species # Detected /
# Sampled
Mean Concentration
±±±± S.D.
(Min-Max)
Health
Assessment
Comparison
Value (mg/kg)
Basis for Comparison Value
Trichlorofluoromethane
Alligator gar 2/2 0.015±0.010
(BDL-0.022)
700 EPA chronic oral RfD: 0.3 mg/kg–day
Black drum 2/2 0.017±0.002
(BDL-0.018)
Gafftopsail catfish 4/4 BDL
Red drum 3/3 BDL
Spotted seatrout 10/10 0.020±0.011
(BDL-0.039)
Striped bass 2/2 0.013±0.006
(BDL-0.017)
All fish combined 23/23 0.015±0.009
(BDL-0.039)

57
Table 7a. Hazard quotients (HQs) for arsenic in fish collected from the Galveston Bay
Estuary, 2010–2011. Table 7a also provides suggested weekly eight-ounce meal
consumption rates for 70-kg adults.
Species Number (N) Hazard Quotient Meals per Week
All Sample Sites
Alligator gar 2 0.76 1.2
Black drum 9 0.31 3.0
Gafftopsail catfish 18 0.23 4.1
Red drum 10 0.15 6.0
Sand trout 17 0.06 16.2
Southern flounder 9 0.14 6.7
Spotted seatrout 69 0.10 9.5
Striped bass 2 0.02 unrestricted‡*
All fish combined 136 0.14 6.7
Table 7b. Hazard quotients (HQs) for mercury in fish collected from Galveston Bay
Estuary, 2010–2011. Table 7b also provides suggested weekly eight-ounce meal
consumption rates for 70-kg adults.
Species Number (N) Hazard Quotient Meals per Week
All Sample Sites
Alligator gar 2 0.28 3.3
Black drum 9 0.33 2.8
Gafftopsail catfish 18 0.42 2.2
Red drum 10 0.23 4.0
Sand trout 17 0.11 8.8
Southern flounder 9 0.09 10.1
Spotted seatrout 72 0.19 4.8
Striped bass 2 0.49 1.9
All fish combined 139 0.22 4.2
* The term, unrestricted, denotes that the allowable 8-ounce meals per week are > 21.0.
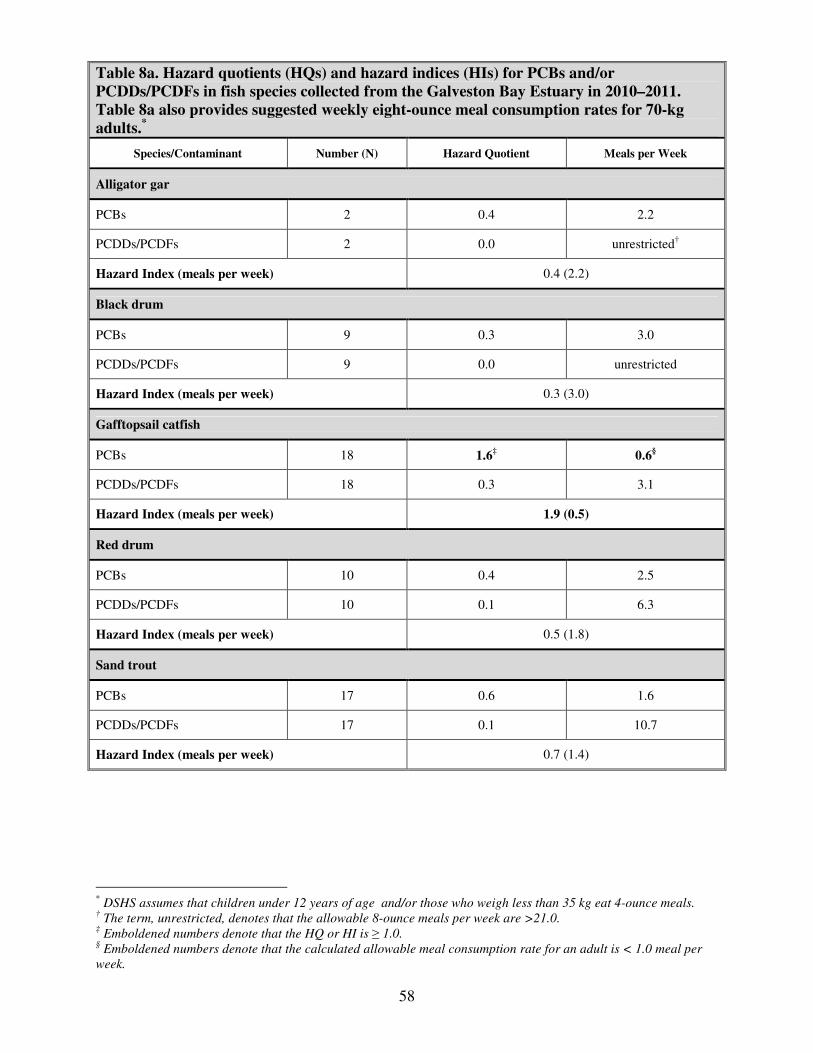
58
Table 8a. Hazard quotients (HQs) and hazard indices (HIs) for PCBs and/or
PCDDs/PCDFs in fish species collected from the Galveston Bay Estuary in 2010–2011.
Table 8a also provides suggested weekly eight-ounce meal consumption rates for 70-kg
adults.*
Species/Contaminant Number (N) Hazard Quotient Meals per Week
Alligator gar
PCBs 2 0.4 2.2
PCDDs/PCDFs 2 0.0 unrestricted†
Hazard Index (meals per week) 0.4 (2.2)
Black drum
PCBs 9 0.3 3.0
PCDDs/PCDFs 9 0.0 unrestricted
Hazard Index (meals per week) 0.3 (3.0)
Gafftopsail catfish
PCBs 18 1.6‡ 0.6
§
PCDDs/PCDFs 18 0.3 3.1
Hazard Index (meals per week) 1.9 (0.5)
Red drum
PCBs 10 0.4 2.5
PCDDs/PCDFs 10 0.1 6.3
Hazard Index (meals per week) 0.5 (1.8)
Sand trout
PCBs 17 0.6 1.6
PCDDs/PCDFs 17 0.1 10.7
Hazard Index (meals per week) 0.7 (1.4)
* DSHS assumes that children under 12 years of age and/or those who weigh less than 35 kg eat 4-ounce meals.
† The term, unrestricted, denotes that the allowable 8-ounce meals per week are >21.0.
‡ Emboldened numbers denote that the HQ or HI is ≥ 1.0.
§ Emboldened numbers denote that the calculated allowable meal consumption rate for an adult is < 1.0 meal per
week.

59
Table 8b. Hazard quotients (HQs) and hazard indices (HIs) for PCDDs/PCDFs and/or
PCBs in fish species collected from the Galveston Bay Estuary in 2010–2011. Table 8b also
provides suggested weekly eight-ounce meal consumption rates for 70-kg adults.*
Species/Contaminant Number (N) Hazard Quotient Meals per Week
Southern flounder
PCBs 9 0.3 3.6
PCDDs/PCDFs 9 0.0 unrestricted†
Hazard Index (meals per week) 0.3 (3.3)
Spotted seatrout
PCBs 72 0.8 1.1
PCDDs/PCDFs 72 0.1 16.1
Hazard Index (meals per week) 0.9 (1.1)
Striped bass
PCBs 2 0.7 1.3
PCDDs/PCDFs 2 0.0 unrestricted
Hazard Index (meals per week) 0.7 (1.3)
All fish combined
PCBs 139 0.8 1.2
PCDDs/PCDFs 139 0.1 10.1
Hazard Index (meals per week) 0.9 (1.1)
* DSHS assumes that children under 12 years of age and/or those who weigh less than 35 kg eat 4-ounce meals.
† The term, unrestricted, denotes that the allowable 8-ounce meals per week are >21.0.

60
Table 8c. Hazard quotients (HQs) and hazard indices (HIs) for PCDDs/PCDFs and/or
PCBs in spotted seatrout collected from the Galveston Bay Estuary in 2010–2011. Table 8c
also provides suggested weekly eight-ounce meal consumption rates for 70-kg adults.*
Species/Contaminant Number (N) Hazard Quotient Meals per Week
Composite Area 1 Galveston Bay System (North of line from Red Bluff Point to Five-Mile Cut Marker to
Houston Point)
PCBs 16 1.7† 0.5
‡
PCDDs/PCDFs 16 0.0 unrestricted‡
Hazard Index (meals per week) 1.7 (0.5)
Composite Area 2 Galveston Bay System (South of line from Red Bluff Point to Five-Mile Cut Marker to
Houston Point)Spotted seatrout
PCBs 55 0.6 1.7
PCDDs/PCDFs 55 0.1 14.0
Hazard Index (meals per week) 0.6 (1.5)
All Sample Sites
PCBs 72 0.8 1.1
PCDDs/PCDFs 72 0.1 16.1
Hazard Index (meals per week) 0.9 (1.1)
* DSHS assumes that children under 12 years of age and/or those who weigh less than 35 kg eat 4-ounce meals.
† Emboldened numbers denote that the HQ or HI is ≥ 1.0.
‡ Emboldened numbers denote that the calculated allowable meal consumption rate for an adult is < 1.0 meal per
week.

61
Table 9a. Calculated theoretical lifetime excess cumulative cancer risk from consuming fish
containing Arsenic, PCBs, and PCDDs/PCDFs collected in 2010–2011 from the Galveston
Bay Estuary and suggested consumption (8-ounce meals/week) for 70 kg adults who
regularly eat fish from Galveston Bay over a 30-year period.*
Species/Contaminant Number (N)
Theoretical Lifetime Excess Cancer Risk
Meals per Week Risk
1 excess cancer per
number of people
exposed
Alligator gar
Arsenic 2 1.5E-04† 6,784 0.6
‡
PCBs 2 7.3E-06 136,111 12.6
PCDDs/PCDFs 2 ---- ---- unrestricted‡
Cumulative Cancer Risk 1.5E-04 6,462 0.6
Black drum
Arsenic 9 5.9E-05 16,985 1.6
PCBs 9 5.5E-06 181,481 16.8
PCDDs/PCDFs 9 1.0E-06 977,599 unrestricted§
Cumulative Cancer Risk 6.5E-05 15,288 1.4
Gafftopsail catfish
Arsenic 18 4.4E-05 22,958 2.1
PCBs 18 2.7E-05 37,291 3.4
PCDDs/PCDFs 18 2.0E-05 50,199 4.6
Cumulative Cancer Risk 9.0E-05 11,075 1.0
Red drum
Arsenic 10 3.0E-05 33,764 3.1
PCBs 10 6.2E-06 160,131 14.8
PCDDs/PCDFs 10 9.8E-06 102,063 9.4
Cumulative Cancer Risk 4.6E-05 21,901 2.0
* DSHS assumes that children under 12 years of age and/or those who weigh less than 35 kg eat 4-ounce meals.
† Emboldened numbers denote that the calculated excess lifetime cancer risk after 30 years exposure is greater than
1 X 10⁻⁴
. ‡ Emboldened numbers denote that the calculated allowable meal consumption rate for an adult < 1.0 meal per
week. § The term, unrestricted, denotes that the allowable 8-ounce meals per week are 21.0.

62
Table 9b. Calculated theoretical lifetime excess cumulative cancer risk from consuming fish
containing Arsenic, PCBs, and PCDDs/PCDFs collected in 2010–2011 from the Galveston
Bay Estuary and suggested consumption (8-ounce meals/week) for 70 kg adults who
regularly eat fish from Galveston Bay over a 30-year period.*
Species/Contaminant Number (N)
Theoretical Lifetime Excess Cancer Risk
Meals per Week Risk
1 excess cancer per
number of people
exposed
Sand trout
Arsenic 17 1.1E-05 92,357 8.5
PCBs 17 9.9E-06 100,823 9.3
PCDDs/PCDFs 17 5.8E-06 173,202 16.0
Cumulative Cancer Risk 2.7E-05 37,708 3.5
Southern flounder
Arsenic 9 2.7E-05 37,574 3.5
PCBs 9 4.4E-06 226,852 21.0
PCDDs/PCDFs 9 1.4E-06 709,355 unrestricted‡
Cumulative Cancer Risk 3.2E-05 30,834 2.8
Spotted seatrout
Arsenic 69 1.9E-05 53,693 5.0
PCBs 72 1.4E-05 71,637 6.6
PCDDs/PCDFs 72 3.8E-06 260,450 unrestricted†
Cumulative Cancer Risk 3.6E-05 27,455 2.5
Striped bass
Arsenic 2 4.0E-06 248,605 unrestricted
PCBs 2 1.2E-05 82,931 7.7
PCDDs/PCDFs 2 5.9E-08 16,941,886 unrestricted
Cumulative Cancer Risk 1.6E-05 61,959 5.7
* DSHS assumes that children under 12 years of age and/or those who weigh less than 35 kg eat 4-ounce meals.
† The term, unrestricted, denotes that the allowable 8-ounce meals per week are 21.0.

63
Table 9c. Calculated theoretical lifetime excess cumulative cancer risk from consuming fish
containing Arsenic, PCBs, and PCDDs/PCDFs collected in 2010–2011 from Galveston Bay
Estuary and suggested consumption (8-ounce meals/week) for 70 kg adults who regularly
eat fish from Galveston Bay over a 30-year period.*
Species/Contaminant Number (N)
Theoretical Lifetime Excess Cancer Risk
Meals per Week Risk
1 excess cancer per
number of people
exposed
All fish combined
Arsenic 136 2.7E-05 37,303 3.4
PCBs 139 1.3E-05 75,617 7.0
PCDDs/PCDFs 139 6.1E-06 163,085 15.1
Cumulative Cancer Risk 4.6E-05 21,662 2.0
* DSHS assumes that children under 12 years of age and/or those who weigh less than 35 kg eat 4-ounce meals.

64
Table 9d. Calculated theoretical lifetime excess cumulative cancer risk from consuming
spotted seatrout containing Arsenic, PCBs, and PCDDs/PCDFs collected in 2010–2011
from the Galveston Bay Estuary and suggested consumption (8-ounce meals/week) for 70
kg adults who regularly eat spotted seatrout from the Galveston Bay System over a 30-year
period.*
Site/Contaminant Number (N)
Theoretical Lifetime Excess Cancer Risk
Meals per Week Risk
1 excess cancer per
number of people
exposed
Composite Area 1 Galveston Bay System (North of line from Red Bluff Point to Five-Mile Cut Marker to
Houston Point)
Arsenic 13 8.5E-06 117,085 10.8
PCBs 16 3.0E-05 33,447 3.1
PCDDs/PCDFs 16 1.9E-06 527,195 unrestricted†
Cumulative Cancer Risk 4.0E-05 24,792 2.3
Composite Area 2 Galveston Bay System (South of line from Red Bluff Point to Five-Mile Cut Marker to
Houston Point)
Arsenic 56 2.1E-05 47,322 4.4
PCBs 56 9.6E-06 104,701 9.7
PCDDs/PCDFs 56 4.4E-06 226,225 20.9
Cumulative Cancer Risk 3.5E-05 28,494 2.6
All Sample Sites
Arsenic 69 1.9E-05 53,377 4.9
PCBs 72 1.4E-05 71,637 6.6
PCDDs/PCDFs 72 3.8E-06 260,256 unrestricted
Cumulative Cancer Risk 3.7E-05 27,370 2.5
* DSHS assumes that children under the age of 12 years and/or those who weigh less than 35 kg eat 4-ounce meals.
† The term, unrestricted, denotes that the allowable 8-ounce meals per week are 21.0.

65
LITERATURE CITED
1 NOAA-NHC (National Oceanic and Atmospheric Administration, National Hurricane Center). 2008. Tropical
cyclone report Hurricane Ike (AL092008) September 1-14, 2008. Available: http://www.nhc.noaa.gov/pdf/TCR-
AL092008_Ike_3May10.pdf (July 13, 2010).
2 SSPEED (Severe Storm Prediction, Education, and Evacuation from Disasters Center), Rice University. 2010.
Interim report: learning the lessons of Hurricane Ike 2010. Available:
http://hydrology.rice.edu/sspeed/downloads/SSPEED_Interim_Report_2010.pdf (July 13, 2010).
3 Handbook of Texas Online, s.v. "," http://www.tsha.utexas.edu/handbook/online/articles/GG/rrg1.html (Accessed
September 7, 2007).
4 USEPA (United States Environmental Protection Agency). 2004. National coastal condition report II. EPA-
620/R-03/002. Office of Research and Development, Office of Water, Washington, D.C.
5 GBEP (Galveston Bay Estuary Program). 2002. The state of the bay: a characterization of the
Galveston Bay ecosystem, second edition. GBNEP-T7.Galveston Bay National Estuary Program Publication Series.
Houston, TX.
6 GBEP (Galveston Bay Estuary Program). About Galveston Bay: economics. Available:
http://www.gbep.state.tx.us/about-galveston-bay/economics.asp (September 1, 2010).
7 Wikipedia, the Free Encyclopedia. Economy of Houston. Available:
http://en.wikipedia.org/wiki/Economy_of_Houston. (September 1, 2010).
8 Coplin, L.S. and D. Galloway. 2007. Houston-Galveston, Texas: managing coastal subsidence. United States
Geological Survey. Available: Pubs.usgs.gov/circ/circ1182/pdf/07Houston.pdf (September 1, 2010).
9 USEPA (United States Environmental Protection Agency). 1987. National dioxin study. EPA/530-SW-87-025.
Office of Solid Waste and Emergency Response, Washington, D.C.
10
USEPA (United States Environmental Protection Agency). 1992. National study of chemical residues in fish, vol
1. EPA 823-R-92-008a. Office of Science and Technology, Washington, D.C. Available:
http://www.epa.gov/waterscience/fish/library/residuevol1.pdf (September 1, 2010).
11
TDH (Texas Department of Health) 1990. Fish and shellfish consumption advisory 3 (ADV-3) issued 19
September 1990. Seafood Safety Division, Austin, TX. Available:
http://www.dshs.state.tx.us/seafood/PDF2/Active/ADV-3_signed_HSCUGB.pdf. (September 1, 2010).
12
GBEP (Galveston Bay Estuary Program). 1995. The Galveston Bay plan. GBNEP-49. Galveston Bay National
Estuary Program, Houston, TX Available: http://www.gbep.state.tx.us/estuary-program-
overview/the%20galveston%20bay%20plan.asp (September 1, 2010).
13
TDH (Texas Department of Health). 2001. Fish and shellfish consumption advisory 20 (ADV-20) issued 9
October 2001. Seafood Safety Division, Austin, TX. Available:
http://www.dshs.state.tx.us/seafood/PDF2/Active/ADV-20_signed_HSC.pdf (September 1, 2010)
14
USEPA (United States Environmental Protection Agency). National Estuary Program (NEP). Available:
http://water.epa.gov/type/oceb/nep/estuaries_index.cfm. (September 1, 2010).
15
GBEP (Galveston Bay Estuary Program). A description of the Galveston Bay Estuary program. Available:
http://www.gbep.state.tx.us/. (September 1, 2010).
16
DSHS (Department of State Health Services). 2005. Fish and shellfish consumption advisory 28 (ADV-28) issued
24 January 2005. Seafood and Aquatic Life Group, Austin, TX. Available:
http://www.dshs.state.tx.us/seafood/PDF2/Active/ADV-28_signed_HSCUGB.pdf (September 1, 2010).

66
17
USCB (United States Census Bureau). 2010. Population finder. Available: http://www.census.gov/ (January 2,
2012).
18
USEPA (United States Environmental Protection Agency). 2002. Economic and Benefits
Analysis for the Proposed Section 316(b) Phase II Existing Facilities Rule Available:
http://www.epa.gov/waterscience/316b/phase2/econbenefits/toc.pdf (July 14, 2010).
19
DSHS (Texas Department of State Health Services). 2007. Standard operating procedures and quality
assurance/quality control manual. Seafood and Aquatic Life Group Survey Team ,Austin, Texas.
20
USEPA (United States Environmental Protection Agency). 2000. Guidance for assessing chemical contaminant
data for use in fish advisories. vol. 1, fish sampling and analysis, 3rd
ed. EPA-823-B-00-007. Office of Water,
Washington, D.C.
21
TSCC (Toxic Substances Coordinating Committee) Web site. Available: http://www.tscc.state.tx.us/dshs.htm
(July 14, 2010).
22
GSMFC (Gulf States Marine Fisheries Commission). 2009. Practical handbook for determining the ages of Gulf
of Mexico fishes, 2nd
Edition. GSMFC Publication Number 167. Ocean Springs, MS.
23
TPWD (Texas Parks and Wildlife Department). 2009. Texas inland fishery assessment procedures, TPWD Inland
Fisheries Division unpublished manual. Austin, TX.
24
USEPA (United States Environmental Protection Agency). 2000. Guidance for assessing chemical contaminant
data for use in fish advisories. vol. 2, risk assessment and fish consumption limits, 3rd
ed. EPA-823-00-008. Office
of Water, Washington, D.C.
25
ATSDR (Agency for Toxic Substances and Disease Registry). 2007. Toxicological profile for arsenic. United
States Department of Health & Human Services, Public Health Service Atlanta, GA.
26
CWA (Clean Water Act). 33 USC 125 et seq. 40CFR part 131: Water Quality Standards.
27
ATSDR (Agency for Toxic Substances and Disease Registry). 1999. Toxicological profile for mercury (update).
United States Department of Health & Human Services, Public Health Service. Atlanta, GA.
28
Lauenstein, G.G. & Cantillo, A.Y. 1993. Sampling and analytical methods of the national status and trends
program national benthic surveillance and mussel watch projects 1984-1992: overview and summary of methods -
Vol. I. NOAA Tech. Memo 71. NOAA/CMBAD/ORCA. Silver Spring, MD. 157pp. Available: http://www.ccma.nos.noaa.gov/publications/tm71v1.pdf (August 27, 2010).
29
McFarland, V.A. & Clarke, J.U. 1989. Environmental occurrence, abundance, and potential toxicity of
polychlorinated biphenyl congeners: considerations for a congener-specific analysis. Environmental Health
Perspectives. 81:225-239.
30
IRIS (Integrated Risk Information System). Polychlorinated biphenyls (PCBs) (CASRN 1336-36-3), Part II,B.3.
United States Environmental Protection Agency. Available: http://www.epa.gov/iris/subst/0294.htm (August 27,
2010).
31
IRIS (Integrated Risk Information System). Comparison of database information for RfDs on Aroclor® 1016,
1254, 1260. United States Environmental Protection Agency. Available: http://cfpub.epa.gov/ncea/iris/compare.cfm
(August 27, 2010).
32
Van den Berg, M., L. Birnbaum, ATC Bosveld et al. 1998. Toxic equivalency factors (TEFs) for PCBs, PCDDs,
PCDFs for humans and wildlife. Environ. Health Perspect. 106(12):775-792.

67
33
WHO (World Health Organization). 2005. Project for the re-evaluation of human and mammalian toxic
equivalency factors (TEFs) of dioxins and dioxin-like compounds. Available:
http://www.who.int/ipcs/assessment/tef_update/en/ (August 27, 2010).
34
De Rosa, CT, D. Brown, R. Dhara et al. 1997. Dioxin and dioxin-like compounds in soil, part 1: ATSDR interim
policy guideline. Toxicol. Ind. Health. 13(6):759-768. Available:
http://www.atsdr.cdc.gov/substances/dioxin/policy/ (August 27, 2010).
35
Klaassen C.D., editor. 2001. Casarett and Doull’s toxicology: the basic science of poisons, 6th
ed. McGraw-Hill
Medical Publishing Division, New York, NY.
36
Beauchamp, R. 1999. Personal Communication: Monte Carlo simulations in analysis of fish tissue contaminant
concentrations and probability of toxicity. Department of State Health Services, Austin, TX.
37
IRIS (Integrated Risk Information System). 1993. Reference dose (RfD): description and use in risk assessments.
United States Environmental Protection Agency. Available: http://www.epa.gov/iris/rfd.htm (August 27, 2010).
38
ATSDR (Agency for Toxic Substances and Disease Registry). 2009. Minimal risk levels for hazardous
substances. United States Department of Health & Human Services. Public Health Service. Available:
http://www.atsdr.cdc.gov/mrls/index.html (August 27, 2010).
39
IRIS (Integrated Risk Information System). 2010. IRIS glossary/acronyms & abbreviations. United States
Environmental Protection Agency. Available: http://www.epa.gov/NCEA/iris/help_gloss.htm (August 27, 2010).
40
USEPA (United States Environmental Protection Agency). 1999. Glossary of key terms. Technology transfer
network national-scale air toxics assessment. Available: http://www.epa.gov/ttn/atw/natamain/gloss1.html (August
27, 2010).
41
Thompson, K.M. 2004. Changes in children’s exposure as a function of age and the relevance of age definitions
for exposure and health risk assessment. MedGenMed. 6(3), 2004. Available:
http://www.medscape.com/viewarticle/480733. (February 24, 2009).
42
University of Minnesota, Maternal and Child Health Program, School of Public Health. 2004. Children’s special
vulnerability to environmental health risks. Healthy Generations 4(3). Available:
http://www.epi.umn.edu/mch/resources/hg/hg_enviro.pdf (August 27, 2010).
43
Selevan, S.G., C.A. Kimmel, and P. Mendola. 2000. Identifying critical windows of exposure for children’s
health. Environmental Health Perspectives Volume 108, Supplement 3.
44
Schmidt, C.W. 2003. Adjusting for youth: updated cancer risk guidelines. Environmental Health Perspectives.
111(13):A708-A710.
45
ATSDR (Agency for Toxic Substances and Disease Registry). 1995. Child health initiative. United States
Department of Health & Human Services. Public Health Service. ATSDR Office of Children’s Health. Atlanta, GA.
46
USEPA (United States Environmental Protection Agency). 2000. Strategy for research on environmental risks to
children, Section 1 and 2. Office of Research and Development (ORD)Washington, D.C.
47
SPSS 13 for Windows©. Release 13.0.1. 2004. Copyright SPSS, Inc., 1989-2004. Available: http://www.spss.com
(August 29, 2006).
48
Microsoft Corporation. Microsoft® Office Excel 2003. Copyright© Microsoft Corporation 1985-2003.
49
CDC (Centers for Disease Control and Prevention). 2005. Preventing lead poisoning in young children. United
States Department of Health & Human Services. Atlanta, GA. Available:
http://www.cdc.gov/nceh/lead/publications/PrevLeadPoisoning.pdf (August 27, 2010).
68
50
CDC (Centers for Disease Control and Prevention). 2007. Interpreting and managing blood lead levels <10
mcg/dL in children and reducing childhood exposures to lead. United States Department of Health & Human
Services, CDC Advisory Committee on Childhood Lead Poisoning Prevention. Atlanta, GA. MMWR 56(RR08);1-
14;16 Available: http://www.cdc.gov/mmwr/preview/mmwrhtml/rr5608a1.htm (August 27, 2010). ERRATUM
MMWR November 30, 2007 / 56(47):1241-1242. Available:
http://www.cdc.gov/mmwr/preview/mmwrhtml/mm5647a4.htm (August 27, 2010).
51
Corl, E., R. Owen, A. Pollack, S. Braunig, and M. Holden. 2002. Detection and reporting limit issues related to
risk assessments. United States Navy. Available:
http://web.ead.anl.gov/ecorisk/issue/pdf/Final_Detection_04_02.pdf (August 27, 2010).
52
USEPA (United States Environmental Protection Agency). 2003. Exposure and human health reassessment of
2,3,7,8-tetrachlorodibenzo-p-dioxin (TCDD) and related compounds. Part III: integrated summary and risk
characterization for 2,3,7,8-tetrachlorodibenzo-p-dioxin (TCDD) and related compounds. National Center for
Environmental Assessment, Research and Development, Washington, D.C. DRAFT for PUBLIC REVIEW
ONLY Available: http://www.epa.gov/NCEA/pdfs/dioxin/nas-review/pdfs/part3/dioxin_pt3_full_oct2004.pdf
(August 27, 2010). 53
USEPA (United States Environmental Protection Agency). 1996. Guidance for assessing chemical contaminant
data for use in fish advisories. vol. 3, overview of risk management. EPA-823-B-96-006. Office of Water,
Washington, D.C.
54
Texas Statutes: Health and Safety Code, Chapter 436, Subchapter D, §436.061and § 436.091.
55
DSHS (Department of State Health Services). 2009. Guide to eating Texas fish and crabs. Seafood and Aquatic
Life Group. Austin, TX.
56
DSHS (Department of State Health Services). 2010. Seafood and Aquatic Life Group Web site. Austin, TX.
Available: http://www.dshs.state.tx.us/seafood/ (August 27, 2010).
57
TPWD (Texas Parks and Wildlife Department). 2010. Summary of fishing and hunting regulations. Available:
http://www.tpwd.state.tx.us/publications/nonpwdpubs/media/regulations_summary_2010_2011.pdf (August 27,
2010).
58
TPWD (Texas Parks and Wildlife Department). 2010-2011 Outdoor annual: hunting and fishing regulations. Ed.
J. Jefferson. Texas Monthly Custom Publishing, a division of Texas Monthly, Inc. 2009 (valid September 1, 2010
through August 31, 2011).