Characterization of myocardial tissue in patients undergoing maintenance hemodialysis by...
8
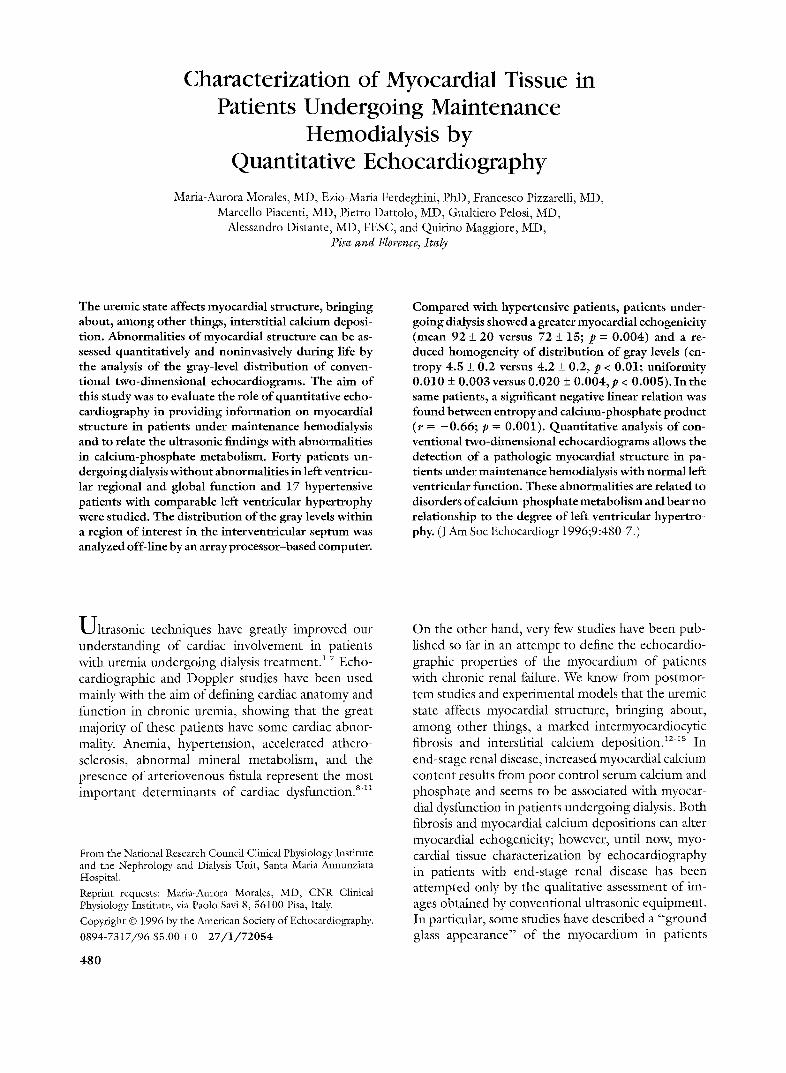
Characterization of Myocardial Tissue Patients Undergoing Maintenance Hemodialysis by Quantitative Echocardiography in Maria-Aurora Morales, MD, Ezio-Maria Ferdeghini, PhD, Francesco Pizzarelli, MD, Marcello Piacenti, MD, Pietro Dattolo, MD, Gualtiero Pelosi, MD, Alessandro Distante, MD, FESC, and Quirino Maggiore, MD, lisa and Flol~ence, Italy The uremic state affects myocardial structure, bringing about, among other things, interstitial calcium deposi- tion. Abnormalities of myocardial strucnire can be as- sessed quantitatively and noninvasively during life by the analysis of the gray-level distribution of conven- tional two-dimensional echocardiograms. The aim of this study was to evaluate the role of quantitative echo- cardiography in providing information on myocardial structure in patients under maintenance hemodialysis and to relate the ultrasonic findings with abnormalities in calcium-phosphate metabolism. Forty patients un- dergoing dialysis without abnormalities in left ventricu- lar regional and global function and 17 hypertensive patients with comparable left ventricular hypertrophy were studied. The distribution of the gray levels within a region of interest in the interventricular septum was analyzed off-line by an array processor-based computer. Compared with hypertensive patients, patients under- going dialysis showed a greater myocardial echogenicity (mean 92 + 20 versus 72 _+15; p = 0.004) and a re- duced homogeneity of distribution of gray levels (en- tropy 4.5 + 0.2 versus 4.2 + 0.2, p < 0.01; uniformity 0.010 + 0.003 versus 0.020 + 0.004,p < 0.005). In the same patients, a significant negative linear relation was found between entropy and calcium-phosphate product (r = -0.66; p = 0.001). Quantitative analysis of con- ventional two-dimensional echocardiograms allows the detection of a pathologic myocardial structure in pa- tients under maintenance hemodialysis with normal left ventricular function. These abnormalities are related to disorders of calcium-phosphate metabolism and bear no relationship to the degree of left ventricular hypertro- phy. (J Am Soc Echocardiogr 1996;9:480-7.) Ultrasonic techniques have greatly improved our understanding of cardiac involvement in patients with uremia undergoing dialysis treatment. 1 7 Echo- cardiographic and Doppler studies have been used mainly with the aim of defining cardiac anatomy and function in chronic uremia, showing that the great majority of these patients have some cardiac abnor- mality. Anemia, hypertension, accelerated athero- sclerosis, abnormal mineral metabolism, and the presence of arteriovenous fistula represent the most important determinants of cardiac dysfunction. 8.H From the National ResearchCouncil ClinicalPhysiology Institute and the Nephrology and Dialysis Unit, Santa Maria Annunziata Hospital. Reprint requests: Maria-Aurora Morales, MD, CNR Clinical PhysiologyInstitute, via Paolo Savi8, 56100 Pisa, Italy. Copyright © 1996 by the AmericanSocietyof Echocardiography. 0894-7317/96 $5.00 + 0 27/1/72054 480 On the other hand, very few studies have been pub- lished so far in an attempt to define the echocardio- graphic properties of the myocardium of patients with chronic renal failure. We know from postmor- tem studies and experimental models that the uremic state affects myocardial structure, bringing about, among other things, a marked intermyocardiocytic fibrosis and interstitial calcium deposition, l>~s In end-stage renal disease, increased myocardial calcium content results from poor control serum calcium and phosphate and seems to be associated with myocar- dial dysfunction in patients undergoing dialysis. Both fibrosis and myocardial calcium depositions can alter myocardial echogenicity; however, until now, myo- cardial tissue characterization by echocardiography in patients with end-stage renal disease has been attempted only by the qualitative assessment of im- ages obtained by conventional ultrasonic equipment. In particular, some studies have described a "ground glass appearance" of the myocardium in patients
Transcript of Characterization of myocardial tissue in patients undergoing maintenance hemodialysis by...
Characterization of Myocardial Tissue Patients Undergoing Maintenance
Hemodialysis by Quantitative Echocardiography
in
Maria-Aurora Morales, MD, Ezio-Maria Ferdeghini, PhD, Francesco Pizzarelli, MD, Marcello Piacenti, MD, Pietro Dattolo, MD, Gualtiero Pelosi, MD,
Alessandro Distante, MD, FESC, and Quirino Maggiore, MD, lisa and Flol~ence, Italy
The uremic state affects myocardial structure, bringing about, among other things, interstitial calcium deposi- tion. Abnormalities of myocardial strucnire can be as- sessed quantitatively and noninvasively during life by the analysis of the gray-level distribution of conven- tional two-dimensional echocardiograms. The aim of this study was to evaluate the role of quantitative echo- cardiography in providing information on myocardial structure in patients under maintenance hemodialysis and to relate the ultrasonic findings with abnormalities in calcium-phosphate metabolism. Forty patients un- dergoing dialysis without abnormalities in left ventricu- lar regional and global function and 17 hypertensive patients with comparable left ventricular hypertrophy were studied. The distribution of the gray levels within a region of interest in the interventricular septum was analyzed off-line by an array processor-based computer.
Compared with hypertensive patients, patients under- going dialysis showed a greater myocardial echogenicity (mean 92 + 20 versus 72 _+ 15; p = 0.004) and a re- duced homogeneity of distribution of gray levels (en- tropy 4.5 + 0.2 versus 4.2 + 0.2, p < 0.01; uniformity 0.010 + 0.003 versus 0.020 + 0.004,p < 0.005). In the same patients, a significant negative linear relation was found between entropy and calcium-phosphate product (r = -0 .66; p = 0.001). Quantitative analysis of con- ventional two-dimensional echocardiograms allows the detection of a pathologic myocardial structure in pa- tients under maintenance hemodialysis with normal left ventricular function. These abnormalities are related to disorders of calcium-phosphate metabolism and bear no relationship to the degree of left ventricular hypertro- phy. (J Am Soc Echocardiogr 1996;9:480-7.)
Ul t r a son ic techniques have greatly improved our understanding of cardiac involvement in patients with uremia undergoing dialysis treatment. 1 7 Echo- cardiographic and Doppler studies have been used mainly with the aim of defining cardiac anatomy and function in chronic uremia, showing that the great majority of these patients have some cardiac abnor- mality. Anemia, hypertension, accelerated athero- sclerosis, abnormal mineral metabolism, and the presence of arteriovenous fistula represent the most important determinants of cardiac dysfunction. 8.H
From the National Research Council Clinical Physiology Institute and the Nephrology and Dialysis Unit, Santa Maria Annunziata Hospital. Reprint requests: Maria-Aurora Morales, MD, CNR Clinical Physiology Institute, via Paolo Savi 8, 56100 Pisa, Italy. Copyright © 1996 by the American Society of Echocardiography. 0894-7317/96 $5.00 + 0 27/1/72054
480
On the other hand, very few studies have been pub- lished so far in an attempt to define the echocardio- graphic properties of the myocardium of patients with chronic renal failure. We know from postmor- tem studies and experimental models that the uremic state affects myocardial structure, bringing about, among other things, a marked intermyocardiocytic fibrosis and interstitial calcium deposition, l>~s In end-stage renal disease, increased myocardial calcium content results from poor control serum calcium and phosphate and seems to be associated with myocar- dial dysfunction in patients undergoing dialysis. Both fibrosis and myocardial calcium depositions can alter myocardial echogenicity; however, until now, myo- cardial tissue characterization by echocardiography in patients with end-stage renal disease has been attempted only by the qualitative assessment of im- ages obtained by conventional ultrasonic equipment. In particular, some studies have described a "ground glass appearance" of the myocardium in patients

Journal of the American Society of Echocardiography Volume 9 Number 4 Moralcs ct al. 481
with increased left ventricular mass ) 6 18 However , like any qualitative assessment, such an approach suffers major limitations in precision and accuracy, because o f the interobserver and intraobserver vari- ability. 19,2°
Recent advances have made possible the quantita- tive analysis o f two-dimensional spatial distribution o f echo amplitudes within a region o f interest in the myocardium. By this statistical analysis, conventional echocardiograms can provide information on the un- derlying structures; alterations o f the pictorial-ele- ments organizat ion could be related to changes o f the tissues under evaluation, as already observed in cardiac amyloidosis and myocarditis. 21'22
The aim o f this study was to assess the role o f quantitative echocardiography in providing objective information on the structural properties o f the myo- cardium in patients under maintenance hemodialysis and whether these findings are related to abnormali- ties in calcium-phosphate metabolism.
MATERIAL AND METHODS
Patient Population
Forty paticnts with chronic urcmia under maintenance hcmodialysis for 65 + 48 months (range 8 to 185 months) undcrwcnt a completc cchocardiographic Doppler exami- nation within 30 minutcs from the end of the dialysis procedure. The group consisted of 25 men and 15 women, whose mean age was 62 + 12 years (range 26 to 81 years). Patients with a history of coronary artery discasc and all subjccts with abnormalities in rcgional left ventricular function were eliminated. Scvcntccn hypcrtcnsive patients (11 men, mean age 60 + IS years) with comparable body surface area and vcntricular septal thickness, normal left ventricular contractility, and normal renal function served as the control group (Table 1).
Echocardiographic Examination
All the examinations werc pcrformed by means of a com- mcrcially available instrumcnt (model SIM 7000 CFM; Esaote Biomcdica, Florence, Italy) with a 2.5 MHz elec- tronic probe within 30 minutes after thc end ofthc dial3Mc procedure. In all patients, parasternal long- and short-axis views and an M-mode tracing of the left vcntriclc were obtained for calculation of the left ventricular mass and the fractional shortening. Left ventricular mass was calculated according to the Penn-cube formula 23 and Icft ventricular fractional shortening as L V E D D - L V E S D / L V E D D - 100, whcre LVEDD = left vcntricular end-diastolic diana- eter and LVESD = left vcntricular cnd-systolic diamctcr.
For the subscquent qualitativc and quantitativc cvalua- tion of thc ultrasonic response of the intervcntricular sep- turn, an apical four-chambcr view was choscn. At the be- ginning of all examinations fiom the apical approach, prc-
Table 1 Clinical characteristics of patients undergoing dialysis and control group
Hemodialysis Hypertensive (40 patients) (17 patients)
Age (yr) 62 + 11 60 -+ 10 No. male/female 25/15 11/6 LVEDD (mm) 49 _+ 6 49 _+ 4 STED (mm) 14 _+ 2 14 -+ 1
LVEDD, Left ventricular end-diastolic dimension; STED, interventricular septal thickness at end diastole.
processing and postprocessing settings and gain controls were adjustcd and kept fixed throughout the procedure. The same magnification (focalization depth= 17 cm), powcr emission (75%), and rcject (0) and gain (4) were adopted. Echocardiographic images were recorded on a 1/2-inch VHS videotape rccorder (Panasonic, Oseke, Japan) for playback and analysis.
Qualitative Echocardiographic Assessment o f Myocardial Structure
Myocardial structurc was defined qualitatively in both the patients undergoing dialysis and thc control group by two independent expcricnced echocardiographers, unaware of thc patients' history. According to a previously described mcthod, ~8 thc tcxture was defined as normal (without significant highly reftactile echoes), mildly granular (mild, scattered highly reftactile echoes), markedly granular (bright, diffuse refractile echoes), and uniform dcnse (con- fluent highly refractile echocs).
Quantitative Echocardiographic Assessment of Myocardial Structure Digitization
hnagcs from the apical four-chamber view and corre- sponding to the end-diastolic phase of the cardiac cycle were sclected and digitized off-line by an array processor- based computer for medical image processing (Mipron, Kontron, Eching, Germany). The images were converted into frames of 256 x 256 pixels of 256 gray levels each (0 = black; 255 = white). For subsequent statistical analy- sis, a region of interest of about 9 x 9 pixels inside the midportion of thc interventricular sepmm was drawn manuall): Special attcntion was paid to avoid the inclusion of specular reflectors such as the endocardium and to the depths from the apex of the image, which were similar in all the patients.
Quantitative Definitions of Texture Analysis
Statistical approaches to texture analysis provide the quan- titativc assessment of conventional ultrasonic images on the basis of the acoustic properties of the tissues under examination. With this approach, statistical features that yicld a quantitative description of what is perceived by an operator, for both the tonal aspect and the spatial organi- zation of the pictorial clements, can be obtained. 2427
First-order statistics are related to the concept of tone and provide parameters for the quantitative description of

Journal of the American Society of Echocardiography 482 Morales ct al. July-August 1996
the shape of the histogram of the gray-level distribution within a region of interest. In particular, the mean is a measure of the overall lightness/darkness of the picture, the standard deviation describes its overall contrast, the skewness describes the asymmetry of the distribution of the gray levels, the curtosis measures the "peakedness" of the distribution relative to the length and size of its tails, and the uniformity is an index of the tonal homogeneity be- cause it evaluates whether the pixels tend to aggregate around peculiar gray tones. Conversely, the entropy re- flects the spread of the gray-level distribution; specifically, the higher its value, the more the gray levels tend to distribute with equal probability. An example of the tonal histogram in a patient undergoing chronic hemodialysis and a control paticnt is reported in Figure 1.
Second-order statistics provide the analysis of the spatial arrangement of the gray levels present in the region of interest (texture), according to "placement" rules of the pictorial elements. In this study the evaluation of the cooccurrcncc matrix was adopted. The matrix coef- ficients arc the joint probability densities of all the possible pairs of gray levels occurring at relative distance of sepa- ration. 28 After fixing thc vector length (in pixel units), corresponding to the distance between two pixels, a cooc- currence matrix is evaluated; in this study interpixel dis- tances of 1, 2, and 4 pixels have been considered, and the vector was oriented along four main directions (0, 90,180, and 270 degrees) on the digital image. The shape of each obtained cooccurrence matrix is described by various parameters: (1) the contrast, which increases when large gray-level transitions in paired pixels occur with greater probability; (2) the correlation, which measures the linearity of the relationship of the gray levels in pix.el pairs; (3) the angular second moment, which is small when the cooccurrence matrix elcments are equal; and (4) the entropy, which is a measure of the coarseness of the image.
Reproducibility
In a group of 10 patients undergoing dialysis, we tested the reproducibility of paired data obtained with first-order statistics in two separate examinations, performed 1 to 3 months apart. The analysis of residual variance of differ- ences was applied; two parameters were considered repro- ducible when the error was less than 10%.
Blood Parameters
Calcium, phosphate, parathyroid hormone, and hemoglo- bin conccntrations were determined by standard labora- tory methods. These biochemical parameters were the mean of 13 blood samples (range 2 to 19) obtained in each patient on a quarterly basis before the cchocardiographic examination.
Statistical Analysis
Values are expressed as mean + SD. First- and second- order statistical parameters were compared between the two groups by the Student t test for unpaired data.
Linear regression analysis was employed to evaluate the relationship between the parameters obtained by quan- titative echocardiography and the biochemical data. The adequacy of the independent variable in the model was assessed with an analysis of variance test and a Bonfer- roni post hoc test; a p value < 0.05 was considered signif- icant.
~ S ~ T S
The two-dimensional cchocardiograms were ad- cquate for the evaluation o f the tonal- textural prop- erties in 37 o f 40 patients; all the echocardiograms o f the control group were satisfactory. Patients un- dergoing chronic hemodialysis and the hyper- tensive group showed comparable left ventricu- lar mass (292 _+ 95 gm in the group undergo ing dialysis versus 298 + 50 gm in the hypertensive pa- tients), interventricular septal thiclmess (14.3 + 2 m m versus 14.1 + 1 m m ) , left ventricular end-dia- stolic d iameter (48.7 + 6 m m versus 48.8 + 4 ram), and basal fractional shor tening (36%+ 7% versus 39% + 6%).
Qualitative Analysis of Myocardial Texture
In the 37 patients with adequate two-dimensional cchocardiograms, normal texture was observed in four patients, mild granularity in seven, marked granularity in 17, and uni form density in nine. In the control group, normal myocardial texture was found in six, mild granularity in eight, and marked granu- larity in three patients. N o n e o f t h e m showed uni- fo rm density.
Quantitative Analysis of Myocardial Texture
Regarding the first-order statistical parameters , pa- tients undergo ing dialysis showed significantly higher mean (92 + 20 versus 72 + 15; p = 0.004) , s tandard deviation (37 + 8 versus 29 _+ 7; p = 0.005) , and en t ropy (4.5 -+ 0.2 versus 4.3 + 0.2; p < 0.01) and lower uniformity (0 .010 + 0.003 versus 0 .020 + 0.004; p < 0.005) compared with control subjects (Figure 2).
O n the contrary% no differences were observed be tween the two groups for second-order statistical parameters in all possible directions and interpixel distances.
Reproducibility
A g o o d reproducibil i ty for all the observed param- eters was found in 10 patients undergo ing dialysis. An error less than 3% was ob ta ined for the mean, less than 8% for the s tandard deviation, less than 9% for

~ournal of the American Society of Echocardiography Volume 9 Number 4 Moralcs et al. 483
MtRN: ~ UNIFORMITY:
ROPY:
85 8.8188 4.7
IN: FORMITY: ROPY:
59 8.8166 4.3
Figure 1 Example of gray-level distribution of patient undergoing dialysis (top) versus control subject (bottom).
the uniformity, and less than 1% for the cntropy values.
Qualitative Versus Quantitative Texture Analysis
In the group undergoing hemodialysis, first-order statistical fcatures were compared with the results obtained by qualitative analysis; no significant statis- tical differences were observed for mean, standard deviation, entropy, and uniformity when normal ver- sus pathologic (i.e., mild plus moderate plus uniform dense images) elements were considered. When the qualitative groups were considered separately, only paticnts who showed mild granular cchoes were dis- criminated from those with uniform density for mean, standard deviation, and entropy. A difference was also found between patients with mild granular echoes and those with a markedly granular appear- ance only for standard deviation. No differences were observed for the other groups; in particular, the group judged as normal showed first-order statistical parameters comparablc to those of the other groups (Figure 3).
Relation to Biochemical Data. A significant negative linear relation was found between en- tropy and calcium-phosphate product ( r= -0 .66 ; p = 0.0001) (Figure 4). A weaker but significantly positive correlation was also observed between uni- formity and calcium-phosphate product ( r= 0.53; p = 0.008). No relation, either linear or nonlinear, was found betwecn calcium-phosphate product and thc other echocardiographic parameters. Moreover, no relation could be reported between parathyroid hormone concentration and hemoglobin concentra- tion and all the available structural features.
DISCUSSION
Our findings show that quantitative echocardiogra- phy can reveal abnormalities in the ultrasonic image texture of left ventricular myocardium of patients undergoing chronic hemodialysis. Several studies have reported abnormalities of myocardial structure in patients with uremia by qualitative assessment of echocardiographic images17-19; however, the com- parison between qualitative and quantitative param- eters yields important information. In this study, qualitative analysis, based on subjective evaluation, did not discriminate between normal and pathologic hearts. However, differences were observed for mean, standard deviation, and entropy only between the group with mild hyperrefractile echoes and that with uniform density, thus supporting the limitations inherent to the qualitative assessment of myocardial structure by echocardiography.
Changes in the acoustic properties of a tissue un- der examination may reflect underlying structural alterations, although "a precise relation between the acoustic pattern and the responsible anatomic struc- ture has not been well characterized" because of the many factors that participate in producing the ultra- sonic image. 24 In our study, histologic findings are missing, but some considerations can be drawn. Pre- vious studies on postmortem examinations of pa- tients undergoing chronic hemodialysis have docu- mented the peculiar histologic elements of the myo- cardium caused by not only the presence of left ventricular hypertrophy but also the depositions of calcium salts and other substances such as aluminium and [3e-amyloid within the fibers. 28 3i Moreover, the collagen content of left ventricular myocardium is

Journal of the American Society of Echocardiography 4:84 Morales et al. July-August 1996
P = .004
60
90-
50 P = .005
30
M E A N
] HEMODIALYZED
120-
FIG 2
P< .01 .03
40
30
20
10
SD
~ H Y P E R T E N S I V E
6
5
4
3
2
1
0
P < .005
-7-
U N I F O R M I T Y
.02
.01
.00
E N T R O P Y
Figure 2 First--order statistical parameters in two groups of patients.
greater in uremia than in primary hypertension at comparable heart weight.12"13 Fibrosis of the myocar- dium could be one factor accounting for the abnor- malities in the ultrasonic response of the myocar- dium, like that observed in patients with myocarditis by quantitative echocardiography. 22
A high calcium-phosphate product, often occur- ring in patients with uremia, favors the formation of calcium deposits within the myocardium. 14 Thus it appears plausible that a higher calcium-phosphate product might contribute to reduce the tonal disor- der in the echocardiogram. Indeed, we observed a significant negative linear correlation between calci- um-phosphate and entropy in our subset of patients. The pattern of uniform density of the echocardio-
gram has also bcen rcportcd qualitatively in a previ- ous echocardiographic study~8; however, in the same study no relation between calcium-phosphate prod- uct and changes in myocardial texture was found. This discrepancy could be explained by not only the limits of qualitative texture measurements but also the fact that a single determination of calcium and phosphate was used for the correlation, which might not truthfully represent the underlying chronic alter- ation in calcium-phosphate metabolism. Instead we used a mean of 13 calcium-phosphate product values obtained on a quarterly basis before the echocardio- graphic examination.
It is worth noting that in patients with uremia a causc-and-effect relationship between anemia and

Journal of the American Society of Echocardiography Volume 9 Number 4 Mora les et al. 485
FIG 3
120-
80-
40-
MEAN 50-
40-
30"
20"
10"
0
S D
*- T
0 ,020-
0 ,015-
0 ,010-
0 ,005 -
0
UNIFORMITY 5-
4-
3-
2-
1-
0
E N T R O P Y
[ ] NORMAL [] MILD [] MARKED [] UNIFORM
Figure 3 Qualitative versus quantitative analysis
left ventricular hypertrophy has been demon- stratcda2; however, as far as myocardial structural abnormalities, no relation was observed between he- moglobin concentration and all the quantitative echocardiographic parameters under evaluation.
The changes in myocardial structure we observed in the patients undergoing dialysis were not associ- ated with an evident impairment in global left ven- tricular systolic function, as shown by comparable left ventricular fractional shortening. A previous study 14 based on energy subtraction of the chest radiograph showed a significant inverse linear asso- ciation between myocardial calcium content and val- ues of left ventricular ejection fraction. In the same patients an inverse relation between serum parathy- roid hormone concentration and left ventricular ejec- tion fraction is also reported. The discrepancies be-
* p < .05
in patients undergoing hemodialysis.
twcen this study and our results can possibly bc explained by the differences in patient selection, because patients with a history of coronary artery disease or abnormalities in contractile function were not allowed into this study. On the other hand, the second-order statistical parameters, expression of the texture of the echocardiogram, did not show any difference between the two groups: the lack of a prevailing direction of textural organization in both groups could be explained by the patchy distribution of inhomogeneities and increased echoreflectivity within the myocardium, which unlikely impairs glo- bal left ventricular function. Another possible expla- nation for a normal left vcntricular fractional short- cning in these patients could be ascribed to the fact that endocardial fractional shortening could overes- timate overall left ventricular myocardial pcrfor-

Journal of the American Society of Echocardiography 4:86 Morales et al. July-August 1996
\,\ l
Fig. 4
t 70
65
60.
55.
50.
45.
40.
35 3.9
r i . i . | . i . ~ . i . ~ . i • t . | .
O
0
o °c9 ° °
0 0 ~ , . 0 . 0 0 0
O O O
i • , - , - l • i - , - , - , - , - , -
4 4.1 4.2 4.3 4.4 4.5 4.6 4.7 4.8 4.9 5
ENTROPY
R = - . 6 6
p = • 0 0 1
Figure 4 Rclation between calcium (Ca)-phosphate (Ph) product and first-order entropy in patients undergoing maintenance hemodialyis.
mance in patients with left vcntricular hypcrtrophy, as already described in hypertensive patients. 33 The timing of the echocardiographic examination also has to be taken into account. To avoid the bias of increased body weight and fluid retention, we per- formed the complete ultrasonic assessment at the end of the dialysis procedure. Previous studies have reported an enhancement in left ventricular contrac- tility at the end of the dialysis, compared with predi- alysis valucs, probably bccause of the reduction in se- rum potassium levcls and increasc in serum calcium valucs. 3~-37 Therefore parameters of cardiac function in our group of patients are related strictly to the post- dialysis pcriod and, lacldng direct evidcncc, cannot be extrapolated to thc predialysis functional state.
L i m i t a t i o n s o f t h e S t u d y
Quantitative measurements of myocardial texture by echocardiography can be affected by many variable factors such as general instrument gains and time- gain compensation curves. In this study, however, gain settings were kept fixed from the beginning and throughout the procedure. Thickness of the chest wall, which is variable between subjects, the distance of the heart from the transducer, and a variable depth in the region of interest from different subjects may
affect texture measuremcnts. Moreover, quantitative cchocardiographic parameters are dependent on the orientation of the echo reflectors because the same target could produce different patterns depending on the view selected. Because uremia affects the structure of all lcft vcntticular walls, in this study only images of the interventricular septum obtained from the same projection were chosen and digitized to avoid all thc possible sources of error represented by the intrinsic limitations of this technique. However, some ldnd of inclination of the transducer, different from subject to subject, could also affect texture measurements of the septum. 3s
In conclusion, quantitative echocardiography could represent a promising technique for an ob- server-independent assessment of myocardial tissue characteristics in patients with end-stage renal dis- easc. Although it cannot provide precise histologic information, it might offer useful parameters for the diagnosis and follow-up of myocardial structural changes in chronic uremia.
REFERENCES
1. Schott CR, LeSar IF, Kotler MN, et al, The spectrum of echocardiographic findings in chronic uremia. Cardiovasc Med 1978;3:217-27.

lournal of the American Society of Echocardiography Volume 9 Number 4 Morales et al. 4 8 7
2. Cohen MV, Diaz P, Scheuer I. Echocardiographic assessment of left ventricular fi,mction in patients with chronic uremia. Clin Nephrol 1979;12:156-62.
3. Miack PJ, Dawborn JK, Luis WJ, McDonald IG. Left ven- tricular function in uremia: echocardiographic assessment in patients on maintenance dialysis. Clin Nephro11981 ;15:259- 63.
4. Fernando HA, Friedman HS, Zaman W, et al. Echocardio- graphic assessment of cardiac performance in patients on maintenance hemodialysis. Cardiovasc Med 1979;4:459-72.
5. Ruffmann 14, Mandelbaum A, Bommer J, et al. Doppler echocardiographic findings in dialysis patients. Nephrol Dial Transplant 1990;5:426-31.
6. Kramer W, Wizemann V, Thormann J, et al. Cardiac dysfunc- tion in patients on maintenance hemodialysis. Contrib Neph- rol 1986;52:97-109.
7. Cohen I, Barooha B, Segal I(R, Batiman V. 2-D echocardio- graphic findings in patients on hemodialysis for more than 6 months. Am J Cardiol 1987;60:743-5.
8. Lindner A, Charra B, Sherrard DJ, et al. Accelerated athero- sclerosis in prolonged maintenance hemodialysis. N Engl l Med i974;290:697-701.
9. London GM, De Vernejoul MC, Fabiani F, et al. Secondary hyperparathyroidism and cardiac hypertrophy in hemodialysis patients. Kidney Int 1987;32:900-7.
10. El Belhessi S, Brauthar N, Anderson K, et al. Effect of chronic renal failure on heart: role of secondary hyperparathyroidism. Am l Physiol 1986;6:369-79.
11. Anderson CB, Lodd JR, GraffRA, et al. Cardiac failure and tipper extremity arterio-venous fistula. Arch Intern Med 1976;136:292-7.
12. Anlann I<i, Mall G, Ritz E. Myocardial interstitial fibrosis in uraemia: is it relevant? Nephrol Dial Transplant 1994;9:127-8.
13. Mall G, Huther W, Schneider J, et al. Diffuse intermyocar- diocytic fibrosis in uremic patients. Nephrol Dial Transplant 1990;5:39-44.
14. Rostand SG, Sanders C, Kirk KA, et al. Myocardial calcifica- tion and cardiac dysfunction in chronic renal failure. Am )" Med 1988;85:651-7.
15. Terman DS, Alfrey AC, Hammond WS, et al. Cardiac calcifi- cation in uremia: a clinical, biochemical and pathologic study. Am J Med 1971;70:744-55.
16. Krane NK, Martinez JA, Cain C, et al. Unique infiltrative changes in the myocardium of patients with end-stage renal disease: a glistening speckled appearance [Abstract]. Kidney Int 1988;33:I97.
17. I(rane NK, Martinez J, Bleich SD, Phillips J. Changes by two-dimensional echocardiography in the myocardial appear- ance of patients with end-stage renal disease. Am J Cardiol 1989;64:40C-3C.
18. Wade MR, Chen YJ, Soliman M, et al. Myocardial texture and cardiac calcification in uremia. Miner Electrolyte Metab 1993;19:21-4.
19. Bhandari AK, Nanda NC. Myocardial texture characteriza- tion by two-dimensional eehocardiography. Am J Cardiol 1983;51:817-25.
20. Nicolosi GL, Pavan D, Lestuzzi C, et al. Prospective identi- fication of amyloid heart disease by two-dimensional echocar- diography. Circulation 1984;70:432-7.
21. Pinamonti B, Picano E, Ferdeghini EM, et al. Quantitative texture analysis in two-dimensional echocardiography: appli- cation to the diagnosis of amyloidosis. J Am Coil Cardiol 1989;14:666-71.
22. Ferdeghini EM, Pinamonti B, Picano E, et al. Quantitative texture analysis in echocardiography: application to the diag- nosis of myocarditis. J Clin Ultrasound 1991;19:263-70.
23. Devereux RB, Reichek N. Echocardiographic determination of left ventricular mass in man: anatomic validation of the method. Circulation 1977;55:613-8.
24. Haralick RM. Statistical and structural approaches to texture. IEEE Proc 1979;67:786-804.
25. Skorton DJ, Collins SM, Nichols J, et al. Quantitative texture analysis in two-dimensional echocardiography: application to the diagnosis of experimental myocardial contusion. Circula- tion 1983;68:217-21.
26. Weszka JS, Dyer CR, Rosenfeld A. A comparative study of texture measures for terrain classification. IEEE Trans Sys Man Cyb 1976;6:269-85.
27. Skorton DI, Milton HE Jr, Pandian NG, et al. Detection of acute myocardial infarction in closed-chest dogs by analysis of regional 2-D echocardiographic grey level distribution. Circ Res 1983;52:36-44.
28. London GM, Fabiani F, Marchais SJ, et al. Uremic cardiomy- opathy: an inadequate left ventricular hypertrophy. Kidney Int 1987;31:973-80.
29. Koch KM. Dialysis-related amyloidosis. Kidney Int 1992;4: 1416-29.
30. London GM, de Vernejoul MC, Fabiani F, et al. Association between aluminum accumulation and cardiac hypertrophy in hemodialyzed patients. Am J Kidney Dis 1989;12:75-83.
31. Nelson SR, Hawkins PN, Richardson S, et al. Imaging of hemodialysis-associated amyloidosis with I2SI-serum amyloid component. Lancet 1991;338:335-9.
32. Cannella G, La Canna G, Sandrini M, et ai. Reversal of left ventricular hypertrophy following recombinant human eryth- ropoietin treatment of anaemic dialysed uremic patients. Nephrol Dial Transplant 1991;6:31-7.
33. De Simone G, Devereux tlB, Roman MJ, et al. Assessment of left ventricular fimction by the midwall fractional shorten- ing/end systolic stress relation in human hypertension. J Am Coil Cardioi 1994;23:1444-51.
34. Chalgnon M, Chen W-T, Tarazi R, et al. Acute effects of hemodialysis on echographic-determined cardiac perfor- mance: improved contractility resulting from serum increased calcium and reduced potassium despite hypovolemic-reduced cardiac output. Am Heart ~I 1982;103:374-8.
35. Henrich WL, Hunt JM, Nixon JV. Increased ionized calcium and left ventricular contractility during hemodialysis. N Engl l Med 1984;310:19-23.
36. Nixon IV, Mitchell JH, McPhanl JJ lr, Henrich WL. Effects of hemodialysis on left ventricular function. J Clin Invest 1983;71:377-84.
37. Travis M, Henrich WL. Factors which affect cardiac perfor- mance during hemodialysis. Semin Dial 1989;2:241-5.
38. Skorton DI, Collins SM, Woskoff SD, et al. Range and azimuth-dependent variability of image texture in two-di- mensional echocardiograms. Circulation 1983;68:834-40.