
Characterization of Mouse Cell Line IMA 2.1 as a Potential...
14
ALTEX 29, 3/12 261 Characterization of Mouse Cell Line IMA 2.1 as a Potential Model System to Study Astrocyte Functions Stefan Schildknecht 1 , Susanne Kirner 1 , Anja Henn 1 , Karlo Gasparic 1 , Regina Pape 1 , Liudmila Efremova 1 , Olaf Maier 2 , Roman Fischer 2 , and Marcel Leist 1 1 Doerenkamp-Zbinden Chair for in vitro Toxicology and Biomedicine, University of Konstanz, Konstanz, Germany; 2 Institute for Cell Biology and Immunology, University of Stuttgart, Stuttgart, Germany Summary Astrocytes are activated in most chronic neurodegenerative diseases associated with inflammatory events such as Parkinson’s disease or Alzheimer’s disease, but also in stroke. Due to an aging population worldwide, research efforts in these areas are likely to expand in the future. This will entail an increased demand for appropriate experimental models. We introduce here the new immortalized mouse astrocyte cell line IMA 2.1 as an alternative to currently used primary astrocyte cultures. IMA 2.1 were directly compared with primary mouse astrocytes with respect to their response to proinflammatory stimuli, expression of typical astrocyte markers, and to the cell line’s capacity to metabolize the parkinsonian toxin MPTP to its toxic metabolite MPP + . Under inflammatory conditions, mimicked with the addition of a cytokine mix, IMA 2.1 responded similarly to primary astrocytes with mRNA upregulation, expression of iNOS and COX-2, and the release of various inflammatory mediators. Analysis of astrocytic markers indicated that IMA 2.1 represent a relatively early, GFAP-negative stage of astrocyte development. Moreover, conversion of MPTP by monoamine oxidase-B proceeded in IMA at least as quickly as in primary cells. For all endpoints investigated, the cell line IMA 2.1, derived from a single clone, delivered reproducible results over a period of several years and allowed upscaling of experiments due to its easy handling compared with primary cells. Keywords: astrocytes, LUHMES, inflammation, Parkinson’s disease, MPTP Received February 14, 2012; accepted in revised form March 28, 2012 ( • O2 - ), which can lead finally to the formation of several cyto- toxic species such as peroxynitrite (ONOO - ) or hydroxyl radi- cals ( • OH) (Brown and Neher, 2010; Beckman and Koppenol, 1996). These molecules can attack and modify cellular proteins, lipids, and DNA in neighboring neurons, particularly in asso- ciation with chronic brain diseases, as illustrated in numerous reports (Schildknecht et al., 2011). In a widely used in vivo model of PD, astrocytes are respon- sible for the conversion of the parkinsonian toxin 1-methyl-4- phenyl-1,2,3,6-tetrahydropyridine (MPTP) into its active me- tabolite 1-methyl-4-phenylpyridinium (MPP + ) (Ransom et al., 1987; Di Monte et al., 1991). The responsible enzyme has been identified as monoamine oxidase-B (MAO-B) (Langston et al., 1984). After release from astrocytes, MPP + is selectively taken up by dopaminergic neurons leading to their death (Pöltl et al., 2011; Schildknecht et al., 2009). The resultant symptoms and pathology recapitulate key features observed in PD patients. The active toxin MPP + is widely used in cellular cultures of neuronal cells. However, the presence of glial cells as such can have a profound impact on the degeneration process of neurons 1 Introduction Astrocytes are highly differentiated cells of the central nervous system that serve numerous functions, such as nutrient supply of neurons, regulation of cerebral blood flow, orchestration of neuronal growth and differentiation, maintenance of extracel- lular glutamate levels, and ion and liquid balance (Kettenmann and Ransom, 2005). They are furthermore involved in inflam- matory processes in the central nervous system that are ob- served not only following the invasion of pathogens but also in association with chronic neurodegenerative diseases such as Alzheimer’s disease (AD) or Parkinson’s disease (PD) (Falsig et al., 2008). The primary effector cells of the brain in response to bacteria are microglia (Lund et al., 2005, 2006). They release proinflammatory cytokines that trigger the subsequent activa- tion of astrocytes as a second line of defense (Lee et al., 1993; Henn et al., 2011; Falsig et al., 2006). Following stimulation, both cell types become rich sources of cytokines and prosta- noids (Murphy et al., 1988; Meeuwsen et al., 2003). Moreover, they produce the free radicals nitric oxide ( • NO) and superoxide
Transcript of Characterization of Mouse Cell Line IMA 2.1 as a Potential...

Altex 29, 3/12 261
Characterization of Mouse Cell Line IMA 2.1 as a Potential Model System to Study Astrocyte Functions Stefan Schildknecht 1, Susanne Kirner 1, Anja Henn 1, Karlo Gasparic 1, Regina Pape 1, Liudmila Efremova 1, Olaf Maier 2, Roman Fischer 2, and Marcel Leist 1
1Doerenkamp-Zbinden Chair for in vitro toxicology and Biomedicine, University of Konstanz, Konstanz, Germany; 2Institute for Cell Biology and Immunology, University of Stuttgart, Stuttgart, Germany
SummaryAstrocytes are activated in most chronic neurodegenerative diseases associated with inflammatory events such as Parkinson’s disease or Alzheimer’s disease, but also in stroke. Due to an aging population worldwide, research efforts in these areas are likely to expand in the future. This will entail an increased demand for appropriate experimental models. We introduce here the new immortalized mouse astrocyte cell line IMA 2.1 as an alternative to currently used primary astrocyte cultures. IMA 2.1 were directly compared with primary mouse astrocytes with respect to their response to proinflammatory stimuli, expression of typical astrocyte markers, and to the cell line’s capacity to metabolize the parkinsonian toxin MPTP to its toxic metabolite MPP+. Under inflammatory conditions, mimicked with the addition of a cytokine mix, IMA 2.1 responded similarly to primary astrocytes with mRNA upregulation, expression of iNOS and COX-2, and the release of various inflammatory mediators. Analysis of astrocytic markers indicated that IMA 2.1 represent a relatively early, GFAP-negative stage of astrocyte development. Moreover, conversion of MPTP by monoamine oxidase-B proceeded in IMA at least as quickly as in primary cells. For all endpoints investigated, the cell line IMA 2.1, derived from a single clone, delivered reproducible results over a period of several years and allowed upscaling of experiments due to its easy handling compared with primary cells.
Keywords: astrocytes, LUHMES, inflammation, Parkinson’s disease, MPTP
Received February 14, 2012; accepted in revised form March 28, 2012
(•O2-), which can lead finally to the formation of several cyto-toxic species such as peroxynitrite (ONOO-) or hydroxyl radi-cals (•OH) (Brown and Neher, 2010; Beckman and Koppenol, 1996). these molecules can attack and modify cellular proteins, lipids, and DNA in neighboring neurons, particularly in asso-ciation with chronic brain diseases, as illustrated in numerous reports (Schildknecht et al., 2011).
In a widely used in vivo model of PD, astrocytes are respon-sible for the conversion of the parkinsonian toxin 1-methyl-4-phenyl-1,2,3,6-tetrahydropyridine (MPtP) into its active me-tabolite 1-methyl-4-phenylpyridinium (MPP+) (Ransom et al., 1987; Di Monte et al., 1991). the responsible enzyme has been identified as monoamine oxidase-B (MAO-B) (Langston et al., 1984). After release from astrocytes, MPP+ is selectively taken up by dopaminergic neurons leading to their death (Pöltl et al., 2011; Schildknecht et al., 2009). the resultant symptoms and pathology recapitulate key features observed in PD patients. the active toxin MPP+ is widely used in cellular cultures of neuronal cells. However, the presence of glial cells as such can have a profound impact on the degeneration process of neurons
1 Introduction
Astrocytes are highly differentiated cells of the central nervous system that serve numerous functions, such as nutrient supply of neurons, regulation of cerebral blood flow, orchestration of neuronal growth and differentiation, maintenance of extracel-lular glutamate levels, and ion and liquid balance (Kettenmann and Ransom, 2005). They are furthermore involved in inflam-matory processes in the central nervous system that are ob-served not only following the invasion of pathogens but also in association with chronic neurodegenerative diseases such as Alzheimer’s disease (AD) or Parkinson’s disease (PD) (Falsig et al., 2008). the primary effector cells of the brain in response to bacteria are microglia (lund et al., 2005, 2006). they release proinflammatory cytokines that trigger the subsequent activa-tion of astrocytes as a second line of defense (lee et al., 1993; Henn et al., 2011; Falsig et al., 2006). Following stimulation, both cell types become rich sources of cytokines and prosta-noids (Murphy et al., 1988; Meeuwsen et al., 2003). Moreover, they produce the free radicals nitric oxide (•NO) and superoxide

Schildknecht et al.
Altex 29, 3/12262
exposed to MPP+ or other toxins. to model the in vivo situation more faithfully, co-culture models composed of astrocytes and neurons are desirable. they would allow studies of the process of MPtP conversion by astrocytes, as well as the subsequent uptake and degeneration of neurons in a defined and easily ac-cessible in vitro model. Primary astrocytes are used in most currently established co-culture systems (Roqué et al., 2011). Availability and use of a defined and well-characterized astro-cyte cell line that can be applied in such experimental models would avoid the disadvantages of primary cultures.
Primary rodent astrocytes have been used for many in vitro disease models and to obtain biochemical insight into astro-cyte function (Kim and Magrané, 2011; Falsig et al., 2004b; Christiansen et al., 2011). Although highly sophisticated isola-tion procedures have been developed, batch-to-batch variations and contamination with microglia represent considerable short-comings in the use of primary cultures (Hansson, 1986). As primary astrocytes hardly proliferate, the high demand for ani-mals puts an additional burden on this type of cellular model. For example, highly purified primary astrocyte preparations, as used for gene expression profiling (Falsig et al., 2004a, 2006) may yield less than 1 million cells per mouse and a single study may require the sacrifice of several hundreds of mice. In order to find alternative approaches, numerous attempts have been undertaken to generate astrocyte cell lines by retroviral trans-duction of immortalizing oncogenes. The first approach dates back to 1990, when progenitor cells isolated from mouse brains were transduced with the myc-oncogene that allowed the gen-eration of cell lines with neuronal and glial phenotypes (Ryder et al., 1990). In a more sophisticated approach, mouse cortical astrocytes of varying differentiation stages were immortalized by SV40 t antigen, and this allowed the generation of mature and immature mouse astrocyte lines (Frisa et al., 1994). In an attempt to generate an immortalized human astrocyte cell line, astrocytes obtained from human fetal brain have been purified and transfected with the SV40 t antigen. However, it was not-ed that the high proliferation capacity of this newly generated A735 line was associated with downregulation of GFAP ex-pression and subsequent loss of other astrocyte specific mark-ers (Price et al., 1999) and thus that cell line does not represent an adequate substitute for primary cells. In a new attempt to provide an alternative to primary astrocyte cultures, we immor-talized cortical astrocytes of wildtype BAlB/c mice with the SV40 large t antigen, created single cell clones, and selected the clone IMA 2.1 based on its ability to respond to proinflam-matory cytokines and its expression of functional monoamine oxidase-B (MAO-B).
During more than three years of use of IMA 2.1 in our labora-tory, its phenotype and response pattern towards cytokines re-mained stable. this makes the IMA 2.1 a reliable new model for certain astrocyte studies (leist et al., 2010). In the present manuscript, we provide data on the characterization of this new cell line and suggest the IMA 2.1 cell line as a useful tool for a variety of in vitro studies of astrocyte functions including as-trocyte-neuron crosstalk. It is intended as an overview for inter-ested researchers to enable a first judgment on whether IMA 2.1 may be useful for their planned investigations.
2 Animals, materials, and methods
2.1 Immortalization of primary astrocytes from BALB/c miceCerebral cortices were isolated from one- or two-day-old mice. After removal of the meninges, cortices were chopped into small pieces with a razor blade and further homogenized by enzymatic digestion in PBS/0.5% trypsin/eDtA (Gibco/Invit-rogen, Karlsruhe, Germany), 0.5% DNase I (Sigma-Aldrich, Steinheim, Germany) for 15 min at 37°C. trypsin was inac-tivated by addition of fetal calf serum (FCS; PAN Biotech, Aidenbach, Germany) and tissue was triturated using a Pasteur pipette. the homogenates were seeded on poly-D-lysine hyd-robromide (PDl; 10 µg/ml; Sigma-Aldrich, MW 30-70 kDA) coated culture flasks at a density of approximately 40,000 cells/cm2 in DMeM (Gibco/Invitrogen) supplemented with 10% FCS, 2 mM l-Glutamin (Invitrogen) and 1% penicillin/streptomycin (Invitrogen). After 8 days in culture, an astrocyte layer, overgrown by numerous microglial cells, oligodendro-cyte precursor cells, and oligodendrocytes can be observed. To prepare purified astrocyte cultures, oligodendrocytes and surface microglia were flushed away from the astrocyte layer. the remaining microglia were removed by trypsinization of the primary cultures and differential adhesion for 30 min on uncoated culture dishes. the astrocytes remaining in the su-pernatant were collected, and approximately 0.5 x 10⁶ cells were plated in PDl-coated 6-well plates. Cells were grown to confluency in culture medium without antibiotics. On the day of transfection, medium was changed to Opti-MeM I (Gibco). lipofectamine 2000 (Invitrogen) was diluted 1:50 in Opti-MeM I and incubated for 5 min at room temperature. the plasmid psV3neo (Chang et al., 1986), coding for the large t antigen from SV40 (500 ng) was diluted in Opti-MeM I and mixed in a ratio of 1:1 with the lipofectamine dilution. the resulting transfection complexes were preincubated at room temperature for an additional 20 min, the transfection mixture (500 µl/well) was added carefully to the cells and then incu-bated at 37°C. After 6 h, the transfection mixture was replaced by standard cell culture medium and the cells were incubated for an additional 24 h. Stably transfected cells were selected with 800 µg/ml geneticin (G418; Invitrogen). the resultant immortalized mouse astrocytes (IMA) were cultured at 37°C (5% CO2) in DMeM Glutamax (high glucose) (GIBCO) with 5% FCS (fetal calf serum, from PAA) without antibiotics. they were trypsinized for 2 min with 0.5% trypsin/DMeM every 2-3 days and reseeded at a ratio of 1:5 or 1:10. experiments were performed in DMeM containing 2% FCS.
2.2 Primary astrocyte cultures Primary cortical astrocytes were generated from BAlB/c mice bred at the animal facility of the University of Konstanz, Ger-many. All mice were housed at 22°C and 55% relative humidity in a 12 h day/night rhythm with free access to food and water ac-cording to national regulations and eU Directive 2010/63/eU. Primary cortical astrocytes were prepared from mouse pups at 24-48 h post partum, as described earlier (Henn et al., 2011). In brief, brains were removed, the cortices were dissected out, and

Schildknecht et al.
Altex 29, 3/12 263
each cell with the predefined algorithm “nuclear translocation,” essentially as described earlier (Henn et al., 2009, 2011).
2.5 Flow cytometryCells from 6-well plates were trypsinized and washed twice with PBS, containing 10% FCS. they were centrifuged for 5 min at 500 x g. FITC-conjugated anti-TLR2 antibody (clone 6C2; eBioscience; Alasdair Stewart, U.K) diluted in 2% FCS/PBS to a concentration of 1 µg per million cells (in 200 µl) was add-ed for 50 min at 4°C. An appropriate isotype control was used in a similar way. Cells were washed twice and fixed with 0.5% PFA. For each sample, a minimum of 10,000 cells within the gated cell population was analyzed using a flow cytometer (Accuri Cytometers, Cambs, U.K.) and the corresponding soft-ware CFlow. the percentage of positively stained cells relative to isotype control (maximum 1% positive staining) was deter-mined.
2.6 RNA extraction, RT-PCR, and quantitative PCRtotal RNA was extracted with tRIzol from Invitrogen (Darm-stadt, Germany) and 1 µg of total RNA was reverse transcribed with Superscript™ II Reverse transcriptase (Invitrogen, Darm-stadt, Germany) using random hexamers and Oligo-dt-Primer in a 20 µl reaction according to the manufacturer’s protocol. PCR amplification of the cDNA was quantified using the Plati-num® SYBR® Green qPCR SuperMix-UDG kit (Invitrogen, Darmstadt, Germany). the threshold cycle (Ct) was determined for each sample using the iCycler MyiQ qPCR detection system (BioRad laboratories, Hercules, CA, USA) and correspond-ing data analysis software. the housekeeping gene control was gapdh. the relative cDNA levels were compared among dif-ferent groups using the delta-delta Ct method. Absolute levels were calculated by the delta Ct method. the following primer sequences were used in the study:
Aqp 4: sense: 5´-GCt CAG AAA ACC CCt tAC CtG tGG-3´, antisense: 5´-ttC CAt GAA CCG tGG tGA CtC C-3´; Cnx 43: sense: 5´-CCA CtC tCA CCt AtG tCt CCt CC-3´, antisense: 5´-CGt CAG GGA AAt CAA ACG GCt GG-3´; COx-2: sense: 5´-CCA ttG AAC CtG GAC tGC AGA AGG C-3´, antisense: 5´-CGG AAC tAA GAG GAG CAG CAA tGC-3´; GAPDH: sense 5´-CAG GCA GCt CAG Gtt GAC tCt G-3´, antisense 5´-GGA tGC AGG GAt GAt Gtt C-3´; GFAP: sense 5´-CGA GAt CGC CAC CtA CAG GAA GC-3´, antisense: 5´-CCt tAA tGA CCt CtC CAt CCC GC-3´; GlASt: sense 5´-CtC tAC GAG GCt ttG GCt GC-3´, antisense: 5´-GAG GCG GtC CAG AAA CCA GtC-3´; Glt-1: sense: 5´-GCA GCC AtC ttC AtA GCC CAA AtG-3´, antisense: 5´-CtC Att CtA tCC AGC AGC CAG tCC-3´; GS: sense: 5´-GtG tGt GGA AGA Gtt ACC tGA GtG G-3´, an-tisense: 5´-AtG tGC CtC AAG ttG GtC tCt GC-3´; Il-1β: sense: 5´-ttt ttG ttG ttC AtC tCG GAG CCt GtA G-3´, antisense: 5´-GAG CAC Ctt Ctt ttC Ctt CAt Ctt tG-3´; Il-6: sense: 5´-CCt CtG GtC ttC tGG AGt ACC AtA GC-3´, antisense: 5´-GGA GAG CAt tGG AAA ttG GGG tAG G-3´; Il-23: sense: 5´-CAt GCA CCA GCG GGA CAt AtG-3´, antisense: 5´-CAG ACC ttG GCG GAt CCt ttG-
hippocampi and meninges were carefully removed before di-gestion with trypsin and DNase. After trituration, the cell sus-pension was carefully layered over a 30% Percoll solution and centrifuged at 150 x g for 10 min. the astrocyte fraction was recovered, washed, and resuspended in DMeM (high glucose), 20% FCS, 100 U/ml penicillin and 100 µg/ml streptomycin. Cells were seeded at a density of 2 million cells (corresponding to 4 brains) per T175 flask, and cultured at 37°C in a 5% CO2 atmosphere. the medium was changed after 4 days, and sub-sequently every second day. After 14 days in primary culture, cells were trypsinized and incubated in DMeM for 45 min at room temperature in a T75 flask for differential adhesion of any residual microglia. Non-adherent cells (astrocytes) were reseed-ed in DMeM plus 10% FCS, containing 4.5 g/l D-glucose and 2 mM Glutamax, and cultured in multiwell dishes for 7-9 days before use in experiments. this protocol was shown to result in microglia or oligodendrocyte contaminations below our detec-tion limit (< 1%) by FACS, PCR, or immunostaining.
2.3 Co-culture modelPrimary astrocytes or IMA were seeded into 24-well plates (Nunclon, Nunc, Roskilde, Denmark), and when confluency was reached, the cells were maintained for 7 additional days. then, predifferentiated (2-days) human mesencephalic cells (lUHMeS) were seeded on top of the glial cell layer at a den-sity of 180,000/cm2 in Advanced DMeM (Gibco), containing 2 mM l-glutamine, 1 x N2 supplement, and 1 µg/ml tetracy-cline for 4 more days. lUHMeS cells were previously charac-terized with respect to their applicability as an in vitro model of terminally differentiated dopaminergic neurons (Schildknecht et al., 2009; Scholz et al., 2011; lotharius et al., 2005). to se-lectively visualize the neurons in these co-cultures, cells were fixed with 4% paraformaldehyde (PFA) for 15 min and permea-bilized with 0.2% triton x-100 in PBS for 10 min. Following blocking with 1% bovine serum albumin (BSA) in PBS for 1 h, lUHMeS were stained with an antibody against the neuronal class of β-III-tubulin (TUJ-1; Convance, mouse, 1:1000) and fluorescence-labeled secondary antibodies.
2.4 Translocation of NF-κBCells were plated in 96-well plates at 15,000 cells/well and cultured in DMeM plus 2% FCS. the cells were stimulated as indicated, then fixed with 4% PFA for 15 min, permeabi-lized with 0.1% triton x-100 for 10 min, blocked with 10% FCS for 1 h, immunostained with purified monoclonal mouse anti-NF-κB p65 (clone 20/NF-κB/p65; final dilution 1:300) antibody (BD transduction laboratories) over night, and de-tected with anti-mouse IgG Alexa-488 secondary antibody. Im-ages were recorded with a high-resolution CCD camera on a Cellomics ArrayScan™, which is based on an automated Zeiss Axiovert-100 microscope equipped with a 20x objective and a FITC/H-33342 filter set (λex-1 = 365 nm, λex-2 = 475 nm, λem = 535 nm). Nuclei, stained with H-33342, were imaged first (channel 1) for automated focusing and identification of valid objects. Subsequently, the stained antigens were imaged in the corresponding fields (channel 2). Based on these data sets, the nuclear translocation of NF-κB was quantified for

Schildknecht et al.
Altex 29, 3/12264
2.9 Monoamine oxidase (MAO) activity assaythe assay is based on the oxidation of kynuramine to 4-hydrox-yquinoline by MAO. Cells were homogenized in PBS, and total protein content was adjusted to 1 mg/ml. Then, 180 µl of cell ho-mogenate were supplemented with 20 µl substrate kynuramine (Sigma) in PBS to yield a final concentration of 100 µM. In par-allel, a standard curve of 4-hydroxyquinoline (0-100 µM) was prepared. After 2 h of incubation, the reaction was terminated by the addition of 80 µl perchloric acid (400 mM). Samples were centrifuged at 12,000 x g for 1 min, 200 µl supernatant was transferred into a new tube and mixed with 400 µl NaOH (1 M). Samples of the standard curve were treated accordingly and fluorescence was detected at λex 315 nm / λem 380 nm.
2.10 Cyclooxygenase (COX) activityCOx activity was determined by the conversion of the 14C-labeled substrate arachidonic acid (14C-AA) to prostanoids (Schildknecht et al., 2008). Cells were washed twice, collected in cold PBS and centrifuged at 1000 x g for 3 min. the pellet was dissolved in lysis buffer (20 mM HePeS, 1% triton x-100, 1% aprotinin, 10% glycerol, pH 7.5) for 30 min on ice. Fol-lowing centrifugation at 12,000 x g for 1 min, the superna-tant was incubated with reaction buffer (80 mM tris-HCl, 0.1 mM phenol, 5 µg/ml hematin, 5 µM 14C-AA, pH 8.0) for 20 min. the reaction was terminated by the addition of ethyl ac-etate/ 2 M citric acid (30:1). After vortexing for at least 1 min, the organic phase was collected, evaporated and used for analy-sis on silica tlC plates (Silica 60, Merck, Darmstadt, Germany) by chromatography. the mobile phase consisted of ethyl acetate : 2,2,4-trimethylpentane : acetic acid : water (110:50:20:100). Plates were dried and used to expose a PhosphorImager™ screen overnight. For reading the screen, a PhosphorImager™ system from Molecular Dynamics, USA was used. Quantifica-tion was performed by the detection of total prostanoid forma-tion utilizing ImageQuant™ software.
2.11 Western blot analysisCells were lysed in RIPA buffer (50 mM tris-base, 150 mM NaCl, 1 mM eDtA, 0.25% sodium deoxycholate, 1% NP40, 1 mM Na3VO4, 50 mM NaF, pH 7.5). Protein determination was performed by using a BCA protein assay kit (Pierce). Af-ter loading of 25 µg protein to a 8% polyacrylamide SDS gel, proteins were transferred onto nitrocellulose membranes (Am-ersham, Buckinghamshire, UK). loading and transfer were controlled by brief Ponceau staining. Washed membranes were then blocked with 5% milk in PBS-tween (0.1%) for 2 h. Pri-mary antibodies were added at 4°C over night (COx-2: Cay-man, polyclonal, 1:1000; NOS-2: BD transduction, polyclonal rabbit 1:5000; β-actin: Sigma, monoclonal mouse 1:2000). Fol-lowing washing steps with PBS-tween, horseradish peroxidase-conjugated secondary antibodies were added for 1 h at room temperature. For visualization, eCl western blotting substrate (Pierce) was used. As secondary antibodies, anti-mouse HRP 1:5000, Jackson Immuno Research and anti-rabbit HRP 1:5000, Ge Healthcare were used.
3´; Kir4.1: sense: 5´-GtA GAC ACA GCC tCA GAC AGC C-3´, antisense: 5´-GGt AGG AAG tGC GAA Ctt GGC-3´; MAO-B: sense: 5´-AAC AGt Att CtG GGG GCt GCt ACA-3´, antisense: 5´-AGG GAC AtC CAA AGA ttC tGG ttC tG-3´; MCP-1: sense: 5´-CAt AGC AGA ACA GAA GAA CAG-3´, antisense: 5´-GtC ttC GGA Gtt tGG Gtt tG-3´; Nestin: sense: 5´-CtG GAA GGt GGG CAG CAA Ct-3´, an-tisense: 5´-Att AGG CAA GGG GGA AGA GAA GGt G-3´; NOD-2: sense: 5´-CAG GCA GCt CAG Gtt GAC tCt G-3´, antisense: 5´-tAG AAA GCG GCA AAA AAG CAC tGG AAG-3´; NOS-2: sense: 5´-ttG CCA CGG ACG AGA CGG AtA GG-3´, antisense: 5´-GGG Gtt Gtt GCt GAA Ctt CCA GtC-3´; S100β: sense: 5´-GGt tGC CCt CAt tGA tGt Ctt CCA C-3´, antisense: 5´-Ctt CCt GCt CCt tGA ttt CCt CCA G-3´; tlR-2: sense: 5´-CCt CCG tCt tGG AAt GtC ACC AGG-3´, antisense: 5´-GAG CCA CGC CCA CAt CAt tC-3´; tlR-3: sense: 5´-GCC CCC ttt GAA CtC CtC ttC-3´, antisense: 5´-AGA tCC tCC AGC CCt CGA tG-3´; tNF-α: sense: 5´-tAG CAA ACC ACC AAG tGG AGG AG-3´, antisense: 5´-GCA GCC ttG tCC Ctt GAA GAG AA-3´; tYKi: sense: 5´- GGA tGC GCt GCA CAC CAA tt-3´, anti-sense: 5´-tAG CtC Ctt GGC CtC CGt ttG-3´.
2.7 Measurements of prostanoids and nitrite in cell culture supernatantsProstaglandin e2 (PGe2) was determined by using commercially available eIA-kits (Assay Designs, MI, USA) according to the manufacturer’s instructions. Nitrite (NO2-), the stable autoxida-tion product of •NO, was measured by the Griess assay. Briefly, 30 µl 12.5 µM sulfanilamide (Sigma) and 30 µl 6 M HCl were mixed with 200 µl cell culture supernatant at room tempera-ture and incubated for 5 min. Absorbance was measured before and after the addition of 25 µl N-(1-naphthyl)ethylenediamide (12.5 µM) (Sigma) at 560 nm using a microtiter plate reader. Nitrite concentrations were calculated from a NaNO2 standard curve in the range of 0.5-10 µM.
2.8 HPLC analysisDetection of MPtP, MPP+, and MPDP+ was performed on a Kontron system (Goebel Analytic, Au/Hallertau, Germany) composed of a model 520 pump, model 560 autosampler, mod-els 535 and 430 diode array detectors, set at 245 nm for MPtP, 295 nm for MPP+, and 345 nm for MPDP+.
Samples were acidified with 9 µl perchloric acid (70%) per ml volume of sample and centrifuged at 10,000 x g for 15 min. the supernatant was filtered through a Chromaphil PET-20/15MS-filter with 0.2 µm pore size from Macherey Nagel (Düren, Germany).
Separation was carried out on a C18 nucleosil column (250 x 4.6 mm; 5 µm particle size) from Macherey Nagel (Düren, Germany) at room temperature. The mobile phase con-sisted of acetonitrile : distilled water : triethylamine : sulfuric acid (12.50 : 86.18 : 1.04 : 0.28, v/v, pH 2.3). the mobile phase was degassed with an online vacuum degasser and delivered isocratically at a flow rate of 1 ml/min at an average pressure of 145 bar. Data analysis was performed with Geminyx II software (Goebel Analytic).
15 http://www.pistoiaalliance.org/ 16 OpenTox, http://www.opentox.org/

Schildknecht et al.
Altex 29, 3/12 265
clones (designated IMA 2.1 - IMA 2.5) were investigated with respect to their response to different cytokines. In all subclones, IL-1β, TNF-α, or CCM were observed to trigger strong NF-κB translocation to the nucleus. Clone 2.1 showed slightly higher growth rates and therefore was selected for all further experi-ments and characterizations.
the inducible isoform of nitric oxide synthase (NOS-2) was chosen as a representative example for pathophysiologi-cally-relevant astrocyte enzymes. NOS-2 mRNA expression was slightly increased after 16 h of stimulation by TNF-α or IL-1β (Fig. 1B). Combination of the two cytokines did not fur-ther increase NOS-2 mRNA, and IFN-γ had no effect, when
2.12 Inflammatory stimulationIMA or primary astrocytes were stimulated with cytokines or the tlR-2 ligand FSl-1 (Invitrogen, San Diego, CA). Murine TNF-α, IL-1β, and IFN-γ were obtained from R&D Systems (Wiesbaden, Germany). The combination of IL-1β (10 ng/ml), TNF-α (10 ng/ml), and IFN-γ (20 ng/ml) was termed complete cytokine mix (CCM).
2.13 ImmunocytochemistryCells were grown on 10 mm glass cover slips (Menzel, Braun-schweig, Germany) in 24-well plastic cell culture plates (Nun-clon™). Following treatment, cells were fixed with 4% PFA for 20 min at 37°C and washed with PBS. After blocking with 1% BSA (Calbiochem, San Diego, CA) for 1 h, primary antibodies (anti-CD44, 1:500, rat monoclonal, Caltag laboratories; anti-nestin, 1:500, rat monoclonal, Millipore) were added in PBS-tween (0.1%) at 4°C over night. Secondary antibodies (anti-rat IgG-Alexa 488, Invitrogen, Darmstadt, Germany) were added for 45 min at Rt. For visualization, an Olympus Ix 81 micro-scope (Hamburg, Germany) equipped with an F-view CCD camera was used. Nuclei were stained with H-33342 (1 µg/ml) for 15 min prior to the final washing step. For image processing, Cell P software (Olympus) was used.
2.14 StatisticsNF-κB translocation data are based on at least 200 valid cells per well and are indicated as the means ±SeM of at least three wells from independent experiments. Flow-cytometry analysis was done in duplicates. Nitrite and PGe2 detection, enzyme ac-tivity assays and mRNA experiments were all performed in trip-licates using independent cell preparations. Statistical analysis was performed with GraphPad Prism software (Version 4.03), using t-test or one-way ANOVA with Bonferroni’s post-hoc test, as appropriate.
3 Results
3.1 Characterization of inflammatory responsesInitially, we used a pool of IMA, obtained by selection of the transfected cells by antibiotics, and then expanded the cells by passaging in normal culture medium. After stable growth con-ditions were reached, such cells were tested for their capacity to react to inflammatory cytokines. Altogether, six cell pools from different transfections were used (IMA 1-6) to assess NF-κB translocation from the cytosol to the nucleus. this sig-naling response is usually observed after stimulation of astro-cytes with various cytokines as well as toll-like receptor (tlR) ligands. Here, it was quantitatively assessed 30 min after stimulation with IL-1β, TNF-α, IFN-γ, or a combination of all three cytokines (complete cytokine mix = CCM). TNF-α or IL-1β stimulation alone was sufficient to evoke maximal NF-κB translocation (Fig. 1A). In these experiments, IMA 2 showed the best responses, and they were used thereafter. In order to obtain a homogeneous cell population, IMA 2 were diluted to the single cell level and different clones originating from this procedure were generated and compared. Five IMA 2 sub-
Fig. 1: Inflammatory response to different cytokines (A) IMA 2.1 were stimulated with IL-1β (10 ng/ml), TNF-α (10 ng/ml), or IFN-γ (20 ng/ml), or by a complete cytokine mix (CCM) composed of all three cytokines for 30 min. Cells were then fixed and stained with an anti-NF-κB p65 antibody. Quantitative assessment of NF-κB translocation from the cytosol to the nucleus was performed with an automated microscope (Cellomics Array Scan). This method allows detection of NF-κB translocation on the single cell level. Data are displayed as percentage of cells positive for NF-κB translocation compared to all cells detected. (B) IMA 2.1 were stimulated with cytokines as indicated for 16 h, nitric oxide synthase-2 (NOS-2) mRNA was detected as representative for an early immediate gene. Data are expressed as means ±SD of quadruplicate samples. Statistical significance was determined by one-way ANOVA followed by Bonferroni’s post-hoc test. *P <0.05
Schildknecht et al.
Altex 29, 3/12266
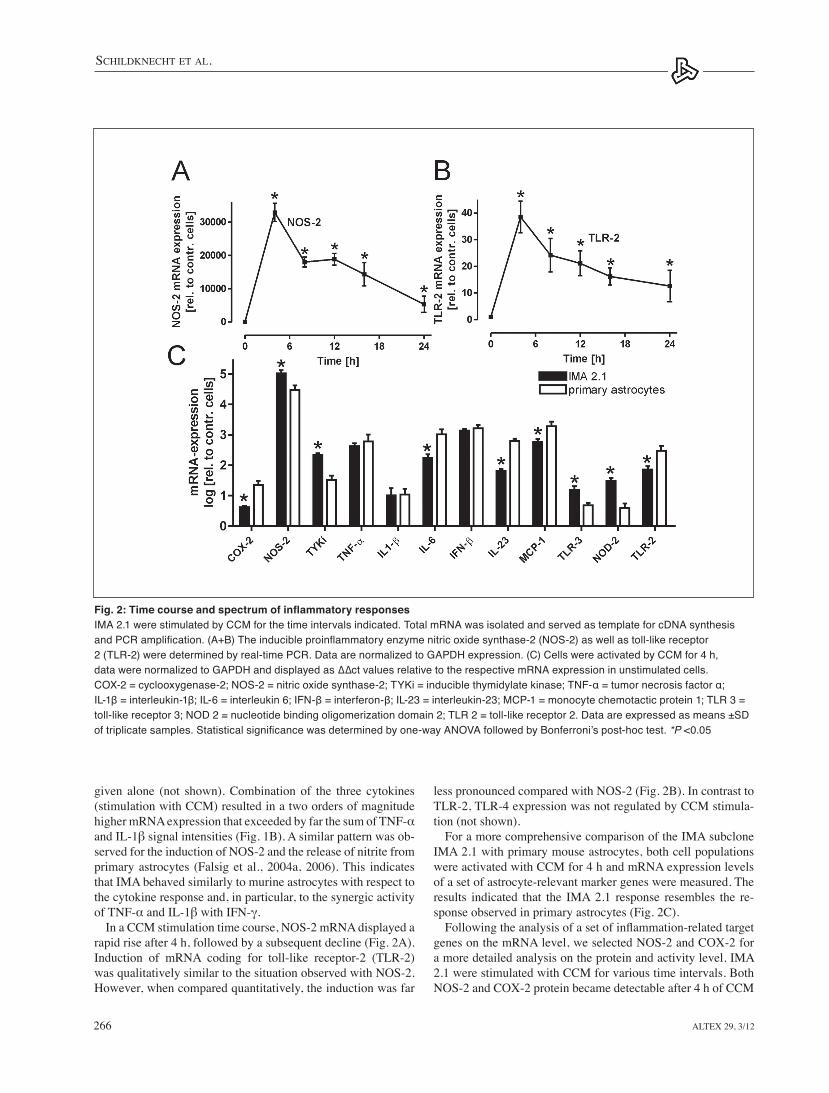
less pronounced compared with NOS-2 (Fig. 2B). In contrast to tlR-2, tlR-4 expression was not regulated by CCM stimula-tion (not shown).
For a more comprehensive comparison of the IMA subclone IMA 2.1 with primary mouse astrocytes, both cell populations were activated with CCM for 4 h and mRNA expression levels of a set of astrocyte-relevant marker genes were measured. the results indicated that the IMA 2.1 response resembles the re-sponse observed in primary astrocytes (Fig. 2C).
Following the analysis of a set of inflammation-related target genes on the mRNA level, we selected NOS-2 and COx-2 for a more detailed analysis on the protein and activity level. IMA 2.1 were stimulated with CCM for various time intervals. Both NOS-2 and COx-2 protein became detectable after 4 h of CCM
given alone (not shown). Combination of the three cytokines (stimulation with CCM) resulted in a two orders of magnitude higher mRNA expression that exceeded by far the sum of TNF-α and IL-1β signal intensities (Fig. 1B). A similar pattern was ob-served for the induction of NOS-2 and the release of nitrite from primary astrocytes (Falsig et al., 2004a, 2006). this indicates that IMA behaved similarly to murine astrocytes with respect to the cytokine response and, in particular, to the synergic activity of TNF-α and IL-1β with IFN-γ.
In a CCM stimulation time course, NOS-2 mRNA displayed a rapid rise after 4 h, followed by a subsequent decline (Fig. 2A). Induction of mRNA coding for toll-like receptor-2 (tlR-2) was qualitatively similar to the situation observed with NOS-2. However, when compared quantitatively, the induction was far
Fig. 2: Time course and spectrum of inflammatory responsesIMA 2.1 were stimulated by CCM for the time intervals indicated. Total mRNA was isolated and served as template for cDNA synthesis and PCR amplification. (A+B) The inducible proinflammatory enzyme nitric oxide synthase-2 (NOS-2) as well as toll-like receptor 2 (TLR-2) were determined by real-time PCR. Data are normalized to GAPDH expression. (C) Cells were activated by CCM for 4 h, data were normalized to GAPDH and displayed as ∆∆ct values relative to the respective mRNA expression in unstimulated cells. COX-2 = cyclooxygenase-2; NOS-2 = nitric oxide synthase-2; TYKi = inducible thymidylate kinase; TNF-α = tumor necrosis factor α; IL-1β = interleukin-1β; IL-6 = interleukin 6; IFN-β = interferon-β; IL-23 = interleukin-23; MCP-1 = monocyte chemotactic protein 1; TLR 3 = toll-like receptor 3; NOD 2 = nucleotide binding oligomerization domain 2; TLR 2 = toll-like receptor 2. Data are expressed as means ±SD of triplicate samples. Statistical significance was determined by one-way ANOVA followed by Bonferroni’s post-hoc test. *P <0.05

Schildknecht et al.
Altex 29, 3/12 267
Fig. 3: Induction of cyclooxygenase-2 and nitric oxide synthase-2IMA 2.1 were activated by CCM (IL-1β, TNF-α, IFN-γ) for the time periods investigated. (A) The amount of cyclooxygenase-2 (COX-2) and nitric oxide synthase-2 (NOS-2) was evaluated on the protein level as shown by Western blot analysis. (B) Prostaglandin E2 (PGE2) as indicator for COX activity and nitrite as indicator for NOS activity were assessed in the respective cell culture supernatants. (C+D) To discriminate between NOS-2-dependent •NO formation and •NO derived from constitutively expressed NOS proteins, the NOS-2 selective inhibitors AMT or L-NMMA were applied in different concentrations together with a cytokine mix for 16 h. Nitrite served as indicator for NOS activity. Data are expressed as means ±SD of quadruplicate samples. Statistical significance was determined by one-way ANOVA followed by Bonferroni’s post-hoc test. *P <0.05
Fig. 4: Regulation of inflammation-relevant proteins(A) IMA 2.1 were stimulated with CCM for the time intervals indicated, enzymatic activity of COX was directly assessed in cell lysates by the addition of 14C-labeled arachidonic acid. (B) IMA 2.1 were activated with a cytokine mix as indicated, cells were stained with an anti-TLR-2 antibody and detected by flow cytometry. (C) IMA 2.1 were treated with CCM, brefeldin A (BFA), or a combination of CCM and BFA for 16 h, TLR-2 surface expression was analyzed by flow cytometry. Data are expressed as means ±SD of quadruplicate samples. Statistical significance was determined by one-way ANOVA followed by Bonferroni’s post-hoc test. *P <0.05
Schildknecht et al.
Altex 29, 3/12268
different morphological features. According to this, IMA 2.1 took the typical star-shape of astrocytes. Both markers were expressed in primary astrocytes and IMA 2.1, but the astro-cytic extensions of IMA 2.1 were slightly shorter compared with primary astrocytes. Both, nestin and CD44, are not con-sidered typical astrocyte markers (Kuegler et al., 2010, 2012), but are rather typical for immature precursors. However, they are often found in primary neonatal astrocyte cultures (which are commonly used for many experiments). the strong expres-sion in IMA suggests their rather early-stage astrocyte precur-sor phenotype. For the assessment of general cell morphology, IMA 2.1 and primary astrocytes were stained with fluorescent phalloidin that selectively binds to F-actin. Confluent IMA 2.1 were additionally stained by calcein-AM (1 µM; 30 min) and the same region was photographed in the phase contrast mode (Fig. 5B). In order to test the functionality of the mature astro-cyte marker glutamine synthase in IMA 2.1, cells were main-tained under different culture conditions. In the presence of 2 mM glutamine, astrocytes had optimal growth conditions and they proliferated largely independent of the FCS concentra-tions in the culture. At lower glutamine concentrations, IMA increased their doubling time and became more dependent on high concentrations of FCS. Addition of glutamate compen-sated for the lack of glutamine supply, at least at high FCS concentrations. these data indicate that IMA were capable of enzymatic conversion of glutamate by glutamine synthase (Fig. 5C). Such a conversion of glutamate to glutamine is a typical function of astrocytes in the brain.
For further characterization of the enzymes involved in the glutamine/glutamate uptake and synthesis as well as other glial-related targets, mRNA expression was directly compared between primary mouse astrocytes, IMA 2.1, and the astrocyte-unrelated, murine control cell types 3t3 or BV-2. In the se-lected set of markers, expression in primary astrocytes was in general much higher compared with IMA 2.1 (Fig. 6A,B). In most cases, the expression in IMA was similar to the one of a non-astrocytic cell (3T3-fibroblasts or BV-2 microglia) (Henn et al., 2009). The RNA data were confirmed also immunocy-tochemically, e.g., by an absence of staining for glial fibrillary acidic protein (GFAP). Four notable exceptions were found: aq-uaporin 4, a typical astrocyte marker was expressed 200-fold higher in IMA than in 3t3. Nestin was expressed in IMA to a similar extent as in primary astrocytes, which is consistent with immunostaining results. S100β and Cnx43, typical mark-ers expressed early in astrogenesis, had an elevated expression relative to non-astrocytic markers. In summary, these data sug-gest that IMA resemble the GFAP-negative astrocytes that can be derived from stem cells (Kuegler et al., 2012) and are at a relatively immature stage.
3.3 Metabolic capacity of IMA 2.1In addition to the descriptive phenotype markers, we also exam-ined the actual metabolic competence of IMA. MAO-B activity was chosen because of its prime importance in neurotoxicology. IMA 2.1 were compared with HeK293, Hela, the neuronal cell line lUHMeS, and SH-SY5Y neuroblastoma cells with respect to MAO activity. Addition of the MAO-substrate kynuramine to
stimulation (Fig. 3A). Interestingly, NOS-2 mRNA peaked at 4 h, while NOS-2 protein expression displayed a peak after 16 h. Similar observations have been made in other inflammatory cells, such as lipopolysaccharide-stimulated primary rat alveo-lar macrophages (Schildknecht, unpublished).
Accumulation of prostaglandin e2 (PGe2) in the supernatant served as an indirect indicator of COx activity. Unlike the grad-ual and continuing increase of nitrite as a marker of NOS activ-ity, PGe2 demonstrated an increase up to 16 h after CCM stimu-lation. From then on, no further elevation was observed, despite a pronounced COx-2 protein expression (Fig. 3A,B). to test whether inducible NOS-2 was solely responsible for the nitrite accumulation, selective inhibitors of NOS-2, i.e., AMt and l-NMMA, were applied in different concentrations together with CCM for 16 h. the complete block of nitric oxide synthesis by these compounds suggests that no other NOS-isoform contrib-uted to the observed •NO synthesis (Fig. 3C,D).
For a further investigation of the lack of PGe2 synthesis af-ter 16 h of CCM activation, COx activity in homogenates of CCM-treated IMA was directly assessed by addition of the 14C-labeled substrate arachidonic acid, followed by separation and quantification of the prostanoids formed. In close correla-tion to the Western blot data in Fig. 3A, a constant increase in activity up to 12 h of CCM stimulation was observed, which was followed by a rapid decline in COx activity to almost baseline values (Fig. 4A). Similar observations were made in RAW 264.7 cells (Schildknecht et al., 2006) and primary rat al-veolar macrophages (unpublished), in which a nitration and in-activation of COx-2 was observed. Although not investigated in detail in IMA 2.1 so far, it is likely that a similar mechanism is responsible for the observed effects, since we found that in-activation of COx-2 could be prevented with NOS-2 inhibitors (not shown).
We examined tlR-2 protein expression on the surface of CCM-stimulated IMA 2.1 by FACS analysis (Fig. 4B) in addi-tion to the mRNA profiling (Fig. 2B). The surface expression continuously increased for up to 12 h. the delay between the time course of mRNA and protein surface expression likely originated from a time period required for the synthesis and transport of newly formed tlR-2 from the Golgi- to the plas-ma-membrane. to test the importance of translocation, the se-cretory vesicle assembly blocker brefeldin A (BFA) was used. Under these conditions, a significant reduction in TLR-2 sur-face expression was detected. this inhibitory effect also was seen for the baseline tlR-2 surface expression of unstimulated cells (Fig. 4C). together, these data indicate that IMA showed inflammatory responses similar to those of primary astrocytes or other inflammatory cells. Moreover, the data suggest the im-portance of activity measurements and protein quantification in addition to the mRNA profiling.
3.2 Expression of immature astrocyte markersFor an initial comparison of the marker expression and mor-phology of primary mouse astrocytes and IMA 2.1, cells were stained with antibodies selective for nestin and CD44 (Fig. 5A). these two proteins with cytoskeletal (nestin) and mem-braneous (CD44) localization allow the characterization of

Schildknecht et al.
Altex 29, 3/12 269
Fig. 5: Phenotypic and functional characteristics of IMA 2.1(A) IMA 2.1 or primary murine astrocytes were fixed, permeabilized, and stained with antibodies against the cell surface glycoprotein CD44 and the intermediate filament protein nestin (green). Nuclei were labeled with H-33342 (red). Alternatively, fluorescence-conjugated phalloidin, selectively binding to F-actin, was used for visualization of general cell morphology of IMA 2.1 and primary astrocytes. (B) Additionally, living IMA 2.1 were labeled with calcein-AM (1 µM; 30 min), the same region was also photographed in the phase contrast mode. (C) IMA 2.1 were seeded at a density of 10,000 cells/cm2 (2% FCS) and 5,000 cells/cm2 (5% and 10% FCS) in the presence of different serum concentrations (2%, 5%, 10%). For each serum concentration, variable glutamine/glutamate levels were added, cells were allowed to grow for a total of 10 days and the number of cells was determined manually every 12 h. The doubling time was calculated from the growth curves. Doubling time for cells grown with 2% serum and 0.1 mM glutamine could not be determined as cells did not tolerate these growth conditions. The value was set to 270 h for graphical representation. Data are expressed as means ±SD of quadruplicate samples. Statistical significance was determined by one-way ANOVA followed by Bonferroni’s post-hoc test. *P <0.05

Schildknecht et al.
Altex 29, 3/12270
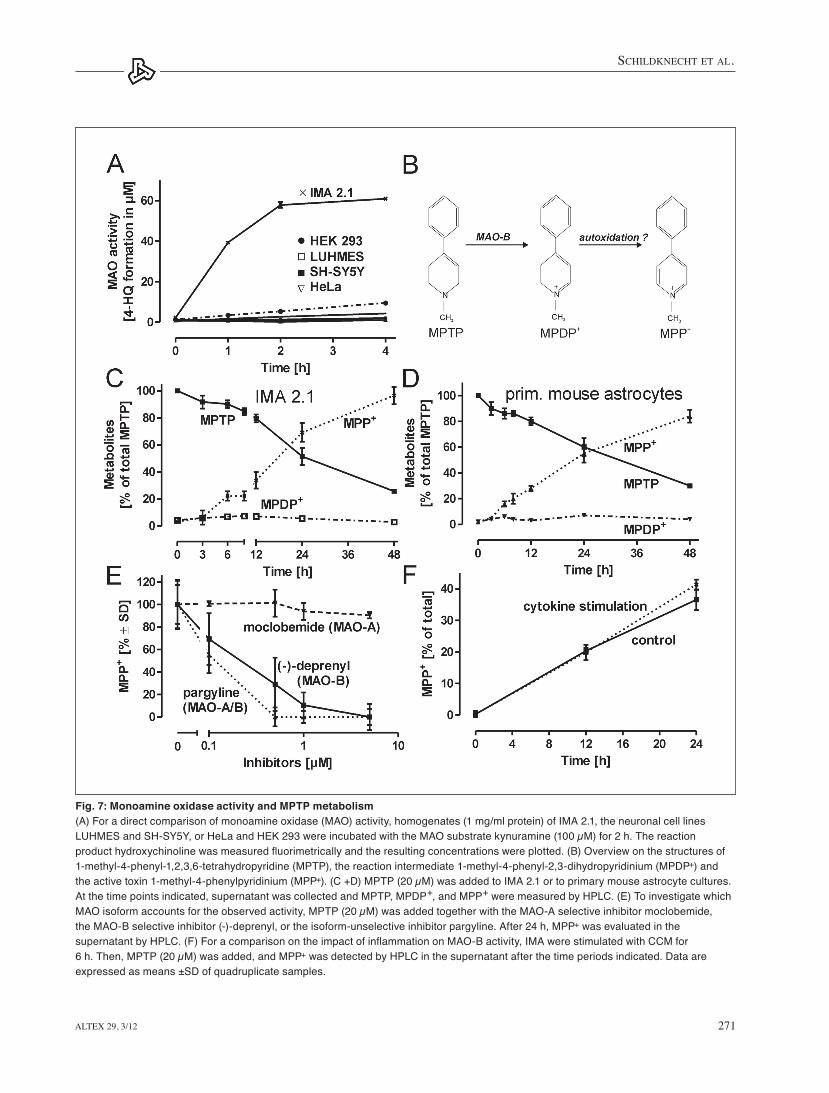
homogenized cells indicated a significantly higher MAO activ-ity in IMA compared with the other cell types investigated (Fig. 7A). thus, as in the case of NOS-2 and tlR-2, the protein data did not correlate with the mRNA data. For a potential applica-tion of IMA 2.1 in co-culture models together with dopamin-ergic neurons in the field of Parkinson’s disease research, con-version of the parkinsonian toxin MPtP into the dopaminergic neurotoxin MPP+ (Fig. 7B) was investigated in IMA 2.1.
Addition of MPtP to IMA 2.1 led to a time-dependent con-version into its active metabolite MPP+. the reaction intermedi-ate MPDP+ was also detectable in the cell culture supernatant (Fig. 7C). the same experiment was then run with primary mouse astrocytes that displayed a similar MPtP conversion rate compared with IMA 2.1 (Fig. 7D). to identify the MAO-isoform responsible for the observed MPtP conversion by IMA 2.1, cells were pretreated with the MAO-A-selective inhibitor moclobemide, the MAO-B-selective inhibitor (-)-deprenyl, or the isoform-unselective inhibitor pargyline for 30 min before MPtP was added. these experiments indicated an almost ex-clusive contribution of MAO-B to the observed conversion of MPTP (Fig. 7E). For a direct comparison of the influence of proinflammatory conditions on MAO-B activity, IMA 2.1 were pre-treated with CCM for 6 h for full activation. When MPtP was added as MAO-B substrate, MPP+ was detected as readout in the supernatant and revealed no significant difference be-tween the control and the CCM group (Fig. 7F). These findings correlate well with a large body of literature, examining MPtP in the in vivo mouse model.
3.4 Compatibility with neuronal co-culturesFinally, we tested whether IMA 2.1 can be used in a co-cul-ture model together with the human dopaminergic neuronal cell line lUHMeS. For direct comparison, primary astrocytes or IMA 2.1 were grown until confluency was reached. Then, predifferentiated lUHMeS were added and differentiated for four days. the morphology of lUHMeS was analyzed by staining of the neuronal marker protein β-III-tubulin. As illus-trated in Figure 8, differentiated lUHMeS grown alone, or on top of either primary astrocytes or IMA 2.1 displayed similar neurite structures and cell morphology. these observations in-dicate that IMA 2.1 can be applied in co-culture models either in direct contact with neurons as illustrated herein, or spatially separated in a transwell co-culture system.
4 Discussion
In an aging population, the incidence of chronic neurodegenera-tive diseases such as PD or AD is constantly increasing. this results in intensified basic and clinical research in this field, as evidenced by the higher use of experimental animals for ba-sic research, and in particular, the widespread generation and use of new transgenic animal models (leist et al., 2008). In the present manuscript, we characterized the mouse cell line IMA with respect to its potential as substitute for primary astrocyte cultures. Particular emphasis was laid on IMA’s response to pro-inflammatory stimuli and its ability to serve as model for the
Fig. 6: Comparison of mRNA expression in IMA 2.1, primary mouse astrocytes, and non-astrocytic cellsTotal mRNA was extracted as template for reverse transcription and PCR amplification. Data are shown relative to GAPDH expression in the same well. In (A), 3T3 cells served as non-astrocytic reference, in (B) BV-2 was used as reference. GS= glutamine synthase; GLT-1 = glutamate transporter 1; GLAST = glutamate-aspartate transporter; Aqp 4 = aquaporin 4; MAO-B = monoamine oxidase B; GFAP = glial fibrillary acidic protein; Cnx43 = connexin 43; Kir 4.1 = inwardly rectifying K+ channel. Data are means ±SEM of three different cultures.
conversion of the parkinsonian toxin MPTP. In the field of PD research, in vitro models that recapitulate these two events are desired.
the standard method to obtain astrocytes is the establishment of primary cell cultures by isolation of cells from brain tissue of newborn animals. this costly and time-consuming procedure represents a clear logistic bottleneck in molecular mechanistic research on astrocyte function. Hence, replacement of primary astrocytes by an adequate cell line has a high potential to ad-vance our knowledge about astrocyte biology and, at the same time, contributes to reduce the number of experimental animals used. For successful replacement, new in vitro models however
Schildknecht et al.
Altex 29, 3/12 271
Fig. 7: Monoamine oxidase activity and MPTP metabolism(A) For a direct comparison of monoamine oxidase (MAO) activity, homogenates (1 mg/ml protein) of IMA 2.1, the neuronal cell lines LUHMES and SH-SY5Y, or HeLa and HEK 293 were incubated with the MAO substrate kynuramine (100 µM) for 2 h. The reaction product hydroxychinoline was measured fluorimetrically and the resulting concentrations were plotted. (B) Overview on the structures of 1-methyl-4-phenyl-1,2,3,6-tetrahydropyridine (MPTP), the reaction intermediate 1-methyl-4-phenyl-2,3-dihydropyridinium (MPDP+) and the active toxin 1-methyl-4-phenylpyridinium (MPP+). (C +D) MPTP (20 µM) was added to IMA 2.1 or to primary mouse astrocyte cultures. At the time points indicated, supernatant was collected and MPTP, MPDP+, and MPP+ were measured by HPLC. (E) To investigate which MAO isoform accounts for the observed activity, MPTP (20 µM) was added together with the MAO-A selective inhibitor moclobemide, the MAO-B selective inhibitor (-)-deprenyl, or the isoform-unselective inhibitor pargyline. After 24 h, MPP+ was evaluated in the supernatant by HPLC. (F) For a comparison on the impact of inflammation on MAO-B activity, IMA were stimulated with CCM for 6 h. Then, MPTP (20 µM) was added, and MPP+ was detected by HPLC in the supernatant after the time periods indicated. Data are expressed as means ±SD of quadruplicate samples.

Schildknecht et al.
Altex 29, 3/12272
require acceptance by the scientific community. Previous as-trocyte cell lines failed to become widely distributed, and they failed to be adopted by the research community.
Primary cultures of astrocytes are undoubtedly closer than any immortalized cell line to an in vivo situation, however also primary cells have, aside from limited availability, clear cut limitations. For example, contamination with microglia can sig-nificantly affect the outcome of an investigation (Saura, 2007). It is also important to realize that brain region-dependent dif-ferences in astrocytic phenotype exist that can have a profound impact on the observations made. Moreover, it has been clearly demonstrated that the commonly used cultures of neonatal as-trocytes differ vastly from adult astrocytes in the brain (Zhang and Barres, 2010).
In the present study, we evaluated the mouse astrocyte cell line IMA with respect to its applicability in inflammation stud-ies and for its suitability as an MPtP conversion model. In comparison to primary astrocytes, IMA are easy to handle, do not require laborious isolation methods that usually lead to batch-to-batch variations, and are stable in their phenotype over years, which is a prerequisite for the reproducibility of re-sults and inter-laboratory comparability. this aspect also opens the field for potential applications in validation assays. We also observed that, in contrast to other cell types, genetic overex-pression by transfection or electroporation, or the siRNA-me-diated knockdown of targets of interest can be performed in IMA (data not shown).
The suitability of IMA as inflammation model was assessed by the detection of NF-κB translocation into the nucleus, which represents one of the key events involved in the induction of so-called immediate early genes. the detection method by an automated microscope system on the single cell level showed that all IMA reacted simultaneously to different cytokines. Such a homogeneous cell population is of great advantage for many biochemical and signal transduction studies. For a general over-view of the inflammatory competence, we have chosen changes of mRNA levels as readout, as suggested previously (Kuegler et al., 2010). However, characterization based on transcript levels alone represented only a first overview. Further information on the actual expression, localization, and activity of a protein or enzyme was therefore presented here for NOS-2, MAO-B, or tlR-2, as examples.
the low GFAP mRNA expression, and the absence of GFAP staining (not shown) in IMA might raise concerns about the astrocytic origin of the cells. However, the original cell pool stained uniformly positive for GFAP directly after transduction. During the four passages thereafter, the expression of GFAP was lost, but the cells maintained the same morphologic features. It has previously been reported that GFAP expression depends highly on the proliferation status of cells. Accordingly, GFAP was reported to be downregulated in a proliferating astrocyte cell line (Price et al., 1999). this might explain the low abun-dance observed in IMA. It is also becoming increasingly clear that a large subpopulation of astrocytes does not express GFAP, also under in vivo conditions. Confluent cells kept for more than a week displayed elevated levels of GFAP that were however still significantly lower compared with the expression in pri-
Fig. 8: Application of IMA 2.1 in co-culture modelsNeuronal LUHMES cells were either differentiated alone (control), or on top of confluent layers of IMA 2.1 or primary rat glia cells. For a phenotypic assessment, LUHMES were stained for neuron-specific β-III-tubulin (green), nuclei were stained with Hoechst H-33342 (red).

Schildknecht et al.
Altex 29, 3/12 273
system to study cellular interactions that may be relevant for disease. For instance, mechanistic and kinetic aspects of the toxicity of the Parkinsonism-inducing toxicant MPtP may be studied, which is not possible in pure neuronal cultures.
ReferencesBeckman, J. S. and Koppenol, W. H. (1996). Nitric oxide, su-
peroxide, and peroxynitrite: the good, the bad, and ugly. Am J Physiol 271, C1424-1437.
Brown, G. C. and Neher J. J. (2010). Inflammatory neurodegen-eration and mechanisms of microglial killing of neurons. Mol Neurobiol 41, 242-247.
Chang, P. L., Gunby, J. L., Tomkins, D. J., et al. (1986). Trans-formation of human cultured fibroblasts with plasmids carry-ing dominant selection markers and immortalizing potential. Exp Cell Res 167, 407-416.
Christiansen, S. H., Selige, J., Dunkern, T., et al. (2011). Com-bined anti-inflammatory effects of β2-adrenergic agonists and PDe4 inhibitors on astrocytes by upregulation of intracellular cAMP. Neurochem Int 59, 837-846.
Di Monte, D. A., Wu, e. Y., Irwin, I., et al. (1991). Biotransfor-mation of 1-methyl-4-phenyl-1,2,3,6-tetrahydropyridine in primary cultures of mouse astrocytes. J Pharmacol Exp Ther 258, 594-600.
Falsig, J., Latta, M., and Leist, M. (2004a). Defined inflammato-ry states in astrocyte cultures: correlation with susceptibility towards CD95-driven apoptosis. J Neurochem 88, 181-193.
Falsig, J., Pörzgen, P., Lotharius, J., and Leist, M. (2004b). Spe-cific modulation of astrocyte inflammation by inhibition of mixed lineage kinases with CeP-1347. J Immunol 173, 2762-2770.
Falsig, J., Pörzgen, P., Lund, S., et al. (2006). The inflammatory transcriptome of reactive murine astrocytes and implications for their innate immune function. J Neurochem 96, 893-907.
Falsig, J., van Beek, J., Hermann, C., and Leist, M. (2008). Mo-lecular basis for detection of invading pathogens in the brain. J Neurosci Res 86, 1434-1447.
Frisa, P. S., Goodman, M. N., Smith, G. M., et al. (1994). Im-mortalization of immature and mature mouse astrocytes with SV40 t antigen. J Neurosci Re 39, 47-56.
Hansson, e. (1986). Primary astroglial cultures. A biochemical and functional evaluation. Neurochem Res 11, 759-767.
Henn, A., Lund, S., Hedtjärn, M., et al. (2009). The suitability of BV2 cells as alternative model system for primary microglia cultures or for animal experiments examining brain inflam-mation. ALTEX 26, 83-94.
Henn, A., Kirner, S., and leist, M. (2011). tlR2 hypersensitiv-ity of astrocytes as functional consequence of previous in-flammatory episodes. J Immunol 186, 3237-3247.
Kettenmann, H. and Ransom, B. R. (ed.) (2005). Neuroglia. 2nd edition. New York, USA: Oxford University Press.
Kim, H. J. and Magrané, J. (2011) Isolation and culture of neu-rons and astrocytes from the mouse brain cortex. Methods Mol Biol 793, 63-75.
Kuegler, P. B., Zimmer, B., Waldmann, t., et al. (2010). Mark-ers of murine embryonic and neural stem cells, neurons and
mary astrocytes. the established cell line IMA 2.1 obviously also lacks some genuine astrocyte functions such as functional expression of glutamine synthase, as well as specific uptake of glutamate. these observations suggest limitations of IMA 2.1 in the field of glutamate/EAAT-toxicity research.
For potential applications in parkinsonian MPtP models, we compared the MAO-dependent conversion of MPtP by IMA and primary mouse glial cells that indicated a compa-rable MAO-B activity in IMA when adjusted to equal total protein content. the IMA cell line therefore represents an easily accessible platform for mechanistic studies on MPtP conversion.
In order to closer simulate the situation in the brain, we then tested whether IMA can form co-cultures with the human dopaminergic cell line lUHMeS. the lUHMeS cell line that can be differentiated into post-mitotic neurons with a dopamin-ergic phenotype is very sensitive to culture conditions. there-fore, the successful co-cultivation was initially surprising, and these data indicate that IMA 2.1 can most likely also be used in combination with other neuronal cell types (Stiegler et al., 2011; Zimmer et al., 2011). the rationale for using a human neuro-nal cell line is based on the intended use of such co-cultures for human disease modeling. the relevant target cells for most diseases are neurons. to our current knowledge, lUHMeS cells represent one of the most favorable in vitro models of dopaminergic neurons. We recently characterized this cell line (Scholz et al., 2011; Schildknecht et al., 2009) extensively, and we believe that no mouse cell line with similar features is avail-able at present. Vice versa, the use of human astrocytes is much less established than the one of murine astrocytes, and the cells are less accessible. Notably, the combination of cells from dif-ferent species does not result in histoincompatibility reactions, as long as no t cells are present. Moreover, most metabolites that are exchanged, in addition to most neurotransmitters, lipid mediators, growth factors and xenobiotic metabolites relevant to the co-culture, are not species-specific. Therefore, combin-ing cell types of different species created no difficulties. We are aware of the disadvantages of the two-species system for the study of certain immune mediators (e.g., IFN-γ) that are species-specific. On the other hand, two species systems also have enormous advantages, as certain cytokines derived from one of the cell types may be blocked selectively, without influ-encing the same cytokine from the other cell type (e.g., human or murine CCl-5), and especially the regulation of transcripts can be followed for each cell type selectively by choosing ap-propriate PCR primers. Such advantages can be very important for mechanistic studies of reciprocal cell-type interactions. In preliminary results (not shown), we observed that MPtP ad-dition to the co-culture model of IMA and lUHMeS leads to a time-dependent conversion into the active toxin MPP+ that subsequently is taken up by lUHMeS cells and leads to a se-lective neurite degeneration and ultimately cell death while viability of IMA, in which the conversion takes place, is not affected. These findings however require further investigations and confirmation.
the suitability of IMA for co-culture models in combination with neurons opens a promising perspective for a new in vitro

Schildknecht et al.
Altex 29, 3/12274
ment and characterization of multipotent neural cell lines us-ing retrovirus vector-mediated oncogene transfer. J Neurobiol 21, 356-375.
Saura, J. (2007). Microglia cells in astroglia cultures: a caution-ary note. J. Neuroinflamm 4, 26.
Schildknecht, S., Heinz, K., Daiber, A., et al. (2006). Auto-catalytic tyrosine nitration of prostaglandin endoperoxide synthase-2 in lPS-stimulated RAW 264.7 macrophages. Bio-chem Biophys Res Commun 340, 318-325.
Schildknecht, S., van der loo, B., Weber, K., et al. (2008). en-dogenous peroxynitrite modulates PGHS-1-dependent throm-boxane A2 formation and aggregation in human platelets. Free Radic Biol Med 45, 512-520.
Schildknecht, S., Pöltl, D., Nagel, D. M., et al. (2009). Require-ment of a dopaminergic neuronal phenotype for toxicity of low concentrations of 1-methyl-4-phenylpyridinium to hu-man cells. Toxicol Appl Pharmacol 241, 23-35.
Schildknecht, S., Pape, R., Müller, N., et al. (2011). Neuropro-tection by minocycline caused by direct and specific scaveng-ing of peroxynitrite. J Biol Chem 286, 4991-5002.
Scholz, D., Pöltl, D., Genewsky, A., et al. (2011). Rapid, com-plete and large-scale generation of post-mitotic neurons from the human lUHMeS cell line. J Neurochem 119, 957-971.
Stiegler, N. V., Krug, A. K., Matt, F., and leist, M. (2011). As-sessment of chemical-induced impairment of human neurite outgrowth by multiparametric live cell imaging in high-den-sity cultures. Toxicol Sci 121, 73-87.
Zhang, Y. and Barres, B. A. (2010). Astrocyte heterogeneity: an underappreciated topic in neurobiology. Curr Opin Neurobiol 20, 588-594.
Zimmer, B., Schildknecht, S., Kuegler, P. B. et al. (2011). Sensi-tivity of dopaminergic neuron differentiation from stem cells to chronic low-dose methylmercury exposure. Toxicol Sci 121, 357-367.
AcknowledgmentsWe would like to thank Prof. Dr Klaus Pfizenmaier (University of Stuttgart) for his fruitful discussion during the preparation of the manuscript. the work was facilitated by grants from the Doerenkamp-Zbinden foundation, the Federal State of Baden-Württemberg and the DFG. SFB969, RTG1331, and KoRS-CB are acknowledged for their support.
Correspondence toStefan Schildknecht, PhDUniversity of KonstanzPO Box M65778457 KonstanzGermanyPhone: +49 7531 88 5053Fax: +49 7531 88 5039e-mail: [email protected]
astrocytes: reference points for developmental neurotoxicity testing. ALTEX 27, 17-42.
Kuegler, P. B., Baumann, B. A., Zimmer, B., et al. (2012). GFAP-independent inflammatory competence and trophic functions of astrocytes generated from murine embryonic stem cells. Glia 60, 218-228.
Langston, J. W., Irwin, I., Langston, E. B., and Forno, L. S. (1984). Pargyline prevents MPtP-induced parkinsonism in primates. Science 225, 1480-1482.
lee, S. C., liu, W., Dickson D. W., et al. (1993). Cytokine pro-duction by human fetal microglia and astrocytes. Differential induction by lipopolysaccharide and Il-1 beta. Immunol 150, 2659-2667.
leist, M., Kadereit, S., and Schildknecht, S. (2008). Food for thought ... on the real success of 3R approaches. ALTEX 25, 17-32.
leist, M., efremova, l., and Karreman, C. (2010). Food for thought ... considerations and guidelines for basic test method descriptions in toxicology. ALTEX 27, 309-317.
Lotharius, J., Falsig, J., van Beek, J., et al. (2005). Progressive degeneration of human mesencephalic neuron-derived cells triggered by dopamine-dependent oxidative stress is depend-ent on the mixed-lineage kinase pathway. J Neurosci 25, 6329-6342.
lund, S., Porzgen, P., Mortensen, A. l., et al. (2005). Inhibition of microglial inflammation by the MLK inhibitor CEP-1347. J Neurochem 92, 1439-1451.
Lund, S., Christensen, K. V., Hedtjärn, M., et al. (2006). The dy-namics of the LPS triggered inflammatory response of murine microglia under different culture and in vivo conditions. J Neuroimmunol 180, 71-87.
Meeuwsen, S., Persoon-Deen, C., Bsibsi, M., et al. (2003). Cy-tokine, chemokine and growth factor gene profiling of cul-tured human astrocytes after exposure to proinflammatory stimuli. Glia 43, 243-253.
Murphy, S., Pearce, B., Jeremy, J., and Dandona, P. (1988). As-trocytes as eicosanoid-producing cells. Glia 1, 241-245.
Pöltl, D., Schildknecht, S., Karreman, C., and leist, M. (2011). Uncoupling of AtP-depletion and cell death in human dopaminergic neurons. Neurotoxicology. Dec 19, epub ahead of print.
Price, T. N., Burke, J. F., and Mayne, L. V. (1999). A novel hu-man astrocyte cell line (A735) with astrocyte-specific neu-rotransmitter function. In Vitro Cell Dev Biol Anim 35, 279-288.
Ransom, B. R., Kunis, D. M., Irwin, I., and Langston J. W. (1987). Astrocytes convert the parkinsonism inducing neuro-toxin, MPtP, to its active metabolite, MPP+. Neurosci Lett 75, 323-328.
Roqué, P. J., Guizzetti, M., Giordano, G., and Costa, L. G. (2011). Quantification of synaptic structure formation in coc-ultures of astrocytes and hippocampal neurons. Methods Mol Biol 758, 361-390.
Ryder, e. F., Snyder, e. Y., and Cepko, C. l. (1990). establish-


