Characterization of globin genes in Atlantic cod · Characterization of globin genes in Atlantic...
89
Characterization of globin genes in Atlantic cod Katrín Halldórsdóttir A Dissertation submitted in partial satisfaction of the requirements for the MS degree in population genetics Advisor: Professor Einar Árnason Department of Biology Faculty of Science UNIVERSITY OF ICELAND February 2007
Transcript of Characterization of globin genes in Atlantic cod · Characterization of globin genes in Atlantic...

Characterization of globin genes in Atlantic cod
Katrín Halldórsdóttir
A Dissertation submitted in partial satisfaction of the requirements for theMS degree in population genetics
Advisor: Professor Einar Árnason
Department of Biology
Faculty of Science
UNIVERSITY OF ICELANDFebruary 2007

Characterization of globin genes in Atlantic cod
by
Katrín Halldórsdóttir
B.S. (University of Iceland, Department of Biology) 2003
A Dissertation submitted to Department of Biology of Faculty of Sciencein partial satisfaction of the requirements for the
MS degree in population genetics
Committee in charge:
Professor Einar Árnason, ChairSigríður Þorbjarnardóttir, sérfræðingur
External referee:
Dr. Pétur Henry Petersen
Department of Biology
Faculty of Science
UNIVERSITY OF ICELANDFebruary 2007

I declare that this dissertation is based on my own observations, that it is written by myself,
and that it has not previously been submitted in part or in whole for a higher degree.
Katrín Halldórsdóttir, author Date
The MS dissertation of Katrín Halldórsdóttir is approved:
Professor Einar Árnason, Chair Date
Sigríður Þorbjarnardóttir, sérfræðingur Date
Dr. Pétur Henry Petersen, External referee Date
University of IcelandFebruary 2007

Characterization of globin genes in Atlantic cod
Copyright c© 2007
Katrín Halldórsdóttir

1
Abstract
Characterization of globin genes in Atlantic cod
by
Katrín Halldórsdóttir
MS in population genetics
University of Iceland
Professor Einar Árnason, Chair
An understanding of biology of a wild species able to support a major fishery of great magni-
tude like the Atlantic cod Gadus morhua is important from both fisheries management as well
as from a purely biological standpoint. The hemoglobin HbI locus shows effects of natural
selection and adaptation to environmental conditions. Globin gene regions have been char-
acterized in some fish species. All of them show linked α and β loci located on the same
chromosome. I report here a characterization of linked β and α globin genes in Atlantic cod
with proximal regulatory elements. The genes are oriented tail to head in a 5′ to 3′ direc-
tion. The orientation of globin genes in Atlantic cod thus differs from orientation in other fish
species described so far. Applying a PCR based strategy for genomic exploration, I show that
there are ten clusters of linked β/α globin genes in the genome of Atlantic cod which likely
represent different β/α gene sets or different alleles at some loci. The results are based on
cloned and sequenced contigs of approximately 3000 base pairs long fragment of the linked
β/α gene sets. The different gene sets differ from each other by a number of nucleotides in
linkage disequilibrium including non-synonymous differences.
Professor Einar ÁrnasonChair, Committee in charge

1
Útdráttur
Greining glóbin gena í þorski
eftir
Katrínu Halldórsdóttur
MS í Stofnerfðafræði
Háskóli Íslands
Prófessor Einar Árnason, formaður
Skilningur á líffræði villtrar tegundar sem er undirstaða fiskveiða af þeirri stærðar-
gráðu eins og þorskur, Gadus morhua, gerir, er mjög mikilvægur bæði fyrir stjórn fiskveiða
sem og frá líffræðilegu sjónarhorni. Hemóglóbin lókusinn HbI sýnir áhrif náttúrulegs vals og
aðlögun að umhverfisaðstæðum. Glóbin gena setum hefur verið lýst í nokkrum fiskategundum.
Í þeim öllum eru α og β glóbin setin tengd saman á litningi. Ég lýsi hér samtengdum β og α
glóbin genasetum í þorski ásamt nálægum stjórnröðum. Genin eru í sömu stefnu á litningnum,
með β genið 5′. Afstaða genanna hvors til annars er í 5′ til 3′ stefnu („tail to head“ eða „rófa í
haus“). Stefna β/α glóbin gena hvors til annars í þorski er því frábrugðin stefnu þeirra í þeim
fisktegundum þar sem þessu hefur verið lýst. Með því að nota tækni grundvallaða á PCR til
að rannsaka erfðamengi þorsksins sýni ég fram á að það eru að minnsta kosti tíu genasett af
tengdum β/α glóbin genum í genamengi þorsks sem eru annaðhvort aðgreind gen eða breyti-
legar samsætur. Niðurstöðurnar grundvallast á um það bil 3000 basapara svæði tengdra β og
α genasetta sem voru klónuð og raðgreind. Mismunur ólíkra genasetta felst í fjölda kirna í
tengslaójafnvægi þar á meðal óþöglar breytingar.
Professor Einar ÁrnasonFormaður umsjónarnefndar

v
Contents
Introduction 1
Tail to Head Orientation of Atlantic Cod β and α Globin Genes (Manuscript 1) 11
Multiple Linked β and α Globin Genes in Atlantic Cod: a PCR Based Strategy ofGenomic Exploration (Manuscript 2) 34

vi
Acknowledgements
I want to thank all my coworkers at lab 387 in Askja, especially Sigríður H. Þorbjarnadóttir
and Zophonias O. Jónsson. I also thank my supervisor, Einar Árnason, for all his support.

1
Introduction
Total catch of Atlantic cod Gadus morhua by Icelandic vessels was 199.420 tonnes
in the year 2006 according to Statistics Iceland (ANONYMOUS, 2006). The world catch of
Atlantic cod 2004 (latest update, ANONYMOUS, 2006) was 899.568 tonnes. The Icelandic
fishing vessels thus catch around 25% of Atlantic cod world catch. It is a remarkable fact that a
wild species is able to support a major fishery of this magnitude. An understanding of biology
of the species is thus important for both Icelandic and world commercial fisheries and their
management. Similarly, there must be several biological characteristics which enable Atlantic
cod to have such high productivity. Thus, it is also important to understand the biology of cod
from a purely biological standpoint.
Atlantic cod is a benthic gadoid species living at variable depths from a few meters
to depths of 600 meters or more in the sea. In the West Atlantic cod has a distribution north
of Cape Hatteras, North Carolina, and around both west and east coasts of Greenland. In
the eastern Atlantic it is found from the Bay of Biscay north to the Arctic Ocean, including
the North Sea, areas around Faroe Islands and Iceland and along the Norwegian coast to the
Barents Sea (WIKIPEDIA, 2007).
For decades a debate has been going on about population structure of Atlantic cod
populations. Allozyme research, using the HbI locus of hemoglobin, indicated heterogeneity
of cod populations in the North Atlantic (MORK et al., 1985). FRYDENBERG et al. (1965)
showed an apparent cline in allele frequency along the Norwegian coast (Figure 1). Clines are
often indicative of natural selection which would limit use of the locus for studies on popu-
lation structure. However, a locus showing clear selective effects is of interest for studies of
adaptation to various environmental conditions.
JAMIESON and JÓNSSON (1971) described considerable HbI variation in Icelandic
waters (Figure 2). They observed large differences among localities and large differences
among temporally spaced samples from the same or neighboring localities. They interpreted
the allelic distribution as a “moving mosaic of genetic isolates” such that different units of stock

2
were present off the southwest coast of Iceland and at the main spawning area of Atlantic cod
in Iceland (Figure 2). This conclusion was drawn from Wahlund effects found in the samples.
Wahlund effect (WAHLUND, 1928) is when heterozygote deficiency is observed among sam-
ples relative to expectation according to Hardy-Weinberg equilibrium. It is noteworthy that in
many of their samples there is heterozygote excess as well (JAMIESON and JÓNSSON, 1971).
Thus, the pattern may also be indicative of natural selection rather than isolated stocks.
The view that there are genetically distinct cod populations in the Atlantic ocean
is, still maintained (e.g. JÓNSDÓTTIR et al., 1999). Mitochondrial DNA sequence variation
has been used for genetic studies of populations of Atlantic cod (ÁRNASON and PÁLSSON,
1996; ÁRNASON et al., 1998; ÁRNASON, 2004). This research does not support the idea of
reproductively isolated subpopulations of Atlantic cod in Iceland.
The aim of this study is to characterize at the DNA level the HbI locus so intensively
used for analysis of Atlantic cod population structure which, however, also shows strong signs
of natural selection. The locus is apparently under strong selective forces according to research
showing different reaction norms among the three genotypes. KARPOV and NOVIKOV (1980)
and BRIX et al. (1998) showed that oxygen affinity of hemoglobin is higher for HbI-2/2 ho-
mozygotes at low temperatures (< 10◦C) and for HbI-1/1 cod, for some blood pH levels, at
high temperatures (> 14◦C). Heterozygotes are generally found to have oxygen affinity values
which are intermediate between the two homozygotes. PETERSEN and STEFFENSEN (2003)
experimentally determined a behavioral response and temperature preference of juvenile At-
lantic cod with different hemoglobin types under normoxia and mild hypoxia. They found
that HbI-2/2 cod preferred 8.2±1.5◦C while HbI-1/1 cod preferred 15.4±1.1◦C. They further
showed that under hypoxia (35% oxygen saturation) HbI-1/1 cod preferred a lower temperature
of 9.8± 1.8◦C.
Furthermore, a number of other studies have shown significant differences among the
HbI hemoglobin genotypes in various other features including competitive feeding strategies
(SALVANES and HART, 2000), haematocrit (MORK and SUNDNES, 1984), and differential
growth (JORDAN et al., 2006). All are important in the physiology of cod and are related to
components of Darwinian fitness.
Atlantic cod like many other wild fish species encounters various environmental chal-
lenges through its lifespan from larvae to adult. Adaptation of the species to its heterogeneous
environment is of special interest. Atlantic cod is one of the most fecund vertebrate known and
supports commercial fisheries of several nations. The environment poses several problems or
challenges for cod related to oxygen use. For example, how to keep neutral buoyancy when

3
it moves up and down in the water column and how to keep its vision in the dark at great
depths in the ocean. The problem of buoyancy is met by O2 secretion mechanism to inflate
the swimbladder. The underlying physiology of O2 secretion involves pH-sensitive Root effect
(ROOT, 1931) hemoglobins which under low pH decrease O2 binding. The Root effect thus
differs from the normal Bohr effect in that acidification unloads O2 from Root hemoglobins
even at O2 tensions above atmospheric levels (BERENBRINK et al., 2005). The rete mirable
associates with the gas gland of the swim bladder, it has a counter current arrangement of
capillaries which maintains a diffusion gradient throughout the length of the diffusion surface.
This makes it possible for Root effect hemoglobin to deliver oxygen into an organ containing
a high partial pressure of oxygen, the swim bladder and avascular retina of the fish eye, to
meet the high oxygen demand. Normal Bohr effect hemoglobin are also important in various
aspects in the physiology of cod. Together, these are examples of some of the challenges in
oxygen use which are met by the use of various hemoglobins. The amino acid composition
of the hemoglobin proteins responsible for these functions differs in the eel Anguilla anguilla
(FAGO et al., 1995, 1997), and in the Atlantic salmon (MCMORROW et al., 1997), inwhich
the proteins are grouped according to their migration towards anode and cathode as anodal or
cathodal proteins. Non-Bohr effect hemoglobins are thought to be more cathodal than Bohr-
effect hemoglobin (MCMORROW et al., 1997).
Hemoglobin, the oxygen carrier of the blood, is a tetramer of two α and two β
chains. The genes have the same internal structure, conserved in evolution of different organ-
isms, which is three exons interrupted with two introns (DICKERSON and GEIS, 1983). The
α and β families of hemoglobin genes are found on separate chromosomes in mammals and
birds. The β globin domain in humans consists of five functional genes and one pseudogene
(ε, γG, γA, ψ−β, δ, β) located on chromosome 11. The α globin domain in humans consists of
three functional genes and two pseudogenes (ζ, ψ − ζ, ψ − α, α2, α1) located on chromosome
16 (KARLSSON and NIENHUIS, 1985). The genes are arranged in the order of their expression
during development. The β cluster in mice has the structural genes in tandem including three
embryonic genes and two genes expressed in fetus and adult animals. In chicken, however, the
adult β genes are flanked by the embryonic genes (SJAKSTE and SJAKSTE, 2002; HARDISON,
1998). This demonstrates variations on the theme of arrangement and order of expression in
development. In the African clawed frog (Xenopus laevis) the genes are linked on the same
chromosome with three α genes followed by three β genes. Direction of transcription is 5′ to
3′ and embryonic genes are located 5′ to adult animal genes (HOSBACH et al., 1983). In fish
the α and β genes are linked together on the same chromosome. However, the orientation of

4
the genes is variable. In the Zebrafish Danio rerio a pair of linked α and β genes are found for
embryonic genes and adult genes respectively, both on the same chromosome. The direction
of transcription is tail to tail (5′–3′ and 3′–5′) in the embryonic pair but head to head (3′–5′
and 5′–3′) in the adult globin pair (BROWNLIE et al., 2003). Similarly, the globin genes in
Pufferfish Fugu rubripes are closely linked and directed in opposite transcriptional orienta-
tions (GILLEMANS et al., 2003). Globin genes in Atlantic Salmon Salmo salar are linked pairs
of tail to tail oriented α and β genes.
Multiple haemoglobins and multiple globin genes are quite common in fish. In
Atlantic salmon, 17 electrophoretically distinct haemoglobin proteins have been described
(MCMORROW et al., 1997). In rainbow trout nine larval haemoglobins have been charac-
terized (IUCHI, 1973). BROWNLIE et al. (2003) characterizing of embryonic globin genes in
Zebrafish in which they describe three embryonic α genes and three embryonic β genes and
furthermore state that it likely represents an underestimate. However, developmental regulation
of their expression is not known as in higher vertebrates. The genetic polymorphism found in
haemoglobin is likely related to various environmental condition. These environmental chal-
lenges are likely met at the genetic level by various structural elements, control elements or
both.
SICK (1965) described a system consisting of two major zones of hemoglobin, HbI
and HbII, using the technique of agar gel electrophoresis in Smithies buffer. The HbI zone
shows variation interpreted genetically as a polymorphism with a pair of co-dominant alleles
giving rise to HbI-1/1, HbI-2/2 homozygotes and HbI-1/2 heterozygotes. On the molecular
level this appeared to be a simple single-locus two-allele polymorphism. By applying a more
sensitive technique of iso-electric focusing to hemoglobin isoforms (BRIX et al., 2004; FYHN
et al., 1994) patterns of at least five major zones and several minor zones of hemoglobins are
found. Rare hemoglobin patterns are known from the beginning of studies on hemoglobin
variation. FRYDENBERG et al. (1965) described several rare hemoglobin patterns ranging in
frequency from 0.5% to 2% in the Barents Sea and 2.5% in Newfoundland and Iceland and
even much higher or about 10% in English and Scottish cod (WILKINS, 1971; MANWELL and
BAKER, 1970). It is not known which of the multiple hemoglobin isoforms in Atlantic cod,
mentioned above, are the Root effect hemoglobins, which are normal Bohr effect hemoglobin,
or which are important for various developmental stages. Based on the comparative knowledge,
however, we expect that the variety of hemoglobins in Atlantic cod also are due to various
structural and control elements in the genome.
Gene duplication can occur via tandem duplication, common in mammals, and by

5
polyploidy which is common in bony fish (SHIMELD, 1999). The contribution of gene du-
plication in evolution is providing new genetic material suitable for adaptive evolution and
differentiation of function (LYNCH, 2002). The origin of globin gene families in vertebrates
is considered to be a duplication event of an ancient gene about 500–570 million years ago,
followed by divergent evolution of the α and β globin gene domains in mammals and birds
(HARDISON, 1998; SJAKSTE and SJAKSTE, 2002). These loci are still linked in fish and the
linked genes apparently have duplicated, perhaps via tetraploidization or by duplication of the
α/β linked genes.
This thesis is a first step towards describing and understanding the structure and
function of hemoglobin genes and their products in the biology of Atlantic cod. The thesis
is in three parts. The first part is this introduction. The second part is a manuscript about
the structure of a gene region. We first characterized a locus of linked β and α genes with
proximal control regions (HALLDÓRSDÓTTIR and ÁRNASON, 2007a). It is a starting point to
understand at the DNA level the organization of globin genes in Atlantic cod. We approach
the subject with a PCR based technique in our genomic exploration. We show in this part
(HALLDÓRSDÓTTIR and ÁRNASON, 2007a) a new organization of globin genes in fish which
illustrate the importance of exploring non-model organism. The third part of the thesis is a
manuscript which takes a genomic perspective. This part of this thesis (HALLDÓRSDÓTTIR
and ÁRNASON, 2007b) is an endeavour to explore the number of linked β and α gene sets
in the Atlantic cod genome. It takes on the problematic task to explore globin genes in the
complete genome of an non-model organism. Many model organism have their genome fully
sequenced, making exploration of their genome achievable. However, many organisms, like the
Atlantic cod, have biological features which are not found in any model organism. Therefore,
it is a challenge to find a way to explore genome of an non-model organism of interest. To
investigate this we used a PCR based stragegy to explore how many linked β and α gene sets
could potentially be found in the genome of Atlantic cod (HALLDÓRSDÓTTIR and ÁRNASON,
2007b).

6
Figure 1: HbI allele frequency along the Norwegian coast. Figure 2 in FRYDENBERG et al.(1965).
6263
6465
6667
68
25 20 15
Longitude
Latit
ude
Figure 2: HbI allele frequencies in JAMIESON and JÓNSSON (1971) study on a map of Iceland.Height of bars represents relative frequency. Longitude locations are plotted with jitter toseparate bars of temporally spaced samples from the same or neighboring localities.

7
Bibliography
ANONYMOUS, 2006. Total catch of Icelandic vessels. Technical report, Statistics Iceland,
http://www.hagstofa.is/.
ÁRNASON, E., 2004. Mitochondrial cytochrome b DNA variation in the high fecundity At-
lantic cod: Trans-Atlantic clines and shallow gene-genealogy. Genetics 166: 1871–1885.
ÁRNASON, E. and S. PÁLSSON, 1996. Mitochondrial cytochrome b DNA sequence variation
of Atlantic cod, Gadus morhua, from Norway. Molecular Ecology 5: 715–724.
ÁRNASON, E., S. PÁLSSON and P. H. PETERSEN, 1998. Mitochondrial cytochrome b DNA
sequence variation of Atlantic cod, Gadus morhua, from the Baltic- and the White Seas.
Hereditas 129: 37–43.
BERENBRINK, M., P. KOLDKJÆR, O. KEPP and A. R. COSSINS, 2005. Evolution of oxygen
secretion in fishes and the emergence of a complex physiological system. Science 307:
1752–1757.
BRIX, O., E. FORÅS and I. STRAND, 1998. Genetic variation and functional properties of
Atlantic cod hemoglobins: Introducing a modified tonometric method for studying fragile
hemoglobins. Comparative Biochemistry and Physiology 119A: 575–583.
BRIX, O., S. THORKILDSEN and A. COLOSIMO, 2004. Temperature acclimation modulates
the oxygen binding properties of the Atlantic cod (Gadus morhua L.) genotypes HbI*1/1,
HbI*1/2, and HbI*2/2—by changing the concentrations of their major hemoglobin compo-
nents (results from growth studies at different temperatures). Comparative Biochemistry and
Physiology 138A: 241–251.
BROWNLIE, A., C. HERSEY, A. C. OATES, B. H. PAW, A. M. FALICK, H. E. WITKOWSKA,
J. FLINT, D. HIGGS, J. JESSEN, N. BAHARY, H. ZHU, S. LIN and L. ZON, 2003. Charac-
terization of embryonic globin genes of the zebrafish. Developmental Biology 255: 48–61.

8
DICKERSON, R. E. and I. GEIS, 1983. Hemoglobin: Structure, Function, Evolution and
Pathology. The Benjamin/Cummings Publishing Company, Inc., Menlo Park, California.
FAGO, A., E. BENDIXEN, H. MALTE and R. E. WEBER, 1997. The anodic hemoglobin of
Anguilla anguilla. The Journal of Biological Chemistry 272: 15,628–15,635.
FAGO, A., V. CARRATORE, G. PRISCO, R. FEUERLEIN, L. SOTTRUP-JENSEN and R. WE-
BER, 1995. The cathodic hemoglobin of Anguilla anguilla. The Journal of Biological Chem-
istry 270: 18,897–18,902.
FRYDENBERG, O., D. MØLLER, G. NÆVDAL and K. SICK, 1965. Haemoglobin polymor-
phism in Norwegian cod populations. Hereditas 53: 257–271.
FYHN, U. E., O. BRIX, G. NÆVDAL and T. JOHANSEN, 1994. New variants of the
haemoglobins of Atlantic cod: a tool for discriminating between coastal and Arctic cod.
ICES marine Science symposia 198: 666–670.
GILLEMANS, N., T. MCMORROW, R. TEWARI, A. WAI, C. BURGTORF, D. DRABEK,
N. VENTRESS, A. LANGEVELD, K. HIGGS, D. ANDI TAN-UN, F. GROSVELD and
S. PHILIPSEN, 2003. Functional and comparative analysis of globin loci in pufferfish and
humans. Blood 101: 2842–2849.
HALLDÓRSDÓTTIR, K. and E. ÁRNASON, 2007a. Tail to head orientation of Atlantic cod β
and α globin genes. Manuscript.
HALLDÓRSDÓTTIR, K. and E. ÁRNASON, 2007b. Multiple linked β and α globin genes in
Atlantic cod: a PCR based strategy of genomic exploration. Manuscript.
HARDISON, R., 1998. Hemoglobins from bacteria to man: evolution of different patterns of
gene expression. The Journal of Experimental Biology 201: 1099–1117.
HOSBACH, H., T. WYLER and R. WEBER, 1983. The Xenopus laevis globin gene family:
Chromosomal arrangement and gene structure. Cell 32: 45–53.
IUCHI, I., 1973. Chemical and physiological properties of the larval and the adult hemoglobins
in rainbow trout, Salmo gairdnerii irideus. Comparative Biochemistry and Physiology - Part
B 44: 1087–1101.
JAMIESON, A. and J. JÓNSSON, 1971. The Greenland component of spawning cod at Ice-
land. Rapports et procès-verbaux des reunions Conseil permanent international pour l’
exploration de la Mer 161: 65–72.

9
JÓNSDÓTTIR, Ó., A. IMSLAND, A. DANÍELSDÓTTIR, V. THORSTEINSSON and G. NÆVDAL,
1999. Genetic differentiation among Atlantic cod in south and south-east Icelandic waters:
synaptophysin (Syp I) and haemoglobin (HbI) variation. Journal of Fish Biology 54: 1259–
1274.
JORDAN, A. D., J. F. LAMPE, B. GRISDALE-HELLEAND, S. J. HELLAND, K. D. SHEARER
and J. F. STEFFENSEN, 2006. Growth of Atlantic cod (Gadus morhua L.) with different
haemoglobin subtypes when kept near their temperature preferenda. Aquaculture 257: 44–
52.
KARLSSON, S. and A. NIENHUIS, 1985. Developmental regulation of human globin genes.
Annual Review of Biochemistry 54: 1071–1108.
KARPOV, A. K. and G. G. NOVIKOV, 1980. Hemoglobin alloforms in cod Gadus morhua
(Gadiformes, Gadidae), their functional characteristics and occurrence in populations. Jour-
nal of Ichthyology 6: 45–49.
LYNCH, M., 2002. Gene duplication and evolution. Science’s Compass 297: 945–947.
MANWELL, C. and A. C. M. BAKER, 1970. Molecular Biology and the Origin of Species.
Sidgewick & Jackson, London.
MCMORROW, T., A. WAGNER, T. HARTE and F. GANNON, 1997. Sequence analysis and
tissue expression of a non-Bohr beta–lobin cDNA from Atlantic salmon. Gene 189: 183–
188.
MORK, J., N. RYMAN, G. STÅHL, F. M. UTTER and G. SUNDNES, 1985. Genetic variation
in Atlantic Cod (Gadus morhua) throughout its range. Canadian Journal of Fisheries and
Aquatic Sciences 42: 1580–1587.
MORK, J. and G. SUNDNES, 1984. Hemoglobin polymorphism in Gadus morhua — genotypic
differences in hematocrit. Helgoländer Meeresuntersuchungen 38: 201–206.
PETERSEN, M. F. and J. F. STEFFENSEN, 2003. Preferred temperature of juvenile Atlantic cod
Gadus morhua with different haemoglobin genotypes at normoxia and moderate hypoxia.
The Journal of Experimental Biology 206: 359–364.
ROOT, R. W., 1931. The respiratory function of the blood of marine fishes. Biological Bulletin
61: 427–456.

10
SALVANES, A. G. V. and P. J. B. HART, 2000. Is individual variation in competitive perfor-
mance of reared juvenile cod influenced by hemoglobin genotype. Sarsia 85: 265–274.
SHIMELD, S., 1999. Gene function, gene networks and the fate of duplicated genes. Cell and
Developmental Biology 10: 549–553.
SICK, K., 1965. Hemoglobin polymorphisms of cod in the Baltic and the Danish Belt sea.
Hereditas 54: 19–48.
SJAKSTE, N. and T. SJAKSTE, 2002. Structure of globin gene domains in mammals and birds.
Russian Journal of Genetics 38: 1343–1358.
WAHLUND, S., 1928. Zuzammensetzung von populationen und korrelationserscheinungen
vom standpunkt der vererbungslehre aus betrachtet. Hereditas 11: 65–106.
WIKIPEDIA, 2007. Atlantic cod — wikipedia, the free encyclopedia. [Online; accessed 16-
February-2007].
WILKINS, N. P., 1971. Haemoglobin polymorphism in cod, whiting and pollack in Scottish
waters. Rapports et procès-verbaux des reunions Conseil permanent international pour l’
exploration de la Mer 161: 60–63.
11
Tail to Head Orientation of Atlantic
Cod β and α Globin Genes
(Manuscript 1)
Tail to Head Orientation of Atlantic Cod β and α Globin Genes
Katrín Halldórsdóttir and Einar Árnason
Institute of Biology
University of Iceland
Sturlugata 7
Reykjavík
Iceland
Received
Keywords: Atlantic cod, Gadus morhua, β, α, globin genes
Address for correspondence:
------------------------------------------------------------------
Katrín Halldórsdóttir [email protected]
Institute of Biology
University of Iceland office: (354)-525-4606
Sturlugata 7 lab: (354)-525-4606
101 Reykjavik, Iceland fax (354)-525-4069
------------------------------------------------------------------
Manuscript of March 30, 2007
Running title: Tail to Head Orientation of Cod β and α Globin Genes
1

Abstract
Hemoglobin is the oxygen carrier in vertebrates, delivering oxygen to tissues from respiratory organs.
Globin gene regions have been characterized in some fish species and all of them show linked α and β
loci located on the same chromosome. We report a characterization of linked β and α globin genes in
Atlantic cod, pulled out of the Atlantic cod genome with a PCR research strategy and screening of a
genomic λ library. The genes are oriented tail to head in a 5′ to 3′ direction. The orientation of globin
genes in Atlantic cod thus differs from orientation in other fish species described so far. They both
contain three exons and two introns, the common vertebrate pattern. Four tandem repeats are found in a
1500 base pairs intergenic region. A putative single exon gene is predicted in this region which consists
primarily of atg tandem repeats. The three genes all have a CCAAT box promoter. 5′ to β exon 1 there
is a TTTAAA box, 5′ to the gene in intergenic region a TTTAA box, and 5′ to α exon 1 a TATA box.
Conserved sequence blocks (up to 89 base pair identity) are found in both the 5′ β and 5′ α regions
which probably are control sequences for transcription.
Keywords: Hemoglobin, β/α globin genes, regulatory elements, Atlantic cod
Introduction
Vertebrate hemoglobin is a heterotetramer of two α globin and two β globin polypeptides. It is an oxygen
carrier, delivering oxygen to tissues and facilitating unloading of carbon dioxide at the respiratory organs.
Hemoglobins are found in all groups of organisms and the diverse hemoglobins appear to be encoded by
orthologous genes i.e., genes descended from an ancient, common ancestral gene (HARDISON 1998). In
mammals and other higher vertebrates globin genes are arranged in distinct clusters, the α–like and the
β–like clusters, located on different chromosomes (KARLSSON and NIENHUIS 1985). The arrangements of
the genes in the domains are the same as the order of expression. Proximal regulatory elements play a vital
role in this regulation, for example the CCAAT box in regulation of human fetal γ globin in the β cluster
(FANG et al. 2004).
Globin gene regions have been characterized in some fish species, e.g. Atlantic Salmon (Salmo salar,
WAGNER et al. 1994), Pufferfish (Fugu rubripes, GILLEMANS et al. 2003), and in both embryonic and
adult Zebrafish (Danio rerio, BROWNLIE et al. 2003; CHAN et al. 1997). In these fish the α and β loci
are linked and located on the same chromosome. The linkage of the α and β genes in fish species supports
the hypothesis of a duplication event of an ancient gene about 500–570 million years ago, followed by
divergent evolution of the α and β globin gene domains in mammals and birds (HARDISON 1998; SJAKSTE
and SJAKSTE 2002). In most species studied transcription proceeds in the same direction, 5′ to 3′ orientation
for globin genes in a given locus. In adult zebrafish (CHAN et al. 1997) and in pufferfish (GILLEMANS et al.
2

2003) the direction of transcription of α/β genes is in 3′ to 5′, 5′ to 3′ configuration (head to head). In
salmon (WAGNER et al. 1994) the genes are oriented 5′ to 3′, 3′ to 5′ (tail to tail orientation).
The most obvious contribution of gene duplication in evolution is providing new genetic material for
selection to act upon, the result of which can be new gene functions (ZHANG 2003) to meet varying physio-
logical demands of the organism. Gene duplication contributes to species divergence and origins of species-
specific features (ZHANG 2003).
All genes are part of regulatory networks (SHIMELD 1999). For duplicated copies of a gene to be
fixed and maintained in a population their functions often diverge to some extent. The determining factors
for a gene to find a new function, even without changing the protein (for cell type-specific genes), are,
among other things, changes in promoter and enhancer sequences (SHIMELD 1999). A mutation in promoter
boxes can lead to severe disease such as β–thalassemia in humans (AGARWALL et al. 2006) as well as to
novel functions. Therefore, when characterizing genes it is important to determine the control regions and
promoters of the genes, especially for genes in multi gene families.
In order to understand and explain structure and function of hemoglobin proteins and their genes in
Atlantic cod, Gadus morhua, a first step is to characterize the molecular components. In particular to
characterize the location and orientation of α and β genes as well as potential control regions regulating
transcription. We report here, as a first step towards such a goal, a study revealing a set of linked β and
α genes with a previously unknown putative gene in their intergenic region as well as proximal promoter
sequences of the genes.
3

Materials and Methods
DNA Isolation Both blood and muscle tissue samples of individuals already genotyped by protein iso-
electric focussing as HbI-1/1 (or SS), HbI-2/2 (or FF) and HbI-1/2 (or FS) (SICK 1965) were obtained from
Jarle Mork, University of Throndheim. We extracted DNA with a Chelex/proteinase K extraction method
(KARI 2006). Tissue samples of approximately 1.5 mm3 were digested in 250 µl of Chelex digestion
solution (5% W/V Chelex 100 Resin (BioRad 142–1253), 0.1µg/µl proteinase K, 0.2% SDS, 0.01 M Tris
pH 8, 0.5 mM EDTA pH 8 in 100 ml) at 65◦C in a thermomixer at 950 rpm for one and a half hour. The
mixture was spun at 3000 rpm for 5 minutes in a tabletop centrifuge, heated to 95◦C for 5 minutes and spun
at 3000 rpm for 5 minutes. The supernatant was drawn off and diluted 1:19 and used directly as template
for PCR (INGIMARSDÓTTIR 2006).
PCR To start the project, we designed oligonucleotide primers for the PCR amplification based on Gen-
Bank sequences (accession numbers for G. morhua mRNA for haemoglobin β chain and α chain, 2154747
and 2597904, respectively) submitted by Tipping and Birley. A pair of primers were designed for the α gene
(GmHBAL26 and GmHBAR553) and for the β gene (GmHBBL29 and GmHBBR532; Table 1). Using a
set of bioinformatics tools and based on the fact that Atlantic salmon α and β globin genes are linked tail
to tail (WAGNER et al. 1994) we designed a PCR strategy for finding similar features in Atlantic cod. We
tested amplification on genomic DNA with a forward and reverse β globin primer and a forward and reverse
α globin primer. We successfully amplified a large fragment using a forward β and a reverse α primer.
To improve specificity of amplification, we made the primers longer or 40 base pairs, GmHBBL29_long,
which was extended to amino acid seven in exon 1 of β gene and GmHBAR553_long which was extended
in the 3′ untranslated region of the α gene. The PCR was carried out with an initial denaturation step at
94◦C for 2 minutes, followed by 10 cycles of denaturation step at 94◦C for 20 seconds, an annealing step at
72◦C for 30 seconds and an extension step at 68◦C for 10 minutes, followed by 25 cycles of a denaturation
step at 94◦C for 20 seconds, an annealing step at 68◦C for 30 seconds and an extension step at 68◦C for 10
minutes which was increased by 10 seconds every cycle. A final extension step was at 68◦C for 10 minutes.
PCR amplifications were performed in 25 µl reactions, using Long PCR Enzyme Mix containing a mixture
of Taq and proofreading pfu polymerases (Fermentas K0181), in 1× Long PCR Buffer with 1.5 mM MgCl2,
0.2 mM of dNTPs, 50 pmol/µl of each primer and 1.5 U Long PCR Enzyme. A 3 µl of 1:19 diluted Chelex
extracted DNA was used as template without quantification.
4

Table 1: PCR primers. A set of primers used to amplify β gene (BL/BR in name) and α gene (AR/AL inname).
Name OligonucleotideGmHBBL29 5′–CCAACAACACATCAGCAACC–3′
GmHBBR532 5′–TTGTGTAGTCAAGAAAATCTGCAA–3′
GmHBAL26 5′–GAAAGCAACTATCTGAACGTCAA–3′
GmHBAR553 5′–ACCATTGAAACGGACCACAT–3′
GmHBBL29_long 5′–CCAACAACACATCAGCAACCATGGTTGAGTGGACAGATAGTGAGC–3′
GmHBAR553_long 5′–ACCATTGAAACGGACCACATGCATCAATGATGGCGGGAGTCTTCA–3′
Cloning After amplification we electrophorized the PCR products from individual SS104.1 in 0.7% TAE
agarose gel and purified the fragments with Ultra Agarose Spin Kit (ABgene). We cloned gel fragments into
the PCR R©4-TOPO vector using the TOPO TA Cloning R© Kit for Sequencing (Invitrogen K4530-20). We
plated transformed cells on kanamycin LB plates and picked and cultured positive clones overnight in liquid
LB media with kanamycin. Plasmid DNA purification was done with QIA prep R© Spin MiniPrep Kit (Qia-
gen). The plasmid DNA was digested with EcoRI restriction endonuclease (Fermentas) and electrophorized
in 1% TAE agarose gel to confirm cloning. Plasmids with about 3000 base pairs long inserts were sequenced
with a set of ten sequencing primers (Table 2).
Table 2: Walking primers for the 3000 base pair linked β and α gene set. Primers are listed in sequentialorder of the walk and with direction.
Name Oligonucleotide Direction
M13Forwardlong 5′– CGTTGTAAAACGACGGCCAG –3′ ForwardGmHBSeq06 5′– CTGAAGAACATGGACGACATCAA –3′ ForwardGmHBBLseq01 5′– TCTTCCTCCCTCCCTCACAT –3′ ForwardGmHBSeq05 5′– GTCAACATCGTCCAAACAACG –3′ ForwardGmHBBLseq02 5′– GCCCGTTAATTTCAGTGCTT –3′ ForwardGmHBARseq02 5′– GGGTCAGACCAATCAATAGGC –3′ ReverseGmHBSeq04 5′– GTCTTTACCTTACGTTGTCCTT –3′ ForwardGmHBARseq01 5′– TATATGGTGGCACACGAAGC –3′ ReverseGmHBSeq03 5′– CTGAACGTCAACATGAGTCTCT –3′ ForwardM13Reverselong 5′– CACACAGGAAACAGCTATGAC –3′ Reverse
Screening of λ genomic library and subcloning To further isolate other globin genes from Atlantic cod,
and in particular to search for a 5′ region of β genes, we screened a genomic library constructed in the phage
λ vector GEM-11 by Scan Biotec using standard procedures (SAMBROOK et al. 1989). The library was
kindly presented by Professor Lars Pilström’s laboratory in Uppsala University Sweden.
5
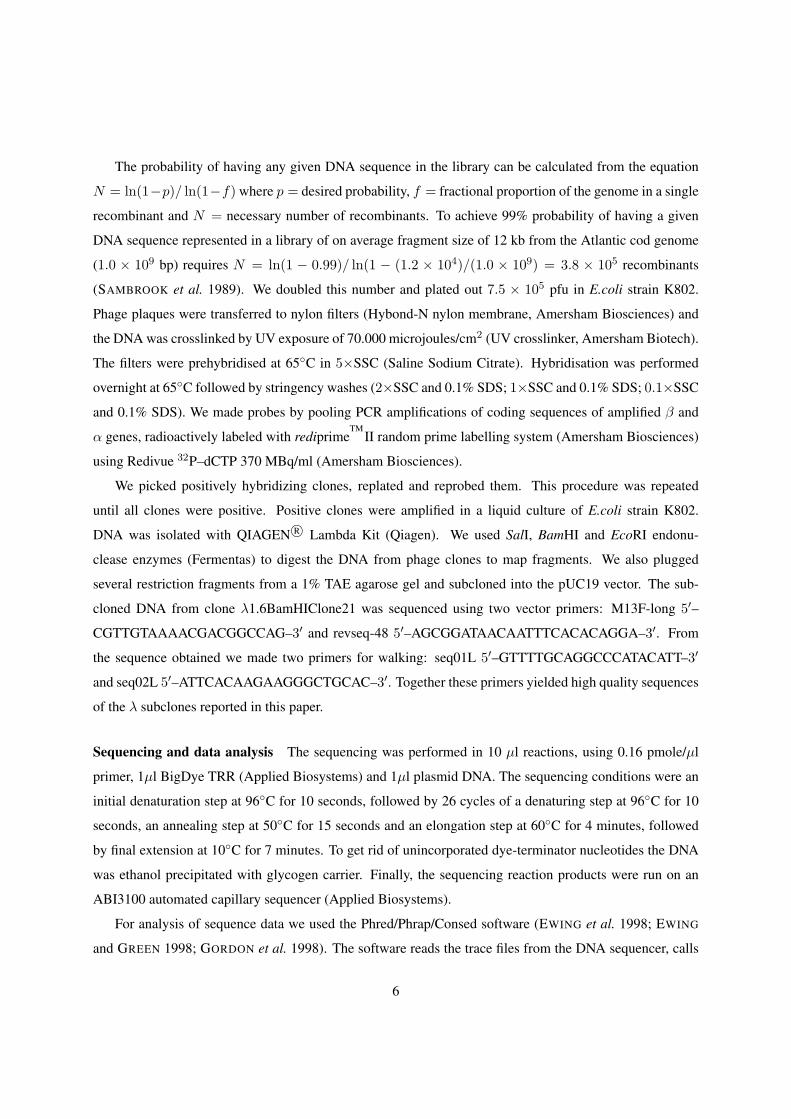
The probability of having any given DNA sequence in the library can be calculated from the equation
N = ln(1−p)/ ln(1−f) where p = desired probability, f = fractional proportion of the genome in a single
recombinant and N = necessary number of recombinants. To achieve 99% probability of having a given
DNA sequence represented in a library of on average fragment size of 12 kb from the Atlantic cod genome
(1.0 × 10⁹ bp) requires N = ln(1 − 0.99)/ ln(1 − (1.2 × 10⁴)/(1.0 × 109) = 3.8 × 10⁵ recombinants
(SAMBROOK et al. 1989). We doubled this number and plated out 7.5 × 10⁵ pfu in E.coli strain K802.
Phage plaques were transferred to nylon filters (Hybond-N nylon membrane, Amersham Biosciences) and
the DNA was crosslinked by UV exposure of 70.000 microjoules/cm2 (UV crosslinker, Amersham Biotech).
The filters were prehybridised at 65◦C in 5×SSC (Saline Sodium Citrate). Hybridisation was performed
overnight at 65◦C followed by stringency washes (2×SSC and 0.1% SDS; 1×SSC and 0.1% SDS; 0.1×SSC
and 0.1% SDS). We made probes by pooling PCR amplifications of coding sequences of amplified β and
α genes, radioactively labeled with rediprimeTM
II random prime labelling system (Amersham Biosciences)
using Redivue 32P–dCTP 370 MBq/ml (Amersham Biosciences).
We picked positively hybridizing clones, replated and reprobed them. This procedure was repeated
until all clones were positive. Positive clones were amplified in a liquid culture of E.coli strain K802.
DNA was isolated with QIAGEN R© Lambda Kit (Qiagen). We used SalI, BamHI and EcoRI endonu-
clease enzymes (Fermentas) to digest the DNA from phage clones to map fragments. We also plugged
several restriction fragments from a 1% TAE agarose gel and subcloned into the pUC19 vector. The sub-
cloned DNA from clone λ1.6BamHIClone21 was sequenced using two vector primers: M13F-long 5′–
CGTTGTAAAACGACGGCCAG–3′ and revseq-48 5′–AGCGGATAACAATTTCACACAGGA–3′. From
the sequence obtained we made two primers for walking: seq01L 5′–GTTTTGCAGGCCCATACATT–3′
and seq02L 5′–ATTCACAAGAAGGGCTGCAC–3′. Together these primers yielded high quality sequences
of the λ subclones reported in this paper.
Sequencing and data analysis The sequencing was performed in 10 µl reactions, using 0.16 pmole/µl
primer, 1µl BigDye TRR (Applied Biosystems) and 1µl plasmid DNA. The sequencing conditions were an
initial denaturation step at 96◦C for 10 seconds, followed by 26 cycles of a denaturing step at 96◦C for 10
seconds, an annealing step at 50◦C for 15 seconds and an elongation step at 60◦C for 4 minutes, followed
by final extension at 10◦C for 7 minutes. To get rid of unincorporated dye-terminator nucleotides the DNA
was ethanol precipitated with glycogen carrier. Finally, the sequencing reaction products were run on an
ABI3100 automated capillary sequencer (Applied Biosystems).
For analysis of sequence data we used the Phred/Phrap/Consed software (EWING et al. 1998; EWING
and GREEN 1998; GORDON et al. 1998). The software reads the trace files from the DNA sequencer, calls
6

bases, assigns a quality value to each base, and assembles reads into contigs (Quality value = − log10(Pe),
Pe is probabilty of error). Primer walking was applied to sequence the SS104.1 plasmid using ten primers
(Table 2). Each base in the contigs of the assembly of sequenced data from SS104.1 had quality values
higher than 40 or 99.99% accuracy of base call and most were higher than 60 (or 99.9999% accuracy;
Figure 1). Quality values of each base pair of subclone λ1.6BamHIclone21 were greater than 60 (data not
shown).
●
●●●
●●●●
●●●●●
●●
●
●●●●●
●●●●●
●
●●
●●●
●●●●●
●
●●●
●
●●●●
●
●●●
●●●●●
●
●
●
●●●
●●●
●●●
●●●
●●●
●●●●●
●
●●●
●●●●●●●●●●
●●●
●
●
●
●
●●●●
●●●
●●●●●●●●●●●●●●●●●
●●●●●
●
●
●●
●●
●●
●●●●●●●●●
●
●●●●
●
●●●●●●●●●●●●●●●●
●●●●
●●●●●●●●●●
●●●●●
●
●
●●●●●●
●●●
●●●●●●●
●●●
●●
●●
●●●●
●●●●
●●●●●●●
●●
●●●●
●●●
●●●●●●●●●●●●
●
●
●
●
●
●●●
●●●●●●●●●●●●●●
●●
●
●
●
●●●●●●●●●●●●●●●●●●●●●●
●●●
●●●●●●●●
●●●
●●●●●●●●●●●●
●●●
●●●
●●●●●●●
●
●●
●
●●
●
●
●
●
●
●
●
●
●●●●●●●●●
●●●●
●●●●●●●●
●
●●●●●●●●
●●●●●●●●●●●●●●
●
●●
●●●
●●
●
●●●
●
●●●●●●●
●●●●
●
●
●
●●
●
●●
●●●●●
●●●●●
●●
●
●●
●●
●●●●●●●●●●●●●●●●●●●●●●●●●●●●●●●●●●●●●●●●●●●●●●●●●●●●
●●
●●●●●●●●●●●●●●●●●●●●●●●●●●●●●●●●●●●●●●●●●●●●●●●●●●●●●●●●●●●●●●●●●●●●●●●●●●●●●●●●●●●●●●●●●●●●●●●●●●●●●●●●●●●●●●●●●●●●●●●●●●●●●●●●●●●●●●●●●●●●●●●●
●●●●●●●
●●●●●●●●●●●●●●●●●●●●●●●●●●●●●
●
●●●●●●●●●●●●●●
●●●●●●●
●●●●●●●●●●●●●●●●●●●●●●●●●●●●●●●●●●●●●●●●●
●
●●●●●●●●●●●●●●●●●●●●●●●●●●●●●●●●●●●●●●●●●●●●●●●●●●●●●●●●●●●●●●●●●●●●●●●●●●●●●●●●●●
●
●●●●●●●●●●●●●●●●●●●●●●●●●●●●●
●●●●●●●●●
●●●●
●●●●●●●●●●●●●●●●●●
●●●●●●●
●●●●
●●●
●●●●●●●●●●●●●●●●●●●●●●●
●●●●●●●●
●●●
●●
●
●●●
●●●●●●●●●●●●●●●●●●●●●
●●●●●●●●●●●●●●
●●●●●
●●
●
●●●●●
●●●
●●●●
●
●●
●●●●
●
●●●●●●●●●
●●●●●
●
●
●●●
●
●
●●●●
●●●●●●●●●
●●●
●●●
●●●●●
●●●●●●
●
●
●●●
●●●●●●
●●●●
●●
●●●●●●
●
●●●●●●
●●●●●●●●●●●●●●●●●●●●●●●●●●●●●●●●●●●●●●●●●●●●●●●●●●
●●●●
●●
●
●●●●●●●●●●●●●●●●●●●●●●●●●●●●●●●●●●●●●●●●●●●●●●●●●●●●●●●●●●●●●●●●●●●●●●●●●●●●●●●●●●●●●●●●●●●●●●●●●●●●●●●●●●●●●●●●●●●●●●●●●●●●●●●●●●●●●●●●●●●●●●●●●●●●●●●●●●●●●●●●●●●●●●●●●●●●●●●●●●●●●●●●●●●●●●●●●●●●●●●●●●●●●●●●●●●●●●●●●●●●●●●●●●●●●●●●●●●●●●●●●●●●●●●●●●●●●●●●●●●●●●●●●●●●●●●●●●●●●●●●●●●●●●●●●●●●●●●●●●●●●●●●●●●●●●●●●●●●●●●●●●●●●●●●●●●●●●●●●●●●●●●●●●●●●●●●●●●●●●●●●●●●●●●●●●●●●●●●●●●●●●●●●●●●●●●●●●●●●●●●●●●●●●●●●●●●●●●●●●●●●●●●●●●●●●●●●●●●●●●●●●●●●●●●●●●●●●●●●●●●●●●●●●●●●●●●●●●●●●●●●●●●●●●●●●●●●●●●●●●●●●●●●●●●●●●●●●●●●●●●●●●●●●●●●●●●●●●●●●●●●●●●●●●●●●●●●●●●●●●●●●●●●●●●●●●●●●●●●●●●●●●●●●●●●●●●●●●●●●●●●●●●●●●●●●●●●●●●●●●●●●●●●●●●●●●●●●●●●●●●●●●●●●●●●●●●●●●●●●●●●●●●●●●●●●●●●●●●●●●●●●●●●●●●●●●●●●●●●●●●●●●●●●●●●●●●●●●●●●●●●●●●●●●●●●●●●●●●●●●●●●●●●●●●●●●●●●●●●●●●●●●●●●●●●●●●●●●●●●●●●●●●●●●●●●●●●●●●●●●●●●●●●●●●●●●●●●●●●●●●●●●●●●●●●●●●●●●●●●●●●●●●●●●●●●●●●●●●●●●●●●●●●●●●●●●●●●●●●●●●●●●●●●●●●●●●●●●●●●●●●●●●●●●●●●●●●●●●●●●●●●●●●●●●●●●●●●●●●●●●●●●●●●●●●●●●●●●●●●●●●●●●●●●●●●●●●●●●●●●●●●●●●●●●●●●●●●●●●●●●●●●●●●●●●●●●●●●●●●●●●
●
●●
●●●●●●●●●●●●●●●●●●●●●●●●●●●●●●●●●●●●●●●●●●●●●●●●●●●●●●●●●●●●●●●●●●●●●●●●●
●●
●
●
●●●
●●●●●●●
●●
●
●●●●●●●
●
●●●●●
●●●
●●
●●●
●●
●●●●●●●●●●●●●●●●●●
●
●●●●
●●●
●●
●
●●●
●
●
●
●●●●
●●
●●
●●●
●
●●
●
●●●●●
●●
●
●●●●
●●●
●●
●●●●●
●●●●●●●●●●●●●●●●●●●●●●●●●●●●●●●●●●●●●●●●●●●●●●●●●●●●●●●●●●●●●●●●●●●●●●●●●●●●●
●●
●●●●
●●
●●
●●●●
●
●●●
●●●●
●●
●●●●●●●
●●
●●●
●
●
●●
●
●
●
●
●●
●●●●●●●●●●●●●●●●●●●●●●●●●●●●●●●●●
●
●●●●●●●●●●●●●●●●●●●●●●●●●●●●●●●●●●●●●●●●●●●●●●●●●●●●●●●●●●●●●●●●●●●●●●●●●●●●●●●●●●●●●●●●●●●●●●●●●●●●●●●●●●●●●●●●●●●●●●●●●●●●●●●●●●●●●●●●●●●●●●●●●●●●●●●●●●●●●●●●●●●●●●●●●●●●●●●●●●●●●●●●●●●●●●●●●●●●●●●●●●●●●●●●●●●●●●●●●●●●●●●●●●●●●●●●●●●●●●●●●●●●●●●●●●●●●●●●●●●●●●●●●●●●●●●●●●●●●●●●●●●●●●●●●●●●●●●●●●●●●●●●●●●●●●●●●●●●●●●●●●●●●●●●●●●●●●●●●●●●●●●●●●●●●●●●●●●●●●●●●●●●●●●●●●●●●●●●●●●●●●●●●●●●●●●●●
●●●●●●●●●●●●●●●●●●●●●●●●●●●●●●●●●
●●
●
●●
●
●●●●
●
●●●●●●●●●●●●●●●●●●●●●●●●●●●●●●●●●●
●
●
●●●
●●
●●
●
●●●
●●●●
●●
●●●●●●●●●
●
●
●
●
●
●●●
●●
●●
●●●
0 500 1000 1500 2000 2500 3000
020
4060
80
Nucleotide position
Qua
lity
valu
e
Figure 1: Basecalling quality values on nucleotide position of clone SS104.1 sequences from thePhred/Phrap/Consed software. Quality value = − log(Pe) where Pe is probability of erroneous base call.
7

Gene prediction For prediction of coding sequences of the contigs we used The New GENSCAN Web
Server at MIT software (BURGE and KARLIN 1997, http://genes.mit.edu/GENSCAN.html).
Information from GENSCAN prediction was used for various data analysis, using R (R DEVELOPMENT
CORE TEAM 2006), the ape package (PARADIS et al. 2005) in particular. We also used the FGENES and
FGENESH programs from Softberry (http://sun1.softberry.com) for gene prediction to compare
with and augment GENSCAN prediction.
For further evaluation and authentication of the predicted genes we ran the contigs through nucleotide-
nucleotide BLAST (blastn) (ALTSCHUL et al. 1990, http://www.ncbi.nlm.nih.gov/BLAST/)
frequently limited by entry query of G. morhua mRNA for haemoglobin β-chain, β introns 1 and 2, α-
chain and α introns 1 and 2 (accession numbers: 2154747, 2154750, 2154752, 2597904, 2154749, 2154751
respectively). For coding sequences we ran the Genscan predicted coding sequences through Translated
query vs. protein database (blastx) (GISH and STATES 1993, http://www.ncbi.nlm.nih.gov/
BLAST/). We aligned the clones isolated from the genomic λ library and the clones derived from PCR
amplification of genomic DNA with Align two sequences bl2seq (ZHANG et al. 2000, http://www.
ncbi.nlm.nih.gov/BLAST/).
For further analysing the structure of sequence data we used the EMBOSS program etandem (RICE
et al. 2000) which looks for tandem repeats in a nucleotide sequence. The program calculates a concensus
for the repeat region and gives a score for how many matches there are to the consensus minus the number
of mismatches.
8
Results
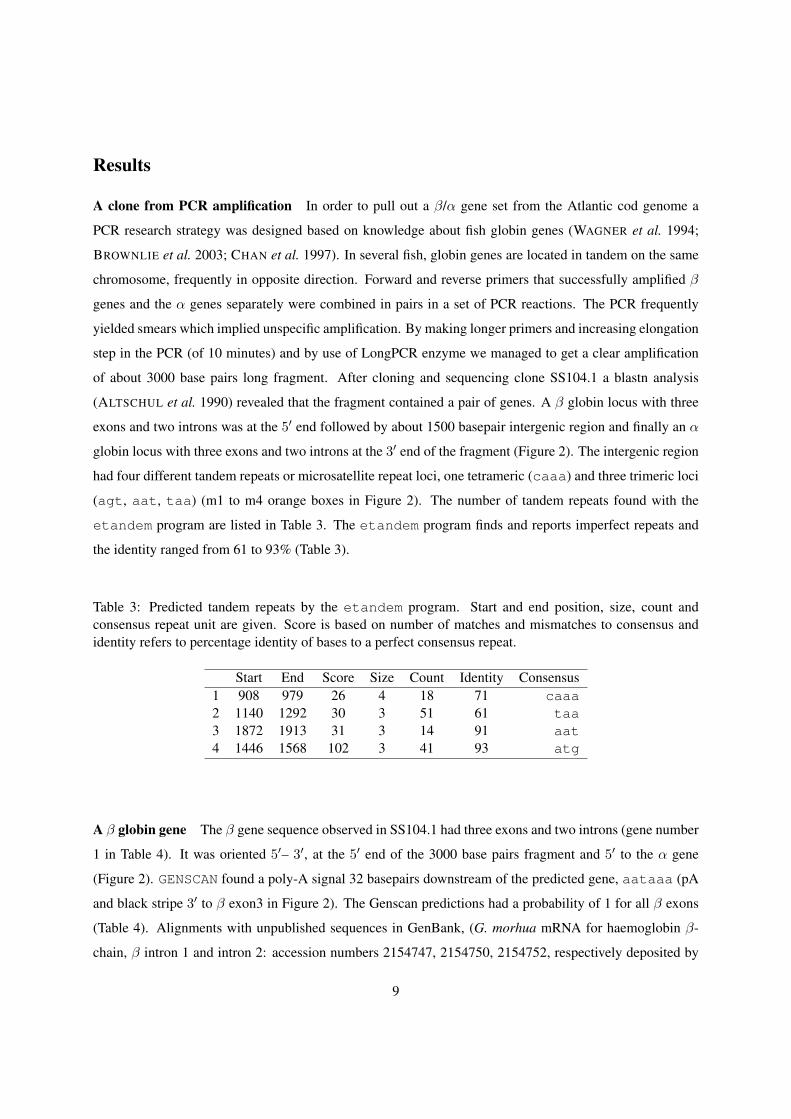
A clone from PCR amplification In order to pull out a β/α gene set from the Atlantic cod genome a
PCR research strategy was designed based on knowledge about fish globin genes (WAGNER et al. 1994;
BROWNLIE et al. 2003; CHAN et al. 1997). In several fish, globin genes are located in tandem on the same
chromosome, frequently in opposite direction. Forward and reverse primers that successfully amplified β
genes and the α genes separately were combined in pairs in a set of PCR reactions. The PCR frequently
yielded smears which implied unspecific amplification. By making longer primers and increasing elongation
step in the PCR (of 10 minutes) and by use of LongPCR enzyme we managed to get a clear amplification
of about 3000 base pairs long fragment. After cloning and sequencing clone SS104.1 a blastn analysis
(ALTSCHUL et al. 1990) revealed that the fragment contained a pair of genes. A β globin locus with three
exons and two introns was at the 5′ end followed by about 1500 basepair intergenic region and finally an α
globin locus with three exons and two introns at the 3′ end of the fragment (Figure 2). The intergenic region
had four different tandem repeats or microsatellite repeat loci, one tetrameric (caaa) and three trimeric loci
(agt, aat, taa) (m1 to m4 orange boxes in Figure 2). The number of tandem repeats found with the
etandem program are listed in Table 3. The etandem program finds and reports imperfect repeats and
the identity ranged from 61 to 93% (Table 3).
Table 3: Predicted tandem repeats by the etandem program. Start and end position, size, count andconsensus repeat unit are given. Score is based on number of matches and mismatches to consensus andidentity refers to percentage identity of bases to a perfect consensus repeat.
Start End Score Size Count Identity Consensus1 908 979 26 4 18 71 caaa2 1140 1292 30 3 51 61 taa3 1872 1913 31 3 14 91 aat4 1446 1568 102 3 41 93 atg
A β globin gene The β gene sequence observed in SS104.1 had three exons and two introns (gene number
1 in Table 4). It was oriented 5′– 3′, at the 5′ end of the 3000 base pairs fragment and 5′ to the α gene
(Figure 2). GENSCAN found a poly-A signal 32 basepairs downstream of the predicted gene, aataaa (pA
and black stripe 3′ to β exon3 in Figure 2). The Genscan predictions had a probability of 1 for all β exons
(Table 4). Alignments with unpublished sequences in GenBank, (G. morhua mRNA for haemoglobin β-
chain, β intron 1 and intron 2: accession numbers 2154747, 2154750, 2154752, respectively deposited by
9

−1
00
00
10
00
20
00
30
00
Nu
cle
otid
e p
ositio
n
e1
i1e
2i2
e3
e1
i1e
2i2
e3
e1
p2
p3
pA
pA
βα
SS
10
4.1
λ1
.6 B
am
HI
Clo
ne
21
e1
i1e
2
o1
c1
c1
c2
c2
c3
c3
ca
aa
taa
atg
aa
t
m1
m2
m3
m4
ca
aa
ata
m1
m2
q1
q2
q3
r1
r2
s1
s2
p1 5'
3'
Figu
re2:
Asc
hem
atic
ofa
5′–
3′ta
ilto
headβ
–α
gene
seti
nA
tlant
icco
d.PC
Rcl
one
SS10
4.1
isa
TOPO
-TA
clon
ed30
00ba
sepa
irPC
Rfr
agm
ento
fge
nom
icD
NA
from
indi
vidu
alSS
104.λ
1.6
Bam
HI
Clo
ne21
isa
subc
lone
from
ala
rger
clon
epu
lled
outo
fan
Atla
ntic
cod
geno
micλ
libra
ry.
Zer
ore
pres
ents
SS10
4β
gene
initi
atio
nco
don.
Thr
eeex
ons
inβ
andα
like
gene
s(e
blue
boxe
s)an
din
tron
s(i
thin
lines
betw
een
boxe
s)as
pred
icte
dby
GENSCAN
.Asi
ngle
-exo
nge
nein
inte
rgen
ic(e
1re
dbo
x).P
rom
oter
sfo
rsin
gle-
exon
gene
inin
terg
enic
regi
onan
dfo
rα
gene
pred
icte
dby
GENSCAN
and
prom
oter
pred
icte
dfo
rβ
gene
byFGENES
andFGENESH
(pye
llow
boxe
s).
Poly
aden
ylat
ion
sign
als3′
toβ
and
sing
le-e
xon
gene
(pA
thin
blac
kba
rs).
Tand
emre
peat
s(m
icro
sate
llite
s)of
both
clon
espr
edic
ted
byetandem
(mor
ange
boxe
s).
Reg
ions
ofco
nser
ved
orne
arly
cons
erve
dse
quen
ces
inβ
/αin
terg
enic
regi
onof
Clo
neSS
104.
1an
din
5′re
gion
ofβ
gene
inλ
1.6
Bam
HIC
lone
21(c
gree
nbo
xes)
.Par
tofa
nun
rela
ted
gene
(om
agen
tabo
x).L
ocat
ions
ofsh
ortf
ragm
ents
(abo
ut10
–12
base
pair
s)atα
exon
1,in
tron
1an
dex
on2
junc
tions
show
ing
iden
tity
tofr
agm
ents
inin
terg
enic
regi
on(q
,ran
ds
atth
ree
top
leve
lsin
SS10
4.1
part
ofdr
awin
g).
See
text
forf
urth
erex
plan
atio
nan
ddi
scus
sion
.
10

Tipping and Birley) showed large differences in intron1. The sequences differed by a 39 base pair fragment
at the beginning of intron 1. In a separate experiment a PCR product from amplification of only the β gene,
which also was TOPO-TA cloned and sequenced, showed similarities to two different fragments of intron
1. Thus we have observed two different β intron 1. They both differed from the GenBank intron (accession
number: 2154750) by the same 39 base pairs long fragment at the beginning of intron 1. In addition our
second intron 1 differed from the first by 30 base pairs at another position at which our first intron sequence
was identical to that of Tipping and Birley. Thus, this 30 base pairs fragment is unique to each of the three
intron 1 sequences known so far. In several other experiments (HALLDÓRSDÓTTIR and ÁRNASON 2007) no
PCR products of linked β and α gene sets showed the intron 1 deposited in GenBank by Tipping and Birley.
Our intron 2 sequence was identical to that deposited by Tipping and Birley (accession number 2154752)
except for two base substitutions, that is base number 476 in SS104.1 C-T and base number 478 in SS104.1
C-G.
Further dissimilarities were also found between the sequence of our clone and the GenBank sequence
mRNA (accession number 2154747). In exon 1 a base substitution changed amino acid number 12, T–N.
In exon 2 one silent substitution occured at nucleotide position 362, G–C. Large differences were found in
exon 3, where many base substitutions gave rise to amino acid differences between our sequence and the
sequence deposited by Tipping and Birley. Amino acids number 8 (V–G), 15 (G–V), 21 (E–D), 25 (A–G),
30 (L–R), 32 (V–F) and 40 (Q–E) in exon 3 differed between our sequence and Tipping and Birley. In
addition five silent substitutions were found as well in exon 3.
A β/α intergenic region GENSCAN predicted a single-exon gene located between the β and α genes.
It is located between nucleotide position numbers 1442–1579 (gene number 2 in Table 4; e1 red box
in Figure 2). According to etandem (Table 3) this gene coincides with the atg microsatellite tandem
repeats (m3 orange box in Figure 2). The predicted protein was a sequence of primarily aspartic acid
(D by codon gat, MNDDCNDGDDDADDDDDDDDDDDDDDDDDDDDDDDDDDDDDDCSL). The
GENSCAN probability for this exon was only 55% (Table 4). However, it had a methionine start codon, a
termination codon and both a promoter (p2 yellow box 3′ to β locus in Figure 2) and a putative polyA signal
(pA black stripe 3′ to single-exon gene in Figure 2, Table 4). The 40 base pair promoter region (TAATTC-
CAATAAAAATGTACAATTTAGCCCGTTAATTTCA) had a CCAAT box and we found a TTTAA box 85
base pairs 5′ to the exon. Thus the predicted gene had all elements of a functional gene. We ran the nu-
cleotide sequence through blastn and the predicted aminoacid sequence through blastx and blastp
(http://www.ncbi.nlm.nih.gov/BLAST/) and found no similarities to any known protein.
11
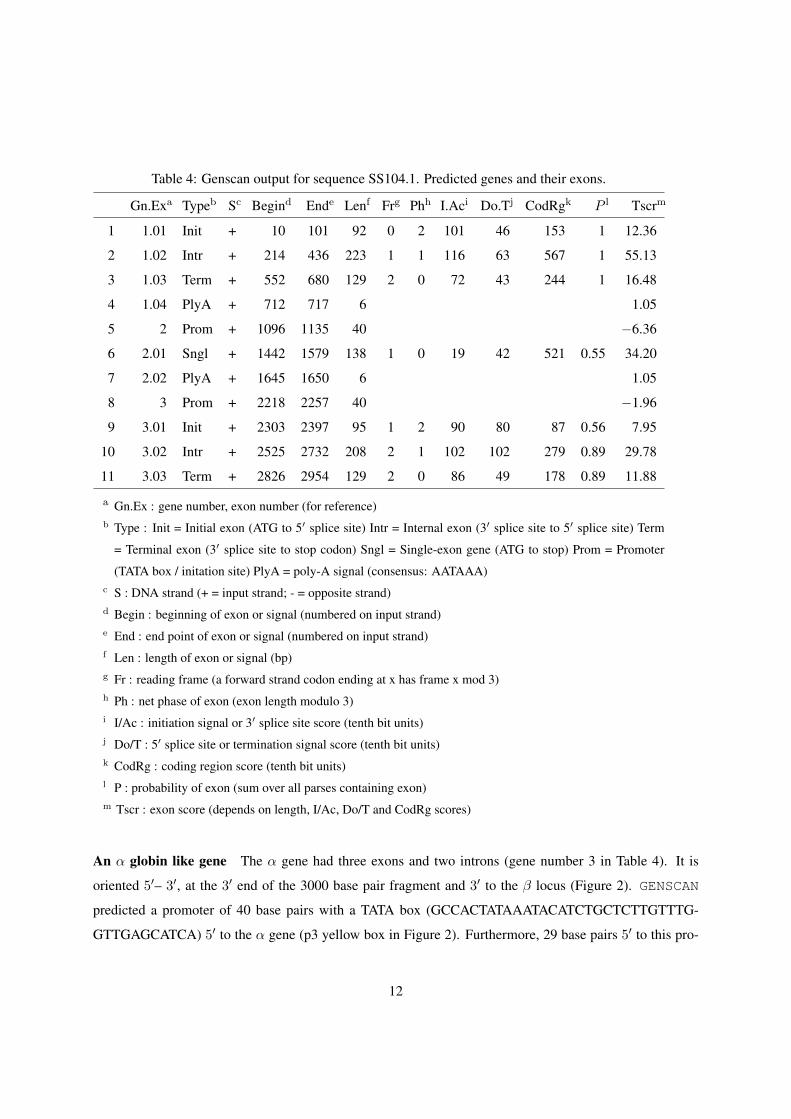
Table 4: Genscan output for sequence SS104.1. Predicted genes and their exons.
Gn.Exa Typeb Sc Begind Ende Lenf Frg Phh I.Aci Do.Tj CodRgk P l Tscrm
1 1.01 Init + 10 101 92 0 2 101 46 153 1 12.36
2 1.02 Intr + 214 436 223 1 1 116 63 567 1 55.13
3 1.03 Term + 552 680 129 2 0 72 43 244 1 16.48
4 1.04 PlyA + 712 717 6 1.05
5 2 Prom + 1096 1135 40 −6.36
6 2.01 Sngl + 1442 1579 138 1 0 19 42 521 0.55 34.20
7 2.02 PlyA + 1645 1650 6 1.05
8 3 Prom + 2218 2257 40 −1.96
9 3.01 Init + 2303 2397 95 1 2 90 80 87 0.56 7.95
10 3.02 Intr + 2525 2732 208 2 1 102 102 279 0.89 29.78
11 3.03 Term + 2826 2954 129 2 0 86 49 178 0.89 11.88
a Gn.Ex : gene number, exon number (for reference)b Type : Init = Initial exon (ATG to 5′ splice site) Intr = Internal exon (3′ splice site to 5′ splice site) Term
= Terminal exon (3′ splice site to stop codon) Sngl = Single-exon gene (ATG to stop) Prom = Promoter
(TATA box / initation site) PlyA = poly-A signal (consensus: AATAAA)c S : DNA strand (+ = input strand; - = opposite strand)d Begin : beginning of exon or signal (numbered on input strand)e End : end point of exon or signal (numbered on input strand)f Len : length of exon or signal (bp)g Fr : reading frame (a forward strand codon ending at x has frame x mod 3)h Ph : net phase of exon (exon length modulo 3)i I/Ac : initiation signal or 3′ splice site score (tenth bit units)j Do/T : 5′ splice site or termination signal score (tenth bit units)k CodRg : coding region score (tenth bit units)l P : probability of exon (sum over all parses containing exon)m Tscr : exon score (depends on length, I/Ac, Do/T and CodRg scores)
An α globin like gene The α gene had three exons and two introns (gene number 3 in Table 4). It is
oriented 5′– 3′, at the 3′ end of the 3000 base pair fragment and 3′ to the β locus (Figure 2). GENSCAN
predicted a promoter of 40 base pairs with a TATA box (GCCACTATAAATACATCTGCTCTTGTTTG-
GTTGAGCATCA) 5′ to the α gene (p3 yellow box in Figure 2). Furthermore, 29 base pairs 5′ to this pro-
12

moter we found a CCAAT box. The cloned fragment ended right after the 3′ end of the α coding sequence
and there was no evidence for a polyA signal 3′ to the α gene. Alignments with unpublished sequences in
GenBank, (G. morhua mRNA for haemoglobin α-chain, intron 1 and intron 2; accession numbers 2597904,
2154749, 2154751, respectively) revealed an overlap of 10 basepairs between the end of intron 1 and start
of exon 2 and base 2510 in SS104.1 was T instead of C in 2154749. Intron 2 differed from 2154751 by eight
base pairs at the start and one indel difference was observed compared to 2154751. Exon 1 was identical to
α in 2597904. A substitution in exon 2 of SS104.1 causes an amino acid change (I-C). Exon 3 was identical
to exon 3 in 2597904. The Genscan predictions had a probability of 56% for exon 1 and 89% for exon 2 and
exon 3 of the predicted α gene (Table 4).
Three eleven base pairs long coding regions from the α gene found similarities to the intergenic region
(q, r and s thin lines in three top levels in SS104.1 part of Figure 2). The fragment at first level in Figure 2
(q) was the amino acid sequence ALSR (GCTCTGTCCAG). It was found at the end of α exon 1 and at
nucleotide positions 1766–1776 in the intergenic region. With one substitution, this same fragment was
found at the end of α intron 1 (GCTCTCTCCAG). At the second level the fragment (r in Figure 2) was the
amino acid sequence VAV (GGTGGCTGTGT) which was found in direct continuation of the q fragment
at the beginning of exon 2 (amino acids numbers 2–4 of that exon). This was also found 3′ to β gene at
nucleotide positions 789–794. At the third level (s in Figure 2) partly overlapping and in continuation of
fragment r, this fragment codes for the amino acid sequence VYPQ (TGTACCCCCAG) which was found
in exon 2 (amino acid numbers 4–7). This fragment was also found 5′ to the α gene at nucleotide positions
2207–2217. Thus different parts of the 30 base pair region at the boundary of intron 1 and exon 2 find
similarities with various parts of the intergenic region.
Clone BamHI21 from a λ genomic library The β locus coding region started soon after the 5′ end
of the cloned PCR fragment and thus there was no information available on control regions located 5′ to
the β locus. To study this a 13 kb λ clone giving positive hybridization signals with the β/α probe was
isolated from an Atlantic cod genomic library. A BamHI digested fragments was subcloned into pUC19 and
sequenced. The clone λ1.6BamHIClone21 contained a 5′ region of a β gene.
The λ clone contained exon 2 (where a BamHI restriction site exists), intron 1 and exon 1 of a β gene
and continued for 1700 base pairs upstream of the β gene (λ1.6BamHIClone21 in Figure 2). The Genscan
predictions had a probability of 99% and 97% respectively for these β exons (data not shown). GENSCAN
did not predict a promoter for the β gene in this region. However, FGENESH and FGENES both predicted a
TTTAAA box 5′ to the β gene (TSS 1 in Table 5).
13
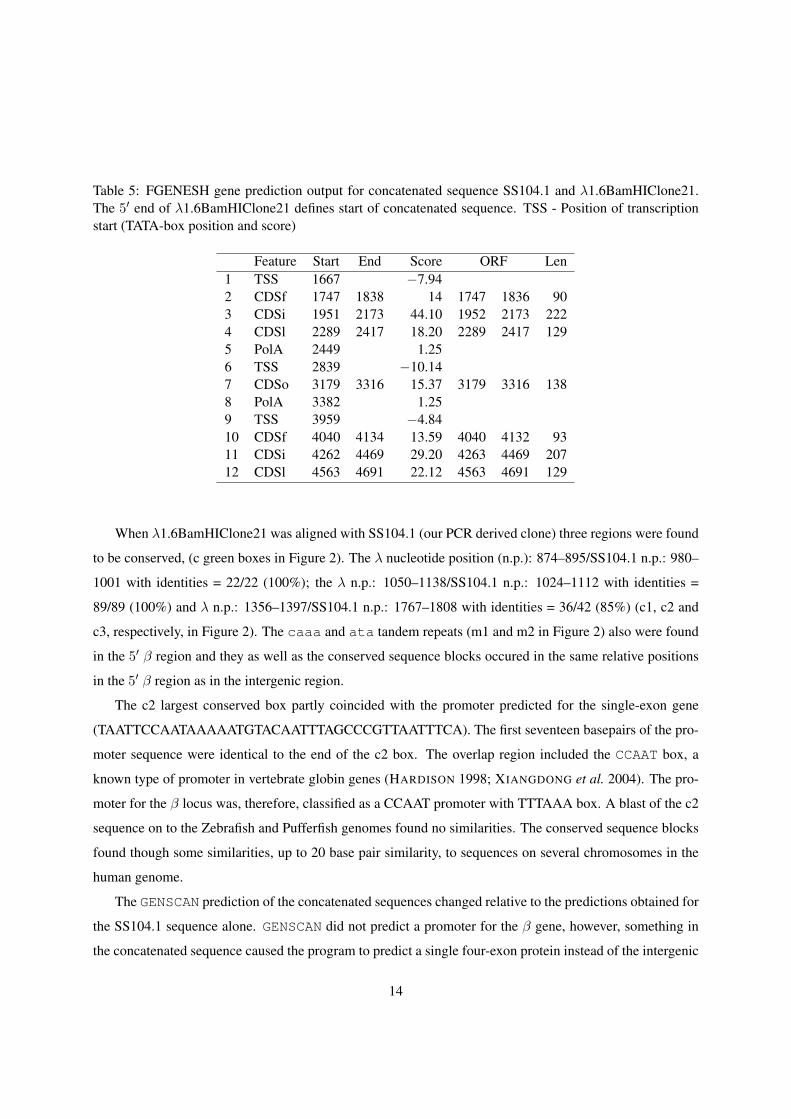
Table 5: FGENESH gene prediction output for concatenated sequence SS104.1 and λ1.6BamHIClone21.The 5′ end of λ1.6BamHIClone21 defines start of concatenated sequence. TSS - Position of transcriptionstart (TATA-box position and score)
Feature Start End Score ORF Len1 TSS 1667 −7.942 CDSf 1747 1838 14 1747 1836 903 CDSi 1951 2173 44.10 1952 2173 2224 CDSl 2289 2417 18.20 2289 2417 1295 PolA 2449 1.256 TSS 2839 −10.147 CDSo 3179 3316 15.37 3179 3316 1388 PolA 3382 1.259 TSS 3959 −4.8410 CDSf 4040 4134 13.59 4040 4132 9311 CDSi 4262 4469 29.20 4263 4469 20712 CDSl 4563 4691 22.12 4563 4691 129
When λ1.6BamHIClone21 was aligned with SS104.1 (our PCR derived clone) three regions were found
to be conserved, (c green boxes in Figure 2). The λ nucleotide position (n.p.): 874–895/SS104.1 n.p.: 980–
1001 with identities = 22/22 (100%); the λ n.p.: 1050–1138/SS104.1 n.p.: 1024–1112 with identities =
89/89 (100%) and λ n.p.: 1356–1397/SS104.1 n.p.: 1767–1808 with identities = 36/42 (85%) (c1, c2 and
c3, respectively, in Figure 2). The caaa and ata tandem repeats (m1 and m2 in Figure 2) also were found
in the 5′ β region and they as well as the conserved sequence blocks occured in the same relative positions
in the 5′ β region as in the intergenic region.
The c2 largest conserved box partly coincided with the promoter predicted for the single-exon gene
(TAATTCCAATAAAAATGTACAATTTAGCCCGTTAATTTCA). The first seventeen basepairs of the pro-
moter sequence were identical to the end of the c2 box. The overlap region included the CCAAT box, a
known type of promoter in vertebrate globin genes (HARDISON 1998; XIANGDONG et al. 2004). The pro-
moter for the β locus was, therefore, classified as a CCAAT promoter with TTTAAA box. A blast of the c2
sequence on to the Zebrafish and Pufferfish genomes found no similarities. The conserved sequence blocks
found though some similarities, up to 20 base pair similarity, to sequences on several chromosomes in the
human genome.
The GENSCAN prediction of the concatenated sequences changed relative to the predictions obtained for
the SS104.1 sequence alone. GENSCAN did not predict a promoter for the β gene, however, something in
the concatenated sequence caused the program to predict a single four-exon protein instead of the intergenic
14

single-exon protein and three-exon α protein predicted for SS104.1. FGENES did predict a TTTAAA box
promoter for the β gene. This program, however, predicted the whole region to consist of one gene with
five exons. The probability that a correct exon is predicted depends on global as well as local sequence
properties. The probability values for exons in the α locus were much lower than for the β locus and
something in the 5′ region caused the programs to change prediction of exons in the region 3′ to β.
Interestingly, a partial sequence of an unrelated gene is found only 924 bp upstream from where the β
gene starts (Figure 2).
15

Discussion
A set of linked β and α globin like genes in Atlantic cod In this report we describe the isolation and
characterization of linked β and α globin genes from Atlantic cod. The genes are oriented tail to head in a
5′ to 3′ direction. The genes both contain the conserved pattern of globin genes, three exons and two introns
each (DICKERSON and GEIS 1983). In addition, a putative single exon gene is predicted in the intergenic
region.
A distinct arrangement of globin genes characterizes vertebrates in general. In humans (and other mam-
mals) β and α globin clusters are located on different chromosomes. The β cluster includes five functional
genes and one pseudogene. Their arrangement on the chromosome frequently correspond to their order of
expression in development, all of them in a 5′ to 3′ direction of transcription. The β cluster in mice has
the structural genes in tandem including three embryonic genes and two genes expressed in fetus and adult
animals. In chicken, however, the adult β genes are flanked by the embryonic genes (SJAKSTE and SJAKSTE
2002; HARDISON 1998). This demonstrates variations on the theme of arrangement and order of expression
in development.
In the African frog (Xenopus laevis) the genes are linked on the same chromosome with three α genes
followed by three β genes. Direction of transcription is 5′ to 3′ and embryonic genes are located 5′ to adult
animal genes (HOSBACH et al. 1983). However, the arrangement of these genes in fish is different. In the
Zebrafish pairs of linked α and β genes are found for embryonic genes and adult genes respectively, both on
the same chromosome. The direction of transcription is tail to tail (5′–3′, 3′–5′) in the embryonic pair but
head to head (3′–5′, 5′–3′) in the adult globin pair (BROWNLIE et al. 2003). Similarly, the globin genes in
Pufferfish are closely linked and directed in opposite transcriptional orientations (GILLEMANS et al. 2003).
Globin genes in Salmon are linked pairs of tail to tail oriented α and β genes. Two types of pairs have been
reported, both with the same direction of transcription (WAGNER et al. 1994).
The orientation of globin genes in Atlantic cod described here differs from arrangements found in the
other model and semi-model fish species described. The tail to head orientation is similar to that of higher
vertebrates. Our findings further support the hypothesis (HARDISON 1998) about hemoglobins being en-
coded by orthologous gene which have gained new role through duplication events and subsequent special-
ization.
Putative gene in intergenic region GENSCAN predicts a single exon gene in the region between the β
and α genes. The exon mainly consist of asparctic acids (D). The gene has its own promoter, initiation and
termination codons and a polyA signal and is thus a putative functional gene. No similarities are found to
16

any known protein in GenBank. The question remains whether this is a functional protein and whether it has
something to do with expression or other functions of the globin genes or proteins. LI et al. (2004) in their
study state that simple sequence repeats (SSR) in protein coding regions or variations of SSR in 5′-UTRs
can regulate gene expression (LI et al. 2004). The atgmicrosatellite tandem repeats in the intergenic region
could also be of that kind. Further experiments (e.g. 5′ or 3′ RACE) have to be done to find out if the gene
that GENSCAN predict is translated to protein or not.
Proximal regulatory regions of the genes Different functions of hemoglobins in all kingdoms of organ-
isms illustrate the acquisition of new roles by a pre-existing structural gene. Temporal and environmental
regulation of expression is usually controlled by promoters and enhancers (HARDISON 1998; DICKERSON
and GEIS 1983)
In humans a distal locus-control-region (LCR) is located 16 kb upstream of the β cluster (SJAKSTE and
SJAKSTE 2002). An interaction between DNase I Hypersensitive Sites (HSS) of the LCR and a promoter
of a globin gene is believed to switch on expression (SJAKSTE and SJAKSTE 2002). The role of proximal
regulatory regions in regulation of transcription in a gene system like the globin clusters is of great impor-
tance. GILLEMANS et al. (2003) searched for remote haemoglobin regulatory elements in Pufferfish and
argued that they are not present for the linked α/β globin gene locus in that specie. Therefore, in this case,
promoters proximal to the genes regulate transcription.
In our study, a short regulatory region, a CCAAT promoter, is located 5′ to the first exon of all of the
three genes reported. This is a conserved motif in all vertebrate globin gene promoters (HARDISON 1998).
It can be bound by the CP1 a complex (HARDISON 1998). The CP1 binds more strongly to the CCAAT box
in the α globin gene promoter than in the β globin gene promoter (COHEN et al. 1986; HARDISON 1998).
Each gene has an associated TATA box which nevertheless differs among the genes. The β gene has a
TTTAAA box, the gene in the intergene region has a TTTAA box and the α gene has a TATA box. All of
them are known as conserved sequences for the TATA Binding Protein (TBP) in initiation of transcription.
To sum up, the proximal regulatory elements for linked β and α globin genes in Atlantic cod are CCAAT
with TATA box promoters. This corresponds to the pattern found in other fish, however, the orientation of
the genes in Atlantic cod differs from that of the model species.
Conserved sequence blocks in 5′ region of β and α genes The conserved sequences found 3′ to the β
gene to the 5′ start of the α gene in the SS104.1 clone and in the 5′ region of the β gene of the λ1.6BamHI21
clone are likely control elements of some kind. These elements and two of the microsatellites occur in the
same relative order in both regions (Figure 2).
17

What role the conserved sequences and the conservation of the relative order of these various elements
play is not known. Indication of simple sequence repeats (SSR) within coding genes and their untranslated
regions participating in regulation of gene expression are known (LI et al. 2004). Variable copy number of
the tandem repeats linked to specific genes are also thought to be in relation to an immediate response to
environmental challenges (LI et al. 2004).
However, the 5′ to 3′ order of expression of globin genes by arrangement in development in human
(DICKERSON and GEIS 1983) might also give a clue. The conserved structure may be related to a joint
expression of linked adjoining β and α genes in Atlantic cod. CHAN et al. (1997) showed that these genes
in Zebrafish are coordinately expressed. The 89 base pair long sequence, (c2 in Figure 2) contains the
CCAAT box, which is a conserved motif in globin promoters (FILIPE et al. 1999). Therefore these conserved
sequences (c1,c2,c3 in Figure 2) located 5′ to both β and α gene, up to 89 base pair of similarity (c2 in
Figure 2), might serve as binding sites for some transcpriptional activators or complexes. This hypothesis
remains to be tested.
A 5′ control region of a β gene To characterize regulation of a gene it is important to examine its flanking
regions, the 5′ region in particular. The position of an unrelated gene about 1000 base pairs upstream of the
β gene indicates that we may have cloned the most 5′ region of a cluster like the one found in Pufferfish
(GILLEMANS et al. 2003). Alternatively, our β/α gene set may be one of a number of such gene sets
which have large genetic regions between them as is the case in Zebrafish (BROWNLIE et al. 2003). In
the Zebrafish such regions may contain other genes. Both these model species and Atlantic cod as well,
are members of evolutionary lineages which are considered to have undergone a genomic duplication via
tetraploidization after the divergence of ray-finned and lobe-finned fishes (HOEGG et al. 2004). However,
independent gene or chromosome duplications are significantly more frequent in each lineage of euteleosts
than in mammals, or are lost less frequently (ROBINSON-RECHAVI et al. 2001). Thus, information about
gene duplication obtained in one fish lineage cannot be extended systematically to another (ROBINSON-
RECHAVI et al. 2001). The Atlantic cod lineage may thus be showing a third pattern of globin genes
arrangement among fish.
If, as is likely, the Atlantic cod genome contains several copies of α and β globin genes there is a
possibility that the β gene in the λ1.6BamHI21 clone is not the same locus as that in the SS104.1 PCR
derived clone. Although the c3 conserved block differs between the 5′ and 3′ region the β coding regions of
the clones are 100% identical. Thus we may have found the correct 5′ region for this particular β/α gene set
(HALLDÓRSDÓTTIR and ÁRNASON 2007). However, a final verification awaits further characterization of
genomic regions.
18

The hemoglobin system is very important for the adaptation of Atlantic cod to its environment. Knowl-
edge of the structure of α and β globin gene both coding, intergenic and control regions, is of fundamental
importance in understanding and explaining regulation of transcription of different hemoglobins in Atlantic
cod. This study is a first step towards such an understanding in Atlantic cod, a non-model organism of great
biological interest.
19
References
AGARWALL, S., V. ARYA, C. STOLLE and M. PRADHAN, 2006. A novel Indian β–thalassemia mutation
in the CACCC box of the promoter region. European Journal of Haematology 77: 530–532.
ALTSCHUL, S., W. GISH, W. MILLER, E. MYERS and D. LIPMAN, 1990. Basic local alignment search
tool. Journal of Molecular Biology 215: 403–410.
BROWNLIE, A., C. HERSEY, A. C. OATES, B. H. PAW, A. M. FALICK, H. E. WITKOWSKA, J. FLINT,
D. HIGGS, J. JESSEN, N. BAHARY, H. ZHU, S. LIN and L. ZON, 2003. Characterization of embryonic
globin genes of the zebrafish. Developmental Biology 255: 48–61.
BURGE, C. and S. KARLIN, 1997. Prediction of complete gene structures in human genomic DNA. Journal
of Molecular Biology 268: 78–94.
CHAN, F., J. ROBINSON, A. BROWNLIE, R. A. SHIVDASANI, A. DONOVAN, C. BRUGNARA, J. KIM,
B. LAU, H. E. WITKOWSKA and L. I. ZON, 1997. Characterization of adult α- and β-globin genes in
the zebrafish. Blood 89: 688–700.
COHEN, R., M. SHEFFERY and C. KIM, 1986. Partial purification of a nuclear protein that binds to the
CCAAT box of the mouse alpha 1-globin gene. Molecular and Cellular Biology 6: 821–832.
DICKERSON, R. E. and I. GEIS, 1983. Hemoglobin: Structure, Function, Evolution and Pathology. The
Benjamin/Cummings Publishing Company, Inc., Menlo Park, California.
EWING, B. and P. GREEN, 1998. Basecalling of automated sequencer traces using phred. II. error proba-
bilities. Genome Research 8: 186–194.
EWING, B., L. HILLIER, M. WENDL and P. GREEN, 1998. Base-calling of automated sequencer traces
using phred. I. accuracy assessment. Genome Research 8: 175–185.
FANG, X., H. HAN, G. STAMATOYANNOPOULOS and Q. LI, 2004. Developmentally specific role of the
CCAAT box in regulation of human γ-globin gene expression. The Journal of Biological Chemistry 279:
5444–5449.
FILIPE, A., Q. LI, S. DEVEAUX, I. GODIN, P. ROMÉO, G. STAMATOYANNOPOULOS and V. MIGNOTTE,
1999. Regulation of embryonic/fetal globin genes by nuclear hormone receptors: a novel perspective on
hemoglobin switching. The Embo Journal 18: 687–697.
20

GILLEMANS, N., T. MCMORROW, R. TEWARI, A. WAI, C. BURGTORF, D. DRABEK, N. VENTRESS,
A. LANGEVELD, K. HIGGS, D. ANDI TAN-UN, F. GROSVELD and S. PHILIPSEN, 2003. Functional
and comparative analysis of globin loci in pufferfish and humans. Blood 101: 2842–2849.
GISH, W. and D. STATES, 1993. Identification of protein coding regions by database similarity search.
Nature Genetics 3: 266–272.
GORDON, D., C. ABAJIAN and P. GREEN, 1998. Consed: A graphical tool for sequence finishing. Genome
Research 8: 195–202.
HALLDÓRSDÓTTIR, K. and E. ÁRNASON, 2007. Multiple linked β and α globin genes in Atlantic cod: a
PCR based strategy of genomic exploration. Manuscript.
HARDISON, R., 1998. Hemoglobins from bacteria to man: evolution of different patterns of gene expres-
sion. The Journal of Experimental Biology 201: 1099–1117.
HOEGG, S., H. BRINKMANN, J. TAYLOR and A. MEYER, 2004. Phylogenetic timing of the fish–specific
genome duplication correlates with the diversification of teleost fish. Journal of Molecular Evolution 59:
190–203.
HOSBACH, H., T. WYLER and R. WEBER, 1983. The Xenopus laevis globin gene family: Chromosomal
arrangement and gene structure. Cell 32: 45–53.
INGIMARSDÓTTIR, S., 2006. A study of methods for isolating, amplifying and sequencing DNA from
several species of fish. Thesis for a 3 units Research project. Department of Biology, University of
Iceland Reykjavík.
KARI, 2006. Chelex extraction. Technical report, Washington State Fisheries.
KARLSSON, S. and A. NIENHUIS, 1985. Developmental regulation of human globin genes. Annual Review
of Biochemistry 54: 1071–1108.
LI, Y., A. KOROL, T. FAHIMA and E. NEVO, 2004. Microsatellites within genes: Structure, function, and
evolution. Molecular Biology and Evolution 21: 991–1007.
PARADIS, E., K. STRIMMER, J. CLAUDE, G. JOBB, R. OPGEN-RHEIN, J. DUTHEIL, Y. NOEL and
B. BOLKER, 2005. ape: Analyses of Phylogenetics and Evolution. R package version 1.6.
R DEVELOPMENT CORE TEAM, 2006. R: A Language and Environment for Statistical Computing. R
Foundation for Statistical Computing, Vienna, Austria. ISBN 3-900051-07-0.
21

RICE, P., I. LONGDEN and A. BLEASBY, 2000. EMBOSS: The European Molecular Biology Open Software
Suite. Trends in Genetics 16: 276–277.
ROBINSON-RECHAVI, M., O. MARCHAND, H. ESCRIVA, P. BARDET, D. ZELUS, S. HUGHES and
V. LAUDET, 2001. Euteleost fish genomes are characterized by expansion of gene families. Genome
Research 11: 781–788.
SAMBROOK, J., E. FRITSCH and T. MANIATIS, 1989. Molecular Cloning, A Laboratory Manual. Cold
Spring Harbor Laboratory Press, New York, 2 edition.
SHIMELD, S., 1999. Gene function, gene networks and the fate of duplicated genes. Cell and Developmental
Biology 10: 549–553.
SICK, K., 1965. Hemoglobin polymorphisms of cod in the Baltic and the Danish Belt sea. Hereditas 54:
19–48.
SJAKSTE, N. and T. SJAKSTE, 2002. Structure of globin gene domains in mammals and birds. Russian
Journal of Genetics 38: 1343–1358.
WAGNER, A., F. DERYCKERE, T. MCMORROW and F. GANNON, 1994. Tail-to-tail orientation of the
Atlantic salmon alpha- and beta-globin genes. Journal of Molecular Evolution 38: 28–35.
XIANGDONG, F., H. HEMEI, S. GEORGE and L. QILIANG, 2004. Developmentally specific role of the
CCAAT box in regulation of human γ-globin gene expression. Journal of Biological Chemistry 279:
5444–5449.
ZHANG, J., 2003. Evolution by gene duplication: an update. Trends in Ecology and Evolution 18: 292–299.
ZHANG, Z., S. SCHWARTZ, L. WAGNER and W. MILLER, 2000. A greedy algorithm for aligning DNA
sequences. Journal of Computational Biology 7: 203–214.
22

34
Multiple Linked β and α Globin Genes
in Atlantic Cod: a PCR Based
Strategy of Genomic Exploration
(Manuscript 2)

Multiple Linked β and α Globin Genes in Atlantic Cod: a PCR
Based Strategy of Genomic Exploration
Katrín Halldórsdóttir and Einar Árnason
Institute of Biology
University of Iceland
Sturlugata 7
Reykjavík
Iceland
Received
Keywords: Atlantic cod, Gadus morhua, β, α, genomic exploration
Address for correspondence:
------------------------------------------------------------------
Katrín Halldórsdóttir [email protected]
Institute of Biology
University of Iceland office: (354)-525-4606
Sturlugata 7 lab: (354)-525-4606
101 Reykjavik, Iceland fax (354)-525-4069
------------------------------------------------------------------
Manuscript of February 19, 2007
Running title: Multiple β and α Globin Genes in Cod
1

Contents
Abstract
Atlantic cod, Gadus morhua, lives in a variety of environments where oxygen transport is of great
importance for individual fitness. Allozyme variation in Atlantic cod hemoglobins shows various signs
of natural selection. We report here a genomic exploration of globin genes in this non-model organism.
We apply a PCR based strategy with a strict criterion of phylogenetically informative sites to estimate
the number of linked β and α globin genes. We estimate PCR error rate by PCR of cloned DNA and
recloning and by analysis of singleton variable sites. Based on the error rate we exclude variable sites
so that the remaining variation meet successively stricter criteria of doubleton and triplet variable site.
Applying these criteria we show that there are ten clusters of linked β/α globin genes in the genome of
Atlantic cod. Six variable amino acid changes in both genes were found to be in linkage disequilibrium
with silent nucleotide substitutions, two in the β gene and four in the α gene. A phylogenetic tree, based
on our strictly phylogenetically informative sites among 57 clones from 19 individuals, is split into two
major branches by the second amino acid change in the β gene. This change is supported by extensive
linkage disequilibrium between the amino acid change and numerous other phylogenetically informative
nucleotide sites. We discuss that the different gene sets observed in the genome of Atlantic cod may
represent different loci encoding different globins and may also represent allelic variation at some loci.
Keywords: Hemoglobin variability, PCR errors, β/α globin genes, genomic exploration, linkage
disequilibrium
Introduction
For decades allozyme variation in Atlantic cod, (Gadus morhua), hemoglobin has been used for inference
about population structure. SICK (1965) described a system consisting of two major zones of hemoglobin,
HbI and HbII, using the technique of agar gel electrophoresis in Smithies buffer. The HbI zone shows
variation interpreted genetically as a polymorphism with a pair of co-dominant alleles giving rise to HbI-
1/1, HbI-2/2 homozygotes and HbI-1/2 heterozygotes. On the molecular level this appeared to be a simple
single-locus two-allele polymorphism. By applying the more sensitive technique of iso-electric focusing
to hemoglobin isoforms (BRIX et al. 2004; FYHN et al. 1994) patterns of at least five major zones of
hemoglobins are found with several minor zones as well. Rare hemoglobin patterns have been detected
from the beginning of hemoglobin studies. FRYDENBERG et al. (1965) described several rare hemoglobin
patterns ranging in frequency from 0.5% to 2% in the Barents Sea and 2.5% in Newfoundland and Iceland
2

and even much higher or about 10% in English and Scottish cod (FRYDENBERG et al. 1965). These rare
patterns have been interpreted (MANWELL and BAKER 1970) to arise due to variation in a polypeptide
chain, which is thought to be common to both the HbI (major) and HbII (minor) zones of FRYDENBERG
et al. (1965).
KARPOV and NOVIKOV (1980) studied reaction norms of hemoglobin genotypes in relation to temper-
ature in Atlantic cod. KARPOV and NOVIKOV (1980) and BRIX et al. (1998) showed that oxygen affinity
of hemoglobin is higher for HbI-2/2 homozygotes at low temperatures (< 10◦C) and for HbI-1/1 cod, for
some blood pH levels, at high temperatures (> 14◦C). Heterozygotes are generally found to have oxygen
affinity values intermediate between the two homozygotes. Extending these observations PETERSEN and
STEFFENSEN (2003) experimentally determined a behavioral response and temperature preference of ju-
venile Atlantic cod with different hemoglobin types under normoxia and mild hypoxia. They found that,
when given a choice, HbI-2/2 cod preferred 8.2 ± 1.5◦C while HbI-1/1 cod preferred 15.4 ± 1.1◦C. They
further showed that under hypoxia (35% oxygen saturation) HbI-1/1 cod preferred a lower temperature of
9.8± 1.8◦C. Thus genetic variation of hemoglobin in Atlantic cod shows complex reaction norms (GUPTA
and LEWONTIN 1982) to various environmental factors.
For fish, organisms which live in water, individual fitness depends on interactions of genes and various
environmental factor. For example, the capacity of maintaining neutral buoyancy of the body at different
depths in the water can be a problem. This problem is solved with a swim bladder and is controlled with
special type of hemoglobins. Root effect (ROOT 1931) hemoglobins can deliver oxygen to an organ con-
taining a high partial pressure of oxygen. Root effect hemoglobins deliver oxygen into the swim bladder
(BERENBRINK et al. 2005). Vision in fish having an avascular retina is another problem, in particular vision
under low light conditions such as at great depths, and the retina of fish eye has high demand for oxygen
(PELSTER and DECKER 2004). In Atlantic salmon, 17 electrophoretically distinct haemoglobin proteins
have been characterized, grouped according to their migration towards anode and cathode as anodal or
cathodal proteins. Expression of cathodal proteins increases with growth. Non-Bohr hemoglobin is one of
the cathodal proteins, a hemoglobin for which pH does not affect O2 affinity. Such multiple haemoglobin in
fish are quite common (MCMORROW et al. 1997). However, the developmental regulation of their expres-
sion is not known as in higher vertebrates (MCMORROW et al. 1997).
It is not known which of the multiple hemoglobin isoforms in Atlantic cod, mentioned above, are the
Root effect hemoglobins, which are normal Bohr effect hemoglobin, or which are important at various de-
3

velopmental stages. The various different environmental conditions which an Atlantic cod experiences in its
lifespan from larvae to adult is likely met with a variety of hemoglobins. The genetic polymorphism found
in the hemoglobin also is clearly related to various environmental condition. These environmental chal-
lenges are likely met at the genetic level by various structural elements, control elements or both. Clearly,
understanding how expression of different isoforms is regulated is of great importance from physiological
and ecological perspectives.
Model organisms are an extensively studied set of species of great importance for understanding of vari-
ous topics in biology. Many important methods derive from studies of model organisms and for many model
organisms complete genomic sequence is known. However, many organism have biological features which
are not found in any model organism which, however, are of great interest. For example the heterogenous
environment which Atlantic cod live in and its high variance in offspring number, likely due to selective
forces (ÁRNASON 2004), makes it an interesting organism for studying fitness and natural selection. The
allozyme research on hemoglobin in Atlantic cod (e.g. FRYDENBERG et al. 1965; PETERSEN and STEF-
FENSEN 2003; SICK 1965) give a strong indication of natural selection at work at this hemoglobin locus.
Therefore, we thought it of interest to study such a system in Atlantic cod applying a genomic perspective.
In our previous study (HALLDÓRSDÓTTIR and ÁRNASON 2007) we report characterization of a set of
linked β and α globin genes in cod. The genes are oriented tail to head (5′to 3′) with a putative single exon
gene in intergenic region of about 1500 base pairs. In this study we report our results from a PCR based
strategy for genomic exploration estimating the number of β and α linked globin gene sets in Atlantic cod.
4

Materials and Methods
Molecular work All molecular work, PCR, sequencing and cloning conditions and methods have been
described in HALLDÓRSDÓTTIR and ÁRNASON (2007). Briefly we PCR amplified approximately 3000
base pairs fragments using genomic DNA as template, TOPO-TA cloned the fragments, sequenced the
clones with a set of primers giving overlapping sequencing and base called and assembled sequences into
contigs using the Phred/Phrap/Consed software (EWING and GREEN 1998; EWING et al. 1998; GORDON
et al. 1998).
Source of genomic DNA Samples from individuals, already genotyped by iso-electric focussing tech-
nique, were obtained from Professor Jarle Mork at the University of Throndheim. The HbI hemoglobin
shows variation considered to be a polymorphism with a pair of co-dominant alleles (SICK 1965). The
homozygous genotypes HbI–1/1 and HbI–2/2 and a heterozygote genotype HbI–1/2 were named after their
relative movements in agar gel electropheresis: SS (slow slow), FF (fast fast) and FS (fast slow) respectively.
A PCR based strategy of genomic exploration Approximately a 3000 base pairs PCR product was am-
plified using conserved primers of a linked β and α gene set (HALLDÓRSDÓTTIR and ÁRNASON 2007)
from a number of individuals already genotyped for the HbI (Table 1). PCR products were cloned into a
pCR R©4-TOPO vector (Invitrogen). Several clones were derived from three individuals (twelve from an FF,
eleven from an SS, and twelve from an FS individual). In addition 2–4 clones were derived from a few indi-
viduals and a single clone was derived from each of several other individuals (Table 1). We fully sequenced
clones from seven FF individuals, six SS individuals and six FS individuals, total 57 clones from nineteen
individuals (Table 1).
Potential PCR and cloning errors There was a potential for two kinds of errors occuring in the PCR
and cloning employed in this study. First, although we used a pfu proof-reading polymerase, there never-
theless exists a possibility for the polymerase to insert incorrect nucleotides in the molecules which were
later cloned and sequenced. Second, the PCR elongation step may be terminated prematurely generat-
ing a molecule which might prime another template in the next PCR round. This would lead to chimeric
molecules. To analyse the variation found among different clones of the same or different individuals, the
possibility of errors made in PCR must be considered. To evaluate and estimate the first kind of error rate
in PCR and cloning procedure we took DNA from a clone and used as a template in a new PCR. We then
5

cloned the PCR products and sequenced a single clone (Figure 1). PCR conditions were the same between
original and repeat except for the source of DNA. We did this for seven clones and thus had seven pairs of
sequences from original and repeat clones. The differences between the original and repeat sequences of
each pair are due to errors in PCR and cloning. We also calculated the PCR error rate from singletons found
among clones. To study the second kind of error we inspected the sequences generated to look for signs of
chimeric molecules as reported in results.
A strict criterion for phylogenetically informative sites To evaluate the polymorphism seen among
clones of each individual as well as among individuals strict criteria were used. To be considered a phy-
logenetically (parsimony) informative site each nucleotide or an amino acid that varied from the rest had
to appear at least in two individuals thus being derived from at least two seperate PCR and cloning events.
A variable site with three or more different base pairs was also taken as phylogenetically informative site
(nucleotide position 2585 in Table 3 for example). A variant observed in two or more clones of the same
individual was not regarded as phylogenetically informative. Phylogenetically informative sites were ac-
quired using MEGA (KUMAR et al. 2004) and the results edited to conform to our strict criteria before being
submitted to further analysis. In addition even stricter criteria were used for variant having to appear in three
or more individuals thus being derived from three or more PCR reactions.
Data analysis Sequence data of PCR and cloned β/α gene sets were analysed with the Phred/Phrap/-
Consed software (EWING and GREEN 1998; EWING et al. 1998; GORDON et al. 1998) which calls bases,
calculates quality values and assembles reads into contigs. We used CLUSTALW (THOMPSON et al. 1994)
under nedit for alignments of both nucleotides and amino acids. We blasted the sequences using blastn
for nucleotides and blastx for coding sequences to look for similarities (http://www.ncbi.nlm.
nih.gov/BLAST/). Sequences used for comparison were for G. morhua (accession numbers: 2154747,
2154749, 2154750, 2154751, 2154752, 2597904), deposited in GenBank by Tipping and Birley and protein
sequences in VERDE et al. (2006).
GENSCAN (BURGE and KARLIN 1997) was used to predict exons and introns (see HALLDÓRSDÓTTIR
and ÁRNASON 2007) for details. The DNAPARS, DNAML and DNADIST and NEIGHBOR programs from
the PHYLIP package were used to make parsimony, maximum likelihood and distance trees (FELSENSTEIN
2002). Variation in tandem repeat copy number among genotypes evaluated with etandem (RICE et al.
2000) was tested with an ANOVA. Nucleotide diversity (Π) and number of segregating sites (S) were es-
6

timated along the sequence in a sliding window of 100 nucleotides and step size of 50 nucleotides using
DnaSP (ROZAS et al. 2003). This was done for all 57 original clones. This was also done for each pair
of the seven pairs of original and repeat clones made for evaluation of PCR error rate. The average of the
seven pairs was compared with the values of the original clones. Linkage disequilibrium (LEWONTIN and
KOJIMA 1960) among sites, or the non-random association between variants at different variable sites, was
estimated with Fisher’s exact test using DnaSP (ROZAS et al. 2003). Bonferroni adjustment for multiple test
(RICE 1995) was applied.
Table 1: Names and numbers of 19 genotyped individuals and their clones.
FF Individual ClonesFF127 FF127.1 FF127.2 FF127.3 FF127.4 FF127.5 FF127.7
FF127.8 FF127.9 FF127.10 FF127.11 FF127.12 FF127.13FF4 FF4.1 FF4.2 FF4b.1 FF4b.2FF10 FF10.1FF16 FF16.1FF20 FF20.1FF23 FF23.1FF24 FF24.1SS Individual ClonesSS103 SS103.1 SS103.3 SS103.4 SS103.5 SS103.6 SS103.7
SS103.8 SS103.10 SS103.11 SS103.12 SS103.13SS51 SS51.1SS104 SS104.1SS129 SS129.1SS130 SS130.1SS131 SS131.1FS Individual ClonesFS113 FS113.1 FS113.2 FS113.3 FS113.4 FS113.5 FS113.6
FS113.7 FS113.9 FS113.10 FS113.11 FS113.12 FS113.13FS14 FS14.1FS36 FS36.1 FS36.2FS43 FS43.1 FS43.2FS54 FS54.1 FS54.2FS82 FS82.1
7

0 500 1000 1500 2000 2500 3000
0.00
00.
020
Nucleotide position
Pi
0 500 1000 1500 2000 2500 3000
0.00
00.
020
Nucleotide position
Mea
n P
i
0 500 1000 1500 2000 2500 3000
Nucleotide position
β α
Figure 1: Nucleotide diversity on nucleotide position. (a) Nucleotide diversity Π estimated in a slidingwindow of 100 nucleotides with a 50 nucleotides step size over the 3000 base pairs linked β and α seqmentamong all clones. (b) Mean Π between original and repeat clone over the seven pairs of original andrepeats in the study of errors generated during PCR and cloning. Estimated in a sliding window the sameas in a. (c) A schematic of predicted exons, introns and intergenic region of the 3000 base pairs fragment(HALLDÓRSDÓTTIR and ÁRNASON 2007).
8

0 500 1000 1500 2000 2500 3000
48
12
Nucleotide position
S
0 500 1000 1500 2000 2500 3000
05
1015
Nucleotide position
Mea
n S
0 500 1000 1500 2000 2500 3000
Nucleotide position
β α
Figure 2: Segregating sites (S) on nucleotide position. (a) S was estimated in a sliding window of 100nucleotides with a 50 nucleotides step size for all nucleotides of a 3000 base pairs linked β and α fragmentamong all clones. (b) S was estimated for the same fragment between pairs of original and repeat clone inthe study of PCR errors. The diagram shows mean S over the seven pairs. (c) A schematic of predictedexons, introns and intergenic regions of the 3000 base pairs fragment (HALLDÓRSDÓTTIR and ÁRNASON
2007).
9

Results
Estimates of PCR errors Nucleotide diversity, Π, is contingent on frequency of different nucleotides at
a position whereas the parameter segregating site, S, is not. Nucleotide diversity Π estimated in a sliding
window was an order of magnitude higher among the original clones than between original and repeat clones
of the pairs of the PCR error study (Figure 1). Peaks of nucleotide diversity seen among the original clones
were not seen between the original and repeat pairs (Figure 1). In particular nucleotide diversity peaked at
nucleotide positions 400–800 in exons 2 and 3 and 3′untranslated region of the β gene (Figure 1).
The diversity seen between the original and repeat pairs was roughly equal over the 3071 base pairs.
This was an estimate of PCR errors (Figure 1). Segregeting sites did not show peaks but were more even
over the 3071 base pair fragment than Π. Between segregating sites of original clone and mean difference
among the seven pairs and repeat were an order of magnitude differences (Figure 2). To further evaluate that
our data represented variation and not PCR errors the exact error rate was calculated. There were altogether
25 variables among all seven original and repeat pairs or on average 3.57 variable sites in the 3071 base
pairs. Thus 3.57/3071 = 1.2 × 10⁻³ was the PCR error rate per base pair in the 3071 base pairs long
fragment. The probabilty of two such events to happen in two independent PCR from two individuals was
1.2 × 10−3 × 1.2 × 10−3 = 1.44 × 10⁻⁶. Thus a predicted number of variable sites because of same PCR
errors in two individuals were 0.004 sites out of 3071. The probability of the same error to occur in three
individuals was 1.728×10⁻⁹ and the predicted number of sites with the same error in 3071 was 5.1×10⁻⁶.
If the PCR error rate was ten times higher the probability of two independent events was 1.4× 10⁻⁴ or 0.4
base pair in 3029 base pairs. The probability for the same PCR error to happen in three independent PCR
from three individual was 1.728× 10−06 or 0.005 wrong base pairs.
Another way to estimate the PCR error rate was to look at the observed variation among all the clones.
The alignment of of all 57 clones was 3071 base pairs. A total of 399 segregating sites were found. Of
these 133 resulted from length variation of microsatellites among individuals. Of the 266 remaining sites,
210 were singletons found in a single clone or in clones from a single individual, 56 were doubletons found
in two or more individuals (Table 3) and of these 36 were triplets found among three or more individuals
(Table 4, Figure 4). Assuming that singletons represent errors the PCR error rate was 210/2938 (3071−133
variable sites because of microsatellite length variation) or 7.1 × 10⁻² single base pair PCR substitution
error. Therefore, 7.1× 10−2 × 7.1× 10−2 = 5.1× 10⁻³ was the probability of the same PCR error in two
independent PCR reactions, or an expectation of 15 doubleton base pair substitutions in the 2938 nucleotide
10

sites. The probability for three independent PCR errors was 3.7× 10⁻⁴ or an expectation of one triplet base
substitution of the 2938 nucleotide sites. The PCR error rate was 60 times higher by this method compaired
to the method of comparing original and repeat pairs.
Table 2: Frequency of variable sites among singletons, doubletons and triplets.
Transitions TransversionsVariable site g:a a:g c:t t:c c:a a:c t:a a:t t:g c:g g:c g:tSingleton 15 75 24 71 4 6 3 7 5Doubleton 6 11 11 9 5 2 3 4 2 2 1Triplets 4 8 7 1 4 2 2 4 1 2 1
Singletons refers to variable sites found in a single or single individual thus representing a single PCR.
Doubletons refers to variable sites found in two or more individuals, thus representing two separate PCR.
Triplets refers to variable sites found among three or more individuals thus representing three PCR reactions.
Transitions/transversions ratio in singletons were 185/25 or 12% transversions. Transitions/transversions
ratio in singletons/doubletons were 185/25, 37/19 respectively (Table 2). The difference was highly signif-
icant (X2 = 13.98, df = 1, p = 1.8 × 10⁻⁴). Transitions/transversions ratio in singletons/triplets were
185/25, 20/16 respectively (Table 2). Again, the difference was highly significant (X2 = 21.14, df =
1, p = 4.26× 10⁻⁶).
Chimeric sequences (mimicking in vitro recombination) could also have occured during DNA amplifica-
tion. Chimeras are PCR artifacts resulting from a prematurely terminated PCR product when it reanneals to a
different template DNA and is elongated to completion based on this second parental sequence (GONZALEZ
et al. 2005). We inspected the data to look for features indicating this. Two instances had the possibility of
being of this kind. In Figure 3 the FF127.12 in Cluster 2 and the SS103.11 in Cluster 5 shared the amino
acid R instead of K (labelled * in Figure 3). Similarily the FF127.4 in Cluster 2 and FS43.2 in Cluster 5
had the amino acid P in common instead of L (labelled ** in Figure 3). An inspection of nucleotide sites in
Table 3, we see that in order to account for the data in terms of chimeric sequences, a break off or premature
termination must have happend after the nucleotide number 2297 for FF127.4/FS43.2 (** in Figure 3) and at
position 1620 or higher for FF127.12/SS103.11 (* in Figure 3). We found no other obvious signs of possible
chimeric sequences in our data.
11

Table 3: Doubleton phylogenetically informative sites of an ap-
proximately 3 kilobase β/α globin gene region among 57 cloned
contigs from genomic DNA of Atlantic cod. FF, FS, and SS re-
fer to HbI genotypes; numbers after genotype refer to individual;
number after dot refer to a clone from that individual. Phyloge-
netically informative sites are defined by a strict criterion of inde-
pendence of being found in clones from two or more separate in-
dividuals, thus derived from two separate PCR and cloning events.
e and i in boxhead refer to exon and intron and number below for
exon or intron number. Capital letters refer to amino acid variation
and s to silent sites, - to intron variation. Site numbers are read
vertically, the first one is number 47, indicated starting at 5′end.
Cluster refers to cluster in Figure 3
Segregating site
β gene Intergenic region α gene
eeeeee i i eeee3 ee i i e e i i i e
122222223333 ′ 11112 22223
Tsssss - - ssEsu sT- -YK- - -L
1111111111111111111122222222 22222
23334455666677777788990111222345555566779900223455 68888
416792245012706777903374048266370015502253711497738 50117
Clone 776810992492678123881659344338338910230007205576365 10133
Cluster 1
FF127.1 cgcc t caacc t cggcccac t agcgt t a tgga t ccaagagt t aaagcaaca a a t tg t
FF4b.1 . . . . . . . . . . . . . . . . . . . . . . . . . . . . . . . . . . . . . . . c . . . . . . . . . . . . . . . .
Cluster 2
FF127.2 . a . . c . . . t . . . . . . . . . . . . . . . . . . . a . . . . . . . . . . . . . . . . . . . . . . . . . . .
FF127.7 . a . . c . . . t . . . . . . . . . . . . . . . . . . . a . . . . . . . . . . . . . . . . . . . . . . . . . . .
Continued on next page
12

Table 3: Continuation
Segregating site
β Intergenic region α
eeeeee i i eeee3 ee i i e e i i i e
122222223333 ′ 11112 22223
Tsssss - - ssEsu sT- -YK- - -L
1111111111111111111122222222 22222
23334455666677777788990111222345555566779900223455 68888
416792245012706777903374048266370015502253711497738 50117
Clone 776810992492678123881659344338338910230007205576365 10133
FF16.1 . a . . c . . . t . . . . . . . . . . . . . . . . . . . a . . . . . . . . . . . . . . . . . . . . . . . . . . .
FF127.10 . a . . c . . . t . . . . . . . . . . . . . . . . . . . a . . . . . . . . . . . . . . . . . . . . . . . . . . .
FF127.13 . a . . c . . . t . . . . . . . . . . . . . . . . . . . a . . . . . . . . . . . . . . . . . . g . . . . . . . .
FF127.3 . a . . c . . . t . . . . . . . . . . . . . . . . . . . a . . . . . . . . . . . . . . . . . . . . . . . . . . .
FF127.12 . a . . c . . . t . . . . . . . . . . . . . . . . . . . a . . . . . . . . . . . . . . . . . . . . . . g . . . .
FF127.4 . a . . c . . . t . . . . . . . . . . . . . . . . . . . a . . . . . . . . . . . . . . . . . . . . . . . . . . c
FF127.8 . a . . c . . . t . . . . . . . . . . . . . . . . . . . a . . . . . . . . . . . . . . . . . . . . . . . . . . .
Cluster 3
SS131.1 . a . . c . . . t . . . . . . . . . t . . . . . . . . . a . . . . . . . . . . . . . . . . . . . . . . . . . . .
FF10.1 . a . . c . . . t . . . . . . . . . t . . . . . . . . . a . . . . . . . . . . c . . . . . . . . . . . . . . . .
FS113.10 . a . . c . . . t . . . . . . . . . t . . . . . . . . . a . . . . . . . . . . . . . . . . . . . . . . . . . . .
FF23.1 . a . . c . . . t . . . . . . . . . t . . . . . . . . . a . . . . . . . . . . . . . . . . . . . . . . . . . . .
SS130.1 . a . . c . . . t . . . . . . . . . t . . . . . . . . . a . . . . . . . . . . . . . . . . . . . . . . . . . . .
Cluster 3a
SS51.1 aa . . c . c . t . . . . . . . . . t . . . . . . . . . a . . . . . . . . . . . . . . . . . . . . . . . . . . .
Cluster 4
FS54.1 . a . . c . c . t . . . . . . . . . t . . . . c . c . . a . . . . . . . . . . . . . . . . . . . . . . . . ca .
FS54.2 . a . . c . c . t . . . . . . . . . t . . . . c . c . . a . . . . . . . . . . . . . . . . . . g . . . . . . a .
Continued on next page
13

Table 3: Continuation
Segregating site
β Intergenic region α
eeeeee i i eeee3 ee i i e e i i i e
122222223333 ′ 11112 22223
Tsssss - - ssEsu sT- -YK- - -L
1111111111111111111122222222 22222
23334455666677777788990111222345555566779900223455 68888
416792245012706777903374048266370015502253711497738 50117
Clone 776810992492678123881659344338338910230007205576365 10133
SS103.3 . a . . c . cgt . . . . . . . . . t . . . . c . c . . a . . . . . . . . . . . . . . . . . . . . . . . . . a .
Cluster 5
FF4.1 . a . . c . c . t . . . . . . . . . t . . . . c . . . caa . a . . . . a- . . . . . . . . . . . . . . . . . .
FF4b.2 . a . . c . cgt . . . . . . . . . t . . . . c . . . caa . a . . . . a- . . . . . . . . . t . . . . . . . .
FF4.2 . a . . c . c . t . . . . . . . . . t . . . . c . . . caa . a . . . -a- . . . . . . . . . . . . . . . . . .
SS103.1 . a . . c . c . t . . . . . . . . . t . . . . c . . . caa . a . . . . a- . . . . . . . . . . . . . . . . . .
SS103.13 . a . . c . c . t . . . . . . . . . t . . . . c . . . caa . . . . . . a- . . . . . . . .g . . . . . . . . .
FS43.2 . a . . c . c . t . . . . . . . . . t . . . . c . . . caa . a . . . . a- . . . . . . . .g . . . . . . . . c
SS103.4 . a . t c . c . t . . . . . . . . . t . . . . c . . . caa . . . . . . a- . . . . . . . . . . . . . . . . . .
SS103.6 . a . . c . c . t . . . . . . . . . t . . . . c . . . caa . . . . . . a- . . . . . . . . . . . . . . . . . .
SS103.5 . a . . c . c . t . . . . . . . . . t . . . . c . . . caa . . . . . . a- . . . . . . . . . . . . . . . . . .
SS103.8 . a . . c . c . t . . . . . . . . . t . . . . c . . . caa . . . . . . a- . . . . . . . . . . . . . . . . . .
SS103.11 . a . . c . c . t . . . . . . . . . t . . . . c . . . caa . . . . . -a- . . . . . . . . . . . . . g . . . .
SS103.12 . a . . c . c . t . . . . . . . . . t . . . . c . . . caa . . . . . . a- . . . . . . . . . . . . g . . c . .
SS103.7 . a . . c . c . t . . . . . . . . . t . . . . c . . . caa . . . . . . a- . . . . . . . . . . . . . . . . . .
Cluster 6
FF20.1 aa . . c . c . t . . . . . . . . . t . . . . c . . . ca . . . . . . . . . . . .g . . . . . . . . . . . . . .
FF24.1 . a . . c . c . t . . . . . . . . . t . . . . c . . . ca . . . . . .g . . . . .g . . . . . . . . . . . . . .
Continued on next page
14

Table 3: Continuation
Segregating site
β Intergenic region α
eeeeee i i eeee3 ee i i e e i i i e
122222223333 ′ 11112 22223
Tsssss - - ssEsu sT- -YK- - -L
1111111111111111111122222222 22222
23334455666677777788990111222345555566779900223455 68888
416792245012706777903374048266370015502253711497738 50117
Clone 776810992492678123881659344338338910230007205576365 10133
FS14.1 . a . . c . c . . . . . . . . . . . t . . . . c . . . ca . . . . . . . . . . . .g . . . . . . . . g . . . . .
Cluster 7
SS129.1 aa . . c . c . t t gg . t tg t t t . . . . cc . . . a . . . . . t - - . t . c . . . . a . . . . . . a . . .
FS43.1 aa t . c . c . t t gg . t tg t t t . . . . cc . . . a . . . . . t - - . t . c . . . . a . . . . . . a . . .
Cluster 8
FF127.5 . a t . c . c . t t gg . . tg t t t . . . . c . .g . a . . . . . t - - . . . . . . t . . . . ag . . . . . .
FF127.11 . a t . c . c . t t gg . . tg t t t . . . . c . .g . a . . . . . t - - . . . . . . t . . . . ag . . . . . .
SS103.10 . a t . c t c . t t gg . . tg t t t . . . . c . .g . a . . . . . t - - . . . . . . t . . . . ag . . . . . .
FF127.9 . a t . c . c . t t gg . . tg t t t . . . . c . .g . a . . . . . t - - . . . . . . t . . . . ag t . . . . .
FS113.6 . a t . c . c . t t gg . . tg t t t . . . . c . .g . a . . . . . t - - . . . . . . t . . . . ag . . . . . .
Cluster 9
FS113.1 . a t . c . c . t t gga . tg t t t ag . ac . . . . a . t . . . . . .g . . . . c . . . . . . . . . . . . .
FS113.7 . a t . c . c . t t gga . tg t t t ag . ac . . . . a . t . . . . . .g . . . . c . . . . . . . . . . . . .
FS113.2 . a t . c . c . t t gga . tg t t t ag . ac . . . . a . t . . . . . .g . . . . c . . . . . . . . . . . . .
FS113.4 . a t . c . c . t t gga . tg t t t ag . ac . . . . a . t . . . . . .g . . . . c . . . . . . . . . . . . .
FS113.11 . a t . c t c . t t gga . tg t t t ag . ac . . . . a . t . . . . . .g . . . . c . . . . . . . . . . . . .
FS113.9 . a t . c . c . t t gga . tg t t t ag . ac . . . . a . t . . . . - -g . . . . c . . . . . . . . . . . . .
FS113.13 . a t . c . c . t t gga . tg t t t ag . ac . . . . a . t . . . . - -g . . . . c . . . . . . . . . . . . .
FS113.12 . a t . c . c . t t gga . tg t t t ag . ac . . . . a . t . . . . - -g . . . . c . . . . . . . . . . . . .
Continued on next page
15

Table 3: Continuation
Segregating site
β Intergenic region α
eeeeee i i eeee3 ee i i e e i i i e
122222223333 ′ 11112 22223
Tsssss - - ssEsu sT- -YK- - -L
1111111111111111111122222222 22222
23334455666677777788990111222345555566779900223455 68888
416792245012706777903374048266370015502253711497738 50117
Clone 776810992492678123881659344338338910230007205576365 10133
FS113.3 . a t . c . c . t t gga . tg t t t ag . ac . . . . a . t . . . . - -g . . . . c . . . . . . . . . . . . .
FS113.5 . a t . c . c . t t gga . tg t t t ag . ac . . . . a . t . . . .g .g . . . . c . . . . . . . . . . . . .
Cluster 10
SS104.1 . a t . c . c . t t gga . tg t t t agaac . . . . a . t . a t . . .g . . . . c . a . . . . . . . . . . .
FS82.1 . a t . c . c . t t gga . tg t t t ag . ac . . . . a . t . a t . . .g . . . . c . - . . . . . . . . . . .
FS36.1 . a t t c . c . t t gga . tg t t t agaac . . . . a . t . a t . . .g . . . . c . a . . . . . . . . . . .
FS36.2 . a t . c . c . t t gga . tg t t t agaac . . . . a . t . a t . . .g . . . . c . - . . . . . . . . . . .
16

Table 4: Triplet phylogenetically informative sites of an approxi-
mately 3 kilobase β/α globin gene region among 57 cloned contigs
from genomic DNA of Atlantic cod. FF, FS, and SS refer to HbI
genotypes; numbers after genotype refer to individual; numbers
after dot refer to a clone from that individual. Phylogenetically in-
formative sites are defined by a strict criterion of independence of
being found in clones from three separate individuals, thus derived
from three separate PCR and cloning events. Numbers in boxhead
refer to nucleotide position in the 3 kilobase contigs. Nucleotide
positions are read vertically, thus first site is number 47. Site num-
bers indicated starte at 5′end.
Segregating site
1 1 1 1 1 1 1 1 1 1 1 1 1 1 2 2 2 2 2 2
3 4 5 6 6 6 6 7 7 7 7 7 8 8 9 0 1 2 2 3 4 5 5 5 5 5 6 9 9 0 0 3 4 5 5
4 6 2 5 0 1 2 7 6 7 7 7 9 0 3 7 4 8 2 6 3 7 0 0 1 5 5 0 3 7 1 1 7 7 3 8
Clone 7 6 9 2 4 9 2 6 8 1 2 3 8 8 1 5 9 4 3 8 3 3 8 9 1 0 2 3 7 2 0 5 6 3 6 5
FF127.1 CCACCTCGCCCACTACGATGATCCAAGAAAAGACAA
FF4b.1 . . . . . . . . . . . . . . . . . . . . . . . . . . . . . . . . . . . .
FF127.2 . . . T . . . . . . . . . . . . . . . . . . . . . . . . . . . . . . . .
FF127.7 . . . T . . . . . . . . . . . . . . . . . . . . . . . . . . . . . . . .
FF16.1 . . . T . . . . . . . . . . . . . . . . . . . . . . . . . . . . . . . .
FF127.10 . . . T . . . . . . . . . . . . . . . . . . . . . . . . . . . . . . . .
FF127.13 . . . T . . . . . . . . . . . . . . . . . . . . . . . . . . . . G . . .
FF127.3 . . . T . . . . . . . . . . . . . . . . . . . . . . . . . . . . . . . .
FF127.12 . . . T . . . . . . . . . . . . . . . . . . . . . . . . . . . . . . . .
FF127.4 . . . T . . . . . . . . . . . . . . . . . . . . . . . . . . . . . . . .
FF127.8 . . . T . . . . . . . . . . . . . . . . . . . . . . . . . . . . . . . .
SS131.1 . . . T . . . . . . . . T . . . . . . . . . . . . . . . . . . . . . . .
Continued on next page
17

Table 4: Continuation
Segregating site
1 1 1 1 1 1 1 1 1 1 1 1 1 1 2 2 2 2 2 2
3 4 5 6 6 6 6 7 7 7 7 7 8 8 9 0 1 2 2 3 4 5 5 5 5 5 6 9 9 0 0 3 4 5 5
4 6 2 5 0 1 2 7 6 7 7 7 9 0 3 7 4 8 2 6 3 7 0 0 1 5 5 0 3 7 1 1 7 7 3 8
Clone 7 6 9 2 4 9 2 6 8 1 2 3 8 8 1 5 9 4 3 8 3 3 8 9 1 0 2 3 7 2 0 5 6 3 6 5
FF10.1 . . . T . . . . . . . . T . . . . . . . . . . . . . . . . . . . . . . .
FS113.10 . . . T . . . . . . . . T . . . . . . . . . . . . . . . . . . . . . . .
FF23.1 . . . T . . . . . . . . T . . . . . . . . . . . . . . . . . . . . . . .
SS130.1 . . . T . . . . . . . . T . . . . . . . . . . . . . . . . . . . . . . .
SS51.1 A . CT . . . . . . . . T . . . . . . . . . . . . . . . . . . . . . . .
FS54.1 . . CT . . . . . . . . T . . . C . . . . . . . . . . . . . . . . . . .
FS54.2 . . CT . . . . . . . . T . . . C . . . . . . . . . . . . . . . G . . .
FF4.1 . . CT . . . . . . . . T . . . C . CA . A . . . . A - . . . . . . . .
FF4b.2 . . CT . . . . . . . . T . . . C . CA . A . . . . A - . . . . T . . .
FF4.2 . . CT . . . . . . . . T . . . C . CA . A . . . - A - . . . . . . . .
SS103.1 . . CT . . . . . . . . T . . . C . CA . A . . . . A - . . . . . . . .
SS103.13 . . CT . . . . . . . . T . . . C . CA . . . . . . A - . . . . . . . .
FS43.2 . . CT . . . . . . . . T . . . C . CA . A . . . . A - . . . . . . . .
SS103.4 . . CT . . . . . . . . T . . . C . CA . . . . . . A - . . . . . . . .
SS103.6 . . CT . . . . . . . . T . . . C . CA . . . . . . A - . . . . . . . .
SS103.5 . . CT . . . . . . . . T . . . C . CA . . . . . . A - . . . . . . . .
SS103.8 . . CT . . . . . . . . T . . . C . CA . . . . . . A - . . . . . . . .
SS103.11 . . CT . . . . . . . . T . . . C . CA . . . . . - A - . . . . . . . .
SS103.12 . . CT . . . . . . . . T . . . C . CA . . . . . . A - . . . . . . . G
FF20.1 A . CT . . . . . . . . T . . . C . C . . . . . . . . . G . . . . . . .
FF24.1 . . CT . . . . . . . . T . . . C . C . . . . . . G . . G . . . . . . .
FS14.1 . . C . . . . . . . . . T . . . C . C . . . . . . . . . G . . . . . . G
SS103.7 . . CT . . . . . . . . T . . . C . CA . . . . . . A - . . . . . . . .
Continued on next page
18

Table 4: Continuation
Segregating site
1 1 1 1 1 1 1 1 1 1 1 1 1 1 2 2 2 2 2 2
3 4 5 6 6 6 6 7 7 7 7 7 8 8 9 0 1 2 2 3 4 5 5 5 5 5 6 9 9 0 0 3 4 5 5
4 6 2 5 0 1 2 7 6 7 7 7 9 0 3 7 4 8 2 6 3 7 0 0 1 5 5 0 3 7 1 1 7 7 3 8
Clone 7 6 9 2 4 9 2 6 8 1 2 3 8 8 1 5 9 4 3 8 3 3 8 9 1 0 2 3 7 2 0 5 6 3 6 5
SS103.3 . . CT . . . . . . . . T . . . C . . . . . . . . . . . . . . . . . . .
FF127.5 . TCTTGG . TGTTT . . . CG . . . . . . T - - . . . T . . AG .
FF127.11 . TCTTGG . TGTTT . . . CG . . . . . . T - - . . . T . . AG .
SS103.10 . TCTTGG . TGTTT . . . CG . . . . . . T - - . . . T . . AG .
FF127.9 . TCTTGG . TGTTT . . . CG . . . . . . T - - . . . T . . AGT
FS113.6 . TCTTGG . TGTTT . . . CG . . . . . . T - - . . . T . . AG .
SS129.1 A . CTTGG . TGTTT . . . C . . . . . . . T - - . . . . . . . . .
FS43.1 ATCTTGG . TGTTT . . . C . . . . . . . T - - . . . . . . . . .
SS104.1 . TCTTGGATGTTTAGAC . . . T . AT . . . G . C . A . . . .
FS82.1 . TCTTGGATGTTTAGAC . . . T . AT . . . G . C . - . . . .
FS36.1 . TCTTGGATGTTTAGAC . . . T . AT . . . G . C . A . . . .
FS36.2 . TCTTGGATGTTTAGAC . . . T . AT . . . G . C . - . . . .
FS113.1 . TCTTGGATGTTTAGAC . . . T . . . . . . G . C . . . . . .
FS113.7 . TCTTGGATGTTTAGAC . . . T . . . . . . G . C . . . . . .
FS113.2 . TCTTGGATGTTTAGAC . . . T . . . . . . G . C . . . . . .
FS113.4 . TCTTGGATGTTTAGAC . . . T . . . . . . G . C . . . . . .
FS113.11 . TCTTGGATGTTTAGAC . . . T . . . . . . G . C . . . . . .
FS113.9 . TCTTGGATGTTTAGAC . . . T . . . . - - G . C . . . . . .
FS113.13 . TCTTGGATGTTTAGAC . . . T . . . . - - G . C . . . . . .
FS113.12 . TCTTGGATGTTTAGAC . . . T . . . . - - G . C . . . . . .
FS113.3 . TCTTGGATGTTTAGAC . . . T . . . . - - G . C . . . . . .
FS113.5 . TCTTGGATGTTTAGAC . . . T . . . . G . G . C . . . . . .
19

Figure 3: Clusters of clones (circles and ellipsis) on a maximum likelihood tree of doubleton strictly phy-logenetically informative sites among 57 clones of a 3000 base pairs β/α gene set in Atlantic cod. Boxesenclose variable amino acids. The first two variable amino acids are in β gene; last four are in α gene. * and** indicate the same amino acids in two clusters (see Table 3). -||- indicates identity with above sequence.

FF4b 1FS113 10
FS113 4FS113 12FS113 9FS113 13
FS113 5FS113 3
FS82 1FS36 2FS36 1SS104 1
FS113 7FS113 2FS113 1FS113 11
SS129 1FS43 1
SS103 10FS113 6
FF127 9FF127 5FF127 11
SS103 3FS54 2
FF24 1FS14 1
FF20 1SS103 8SS103 7SS103 5SS103 4SS103 11
FF4 2FS43 2SS103 1
FF4b 2FF4 1SS103 12
SS103 6SS103 13
FS54 1SS51 1
SS130 1SS131 1FF10 1FF23 1
FF127 12FF16 1FF127 8FF127 10FF127 3
FF127 13FF127 2FF127 7FF127 4
FF127 1
Figure 4: A maximum likelihood tree of triplet strictly phylogenetically informative sites among 57 clonesof a 3000 base pairs β/α gene set in Atlantic cod. Phylogenetically informative sites are defined by indepen-dence of being found in clones from three separate individuals, thus derived from three separate PCR andcloning events (Table 4).

Genotypes and tandem repeat Microsatellite tandem repeats were found in the intergenic region and also
5′to β gene (HALLDÓRSDÓTTIR and ÁRNASON 2007). The atg repeats showed some varation in number
among the genotypes (Table 5). A hierarchical analysis of variance showed that difference among individ-
uals were highly significant (data not shown). However, the difference in copy number among genotypes
although suggestive were not significant, perhaps because of the high variation among individuals (Table 6).
Table 5: Mean numbers of atg repeats among HbI genotypes.
Genotype FF FS SSatg. 32.5 34.6 28.5
Table 6: Hierarchical analysis of variance of the count of atg microsatellite tandem repeats.
atg tandem repeat Df SS MS F P
Among genotypes 2 336.10 168.05 3.45 0.055Among individuals within genotypes 17 827.55 48.68 11.09 8.8e-10Among clones within individuals 37 162.49 4.39
The clones from the three multiclone individuals (FF127, SS103 and FS113 (Table 1)) appeared in three
clusters each in Figure 3. Clones from all individuals were in cluster 8, most of the FF127 clones were in
cluster 2, most of the FS113 clones were in cluster 9 and most of the SS103 clones were in cluster 5.
Table 7: Distribution of clones from multiclone individuals into clusters in Figure 3.
Individual ClustersFF127 2 1 8SS103 5 4 8FS113 9 3 8
Phylogenetically informative sites Our PCR based strategy was to cast the net widely within three indi-
viduals in the hope of finding different gene sets within an individual. By then casting the net in different
individuals we hoped to find gene sets matching the different gene sets found within the three individuals.
A total of 57 clones from 19 individuals (Table 1) were fully sequenced for about 3000 base pairs frag-
ments giving reliable sequence with high quality scores (HALLDÓRSDÓTTIR and ÁRNASON 2007). We
22

used MEGA to find segregating sites and found, according to our strict criteria, phylogenetically informative
sites. There were 56 phylogenetically informative doubleton sites in this sense, 13 at the β locus and 10 at
the α locus. The remaining phylogenetically informative sites were in the intergenic region. As can be seen
in Table 3, one informative site was found in exon 1 of the β gene, five in exon 2, two in intron 2 and four
in exon 3. In the α gene two informative sites were found in exon 1, two in intron 1, two in exon 2, three in
intron 2 and one in exon 3.
Amino acid variation To analyse the polymorphism found in the coding sequences we did a comparable
comparison among amino acid variants of predicted proteins. Tables 8 and 9 show the variable amino
acids found between β and α proteins in 55 clones. Two clones, FF127.1 and FF4b.1, were left out of this
comparison because their predicted proteins were clearly different. They are discussed separately below.
In addition we compaired our protein sequences to those of Tipping and Birley and VERDE et al. (2006).
Based on our strict criteria for phylogenetically informative sites, variable amino acids were not regarded
informative unless found in at least two clones from separate individuals.
Of the 147 amino acids predicted in the β coding region, 41 amino acid residues were variable among
the clones. However, based on our strict criterion of phylogenetically informative sites only two of them
were informative in this sense. Of the 41 amino acids which were variable (Table 8), nine were sequence
specific for β globin 2 of VERDE et al. (2006). We also found five silent variable sites in exon 2 and three
in exon 3. Two phylogentically informative sites were found in intron 1. One phylogenetically informative
site was found in the 3′untranslated sequence of the predicted mRNA sequence (Table 3).
Of the 143 amino acid in the α coding region, 23 amino acid residues were variable (Table 9). Using
our strict doubleton criterion, four of them were phylogenetically informative. Amino acid number 10 in
exon 1, amino acid number 37 and 59 in exon 2, and amino acid number 102 in exon 3 (Table 3). One silent
change was found in exon 1 as well. Similarly, there were two phylogenetically informative sites in intron 1
and three in intron 2 (Table 3).
23

Table 8: Variable amino acid sites in predicted β globins among 55
clones from Atlantic cod genomic DNA PCR amplification. Also
included for reference is a sequence deposited in GenBank by Tip-
ping and Birley and sequence 2 presented by VERDE et al. (2006).
They were excluded from analysis.
Amino acid position
1 1 1 1 1 1 1 1 1 1 1 1 1 1 1
1 1 1 1 1 1 2 2 2 3 3 4 4 5 5 5 6 7 8 8 8 9 9 9 9 0 0 1 1 2 2 2 3 3 3 3 4 4 4 4
7 0 1 3 4 5 8 2 4 5 2 4 5 8 3 6 7 7 6 1 4 8 1 3 5 6 3 4 3 8 0 3 6 0 1 5 7 0 4 5 7
FF20.1 SA I NS I NE I GC I GNE L CKLDNELHGKNFVKGFDAWLVSRQH
Birley . . . . . . . . . . . . . . . . . . . . . . . . D . . . G . V . . G . RF . . E .
SS51.1 . . . . . . . . . S . . . . . . . . . . . . . . D . . . . . . . . . . . . F . . .
FF127.11 . . . T . . . . . . . . . . . . . . . . . . . . D . . . . . . . E . . . . . . . .
FS113.5 . . . T . . . . . . . V . . . . . . . . . G . . D . . . . . . . E . . . . . . . .
FS113.4 . . . T . . . . . . . . . . . . . . . . . . . . D . . . . . . . E . . . . . . . .
SS103.10 . . . T . . . . . . . . . . . . . . . . . . . . D . . . . . . . E . . . . . . . .
FS113.1 . . . T . . . . . . . . . . . . . . . . . . . . D . . . . . . . E . . . . . . . .
FS113.7 . . . T . . . . V . . . . . G . . . . . . . . . D . . . . . . . E . . . . . . . .
FS113.12 . . . T . . . . . . . . . . . . . . . . . . . . D . . . . . . . E . . . . . . . .
FS36.1 . . . T . . . . . . . . . . . . . . . . . . . . D . . . . . . . E . . . . . . . .
FS113.2 . . . T . . . G . . . . . . . . . . P . . . . . D . . . . . . . E . . . . . . . .
FS113.6 . . . T . . . . . . . . . . . . . . . . . . . . D . . . . . . . E . . . . . . . .
FS113.3 . . . T . . . . . . . . . . . . . . . . . . . . D . . . . . . . E . . . . . . . .
SS104.1 . . . T . . . . . . . . . . . . . . . . . . . . D . . . . . . . E . . . . . . . .
FS36.2 . . . T . . . . . . . . . . . . . . . . . . . . D . . . . . . . E . . . . . . . .
FS113.11 . . . T . T . . . . . . . . . . . . . . . . . RD . . . . . . . E . . . . . G . .
FF127.5 . . VT . . . . . . . . . . . . . . . . . . . . D . . . . . . . E . . . . . . . .
FF127.9 . . . T . . . . . . . . . . . . . . . . . . . . D . . . . . . LE . . . . . . . .
Continued on next page
24

Table 8: Continuation
Amino acid position
1 1 1 1 1 1 1 1 1 1 1 1 1 1 1
1 1 1 1 1 1 2 2 2 3 3 4 4 5 5 5 6 7 8 8 8 9 9 9 9 0 0 1 1 2 2 2 3 3 3 3 4 4 4 4
7 0 1 3 4 5 8 2 4 5 2 4 5 8 3 6 7 7 6 1 4 8 1 3 5 6 3 4 3 8 0 3 6 0 1 5 7 0 4 5 7
FS82.1 . . . T . . . . . . R . . . . . . . . . . . . . D . . . . . . . E . . . . . . . .
FS113.13 . . . T . . . . . . . . . . . . . . . . . . . . D . S . . . . . E . . . . . . . .
FS113.9 . . . T . . . . . . . . . . . . . . . . . . . . D . . . . . . . E . . . . . . . P
SS103.13 . . . T . . . . . . . . . . . . . . . . . . . . D . . . . . . . . . . . . . . . .
SS103.1 . . . T . . . . . . . . . . . . . . . . . . . . D . . . . . . . . . . . . . . . .
SS103.12 . . . T . . . . . . . . . . . . . . . . . . . . D . . . . . . . . . . . . . . . .
FF127.13 . . . T . . . . . . . . . . . . . . . . . . . . D . . . . . . . . . . . . . . . .
FF127.12 . . . T . . . . . . . . . . . . . . . . . . . . D . . . . . . . . . . . . . . . .
FF127.3 . . . T . . . . . . . . . . . . . . . . . . . . D . . . . . . . . . . . . . . . .
SS131.1 . . . T . . . . . . . . . . . . . . . . . . . . D . . . . . . . . . . . . . . . .
SS130.1 . . . T . . . . . . . . . . . . . . . . . . . . D . . . . . . . . . . . . . . . .
FS113.10 . . . T . . . . . . . . . . . . . . . . . . . . D . . . . . . . . . . . . . . . .
FF127.8 . . . T . . . . . . . . . . . . . . . . . . . . D . . . . . . . . . . . . . . . .
FF127.7 . . . T . . . . . . . . . . . . . . . . . . . . D . . . . . . . . . . . . . . . .
SS103.8 . . . T . . . . . . . . . . . . . . . . . . . . D . . . . . . . . . . . . . . . .
SS103.7 . . . T . . . . . . . . . . . . . . . . . . . . D . . . . . . . . . . . . . . . .
SS103.6 . . . T . . . . . . . . . . . . . . . . . . . . D . . . . . . . . . . . . . . . .
SS103.5 . . . T . . . . . . . . . . . . . . . . . . . . D . . . . . . . . . . . . . . . .
SS103.4 . . . T . . . . . . . . . . . . . . . . . . . . D . . . . . . . . . . . . . . . .
FF127.10 . . . T . . . . . . . . . . . . . . . . . . . . D . . . . . . . . . . . . . . . .
FF10.1 . . . T . . . . . . . . . . . . . . . . . . . . D . . . . . . . . . . . . . . . .
FF23.1 . . . T . . . . . . . . . . . . . . . . . . . . D . . . . . . . . . . . . . . . .
FF16.1 . . . T . . . . . . . . . . . . . . . . . . . . D . . . . . . . . . . . . . . . .
FF4.2 . . . T . . . . . . . . . . . . . . . . . . . . D . . . . . . . . . . . . . . . .
Continued on next page
25

Table 8: Continuation
Amino acid position
1 1 1 1 1 1 1 1 1 1 1 1 1 1 1
1 1 1 1 1 1 2 2 2 3 3 4 4 5 5 5 6 7 8 8 8 9 9 9 9 0 0 1 1 2 2 2 3 3 3 3 4 4 4 4
7 0 1 3 4 5 8 2 4 5 2 4 5 8 3 6 7 7 6 1 4 8 1 3 5 6 3 4 3 8 0 3 6 0 1 5 7 0 4 5 7
FF4.1 . . . T . . . . . . . . . . . . . . . . . . . . D . . . . . . . . . . . . . . . .
FS14.1 . . . T . . . . . . . . . . . . . . . . . . . . D . . . . . . . . . . . . . . . .
FF127.2 . . . T . . . . . . . . . S . . . . . . . . . . D . . . . . . . . . . . . . . . .
SS103.3 . . . T . . . . . . . . . . . . . . . G . . . . D . . . . . . . . . . . . . . . .
FF4b.2 . . . T . . . . . . . . . . . . . . . . . . . . DR . . . . . . . . . . . . . . .
SS103.11 . . . T . . . . . . . . . . . . . R . . . . . . D . . . . . . . . . . . . . . . .
FF127.4 . . . T . . . . . . . . . . . . . . . . . . P . D . . . . . . . . . . . . . . . .
FS43.2 . . . T . . . . . . . . . . . . . . . . . . . . D . . . . E . . . . . . . . . . .
FS54.1 . . . T . . . . . . . . . . . . . . . . S . . . D . . . . . . . . . . . . . . . .
FS54.2 . . . T . . . . . . . . . . . . . . . . . . . . D . . I . . . . . . . . . . . . .
FF24.1 N . . T . . . . . . . . . . . . . . . . . . . . D . . . . . . . . . . . . . . . .
FS43.1 . . . . . . . . . . . . . . . . . . . . . . . . D . . . . . . . E . . . . . . . .
SS129.1 . . . . . . . . . . . . . . . . . . . . . . . . D . . . . . . . E . . . . . . . .
Verde2 ET . . D . T . . . . . A . . MA . . . . . . . D . . . . . . . . . V . . . . . .
26

Table 9: Variable amino acid sites in predicted α globins among 55
clones from Atlantic cod genomic DNA PCR amplification. Also
included is a sequence deposited in GenBank by Tipping and Bir-
ley and sequence 2 presented by VERDE et al. (2006)
Amino acid position
11 1 1 1 1 1 1 1
1 2 2 3 3 4 4 4 5 6 8 9 9 00 0 1 2 2 2 3 3
4 0 6 9 0 7 0 4 8 9 4 7 5 9 02 6 4 1 3 5 4 5
FF127.10 STGALYTFKK I EVNFLC I LVVLA
FF127.11 . . . . . . . . . . . . . . S . . . P . . . .
SS103.4 . . . . . . A . . . . . . . . . . . P . . . .
FS113.4 . . . T . . . . . . . . . . . . . . P . . . .
SS51.1 . . . . . . . . . . . . I . . . . . P . . . .
FF23.1 . . . . . . . . . . . . . . . . . . P . A . .
FF127.4 . . . . . . . . . . . . . . . P . . P . . . .
FF127.7 . . . . . . . S . . . . . . . . . . P . . . .
SS129.1 T . . . . . . . . . . . . . . . . . P . . . .
SS130.1 . . . . . . . . . . . . . . . . . VP . . . .
FF127.12 . . . . . . . . . R . . . . . . . . P . . . .
SS103.11 . . . . . . . . . R . . . . . . . . P . . . .
FF16.1 . . . . . . . . . . . . . . . . R . P . . . .
FF127.2 . . R . . . . . . . . . . . . . . . P . . . .
FF127.5 . . . . . . . . E . . . . . . . . . P . . . .
FS14.1 . . . . . C . . . . . . . . . . . . P . . . .
SS103.12 . . . . . C . . . . . . . . . . . . P . . . .
FF127.9 . . . . . F . . . . . . . . . . . . P . . . .
FF20.1 . . . . P . . . . . . . . . . . . . P . . . .
FF4.2 . . . . . . . . . . . G . . . . . . P . . . .
Continued on next page
27

Table 9: Continuation
Amino acid position
11 1 1 1 1 1 1 1
1 2 2 3 3 4 4 4 5 6 8 9 9 00 0 1 2 2 2 3 3
4 0 6 9 0 7 0 4 8 9 4 7 5 9 02 6 4 1 3 5 4 5
FS36.1 . . . . . . . . . . . . . . . . . . P . . . T
Birley . . . . . . . . . . T . . . . . . . P . . . .
Verde2 . . . . . . . . . . T . . . . . . . P . . . .
SS103.13 . . . . . . . . . . T . . . . . . . P . . . .
FF127.13 . A . . . . . . . . . . . . . . . . P . . . .
FS54.2 . A . . . . . . . . . . . . . . . . P . . . .
FF4b.2 . S . . . . . . . . . . . . . . . . PA . . .
FF127.1 . . . . . . . . . . . . . . . . . . P . . . .
SS103.10 . . . . . . . . . . . . . . . . . . P . . . .
FS82.1 . . . . . . . . . . . . . . . . . . P . . . .
FS54.1 . . . . . . . . . . . . . . . . . . P . . . .
FS43.1 . . . . . . . . . . . . . . . . . . P . . . .
FS36.2 . . . . . . . . . . . . . . . . . . P . . . .
FS113.9 . . . . . . . . . . . . . . . . . . P . . . .
FS113.7 . . . . . . . . . . . . . . . . . . P . . . .
FS113.6 . . . . . . . . . . . . . . . . . . P . . . .
FS113.5 . . . . . . . . . . . . . . . . . . P . . . .
FS113.3 . . . . . . . . . . . . . . . . . . P . . . .
FS113.2 . . . . . . . . . . . . . . . . . . P . . . .
FS113.1 . . . . . . . . . . . . . . . . . . P . . . .
FS113.13 . . . . . . . . . . . . . . . . . . P . . . .
FS113.12 . . . . . . . . . . . . . . . . . . P . . . .
FS113.11 . . . . . . . . . . . . . . . . . . P . . . .
FS113.10 . . . . . . . . . . . . . . . . . . P . . . .
Continued on next page
28

Table 9: Continuation
Amino acid position
11 1 1 1 1 1 1 1
1 2 2 3 3 4 4 4 5 6 8 9 9 00 0 1 2 2 2 3 3
4 0 6 9 0 7 0 4 8 9 4 7 5 9 02 6 4 1 3 5 4 5
FF127.8 . . . . . . . . . . . . . . . . . . P . . . .
FF10.1 . . . . . . . . . . . . . . . . . . P . . . .
SS103.3 . . . . . . . . . . . . . . . . . . P . . . .
SS103.1 . . . . . . . . . . . . . . . . . . P . . . .
FF4.1 . . . . . . . . . . . . . . . . . . P . . . .
FF24.1 . . . . . . . . . . . . . . . . . . P . . . .
FF127.3 . . . . . . . . . . . . . . . . . . P . . . .
SS104.1 . . . . . . . . . . . . . . . . . . P . . . .
SS103.8 . . . . . . . . . . . . . . . . . . P . . . .
SS103.7 . . . . . . . . . . . . . . . . . . P . . . .
SS131.1 . . . . . . . . . . . . . . . . . . P . . . .
SS103.5 . . . . . . . . . . . . . . . . . . P . . . .
SS103.6 . . . . . . . . . . . . . S . . . . P . . Q .
29

Variable gene prediction Most of the cloned contigs analysed showed the same pattern of gene structure
in GENSCAN prediction. They showed a linked β and α gene and a putative single exon gene in the intergenic
region. Both globin genes were comprised of three exons. Promoters with CCAAT and TATA boxes were
found for all three genes (information about β gene promoters HALLDÓRSDÓTTIR and ÁRNASON 2007).
The structure of the region is extensively described in HALLDÓRSDÓTTIR and ÁRNASON (2007). In this
study we analysed clones from several individuals and some variation from this main pattern was found
which.
The FF4b.1 clone had a single base pair deletion in exon 2 in the α gene which caused a shift in reading
frame in amino acid number 79. The translation continued to amino acid number 93 where out of frame
a stop codon was found. GENSCAN predicted an α gene with two exons instead of three, an initial one
and terminal one. The initial exon was similar to exons of most clones, however, the terminal exon was 24
base pairs shorter than the internal exon in α genes of other clones. Furthermore, exon 2 in the β gene of
this clone was 10 amino acids shorter than exon 2 found in other clones. This clone was excluded from
comparison of amino acid differences in the α gene (Table 9) because of these differences.
Clone FF127.1 also had the same kind of short exon 2 in the β gene. However GENSCAN predicted a
normal α gene. At the end of intron 1 in the β gene of these two clones a substitution was observed such
that an –AG becomes –GG. An AG is a normal acceptor site for splicing. Another AG is found 30 base
pairs further downstream after 10 amino acids of exon 2. Apparently the GENSCAN software takes this AG
as terminating intron 2 and thus predicts a 10 amino acid indel in the protein.
The gene in the intergenic region predicted in both FF127.1 and FF4b.1 had the usual 38 amino acids,
most commonly predicted for this gene. Both clones, however, FF127.1 and FF4b.1, were excluded from
finding amino acid differences in the β gene (Table 8) because of the large deletion predicted. There are the
clones which define cluster 1 (Figure 3).
The β gene of the FS54.1 clone was not different from that predicted in the other clones. The single
exon gene in the intergenic region, however, had a 27 base pairs longer exon than the common pattern. The
exon was composed of atg tandem repeats which was translated to D (asparctic acid). The difference in
exon size was due to nine more repeats in this clone compaired to the other clones. Furthermore GENSCAN
predicted an α gene with only two exons. It had no predicted internal exon. Instead, GENSCAN took what
was commonly defined as internal exon 2, joined with a translation of intron 2 and the commonly defined
terminal exon 3 as one long terminal exon. Thus, GENSCAN predicted a 174 amino acid α globin for clone
30

FS54.1. This clone defines cluster 3a in Figure 3.
Clone FF20.1 was more similar to the sequence deposited in GenBank by Tipping and Birley (accession
number 2154747, 2154750, 2154752) than the rest of the clones. They both had an insert in intron 1, an
–AATG– at base pairs 36–39. Similarly base pairs number 3 and 10 in intron 1 also were similar and thus
distinguished FF20.1 from our other clones. No other clones were similar with Tipping and Birley intron 1
for the first 39 base pairs. It is also seen in Table 8 that clone FF20.1 and the Tipping/Birley sequence were
identical in exon 1. The variation observed in FF20.1 thus also conforms to our strict criterion because the
Tipping and Birley sequence is independent of ours.
In the GENSCAN prediction for clones FS43.2, FF127.9, SS103.5, 6, 7, 12, 13 (clusters 5 and 8 in Table 3
and Figure 3) the single exon in the intergenic region was joined to the α gene, predicting a hybrid protein
of 173 amino acids. The promoter for the gene in the intergenic region was predicted as the promoter of
this gene. The promoter sequence for the α gene was not detected by GENSCAN although the sequence was
found in the clones. The asparctic acid coding sequence was predicted as the initial exon. Following that the
normal first and second exons were added as internal exons followed by the terminal exon thus predicting
a four exon α gene. There were fewer than usual tandem repeats in these clones but there were also amino
acid differences at the beginning and at the end of the sequence between these clones and the most common
pattern (Table 10).
Table 10: Two different coding sequences for the gene in the intergenic region.
MNDDCNEGDDDADDDDDDDDDDDDDNSTCSFSLESNYLNVN The predicted inter-genic exon in clones inwhich this exon formsthe initial exon of the αgene.
MNDDCNDGDDDADDDDDDDDDDDDDDDDDDDDDDNCSL The most commonlypredicted exon in in-tergenic region amongclones.
In clones FF4b.2, FF4.1, 2, SS103.1, 4 in cluster 5 in Table 3 and Figure 3 GENSCAN did not predict
a gene in the intergenic region. The promoter sequence, however, had a one base pair substitution relative
to the common promoter sequence. The contigs of sequence data from these clones were of same length as
the rest and the atg microsatellite were found as well. There were no obvious sequence changes in these
clones which would account for this prediction.
31

Phylogenetic trees and clusters We made phylogenetic trees using our strictly phylogenetically informa-
tive sites of all 57 clones (Table 3, Figure 3, 6, 7 and 8). The trees were a maximum likelihood tree made
with DNAML (Figure 6), a parsimony tree made with DNAPARS (Figure 7) and a neighbour joining tree
of genetic distances made with DNADIST and NEIGHBOUR (Figure 8). The topologies of the trees were
almost identical.
Inspection of the trees revealed distinct clusters. The clones could be clustered into ten clusters when
maximum split up was done (Figure 3 and Table 3). Clusters one to six all had an Asparctic acid, D, as the
second variable amino acid variable in the β gene. 1) The first group to separate from the rest consisted of
clones FF4b.1 and FF127.1. By GENSCAN prediction these clones had a short exon 1 in the β gene and in
addition FF4b.1 had a deletion in the α exon 2 that would cause a premature termination of translation. 2)
The next group to separate consisted primarily of FF clones from two individuals, FF127 and FF16 (Table 3).
3a) The SS51.1 clone grouped separately, located between clusters 2 and 3, although more related to cluster
3 than cluster 2 (Table 3). 3) The next cluster contained five individuals of all genotypes, two FF, two SS and
one FS. 4) A group of two individuals, both clones of FS54 and one clone of SS103, grouped together. 5)
The next was mostly made of clones from individual SS103 from which a subgroup of an FF individual and
an FS individual branched off. 6) Two FF and one FS individual separated from the SS103 goup. As seen
in Figure 3 clusters seven to ten all contained E as the second amino acid difference in the β gene (Table 3).
7) Clones FS43.1 and SS129.1 clustered together. In this group the first amino acid in the β gene changed
from T to N. A homoplasy was found for this amino acid change in the tree because this was also found
in clone FF20.1 in cluster 6. It had a D rather than E as the second β chain amino acid and thus it is more
parsimonious to consider the T↔N as a homoplasy instead of E↔D (Table 3). 8) Three clones of FF127,
one SS and one FS clone constituted this cluster. 9) This cluster contained only clones from individual
FS113. 10) Two clones of FS36 another FS and a SS individual clustered together (Table 3 and Figure 3).
In Figure 3 the sequence of amino acid variation (TETYKL a common pattern) were given for each
clone in a cluster. A major variation split the tree into two major branches. The β chain change from D
to E was supported with many silent variable sites which were in linkage disequilibrium with the amino
acid change and several other sites (Figure 5 and Table 3). Similarly, linkage disequilibrium between sites
supported most clusters (Figure 5 and Table 3).
32

500 1000 1500 2000 2500
604
676
772
831
1268
1858
2473
●
● ●
● ●●
●
● ●●●
● ●●● ●
● ●●● ●●
● ●●● ●●●
● ●
● ● ●
● ● ●●
●
●
● ● ●● ●
●
●
● ● ●● ● ●
●
● ●
● ● ●
Nucleotide site 1
Nuc
leot
ide
site
2
Figure 5: Linkage disequilibrium between pairs of sites in the 3000 base pairs β/α gene region in Atlanticcod. Points represent significant linkage disequilibrium, D, between pairs of sites by Fisher’s exact test andapplying Bonferroni adjustment for multiple tests. Excluded from the calculations were all but one identicalsequence of multiple clones from an individual within a cluster (Figure 3).
The polymorphism found in coding region among amino acid residues were considerably higher at the
β locus than at the α locus (Table 3). This was consistent with the pattern seen in Figure 1. The peaks of
nucleotide diversity were higher at the β locus than the α locus. The nucleotide diversity peaked at the end
of β exon 3 close to the location of the D to E change (Figures 1 and 3). There was also considerable linkage
33

disequilibrium among sites in this region of the fragment (Figure 5). The non–synonymous polymorphism
found in the α gene was less frequent than in the β gene (Figure 1). The amino acid changes in the α gene
were dispersed over the tree (Figure 3).
The mean number of atg tandem repeats were significantly different among the clusters (Table 11).
Seven of the 56 strictly phylogenetically informative sites (Table 3), were at this microsatellite locus. These
sites are part of the data used to make the trees and clusters. Therefore the degrees of freedom in the ANOVA
we made were overestimated to some extent because of partial correlation of parts with whole. However,
correcting for this is not likely to reverse this determinant and highly significant results.
Table 11: Analysis of variance of atg microsatellite tandem repeat number among clusters.
atg tandem repeat Df SS MS F P
Cluster 9 1187.1 131.90 44.6 0Clones with in cluster 47 139.1 3.0
Table 12: Mean number of atg microsatellites repeats among clusters.
Cluster 1 2 3 4 5 6 7 8 9 10Mean number 34.0 33.7 34.2 39.3 24.9 33.6 30.0 31.0 34.7 39.8
34

FF4b.1FF127.13
FF127.8FF127.7FF127.2FF127.3FF127.10FF16.1
FF127.12FF127.4
FS113.11FS82.1
FS36.2FS36.1
SS104.1FS113.12
FS113.5FS113.13FS113.9FS113.3FS113.4FS113.2FS113.7FS113.1
FS43.1SS129.1
SS103.10FF127.9
FS113.6FF127.5FF127.11
FF24.1FS14.1
FF20.1SS103.12
SS103.11SS103.13
FS43.2FF4b.2
FF4.2FF4.1SS103.1
SS103.7SS103.8SS103.5SS103.6
SS103.4SS103.3FS54.2FS54.1
FF10.1FF23.1SS131.1FS113.10SS130.1
SS51.1FF127.1
Figure 6: Maximum likelihood tree of doubleton strictly phylogenetically informative sites among 57 clonesof a 3000 base pairs β/α gene set in Atlantic cod.

FS113.5FS113.3FS113.12FS113.13FS113.9
FS113.11FS113.4FS113.2FS113.7FS113.1
FS82.1FS36.2
FS36.1SS104.1
FS43.1SS129.1
FS113.6FF127.9SS103.10
FF127.11FF127.5
FS14.1FF24.1FF20.1
SS103.7SS103.12SS103.11
SS103.8SS103.5SS103.6
SS103.4FS43.2SS103.13
SS103.1FF4.2
FF4b.2FF4.1
SS103.3FS54.2FS54.1
SS51.1SS130.1FF23.1FS113.10
FF10.1SS131.1
FF127.8FF127.4FF127.12
FF127.3FF127.13
FF127.10FF16.1FF127.7FF127.2
FF4b.1FF127.1
Figure 7: Most parsimonious tree of doubleton strictly phylogenetically informative sites among 57 clonesof a 3000 base pairs β/α gene set in Atlantic cod.

FF4b.1
FF127.2
FF16.1
FF127.7
FF127.13
SS131.1
FS113.10
FF23.1
SS130.1
FF10.1
SS51.1
FS54.1
SS103.3
FS54.2
FF4.1
FF4b.2
FS43.2
FF4.2
SS103.1
SS103.13
SS103.4
SS103.12
SS103.11
SS103.6
SS103.5
SS103.8
SS103.7
FF20.1
FF24.1
FS14.1
FF127.5
SS103.10
FF127.9
FF127.11
FS113.6
SS129.1
FS43.1
SS104.1
FS36.1
FS36.2
FS82.1
FS113.11
FS113.9
FS113.5
FS113.13
FS113.12
FS113.3
FS113.1
FS113.7
FS113.2
FS113.4
FF127.10
FF127.3
FF127.4
FF127.12
FF127.8
FF127.1
Figure 8: Neighbour joining tree of genetic distance of doubleton strictly phylogenetically informative sitesamong 57 clones of a 3000 base pairs β/α gene set in Atlantic cod.

Discussion
In this study we show multiple putative globin gene sets in Atlantic cod, a non-model organism. By our
PCR based strategy of genomic exploration we found ten clusters of linked β and α globin like genes. The
diversity of clusters observed is considered to represent multiple β and α gene sets as well as allelic variation
of some of the loci of the gene sets loci.
PCR errors To evaluate the authenticity of the variation defining the ten clusters we estimated potential
PCR errors in order to exclude results due to technical artifacts. We used two methods to estimate PCR
errors. First, the particular conditions in the PCR reactions with elongation step of ten minutes and using
long primers (HALLDÓRSDÓTTIR and ÁRNASON 2007), might facilitate polymerase errors. Our first error
estimate was based on clonded DNA as a template in a new PCR and subsequent cloning. All conditions are
the same the only difference is the DNA template. The cloned DNA is presumably cleaner than the genomic
DNA and contains little or no extraneous DNA sequence which could include PCR errors. This method
estimates the minimum PCR error rate and is a measure of errors occuring in the PCR reactions and cloning
procedures. The error rate according to this method is 1.2 × 10⁻³ per base pair. PUSCH and BACHMANN
(2004) showed that ancient DNA may induce mutations in a PCR on a human DNA. Based on this we
hypothesize that the extract of genomic DNA isolation may include some materials from the chelex isolation
and precipitation procedures and various extraneous DNA sequences which can make the polymerase more
error prone. On the assumption that all singleton variable sites among the original clones represent PCR
errors, the error rate is 7.1 × 10⁻² or 60 times higher than from our estimate of original and repeat pairs.
However, this probably is an overestimate because this high an error rate would alter the sequence beyond
recognition. Using this rate, thus erring on the conservative side, the predicted number of errors occuring in
two separate PCR reactions from two individuals is 15. By this argument 15 of the 56 doubleton variable
sites found in two or more individuals (Table 3) would be considered PCR errors. Taking an even stricter
stand by considering triplet variable sites found among three or more individuals thus having occured in
three or more independent PCR reactions the variable sites are reduced to 36. According to this maximal
error rate there should be one triplet error found in three independent PCR reactions (Table 4). Furthermore,
according to BRACHO et al. (1998), studying Taq polymerase induced errors in RNA virus diversity, the
ratio of transition/transversion nucleotide substitutions because of Taq polymerase PCR errors is 83/19 or
18,6%. This ratio among singleton sites is 185/25 or 12% (Table 2) in our data, a non-significant difference
38
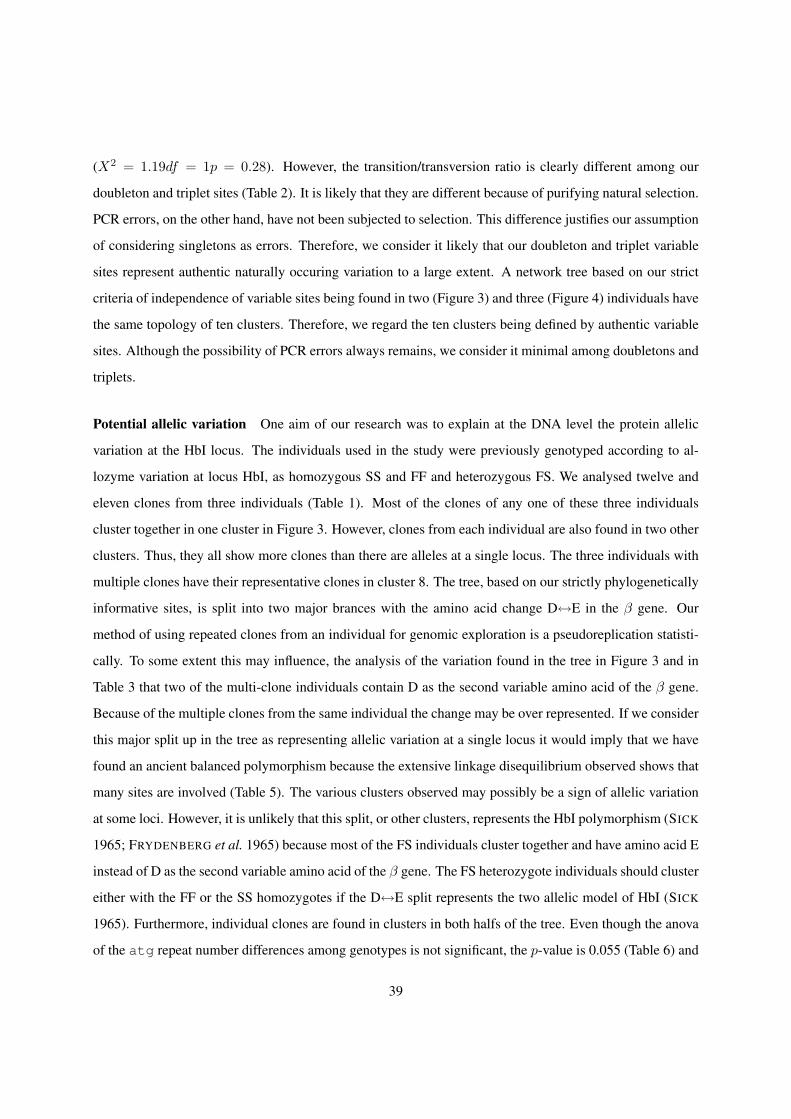
(X2 = 1.19df = 1p = 0.28). However, the transition/transversion ratio is clearly different among our
doubleton and triplet sites (Table 2). It is likely that they are different because of purifying natural selection.
PCR errors, on the other hand, have not been subjected to selection. This difference justifies our assumption
of considering singletons as errors. Therefore, we consider it likely that our doubleton and triplet variable
sites represent authentic naturally occuring variation to a large extent. A network tree based on our strict
criteria of independence of variable sites being found in two (Figure 3) and three (Figure 4) individuals have
the same topology of ten clusters. Therefore, we regard the ten clusters being defined by authentic variable
sites. Although the possibility of PCR errors always remains, we consider it minimal among doubletons and
triplets.
Potential allelic variation One aim of our research was to explain at the DNA level the protein allelic
variation at the HbI locus. The individuals used in the study were previously genotyped according to al-
lozyme variation at locus HbI, as homozygous SS and FF and heterozygous FS. We analysed twelve and
eleven clones from three individuals (Table 1). Most of the clones of any one of these three individuals
cluster together in one cluster in Figure 3. However, clones from each individual are also found in two other
clusters. Thus, they all show more clones than there are alleles at a single locus. The three individuals with
multiple clones have their representative clones in cluster 8. The tree, based on our strictly phylogenetically
informative sites, is split into two major brances with the amino acid change D↔E in the β gene. Our
method of using repeated clones from an individual for genomic exploration is a pseudoreplication statisti-
cally. To some extent this may influence, the analysis of the variation found in the tree in Figure 3 and in
Table 3 that two of the multi-clone individuals contain D as the second variable amino acid of the β gene.
Because of the multiple clones from the same individual the change may be over represented. If we consider
this major split up in the tree as representing allelic variation at a single locus it would imply that we have
found an ancient balanced polymorphism because the extensive linkage disequilibrium observed shows that
many sites are involved (Table 5). The various clusters observed may possibly be a sign of allelic variation
at some loci. However, it is unlikely that this split, or other clusters, represents the HbI polymorphism (SICK
1965; FRYDENBERG et al. 1965) because most of the FS individuals cluster together and have amino acid E
instead of D as the second variable amino acid of the β gene. The FS heterozygote individuals should cluster
either with the FF or the SS homozygotes if the D↔E split represents the two allelic model of HbI (SICK
1965). Furthermore, individual clones are found in clusters in both halfs of the tree. Even though the anova
of the atg repeat number differences among genotypes is not significant, the p-value is 0.055 (Table 6) and
39

is as such suggestive of some correlation of a DNA variation with the HbI allozyme genotypes. However,
this would not be structural variation. More extensive sampling is required to make more solid statement
about statistical significance in this respect. On the other hand the result from the anova we made regarding
clusters (Table 11) instead suggest that the various clusters represent different gene sets or allelic variation
at a locus other than the HbI. Clones from the three multi-clone individuals each appear in three clusters
(Table 7). Therefore, because each individual can only have two alleles of one gene, we cannot explain
the variation as a allelic variation at a single locus. On the assumption that cluster 8, in which the three
individuals have their representative clone, is a separate gene set the remaining six clusters could represent
alleles of another β/α gene set. If it is the same homologous gene set among the three individuals they would
represent three different heterozygotes for one gene set: FF127: cluster1/cluster2; SS103: cluster5/cluster4;
FS113: cluster9/cluster3 (Table 7). Under this assumption this particular gene set has at least six allels.
Some other combinations of allelic variation are possible as well. For example, on the assumption that clus-
ter 8 represents allelic variation of a gene set common to the three individuals in heterozygous condition
with one of the other clusters of each individual there would be four alleles and up to four different gene
sets. Whichever way one counts. The results likely represent both allelic variation of at least one locus as
well as several β/α gene sets.
Number of gene sets in an individual The more individuals we analyzed the more new clusters appear.
To start with we analyzed multiple clones from three individuals and later added single clones from many
individuals. Clusters 6, 7 and 10 do not contain any of the original clones. They contain clones from both
homozygous and heterozygous individuals. Clusters 3 and 8 have all genotypes, representing loci clearly
independent of HbI genotype (Figure 3 and Table 3). This raises the question of how many linked β and α
globin gene sets there are in the genome of Atlantic cod?
Repeated clones from the same individual were found in three clusters (Figure 3). Based on this evidence
we argue that there could be three sets of linked β and α globin genes in an individual. The appearance of
new clusters with analysis of more individuals give reasons to argue that the numbers may be higher or the
clusters indicate multiallel loci. Under this argument one may look at the clusters as discrete gene sets which
presumably are found in every individual with some of them having multiple alleles.
The sequences deposited in GenBank by Tipping and Birley differ from our sequences, especially in
intron 1 and exon 3 of the β gene. However, FF20.1 finds similarities whith intron 1 and the amino acid
sequence for exon 1 in the β gene is identical to the Tipping and Birley β exon 1 (Table 3 and Table 8).
40

The dissimilarities in the remaining amino acid sequences are so extensive that, if authentic, the Tipping and
Birley sequence likely represents another β locus. Our FF20.1 clone might be a recombinant with this gene.
At least FF20.1 conforms to our strict criterion of phylogenetically informative sites because the Tipping
and Birley sequence is fully independent from ours.
Comparison was also done with the β globin amino acid sequences from VERDE et al. (2006) who
report two β globins, β1 and β2. The β2 sequence resembles our sequences more than the β1 which is very
different. The β2 amino acid sequence is aligned with our data in Table 8. A phenetic tree in VERDE et al.
(2006) shows distances between these genes where β2 and an additional β chain (which is based on the β
mRNA from Tipping and Birley) are closely linked in the tree with β1 being more distantly related. VERDE
et al. (2006) infer from this that β1 and β2 are two separate β globin loci and that the additional chain/Tipping
and Birley chain is as well a separate locus. Our gene sets are more closely related to β1 and Tipping and
Birley than to the β2 from VERDE et al. (2006). With this additional information the number of β genes
in the Atlantic cod genome might be as high as 13. Similarly BROWNLIE et al. (2003) characterizing of
embryonic globin genes in zebrafish in which they describe three embryonic α genes and three embryonic
β genes and furthermore state that it likely represents an underestimate. Our data, in contrast to Tipping
and Birley and VERDE et al. (2006), consist of contigs of linked β and α genes. In the zebrafish an α/β
embryonic globin locus is linked to an α/β adult globin locus on the same chromosome with a 9 kilobase
intergenic region (BROWNLIE et al. 2003). CHAN et al. (1997) show that the linked α and β genes are
coordinately expressed. From this we can deduce that the α/β gen sets in Atlantic cod possibly encode
different embryonic or adult or both α/β gene set loci.
Large gene families and large number of duplicated genes, often located on different chromosomes are
known in fish (HOEGG et al. 2004). There is still a question if the linked β and α globin genes in Atlantic
cod are located in tandem on the same chromosome like in the Zebrafish (BROWNLIE et al. 2003), located
on separate chromosome like in the Salmon (WAGNER et al. 1994), or both. The sequences from VERDE
et al. (2006) and Tipping and Birley may well represent other loci of linked β and α genes. For example, the
β1 and α1 of VERDE et al. (2006) which differ from our sequences by over 40% may represent a completely
different set of β and α globin loci. They are at least very different from our genes and as no potential
recombinants were evident between our sequences and theirs. Therefore our genes and theirs are not likely
to represent allelic variation. They may even represent an ancient globin gene homology.
Known globin gene families (KARLSSON and NIENHUIS 1985; SJAKSTE and SJAKSTE 2002) consist of
41

genes expressed at different developmental stages. From these facts we may argue that some of our loci may
contain embryonic or larval globin genes. However, blast analysis shows partial homology of our sequences
to both embryonic and adult forms in different taxa. There is thus no clear indication for our genes that they
represent embryonic or adult forms.
Pseudogenes are a consequence of gene duplication in genomic DNA. Duplicated genes can take on
new adaptive functions, like in gene families such as the globin gene family, or become neutralized to
pseudogenes or non-functional genes. A failure of transcription or translation is the main reason for this
lack of function (MIGHELL et al. 2000). In the human β globin domain there is one pseudogene (HARRIS
et al. 1984, the ψβ1 gene) and two in the α globin domain (DICKERSON and GEIS 1983). One of our
clones potentially contains a pseudogene. The FF4b.1 clone has a deletion in the α gene which causes a
shift in reading frame leading to insertion of incorrect amino acids and eventually a translation stop and
with a GENSCAN gene prediction of a two exon protein and a single intron gene without a polyA signal.
Putative gene in intergenic region GENSCAN predicts a single exon gene in the region between the β
and α genes. The exon mainly consist of asparctic acids (D). The gene has its own promoter, initiation and
termination codons and a polyA signal and is thus a putative functional gene. No similarities are found
to any known protein in GenBank. The question is whether this is a functional protein and whether it has
something to do with expression or other functions of the globin genes or proteins? The length of this exon
varies among the clones and the GENSCAN gene prediction changes according to the length of this single-
exon in the intergenic region. In primates, the β globin locus contains five genes which are arranged in the
same order in which they are expressed during development. It has been suggested that distance from the
locus control region (LCR) controls the order of expression of these genes (JOHNSON et al. 2006). Based on
this suggestion, some regulation of expression of the globin genes could be related to this sequence of atg
tandem repeats in the intergenic region which form the main part of the single exon gene. Other research
has also indicated that simple sequence repeat expansions and/or contractions can regulate gene expression
and thus should be subjected to strong selective pressures (LI et al. 2004). However, in our case the repeated
sequence has a promoter and a polyA signal and is thus a putative functional gene.
The LCR element in human α globin gene domain is located in an intron of another gene that is tran-
scribed in the orientation opposite to that of the globin genes, the −14 gene in humans. Also in the chicken
a gene is located in the α globin gene domain which is transcribed in opposite direction to the globin genes.
The clusters of α globin and proximal genes are part of an area in which genes are tightly packed (SJAKSTE
42

et al. 2000).
Variation within gene set A duplication of an ancient gene explains the generation of gene families
from a single ancestral gene. The presence of duplicate genes is sometimes beneficial simply because
additional amounts of protein or RNA products are provided which are important for a specific function.
This applies mainly to genes the products of which are in high demand. Strong purifying selection against
mutations which modify gene function can prevent such duplicated genes having the same function from
diverging. Similarly gene conversion can prevent divergence of such genes. Paralogous genes will have
similar sequences after gene conversion. Thus genes serving a single function in high demand are preserved.
Synonymous nucleotide differences among duplicated genes can be an indication of purifying selection.
Synonymous differences are more or less immune to selection and are not removed by purifying selection
(ZHANG 2003). Other duplicate genes may be subject to diversifying selection and acquire new and different
roles. Highly variable and even fluctuating environment of fish such as Atlantic cod may create a high
and varied demand for oxygen. In this context we can interpret our results of numerous divergent gene
sets as a possible response to such demands. Both Bohr and Root effect (ROOT 1931) hemoglobins are
known in fish (BERENBRINK et al. 2005) and presumably the genes responsible are encoded at different loci
(MCMORROW et al. 1997). Silent substitutions are much more common than non-silent among our clones
(Table 3). Interestingly the variation is considerably higher at the β locus than at the α locus (Table 3, 8,
9). This is an indication of greater conservation among α genes then the β genes. Either the function of α
globin chain is more conserved for some reason by purifying selection or by gene conversion.
Our strict criterion that every substitution has to occur in two or three individuals to be considered a
phylogenetically informative site is a conservative perspective. It was made in response to potential PCR
errors. Some of the polymorphism in Table 8, and 9, which we thus regarded as potential PCR errors
may, therefore, nevertheless be real. Figure 1 (panel 2 vs. panel 1) and our calculation of PCR error rate
shows how little of the variation observed is clearly because of error in PCR. Thus, we conclude that there
are several β/α gene sets in Atlantic cod. Presumably they encode different kinds of hemoglobins, adult,
embryonic, both Bohr and Root effect hemoglobins, which the organism uses and requires for its successful
development and functioning in a heterogeneous environment.
43

References
ÁRNASON, E., 2004. Mitochondrial cytochrome b DNA variation in the high fecundity Atlantic cod: Trans-
Atlantic clines and shallow gene-genealogy. Genetics 166: 1871–1885.
BERENBRINK, M., P. KOLDKJÆR, O. KEPP and A. R. COSSINS, 2005. Evolution of oxygen secretion in
fishes and the emergence of a complex physiological system. Science 307: 1752–1757.
BRACHO, M., A. MOYA and E. BARRIO, 1998. Contribution of taq polymerase-induced errors to the
estimation of RNA virus diversity. Journal of General Virology 79: 2921–2928.
BRIX, O., E. FORÅS and I. STRAND, 1998. Genetic variation and functional properties of Atlantic cod
hemoglobins: Introducing a modified tonometric method for studying fragile hemoglobins. Comparative
Biochemistry and Physiology 119A: 575–583.
BRIX, O., S. THORKILDSEN and A. COLOSIMO, 2004. Temperature acclimation modulates the oxygen
binding properties of the Atlantic cod (Gadus morhua L.) genotypes HbI*1/1, HbI*1/2, and HbI*2/2—
by changing the concentrations of their major hemoglobin components (results from growth studies at
different temperatures). Comparative Biochemistry and Physiology 138A: 241–251.
BROWNLIE, A., C. HERSEY, A. C. OATES, B. H. PAW, A. M. FALICK, H. E. WITKOWSKA, J. FLINT,
D. HIGGS, J. JESSEN, N. BAHARY, H. ZHU, S. LIN and L. ZON, 2003. Characterization of embryonic
globin genes of the zebrafish. Developmental Biology 255: 48–61.
BURGE, C. and S. KARLIN, 1997. Prediction of complete gene structures in human genomic DNA. Journal
of Molecular Biology 268: 78–94.
CHAN, F., J. ROBINSON, A. BROWNLIE, R. A. SHIVDASANI, A. DONOVAN, C. BRUGNARA, J. KIM,
B. LAU, H. E. WITKOWSKA and L. I. ZON, 1997. Characterization of adult α- and β-globin genes in
the zebrafish. Blood 89: 688–700.
DICKERSON, R. E. and I. GEIS, 1983. Hemoglobin: Structure, Function, Evolution and Pathology. The
Benjamin/Cummings Publishing Company, Inc., Menlo Park, California.
EWING, B. and P. GREEN, 1998. Basecalling of automated sequencer traces using phred. II. error proba-
bilities. Genome Research 8: 186–194.
44

EWING, B., L. HILLIER, M. WENDL and P. GREEN, 1998. Base-calling of automated sequencer traces
using phred. I. accuracy assessment. Genome Research 8: 175–185.
FELSENSTEIN, J., 2002. PHYLIP (phylogeny inference package) version 3.6a3. Distributed by the author.
Department of Genome Sciences, University of Washington, Seattle.
FRYDENBERG, O., D. MØLLER, G. NÆVDAL and K. SICK, 1965. Haemoglobin polymorphism in Norwe-
gian cod populations. Hereditas 53: 257–271.
FYHN, U. E., O. BRIX, G. NÆVDAL and T. JOHANSEN, 1994. New variants of the haemoglobins of
Atlantic cod: a tool for discriminating between coastal and Arctic cod. ICES marine Science symposia
198: 666–670.
GONZALEZ, J., J. ZIMMERMANN and C. SAIZ-JIMENEZ, 2005. Evaluating putative chimeric sequences
from PCR-amplified products. Bioinformatics 21: 333–337.
GORDON, D., C. ABAJIAN and P. GREEN, 1998. Consed: A graphical tool for sequence finishing. Genome
Research 8: 195–202.
GUPTA, A. and R. LEWONTIN, 1982. A study of reaction norms in natural populations of Drosophila
pseudoobscura. Evolution 36: 934–948.
HALLDÓRSDÓTTIR, K. and E. ÁRNASON, 2007. Tail to head orientation of Atlantic cod β and α globin
genes. Manuscript.
HARRIS, S., P. BARRIE and M. WEISS, 1984. The primate ψβ gene. Journal of Molecular Biology 180:
785–801.
HOEGG, S., H. BRINKMANN, J. TAYLOR and A. MEYER, 2004. Phylogenetic timing of the fish–specific
genome duplication correlates with the diversification of teleost fish. Journal of Molecular Evolution 59:
190–203.
JOHNSON, R., T. PRYCHITKO, D. GUMUCIO, D. WILDMAN, M. UDDIN and M. GOODMAN, 2006. Phylo-
genetic comparisons suggest that distance from the locus control region guides developmental expression
of primate β–type globin genes. Proceedings of the National Academy of Sciences USA 103: 3186–3191.
45

KARLSSON, S. and A. NIENHUIS, 1985. Developmental regulation of human globin genes. Annual Review
of Biochemistry 54: 1071–1108.
KARPOV, A. K. and G. G. NOVIKOV, 1980. Hemoglobin alloforms in cod Gadus morhua (Gadiformes,
Gadidae), their functional characteristics and occurrence in populations. Journal of Ichthyology 6: 45–49.
KUMAR, S., K. TAMURA and M. NEI, 2004. MEGA3: Integrated software for molecular evolutionary
genetics analysis and sequence alignment. Briefings in Bioinformatics 5: 150–163.
LEWONTIN, R. and K. KOJIMA, 1960. The evolutionary dynamics of complex polymorphisms. Evolution
14: 458–472.
LI, Y., A. KOROL, T. FAHIMA and E. NEVO, 2004. Microsatellites within genes: Structure, function, and
evolution. Molecular Biology and Evolution 21: 991–1007.
MANWELL, C. and A. C. M. BAKER, 1970. Molecular Biology and the Origin of Species. Sidgewick &
Jackson, London.
MCMORROW, T., A. WAGNER, T. HARTE and F. GANNON, 1997. Sequence analysis and tissue expression
of a non-Bohr beta-globin cDNA from Atlantic salmon. Gene 189: 183–188.
MIGHELL, A., N. SMITH, P. ROBINSON and A. MARKHAM, 2000. Vertebrate pseudogenes. FEBS Letters
468: 109–114.
PELSTER, B. and H. DECKER, 2004. The Root effect—a physiological perspective. Micron 35: 73–74.
PETERSEN, M. F. and J. F. STEFFENSEN, 2003. Preferred temperature of juvenile Atlantic cod Gadus
morhua with different haemoglobin genotypes at normoxia and moderate hypoxia. The Journal of Exper-
imental Biology 206: 359–364.
PUSCH, C. and L. BACHMANN, 2004. Spiking of contemporary human template DNA with ancient DNA
extracts induces mutations under PCR and generates nonauthentic mitochondrial sequences. Molecular
Biology and Evolution 21: 957–964.
RICE, J. A., 1995. Mathematical Statistics and Data Analysis. Duxbury Press, Belmont, California, 2
edition.
46

RICE, P., I. LONGDEN and A. BLEASBY, 2000. EMBOSS: The European Molecular Biology Open Software
Suite. Trends in Genetics 16: 276–277.
ROOT, R. W., 1931. The respiratory function of the blood of marine fishes. Biological Bulletin 61: 427–456.
ROZAS, J., J. C. SÁNCHEZ-DELBARRIO, X. MESSEGUER and R. ROZAS, 2003. DnaSP, DNA polymor-
phism analyses by the coalescent and other methods. Bioinformatics 19: 2496–2497.
SICK, K., 1965. Hemoglobin polymorphisms of cod in the Baltic and the Danish Belt sea. Hereditas 54:
19–48.
SJAKSTE, N., O. IAROVAIA, S. RAZIN, G. LINARES-CRUZ, T. SJAKSTE, V. LEGAC, Z. ZHAO and
K. SCHERRER, 2000. A novel gene is transcribed in the chicken α-globin gene domain in the direc-
tion opposite to the globin genes. Molecular and General Genetics 262: 1012–1021.
SJAKSTE, N. and T. SJAKSTE, 2002. Structure of globin gene domains in mammals and birds. Russian
Journal of Genetics 38: 1343–1358.
THOMPSON, J., D. HIGGINS and T. GIBSON, 1994. CLUSTAL W: improving the sensitivity of progressive
multiple sequence alignment through sequence weighting, positions-specific gap penalties and weight
matrix choice. Nucleic Acids Research 22: 4673–4680.
VERDE, C., M. BALESTRIERI, D. DE PASCALE, D. PAGNOZZI, G. LECOINTRE and G. DI PRISCO, 2006.
The oxygen transport system in three species of the Boreal fish family Gadidae. The Journal of Biological
Chemistry 281: 22,073–22,084.
WAGNER, A., F. DERYCKERE, T. MCMORROW and F. GANNON, 1994. Tail-to-tail orientation of the
Atlantic salmon alpha- and beta-globin genes. Journal of Molecular Evolution 38: 28–35.
ZHANG, J., 2003. Evolution by gene duplication: an update. Trends in Ecology and Evolution 18: 292–299.
47