CHARACTERIZATION OF Fusarium sp - WSU Libraries · iv identification of quantitative trait loci...
278
IDENTIFICATION OF QUANTITATIVE TRAIT LOCI (QTL) FOR RESISTANCE TO FUSARIUM CROWN ROT IN WHEAT AND A SURVEY OF FUSARIUM PSEUDOGRAMINEARUM AND F. CULMORUM IN THE PACIFIC NORTHWEST OF THE U.S. By GRANT J. POOLE A dissertation submitted in partial fulfillment of the requirements for the degree of Doctor of Philosophy WASHINGTON STATE UNIVERSITY Department of Plant Pathology May 2010 © Copyright by GRANT J. POOLE, 2010 All Rights Reserved
Transcript of CHARACTERIZATION OF Fusarium sp - WSU Libraries · iv identification of quantitative trait loci...
IDENTIFICATION OF QUANTITATIVE TRAIT LOCI (QTL) FOR RESISTANCE TO
FUSARIUM CROWN ROT IN WHEAT AND A SURVEY OF FUSARIUM
PSEUDOGRAMINEARUM AND F. CULMORUM IN THE PACIFIC NORTHWEST OF
THE U.S.
By
GRANT J. POOLE
A dissertation submitted in partial fulfillment of
the requirements for the degree of
Doctor of Philosophy
WASHINGTON STATE UNIVERSITY
Department of Plant Pathology
May 2010
© Copyright by GRANT J. POOLE, 2010
All Rights Reserved

© Copyright by GRANT J. POOLE, 2010
All Rights Reserved

ii
To the Faculty of Washington State University:
The members of the Committee appointed to examine the dissertation of
GRANT J. POOLE find it satisfactory and recommend it be accepted.
____________________________________
Timothy Paulitz, Ph.D., Chair
____________________________________
Kimberly Garland-Campbell, Ph.D.
____________________________________
Richard W. Smiley, Ph.D.
____________________________________
Timothy D. Murray, Ph.D.

iii
ACKNOWLEDGEMENTS
There are many of whom without this research would not have been possible. First and
foremost I would like to thank Christ for the strength and assistance He has graciously granted to
my life and career. I would like to thank Dr. Timothy Paulitz for his wisdom, patience, and
careful guidance throughout the duration I conducted research at WSU. Dr. Paulitz was always
pleasant to work with. I learned a great deal from his knowledge of plant pathology and
mentoring skills of colleagues and graduate students. I would equally like to thank Dr. Kim
Campbell for her patience and imparting her knowledge of wheat genetics and breeding
principles whenever I asked. Working with Dr. Campbell‟s program I was able to witness her
personal skills in supervising students and working with the growers and industry. It was always
in the best interest of both of these advisors to allow me the opportunity to attend workshops,
meetings, and professional societies to extend my education, thank you.
I am appreciative of Dr. Smiley for his friendly assistance whenever I requested it, and
travelling to Pullman to attend committee meetings. This research would not have been possible
without Dr. Smiley readily imparting his knowledge and experience from years of Fusarium
crown rot research. I would like to thank Dr. Tim Murray for his guidance and wisdom in
practical aspects of graduate school as well as imparting his helpful knowledge and experience of
plant pathology pertaining to wheat and statistical analysis. I also want to thank Dr. Julie Nicol
(CIMMYT) for granting her experience and knowledge of Fusarium crown rot and guidance
throughout my graduate studies at WSU.
I would like to thank my mother and father for their continued wisdom, guidance and
support. I dedicate this dissertation to Jesus Christ as well as my life and career.

iv
IDENTIFICATION OF QUANTITATIVE TRAIT LOCI (QTL) FOR RESISTANCE TO
FUSARIUM CROWN ROT IN WHEAT AND A SURVEY OF FUSARIUM
PSEUDOGRAMINEARUM AND F. CULMORUM IN THE PACIFIC NORTHWEST OF
THE U.S.
Abstract
by Grant J. Poole, Ph.D.
Washington State University
May 2010
Chair: Timothy D. Paulitz
Fusarium crown rot (FCR), caused by a complex of Fusarium species, of which F.
pseudograminearum and F. culmorum are the most important, reduces wheat yields in the
Pacific Northwest (PNW) of the U.S. by an average of 9%. The objectives of this research were
to: 1) conduct a thorough survey of Fusarium spp. in 2008 and 2009 throughout 105 wheat fields
in Oregon and Washington; 2) correlate FCR severity ratings in wheat to DNA extracted from
infected wheat stems through the use of Q-PCR techniques; 3) develop greenhouse inoculation
methods for screening for FCR resistance; and 4) map resistance to FCR in two recombinant
inbred line populations with a resistant Australian hard red wheat line „Sunco‟.
Results from the FCR survey showed that four species of Fusarium were isolated into
pure culture from 99% and 97% of the fields surveyed in 2008 and 2009, respectively, showing
the widespread occurrence of the pathogen. Although previous efforts had been made to extract
Fusarium DNA from infected stems and quantify the amount of pathogen DNA using Real Time
Quantitative PCR (Q-PCR) technology, results from this study did not indicate a strong positive
correlation between Fusarium crown rot severity ratings from field samples in the 2008 survey
and DNA concentrations using Q-PCR.

v
To accurately describe Quantitative Trait Loci (QTL) for FCR resistance, it was
necessary to develop a reliable inoculation method for screening mapping population lines.
Optimization experiments to assess the virulence of five PNW isolates of F. pseudograminearum
and to determine the best method of inoculation revealed that one Fusarium isolate was
consistently the most virulent across studies. Placing millet seed colonized with F.
pseudograminearum at the stem base of the seedling resulted in the most consistent virulence
and differentiation between the parents of two mapping populations. Two recombinant inbred
line mapping populations with the parents Sunco/Macon and Sunco/Otis were developed for the
purpose of constructing a genetic linkage map for identifying QTL describing FCR resistance.
Significant QTL were identified on chromosome 3BL with a LOD = 14 and LOD = 10 for the
Sunco/Macon and Sunco/Otis mapping populations, respectively.

vi
TABLE OF CONTENTS
Page
ACKNOWLEDGEMENTS………………………………………………………….. iii
ABSTRACT…………………………………………………………………………. iv - v
LIST OF TABLES…………………………………………………………………... ix
LIST OF FIGURES………………………………………………………………….. xiii
CHAPTER
1. LITERATURE REVIEW
I. INTRODUCTION……………………………………………………....... 1
II. CROWN ROT HISTORY, BIOLOGY, SURVEY, AND
EPIDEMIOLOGY……………………………………………………….. 4
III. BIOASSAYS FOR IDENTIFYING CROWN ROT RESISTANCE….... 21
IV. GENETIC RESISTANCE AND DEVELOPMENT OF MOLECULAR
MARKERS……………………………………………………….…..... 24
Genetic Mapping……………………………………………………. 26
Identification of QTL……………………………………………….. 28
QTL Identification for Crown Rot Resistance………………………. 29
Marker Assisted Selection (MAS)…………………………………... 35
V. POPULATION DIVERSITY AND MOLECULAR CHARACTERIZATION OF
FUSARIUM SPECIES FOR IDENTIFICATION AND
QUANTIFICATION……….......................................................................37
Fusarium pseudograminearum and F. graminearum
population diversity ………………………………………………… 44
Quantitative Real-Time PCR for quantification and identification of
Fusarium.……………………………………………………………. 46

vii
5. SUMMARY……………..……………………………………………….. 50
6. LITERATURE CITED…………………………………………………… 52
2. A SURVEY OF FUSARIUM CROWN ROT IN DRYLAND WHEAT
IN THE PACIFIC NORTHWEST OF THE U.S.………………………………….66
ABSTRACT…………………………………………………………………. 66
INTRODUCTION…………………………………………………………… 67
MATERIALS AND METHODS……………………………………………. 75
RESULTS…………………………………………………………………… 80
DISCUSSION………………………………………………………………... 88
LITERATURE CITED………………………………………………………. 95
3. OPTIMIZATION OF REAL TIME QUANTITATIVE PCR (Q-PCR)
FOR FUSARIUM PSEUDOGRAMINEARUM AND F. CULMORUM
ON WHEAT………………………………………………………………………. 102
ABSTRACT…………………………………………………………………. 102
INTRODUCTION…………………………………………………………… 104
MATERIALS AND METHODS……………………………………………. 111
RESULTS…………………………………………………………………… 122
DISCUSSION………………………………………………………………... 139
LITERATURE CITED………………………………………………………. 145
4. EVALUATION OF INOCULATION METHODS TO ASSAY
SPRING WHEAT FOR RESISTANCE TO FUSARIUM CROWN
ROT IN A CONTROLLED GROWTH ENVIRONMENT…………...…………. 152
ABSTRACT…………………………………………………………………. 152

viii
INTRODUCTION…………………………………………………………… 153
MATERIALS AND METHODS……………………………………………. 160
RESULTS…………………………………………………………………… 171
DISCUSSION………………………………………………………………... 191
LITERATURE CITED………………………………………………………. 198
5. IDENTIFYING QTL FOR FUSARIUM CROWN ROT RESISTANCE (F.
PSEUDOGRAMINEARUM) IN THE SPRING WHEAT CULTIVAR SUNCO... 203
ABSTRACT…………………………………………………………………. 203
INTRODUCTION…………………………………………………………… 205
MATERIALS AND METHODS……………………………………………. 209
RESULTS…………………………………………………………………… 219
DISCUSSION………………………………………………………………... 226
LITERATURE CITED………………………………………………………. 230
6. SUMMARY OF FINDINGS AND CONCLUSIONS……………………………..249

ix
LIST OF TABLES
CHAPTER 2
1. Descriptive parameters of six agronomic zones developed by
Douglas et al. (1990) including characteristics of the climatic
region, precipitation (mm), growing degree days, and soil
type…………………………………...…………………………………. 73
2. Frequency of isolation of each respective species from diseased wheat
stems from the 2008 and 2009 PNW field survey……………………… 80
3. Results for the crown rot severity score (rated 0 to 10)
for the Year ANOVA model analyzed over years 2008 and 2009
from the Fusarium survey……………………………………………… 82
4. Results for the number of symptomatic nodes for the
Year ANOVA model analyzed over years 2008 and 2009
from the Fusarium survey………………………………………………. 82
5. Crown rot severity, average number of nodes with symptoms, and
isolation frequency per field for F. pseudograminearum (Fp) and
F. culmorum (Fc) within six PNW climatic regions adapted
from Douglas et al. 1990………………………………………………... 83
6. Distribution of Fusarium spp. identified in culture for
(2-year mean %). Fields contained only F. pseudograminearum,
only F. culmorum, or both species within the same field for each
climatic region………………………………………………………….. 85
7. Results from the t-test analysis between population means for
F. pseudograminearum and F. culmorum isolation frequencies
within each agronomic zone described by Douglas et al. (1990)………. 87
CHAPTER 3
1. Results from the Fusarium spp. conidial DNA extraction
experiment (EE-1) using the FastDNA extraction kit. Samples
were analyzed with conventional PCR and products were amplified
on a 1% agarose gel…………………………………………………….. 126
2. Results from the DNA extraction experiment (EE-2) using the
FastDNA kit comparing grinding techniques for wheat stem/crown
tissue extractions. Samples were from fields 34 and 35
(Connell, WA), and field 93 (Douglas Co., WA)……………………….. 127

x
3. DNA extraction experiment (EE-3) from various fields
and samples showing significant levels of crown rot where
different species were isolated using the Mo-Bio Ultra Clean
Soil kit and Q-PCR analysis of DNA…………………………………… 128
4. Comparison of DNA extraction with the Mo-Bio and FastDNA
extraction kits in experiment EE-4 for 12 field samples identified
morphologically with various Fusarium spp…………………………….130
5. Evaluation of bead beating and liquid nitrogen grinding of
mature wheat stems to extract DNA using the Mo-Bio
extraction kit in experiment EE-5…………………………………….. 131
6. DNA extractions from various samples within fields
from the 2008 Fusarium survey samples with the Mo-Bio
DNA extraction kit to correlate DNA quantity to crown rot
severity ratings in experiment EE-6………………………………....... 133
7. Comparison of sample preparation in experiment EE-8 with liquid nitrogen
grinding, soaking, bead beating, the addition of PVPP, and the
Fast Prep speed to optimize DNA extractions from 2008
Fusarium Survey wheat stem samples infected with crown rot………… 134
8. Results of amplification with „FPG‟ and „OPT‟ primers
In expermient EE-10 from 144 DNA extractions made from 48 fields and
the respective morphological identifications (Fusarium spp.)
of the amplified samples………………………………………………… 136
CHAPTER 4
1. Background information for five Fusarium pseudograminearum
isolates used in greenhouse and terrace screening experiments………… 161
2. List of cultivars screened in the greenhouse for Fusarium crown
rot resistance with their respective market class and relative
resistance / susceptibility……………………………………………….. 165
3. Description of six inoculation methods for AE-4 to evaluate
the effects of inoculation methods on the performance of four
cultivars (Seri (S), 2-49 (PR), Sunco (PR), and Macon (S)) inoculated
with PNW F. pseudograminearum isolates 4 (081-11) and
5 (032-06) during 2008………………………………………………….. 166

xi
4. Treatment methods of inoculation used in Experiments AE-6 and AE-7
to evaluate six inoculation methods with F. pseudograminearum
inoculated with PNW Isolate 2 (006-13) on four spring wheat
cultivars (Sunco (PR), Otis (S), 2-49 (PR), and Seri (S))………………. 169
5. Crown rot severity of 11 wheat cultivars in screen
AE-1 treated with five PNW F. pseudograminearum
isolates with the „Early inoculation method‟.…………………………. 172
6. ANOVA results for AE-1……………………………………………… 172
7. Mean crown rot severity of three PNW F. pseudograminearum
isolates averaged over four wheat cultivars
(Sunco, Macon, 2-49, and Seri) for two rating systems
in screen AE-3……………………………………………………….….176
8. Mean summary of methods of inoculation for two
rating systems (leaf sheath sum and Mitter crown rot severity index)
and the first leaf sheath rating (0 to 4) portion of the leaf sheath sum… 179
9. Mean crown rot severity for four cultivars evaluated over seven
methods of inoculation using three rating systems and the first
leaf sheath rating (0 to 4) of the leaf sheath sum………………………. 180
10. Mean summary of methods of inoculation for four
cultivars rated according to Nicol rating system (0 to 10)
evaluated in AE-4……………………………………………………… 183
11. Crown rot severity of four spring wheat cultivars
evaluated with a non-germinated seedling dipping method
in a conidial suspension of 1.0 x 10⁶ F. pseudograminearum
PNW Isolate 4 (081-11) conidia per mL distilled water………………. 185
12. Mean crown rot severity for six methods of inoculation used
in Experiment AE-6 inoculated with F. pseudograminearum
PNW Isolate 2 (006-13) on four spring wheat cultivars
(Sunco (PR), Otis (S), 2-49 (PR), and Seri (S))……………………….. 187
13. Mean crown rot severity for six methods of inoculation used
in Experiment AE-7 inoculated with F. pseudograminearum
PNW Isolate 2 (006-13) on four spring wheat cultivars
(Sunco (PR), Otis (S), 2-49 (PR), and Seri (S))……………………….. 188

xii
14. Mean crown rot severity for four cultivars in Experiment
AE-7 inoculated with F. pseudograminearum PNW
Isolate 2 (006-13) averaged across six methods of inoculation
treatments……………………………………………………………… 190
CHAPTER 5
1. Crown rot severity summary statistics including minimum
and maximum ranges, standard deviations, coefficient of
variation (CV) and broad sense heritability (H2) for the
Sunco/Macon RIL mapping population………………………………… 237
2. Correlation coefficients for the Sunco/Macon population
assessed for crown rot severity among mean growth chamber
screens, mean terrace screens, and one field screen……………………. 238
3. Correlation coefficients for the Sunco/Macon population
assessed for crown rot severity among three growth chamber
screens, two terrace screens, and one field screen…………………….... 239
4. Crown rot severity summary statistics including minimum
and maximum ranges, standard deviations, coefficient of
variation (CV) and broad sense heritability (H2) for the
Sunco/Otis RIL mapping population……………………………………. 240
5. A summary of QTL for the Sunco/Macon population
correlated to crown rot resistance using composite interval
mapping across three seedling screens, two terrace screens,
and one field screen during 2008 and 2009. Population parameters
including the QTL inheritance origin, chromosomal location,
likelihood of odds (LOD) score, percent phenotypic variation
(R2), and the flanking markers of each QTL region is summarized……. 241
6. A summary of QTL for the Sunco/Otis population correlated
to crown rot resistance using composite interval mapping (CIM)
across two seedling screens, a single terrace screen, and field
screen during 2009. Population parameters including the QTL
inheritance origin, chromosomal location, likelihood of odds
(LOD) score, percent phenotypic variation (R2), and the
flanking markers of each QTL region is summarized………………….. 242
xiii
LIST OF FIGURES
CHAPTER 1
1. Life cycle of Fusarium pseudograminearum (semi-arid climate)
and F. graminearum (humid climate), formerly known
as Fusarium roseum and F. graminearum Group 1 and Group 2,
respectively (Nelson et al. 1981)………………………………………... 8
CHAPTER 2
1. Map of six Agronomic zones for the dryland Pacific
Northwest developed by Douglas et al. (1990)…………………………. 74
2. Regression analysis of isolation frequency within 105
fields (averaged across five samples) of F. pseudograminearum
(independent variable =y) and F. culmorum (dependent variable =x)
(r2=0.43; p<0.0001)…………………………………………………….. 86
CHAPTER 3
1. Standard curves generated using real-time PCR for the „FPG‟
primers developed by Williams et al. (2002) for identification
and quantification……………………………………………………….. 123
2. Standard curves generated using real-time PCR for the „OPT‟
primers developed by Shilling et al. (1996) for identification
and quantification……………………………………………………….. 124
3. Relationship between DNA concentration and crown rot rating,
using single wheat stem extractions with the Mo-Bio kit and
the „FPG‟ primer in experiment EE-9……………………...…………… 135
4. Relationship between DNA concentration and crown rot
severity score, from 144 DNA extractions in experiment EE-10 made
with the Mo-Bio Ultra Clean Soil extraction kit and Q-PCR
with the „FPG‟primers…………………………………………………... 137
5. Relationship between DNA concentration and crown
rot severity score, from 144 DNA extractions in experiment
EE-10 made with the Mo-Bio Ultra Clean Soil
extraction kit and Q-PCR with the „OPT‟primers………………………. 138

xiv
CHAPTER 4
1. Crown rot severity of 11 wheat cultivars in screen
AE-1 treated with five F. pseudograminearum isolates
rated according to the leaf sheath sum method…………………………. 173
2. Crown rot severity rated according to the leaf sheath sum
(0 to 12) of Wildermuth and McNamara (1994) of
five PNW F. pseudograminearum isolates for four spring
wheat cultivars (Seri, 2-49, Sunco, and Macon) evaluated
during September and October 2007 (LSD = 0.81; CV = 59)………….. 174
3. Crown rot severity index calculated according to
Mitter et al. (2006) of five PNW F. pseudograminearum isolates
for four spring wheat cultivars (Seri, 2-49, Sunco, and Macon)
evaluated during September and October 2007
(LSD = 13.3; CV = 153)………………………………………………… 175
4. Linear regression of leaf sheath sum (0 to 12) and the
Nicol rating scale (0 to 10) systems (p<0.0001) averaged across
four cultivars and six method of inoculation treatments
in the AE-4 experiment…………………………………………………. 178
5. Response of four spring wheat cultivars to six different
methods of inoculation. The interaction between cultivars
and methods of inoculation was significant (p=0.04)…………………... 184
6. Relative ranking of cultivars for the seedling dip
method with a conidial concentration of 5 x 10⁵
according to the Nicol rating scale (0 to 10)……………………………. 189
CHAPTER 5
1. Distribution of crown rot severity ratings
(0 to 10; 10 = severe disease) based on a mean of the
three growth chamber screens for the Sunco/Macon population……….. 243
2. Regression scatter plot of crown rot severity for the
field versus the independent variable growth chamber
for the Sunco/Macon population (r=0.14; p=0.03)…………………….. 244
3. Distribution of crown rot severity ratings
(0 to 10; 10 = severe disease) based on a mean of the
three growth chamber screens for the Sunco/Otis population………….. 245

xv
4. Fusarium crown rot resistance quantitative trait locus
chromosome 3B identified in the Sunco / Macon population
across 3 growth chamber and one field screen utilizing
composite interval mapping (CIM)……………………………………... 246
5. Two crown rot resistance quantitative trait loci on
chromosome 3B identified in the Sunco/Otis population
across two growth chamber (inherited from Sunco) and one
field screen (inherited from Otis) utilizing
composite interval mapping (CIM)……………………………………... 247

1
CHAPTER 1
LITERATURE REVIEW
I. INTRODUCTION
Wheat (Triticum aestivum L.) production was approximately 659.3 million tons in
2009, which was second to maize (796.3 tons) and higher than rice (433.5) according to
Foreign Agricultural Service production statistics (USDA-FAS, 2009). Due to its
diversity of uses, protein content, and storage qualities, wheat is one of the most common
staple food crops for more than one-third of the world‟s population. Wheat originated in
southwestern Asia over 10, 000 years ago and is related to wild species that still can be
found in Lebanon, Syria, northern Israel, Iraq, and eastern Turkey. Breeding of wheat for
genetic improvements in crop production began in the early 1800s (Sleper and Poehlman,
2006).
Cook (2001) estimated that soil-borne root diseases cost the U.S. about 10 million
tons in wheat production annually. He also stated that the development of host plant
resistance is the most effective and affordable opportunity to combat soil-borne diseases.
Fusarium crown rot, caused by F. pseudograminearum (O‟Donnell & Aoki) (= F.
graminearum group I, = Gibberella coronicola) and F. culmorum (Wm. G. Sm.) Sacc. is
one of the most damaging soil-borne diseases of dryland wheat in the world, and in the
Pacific Northwestern (PNW) United States (Cook, 1992; Burgess et al., 2001; Backhouse
et al. 2004; Nicol et al., 2007). Crown rot is considered the most important Fusarium
disease of wheat in Australia (Burgess et al., 2001) and ranked second in economic
impact to Septoria leaf blotch (Septoria tritici (Rob ex. Desm.) = Mycosphaerella

2
graminicola (Fuckel) Schroeter), causing losses of AU$56 million annually (Chakraborty
et al., 2006). Infection by Fusarium crown rot results in rotting of the stems, crown, and
root tissues resulting in a chocolate-brown lesion in the crown region of wheat (Cook and
Veseth, 1991). Crown rot is typically associated with wheat production in semi-arid
areas where wheat matures under hot-dry conditions because the fungus colonizes
stressed plants during the grain filling period (Burgess et al., 2001).
An economic analysis conducted in 1994 from 13 fields evaluated for the impact
of crown rot estimated that yield loss represented 97 million kg (3.5 million bu.) in
production at a value of $13 million for the PNW region of the USA (Smiley et al.
2005a). Yield losses from crown rot have been documented to range from 9% to 89%
with an average of 9% in the PNW, with world wide losses exceeding 30% (Cook, 1992;
Kane, 1987; Burgess et al. 2001; Dodman & Wildermuth, 1987; Klein et al. 1991;
Hekimham et al., 2004). Smiley et al. (2005a) documented yield loss as high as 61%
following artificial inoculation with a mixture of five F. pseudograminearum isolates.
Yield loss estimates for bread wheat from surveys in Turkey range from 24% to 42% for
natural infections (Hekimhan et al. 2004; Nicol et al. 2001).
Yield loss resulting from Fusarium crown rot infection is difficult to assess on a
regional basis as infection occurs at or near the soil line and is not clearly visible
(Strausbaugh et al. 2004), with the exception of the formation of white heads for a brief
period of time prior to straw ripening (Burgess et al. 2001). White heads form as a result
of destruction of the vascular system by the fungus during colonization resulting in an
inability of the plant to transport water and nutrients to the head during grain filling. It is
also difficult to quantify the type and amount of soil-borne fungi responsible for infection

3
(Okubara et al. 2005). With recent advances in molecular technology, quantitative real-
time polymerase chain reaction (Q-PCR) technology, the amount and species of the
pathogens can be estimated. Smiley et al. (2005b) conducted extensive surveys of
northern Oregon and southeastern Washington, however the central northernmost
portions of Washington dryland wheat producing areas needed to be surveyed more
extensively. The first objective of this study was to survey Fusarium crown rot
distribution over a broader area throughout the northern and central Washington areas of
the PNW region. The second objective of this study was to assess the use of Q-PCR for
the quantification of pathogenic Fusarium DNA in soil and plant tissue as a potential
diagnostic tool for disease management.
Management of crown rot in the past has relied on cultural practices that provide
partial control and are not reliable for limiting damage (Cook, 1981; Paulitz et al. 2002;
Smiley and Patterson, 1996). Host plant resistance is the most efficient and reliable
approach to reducing yield losses due to Fusarium crown rot (Cook, 2001). Evaluation of
Fusarium crown rot cultivar resistance dates back to the 1960s in Australia (McKnight
and Hart, 1966; Purss, 1966). Evaluation of PNW germplasm by Smiley and Yan (2009)
showed there is a high degree of variation in varietal response to Fusarium crown rot over
years and across sites. As a result no cultivars in the PNW have been identified as being
consistently tolerant to the disease. Several isolates of Fusarium spp. have been collected
and cultured from the PNW. The third objective of this study was to assess wheat
cultivars to identify genes responsible for host plant resistance to these local isolates.
Currently there are no published results for mapping the partial genetic resistance to
Fusarium crown rot inherent in the Australian spring wheat cultivar „Sunco‟. The fourth

4
objective of this study was to identify quantitative trait loci for crown rot resistance in a
Sunco/Macon recombinant inbred line mapping population.
This literature review provides a synopsis of the history, surveys, biology and
epidemiology of Fusarium crown rot, greenhouse bioassay screening techniques,
identification of QTL for Fusarium crown rot resistance, and genetic characterization of
Fusarium species.
II. CROWN ROT CAUSED BY FUSARIUM SPP.: BIOLOGY, LIFE CYCLE,
AND HISTORY
Biology
Common names of crown rot include dryland foot rot, dryland root rot, foot rot,
Fusarium crown rot, and Fusarium root rot. Crown rot is caused by a complex of
Fusarium pseudograminearum (O‟Donnell & Aoki) (= F. graminearum group I, =
Gibberella coronicola), F. culmorum (Wm. G. Sm.) Sacc., Bipolaris sorokiniana (Sacc.)
Shoemaker (= Cochliobolus sativus), F. avenaceum (Fr.:Fr.) Sacc. (= Gibberella
avenacea), and Michrodochium nivale (Fr.) Samuels & I.C. Hallet (= Monographella
nivalis) (Cook, 1968; Cook and Veseth, 1991; Smiley et al., 2005a.; Nicol et al., 2006).
In Australia, and other parts of the world, 'crown rot' is the accepted common name of the
disease and is understood to be caused mainly by F. pseudograminearum and F.
culmorum (Burgess et al., 2001).
B. sorokiniana causes „common root rot‟ alone or in association with Fusarium
sp. (Cook and Veseth, 1991). Although the symptoms of common root rot and crown rot
are similar, the symptoms are distinguishable (Cook, 1968). Common root rot is
characterized by a dark brown to black discoloration of the sub-crown internode if caused
5
by B. sorokiniana, and chocolate to reddish brown symptoms on roots if caused by
Fusarium species (Purss, 1970; Cook and Veseth, 1991).
Typical symptoms of crown rot include a dark brown discoloration (with an
occasional pink tinge) of the crown region and lower one, two, or sometimes three
internodes (Cook, 1968; Cook and Veseth, 1991). Burgess et al. (2001) reported that
lesions extend to the fourth or fifth node and can be accompanied by salmon colored
sporodochia. Infection of the crown region leads to destruction of the vascular system
and the subsequent formation of white heads containing little to no seed (Cook, 1968;
Burgess et al. 2001; Nicol et al. 2001). Although there are several other soil-borne root
diseases that lead to the development of white heads in wheat, „white heads‟ are often
used as an indicator of crown rot injury (Burgess et al. 2001; Cook, 1968; Nicol et al.
2007).
The first visual symptoms of the disease on seedlings are a uniform browning of
the stem bases (Burgess et al. 2001). Cook (1968) conducted a time of infection study
and reported that initial infection occurred around 4 weeks after emergence. In that study
97% of the plants were symptomless 2 weeks after emergence. Cook (1968) concluded
that the initial infections occurred through openings made during crown root emergence.
He also postulated that disease development was limited during the winter, but resumed
in the spring and the disease life cycle followed that of the winter wheat. Symptoms and
adverse effects of crown rot are much more pronounced under drought conditions in
dryland wheat producing regions throughout Australia, Europe, North America, North
and South Africa, and West Asia, Turkey, and South America (Smiley et al. 2005a.;
Nicol et al. 2007; Chakraborty et al. 2006).
6
The dominant causal pathogen and occurence of Fusarium spp. within a given
location varies from year to year (Smiley and Patterson, 1996). Smiley et al. (2005b)
found that infection by F. pseudograminearum caused a greater incidence of lesions of
the sub-crown internode and crowns than B. sorokiniana or F. culmorum in field trials.
F. pseudograminearum and F. culmorum led to a greater abundance of white heads and
reduction in seedling stand than any of the other species involved in the infection
complex (i.e. B. sorokiniana, F. avenaceum, and Michrodochium nivale) at two locations
during 2003 and 2004. Yield was consistently reduced with F. pseudograminearum and
F. culmorum, but not with B. sorokiniana (Smiley et al. 2005b).
Life Cycle
The Fusarium crown rot pathogens survive in the soil as chlamydospores in dead
organic matter and plant debris (Paulitz et al. 2002). Summerell et al. (1990) found that
the main inoculum source was infected residue. Cook (1968) reported that Fusarium
culmorum survives in the soil as thick-walled chlamydospores embedded in organic
matter or formed within macroconidia. Chlamydospores have the potential for long-term
survival in soil and plant debris. Chlamydospores can form from macroconidia
(endoconidial chlamydospores) or hyphae (mycelial chlamydospores) (Cook, 1968;
Sitton and Cook, 1981; Inglis and Cook, 1986). Inglis and Cook (1986) reported that
endoconidial chlamydospores are the predominant type for F. culmorum in eastern
Washington wheat fields in Adams, Lincoln and Whitman counties. Of these
endoconidial chlamydospores most occurred in chains of two, three or four adjacent
intercalary macroconidial cells with little variation in shape. Sitton and Cook (1981)
showed that some chlamydospores formed from macroconidia of F. pseudograminearum

7
were short-lived (5.5 years) compared to chlamydospores formed from F. culmorum
macroconidia which survived 8.5 years.
Burgess et al. (2001) stressed that F. pseudograminearum persists in Australia as
hyphae in stem tissues that were colonized during the parasitic phase of the life cycle. In
dry and arid climates F. pseudograminearum dominates with infections localized to the
crown region (Figure 1). Its life cycle is readily distinguished from F. graminearum,
which produces the sexual stage (teleomorph Gibberella zeae) that results in formation of
perithecia and ascospores and leads to head infections (Nelson et al. 1981). Head (blight)
infections are rare with F. pseudograminearum or F. culmorum in an arid environment.
Inglis and Maloy (1983) were the first to report head scab caused by Giberella zeae on
irrigated wheat in eastern Washington.
Paulitz et al. (2002) reported that both F. culmorum and B. sorokiniana survive as
chlamydospores and pigmented conidia, either in plant residue or soil. Propagules infect
newly sown plants leading to the colonization of crowns and lower internodes (Nelson et
al. 1981). Infection of roots does not appear to be common (Burgess et al. 2001). Culms
become infected as an extension of crown infections. If inoculum is severe and
conditions are moist, infection prior to emergence can result in damping-off and seedling
death. Macroconidia are produced in infected crowns and return to the soil in debris as a
long-term inoculum source (Nelson et al. 1981).

8
Figure 1. Life cycle of Fusarium pseudograminearum (semi-arid climate) and F.
graminearum (humid climate), formerly known as Fusarium roseum and F. graminearum
Group 1 and Group 2, respectively (Nelson et al. 1981).
Fusarium head blight, caused by F. graminearum, occurs occasionally under
irrigated conditions or in high elevation (late maturing) areas but is not considered a
serious problem in the predominantly rain-fed PNW region (Paulitz et al. 2002).
Fernandez and Chen (2005) found that although F. culmorum and F. graminearum both
caused head blight infections, F. culmorum was the most virulent species on wheat
crowns. F. avenaceum, F. equiseti and F. poae were also evaluated and found be less
virulent on wheat (Fernandez and Chen, 2005).

9
Fusarium species limit yield by rotting seed, seedlings, roots, crowns, basal
stems, or heads (Smiley et al. 1996; Paulitz et al. 2002; Smiley et al. 2003). Infection of
seedlings and basal stems leads to yield loss from damaged seedlings, pre-harvest
lodging, and impaired grain filling (Schilling et al. 1996). Crown rot infection causes a
reduction in wheat straw production, grain yield, and grain quality (i.e. mainly test
weight). Crown rot tends to have a greater impact than other soil-borne root rotting
diseases in dryland or rain-fed wheat producing regions (Smiley et al. 2005a). Although
F. culmorum and F. pseudograminearum both cause significant yield reductions, the
latter tends to occur in the greatest frequency in Oregon and Washington (Smiley et al.
2005b). Occurrence of crown rot is favored by wet conditions shortly after seeding and
dry conditions between anthesis and maturity (Paulitz et al. 2002; Smiley et al. 1996).
History of Surveys of Fusarium Crown Rot
Burgess et al. (2001) stated that Hynes (1923) was the first to describe an isolate
of Gibberella saubinetii, which resembled the currently named Gibberella zeae
(teleomorph of F. graminearum) as the causal pathogen of crown rot. Hynes (1923)
described the fungus by its inability to produce perithecia in culture, from which others
have since postulated that it could have been the earliest evidence of F.
pseudograminearum occurring in wheat (Burgess et al., 2001). Burgess et al. (2001) also
stated that the earliest evidence of resistance to crown rot in published literature was
described in Australia by McKnight and Hart (1966).
According to Purss (1970), the earliest documented mention of resistance in
wheat to “foot rot” or common root rot was in Australia in 1922 by Hamblin (1922).
Purss (1970) further mentioned that Hynes (1938) was the first to confirm the resistance

10
identified by Hamblin (1922). Purss (1970) evaluated 18 cultivars from the world
collection, six from Canada, and eight local cultivars for resistance to common root rot.
„Gala‟, a cultivar with a high level of resistance to crown rot, was not as resistant to
common root rot. Purss (1970) summarized that although common root rot did not cause
significant above ground symptoms, its infection had an “insidious effect on the plant.”
At the time of this publication, resistance to common root rot and crown rot was thought
to be “multigenic” (Purss, 1970).
Economic damage from crown rot infections were first documented in the PNW
region of the U.S. in 1964 with estimated yield losses up to 50% (Cook, 1968). Cook
(1968) described the fungus as F. roseum Lk. (emend. Snyd. & Hans.) f. sp. cerealis
(Cke.) Snyd. and Hans.) and delineated the fungal cultivars as 'Culmorum',
'Graminearum', or 'Avenaceum'. Greater than 90% of the isolates from diseased fields in
Washington in 1964 were F. roseum f. sp. cerealis 'Culmorum' and F. roseum f. sp.
cerealis 'Graminearum', with 'Culmorum' predominating. F. roseum f. sp. cerealis
'Avenaceum' was isolated occasionally. The fundamental documentation of
nomenclature used to describe these species in literature is now F. graminearum, F.
culmorum, and F. avenaceum.
Cook (1968) was the first to conduct detailed survey studies of crown rot in
winter wheat in the PNW. Yield losses of 17% and 50%, respectively, were reported for
two winter wheat populations with different Fusarium population densities. Within the
last 40 years crown rot has been well documented throughout the Pacific Northwest
(PNW) wheat producing states of Washington, Oregon and Idaho (Cook, 1980; Smiley
and Patterson, 1996; Strausbaugh et al. 2004; Smiley et al. 2005a). More recent research

11
has shown yield losses in the 0 to 35% range, with an average of 9.5% in a study
evaluating 13 sites that had Fusarium infection in Washington and Oregon (Smiley et al.
2005a).
Burgess et al. (1975) conducted surveys in Australia and found that Fusarium
roseum ‘Graminearum‟ was the predominant pathogen associated with crown rot in the
eastern wheat belt of Australia during the 1972, 1973, and 1974 growing seasons.
Surveying was conducted by taking tiller samples from plants showing symptoms 50 to
75 m inside the field border in a 25 m arc during the time of white-head formation.
Isolates were identified as F. roseum „Graminearum‟ Group 1 isolates because they did
not form perithecia in culture or on sterile wheat straw. Burgess et al. (1975) confirmed
work by McKnight and Hart (1966) that found the predominant causal pathogen of crown
rot was F. roseum „Graminearum‟.
U.S. surveys for common and Fusarium root rots have been conducted in
California, Colorado, Wyoming, and Texas (Scardaci and Webster, 1982; Hill et al. 1983;
Specht and Ruch, 1988). In Colorado, Wyoming, and Texas the main pathogens
associated with common root rot were B. sorokiniana and F. acuminatum. Although F.
equiseti was frequently isolated in Texas, it was not virulent (Specht and Rush, 1988). In
California F. culmorum, F. graminearum, and B. sorokiniana were most frequently
isolated from cereals with root rot symptoms (Scardaci and Webster, 1982).
Klein et al. (1990) surveyed the incidence of white heads in wheat in the northern
areas of the wheat belt in New South Wales from 1976 to 1981. Sampling was conducted
by taking infected tillers from five sub-sites in a sampling arc located at least 150 m from
the field border. Incidence of white heads across cultivars was generally low (less than

12
5%), but their presence was associated with crown rot. Results showed the predominant
crown rot pathogen was F. graminearum Group 1 which was isolated from 97% of 1450
stems showing white head symptoms. F. equiseti and B. sorokiniana were frequently
isolated from stems and sub-crown internodes as well (Klein et al. 1990).
Smiley and Patterson (1996) surveyed 288 non-irrigated winter wheat fields in the
PNW during 1993 and 1994. Samples were collected from random fields by taking 15
stems and soil samples in a 10 to 15 m circle located 20 to 70 m into each field. F.
graminearum Group 1 was the dominant and most wide spread pathogen associated with
crown rot samples from 19 counties throughout the PNW region. Although F. culmorum
was widely distributed in soil, it was detected in plants half as often as F.
pseudograminearum. Complex interactions between cropping systems and the
environment influence pathogen distribution of these species. Smiley and Patterson
(1996) proposed “Fusarium foot rot” as the name used to describe the disease.
Smiley et al. (1996) evaluated crown and root rot diseases of winter wheat under
different crop rotations and cultural practices over 3 years (1989 to 1991) in the PNW.
Take-all (Gaeumannomyces graminis (Sacc.) Arx & D. Oliver var. tritici J. Walker) and
eyespot (Pseudocercosporella herpotrichoides (Fron.) Deighton) were associated with
high precipitation sites, while Rhizoctonia root rot (Rhizoctonia solani Kühn AG-8) and
Fusarium crown rot were favored by locations with drought conditions. Occurrence of
crown rot increased with increasing surface residue from previous crops as well as the
application of inorganic N fertilizers. The occurrence of crown rot also was greater under
annual cropping systems (continuous wheat). Overall root diseases were less prevalent in
wheat-pea rotations compared to annual and summer-fallow dryland wheat rotations.

13
Backhouse and Burgess (2002) conducted a climatic analysis of the distribution of
F. pseudograminearum, F. graminearum, and F. culmorum in Australia using the climate
matching system BIOCLIM. Records for this study were obtained from a survey
database at the University of Sydney Fusarium Research Laboratory. BIOCLIM aided in
describing Fusarium distributions through quantitative climatic data. F. graminearum
was most closely associated with warmer temperatures (greater than 18 oC) and high
rainfall (greater than 195 mm). F. pseudograminearum did not appear to be limited by
climatic conditions in this study as it was found to be very widespread. F. culmorum was
more limited in distribution as populations were associated with lower temperatures and
higher rainfall compared to F. pseudograminearum. Sitton and Cook (1981) and Smiley
and Paterson (1996) reported F. pseudograminearum tended to dominate in counties
where the maximum temperature in July was warmer than counties where F. culmorum
dominated.
Backhouse et al. (2004) conducted an extensive survey of 409 wheat, barley or
durum wheat fields from the eastern Australian grain belt from 1996 to 1999. F.
pseudograminearum was nearly the only pathogen isolated from samples, but F.
culmorum, F. avenaceum, F. crookwellense, and F. graminearum were also isolated. F.
culmorum accounted for more than 70% of isolates from samples collected from the high
rainfall region (Victorian > 500 mm) and the southeast region of Southern Australia. F.
culmorum represented 18% of the isolates collected from the moderate rainfall region
(350-500 mm), and 7% of the isolates from the mid-Northern low rainfall region. The
proportions of F. culmorum were significantly correlated with climatic conditions in this
study, especially November rainfall and temperature. It was concluded that F.

14
pseudograminearum dominated the region and F. culmorum was more confined to areas
with cooler temperatures and higher rainfall. The authors postulated that rainfall may
have a stronger influence on the occurrence of F. culmorum than temperature.
Surveys of root diseases were conducted in southern Idaho by Strausbaugh et al.
(2004) to identify the dominant soil-borne pathogens present in 133 wheat and barley
dryland (230 to 360 mm) and irrigated fields during 2001 and 2002. This region, known
as the Intermountain West Region of the PNW, is unique due to its high elevation and
cooler temperatures. F. culmorum and B. sorokiniana were isolated among other
pathogens including other Fusarium spp. (F. equiseti, F. reticulatum, F. acuminatum, F.
semitectum, F. tricinctum, and F. crookwellense), Rhizoctonia solani, and
Gaeumannomyces graminis var. tritici. Ninety-six percent of the fields sampled had
lesion nematodes (Pratylenchus spp.), 78% had stunt nematodes (Tylenchorhynchus spp.)
and cereal cyst nematodes (Heterodera avenae) to a lesser extent. The authors concluded
that F. culmorum is more prevalent in cooler climates and plant breeders should screen
for resistance to B. sorokiniana and F. culmorum. This study showed the prevalence and
importance of crown and common root rot pathogens in the PNW region and confirms
other literature that F. culmorum is associated with cooler temperatures. However, this
crown rot assessment was based on roots, not crowns. Burgess et al. (2001) suggested
that root infections of crown rot rarely occur in Australia with F.pseudograminearum.
Root infections are more common with F. culmorum infections (Dr. J. Nicol, personal
comm.).
Smiley et al. (2005a) conducted an extensive survey of crown rot in wheat and
barley in the PNW region of the U.S.. These trials were the first yield loss estimates for

15
the region in controlled field experiments. Yield loss was evaluated by analyzing
diseased tillers sampled from commercial fields and plots of cultivars inoculated with F.
pseudograminearum compared to non-inoculated naturally infested soils. Crown rot
decreased yield in 13 commercial fields by as much as 35% with an average of 9.5%.
Under inoculated conditions yield loss was as high as 61%. The incidence of crown rot
was the greatest in seasons with low precipitation and above ground symptoms were not
always obvious under moderate pathogen pressure (Smiley et al. 2005a). This research is
commonly cited and represents reliable controlled experiments to assess yield loss in the
Oregon and Eastern Washington regions of the PNW.
Smiley et al. (2005b) described the pathogenicity of fungi associated with the
crown rot complex in experiments conducted during 2003 to 2004 in greenhouse tests
and at two field locations. Pathogenicity was evaluated for 178 isolates in the
greenhouse, of five species (cited previously) involved in the „crown rot complex‟.
Twenty-four isolates of B. sorokiniana, F. culmorum, and F. pseudograminearum were
also evaluated in field experiments. Across experiments crown rot occurrence caused by
those species significantly reduced plant height, or was negatively correlated with plant
height. In field experiments with spring wheat, stand establishment and density of
mature heads were reduced with increased crown rot severity. F. culmorum and F.
pseudograminearum caused the greatest amount of yield loss and disease severity.
Smiley et al. (2005b) recommended that future research should use a mixture of isolates
to evaluate varietal resistance to be representative of native pathogen populations.
Bentley et al. (2006a) conducted surveys from wheat and other grasses in New
Zealand. Although F. oxysporum was isolated in the greatest frequency (20%), it was

16
secondary in causing disease to F. culmorum and F. pseudograminearum species. F.
culmorum was isolated from 16% of all wheat stems and F. pseudograminearum was
isolated from 1.5% of wheat stems. The authors concluded that the cool mild climate in
New Zealand compared to other regions led to the dominance of F. culmorum in the
crown rot complex.
The dominant species associated with Fusarium foot rot and head blight differs
among countries and occurrence is qualitatively related to climate (Backhouse and
Burgess, 2002). Prior to Bentley et al. (2006b) there were no detailed reports of the
relative distribution and importance of Fusarium species associated with crown and root
rot of wheat in Turkey. Random wheat samples were collected from three ecological
wheat producing regions in northern Turkey. Results indicated that of the 15 Fusarium
species isolated from wheat stem bases, F. culmorum was isolated most frequently at
28% of the sites sampled, and F. pseudograminearum was isolated from only 8% of the
sites.
Tunali et al. (2006) obtained 51 isolates representing 13 Fusarium species from
32 fields from a survey of Northern and Central regions of the Anatolian plain in Turkey.
Approximately 49% of the samples were taken from a region where the annual rainfall
exceeded 453 mm and 51% were taken from regions where annual precipitation was 252
to 452 mm. F. culmorum, F. pseudograminearum, and F. graminearum were isolated (in
that order of frequency) from discolored crown regions of the winter wheat cultivar
„Pehlivan‟ and identified as the most virulent species associated with crown rot in the
survey.

17
Chakraborty et al. (2006) provided an international review of literature on
Fusarium crown rot and head blight population structure and epidemiology. The review
reported that F. pseudograminearum is the dominant pathogen responsible for crown rot
in Australia and other arid parts of the world. Although crown rot has received less
attention than Fusarium head blight world wide, it occurs in most cereal producing
regions of the world including Australia, Europe, North America, South America, West
Asia, South Africa, and North Africa. The distribution of F. pseudograminearum and F.
culmorum in causing crown rot infections is most likely linked to climate as several
studies suggest that F. culmorum is the dominant pathogen in cooler / wetter climates
(Backhouse and Burgess, 2002; Strausbaugh et al. 2004; Smiley et al. 2005a). Several
studies have found that tillage and crop rotation have a significant effect on the
occurrence of crown rot in the PNW (Smiley et al. 1996; Paulitz et al. 2002).
Fusarium Crown Rot in Different Cropping Systems and Cultural Control
Much of the research documenting the impacts of cropping systems and soil
management practices on these soil-borne diseases was initiated in the mid-1960s (Cook,
1968). Smiley et al. 1970 reported that anhydrous ammonia NH3 fertilizer significantly
reduced Fusarium spp. (mainly F. culmorum) populations in a 4 to 5 cm zone of Palouse
silt loam and Ritzville silt loam soil in situ laboratory experiments. Later reports showed
little or no decline in the number of Fusarium spp. propagules in the soil tillage layer
following banding applications in field experiments due to an insufficient distribution of
anhydrous ammonia throughout the layer (Smiley et al. 1972).
Papendick and Cook (1974) provided the most comprehensive report of the
earliest evidence pertaining to cultural practices on the development of Fusarium foot rot

18
in eastern Washington. Experiments were conducted over three growing seasons (1970
to 1972) in Lincoln County to assess the effects of planting date, nitrogen fertilization
and planting density on the development of Fusarium foot rot caused by F. roseum f. sp.
„Culmorum‟ (currently referred to as F. culmorum). The research also utilized soil and
plant water potentials to assess the respective moisture content during the duration of the
studies. Results showed that high nitrogen rates (>60 kg N/ha) accompanied by increased
planting densities (60 kg seed/ha in rows 30 cm apart) resulted in the greatest occurrence
of Fusarium foot rot with the driest conditions and lowest water potentials of -42 bars in
June (Papendick and Cook, 1974).
Plant water potentials remained steady at -20 to -25 bars regardless of the
treatment until May (Papendick and Cook, 1974). The authors reported that lethal attacks
to plants by the disease occurred under drier plant water potentials of -35 to -42 bars
during June, while at -30 to -33 bars crown rot acted as a slow-decaying disease. High
nitrogen rates were more significant in determining disease severity than F. culmorum
inoculum density (propagules/g soil). The authors concluded that early planting, high
nitrogen rates, and high planting densities contributed to the development of lush
vegetative growth that resulted in greater transpirational capacities that led to increased
water deficit in April and early May resulting in elevated crown rot occurrence
(Papendick and Cook, 1974).
As mentioned previously, crown rot is severe following dry conditions between
anthesis and maturity (Nelson et al. 1981; Paulitz et al. 2002; Smiley et al. 1996). Field
conditions that are thought to contribute to a greater occurrence of Fusarium crown rot
and Pythium root rot include annual cropping, summer fallow cropping systems, early

19
planting, high nitrogen content in soil, and the presence of surface crop residue (Smiley et
al. 1996). Wildermuth et al. (1997) found that crown rot was significantly higher in
conservation tillage treatments where stubble was retained (32% infection) compared to
where it was removed through disc tillage (4.7% infection).
No-till and reduced tillage practices (conservation tillage) are becoming more
popular in Washington, Oregon, and Idaho (Paulitz et al. 2002). The total conservation
tillage acreage that accounts for no-till and reduced tillage practices represents 5.7% of
the acreage in the PNW region. Across the U.S., conservation tillage was practiced on
over 17% of the acreage in 2000 (Paulitz et al. 2002). These reduced tillage practices can
reduce operational costs and equipment depreciation as well as improve soil water
holding capacity, microbial activity and lead to reduced wind and surface erosion from
residue on the soil surface. However, tillage is often responsible for alleviating the
reproductive structures and host material of soil-borne pathogens involving Fusarium
spp. and Pythium spp. (Paulitz et al. 2002). The additional pressure from soil-borne
pathogens under conservation tillage practices has made growers reluctant to adopt the
technology (Paulitz et al. 2002).
Cultural methods for crown rot control include delayed planting dates and
optimized nitrogen applications to reduce late season water stress (Paulitz et al., 2002).
Because options for chemical control are limited and not cost effective, identifying
genetic resistance in wheat remains the most important tool to control crown rot (Cook,
2001; Yahyaoui et al. 2003).
Fusarium pseudograminearum remains the most prominent species and subject of
study for evaluating and developing genetic resistance in wheat populations. Australia

20
has made progress with the discovery of cultivars „Kukri‟ and „Sunco‟, which have adult-
plant resistance to F. pseudograminearum (Wallwork et al. 2004; Mitter et al. 2006). The
term 'adult-plant resistance' is often used to distinguish resistance evident in older plants
from that observed in seedling screening assays, and will be discussed in more detail in
subsequent sections.
Wildermuth et al. (2001) found that crown depth, which ranged from 17 mm to 2
mm (above ground), was correlated to the relative susceptibility of 13 cultivars to crown
rot (r2 = 0.57, P< 0.05). Results showed that as crown depth increased, relative
susceptibility of cultivars to crown rot increased, with the exception of „Sunco‟.
Cultivars with greater than 55% susceptibility to crown rot (based on a proportionate
scale of the highly susceptible cultivar „Puseas‟), had crown depths between 9.5 mm and
15.8 mm. The more resistant cultivars, such as „2-49‟, had crown depths shallower than
6.7 mm, with the exception of „Sunco‟ (crown depth = 17 mm) (Wildermuth et al. 2001).
Crown depth in seedlings was highly related to crown rot susceptibility in the
greenhouse as well (r2 = 0.8, p< 0.001). The correlation between crown depth measured
in the greenhouse and field were highly correlated (r2 = 0.9), as was the correlation
between crown depth (field) and relative cultivar susceptibility (r2 = 0.89). As the
planting depth of the cultivars increased from 25 mm to 75 mm, there was shallower
crown depth formation in more resistant cultivars („2-49‟ and „IRN497‟) but significantly
deeper crown depth formation for more susceptible cultivars („Kamilaroi‟ and
„Cunningham‟) (Wildermuth et al. 2001).
It has been postulated that the depth of crown formation in wheat could explain
two types of crown rot resistance; that of which can be detected in seedlings and adult

21
plants (common in cultivars such as „2-49‟) and resistance that can only be detected in
adult plants in the field (common in „Sunco‟ and „Pelsart‟) (Wildermuth et al. 2001).
This research documented that the depth of crown formation is a dominant genetically
controlled trait that is linked to partial resistance (Wildermuth et al. 2001). Methods of
screening for resistance in controlled environments are needed in order to evaluate a
range of wheat genotypes for resistance to crown rot (Wildermuth and McNamara, 1994).
III. BIOASSAYS FOR IDENTIFYING CROWN ROT RESISTANCE
Field screening of cultivars for disease resistance can be time-consuming and
limited by seasonal crop growing constraints and environmental variability (Wildermuth,
1994). Methods for screening plant material year around in greenhouses can be very
efficient for cultivar screening. Early efforts in the mid-1960s failed to adequately mimic
field inoculation of wheat with Fusarium to obtain crown rot symptoms at plant maturity
(Liddell, 1986). However, Burgess et al. (2001) reported that Purss (1966) found no
correlation between seedling blight in greenhouse tests and tolerance to mature plants in
the field using a “seed inoculation” technique. Subsequent studies found significant
correlations between greenhouse tests and field trials for crown rot disease ratings
(Wildermuth and McNamara, 1994; Mitter et al. 2006; Li et al. 2008).
A study was conducted to evaluate the inoculation potential of Fusarium-
colonized wheat chaff (Liddell, 1986). Results from these experiments showed that
sufficient inoculum was needed to cause uniform infection; however excessive amounts
skewed results by causing premature death of wheat plants (Liddell, 1986). Other
recommendations from this study encouraged the use of pasteurized soil to inhibit
secondary effects from soil microflora.

22
Wildermuth and McNamara (1994) evaluated wheat seedlings for resistance to
Fusarium grown in a controlled greenhouse environment to speed the process of selection
for Fusarium tolerance. Wheat and barley grain was autoclaved and colonized with F.
pseudograminearum. Wheat leaf sheaths were rated for necrotic lesions after 22 days.
Seedling evaluations were compared with mature plant ratings from wheat grown under
inoculated conditions in the field with a resulting correlation coefficient of r=0.78
(p<0.01). However, at growth chamber temperatures below 25 o C, differences among
cultivars for crown rot susceptibility were not as pronounced (Wildermuth and
McNamara, 1994). Furthermore, the use of this method requires a lot of greenhouse
space and can be inconvenient (Mitter et al. 2006).
Adult and seedling resistance have been documented. The seedling stage of
growth has been defined within the first 45 days, while a mature plant is considered an
adult for this comparison (Wallwork et al. 2004; Mitter et al. 2006). It appears that the
most resistant genotypes can be identified in seedling bioassays, but genotypes with
adult-plant resistance (such as that of „Sunco‟). Thus the potential for significant
resistance to crown rot to remain undetected in seedling screening programs exists
(Wallwork et al. 2004). Seedling resistance can be evaluated during the first 45 days of
the seedling phase of growth. Adult plant resistance is documented by evaluating mature
plants for crown rot symptoms and damage.
Wallwork et al. (2004) developed an improved method of screening wheat
cultivars for crown rot resistance. The method used seedlings grown in open-ended tubes
in galvanized baskets placed in outdoor sand-based terraces. This method was used to
detect adult plant resistance to F. pseudograminearum and F. culmorum. The authors

23
add that screening of plants in field-sown trials often is unreliable due to uneven natural
infection, contamination by other pathogens, or adverse environmental conditions that
affect results.
A refinement of these methods was conducted by Mitter et al. (2006). The
objective of these experiments was to find a method for screening high volumes of
seedlings for F. pseudograminearum resistance in a greenhouse environment. Single
seedlings were grown in square seedling pots, inoculated 13 to 14 days after planting
with F. pseudograminearum, and incubated under high relative humidity (60%/ 80% (+
or – 10%) day / night) conditions for 48 hours at 25 C. Following incubation, the original
growing conditions were restored and crown rot severity was assessed 35 days after
inoculation. Sixteen cultivars were compared using this technique in the greenhouse and
then followed by in-field evaluations where the plants were rated at maturity. The two
methods were highly correlated according to Spearman‟s rank correlation coefficient (rs =
0.987), proving that the greenhouse screening technique was sufficient to appropriately
screen cultivars for resistance to F. pseudograminearum (Mitter et al., 2006). Crown rot
severity for „Sunco‟ was 0.54 according to the crown rot index (CRI) calculated by the
authors (CRI = length of stem discoloration/seedling height) x (number of leaf sheaths
with necrosis).
Li et al. (2008) conducted the most recent research pertaining to seedling
inoculation for crown rot resistance. Experiments were conducted in the greenhouse to
evaluate soaking seedlings (age 1 to 4 days old) in a conidial suspension varying in
concentrations ranging from 5 x 10⁵ to 1 x 10
7 conidia per mL of solution (water + 0.1%
tween (v/v)). In addition to these treatments the duration of inoculation (1 to 10 min of

24
soaking), incubation period (0, 24, and 48 hr at 100% relative humidity and darkness), the
effect of water stress on crown rot symptom development, and comparisons to the Mitter
et al. 2006 stem droplet method were conducted. Plants were rated on the basis of a 0 to
5 scale (0=no disease; 5=severe crown rot symptoms). There was not any effect of
duration of inoculation or incubation period. However, increasing the conidial
concentration to1 x 106 conidia per mL resulted in greater levels of infection. Overall
disease severity was significantly greater than plants inoculated with the Mitter et al.
(2006) method. The authors summarized that this was a simple reliable method for
screening resistant germplasm, but did note that there was a high mortality among the
most susceptible cultivars evaluated with this seedling dipping method.
Seedling and adult plant screening bioassays described previously have been
useful in identifying Quantitative Trait Loci (QTL) for plant resistance (Wallwork et al.
2004; Collard et al. 2005; Bovill et al. 2006). Liu (1998) defined a QTL as “genes
affecting quantitative traits”, such as disease symptoms or signs.
IV. GENETIC RESISTANCE AND DEVELOPMENT OF MOLECULAR
MARKERS IN WHEAT
Host Plant Resistance to Crown Rot in Wheat
Purss (1970) commented that the first resistance for “foot rot” or common root rot
was mentioned around 1922 (Hamblin, 1922). World wide sources of resistance have
been evaluated since that time (Purss, 1966; McKnight and Hart, 1966; Purss, 1970;
Nelson and Burgess, 1994; Smiley et al. 2003). Although Cook (1968) surveyed several
fields, Smiley et al. (2003) was first reported quantifying cultivars for Fusarium
susceptibility in inoculated field experiments in the PNW. Nelson and Burgess (1994)

25
reported that a wide range of wheat genotypes had been evaluated over the prior two
decades. Nelson and Burgess (1994) evaluated nine cultivars of oats, barley, and wheat
for resistance and found oats to be the most resistant, followed by wheat and barley. In
fact, crown rot symptoms were not observed on any of the oat plants (Nelson and
Burgess, 1994).
Cook (2001) suggested that resistance could be due to escape or tolerance
mechanisms rather than true host resistance. He suggested the possibility that superior
performance of soft white winter wheat cultivars, when infected with F. culmorum under
dryland conditions in the PNW was associated with the ability to avoid or tolerate water
stress. Nelson and Burgess (1994) stated that although crown rot severity differed among
genotypes, complete resistance to infection had not been demonstrated in Australia.
Tolerance or resistance to crown rot and common root rot has been described as
„polygenic‟ (Purss, 1970; Burgess et al. 2001; Collard et al. 2005; Bovill et al. 2006).
Although various QTL have been identified for crown rot resistance, the analysis of trait
inheritance and genetic mapping in bread wheat has proven to be difficult due to the
complex genetic structure of hexaploid wheat (Sleper and Poehlman, 2006).
The Triticum species are grouped into three ploidy classes: diploid (2n = 2x = 14),
tetraploid (2n = 4x = 28), and hexaploid (2n = 6x = 42). There are currently 11 species of
diploid and tetraploid wheats and six hexaploid species. Triticum aestivum, common
hexaploid bread wheat, and Triticum turgidum, tetraploid durum wheat are most
important for commercial production (Sleper and Poehlman, 2006). Triticum timopheevii
is a wild tetraploid species and has been the source of several disease resistance genes
(Kammholz et al. 2001; Bovill et al. 2006).

26
Genetic Mapping
Genetic mapping is the determination of relative positions of loci along a
chromosome and is essential for quantitative genetic analysis (Lynch and Walsh, 1998).
According to Hartl and Jones (2006) „genes‟ are the elements of inherited traits that are
transmitted from parents to offspring in reproduction. „Alleles‟ are the different forms of
a particular gene (e.g. allele „A‟ or allele „a‟). The genotype is the genetic constitution, or
molecular make-up of an organism or cell. The phenotype is the observable properties
of a characteristic governed by the gene, which can be affected by the environment. A
genetic „marker‟ can be a variant in DNA that is a known gene, protein, or represent a
fragment of DNA without a known function. A gene can be considered a marker if it has
a known function and detectable variation. In order to be of use as an indirect selection
tool, the gene and the marker should be tightly linked, that is they should exhibit simple
inheritance that can be followed through generations (Hartl and Jones, 2006; Liu, 1998).
Genetic linkage is defined as the association or inheritance of genes located in
close proximity on the same chromosome (Liu, 1998). Linkage is estimated from the
degree of “recombination”, or the number of progeny phenotypes that are intermediate or
different than parental phenotypes. The recombination frequency between different
genetic loci is associated with the mathematical map distance between those loci. For
example, if there is a recombination frequency of 1 percent in progeny from a controlled
parental cross, then the genes of interest are located 1 map unit or centimorgan (cM)
apart, that is 1 map unit = 1% recombination = 1 centimorgan (Hartl and Jones, 2006;
Liu, 1998). Recombination results from random “crossing over”, the exchange of DNA

27
molecules between chromosomes during meiosis. If there is a high degree of
recombination, genetic linkage will be low (Hartl and Jones, 2006).
The maximum frequency of recombination between any two genes is 50%. For a
recombination frequency of 50%, two genes would be assumed to be on different
chromosomes and / or assorted independently. Genes are considered to be tightly linked
at recombination frequencies of 10% or less. A genetic map that includes all of the
known genes in a chromosome constitutes a “linkage group” (Hartl and Jones, 2006).
Mapping information can be useful in determining parental crosses and selection
strategies in a breeding program (Eagles et al. 2001). Efforts to combine the maps of
several important genotypes through molecular techniques have led to a more thorough
knowledge of the wheat genome (Somers et al. 2004). Molecular mapping through the
use of molecular markers allows for the generation of chromosome maps. Types of DNA
molecular markers include restriction fragment length polymorphism (RFLP), amplified
fragment length polymorphism (AFLP), random amplification of polymorphic DNA
(RAPD), and simple sequence repeats (SSR) microsatellite are DNA-based markers
(Eagles et al. 2001). Another common marker type utilized in molecular mapping are
known as single nucleotide polymorphisms (SNP).
A private institution known as „Triticarte‟ has used proprietary markers utilizing a
micro-array platform to generate numerous genetic maps of bread wheat and barley
(Akbari et al. 2006). These markers are typically known as „DArT‟ markers (Diversity
Arrays Technology ®
). The concept of the formation of these segments of DNA is
similar to that of AFLP. A restriction enzyme is used to digest (or cut) genomic DNA
into fragments. Adapters are annealed to fragments that are amplified with PCR.

28
Libraries of genomic representations are generated, cloned, denatured, and hybridized to
microarrays. These dominant marker clones are then scored for polymorphism through
the use of DARTSOFT analysis software, which utilizes ANOVA to statistically
calculate the difference between allele clusters. If two allele clusters are readily
distinguishable, and the between cluster variance was at least 80% of the total variance,
the clone is labeled „polymorphic‟ and deemed a satisfactory marker clone. DArT
marker technology will be utilized in this research to generate linkage maps for two
recombinant inbred line populations (Sunco/Macon and Sunco/Otis).
Detection of genes through the use of DNA markers allows for the quantification
of variation in genomic DNA. The utilization of methods including „gene pyramiding‟
and „rapid backcrossing‟ can be implemented through the use of molecular markers
(Eagles et al. 2001). In the case of gene pyramiding, several genes identified through the
use of markers are crossed into a single cultivar resulting in improved plant resistance.
Rapid backcrossing allows for the acceleration of the process of incorporating a trait into
a genotype (Eagles et al. 2001). Recently quantitative trait loci (QTL) for resistance to F.
pseudograminearum have been identified through DNA marker techniques in Australia
(Wallwork et al. 2004; Collard et al. 2005; Bovill et al. 2006).
Bread wheat (Triticum aestivum L.) has been genetically mapped for all 7
chromosome groups using RFLP-based molecular markers (Cadalen et al., 1997). The
first map of the cultivar „Sunco‟ was generated from doubled-haploid lines derived from
a cross of „Sunco‟ x „Tasman‟ (Chalmers et al., 2001). These linkage maps were
constructed with RFLP, AFLP, microsatellite markers, known genes, and proteins.
29
Identification of Quantitative Trait Loci (QTL)
Genes affecting quantitative traits are often referred to as Quantitative Trait Loci
(QTL) (Liu, 1998). However, a QTL is not a gene. Paterson (1998) defines a QTL as
“chromosomal locations of individual genes or groups of genes which influence complex
traits”. The QTL represents a region on the chromosome that is connected to, or
expresses, a quantifiable phenotypic trait of interest (e.g. disease resistance). Liu (1998)
describes a QTL as a term used to describe a situation when more than one gene is
responsible for a varying phenotype. Linkage between a gene, or genes of interest, and a
marker is the basis for QTL identification with the ultimate goal of marker assisted
selection (MAS) (William et al. 2007).
The first step in identifying a QTL is to develop a genetic map, of which requires
the development of a mapping population (recombinant inbred line, doubled haploid, F2
intercross etc.) from a controlled cross between parents for the trait of interest (Liu,
1998). For example, for mapping crown rot resistance a cross was made between a
partially resistant parent „W21MMT70‟ and a moderately susceptible parent „Mendos‟
(Bovill et al. 2006). Decisions of the parents depend on the objectives of the experiment,
but parents must have sufficient variation (i.e. polymorphic) for the trait of interest at
both the molecular (DNA) and phenotypic levels (Liu, 1998). Variation in parents at the
DNA level is essential for tracing recombination frequency (Liu, 1998).
Phenotypic polymorphism is variation in the degree of disease or trait of interest.
Genetic polymorphism between the parents can be defined as the detectable heritable
variation at a locus identified by a marker. Loci polymorphisms are inferred from marker
segregation patterns. If a marker segregates, that is it is polymorphic among the progeny

30
in a pattern, then it has heritable polymorphism. Microsatellite markers are often “hyper-
variable”, co-dominant in nature, and have high heterozygosity in many populations. An
acceptable genetic marker is polymorphic between parents, heritable, repeatable, and can
be genetically interpreted (Liu, 1998).
There are four steps to constructing a genetic map with a large set of markers; 1.
Pair wise linkage analysis for all possible two-locus combinations; 2. Group the markers
into different linkage groups; 3. Order markers within each linkage group; 4. Estimate
multi-point recombination fractions among the adjacent loci (Liu, 1998).
Determining robust recombination frequencies for molecular map development
are often conducted through the use of computer programs such as „Map Maker‟ (Lincoln
et al. 1993). MapMaker® is a computer program with the capability to calculate genetic
linkages through the use of molecular marker data. For QTL identification „QTL
Cartographer‟ is a commonly used computer program to calculate statistics correlating
phenotypic and genotypic recombination data to assign subsequent QTL locations to
marker locations on chromosomes (N.C. State Univ., Raleigh NC, 2004).
QTL Identification for Crown Rot Resistance in Wheat
Due to the difficulty in phenotypically assessing crown rot resistance, identifying
markers linked to resistance would facilitate cultivar development (Wallwork et al.
2004). Prior to 2004, there were no reports of the genetic location of resistance genes for
crown rot in wheat. Since Wallwork et al. (2004), three additional studies have mapped
QTL for crown rot resistance in bread wheat (Collard et al. 2005; Bovill et al. 2006; Ma
et al. 2009).
31
Wallwork et al. (2004) developed 100 doubled haploid (DH) homozygous inbred
lines from a Kukri („PR‟ parent)/Janz („S‟ parent) cross. The progeny of this cross was
screened in an outdoor terrace system inoculated with F. pseudograminearum and F.
culmorum and growth of lines to maturity to quantify adult plant resistance. Plants were
scored on the basis of a 0 to 5 rating system (0 = no disease; 5 = >75% disease
browning). A bulked segregant analysis (BSA) was conducted by pooling DNA into
resistant and susceptible groups. Wallwork et al. (2004) analyzed one hundred between-
bulk AFLPs for linkage with crown rot resistance in the 12 lines (6 susceptible lines and
6 resistant lines).
Wallwork et al. (2004) discovered the first crown rot (QTL) resistance locus in
wheat with polymorphic markers on chromosome 4B near the dwarfing gene Rht1 in the
cultivar „Kukri‟. The QTL was approximately 20 cM from the Rht1 locus. Collard et al.
(2005) confirmed this QTL on 4B at 19.8 cM using a seedling assay similar to
Wildermuth and McNamara (1994). The terrace disease-screening method was used to
evaluate lines carrying this QTL. A large proportion of the resistant lines were shorter
(having the Rht1 gene), whereas susceptible lines were taller. A correlation coefficient of
-0.59 was found between height and resistance (i.e. shorter lines were more resistant).
„Kukri‟ was documented as having adult plant resistance.
Collard et al. (2005) constructed a population of doubled-haploid lines from the
parental cross „2-49‟ (partially resistant) x „Janz‟ (susceptible). The combined effect of
the best marker associated with five crown rot resistance QTL identified by composite
interval mapping explained 40.6% of the overall phenotypic variance in resistance. The
QTL explaining the greatest variation were located on chromosomes 1D and 1A, with

32
LOD scores of 7.5 and 3.2 explaining 21% and 9% of the variation, respectively. These
resistance alleles were inherited from 2-49, but additional alleles were discovered on
chromosome 2B and inherited from the susceptible parent „Janz‟. Additional QTL were
identified on chromosomes 2A, 2B, 4B, and 7B.
Bovill et al. (2006) evaluated a doubled haploid population derived from a cross
between parental lines „W21MMT70‟ (partially resistant) x „Mendos‟ (moderately
susceptible). Three putative QTL were identified and located on chromosomes 2B, 2D,
and 5D with LOD scores of 5.6, 2.2, and 9.4, respectively. The authors postulated that
the resistance locus on the short arm of 2B was possibly from an introgression from T.
timopheevii. This introgression has been documented in „Sunco‟ (Kammholz et al.
2001). These QTL are the most recent and closely associated loci to identify genetic
potential resistance to F. pseudograminearum.
Both Collard et al. (2005) and Bovill et al. (2006) concluded that the resistance
loci identified on chromosome 2B, from the respective susceptible parents („Janz‟ and
„Mendos‟), was due to transgressive segregation. Collard et al. (2005) mentioned that
due to transgressive segregation, the 2B QTL may not show up in seedling screening
assays. The QTL on 2B (introgression from T. timopheevii) is also in close proximity to
the Sr36 resistance gene (Bovill et al. 2006). Collard et al. (2005) reported that the QTL
identified on 1DL, tightly linked by flanking markers (2.1 cM) and explaining 21% of the
variation, had the greatest potential for use in marker assisted selection (MAS). Collard
et al. (2006) confirmed the QTL on 1DL as being inherited from Gluyas Early and the
QTL on 2B was inherited from „Janz‟. However, screening of tightly flanked SSR
markers to the 1D and 1A QTL on a subset of elite wheat genotypes were not

33
polymorphic in all backgrounds. There is a need to identify more tightly flanking
markers for backcrossing to elite pedigrees (Collard et al. 2006).
Ma et al. (2009) reported the most recent QTL for resistance to Fusarium crown
rot from CSIRO in Australia. Ninety-two lines from a recombinant inbred line F8
mapping population was used in this study and derived from a cross between „CSCR6‟
and „Lang‟. The population was screened with Fusarium graminearum and F.
pseudograminearum isolates. The seedling dipping method using a conidial
concentration of 1x10⁶
as outlined by Li et al. (2008) was used for inoculation. A total of
six replicated trials were carried out on the mapping population (two for the F.
pseudograminearum isolate and four for the F. graminearum isolate). Correlations
between one of the F. graminearum screens was weak (r = 0.50), but strong for the other
four (ranging from r = 0.82 to 0.99).
A wheat DArT array consisting of 776 polymorphic markers were used in
conjunction with 54 SSR markers to generate a linkage map with a total distance of 912.9
cM. No markers were assigned to chromosomes 4D, 5D, or 6D. A total of 144 of the
markers were mapped to chromosome 3B.
QTL analysis revealed two QTL for the F. pseudograminearum isolate on
chromosomes 3BL and 4B using interval mapping (IM) with a LOD = 10.2 and 3.1 (for
trial #1), respectively. The QTL on the end of the long arm of chromosome 3B had a
LOD = 10.3 for both trials for F. pseudograminearum and a combined LOD = 11.1
explaining 41.6% of the variation in the data. The flanking DArT markers for the major
QTL on chromosome 3B were wPt10505 and wPt2277. Resistance QTL were detected
in the same location (3BL) and magnitude for all four F. graminearum isolate screening

34
trials. The authors postulated that crown rot resistance was not species-specific as the two
Fusarium isolates returned similar QTL with the same chromosomal location (3BL).
There were not any SSR markers identified in the region of the QTL on chromosome 3B.
To date a total of 11 QTL located on chromosomes 1A, 1D, 2A, 2B, 2D, 3B, 4B,
5D, and 7B have been identified and correlated to crown rot resistance. The only overlap
of QTL from these three studies was on chromosomes 2B and 4B. This illustrates genetic
variation in the crown rot resistance mechanism and the potential for „gene pyramiding‟
to enhance resistance (Bovill et al., 2005).
Marker Assisted Selection (MAS)
Markers for marker assisted selection are often identified through QTL analysis
and are those that are conserved among genotypes with a high degree of inheritance and
can be effectively used to select for the trait of interest (William et al. 2007). The use of
DNA markers to screen for genetic traits in marker-assisted selection (MAS) can be used
to screen large quantities of plant material in a relatively short period of time at a reduced
cost, compared to traditional breeding techniques (William et al. 2007). The application
of QTL analysis is the use of markers linked to a QTL in marker assisted selection
(Paterson, 1998). Until recently there has been little application of markers for use in
MAS in breeding programs due to a lack of reliable markers and economic feasibility
associated with transgressing multiple QTL regions into desirable germplasm (Paterson,
1998; William et al. 2007).
Currently there are some barriers to MAS (William et al. 2007). One is a lack of
applicable markers available for traits of interest. Many markers are associated with
qualitative traits, which can be more effectively screened with traditional phenotypic

35
methods (William et al. 2007). Although markers exist for certain genetic traits, selection
in a breeding program involves selecting for traits that involve additional factors for
which markers are not available. „Indirect selection‟ is a term used to describe the use of
a marker to select for a trait of interest including disease resistance (William et al. 2007).
Some of the advantages of indirect selection with markers would be as follows:
1) Screening for multiple genes for gene pyramiding; 2) Selecting for recessive traits; 3)
Expense in screening; 4) Use of lab or greenhouse facilities for screening (not limited by
seasonal and geographic considerations); 5) Heritability of traits (QTL may be affected
by the environment); 6) Early generation selection with low amounts of seed; 7) Early
detection or screening of young seedlings (William et al. 2007). A lack of confidence in
published results has been mentioned as an additional barrier to MAS. Another
disadvantage for MAS would be for users lacking resources to utilize MAS there can be a
high initial expense in establishing a lab with the proper instrumentation. Markers must
be reliable, repeatable, and must have been validated (William et al. 2007).
There are advantages and disadvantages to adopting MAS (William et al. 2007).
Genetic markers allow for the detection of differences at the molecular level. Thus MAS
allows for gene pyramiding, as individual genes responsible for a trait that can be
detected with markers may not otherwise be phenotypically expressed. This similar
concept can be applied to using markers to breed for a recessive trait that would
otherwise require an extra generation of selfing (William et al. 2007).
Depending on the resources of the end user, the expense of the MAS strategy can
be an advantage to the alternative expenses and time for labor and materials required for
field and greenhouse screening systems. However, if resources and instrumentation for

36
MAS are not available, one disadvantage can be the system can be substantially more
expensive to adopt initially. Acceptable markers can be an advantage to field screening
techniques by removing the element of environmental variation. Also seasonal
limitations of screening in the field in terms of time and pathogen pressure are by-passed
with MAS. The heritability can be much more accurate for these reasons as well, but
only for proven reliable markers. Assay requirements for protein and other quality
analysis at early generation selection stages are bypassed with MAS as well (William et
al. 2007).
Several researchers have expressed the need for improving methods to phenotype
plants as they can be time-consuming, laborious, and expensive (Wildermuth and
McNamara, 1994; Mitter et al. 2006; Nicol et al. 2007). Collard et al. (2006) stressed the
need for the development of markers closely linked to crown rot resistance for use in a
MAS program. Collard et al. (2006) summarized the process of finding a marker is a
process that involves several steps including but not limited to QTL identification,
confirmation of accuracy of the QTL location, and „marker validation‟ which refers to the
process of confirming the effectiveness of markers linked to putative QTL in one
mapping population in target backgrounds of other populations and germplasm. To date
none of the crown rot QTL have been confirmed in independent populations. Once a
durable marker is identified it must be polymorphic (or differ in size) in target genotype
backgrounds so it can be traced and used for indirect selection (Collard et al. 2006).
Collard et al. (2005) reported a major QTL located on chromosome 1D (QCr.usq-
1D1) with a LOD = 7.5 explaining 21% of the phenotypic variation from a 2-49 x Janz
population. Collard et al. (2006) was able to confirm that QTL in another background

37
population (Gluyas early x Janz), but screening of tightly linked SSR markers on a small
sample of elite wheat genotypes indicated that not all of the linked markers were
polymorphic in all backgrounds. Collard et al. (2006) summarized that there was a need
to identify more SSR markers linked to the QTL region of interest to evaluate for
polymorphism in elite germplasm backgrounds. The need remains for the identification
of durable SSR markers that can be used in MAS for crown rot resistance.
V. POPULATION DIVERSITY AND MOLECULAR CHARACTERIZATION OF
FUSARIUM SPECIES FOR IDENTIFICATION AND QUANTIFICATION
Symptoms of crown rot begin as small (0.5 to 4 cm) necrotic lesions on the
coleoptile, subcrown internode or leaf sheaths and progress to uniform browning from the
base of the stem to the fourth internode (Burgess et al. 2001). Traditional diagnostic
methods of identifying and re-isolating Fusarium species have been based on
morphological characteristics of conidia from cultures grown on nutrient weak selective
media (Burgess et al. 2001). Initially Fusarium graminearum was placed into two
groups, designated Group 1 and Group 2, distinguished within the anamorphic species on
the basis of host pathogenicity and the origin of the isolate (Burgess et al. 2001). Burgess
et al. (1988) reported the key diagnostic feature distinguishing the two groups was the
formation of homothallic perithecia of Gibberella zeae in Group 2 on carnation leaf agar.
Group 1 isolates did not form perithecia in culture and were presumably heterothallic.
The groups appeared to have different geographic distributions, with Group 1 being
found in hot and dry climates while Group 2 isolates were found in wetter climates.
Thus, distinguishing species involved in the root rot complex required a certain level of
mycological expertise (Burgess et al. 2001).

38
Root diseases caused by soil-borne pathogens are often present in the soil as a
complex and produce similar symptoms making it difficult to isolate and identify the
specific causal pathogen of the disease. Oftentimes symptoms of eyespot (caused by
Tapesia yullundae and T. acuformis anamorph Pseudocercosporella herpotrichoides),
Fusarium, Microdochium and common root rot (B. sorokiniana) are confused and
competition on media may favor one species over another (Nicholson et al. 1998). With
the advent of molecular techniques, such as PCR, DNA can be amplified and detected in
plant tissues and soil (Schilling et al. 1996). Fusarium graminearum Group 2 and F.
culmorum were distinguished using randomly amplified polymorphic DNAs (RAPD)
analysis (Shilling et al. 1996).
Schilling et al. (1996) were the first to develop diagnostic molecular PCR-based
assays for detecting differences among Fusarium species. SCARs (sequence-
characterized RAPD fragments) were used to generate primers in an attempt to
distinguish three Fusarium spp. The internal transcribed spacer region (ITS) of nuclear
ribosomal DNA were amplified with universal primers (OPT18 (SCAR2-35: 5‟-
GATGCCAGAC-3‟ and UBC85 (SCAR85): 5‟-GTGCTCGTGC-3‟) and analyzed for
sequence variation among Fusarium species.
The primer OPT18 amplified a fragment of 470 bp that was specific to F.
culmorum, whereas primer UBC85 amplified a distinct fragment of 410 bp specific to F.
graminearum Group 2. Although ITS sequences of F. culmorum and F. graminearum
were not polymorphic, there was sufficient variation between the ITS of F. culmorum / F.
graminearum and F. avenaceum, allowing for the development of species-specific
primers only for F. avenaceum. RAPD fragments were identified and used to develop
39
primers for selective amplification of F. culmorum and F. graminearum (Shilling et al.
1996).
The primers developed for F. culmorum correctly detected 65 of 69 F. culmorum
isolates (Shilling et al. 1996). The four that were undetected were confirmed to be F.
culmorum by morphological identification. Possibilities for non-amplification of these
primers were postulated to be due to alterations in annealing sites. This study also
assayed plant tissue for the presence of Fusarium species. The amplification of SCAR2-
35 (OPT18 primer) and SCAR85 (UBC85 primer) revealed the presence of both F.
culmorum and F. graminearum in plant-tissue extracts Shilling et al. 1996).
Nicholson et al. (1998) used RAPD assays to distinguish F. culmorum from F.
graminearum. Three primer pairs were used including OP-T01 (Fc01)
(GGGCCACTCA), OP-T16 (Fg16) (GGTGGACGCT), and OP-U17 (Fcg17)
(ACCTGGGGAG). The F. culmorum primer (Fc01) was used in the detection of
inoculum load and timing of inoculation on winter wheat stem bases infected with F.
culmorum. Fc01 detected all 21 F. culmorum isolates evaluated in this study. Analysis
of the ITS region of ribosomal RNA (rDNA) showed no differences between F.
culmorum, F. graminearum, or F. crookwellense (Nicholson et al. 1998). Primer Fcg17
detected both F. culmorum and F. graminearum, indicating the two species are closely
related as shown by Shilling et al. (1996). The F. graminearum primers (Fg16 and
Fg16N) were used to detect the trichothecene gene which was correlated to colonization
and virulence of F. graminearum on grain. PCR assays from wheat tissue were
positively correlated with disease severity ratings. The DNA detection limit was 1 pg for

40
both species. Primers specific to F. graminearum and F. culmorum were successfully
used to detect the presence of each pathogen in diseased rye and wheat tissues.
Aoki and O‟Donnell (1999a) observed morphological characters of 17 F.
graminearum Group 1 strains and 15 F. graminearum Group 2 strains to identify
differences between the groups. They also analyzed DNA sequence data from the β-
tubulin gene introns and exons of these groups and other Fusarium spp. to investigate
phylogenic relationships among them. Two species-specific F. pseudograminearum PCR
primer pairs were developed from the aligned translation elongation factor (EF-1α) gene,
which were Fp1-1 (5‟-CGGGGTAGTTTCACATTTC(C/T)G – 3‟) and Fp1-2 (5‟ –
GAGAATGTGATGA(C/G)GACAATA – 3‟).
Based on the ability to differentiate between F. graminearum Groups 1 and 2
through molecular techniques, Aoki and O‟Donnell (1999a) described F. graminearum
Group 1 as a distinct species, which they called “Fusarium pseudograminearum” with a
distinct phylogeny. A thorough description of F. graminearum Group 1 morphology and
growth habit was published by Burgess et al. (1975).
Morphological differences were reported between F. graminearum Groups 1 and
2 in width of 3- and 5-septate conidia (Aoki and O‟Donnell, 1999a). Conidia of Group 1
were typically widest at the middle septum compared to those of Group 2. The widest
position on the conidia of Group 2 strains were frequently 30% to 40% from the apex,
that is between the 1st and 2
nd septum for 3-septate conidia, and near the 2
nd septum for 4-
septate conidia, and between the 2nd
and 3rd
(middle) septum for 5-septate conidia (Aoki
and O‟Donnell, 1999a). The upper halves of the conidia of Group 2 are often thicker

41
than the bottom halves, whereas conidia of Group 1 (F. pseudograminearum) have a
symmetrical decrease in width from the middle region (Aoki and O‟Donnell, 1999a).
In summary, Aoki and O‟Donnell (1999a) described F. pseudograminearum on
the basis of four different characters: 1) slower growth rate on weak nutrient media
(SNA); 2) symmetrical decrease in conidial width from the middle septum; 3) uniform
length of 3-septate conidia formed under BLB light and complete darkness; and 4) the
absence of homothallic production of perithecia. The widest portion of the conidia was
described as the most reliable morphological characteristic for distinguishing F.
pseudograminearum from F. graminearum.
However, Aoki and O‟Donnell (1999b) found seven combinations of single-
conidial isolates of F. pseudograminearum (out of 153 possible combinations) that
yielded mature heterothallic perithecia of Gibberella sp. containing viable ascospores.
Molecular techniques serve as the most definitive method for identifying F.
pseudograminearum (Aoki and O‟Donnell, 1999a). Phylogenically F. graminearum
seems to be more closely related to F. culmorum than to F. pseudograminearum.
Williams et al. (2002) conducted PCR assays on 79 isolates of 12 different
Fusarium species. Primers were developed by cloning RAPD amplicons. A universal
primer combination comprised of OPB-07 (5‟ – GGTGACGCAG – 3‟) and OPD-03 (5‟ –
GTCGCCGTCA – 3‟) amplified a 1020 bp segment specific to F. pseudograminearum.
RAPD fragments were cloned and designated „FPG‟ with the sequences (FPG-F – 5‟ –
GTCGCCGTCACTATC – 3‟; FPG-R – 5‟ – CACTTTTATCTCTGGTTGCAG – 3‟).
This FPG species-specific primer set amplified 40 out of 42 F. pseudograminearum
isolates. Two isolates showed a mis-identification of F. pseudograminearum. AFLP
42
analysis of these mis-identified isolates showed they were more similar to F.
graminearum than F. pseudograminearum.
PCR assays to identify Fusarium species were validated by extracting DNA from
seedlings infected with single or multiple isolates, as well as by extracting DNA from
cultures from infected mature wheat stems (Williams et al. 2002). Seedlings were
inoculated with F. pseudograminearum, F. graminearum, and F. culmorum by placing a
3-mm PDA plug against the stem of young seedlings, covered by 2 cm of soil. DNA was
also extracted from cultures of field samples from mature wheat stems. DNA was
extracted from inoculated seedlings by freezing with liquid nitrogen, crushing to a fine
powder and extracting with several liquid chemical compounds and re-suspended in
10mM Tris-HCL, 1 mM EDTA (pH 8.0) containing 40 μg/mL RNAase. Purified DNA
was amplified with FPG (F. pseudograminearum species-specific primer), SCAR 2-35
(OPT-18 specific to F. culmorum), and SCAR 85 (UBC85 specific to F. graminearum)
(Williams et al. 2002).
In two out of three double inoculations to plants, amplicons were generated from
each primer set, indicating the primers ability to detect different species in inoculated
wheat tissue (Williams et al. 2002). SCAR 85 (UBC85) failed to amplify DNA from F.
pseudograminearum and F. graminearum. The SCAR 2-35 (OPT18) primer set
produced non-specific amplification from one of the seedlings infected with both F.
pseudograminearum and F. graminearum. In summary only the FPG and FAC primers
accurately identified F. pseudograminearum and F. acuminatum, respectively (Williams
et al. 2002).

43
Direct DNA extractions from mature wheat stems did not always produce reliable
amplification results, of which the authors attributed to potential polysaccharide
contamination of the extracts (Williams et al. 2002). A method was developed that
allowed for mycelial growth in the extraction tube and nine out of ten stems produced
enough mycelium for DNA isolation using this technique. Species-specific amplification
was successful for eight out of nine of these DNA extractions. In the ninth sample
amplicons were produced for both F. pseudograminearum and F. culmorum, and only the
former was cultured from five stem sections. The authors postulated that the presence of
F. pseudograminearum was most likely dominant in the stem. Although there was
enough F. culmorum was present in tissue to be amplified, it was more difficult to
subculture and isolate from stems. Genotyping isolates of Fusarium using AFLPs proved
to be reliable in this study (Williams et al. 2002).
More recently, PCR assays have been developed for the specific identification of
F. culmorum (Klemsdal and Elen, 2006; Leisova et al. 2006). Klemsdal and Elen (2006)
used nested PCR to increase sensitively and detect F. culmorum in infected cereal tissues.
They wanted to accurately detect the presence of F. culmorum to prevent contamination
of cereal products by its production of carcinogenic mycotoxins that are harmful to
humans and animals. The detection limit for F. culmorum was 5 to 50 fg of purified
target DNA and allowed the detection of 1% infected wheat seeds in a mixture of
uninfected grains. The authors concluded that the detection of F. culmorum in cereal
samples using the nested PCR method was 100 times more sensitive than previously
documented PCR methods. The method was also more efficient and cost effective for
commercial use.

44
Fusarium pseudograminearum and F. graminearum population distribution and
diversity
Several studies have evaluated the population dynamics of F.
pseudograminearum and F. graminearum in surveys in Canada and Australia (Scott et al.
2004; Akinsanmi et al. 2006; Mishra et al. 2006; Bentley et al. 2008). Surveys of
Fusarium species associated with crown rot and head blight have shown that F.
pseudograminearum is more closely associated with crown rot in the Queensland, New
South Wales, and Southern Australia regions, whereas F. graminearum is more localized
to moist regions of northern New South Wales and is more closely associated with
Fusarium head blight (Backhouse et al. 2004).
Akinsanmi et al. (2006) evaluated the genetic diversity of F. graminearum and F.
pseudograminearum using AFLP analysis. Sixty three of 149 AFLP loci were distinct
between the two species using X2 analysis. Results showed that 70 of 72 isolates of F.
pseudograminearum and 56 of 59 F. graminearum isolates had distinct haplotypes.
Phenotypic experiments were conducted between the two species for growth rate and
sporulation, but no statistical differences were found. The genotypic diversity of these
haplotypes was highly associated with aggressiveness for the two pathogen species.
Within fields, the spatial diversity of F. graminearum was high, while that of F.
pseudograminearum was low with a high degree of gene flow among isolates. The
authors concluded that these differences illustrated diversity expressed with the
homothallic sexual reproductive nature of F. graminearum versus the heterothallic
asexual reproductive nature of F. pseudograminearum.

45
Mishra et al. (2006) investigated the genetic diversity of F. pseudograminearum
populations from the Canadian provinces of Alberta and Saskatchewan. Nuclear
ribosomal DNA (nrDNA) intergenic space region (IGS) and inter-simple sequence-repeat
(ISSR) molecular markers were used to evaluate 26 isolates from infected wheat grains
collected during 1998 and 2000. Restriction analysis of the IGS region resulted in 12
polymorphic markers of 18 screened. ISSR resulted in 118 polymorphic markers of 120
screened. Genetic diversity and gene flow estimates within populations were high and
significant recombination within these populations was assumed. The authors postulated
that regular gene flow and random mating between isolates from different populations
could result in potentially damaging genotypes (Mishra et al. 2006). Amplified fragment
length polymorphism analysis (AFLP) from the Tef-1 gene (translation elongation factor
- 1α) revealed five distinctive clusters of Fusarium species that corresponded to F.
pseudograminearum, F. culmorum, F crookwellense, and Chionochloa rubra ssp. cuprea
(Bentley et al. 2006).
Bentley et al. (2008) assessed genetic diversity within and between populations of
217 isolates of F. pseudograminearum with AFLP analysis. These isolates were from
eight populations from three key regions of Australia; northeastern, south central, and
southwestern Australia. From the F. pseudograminearum population 176 haplotypes
were identified and grouped into two main clusters characterized by their geographic
origin (northeastern or southwestern Australia).
The southern populations were unique from the northeastern population by greater
levels of population differentiation and genetic identity amongst the populations. South
central and southwestern isolates were genetically similar with low genetic

46
differentiation. There were also high levels of gene flow within the northeastern
population, which was in agreement with Akinsanmi et al. (2006). However, there was
restricted gene flow between regions. It was hypothesized that populations from
northeastern and southern Australia were independent from different founding effects or
from geographic isolation. Although it has been postulated that sexual recombination is a
key factor in genetic diversity observed among F. pseudograminearum populations, it is
uncertain as the teleomorph Gibberella coronicola has been reported only occasionally in
field and laboratory conditions (Bentley et al. 2008).
Data from Bentley et al. (2008) confirmed this theory as PCR amplification of
conserved portions of mating loci (MAT-1 and MAT-2 loci) exhibited linkage
disequilibrium indicating a low level of sexual recombination in F. pseudograminearum
populations. These results were in contradiction with Akinsanmi et al. (2006) and are
more consistent with low sexual recombination that would be expected as F.
pseudograminearum reproduces mainly asexually via conidia. It was postulated that
under field conditions sexual recombination remains unknown, but is estimated to be
occasional, if at all. The differences in F. pseudograminearum population structure
between northeastern and southern Australia were attributed to selection, genetic drift,
population bottlenecks, and founder effects.
Quantitative (Real Time) Polymerase Chain Reaction for Fusarium quantification
In contrast to the conventional PCR approach, the advent of quantitative or „real
time‟ PCR (referred to as Q-PCR ) allows for the monitoring and quantification of DNA
during thermocycling. Q-PCR is convenient in pathological studies because it allows for
the quantification of pathogenic DNA that cannot be readily extracted or cultured from

47
host tissue or soil samples (Okubara et al. 2005). The sensitivity of Q-PCR detection is
high as symptomless plants can contain inoculum of the pathogen (Okubara et al., 2005).
The basis of Q-PCR is that the amplicon (or amplified PCR product) is monitored
(quantified) as the PCR thermocycler is going through the heating / cooling cycles
(Okubara et al. 2005). Through the use of a binding fluorescent dye (SYBR green 1) or
complementary probe to target DNA, the amplicon, can be detected and monitored
(Okubara et al., 2005). The point at which detection of the amplicon accumulates to
supersede background DNA levels is called the cycle threshold (CT). The CT level is
important because the quantity of target DNA is inversely proportional to the CT value
(Okubara et al., 2005). The greater the amount of initial DNA in the target sample, the
earlier the CT value (Stratagene, La Jolla, CA., 2004). The CT value and amplification
figures from the software associated with the real time thermocyclers are used to make
inferences about the quantity of the target DNA in the sample. These values are
calibrated from known concentrations of pathogens in soil and diseased plant tissue (rated
or quantified) to develop standard curves for assaying pathogen species extracted from
field soil and tissue samples (Hogg et al. 2007).
The simplest, least expensive, and most universal Q-PCR detection method is the
use of a universal fluorescent DNA dye called „SYBR green I‟ (Molecular Probes,
Eugene, Oreg.). SYBR green I binds to the minor groove of double-stranded DNA
within the region amplified by two PCR primers, and its florescence is detected by the Q-
PCR model thermocycler (Leisova et al. 2006). The fluorescence of bound SYBR green
1 dye is detectable because its fluorescence is about 20-fold greater than unbound dye.

48
The major disadvantage of Q-PCR systems is the relatively high cost of the equipment
(thermocyclers and supporting assay equipment) (Okubara et al. 2005).
Q-PCR has been successfully used for symptom diagnosis and culture-based
assessments from agricultural studies (Okubara et al. 2005). Q-PCR has been used in
several studies to quantify the amount of F. culmorum and F. pseudograminearum in
diseased wheat tissue (Leisova et al. 2006; Hogg et al. 2007). Leisova et al. (2006) used
Q-PCR to detect F. culmorum in infected seeds. The detection limit was 0.9 pg of F.
culmorum genomic DNA. Significant correlations were found (r2 = 0.98) between DNA
concentration, CT values, and deoxynivalenol (DON) content (a commonly used method
for assaying mycotoxins such as those produced by F. culmorum) of seed samples
inoculated with F. culmorum.
Strausbaugh et al. (2005) isolated Fusarium from wheat and barley roots common
to southern Idaho and rated root lesions in four growth chamber and two field assays.
They developed Q-PCR assays using TaqMan probes to quantify Fusarium crown rot in
diseased wheat and barley tissues. Primers Gzeae87T forward and reverse primers and a
Gzeae87T probe were developed from the trichodiene synthase (tri5) gene of F.
graminearum. However, the tri5 gene based primers were not species-specific and
amplified F. culmorum and F. pseudograminearum in addition to F. graminearum. The
primer set did not amplify pure cultures of F. avenaceum, F. acuminatum, F. semitectum,
F. equiseti, Rhizoctonia solani, Gaeumannomyces graminis var. tritici, Pythium spp. and
10 of the most common fungal saprophytes isolated from wheat and barley roots from
southern Idaho. F. culmorum infections resulted in the largest infected root area.
49
Field assays resulted in 245 and 307 root isolates at two locations, respectively,
and resulted in the following isolates in order of decreasing amplitude; F. culmorum, B.
sorokiniana, F. equiseti, F. acuminatum, F. reticulatum, F. semitectum,
Gaeumannomyces graminis var. tritici, F. chlamydosporum, F. crookwellense, other
Fusarium sp., and Rhizoctonia spp. (Strausbaugh et al. 2005). These assays were able to
detect F. culmorum in root tissue down to 61 pg. In greenhouse assays with F. culmorum
inoculated plants were found between the percent infected root area and Fusarium DNA
quantities in tissue. However, most Fusarium crown rot measures use a crown / basal
internode / lower stem based rating system (Burgess et al. 2001). Thus there was a need
to evaluate species-specific primers and compare them to crown rot severity ratings of
wheat stem bases (Hogg et al. 2007).
Hogg et al. (2007) used the (tri5) gene based primers and probes developed by
Strausbaugh et al. (2005) to relate 22 Fusarium species (including F.
pseudograminearum and F. culmorum), and additional isolates from 12 fungal species, to
field inoculated experiments during 2004 and 2005. The primer used in the study was
from the cloned fragment of the tri5 gene from a F. culmorum isolate and was designated
„Fusclone‟ with the forward sequence (5‟ – CGGGTCCAGATGTTTGCCAT – 3‟) and
the reverse sequence (5‟ – ACTGCTCAATCCAGCATCCC – 3‟). The Q-PCR assay
detected all of the Fusarium crown rot isolates, but did not amplify any of the other
species evaluated. The sensitivity of the assay was the greatest with F. graminearum
with step-wise diminishment from F. pseudograminearum to F. culmorum.
Field trials were inoculated with F. pseudograminearum. Disease severity scores
(DSS) and Fusarium DNA quantities were negatively correlated to yield and comparable

50
in predicting yield reductions with r values = -0.64 and -0.77, respectively. The location
or length of lesion up to the fourth internode did not appear to be correlated to DNA
quantities. The authors summarized that the Q-PCR assay used was able to accurately
estimate disease severity and subsequent yield loss from Fusarium crown rot infection
under inoculum pressure and favorable climatic conditions for disease development
(Hogg et al. 2007).
From these studies it appears that Q-PCR is an adequate tool for assessing
Fusarium populations in an epidemiological context. Traditional methods of plating and
identification are cumbersome and require mycological expertise. Furthermore, some
Fusarium spp. can be extracted from soil using dilution plating, but Q-PCR has been used
to more readily identify quantities of soil-borne pathogens from soil samples (Schroeder
et al. 2006).

51
VI. SUMMARY
Crown rot has been known to cause significant yield losses in wheat throughout
the PNW region of the U.S. and the world. Previously, there were no effective methods
of isolating and quantifying Fusarium sp. from soil samples. With the advent of Q-PCR
thermocyclers for amplifying pathogenic DNA, and published primers for F.
pseudograminearum and F. culmorum, levels of Fusarium sp. can be rapidly and
accurately quantified in plants and soil for use in epidemiological survey studies.
Although genetic resistance in cultivars has been identified, its genetic location would
facilitate breeding efforts. QTL, identified chromosomal regions of potential resistance
genes, have been identified for crown rot resistance through the utilization of high-
throughput greenhouse assays. Identification of QTL would allow for the potential use of
marker assisted selection (MAS) for applications of gene pyramiding and rapid
backcrossing of crown rot resistance genes into locally adapted PNW wheat cultivars.

52
LITERATURE CITED
Akbari, M., Wenzl, P., Caig, V., Carling, J., Xia, L., Yang, S., Uszynski, G., Mohler, V.,
Lehmensiek, A., Kuchel, H., Hayden, M., Howes, N., Shrp, P., Vaughan, P.,
Rathmell, B., Huttner, E., and Kilian, A. 2006. Diversity Arrays Technology
(DArT) for high-throughput profiling of the hexaploid wheat genome. Theor.
Appl. Genet. 113:1409-1420.
Akinsamni, O.A., Backhouse, D., Simpfendorfer, S., and Chakraborty, S. 2006.
Genetic diversity of Australian Fusarium graminearum and F.
pseudograminearum. Plant Path. 55:494-504.
Aoki, T., and O‟Donnell, K.O. 1999a. Morphological and molecular characterization of
Fusarium pseudograminearum sp. nov., formerly recognized as the Group 1
population of F. graminearum. Mycologia 91:597-609.
Aoki, T., and O‟Donnell, K.O. 1999b. Morphological characterization of Gibberella
coronicola sp. nov., obtained through mating experiments of Fusarium
pseudograminearum. Mycoscience 40:443-453.
Backhouse, D., Abubakar, A.A., Burgess, L.W., Dennis, J.I., Hollaway, G.J.,
Wildermuth, G.B., Wallwork, H., and Henry, F.J. 2004. Survey of Fusarium
species associated with crown rot of wheat and barley in eastern Australia.
Australas. Plant Path. 33:255-261.
Backhouse, D. and Burgess, L.W. 2002. Climatic analysis of the distribution of
Fusarium graminearum, F. pseudograminearum and F. culmorum on cereals in
Australia. Australas. Plant Path. 31:321-327.

53
Bentley, A.R., Cromey, M.G., Farrokhi-Nejad, R., Leslie, J.F., Summerell, B.A., and
Burgess, L.W. 2006a. Fusarium crown and root rot pathogens associated with
wheat and grass stem bases on the South Island of New Zealand. Australas.
Plant Path. 35:495-502.
Bentley, A.R., Tunali, B., Nicol, J.M., Burgess, L.W., and Summerell, B.A. 2006b. A
survey of Fusarium species associated with wheat and grass stem bases in
northern Turkey. Sydowia 58:163-177.
Bentley, A.R., Leslie, J.F., Liew, E.C.Y., Burgess, L.W., and Summerell, B.A. 2008.
Genetic structure of Fusarium pseudograminearum populations from the
Australian grain belt. Phytopathology 98:250-255.
Bovill, W.D., Ma, W., Ritter, K., Collard, B.C.Y, Davis, M., Wildermuth, G.B. and
Sutherland, M.W. 2006. Identification of novel QTL for resistance to crown rot
in the doubled haploid wheat population „W21MMT70‟ x „Mendos‟. Plant
Breeding 125:538-543.
Burgess, L.W., Wearing, A.H., and Toussoun, T.A. 1975. Surveys of Fusaria associated
with crown rot of wheat in eastern Australia. Aust. J. Agric. Res. 26:791-799.
Burgess, L.W., Liddell, C.M., and Summerell, B.A. 1988. Laboratory Manual for
Fusarium Research. 2nd
Ed. The University of Sydney, Sydney Aust.
Burgess, L.W., Backhouse, D., Summerell, B.A., and Swan, L.J. 2001. Crown rot in
wheat - Chapter 20 In Fusarium – Paul E Nelson Memorial Symposium. Edited
by Summerell, B.A., Leslie, J.F., Backhouse, D., Bryden, W.L., Burgess, L.W.
APS Press, the American Phytopathological Society, St. Paul, MN.

54
Cadalen, T., Boeuf, C., Bernard, S., and Bernard, M. 1997. An intervarietal molecular
marker map in Triticum aestivum L. em. Thell. and comparison with a map from
a wide cross. Theor. App. Genetics 78:495-504.
Chakraborty, S., C.J. Liu, V. Mitter, J.B. Scott, O.A. Akinsanmi, S. Ali, R. Dill-Macky,
J. Nicol, D. Backhouse, and S. Simpfendorfer. 2006. Pathogen population
structure and epidemiology are keys to wheat crown rot and Fusarium head blight
management. Australas. Plant Path. 35:643-655.
Chakraborty, S. 2006. A vital step towards controlling „Crown Rot‟.
http://www.csiro.au/csiro/content/standard/ps2is.html. CSIRO Media Release.
Chalmers, K.J., Campbell, A.W., Kretschmer, J., Karakousis, A., Henschke, P.H.,
Pierens, S., Harker, N., Pallotta, M., Cornish, G.B., Shariflou, M.R., Rampling,
L.R., McLauchlan, A., Daggard, G., Sharp, P.J., Holton, T.A., Sutherland, M.W.,
Appels, R., and Langridge, P. 2001. Construction of three linkage maps in bread
wheat, Triticum aestivum. Aust. J. Agric. Res. 52:1089-1119.
Collard, B.C.Y., Grams, R.A., Bovill, C.D., Percy, C.D., Jolley, R., Lehmensiek, A.,
Wildermuth, G., and Sutherland, M.W. 2005. Development of molecular
markers for crown rot resistance in wheat: mapping of QTL for seedling
resistance in a „2-49‟ x „Janz‟ population. Plant Breeding 124:532-537.
Collard, B.C.Y, Jolley, R., Bovill, W.D., Grams, R.A., Wildermuth, G.B., and
Sutherland, M.W. 2006. Confirmation of QTL mapping and marker validation
for partial seedling resistance to crown rot in wheat line „2-49‟. Aust. J. Agric.
Res. 57:967-973.
55
Cook, R.J. 1968. Fusarium root and foot rot of cereals in the Pacific Northwest.
Phytopathology 58:127-131.
Cook, R.J. 1980. Fusarium foot rot of wheat in the Pacific Northwest. Plant Dis.
64:1061-1066.
Cook, R.J. 1992. Wheat root health management and environmental concern.
Can. J. Plant Pathol. 14:76-85.
Cook, R.J. 2001. Management of wheat and barley root diseases in modern farming
systems. Australas. Plant Path. 30:119-126.
Cook, R. J., and Veseth, R. J. 1991. Wheat Health Management. American
Phytopathological Society, St. Paul, MN.
Dixon, R.A. and Lamb, C.J. 1990. Molecular communication in interactions between
plants and microbial pathogens. Ann. Rev. Plant Physiol. Plant Mol. Biol.
41:339-367.
Dodman, R.L., and Wildermuth, G.B. 1987. Inoculation methods for assessing
resistance in wheat to crown rot caused by Fusarium graminearum Group 1. Aust.
J. Agric. Res. 38: 473-486.
Douglas, C.L., Wysocki, D.J., Zuzel, J.F, Rickman, R.W., and Klepper, B.L. 1990.
Agronomic zones for the dryland Pacific Northwest. A Pacific Northwest
Extension Publication. PNW No. 354: 1-8.
Eagles, H. A., Bariana, H. S., Ogbonnaya, F. C., Rebetzke, G. J., Hollamby, G. L., Henry,
R. J., Henschke, P. H., and Carter, M. 2001. Implementation of markers in
Australian breeding. Aust. J. Agric. Res. 52:1349-1356.

56
Fernandez, M.R., and Chen, Y. 2005. Pathogenicity of Fusarium species on different
plant parts of spring wheat under controlled conditions. Plant Dis. 89:164-169.
Hamblin, C.O. 1922. “Foot rot” of wheat caused by the fungus Helminthosporium. The
Agricultural Gazette of New South Wales. 33:13.
Hartl, D.L. and Jones, E.W. 2006. Essential Genetics. 4th
Ed. Jones and Bartlett
Publishers, Sadbury, Mass. pg. 1-123.
Hekimhan, H., Ahmet B.S., Nicol, J.M., Arisoy, R.Z., Taner, S., and Sahin, M. 2004.
Dryland root rot: a major threat to winter cereal production under sub-optimal
growing conditions. Crop Science Congress, Brisbane Australia: 26 Sept. to 1
Oct. 2004. p. 1232-1336.
Hill, J.P., Fernandez, J.A., and McShane, M.S. 1983. Fungi associated with common
root rot of winter wheat in Colorado and Wyoming. Plant Dis. 67:795-797.
Hogg, A. C., Johnston, R.H, and Dyer A.T. 2007. Applying real-time quantitative PCR
to Fusarium crown rot of wheat. Plant Dis. 91:1021-1028.
Hynes, H.J. 1923. On the occurrence in New South Wales of Gibberella saubinetii, the
organism causing scab of wheat and other cereals. J. Proc. Roy. Soc. New S.
Wales. 57:337-348.
Hynes, H.J. 1938. Studies on Helminthosporium root rot of wheat and other cereals.
Department of Agriculture, New South Wales, Science Bulletin No. 61.
Inglis, D.A., and Cook, R.J. 1986. Persistence of chlamydospores of Fusarium
culmorum in wheat fields of eastern Washington. Phytopathology 76:1205-1208.
Inglis, D.A., and Maloy, O.C. 1983. Scab caused by Giberella zea occurring on irrigated
wheat in eastern Washington. Plant Dis. 67:827-828.

57
Kane, R.T., Smiley, R.W., and Sorrells M.E. 1987. Relative pathogenicity of selected
Fusarium species and Microdochium bolleyi to winter wheat in New York. Plant
Dis. 71:177-181.
Kammholz, S.J., Campbell, A.W., Sutherland, M.W., Hollamby, G.J., Martin, P.J.,
Eastwood, R.F., Barclay, I., Wilson, R.E., Brennan, P.S., and Sheppard, J.A.
2001. Establishment and characterization of wheat genetic mapping populations.
Aust. J. of Agric. Res. 52:1079-1088.
Keen, N.T. 1990. Gene-for-gene complimentarity in plant-pathogen interactions. Annu.
Rev. Gen. 24:447-463.
Klein, T.A., Burgess, L.W., and Ellison, F.W. 1990. Survey of the incidence of
whiteheads in wheat crops grown in northern New South Wales, 1976-1981.
Aust. J. Exp. Ag. 30:621-627.
Klein, T.A., Burgess, L.W, and Ellison, F.W. 1991. The incidence and special patterns
of wheat plants infected by Fusarium graminearum Group 1 and the effect
of crown rot on yield. Aust. J. Agric. Res. 42:399-407.
Klemsdal, S.S., and Elen, O. 2006. Development of highly sensitive nested-PCR method
using single closed tube for detection of Fusarium culmorum in cereal samples.
Letters in Applied Microbiology 42:544-548.
Leisova, L., Kucera, L., Chrpova, J., Sykorova, S., Sip, V., and Ovesna, J. 2006.
Quantification of Fusarium culmorum in wheat and barley tissues using real-time
PCR in comparison with DON content. J. Phytopathology 154:603-611.

58
Li, Y., Liu, C., Chakraborty, S., Manners, J., and Kazan, K. 2008. A simple method for
the assessment of crown rot disease severity in wheat seedlings inoculated with
Fusarium pseudograminearum. J. Phytopathology 156:751.
Liddell, C.M., Burgess, L.W., and Taylor, P.W.J. 1986. Reproduction of crown rot of
wheat caused by Fusarium graminearum group 1 in the greenhouse. Plant
Dis. 70:632-635.
Lincoln, S. E., Daly, M. J., and Lander, E. S. 1993. Constructing Genetic Linkage Maps
with MAPMAKER/EXP Version 3.0: A tutorial reference manual. Whitehead
Institute, Cambridge, MA.
Liu, B.H. 1998. Statistical Genomics: Linkage, Mapping, and QTL Analysis. CRC
Press, New York, USA. pg. 1-83.
Lynch, M. and Walsh, B. 1998. Genetics and Analysis of Quantitative Traits. Sinauer
Associates, Inc. Publishers, Sunderland Mass. pg. 379-441.
Ma, J., Li, H., Zhang, C., Yang, X., Liu, Y., Yan, G., and Liu, C. 2009. Identification
and validation of a major QTL conferring crown rot resistance in hexaploid
wheat. Theor. Appl. Genet. 6:1119-1128.
McKnight, T., and Hart, J. 1966. Some field observations on crown rot disease of wheat
caused by Fusarium graminearum. Queensland J. of Ag. and
Animal Sci. 23:373.
Mishra, P.K., Tewsri, J.P., Clear, R.M., and Turkington, T.K. 2006. Genetic diversity
and recombination with populations of Fusarium pseudograminearum from
western Canada. International Microbiology 9:65-68.

59
Mitter, V., Zhang, M.C., Liu, C.J., Ghosh, R., Ghosh, M., and Chakraborty, S. 2006. A
high-throughput greenhouse bioassay to detect crown rot resistance in wheat
germplasm. Plant Path. 55:433-441.
Nelson, P.E., Toussou, T.A., and Cook, R.J. 1981. Fusarium: Diseases, Biology and
Taxonomy. Penn State University Press, University Park, PA.
Nelson, K.E. and Burgess, L.W. 1994. Reaction of Australian cultivars of oats and
barley to infection by Fusarium graminearum Group 1. Aust. J. Exp. Agric.
34:655-658.
Nicholson, P., Simpson, D.R., Weston, G., Rezanoor, H.N., Lees, A.K., Parry, D.W., and
Joyce, D. 1998. Detection and quantification of Fusarium culmorum and
Fusarium graminearum in cereals using PCR assays. Physiological and
Mol. Plant Path. 53:17-38.
Nicol, J.M., Bolat, N., Bağcı,., M., Hekimkan, H., Tunalı., B., Bolat, N., Braun, H, J.,
Trethowan, R. 2004. Strategy for the Identification and Breeding of Resistance to
Dryland Root Rot Complex for International Spring and Winter Breeding
Programs.4th International Crop Science Congress, Brisbane, Australia, 2004.
Nicol, J.M, Rivoal, R., Trethowan, R.M., van Ginkel, M., Meroum, M., and Singh, R.P.
2001. CIMMYT‟s approach to identify and use resistance to nematodes and soil-
borne fungi, in developing superior wheat germplasm. In: 'Wheat in a Global
Environment'. Ed. Z. Bedo and L. Lang, Proceedings of the 6th International
Wheat Conference, 5-9 June 2000, Budapest, Hungary. Kluwer Academic
Publishers, Netherlands. pg. 381-389.
60
Nicol, J.M., Bolat, N., Bagci, A., Trethowan, R.T., William M., Hekimhan, H., Yildirim,
A.F., Sahin, E., Eleckcioglu, H., Toktay, H., Tunali, B., Hede, A., Taner, S.,
Braun, H.J., Van Ginkel, M., Arisoy, Z., Yorgancilar, A., Tulek, A., Erdurmus,
D., Buyuk, O., and M. Aydogdu. 2007. The International breeding strategy for
the incorporation of resistance in bread wheat against the soil-borne pathogens
(dryland root rot and cyst and lesion cereal nematodes) using conventional and
molecular tools. In: Wheat Production in Stressed Environments, H.T. Buck et
al. (eds.). pg. 125-137.
Okubara, P.A., Schroeder, K.L., and Paulitz, T.C. 2005. Real-time polymerase chain
reaction: applications to studies on soil-borne pathogens. Can. J. Plant Pathol.
27:300-3133.
Papendick, R.I., and Cook, R.J. 1974. Plant water stress and development of Fusarium
foot rot in wheat subjected to different cultural practices. Phytopathology 64:358-
363.
Paterson, A.H. 1998. Molecular Dissection of Complex Traits. CRC Press, New York,
USA. Pgs. 1-118.
Paulitz, T.C., Smiley, R.W., and Cook, R.J. 2002. Insights into the prevalence and
management of soil-borne cereal pathogens under direct seeding in the Pacific
Northwest, U.S.A. Can. J. Plant Path. 24:416-428.
Purss, G.S. 1966. Studies on varietal resistance to crown rot of wheat caused by
Fusarium graminearum. Qld. J. of Agric. and Animal Sci. 23:475.
Purss, G.S. 1970. Resistance to common root rot (Cochliobolus sativus) in wheat in
Queensland. Aust. J. of Exp. Ag. and Animal Hus. 10:497-501.

61
Saiki, R.K., Scharf, S., Faloona, F., Mullis, K.B., Horn, G.T., Erlich, H.A., and Arnheim,
N. 1985. Enzymatic amplification of B-globin genomic sequences and restriction
site analysis for diagnosis of sickle cell anemia. Science 230:1350-1354.
Scardaci, S.C. and Webster, R.K. 1982. Common root rot of cereals in California. Plant
Dis. 66:31-34.
Schilling, A.G., Moller, E.M., and Geiger, H.H. 1996. Polymerase chain reaction-based
assays for species-specific detection of Fusarium culmorum, F. graminearum, and
F. avenaceum. Phytopathology 86:515-522.
Schroeder, K.L., Okubara, P.A., Tambong, J.T., Lévesque, C.A., and Paulitz, T.C. 2006.
Identification and quantification of pathogenic Pythium spp. from soils in eastern
Washington using Real-Time Polymerase Chain Reaction. Phytopathology
96:637-647.
Scott, J., Akinsanmi, O., Mitter, V., Simpfendorfer, S., Dill-Macky, R., and Chakraborty,
S. 2004. Prevalence of Fusarium crown rot pathogens of wheat in southern
Queensland and northern New South Wales. Crop Science.
Found at http://www.cropscience.org.au/icsc2004/poster/2/4/2/1274_scottj.htm.
Sitton, J.W. and Cook, R.J. 1981. Comparative morphology and survival of
chlamydospores of Fusarium roseum „Culmorum‟ and „Graminearum‟.
Phytopathology 71:85-90.
Sleper, D.A. and Poehlman, J.M. 2006. Breeding Field Crops. 5th
Ed. Blackwell
Publishing, Ames, Iowa. pgs. 221-235.

62
Smiley, R.W., Cook, R.J., and Papendick, R.I. 1970. Anhydrous ammonia as a soil
fungicide against Fusarium and fungicidal activity in the ammonia retention zone.
Phytopathology 60:1227-1232.
Smiley, R.W., Cook R.J., and Papendick, R.I. 1972. Fusarium foot rot of wheat and peas
as influenced by soil applications of anhydrous ammonia and ammonia-potassium
azide solutions. Phytopathology 62:86-91.
Smiley, R.W., Collins, H. P., and Rasmussen, P.E. 1996. Diseases of wheat in long-term
agronomic experiments at Pendleton, Oregon. Plant Dis. 80:813-820.
Smiley, R.W. and Patterson, L.M. 1996. Pathogenic fungi associated with Fusarium foot
rot of winter wheat in the semiarid Pacific Northwest USA. Plant Dis. 80:944-
949.
Smiley, R., Whittaker, R., Gourlie, J., Easley, S., Rhinhart, K., Jacobsen, E., Petersen, J.,
Kidwell, K., and Campbell, K. 2003. Genetic tolerance of Fusarium crown rot of
wheat. Oreg. State Univ. Agric. Exp. Stn. Spec. Rep. 1047:40-52.
Smiley, R.W., Gourlie, J. A., Easley, S. A., Patterson, L.-M., and Whittaker, R.G.
2005a. Crop damage estimates for crown rot of wheat and barley in the Pacific
Northwest. Plant Dis. 89:595-604.
Smiley, R.W., Gourlie, J. A., Easley, S. A., Patterson, L.-M., and Whittaker, R.G.
2005b. Pathogenicity of fungi associated with the wheat crown complex in
Oregon and Washington. Plant Dis. 89:949-957.
Smiley, R.W., and Yan, H. 2009. Variability of Fusarium crown rot tolerances among
cultivars of spring and winter wheat. Plant Dis. 93:954-961.

63
Somers, D. J., Isaac, P., and Edwards, K. 2004. A high-density microsatellite consensus
map for bread wheat (Triticum aestivum L.). Theor. Appl. Genet. 109:1105-1114.
Specht, L.P. and Rush, C.M. 1988. Fungi associated with root and foot rot of winter
wheat and populations of Cochliobolus sativus in the Texas Panhandle. Plant Dis.
72:959-963.
Strausbaugh, C.A., Bradley, C.A., Koehn, A.C., and Forster, R.L. 2004. Survey of root
disease of wheat and barley in southeastern Idaho. Can. J. Plant Pathol. 26:167-176.
Strausbaugh, C.A., Overturf, K., and Koehn, A.C. 2005. Pathogenicity and real-time
PCR detection of Fusarium spp. in wheat and barley roots. Can. J. Plant Pathol.
27:430-438.
Summerell, B.A., Burgess, L.W., Klein, T.A., and Pattison, A.B. 1990. Stubble
management and the site of penetration of wheat by Fusarium graminearum
Group 1. Phytopathology 80:877-879.
Tunali, B., Nicol, J., Yelda Erol, F., and Altiparmak, G. 2006. Pathogenicity of Turkish
crown and head scab isolates on stem bases on winter wheat under greenhouse
conditions. Plant Path. J. 5:143-149.
Wallwork, H., Butt, M., Cheong, J. P. E., and Williams, K. J. 2004. Resistance to crown
rot in wheat identified through an improved method for screening adult plants.
Australas. Plant Path. 33:1-7.
Wildermuth, G.B., Thomas, G.A., Radford, B.J., McNamara, R.B., and Kelley, A. 1997.
Crown rot and common root rot in wheat grown under different tillage and
stubble treatments in southern Queensland, Australia. Soil Till. Res.
44:211-224.

64
Wildermuth, G.B., and McNamara, R.B. 1994. Testing wheat seedlings for resistance to
crown rot caused by Fusarium graminearum Group 1. Plant Dis. 78:949-953.
Wildermuth, G.B., McNamara, R.B., and Quick, J.S. 2001. Crown depth and
susceptibility to crown rot in wheat. Euphytica 122: 397-405.
William, H.M., Trethowan, R., and Crosby-Galvan, E.M. 2007. Wheat breeding assisted
by markers: CIMMYT‟s experience. Euphytica 10: 13 pgs.
Williams, K.J., Dennis, J.I., Smyl, C., and Wallwork, H. 2002. The application of
species-specific assays based on the polymerase chain reaction to analyze
Fusarium crown rot of durum wheat. Australas. Plant Path. 31:119-127.
Yahyaoui, A., Abido, H., Marrawi, N., Naeb, R.E., Nicol, J., Elahmed, A., Nachit, M.,
H., Ketata, Braun, H., Shulz, U., Rivoal, R. 2003. Cereal root diseases in West
Asia and North Africa. Wheat Breeding for Biotic Stress. The 1st Central Asian
Wheat Conference Proceedings, Almaty, Kahzachstan, June 10-13, 2003. p. 635-
636.

65
CHAPTER 2

66
CHAPTER 2
A SURVEY OF FUSARIUM CROWN ROT IN DRYLAND WHEAT IN THE
PACIFIC NORTHWEST OF THE U.S.
Grant Poole1, Richard W. Smiley
2, Timothy D. Murray
1, Julie M. Nicol
3, Kimberly
Garland-Campbell4, and Timothy C. Paulitz
4.
1Washington State University, Dept. of
Plant Pathology, Pullman, WA, 99164-6430; E-mail: [email protected]; FAX: 509-335-
9581; 2Oregon State University, Pendleton, OR.;
3CIMMYT International Maize and
Wheat Improvement Centre, Ankara, Turkey; 4
USDA-Agriculture Research Service,
Pullman, WA;.
ABSTRACT
Fusarium crown rot is one of the most widespread root and crown diseases of wheat in
the Pacific Northwest of the U.S. but its distribution in specific areas of the Pacific
Northwest remains unknown. Accurate surveys of pathogen and disease presence are
needed to determine the extent and damage due to crown rot. Surveys were previously
conducted in northern Oregon and south central Washington in 1993 and 1994,
representing a more arid region within the Pacific Northwest. Our objectives were to
conduct a survey covering the diverse dryland wheat-producing areas of Washington and
Oregon and to determine the geographic species distribution of causal agents of Fusarium
crown rot. In this study 105 fields were surveyed during 2008 and 2009. One-thousand
and fifty tillers were cultured of the study to obtain 768 isolates. Crown rot symptoms
were reported in every field in both years with a crown rot severity rating ranging from
67
0.18 to 5.12 in 2008 and 0.48 to 5.42 in 2009. Isolates of Fusarium spp. were obtained
from 99% of fields in 2008 and 97% of fields in 2009. Fusarium culmorum was isolated
from 31% of the symptomatic stems surveyed, closely followed by F.
pseudograminearum isolated at a frequency of 30% (symptomatic stems) averaged over
both survey years. The 2 year mean field proportions where only F. culmorum or F.
pseudograminearum were isolated was 33% and 36%, respectively, while both species
were isolated from 26% of the fields, while 5% of the fields contained isolates of minor
species or no isolations. Overall isolation frequency means for other minor species
included F. crookwellense, F. acuminatum, F. equiseti, and Bipolaris sorokiniana at
13%, 1%, 1%, and 2%, respectively. Species composition and disease severity varied
significantly among climatic regions. F. pseudograminearum occurred in significantly
greater frequency in areas of the PNW with hotter and drier weather patterns (Region 5),
whereas F. culmorum occurred in greater frequency from regions with moderate to high
moisture and cooler temperatures (Regions 1 and 4). Isolates of F. pseudograminearum
and F. culmorum were capable of infecting and causing Fusarium crown rot symptoms on
winter wheat cultivars.
INTRODUCTION
Crown rot is one of the most widespread root and crown rot diseases of dryland
wheat (Triticum aestivum L.) and barley (Hordeum vulgare L.) in the Pacific Northwest
(PNW) region of the United States (Smiley et al. 2005a). This disease causes average
annual yield losses of 9.5% at a value of U.S. $13 million in the PNW (Smiley et al.
2005a). Crown rot infections limit yield by rotting seed, seedlings, roots, crowns, and

68
basal stems resulting in seedling mortality, premature lodging, and impaired grain filling
(Smiley et al. 1996; Schilling et al. 1996; Paulitz et al. 2002).
Smiley et al. (2005a) conducted a survey of crown rot in wheat and barley in the
PNW accompanied by yield loss estimates. Crown rot decreased yield in 13 commercial
fields by as much as 35%, with an average of 9.5%. Under inoculated conditions yield
loss was as high as 61%. The incidence of crown rot was the greatest in seasons with low
precipitation and aboveground symptoms were not always obvious even under moderate
disease pressure (Smiley et al. 2005a).
Crown rot is caused by a complex of Fusarium pseudograminearum (O‟Donnell
& Aoki) (= F. graminearum group I, = Gibberella coronicola), F. culmorum (Wm. G.
Sm.) Sacc., and Bipolaris sorokiniana (Sacc.) Shoemaker (= Cochliobolus sativus),
(Cook, 1968; Cook and Veseth, 1991; Smiley et al., 2005a; Nicol et al., 2006). Other
pathogens of lesser importance capable of causing crown infection include F. avenaceum
(Fr.:Fr.) Sacc. (= Gibberella avenacea) and Microdochium nivale (Fr.) Samuels & I.C.
Hallett (= Monographella nivalis) (Smiley et al. 2005a). F. pseudograminearum and F.
culmorum are the most dominant pathogens causing crown rot in the PNW. It is widely
accepted that F. pseudograminearum is the dominant species responsible for causing
crown rot in arid regions of the PNW and Australia (Burgess et al. 1975; Backhouse and
Burgess, 2002; Chakraborty et al., 2006; Smiley et al. 2005b). „Crown rot‟ is generally
the accepted name when Fusarium spp. are the dominant causal pathogens, and „common
root rot‟ is the term that describes the disease when B. sorokiniana is the causal pathogen
(Purss 1970; Burgess et al. 2001; Cook and Veseth, 1991; Smiley et al. 2005a).

69
Although the symptoms of „common root rot‟ and „crown rot‟ are similar, they are
distinguishable (Cook, 1968). The disease caused by B. sorokiniana is characterized by a
dark brown to black discoloration of the sub-crown internode, whereas Fusarium species
cause chocolate to reddish brown symptoms on roots or shoot internodes (Purss, 1970;
Cook and Veseth, 1991). Burgess et al. (2001) suggested that lesions extending to the
fourth or fifth node were accompanied by salmon-colored sporodochia, which are masses
of macroconidia. The infection of the crown region leads to a constriction of the vascular
system and the subsequent formation of whiteheads containing little to no seed (Cook,
1968; Burgess et al. 2001; Nicol et al. 2001). Whiteheads are often used as an indicator
of crown rot injury and as a measure to quantify the amount of disease present (Burgess
et al. 2001; Cook, 1968; Nicol et al. 2007).
Several Fusarium surveys have been conducted throughout the world (Cook,
1968; Smiley and Patterson, 1996; Smiley et al. 2002; Backhouse and Burgess, 2002;
Backhouse et al. 2004; Smiley et al. 2005a). The earliest documentation of Fusarium
crown rot in the PNW was reported by Cook (1968). Yield losses of 17% and 50%,
respectively, were reported for two winter wheat fields with different densities of
Fusarium populations. Cook (1968) described the fungus as F. roseum Lk. (emend.
Snyd. & Hans.) f. sp. cerealis (Cke.) Snyd. and Hans. and delineated the fungal cultivars
as being 'Culmorum', 'Graminearum', or 'Avenaceum'. Greater than 90% of the isolates
from diseased fields in Washington in 1964 were F. roseum f. sp. cerealis 'Culmorum'
and F. roseum f. sp. cerealis 'Graminearum', with 'Culmorum' being predominantly
present. F. roseum f. sp. cerealis 'Avenaceum' was isolated occasionally from those
samples. Studies conducted in the U.S. states of California, Colorado, Wyoming, and
70
Texas found that F. culmorum, F. graminearum, and B. sorokiniana were most
commonly associated with root and crown rot symptoms (Scardaci and Webster, 1982;
Hill et al. 1983; Specht and Rush, 1988). Results from surveys were conducted in the
PNW in 1993 and 1994 from 288 dryland fields showed F. pseudograminearum was the
dominant pathogen, with F. culmorum detected less often (Smiley and Patterson, 1996).
Complex interactions between cropping systems and the environment influence the
distribution of these species (Smiley et al. 1996). Trends have been reported where F.
pseudograminearum dominated in areas where the maximum temperature in July was
warmer (31o C) than counties where F. culmorum dominated (28
o C) (Sitton and Cook,
1981).
Smiley and Patterson (1996) conducted an extensive survey of the PNW region
and reported the occurrence of F. pseudograminearum was more frequent than F.
culmorum in nine counties and the opposite was true in three counties. F. culmorum was
more prevalent than F. pseudograminearum in Lincoln and Adams counties in 1993 and
only Lincoln county in 1994. The percentages of fields yielding isolates of F.
pseudograminearum were higher (40% in 1993 and 23% in 1994) than F. culmorum
(20% in 1993 and 10% in 1994) in both survey years. There was a significant correlation
between precipitation and elevation with the occurrence of F. pseudograminearum (r2 =
0.46, P = 0.05) suggesting that its occurrence may be less prevalent as both elevation and
temperature increase. There also was a weak but consistent correlation of F.
pseudograminearum occurrence with the mean monthly temperature during July (r2 =
0.42, P = 0.06). Smiley and Patterson (1996) concluded that there were no relations
between the occurrence or frequency of Fusarium foot rot pathogens with six agronomic

71
zones defined by Douglas et al. (1990). The authors also concluded that F.
pseudograminearum was the dominant pathogen responsible for causing Fusarium crown
rot throughout the region.
In Australia, Burgess et al. (1975) found that F. graminearum Group 1, now
referred to as F. pseudograminearum, was the dominant pathogen responsible for crown
rot infection. Klein et al. (1990) surveyed fields in Australia and found that whitehead
occurrence was correlated to crown rot occurrence with F. graminearum Group 1 as the
dominant pathogen isolated. Backhouse and Burgess (2002) conducted a climatic
analysis of the distribution of Fusarium spp. and found F. pseudograminearum did not
appear to be limited by climatic conditions as it was found to be very wide-spread. F.
culmorum was more limited in distribution and populations were associated with lower
temperatures and higher rainfall compared to F. pseudograminearum. The authors also
utilized 16 climatic parameters to conduct a Principle Component Analysis (PCA) where
the first two principle components explained 52% and 21%, respectively, of the variation
in the survey data set. Survey sites were clustered in accordance with the first principle
component in two clusters which corresponded to winter and summer rainfall. The
authors concluded that the distribution of F. culmorum was less restricted in the
predominantly winter rainfall cluster. The sites from which F. culmorum was collected
tended to be clustered in areas with low temperature (<22 oC)
and higher levels of rainfall
(>350 mm). .
Backhouse et al. (2004) surveyed wheat, barley or durum wheat fields from the
low rainfall (250 to 500 mm) areas near Qeensland and New South Wales eastern
Australian grain belt finding F. pseudograminearum as nearly the only pathogen

72
(approximately 99%) isolated from samples. However, F. culmorum was isolated from
70% of samples from the Victorian high rainfall region (>500 mm). Other species
isolated included F. avenaceum, F. crookwellense, and F. graminearum.
Strausbaugh et al. (2004) found that F. culmorum and B. sorokiniana were the
soil-borne pathogens most frequently isolated from 81 wheat fields and 52 barley fields
from 13 counties in Southeastern Idaho during 2001 and 2002, among other pathogens
including other Fusarium spp. They documented the prevalence and importance of crown
and common root rot pathogens throughout Idaho and confirmed other literature
associating F. culmorum with cooler temperatures. Smiley and Patterson (1996) and
Smiley et al. (2005a) conducted extensive surveys of Fusarium spp. throughout northern
Oregon and southeastern Washington, but there remained an extensive area in north
central and eastern Washington that needed to be surveyed for Fusarium crown rot.
Many of these areas have different climatic conditions than regions previously surveyed.
Douglas et al. (1990) published agronomic zones developed on the basis of
growing degree days, precipitation, and soil depth (Table 1; Figure 1). Average annual
precipitation and growing degree days were calculated based on 30 year National
Weather Service data. The information on soil depth was obtained from soil surveys
published by the Soil Conservation Service. Cropping system information was
summarized for each zone by the authors to further characterize and define each
agronomic zone. The zones were suggested for use as a geographical base for
extrapolating research results (Figure 1).
The objective of this work was to; 1. determine crown rot occurrence and
Fusarium species distributions covering the broad geographic region comprising the

73
major wheat producing areas of Washington and Oregon; 2. analyze survey results
according to the agronomic zones developed by Douglas et al. (1990).
Table 1. Pacific Northwest Agronomic zones, the number of field collection sites within
each zone, and parameters used to develop the respective zones.
Number Characteristics
Agronomic of fields of climatic Precipitation Soil
zone1 sampled region
3 (mm)
4 GDD
5 Depth (m)
6
per zone2
1. Annual Crop 5 Wet Cold >400 <700 ---
2. Annual Crop 18 Wet Cool >400 700-1000 ---
3. Annual Crop 7 Fallow-transition 350-400 700-1000 > 1m
4. Annual Crop 20 Dry 250-400 <1000 < 1m
5. Grain fallow 41 Dry <350 NA > 1m
6. Irrigated 9 Hot dry summers NA NA
Irrigation required 1
Agronomic zones were developed by Douglas et al. (1990) and Douglas et al. (1992) on
the basis of precipitation, growing degree days, and soil depth. 2
Number represents the number of fields that were sampled within each agronomic zone
in the Fusarium crown rot survey conducted in 2008 and 2009. 3
Characteristics of each climatic region were developed on the basis of precipitation,
temperature and cropping system wherever each was appropriate to characterize the
respective region. „Wet‟ areas received over 400 mm, and „Dry‟ areas were placed into
two subclasses (250 to 400 mm and 350 to 400 mm). 4
Precipitation values were obtained for the National Weather Service 30 year
precipitation records. 5
GDD = Growing degree days were calculated by adding daily maximum and minimum
air temperatures (oC) and dividing by two, discarding values less than zero and summing
GDD values accumulated from 1 Jan – 31 May. 6
Soil depth was estimated on the basis of Soil Conservation Service County soil survey
maps and was included in zone delineation as an indicator of water storage capacity.
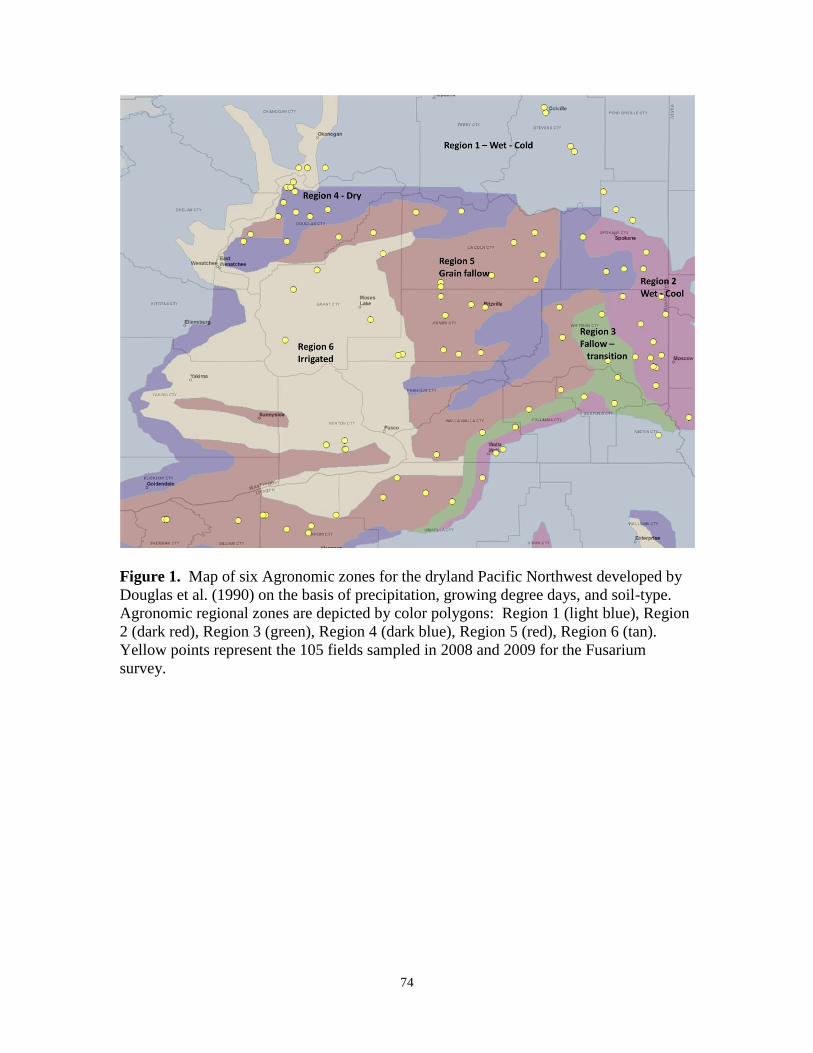
74
Figure 1. Map of six Agronomic zones for the dryland Pacific Northwest developed by
Douglas et al. (1990) on the basis of precipitation, growing degree days, and soil-type.
Agronomic regional zones are depicted by color polygons: Region 1 (light blue), Region
2 (dark red), Region 3 (green), Region 4 (dark blue), Region 5 (red), Region 6 (tan).
Yellow points represent the 105 fields sampled in 2008 and 2009 for the Fusarium
survey.

75
MATERIALS AND METHODS
Sampling of field sites
Selected survey sites included 210 randomly selected commercial fields located
across the major wheat producing regions of Washington (17 counties) and Oregon (5
counties), including 21 Washington State University Cooperative Extension Uniform
Cereal Cultivar Testing sites for winter wheat. Locations were surveyed during the
summers of 2008 and 2009.
Fields were selected on the basis of their location within the major dryland wheat
producing areas of Washington and Oregon. The approximate sampling distance
between fields ranged from 17 to 80 km. Field sampling frequency was greater where
Fusarium crown rot was known to persist in northern Oregon and north central
Washington areas that had not been sampled previously. Fields were sampled randomly
over a broad geographic area covering the summer fallow winter wheat region from 13
Washington counties and 5 Oregon counties. Given the crop rotation was predominantly
grain-fallow, fields were sampled in 2009 in the closest proximity of those sampled in
2008, within 3.2 km. Sampling began when wheat was fully mature after harvest began
in the Pendleton region around July 7th
in 2008 and July 10th
in 2009. Sampling followed
the harvest pattern throughout the region through approximately September 15th
in 2008
and September 25th
in 2009 in the Pullman and Spokane areas of eastern Washington.
Five samples were randomly taken from each field. A sample was defined by a 1-
m row of wheat stubble and roots taken with a shovel. A single sample was taken after
walking 100 m into a field from the edge. Four additional samples were taken from that
point by walking 25 m between each sample in a zig-zag pattern. Samples were placed in

76
a labeled paper bag and taken back to the Plant Pathology Farm near Pullman, WA to be
scored at a later time. At the time of scoring, 10 stems were randomly chosen from plants
within the sample. A total of 10 stems per sample were scored for crown rot severity
based on the 0 to 10 scale for crown score according to the methods of Nicol et al.
(2004). The number of nodes with disease symptoms was also recorded. At each sample
a 2.5-cm diameter soil core was taken to a depth of 4-cm and stored in a -80 oC freezer in
the lab in Pullman, WA to be used for soil DNA extraction. GPS coordinates were
recorded using a „Magellan‟® device (Triton model, Magellan mfg., San Dimas, CA) at
each 1-m row sample in 2008, but only at each field in 2009. A total of 5,100 tillers were
selected and scored each year (2008 and 2009) (10,200 tillers rated total) for crown rot
severity.
Isolation and culturing techniques
A stem was randomly selected from a group of symptomatic stems from each
sample, 5 stem samples per field (500 isolates total), from diseased crown and sub-crown
internode tissue. A 2-cm diseased stem section was cut from each of the randomly
selected symptomatic tillers. Stems were surface sterilized in 0.05% NaOCl for 30 s
followed by a 6 minute rinse in ddH2O and placed on Synthetischer Nährstoffärmer agar
(SNA) (Nirenberg, 1976) (1 g KH2PO4, 1 g KNO3, 0.5 g MgSO4 7H2O, 0.5 g KCl, 0.2 g
glucose, 0.2 g saccharose, and 20 g of agar per 1 L of media). Cultures were placed at
room temperature in natural light for 3 days.
After 3 days, 1-cm pieces were cut from the SNA agar and fungal growth
surrounding each cut stem piece was transferred to a fresh SNA plate. Plates were
incubated for 3 weeks in the dark. Fungal species present were identified on the basis of
77
morphological characters of macroconidia observed through a light microscope at 40 X
and 100 X (Nelson et al. 1981; Lesley et al. 2006).
When different species were isolated from a single field, single-spore cultures
were made. Each SNA plate was viewed under the dissecting scope and a 1-cm piece of
agar containing sporodochia was cut out and placed in 1 mL of water in a 5 mL tube.
The tube was vortexed for 5 s and 90µL was pipetted onto a ½ strength PDA plate
containing chloroamphenicol. Plates were incubated for 24 hrs at 22 C. Plates were
viewed under the dissecting microscope and single germinated spores were cut out and
transferred to a new SNA plate to serve as monospored isolations.
Data Analysis
Means representing overall frequency of isolation of various fungi associated with
crown rot were calculated. Species occurrence represented a mean across samples of F.
pseudograminearum, F. culmorum, F. crookwellense, F. acuminatum, F. equisiti, and
Bipolaris sorokiniana from a single randomly sampled cultured stem within each sample.
No other descriptive statistics were used to analyze this qualitative data set.
The dependent variables from each survey sample were analyzed using Proc
GLM ANOVA performed with SAS v.6.12 (SAS Institute Inc., Cary, NC.).
Experimental units were individual stems randomly selected from 10 plants within a
sample. The dependent variables were crown rot severity score and the number of
diseased nodes from 10 stems per sample. The independent variables were field (random
effect) and sample (random effect). The experimental design was a nested design where
samples were nested within fields and stems were nested within transects. The random

78
field effect was tested with the sample (field) mean square error term and the random
sample effect was tested with the stem (sample) mean square error term.
To analyze year differences for the dependent variables crown rot severity and the
number of nodes with symptoms, 10 individual stems within a sample served as the
experimental unit. Fields were nested within years. The independent variables were
year, field, and sample. The mean square error of the field (year) term was used to test
for the year effects and the sample (field) mean square error term was used to test for
significance for the field effect. Least squares means were used to calculate means of
dependent variables (crown rot score and number nodes with symptoms) and Proc GLM
ANOVA was performed with SAS.
Agronomic zone ANOVA model
In another analysis field survey locations for each individual year were placed
within agronomic zones developed by Douglas et al. (1990). The experimental units
were means of 10 stems averaged within a sample for each field (sample or replications =
5 per field). Sample means served as replications within each field. The independent
variables were agronomic zones (fixed effect) and fields within agronomic zones
(random effect). Since agronomic zones were assigned to specific areas they were
designated as fixed effects. The model error mean square field (agronomic zone) was
used to test agronomic zones for significance. The dependent variables analyzed
according to this model were crown rot severity and the number of nodes with symptoms
over years.
In another analysis field survey locations were again placed within agronomic
zones developed by Douglas et al. (1990). Independent variables were agronomic zones

79
(fixed effect) and fields (random effect). To test the dependent variables of F.
pseudograminearum and F. culmorum isolation frequency, the mean number of isolations
per field of each respective species was averaged across the 5 samples within a field (i.e.
numbers represented a value between 1 and 5). The isolation number of each species per
field served as the experimental unit. Duncan‟s least significant difference (LSD)
multiple range test was used to calculate mean separation values and Proc GLM ANOVA
was performed with SAS. Following statistical analysis values were converted from
numbers to a frequency of isolation proportion (%) per five samples within each field
within each agronomic zone.
Given that the two main Fusarium spp. (F. pseudograminearum and F.
culmorum) seemed to dominate in certain agronomic zones of the Pacific Northwest, a t-
test analysis was conducted to test the differences between mean isolation frequencies of
F. pseudograminearum and F. culmorum within each zone over the survey years 2008
and 2009. Sampling locations between years were aligned and means for F.
pseudograminearum and F. culmorum isolation frequencies were calculated within fields
across the years 2008 and 2009. An F-test was conducted for the frequency of isolation
within each field for each species (F. pseudograminearum and F. culmorum) to test for
equality of variance. Wherever F-tests were not significant (p>0.05) a t-test for equal
variance between Fusarium spp. means for each region was conducted. Wherever F-tests
were significant (p<0.05) a t-test for unequal variance between Fusarium spp. was
conducted. Regression analysis was also conducted on the mean isolation frequency for
F. pseudograminearum and F. culmorum averaged within fields and across survey years
2008 and 2009.

80
RESULTS
The mean frequency of isolation from randomly selected symptomatic stems of F.
culmorum and F. pseudograminearum was very similar at 31% and 30%, respectively,
over both survey years (Table 2). Within years, the frequency of isolation for F.
pseudograminearum (26%) and F. culmorum (23%) were slightly lower in 2009 than in
2008. Other species were also isolated from infected stems, including F. crookwellense,
F. acuminatum, F. equisiti, and B. sorokiniana at frequencies of 13%, 1.3%, 0.3%, and
1.7%, respectively (Table 2).
Table 2. Frequency of isolation of each respective species isolated from the total (525)
sampled wheat stems in the 2008 and 2009 PNW Fusarium crown rot field survey.
Fungal Frequency of isolation2
Species1 2008 2009 Mean
3
F. pseudograminearum 34% 26% 30%
F. culmorum 38% 23% 31%
F. crookwellense 12% 14% 13%
F. acuminatum 1.6% 1% 1.3%
F. equisiti 0.6% 0% 0.3%
Bipolaris sorokiniana 1.4% 2% 1.7%
1Fungal species were identified according to Lesley et al. 2006. Stem isolates were
cultured from SNA media and placed in slides for morphological identification. 2
Frequency of isolations represent the proportion of samples (per 525) isolated from the
entire survey for 2008 and 2009 survey years, respectively. 3Mean represents the average for each species isolated across the 2008 and 2009 survey
years.
81
Significant differences in the field sample ANOVA model in crown rot severity
(p<0.0001) and number of nodes with symptoms (p<0.0001) were detected among fields
for both the 2008 and 2009 survey years. The mean crown rot severity rating among
fields was 2.2 in 2008 and 2.9 in 2009, with a coefficient of variation (CV) of 60 and 57
for each year, respectively. Field ratings for crown rot severity (rated 0 to 10) ranged
from 0.2 to 5.1 in 2008 and from 0.5 to 5.4 in 2009. The R2 of the model was 0.54 and
0.48, for 2008 and 2009, respectively showing a reasonable fit of the data to the field
sample ANOVA model for both years. There was a significant difference between years
in crown rot severity (p<0.0001) and the number of nodes with symptoms (p=0.0001) for
the Year ANOVA model (Tables 3 and 4). Most of the variation was accounted for
between the survey years 2008 and 2009, followed by between field variation.
There were significant statistical differences between crown rot severity
(p<0.0001), nodes with symptoms (p<0.0001), and isolation frequencies for F.
pseudograminearum (p<0.0001) and F. culmorum (p<0.0001) during 2008 and 2009 for
the Agronomic zone ANOVA model. In both 2008 and 2009 crown rot severity was the
greatest in Region 3, the fallow transition zone extending from St. John to Walla Walla in
Washington State. Region 3 had significantly greater number of nodes with crown rot
symptoms in both years than Regions 1 and 4 (Table 5).
In 2009 Region 4 had the least amount of crown rot severity and significantly
greater frequency of F. culmorum isolation than Regions 2, 3 and 5. Region 1 had the
least crown rot severity and lowest frequency of F. pseudograminearum in 2008 and a
significantly greater frequency of F. culmorum isolation over both survey years compared
to Regions 2, 3 and 5 (Table 5).

82
Table 3. Results for crown rot severity (rated 0 to 10) from the Year ANOVA model
analyzed over years 2008 and 2009 from the Fusarium survey.
Source DF1 Sum of Squares Mean Square F-Value P-value
2
Model3 636 20110.92 31.62 15.03 0.0001
Error 9735 20485.85 2.10
Total 10371 40596.78
Year4 1 1219.56 1219.56 579.55 0.0001
Field (Year)5 102 6097.36 59.77 28.41 0.0001
Sample (Field)6 429 3199.45 7.45 3.54 0.0001
1 DF = degrees of freedom (DF = (n) -1, where n=number of samples).
2 P-values were considered significant at P=0.05.
3 The ANOVA model according to year and field where the dependent variable, crown
rot severity, was rated from 10 individual stems within a sample which served as the
experimental unit. The independent variables were year, field, and sample. 4 Year effect was analysed for the 2008 and 2009 Fusarium survey years.
5 Fields were nested within years 2008 and 2009.
6 Five samples were taken within each field randomly in a zig-zag pattern.
Table 4. Results for the number of symptomatic nodes from the Year ANOVA model
analyzed over years 2008 and 2009 from the Fusarium survey.
Source DF1 Sum of Squares Mean Square F-Value P-value
2
Model3 636 4395.29 6.91 12.74 0.0001
Error 9735 5279.86 0.54
Total 10371 9675.16
Year4 1 179.45 179.45 330.88 0.0001
Field (Year)5 102 1504.88 14.75 27.20 0.0001
Sample (Field)6 429 699.00 1.62 3.00 0.0001
1 DF = degrees of freedom (DF = (n) -1, where n=number of samples).
2 P-values were considered significant at P=0.05.
3 The ANOVA model according to year and field where the dependent variable, the
number of nodes with symptoms, was rated from 10 individual stems within a sample
which served as the experimental unit. The independent variables were year, field, and
sample within a field. 4 Year effect was analysed for the 2008 and 2009 Fusarium survey years.
5 Fields were nested within years 2008 and 2009.
6 Five samples were taken within each field randomly in a zig-zag pattern.

83
Table 5. Crown rot severity, average number of nodes with symptoms, and isolation
frequency per field for F. pseudograminearum (Fp) and F. culmorum (Fc) within six
PNW Agronomic zones.
Agronomic Crown rot Nodes Isolation frequency (%)5
zones1 severity
3 with symptoms
4 Fp Fc
2008 2009 2008 2009 2008 2009 2008 2009
1. Wet/ 0.8 d2 3.2 b 0.6 d 2.0 b 0 b 20 bc 76 a 38 a
Cold
2. Wet/ 2.2 b 3.4 b 1.4 b 1.8 b 28 a 22 abc 30 b 26 bc
Cool
3. Fallow- 3.1 a 4.2 a 1.7 a 2.4 a 36 a 32 ab 26 b 4 d
transition
4. Dry 1.5 c 2.1 d 0.8 c 1.2 c 28 a 4 c 52 ab 50 a
5. Grain fallow 2.3 b 2.7 c 1.4 b 1.3 c 44 a 38 a 32 b 12 cd
6. Irrigated 2.8 a 3.1 b 1.5 b 1.8 b 16 ab 26 ab 48 ab 16 bcd
Mean6 2.2 2.9 1.3 1.5 34 26 38 24
LSD 0.3 0.3 0.1 0.2 27 17 27 19.8
1
Agronomic zones were developed by Douglas et al. (1990) and Douglas et al. (1992) on
the basis of precipitation, growing degree days, and soil depth. 2
Numbers within a column followed by the same letter are not significantly different
according to Duncans LSD multiple range test at P=0.05. 3
Crown rot severity was rated on a 0 to 10 scale (0 = no disease; 10 = significant
disease/death) from each of 10 stems per sample from 5 samples within each field (50
samples per field). 4
The number of nodes showing symptoms were recorded for each stem rated for crown
rot severity. 5 Isolation frequencies represent the number of total proportion (%) of samples where
each respective species (Fp = F. pseudograminearum and Fc = F. culmorum) was
isolated and morphologically identified according to Lesley et al. (2006). 6 Means and Fischer LSD values represent the numbers within a column.

84
Region 5, the grain fallow region making up most of the eastern Washington and
Oregon dryland wheat production region, was moderate in crown rot severity compared
to all other regions, but had statistically lower crown rot severity compared to Region 3 in
both years. Regions 2 and 6 also had moderate levels of crown rot severity over both
years. Isolation of F. pseudograminearum seemed to be prevalent across all the regions,
with the exception of Region 1 in 2008, with the greatest isolation frequency in Region 5
(Table 5).
The mean proportion of isolations of F. pseudograminearum and F. culmorum
were further analyzed for their distribution across fields in six agronomic zones (Table 6).
Fields within regions were separated into categories according to fields with only one of
each species isolated within a field, or both species occurring within each field and
averaged over the 2008 and 2009 survey years. F. culmorum alone was most frequently
isolated from fields within Regions 1 and 4 at an equal proportion of 65%, respectively.
Fields were dominated with F. pseudograminearum within Regions 3 and 5 at
proportions of 67% and 54%, respectively. There were a high proportion of both species
isolated within the same field for Regions 2 and 6, which are characterized by high
rainfall and irrigation (Table 6).

85
Table 6. Distribution of Fusarium spp. identified in culture. Proportions of fields that
contained only F. pseudograminearum, only F. culmorum, or both species within the
same field for each agronomic zone.
Agronomic Mean (2-year) proportion of fields2
zone1 F. pseudograminearum
3 F. culmorum
4 Both
5
1. Wet / Cold 12% 65% 19%
2. Wet / Cool 33% 30% 34%
3. Fallow- transition 67% 13% 11%
4. Dry 3% 65% 30%
5. Grain fallow 54% 14% 29%
6. Irrigated 30% 30% 33%
Mean 33% 36% 26%
1
Agronomic zones were developed by Douglas et al. (1990) and Douglas et al. (1992) on
the basis of precipitation, growing degree days, and soil depth. 2 Numbers represent 2 year mean (2008 and 2009) proportions (%) of fields where only
one species or the other or both were isolated. 3 Proportion of fields where only F. pseudograminearum was isolated averaged over the
2008 and 2009 survey years. 4 Proportion of fields where only F. culmorum was isolated averaged over the 2008 and
2009 survey years. 5 Proportion of fields where both F. pseudograminearum and F. culmorum were isolated
within the same field averaged over the 2008 and 2009 survey years.

86
Regression analysis of isolation frequency showed a significant relationship
between F. pseudograminearum and F. culmorum across the 105 fields and six
agronomic zones (r2=0.43; p<0.0001) (Figure 2). These regression results suggest a trend
that the isolation of one species may dominate within a given field over the other (in
comparing the two most frequently isolated Fusarium spp.). T-tests of mean isolation
frequencies across the years for F. pseudograminearum and F. culmorum within each
region revealed significantly higher isolations of F. culmorum from Regions 1 (p=0.02)
and 4 (p<0.0001). In Region 5 there were significantly higher isolations of F.
pseudograminearum (p=0.0003). There were no significant differences between the
isolation frequencies between F. pseudograminearum and F. culmorum for Regions 2, 3,
and 6 (Table 7).
Figure 2. Regression analysis of isolation frequency within 105 fields (averaged across
five samples) of F. pseudograminearum (independent variable =y) and F. culmorum
(dependent variable =x) (r2=0.43; p<0.0001).
y = -0.7289x + 2.628r² = 0.43
(P<0.0001)
0.00
0.50
1.00
1.50
2.00
2.50
3.00
3.50
4.00
4.50
5.00
0.00 1.00 2.00 3.00 4.00 5.00 6.00
F. p
seu
do
gra
min
earu
mis
ola
tio
n f
req
ue
ncy
w
ith
in f
ield
F. culmorum isolation frequency within field

87
Table 7. Results from the t-test analysis between population means for F.
pseudograminearum and F. culmorum isolation frequencies within each Agronomic
zone.
Agronomic Mean (2-year) isolation frequencies (%)2
zone1 F. pseudograminearum
4 F. culmorum
4 P-Value
5
1. Wet / Cold 14 a3 2.80 b 0.0280
2. Wet / Cool 1.31 1.36 0.8740
3. Fallow 1.50 1.00 0.4810
-transition
4. Dry 0.60 a 2.65 b <0.0001
5. Grain fallow 2.06 a 1.09 b 0.0003
6. Irrigated 1.11 1.67 0.2520
Mean 1.21 1.76 --------
1
Agronomic zones were developed by Douglas et al. (1990) and Douglas et al. (1992) on
the basis of precipitation, growing degree days, and soil depth. 2 Numbers represent 2 year mean (2008 and 2009) isolation frequencies within each field
which served as replications within agronomic zones. 3
Numbers followed by different letters within a row represent significant differences
according to pairwise t-tests. 4 Numbers represent the number of isolations per field (out of 5 samples within a field)
within each respective agronomic zone for respective F. culmorum and F.
pseudograminearum averaged over both survey years. 5P-values were considered significantly different at the 0.05 level according to a pairwise
t-test.

88
DISCUSSION
Crown rot surveys conducted in the PNW have established that F. culmorum and
F. pseudograminearum are the two dominant causal agents of Fusarium crown rot (Cook,
1968; Smiley and Patterson, 1996; Smiley et al. 2005a). In the this study, we conducted a
survey of 210 fields in the dryland wheat producing regions of Washington and Oregon
during 2008 and 2009 to determine the distribution of fungi associated with crown rot of
wheat. Results confirmed previous reports that F. pseudograminearum and F. culmorum
are the dominant species associated with crown rot symptoms, and were isolated in the
greatest frequencies of 30% and 31%, respectively, over the two year survey. Isolates of
Fusarium spp. were obtained from 99% and 97% of all fields surveyed in 2008 and 2009,
respectively, confirming its widespread distribution in the dryland wheat producing
regions of the PNW.
Other species have been associated with the crown rot and common root rot
disease complex including F. crookwellense, F. acuminatum, F. equiseti, and B.
sorokiniana in the U.S. (Scardaci and Webster, 1982; Specht and Rush, 1988; Hill et al.
1983). Specht and Rush (1988) reported that F. acuminatum was associated with root
and foot rot of wheat in the Texas pan-handle. Others have reported the isolation of F.
equiseti from stems with crown rot symptoms, but it was not considered to be pathogenic
(Burgess et al. 1975; Specht and Rush, 1988; Klein et al. 1990; Strausbaugh et al. 2004).
Our results showed that the isolation of F. crookwellense, F. acuminatum, F. equiseti,
and B. sorokiniana at frequencies of 13%, 1.3%, 0.3%, and 1.7%, respectively, from
symptomatic tissue agree with that of others (Bentley et al. 2006a; Smikey and Patterson,
1996; Specht and Rush, 1988; Strausbaugh et al. 2004).

89
In addition to these two main species of Fusarium, F. crookwellense was isolated
from 12% and 14% of the total isolated stem samples in 2008 and 2009, respectively,
according to conidial morphology outlined by Lesley et al. (2006). The mean isolation
frequency was 13% averaged over both survey years. Others have reported isolation of
F. crookwellense from diseased wheat crown tissue in surveys conducted in Australia and
Turkey (Backhouse et al. 2004; Bentley et al. 2006b).
Bentley et al. (2006a) isolated F. crookwellense from wheat and other grassy plant
crowns and verified that three isolates had been incorrectly morphologically identified as
F. pseudograminearum and were molecularly confirmed as F. crookwellense. Mis-
identifications are common as conidia morphology of F. crookwellense closely resembles
that of F. culmorum and their geographic ranges overlap (Lesley et al. 2006). Lesley et
al. (2006) reported that F. crookwellense can cause mild root rot of wheat in greenhouse
trials. Although F. crookwellense has been reported in the northern U.S. (Lesley et al.
2006), to our knowledge it has not been reported in Oregon or Washington. The
morphological identifications made in the current study await confirmation with
conventional PCR primers (CRO-C) published by Williams et al. (2002).
Cook (1968) conducted the first surveys in the PNW, providing some of the first
descriptions of the symptoms and reported that 90% of the species isolated from those
areas were F. culmorum. Cook (1968) reported that F. pseudograminearum (F. roseum f.
sp. cerealis „Graminearum‟) dominated in Franklin, Walla Walla and Benton Counties.
These counties would fall within agronomic zones 3, 5, and 6 according to Douglas et al.
(1990), which contained significant levels of F. pseudograminearum. Smiley and
Patterson (1996) surveyed areas of Adams and Lincoln counties that had been previously

90
surveyed by Cook (1968) and confirmed that F. culmorum was much more prevalent in
Lincoln county where Cook (1968) had done previous research.
Climate and soils are highly variable in the PNW (Smiley and Patterson, 1996;
Douglas et al. 1990). Smiley and Patterson (1996) reported that the occurrence of
Fusarium foot rot pathogens was not related to the agronomic zones outlined by Douglas
et al. (1990). However, the authors did report that the detection of F.
pseudograminearum was weakly correlated to mean monthly temperature (r2
= 0.42,
P=0.06) and elevation (r2 = 0.49, P=0.03). But when elevation and precipitation was
regressed together with F. pseudograminearum there was a strong relationship (r2 = 0.46,
P=0.05), suggesting the species occurrence may decrease as elevation and mean annual
precipitation increase.
In the current study, when survey sites were placed into six climatic regions
defined by precipitation, growing degree days, and soil type (Douglas et al. 1990), there
were statistical differences in crown rot severity, number of nodes with disease
symptoms, and species isolation frequencies (F. pseudograminearum and F. culmorum)
among the zones. F. culmorum was more frequently isolated from Regions 1 (cool and
wet) and 4 (dry), while F. pseudograminearum occurred in significantly greater
frequency in Region 5 (grain-fallow) according to t-test results. Region 1 is characterized
by wetter and cooler climates, whereas region 4 is characterized by a dry climate and
shallow soil according to Douglas et al. (1990).
Samples from Region 4 were collected from high elevation locations (2,200 feet)
that experience significant amounts of snowfall. In these areas of Douglas county. snow-
mold (M. nivale and Typhula spp.) has been reported to be a significant problem (Bruehl,

91
1982). Most of the moisture in this region comes in the fall and winter. The parameters
used to define the agronomic zones described by Douglas et al. (1990) are broad and lack
detail for information pertaining to snowfall, specific temperature, and moisture patterns
within each zone that could potentially affect species distribution.
Backhouse et al. (2001) reported that many factors can influence Fusarium spp.
distribution including soil type, microenvironment, and land use and vegetation type, but
that on a broader regional scale climate has an overriding effect. Many species of
Fusarium seem to be controlled by climate (Backhouse et al. 2001). Backhouse et al.
(2001) stressed that many factors must be taken into consideration when evaluating
species distributions including latitude, longitude, elevation, temperature, rainfall, and
should be as specific so as to include the seasonality of temperature and rainfall.
Cook (1981) reported that the basic difference among populations of F.
pseudograminearum (F. graminearum Group 1) and F. culmorum are their temperature
preferences. F. pseudograminearum occurs in warmer areas whereas F. culmorum is
“intermediate in temperature preference” (Cook, 1981). Others have reported climatic
correlations of the occurrence of F. culmorum in cooler and wetter climates (Sitton and
Cook, 1981; Strausbaugh et al. 2004; Backhouse and Burgess, 2002). In a more detailed
survey from zones associated with climate, Backhouse et al. (2004) isolated F. culmorum
from 70% of the diseased wheat stems collected from the Victorian high rainfall region
(>500 mm). There is the potential that climate may have an effect on the distribution of
Fusarium spp. in the PNW.
Although F. pseudograminearum seemed to dominate in Region 5 in this survey,
characterized by grain-fallow crop rotation typical of eastern Washington and warmer

92
and drier weather patterns, the species was not limited to these areas of distribution. The
occurrence of the two dominant Fusarium species was highly variable between 2008 and
2009 with significant year effects in this study showing the high degree of field
variability from year to year. These results agree with that of others (Smiley and
Patterson, 1996).
Other factors that could affect species distribution include crop rotational patterns
and cultural practices (Burgess et al. 2001; Papendick and Cook, 1974; Nelson et al.
1981). The main rotational crops in the PNW dryland wheat producing region are peas
and lentils, and to a lesser extent canola and mustard (Brassica sp.). To date there have
been no reports of Fusarium spp. capable of causing crown rot on these rotational crops
(Shaw, 1973; Richardson, 1990).
The other factor that could affect species distribution is the inoculum source and
overwintering structure. F. pseudograminearum and F. culmorum survive as
chlamydospores in the soil and host residue (Sitton and Cook, 1981). Sitton and Cook
(1981) suggested that the survival of F. culmorum chlamydospores (8.5 years) is much
longer than those of F. pseudograminearum (5.5 years). Smiley and Patterson (1996)
reported that F. culmorum was detected in more soil samples than plant samples in one
year (1993) but more in plant samples than the soil in the other year (1994). Inglis and
Cook (1986) reported a greater decrease in F. culmorum chlamydospores over time at
Lind (survived 215 days) compared to Pullman (survived 330 days), but field surveys still
indicated greater disease severity at Lind than Pullman. Inglis and Cook (1986)
concluded that environmental conditions had a greater influence than chlamydospore
survival on the ability of the fungus to develop and persist as a wheat pathogen. Year to

93
year variation between species occurrence exists as well and survey have indicated that
the dominance of species has changed over time (Cook, 1968; Burgess et al. 1975;
Smiley and Patterson, 1996). There were significant differences between years for crown
rot severity and the number of nodes with symptoms in the current study. Most of the
variation was accounted for between years in this study, followed by the variation
between fields, while the variation within field was the least for crown rot severity and
the number of nodes with symptoms (Tables 3 and 4).
Results of the current study agree with others that F. pseudograminearum and F.
culmorum are associated with crown rot and dominate the rain-fed dryland wheat
production region of the PNW. F. crookwellense were identified according to conidia
morphology in both survey years, however these identifications must be confirmed with
genetic analysis through conventional PCR. Regional differences were found in
Fusarium spp. distribution where F. pseudograminearum dominated in Region 5 the
grain-fallow area, while F. culmorum dominated in Region 1 characterized by a wet cold
climate and Region 4 characterized by a dry climate according to Douglas et al. (1990).
The validity of these climatic relationships requires further research.
The objective of this research was to simply conduct a survey of Fusarium
species distribution causing crown rot in the PNW. In this study the greatest amount of
variation in crown rot severity and the number of nodes with symptoms occurred over
years compared to variation between and within fields. Others have documented the high
degree of variation in crown rot occurrence over years (Inglis and Cook, 1986; Smiley
and Patterson, 1996).
94
Further research needs to continue over the course of several years to evaluate the
distribution of Fusarium spp. causing crown rot and its potential association with climate
in the PNW, as well as species population changes over time. There is a need to develop
appropriately designed experiments to conduct Fusarium spp. distribution studies that
coincide with climatic parameters. A more detailed analysis with Principal Components
Analysis (PCA) would further refine the relationship between Fusarium spp. distribution
and climate and will be conducted in the future similar to the methods described by
Backhouse and Burgess (2002). PCA analysis may lend more information as to the role
of temperature and precipitation in Fusarium spp. distribution and crown rot occurrence
in dryland wheat production of the Pacific Northwest. Further documentation of crop
production cultural practices and cropping history should be made to better explain
regional differences in species distribution.

95
LITERATURE CITED
Backhouse, D., Burgess, L.W., Summerell, B.A. 2001. Chapter 9 - Biogeography of
Fusarium. In: Fusarium – Paul E. Nelson Memorial Symposium. Edited by
Summerell, B.E., Leslie, J.F., Backhouse, D., Bryden, W.L., and Burgess, LW.
APS Press, The American Phytopathological Society, St. Paul, MN. pg. 122-137.
Backhouse, D. and Burgess, L.W. 2002. Climatic analysis of the distribution of
Fusarium graminearum, F. pseudograminearum and F. culmorum on cereals in
Australia. Australas. Plant Path. 31:321-327.
Backhouse, D., Abubakar, A.A., Burgess, L.W., Dennis, J.I., Hollaway, G.J.,
Wildermuth, G.B., Wallwork, H., and Henry, F.J. 2004. Survey of Fusarium
species associated with crown rot of wheat and barley in eastern Australia.
Australas. Plant Path. 33:255-261.
Bentley, A.R., Cromey, M.G., Farrokhi-Nejad, R., Leslie, J.F., Summerell, B.A., and
Burgess, L.W. 2006a. Fusarium crown and root rot pathogens associated with
wheat and grass stem bases on the South Island of New Zealand. Australas.
Plant Path. 35:495-502.
Bentley, A.R., Tunali, B., Nicol, J.M., Burgess, L.W., Summerell, B.A. 2006b. A survey
of Fusarium species associated with wheat and grass stem bases in northern
Turkey. Sydowia 58:163-177.
Bruehl, G.W. 1982. Developing wheats resistant to snow mold in Washington State.
Plant Dis. 66:1090-1094.
Burgess, L.W., Wearing, A.H., and Toussoun, T.A. 1975. Surveys of Fusaria associated
with crown rot of wheat in eastern Australia. Aust. J. Agric. Res. 26:791-799.

96
Burgess, L.W., Liddell, C.M., and Summerell, B.A. 1988. Laboratory Manual for
Fusarium Research. 2nd Ed. (The University of Sydney, Sydney Aust.).
Burgess, L.W., Backhouse, D., Summerell, B.A., and Swan, L.J. 2001. Crown rot in
wheat - Chapter 20 in Fusarium – Paul E Nelson Memorial Symposium. Edited
by Summerell, B.A., Leslie, J.F., Backhouse, D., Bryden, W.L., Burgess, L.W.
APS Press, the American Phytopathological Society, St. Paul, MN.
Chakraborty, S., C.J. Liu, V. Mitter, J.B. Scott, O.A. Akinsanmi, S. Ali, R. Dill-Macky,
J. Nicol, D. Backhouse, S. Simpfendorfer. 2006. Pathogen population
structure and epidemiology are keys to wheat crown rot and Fusarium head blight
management. Australas. Plant Pathology. 35:643-655.
Cook, R.J. 1968. Fusarium root and foot rot of cereals in the Pacific Northwest.
Phytopathology 58:127-131.
Cook, R.J. 1981. Chapter 4 – Fusarium diseases of wheat and other small grains in
North America. In: Fusarium: Diseases, Biology and Taxonomy. Edited by
Nelson, P.E., Toussoun, T.A., and Cook, R.J. Penn State University Press,
University Park, PA.
Cook, R. J., and Veseth, R. J. 1991. Wheat Health Management. American
Phytopathological Society, St. Paul, MN.
Douglas, C.L., Wysocki, D.J., Zuzel, J.F, Rickman, R.W., and Klepper, B.L. 1990.
Agronomic zones for the dryland Pacific Northwest. A Pacific Northwest
Extension Publication. PNW No. 354: 1-8.

97
Douglas, C.L., Rickman, R.W., Klepper, B.L., and Zuzel, J.F. 1992. Agronomic zones
for dryland winter wheat producing areas of Idaho, Washington, and Oregon.
Northwest Science 66:26-34.
Hill, J.P., Fernandez, J.A., McShane, M.S. 1983. Fungi associated with common root rot
of winter wheat in Colorado and Wyoming. Plant Dis. 67:795-797.
Inglis, D.A., and Cook, R.J. 1986. Persistence of chlamydospores of Fusarium
culmorum in wheat fields of eastern Washington. Phytopathology 76:1205-1208.
Klein, T.A., Burgess, L.W., and Ellison, F.W. 1990. Survey of the incidence of
whiteheads in wheat crops grown in northern New South Wales, 1976-1981.
Aust. J. Exp. Ag. 30:621-627.
Lesley, J.F., Summerell, B.A., Bullock, S. 2006. The Fusarium laboratory manual.
Blackwell pub. Ames, Iowa. p. 1-388.
Nelson, P.E., Toussou, T.A., and Cook, R.J. 1981. Fusarium: Diseases, Biology and
Taxonomy. Penn State University Press, University Park, PA.
Nicol, J.M., Bolat, N., Bağcı,., M., Hekimkan, H., Tunalı., B., Bolat, N., Braun, H, J.,
Trethowan, R. 2004. Strategy for the Identification and Breeding of Resistance to
Dryland Root Rot Complex for International Spring and Winter Breeding
Programs.4th International Crop Science Congress, Brisbane, Australia, 2004.

98
Nicol, J.M, Rivoal, R., Trethowan, R.M., van Ginkel, M., Meroum, M., and Singh, R.P.
2001. CIMMYT‟s approach to identify and use resistance to nematodes and soil-
borne fungi, in developing superior wheat germplasm. In: 'Wheat in a Global
Environment'. Ed. Z. Bedo and L. Lang, Proceedings of the 6th International
Wheat Conference, 5-9 June 2000, Budapest, Hungary. Kluwer Academic
Publishers, Netherlands. pg. 381-389.
Nicol, J.M., Bolat, N., Bagci, A., Trethowan, R.T., William M., Hekimhan, H., Yildirim,
A.F., Sahin, E., Eleckcioglu, H., Toktay, H., Tunali, B., Hede, A., Taner, S.,
Braun, H.J., Van Ginkel, M., Arisoy, Z., Yorgancilar, A., Tulek, A., Erdurmus,D.,
Buyuk, O., and M. Aydogdu. 2007. The International breeding strategy for the
incorporation of resistance in bread wheat against the soil-borne pathogens
(dryland root rot and cyst and lesion cereal nematodes) using conventional and
molecular tools. In: Wheat Production in Stressed Environments, H.T. Buck et
al. (eds.), p. 125-137.
Nirenberg, H.I. 1976. Untersuchungen über die morphologische und biologische
Differenzierung in der Fusarium Sektion Liseola. Mitteilungen aus der
Biologischen Bundesanstalt Für Land- und Forstwirtschaft (Berlin – Dahlem)
169:1-117.
Papendick, R.I., and Cook, R.J. 1974. Plant water stress and development of Fusarium
foot rot in wheat subjected to different cultural practices. Phytopathology 64:358-
363.

99
Paulitz, T.C., Smiley, R.W., Cook, R.J. 2002. Insights into the prevalence and
management of soil-borne cereal pathogens under direct seeding in the Pacific
Northwest, U.S.A. Can. J. Plant Path. 24:416-428.
Purss, G.S. 1970. Resistance to common root rot (Cochliobolus sativus) in wheat in
Queensland. Australian Journal of Experimental Agriculture and Animal
Husbandry. 10:497-501.
Richardson, M.J. 1990. An annotated list of seed-borne diseases. Fourth Ed.
International Seed Testing Association, Zurich. pg. 387.
Scardaci, S.C. and Webster, R.K. 1982. Common root rot of cereals in California. Plant
Dis. 66:31-34.
Schilling, A.G., Moller, E.M., Geiger, H.H. 1996. Polymerase chain reaction-based
assays for species-specific detection of Fusarium culmorum, F. graminearum, and
F. avenaceum. Phytopathology 86:515-522.
Shaw, C.G. 1973. Host fungus index for the Pacific Northwest – I. Hosts. Washington
State Univ. Agric. Exp. Sta. Bull. 765:1-121.
Sitton, J.W. and Cook, R.J. 1981. Comparative morphology and survival of
chlamydospores of Fusarium roseum „Culmorum‟ and „Graminearum‟.
Phytopathology 71:85-90.
Smiley, R.W., Collins, H. P., and Rasmussen, P.E. 1996. Diseases of wheat in long-term
agronomic experiments at Pendleton, Oregon. Plant Dis. 80:813-820.
Smiley, R.W. and Patterson, L.M. 1996. Pathogenic fungi associated with Fusarium foot
rot of winter wheat in the semiarid Pacific Northwest USA. Plant Dis. 80:944-
949.
100
Smiley, R., Petersen, J., Gourlie, J., Whittaker, R., Patterson, L., Easley, S., Thompson,
D., and Rhinhart, K. 2002. Influence of Fusarium crown rot on yield of winter
wheat and spring wheat. In Biological and Cultural Tests for Control of Plant
Diseases. Vol. 17. Edited by S.C. Bost. American Phytopathological Society, St.
Paul, MN., Report S07.
Smiley, R.W., Gourlie, J. A., Easley, S. A., Patterson, L.-M., and Whittaker, R.G.
2005a. Crop damage estimates for crown rot of wheat and barley in the Pacific
Northwest. Plant Dis. 89:595-604.
Smiley, R.W., Gourlie, J. A., Easley, S. A., Patterson, L.-M., and Whittaker, R.G.
2005b. Pathogenicity of fungi associated with the wheat crown complex in
Oregon and Washington. Plant Dis. 89:949-957.
Specht, L.P. and Rush, C.M. 1988. Fungi associated with root and foot rot of winter
wheat and populations of Cochliobolus sativus in the Texas Panhandle. Plant Dis.
72:959-963.
Strausbaugh, C.A., Bradley, C.A., Koehn, A.C., Forster, R.L. 2004. Survey of root
disease of wheat and barley in southeastern Idaho. Can. J. Plant Pathol. 26:167-176.

101
CHAPTER 3

102
CHAPTER 3
OPTIMIZATION OF REAL TIME QUANTITATIVE PCR (Q-PCR) FOR
FUSARIUM PSEUDOGRAMINEARUM AND F. CULMORUM ON WHEAT
Grant Poole1, Fatih Ozdemir
2, Seth D. Nydam
3, Kurtis L. Schroeder
4, Julie M. Nicol
5,
Richard W. Smiley6, Kimberly Garland-Campbell
4, and Timothy C. Paulitz
4.
1Washington State University, Dept. of Plant Pathology, Pullman, WA, 99164-6430; E-
mail: [email protected]; FAX: 509-335-9581; 2Bahri Dagdas International Agricultural
Research Institute, Konya, Turkey; 3Washington State University, Dept. of Veterinary
Microbiology and Pathology, Pullman, WA, 99164; 4USDA-Agricultural Research
Service, Pullman, WA; 5
CIMMYT (International Maize and Wheat Improvement Centre)
P.O. Box. 39 Emek 06511 Ankara, Turkey; 6Oregon State University, Pendleton, OR.
ABSTRACT
Current identification of Fusarium spp. causing crown rot relies on traditional culturing
methods that require mycological expertise and extensive time and materials. The advent
of Q-PCR (Quantitative Real-Time PCR) techniques and the development of species-
specific primers for F. pseudograminearum and F. culmorum has allowed for more
accurate species identification and fungal DNA quantification from wheat stems infected
with crown rot pathogens. The objective of this study was to develop a Q-PCR-based
assay by evaluating and optimizing DNA extraction methods to accurately assess DNA
concentrations of Fusarium spp. in wheat stem tissue from field samples. Fusarium
species-specific primers developed in previous studies were evaluated for use in Q-PCR

103
to identify and quantify Fusarium spp. from wheat stem tissue. Fungal DNA was
extracted from local Pacific Northwest (PNW) of F. pseudograminearum and F.
culmorum mycelium grown on potato-dextrose broth (PDB) and used for developing
standard curves and positive controls. The use of the „OPT‟ primers for the amplification
of F. culmorum and the „FPG‟ primers for the amplification of F. pseudograminearum
yielded the most consistent Q-PCR results. The MO-BIO©
Ultra Clean Soil Kit for DNA
extraction produced the most consistent Q-PCR from infected wheat tissue when
compared to the FastDNA kit (MP Biomedicals©
). Bead beating utilizing the MO-BIO
kit (using the ceramic beads from the FastDNA kit) was superior to grinding with liquid
nitrogen alone for Q-PCR and DNA quantification. Optimal results were obtained by
grinding with liquid nitrogen, soaking prior to bead beating and a Fast Prep speed of 5 for
45s. A Fast Prep speed of 6 resulted in lower DNA quantification possibly due to over-
maceration of fungal and plant cells and subsequent fragmentation of DNA. The addition
of polyvinylpolypyrrolidone (PVPP) was necessary for adequate DNA extraction. The
analysis of 144 field samples from a crown rot field survey showed that DNA
quantification from Q-PCR was not positively correlated to field crown rot ratings.
However, there was a significant correlation (r2 = 0.61) between DNA concentration and
crown rot severity in seven amplified Q-PCR samples that were extracted from individual
symptomatic wheat stems.

104
INTRODUCTION
Fusarium crown rot of wheat (Triticum aestivum L.) is caused by a complex of
Fusarium spp. and other fungal species, of which F. pseudograminearum and F.
culmorum are the most dominant. Crown rot reduces wheat yields by an average of 9.5%
in the Pacific Northwestern United States, with losses as high as 30% reported (Burgess
et al. 2001; Cook, 1968; Cook and Veseth, 1991; Cook, 1992; Dodman and Wildermuth,
1987; Hekimham et al. 2004; Kane, 1987; Klein et al. 1991; Nicol et al. 2001; Smiley et
al. 2005a). Smiley et al. (2005a) documented yield loss in the Pacific Northwest (PNW)
as high as 61% resulting from inoculation with a mixture of five F. pseudograminearum
isolates. Yield loss resulting from Fusarium crown rot infection is difficult to assess on a
regional basis as infection occurs at or near the soil line and is not clearly visible
(Strausbaugh et al. 2004), with the exception of the formation of white heads for a brief
period of time prior to straw ripening (Burgess et al. 2001).
Common names of crown rot include dryland foot rot, dryland root rot, foot rot,
Fusarium crown rot, and Fusarium root rot. Crown rot is caused by a complex of
Fusarium pseudograminearum (O‟Donnell & Aoki) (= F. graminearum group I, =
Gibberella coronicola), F. culmorum (Wm. G. Sm.) Sacc., Bipolaris sorokiniana (Sacc.)
Shoemaker (= Cochliobolus sativus), F. avenaceum (Fr.:Fr.) Sacc. (= Gibberella
avenacea), and Michrodochium nivale (Fr.) Samuels & I.C. Hallet (= Monographella
nivalis) (Cook, 1968; Cook and Veseth, 1991; Smiley et al. 2005a.; Nicol et al. 2001). In
Australia, and other parts of the world, crown rot is the accepted common name of the
disease and is understood to be caused mainly by F. pseudograminearum and F.
culmorum (Burgess et al. 2001). It is widely accepted that F. pseudograminearum is the

105
dominant species responsible for causing crown rot in arid regions of the PNW region of
the U.S. and in Australia (Burgess et al. 1975; Backhouse and Burgess, 2002;
Chakraborty, 2006; Smiley et al. 2005b).
Traditional methods of measuring crown rot severity typically use visual rating
systems (based on the proportion of symptoms) and index scales (Mitter et al. 2006;
Nicol et al. 2001; Smiley et al. 2005a; Wildermuth and McNamara, 1994). Klein et al.
(1990) isolated crown rot pathogens in accordance with white head symptoms and found
the two were closely related. Smiley et al. (2005a) utilized crown ratings and disease
severity classes to correlate disease severity to yield loss. Traditional techniques for
determining crown rot severity are not only dependent on tedious rating systems, but on
culturing fungal isolates and obtaining appropriate morphological characters for proper
identification (Aoki and O‟Donnell, 1999).
With recent advances in molecular technology such as Q-PCR technology, the
amount and species identity of a pathogen can be more easily estimated by the amount of
fungal DNA present (Okubara et al. 2005; Schroeder et al. 2006; Hogg et al. 2007). The
development of species-specific primers for use in Q-PCR have allowed for more
efficient and accurate quantification of fungal DNA at the species level. Schroeder et al.
(2006) designed and utilized species-specific primers for the detection and quantification
of nine Pythium spp. from soils collected in eastern Washington.
Q-PCR has been used in several studies to quantify the amount of F. culmorum
and F. pseudograminearum in diseased wheat tissue (Leisova et al. 2006; Hogg et al.
2007; Hogg et al. 2010). Waalwijk et al. (2004) developed species-specific TaqMan
based primers (PE Applied Biosystems, Foster City, CA) for F. avenaceum, F.

106
culmorum, F. graminearum, F. poae, and Microdochium nivale to detect fungal DNA
concentrations in leaves, heads, and seed for detecting Fusarium head blight occurrence
and deoxynivalenol (DON) content in grain. Fungal DNA concentrations determined by
Q-PCR with primers specific to F. graminearum and F. culmorum were correlated to
both the incidence of Fusarium head blight and DON content of mycotoxin in the grain.
TaqMan based primers for F. graminearum and F. culmorum used in the study were
developed by Nicholson et al. (1996; 1998).
Strausbaugh et al. (2005) isolated Fusarium from wheat and barley roots common
to southern Idaho and rated root lesions in four growth chamber and two field assays.
Strausbaugh et al. (2005) developed Q-PCR assays using TaqMan probes to quantify
Fusarium crown rot in diseased wheat and barley root tissues. Forward and reverse
primers named „Gzeae87T‟ and a „Gzeae87T‟ probe were developed from the trichodiene
synthase (tri5) gene of F. graminearum with nucleotide sequences obtained from
GenBank corresponding to the tri5 encoding trichodiene synthase from Fusarium spp. (F.
poae and Gibberella zeae accessions). A sequence alignment was performed on the most
conserved region of the tri5 gene within the Gibberella zeae sequence from a specific
collection accession.
The tri5 gene-based primers were not species-specific and amplified F. culmorum
and F. pseudograminearum in addition to F. graminearum. The primer set did not
amplify pure cultures of F. avenaceum, F. acuminatum, F. semitectum, F. equiseti,
Rhizoctonia solani, Gaeumannomyces graminis var. tritici, Pythium spp. and 10 of the
most common fungal saprophytes isolated from wheat and barley roots from southern
Idaho. F. culmorum infections resulted in the largest infected root area in inoculated

107
greenhouse assays. These assays were sensitive enough to detect F. culmorum extracted
from pure cultures down to 61 pg (Strausbaugh et al. 2005).
Strausbaugh et al. (2005) evaluated Fusarium spp. populations at two field sites in
Idaho under natural inoculum pressure. The isolation frequency of F. culmorum was 1%
at the Arbon Valley and 67% at the Ririe location, however DNA was quantifiable only
at the Ririe location. Although DNA was quantifiable where F. culmorum was persistent,
there was no correlation with field disease severity ratings under naturally inoculated
field conditions. However, they did report significant correlations between DNA
quantities and the percentage of infected roots in growth chamber studies where plants
were inoculated with F. culmorum and other Fusarium spp.
Hogg et al. (2007) used the tri5 gene based „TaqMan‟ primers and probes
developed by Strausbaugh et al. (2005) to relate 22 Fusarium species (including F.
pseudograminearum and F. culmorum), and additional isolates from 12 fungal species, to
inoculated field experiments during 2004 and 2005. The primers used in the study were
from the cloned fragment of the tri5 gene from a F. culmorum isolate collected near
Loma, MT. The Q-PCR assay detected all of the Fusarium crown rot isolates, but did not
amplify any of the other species evaluated. The sensitivity of the assay was greatest with
F. graminearum with step-wise diminishment from F. pseudograminearum (51% of F.
graminearum) to F. culmorum (15% of F. graminearum).
Field trials were inoculated with a F. pseudograminearum isolate (Hogg et al.
2007). Disease severity scores (DSS) and Fusarium DNA quantities were negatively
correlated to grain yield and yield reductions with r values = -0.64 and -0.77,
respectively. The location or length of lesion up to the fourth internode did not appear to
108
be correlated to DNA quantities. The authors concluded that the Q-PCR assay used had
the ability to accurately estimate disease severity and subsequent yield loss from
Fusarium crown rot infection under inoculum pressure and favorable climatic conditions
for disease development.
Kohl et al. (2007) was able to use species-specific primers for various Fusarium
spp. from Waalwijk et al. (2004) to detect DNA concentrations in wheat stubble residue
in a crown rot epidemiological study extending 10 months after harvest. They reported
that DNA concentrations in the residue decreased in node and internode tissue but not in
stem base tissue over the 10 month duration. Hogg et al. (2010) followed this work with
an epidemiological study of wheat residues from inoculated and non-inoculated plots in
Montana. They used the TaqMan assay based on the trichodiene synthase gene (tri-5) to
non-specifically detect populations of F. culmorum, F. graminearum, and F.
pseudograminearum. They reported that Fusarium populations in non-inoculated
residues were approximately 0.4% or 100 times less than that of inoculated residues. The
authors found that Fusarium populations declined rapidly in the first few months
following harvest.
The current practical application of Q-PCR technology would be to quantify
disease from infected field samples with crown rot symptoms. If crown rot symptoms
were correlated to DNA quantities, one could rapidly and accurately assess the degree of
disease and causal Fusarium species from a Q-PCR assay. However, as previously
mentioned, other crown rot Q-PCR assays utilized primers from the tri5 gene region from
Strausbaugh et al. (2005) that are not species-specific for F. pseudograminearum and F.
culmorum, unlike primers developed by Williams et al. (2002) and Schilling et al. (1996).
109
Also, the assay developed by Hogg et al. (2007) was from field inoculated samples, not
from naturally occurring populations in the field. From these studies it appears that Q-
PCR is an adequate tool for assessing Fusarium populations. Traditional methods of
plating and identification are cumbersome and require mycological expertise.
Furthermore, Fusarium spp. cannot be easily extracted and cultured from soil, but Q-PCR
has been used to identify quantities of other soil-borne pathogens from soil samples
(Okubara et al. 2005; Schroeder et al. 2006).
The DNA extraction techniques described by Strausbaugh et al. (2005) were
based on fungal mycelia isolations from a kit extraction protocol dating to the early
1990s. More DNA extraction kits have been released by several manufacturers. A DNA
extraction technique from a recently manufactured FastDNA® kit (MP Biomedicals,
Solon, OH) was applied to DNA extraction from wheat stems (Hogg et al. 2007).
However, the extraction protocol was modified significantly from the manufacturer
protocol and was not successful in producing extractions in preliminary results performed
with the current study. Thus other DNA extraction kits needed to be evaluated for use in
extracting and amplifying DNA from wheat stems infected with crown rot.
Hogg et al. (2007) commented on the tough, dry nature of mature wheat stems.
They subsequently modified the manufacturer protocol by adding a ceramic bead and
soaking the tissue samples in the extraction buffer for 1 hour to better ensure tissue
maceration and subsequent DNA quantities. Other plant extraction protocols use liquid
nitrogen to aid in tissue maceration. These additional methods needed to be evaluated
with another Mo-Bio® DNA extraction kit (Mo BIO Laboratories llc., Carlsbad, CA) to
better optimize the DNA extraction process.

110
Hogg et al. (2007) diluted (1:10) the fungal DNA samples following extractions
with the FastDNA kit. Inhibitors in the form of polysaccharides, humic and fulvic acids
and colloidal substances in soils exist that could potentially interfere with Q-PCR and
create false-negatives (Okubara et al. 2005). Diluting fungal DNA samples are meant to
alleviate these effects. The Mo-Bio DNA extraction kit is designed for soil analysis and
contains an inhibitor removal solution. As a result, samples processed with the Mo-Bio
kit do not need dilution. During the DNA extraction-optimization process with the
FastDNA kits, samples were diluted with water following failed Q-PCR. Hogg et al.
(2007) diluted sample DNA extracted from mycelium using the FastDNA kit 1:5 and
from infected wheat stems 1:10 (1 part extracted DNA: 10 parts water).
Strausbaugh et al. (2005) extracted fungal DNA from mycelium whereas Hogg et al.
(2007) was the first to report fungal DNA extracted from crown rot infected wheat stems.
It is accepted that extracting DNA from fungal mycelium will produce the most reliable
DNA samples for amplification with PCR (Aoki and O‟Donnell, 1999). However this
process can be tedious. It requires materials that need to be placed on shakers for several
days to grow mycelium in PDB for DNA extraction. The entire process can take a week
or more for a large number of samples. Since macroconidia remain in culture from
identified field isolates in SNA (Synthetischer Nährstoffärmer agar)
(Nirenberg, 1976), there is a potential that they could be used as an easier medium for
DNA extraction and species verification. To date there has been no attempt to extract
DNA from macroconidia with the FastDNA kit from cultures of Fusarium spp. causing
crown rot.
111
The objectives of this research were to: 1 - Optimize the DNA extraction process
for accurate Q-PCR using two DNA extraction kits (FastDNA©
kit (MP Biomedicals)
and MO-BIO©
kit (Ultra Clean Soil Kit); 2 - Optimize the grinding and extraction process
using the prefered kit; 3 - Compare Q-PCR results with morphological results for
appropriate species identification; and 4 - Correlate crown rot severity of ratings from
field survey to DNA quantity amplified for F. pseudograminearum and F. culmorum.
MATERIALS AND METHODS
Fungal DNA extraction from mycelium for positive controls
Fusarium pseudograminearum and F. culmorum isolates collected from wheat
fields in Washington state between 2000 and 2008 and previously identified using
morphological characters (seven F. culmorum isolates and 13 F. pseudograminearum
isolates) according to Lesley et al. (2006) were used as positive controls in all PCR and
Q-PCR reactions. DNA of 20 Fusarium spp. isolates was extracted from mycelium.
Fungi were grown in potato dextrose broth (PDB) for approximately 5 days and the
mycelium extracted from the PDB by passing it through a vacuum funnel with filter
paper (Whatman #4, 12.5 cm diameter). The mycelium that remained on the filter paper
was placed into a 2-mL centrifuge bead beating tube containing a ceramic bead and
extracted using the FastDNA extraction kit (Catalog # 6540-400 MP Biomedicals)
(details below).
2008 Fusarium survey field sampling technique
A field survey evaluating crown rot occurrence, severity, and Fusarium spp.
distribution from PNW dryland wheat fields was conducted during 2008. The sampling
protocol involved taking five samples each 1 m in length from five locations within a

112
field that were 25 m apart in a diagonal (i.e. zig zag) pattern throughout the field.
Sampling was conducted by walking 100 m into a field and taking a 1 m row of stubble at
one of five locations, which defined a sample. Five samples (1 m stubble rows) were
sampled per field and scored for crown rot severity. One stem from each sample was
cultured on SNA media the Fusarium spp. were identified morphologically (Lesley et al.
2006). The application of Q-PCR as a diagnostic tool was applied to stem samples from
samples of this survey to function as replications within a field.
DNA Extraction Experiments (EE-1 through EE-10)
Two kits were used to extract DNA from infected plant tissue: the FastDNA Kit –
Catalog # 6540-400 ( MP Biomedicals®,Solon, OH) and the Ultra Clean Soil DNA Kit
Catalog # 12800-100 (MO-BIO®, Carlsbad, CA). The 2008 Fusarium survey samples
were used as the basis for sampling and analyzing DNA extraction techniques and
methods from different sources of pathogen material (i.e. conidia and mature plant
stems). Each DNA extraction experiment was assigned an „EE‟ number delineating
“Extraction Experiment” followed by the experiment number. There were a total of 10
extraction experiments labeled EE-1 through EE-10.
The objective of EE-1 was to evaluate the efficiency and efficacy of extracting
DNA from concentrated macroconidia collected from SNA cultures with the FastDNA
extraction kit. Macroconidia of each species was harvested by flushing plates with 5 mL
of deionized distilled water into 50 mL test tubes (Falcon, Franklin Lakes, NJ.). Test
tubes were centrifuged at 3,200 rpm for 4 minutes. Supernatant was removed with the
exception of 1 mL. The 50mL tubes were vortexed for 5 s and the 1mL solution
transferred to a FastDNA kit lysing tube and the extraction process was conducted as

113
outlined below. Homogenization of samples was done at a Fast Prep FP120 (QBiogene
Inc., Carlsbad, CA.) speed = 5. All samples were amplified using conventional PCR as
outlined below.
The objective of EE-2 was to evaluate the effectiveness of grinding stem tissue
with liquid nitrogen prior to DNA extraction with the FastDNA kit according to Hogg et
al. (2007) to enhance Q-PCR. Fields were selected that had isolates with morphological
identifications from the 3 main Fusarium spp. identified in the survey (F.
pseudograminearum, F. culmorum, and F. crookwellense). Cross sections 2 cm in length
were cut from symptomatic wheat stems (approximately 20 mg tissue). Samples were
either ground with liquid nitrogen or untreated and placed in the FastDNA kit lysing
tubes to be ground in the „Fast Prep‟ homogenizer. Homogenization of samples was
done at a Fast Prep speed = 5. Samples were not diluted and were amplified using
conventional PCR with the FPG and OPT primer sets.
Samples in EE-2 extracted with the FastDNA kit did not successfully amplify
with PCR. Therefore the objective of EE-3 was to extract DNA using the Mo-Bio kit
from a broader range of seven fields with the morphological occurrence of the 3 main
Fusarium spp. (F. pseudograminearum, F. culmorum, and F. crookwellense). The
extracted samples were amplified with Q-PCR. A 6 cm wheat stem cross section was cut
into 1 cm pieces from each respective sample stem and ground finely in liquid nitrogen
(15 to 21 mg tissue) then placed in the Mo-Bio kit lysing tube and carried through the
DNA extraction process as outlined below. Homogenization of samples was done at a
Fast Prep speed = 5. Samples were amplified with Q-PCR for the FPG and OPT primer
sets.

114
Since Mo-Bio kit extractions had been more successful than FastDNA kit
extractions, the objective of EE-4 was to compare the two kits under similar survey
sample conditions with various morphological identifications of the three main Fusarium
spp. isolated in the survey. A 5 cm cross section of stem base crown tissue was cut into 1
cm sections. Liquid nitrogen was used to grind the samples for the Mo-Bio kit
extractions while bead beating by itself was used with the FastDNA kit. All samples
were processed at a speed of 5 for 45s on the Fast Prep. The DNA extraction protocols
for each respective kit were carried out as outlined below. Samples were amplified with
Q-PCR for the FPG and OPT primer sets.
Given the only samples that amplified in EE-4 were extracted with the Mo-Bio
kit, the objective of EE-5 was to evaluate the need for grinding stems with liquid nitrogen
or bead beating with the Mo-Bio kit. A 9 cm symptomatic wheat stem / crown cross
section was cut into 1 cm sections. For liquid nitrogen grinding treatments, stems were
placed into 2 mL Eppindorf micro-centrifuge tubes and ground to a fine powder before
being transferred to a Mo-Bio bead beat lysing tube containing one 1.4 mm ceramic bead
from the FastDNA kit. „Bead beat‟ samples were placed directly into Mo-Bio lysing
tubes with one 1.4 mm ceramic bead for homogenization and extraction. For the „soak‟
treatment the stems were placed into the bead beat lysing tubes with 60 µL of S1 solution
and 200 µL of Inhibitor removal solution (IRS) for 1 hour on ice. All samples were
homogenized at a Fast Prep speed = 5. Samples were analyzed with Q-PCR for the FPG
and OPT primer sets.
The Mo-Bio kit produced the most consistent PCR amplification results to this
point. The objective of EE-6 was to correlate extracted DNA concentrations to field

115
crown rot severity ratings (low, medium, and high) from eight stems from the 2008
Fusarium survey using the Mo-Bio kit. A 1 cm cross section of symptomatic wheat stem
/ crown tissue was cut from each wheat stem. Extractions were conducted with the Mo-
Bio kit. Samples were soaked on ice in the S1 / IRS extraction buffer solution for 1 hour
then homogenized in the Fast Prep machine at a speed = 6. Samples were amplified with
Q-PCR with the FPG, OPT, and CRO-C (F. crookwellense) primer sets.
The objective of EE-7 was to further optimize the DNA extraction procedure with
the Mo-Bio extraction kit to confirm optimal conditions for the addition of a 1.4 mm
ceramic bead from the FastDNA kit to the Mo-Bio kit, the 1 hour soaking treatment in
the S1 / IRS extraction buffer solutions on ice, and the Fast Prep speed = 5 or 6. A 15 cm
cross section of symptomatic wheat stem / crown tissue was cut up into 1 cm sections and
pooled into one sample from each sample. Samples were amplified with Q-PCR for the
FPG and OPT primer sets.
The objective of EE-8 was to further evaluate all of the parameters involved in the
extraction process with the Mo-Bio kit to confirm previous results and finalize DNA
extraction optimization. Grinding and extraction treatments were the addition of a 1.4
mm ceramic bead from the FastDNA kit to the Mo-Bio kit, the 1 hour soaking treatment
in the S1 / IRS extraction buffer solutions on ice, a Fast Prep speed = 5 or 6, and the
addition or lack of PVPP. A total of 10 – 1 cm cross sections of symptomatic wheat stem
tissue were pooled together for each extraction treatment. Samples were taken from four
samples with crown rot severities ranging from low (1-3) to medium (4-6) to high (8-10)
ratings. Samples were amplified with Q-PCR for the FPG and OPT primer sets.

116
The objective of EE-9 was to correlate the crown rot severity ratings from 24 field
samples ranging in crown rot severity scores from sample ratings of 1 to 8 (with three
replications in each rating category) to the DNA concentration results from Q-PCR. The
extraction methods used were to grind plant tissue in liquid nitrogen, add a 1.4 mm
ceramic bead, use PVPP, and homogenize in the Fast Prep at speed = 6 without soaking.
DNA was extracted from 24 single stems that were 3 cm long cut into 0.5 to 1 cm cross
sections. Samples were amplified with Q-PCR for the FPG and OPT primer sets.
The objective of EE-10 was to correlate crown rot severity with DNA
concentration from samples extracted with the Mo-Bio kit by pooling stems within a
sample, similar to the methods outlined by Hogg et al. (2007). Fields were grouped into
39 groups in a frequency histogram based on their crown rot severity. One field was
selected at random from each of these 39 groups to represent 39 fields with varying
degrees of crown rot severity ranging from 0.2 to 5.1. Nine additional fields were
selected from a range of crown rot severity ratings according to geographic origin and
morphological species identification to make 48 fields total. Three samples were
randomly selected from each field and five symptomatic stems were selected from each
sample for extraction. Two 3-mm sections were cut from each of the 5 stems (6 mm
total) to make 30 mm per sample as outlined in Hogg et al. (2007). DNA extractions
were made using the Mo-Bio extraction kit from each 30 mm of stem tissue per sample,
similar to Hogg et al. (2007) . There were a total of 144 DNA extractions that were
conducted for the experiment. Each sample represented a replication of sorts within each
field.

117
FastDNA extraction kit protocol
The protocol for the FastDNA kit for both fungal mycelium and plant tissue was
as follows. The extraction buffer consisted of 800 µL of CLS-VF buffer and 200 µL of
PPS containing 25:24:1 phenol:chloroform:isoamyl-alchohol (pH=8.0) solutions from the
kit. These were added to a 2.0 mL micro-centrifuge tube containing variable amounts of
plant tissue ranging from 20 to 150 mg depending on the sample size and optimization
experiment objective. A ceramic bead (1.4 mm) that was included in the kit was added to
the tube and tissue maceration was conducted with the use of a Fast Prep FP120
instrument at speed 6 for 45 s. An alternative method of tissue maceration was evaluated
where plant tissue was first ground in liquid nitrogen. The ground tissue (ranging from
20 to 150 mg) was added to a lysing tube containing cell lysing solution with a ceramic
bead, and further ground using the Fast Prep instrument. In some optimization
experiments two ceramic beads were added to the tube. Samples were centrifuged after
maceration at 14,000 g for 12 minutes. A volume of 600 to 700 (approximately 650) µL
of the supernatant was placed into a new 2 mL micro-centrifuge tube along with an equal
volume (600-700 µL) of „binding matrix‟ (provided in the kit). Polyvinylpyrrolidone
(PVPP) was added to the each micro-centrifuge tube at a rate of 25 mg (50 µL) and
inverted to mix. Samples were incubated with gentle agitation (low-speed vortex) for 5
min at room temperature. Samples were centrifuged at 14,000 g for 10 s to pellet the
binding matrix, and the supernatant was discarded. A volume of 500 µL of prepared
SEWS-M wash solution (provided in the kit) was added to the micro-centrifuge tubes.
SEWS-M is an ethanol based wash solution meant to further purify and release DNA
bound in the silica membrane of the filter. Samples were then centrifuged at 14,000 g for

118
1 min and the supernatant was discarded. Samples were centrifuged again at 14,000 g for
10 s and residual liquid was removed with a pipette. DNA was eluted by gently
resuspending the binding matrix in 100 µL of DES solution and incubated for 5 min at 55
oC in a heat block or water bath. Samples were centrifuged at 14,000 g for 1 minute. The
supernatant containing eluted DNA was transferred (avoiding the binding matrix) to a
clean micro-centrifuge tube and stored at –20 oC. Samples extracted from wheat stem
tissue were diluted 1:10 (1 part extracted DNA solution:10 parts water).
MO-BIO DNA extraction kit protocol
Approximately 20 to 80 mg of plant tissue was added to a 2 mL micro-centrifuge
tube (included in the kit), which contained small silicon pellets to aid in grinding. Plant
tissue, which had been ground with liquid nitrogen or that was left un-ground (depending
on the experiment objective), was added to the tubes. In some cases, a 1.4 mm ceramic
bead from the FastDNA kit was also added to the tube. Micro-centrifuge tubes were
gently vortexed to mix the tissue, grinding pellets and ceramic bead if it was added.
However, this step did not fully grind tissue, but simply mixed contents for better
homogenization in the Fast Prep unit. Sixty microliters of Solution S1 was added to each
tube and the tube was inverted several times to mix. S1 solution was provided in the kit
and contained SDS, a detergent that aids in cell lyses to break down fatty acids and lipids
associated with the cell membrane of organisms. Two hundred microliters of solution
IRS (Inhibitor Removal Solution) was added to the tubes, which were then secured in the
Fast Prep instrument and operated at a speed of either 5 or 6 for 45 s. The (IRS) inhibitor
removal solution is a proprietary agent that was designed by Mo-Bio to precipitate humic
acids and other inhibitors of PCR reactions. Extraction tubes were centrifuged at 10,000

119
g for 30 s. A volume of 400 to 450 (425) µL of supernatant was transferred to a new 2
mL micro-centrifuge tube. A volume of 250 µL of Solution S2 was added to the
supernatant in the new tube and vortexed for 5 sec. Solution S2 contains a protein
precipitation agent to remove contaminant proteins that reduce DNA purity and
potentially inhibit PCR applications. Micro-centrifuge tubes were incubated at 4 oC for 5
minutes then centrifuged for 1 minute at 10,400 g. Supernatant (~650µL) was carefully
transferred (avoiding the pellet) to a new 1.5 mL micro-centrifuge tube. Solution S3 was
added at a volume of 1.2 mL to the supernatant and vortexed for 5 s. S3 is a DNA
binding salt solution that contains silica, as DNA will bind to silica in the presence of
high salt concentrations. Approximately 670 µL of the supernatant was loaded into the
spin filter micro-centrifuge tube (from the kit) and centrifuged at 10,000 g for 1 minute.
The flow through was discarded and the remaining supernatant was added to the spin
filter (two more cycles of 670 µL) and centrifuged for 1 minute at 10,000 g. This process
was repeated three times. 300 µL of Solution S4 was added to the spin filter centrifuge
tube and centrifuged for 30 s at 10,000 g, then the remaining flow through was discarded.
Solution S4 is an ethanol based solution used to wash DNA that is bound to the silica
membrane in the filter and also removes residual salt, humic acid, and other
contaminants. The tube was centrifuged again at 10,000 g for 1 minute. The spin filters
were taken out of the centrifuge tubes and placed into tubes containing 25 mg of PVPP
that had been prepared prior to extraction. A volume of 50 µL of Solution S5 was added
to the center of the spin filter and centrifuged at 10,000 x g for 1 minute. Solution S5 is a
sterile elution buffer containing 10 mM Tris (pH = 8.0) designed to release the eluted
DNA from the silica membrane and into the micro-centrifuge tube. Eluate containing

120
DNA and PVPP were mixed by tapping. The mixed solution was allowed to sit at room
temperature for several minutes, then centrifuged at10, 000 g for 3 minutes and 50 µL
was transferred to a new sterile 0.5 mL Eppendorf micro-centrifuge tube to be used for
PCR. Samples were stored at -20 C.
Conventional PCR amplification
Conventional PCR was carried out in EE-1 and EE-2 samples using 15.5 µL of
molecular water, 6.0 µL of DNA loading buffer (New England Biolabs, Ipswich, MA),
1.8 µL of MgCl2 (New England Biolabs, Ipswich, MA), 2.0 µL of oligonucleotides
(dNTPs), 1.2 µL of forward primer, 1.2 µL of reverse primer, and 0.3 µL of Taq
polymerase (New England Biolabs, Ipswich, MA). Two microliters of template DNA
was added to the reaction. The PCR (MJ Research, Watertown, MA) program included
an initial denaturing temperature of 94 oC for 3 minutes. Each cycle included a
denaturing temperature of 92 oC for 45 seconds, an annealing temperature of 60
oC for 45
seconds, and an extension temperature of 72 oC for 1 minute. The PCR product was
visualized on a 1% agarose gel, stained with Ethidium bromide (EtBr).
Real Time Q-PCR amplification
Fungal DNA from crown and sub-crown tissues were assayed using the FastStart
DNA Master SYBR Green I fluorescence (Roche Applied Science, Indianapolis, Ind.)
and a Light Cycler thermocycler (Roche Applied Science, Indianapolis, Ind.) according
to Okubara et al. (2005). Published PCR primers (Schilling et al. 1996; Nicholson et al.
1998; Aoki and O‟Donnell, 1999; Williams et al. 2002) were evaluated for species-
specificity using 19 PNW isolates of F. culmorum, F. pseudograminearum, and F.
crookwellense. The following primers were used: OPT18 (SCAR2-35: 5‟-
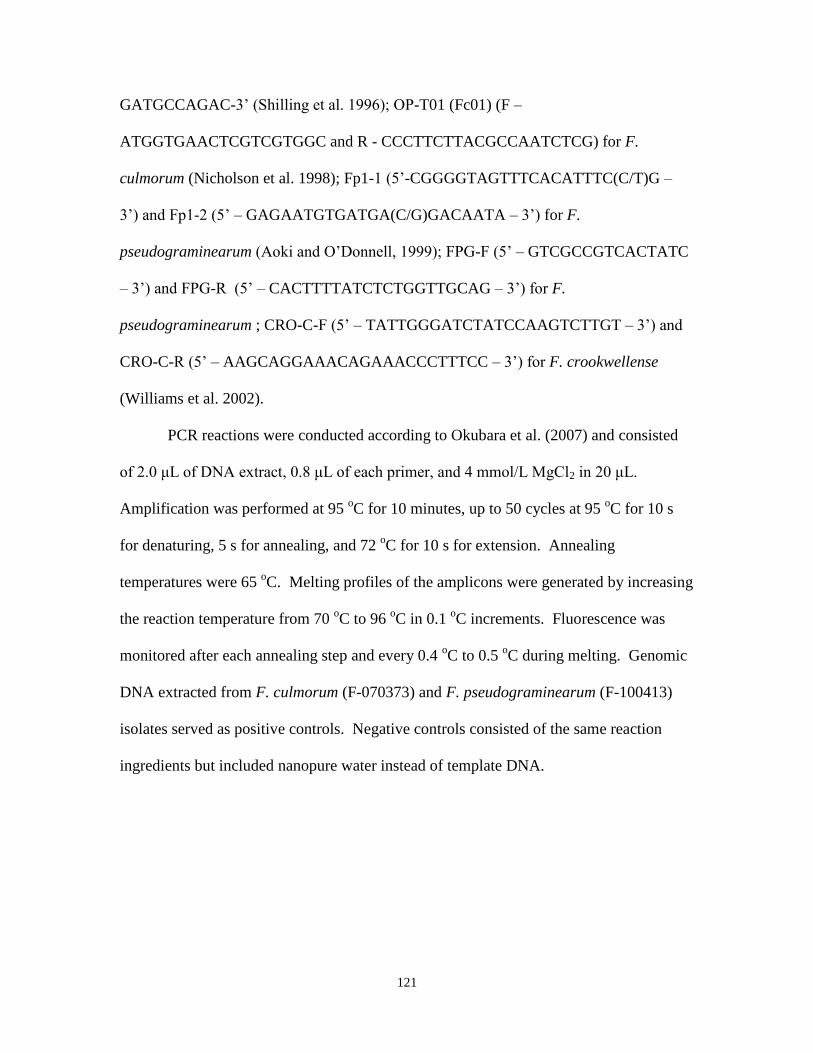
121
GATGCCAGAC-3‟ (Shilling et al. 1996); OP-T01 (Fc01) (F –
ATGGTGAACTCGTCGTGGC and R - CCCTTCTTACGCCAATCTCG) for F.
culmorum (Nicholson et al. 1998); Fp1-1 (5‟-CGGGGTAGTTTCACATTTC(C/T)G –
3‟) and Fp1-2 (5‟ – GAGAATGTGATGA(C/G)GACAATA – 3‟) for F.
pseudograminearum (Aoki and O‟Donnell, 1999); FPG-F (5‟ – GTCGCCGTCACTATC
– 3‟) and FPG-R (5‟ – CACTTTTATCTCTGGTTGCAG – 3‟) for F.
pseudograminearum ; CRO-C-F (5‟ – TATTGGGATCTATCCAAGTCTTGT – 3‟) and
CRO-C-R (5‟ – AAGCAGGAAACAGAAACCCTTTCC – 3‟) for F. crookwellense
(Williams et al. 2002).
PCR reactions were conducted according to Okubara et al. (2007) and consisted
of 2.0 μL of DNA extract, 0.8 μL of each primer, and 4 mmol/L MgCl2 in 20 μL.
Amplification was performed at 95 oC for 10 minutes, up to 50 cycles at 95
oC for 10 s
for denaturing, 5 s for annealing, and 72 oC for 10 s for extension. Annealing
temperatures were 65 oC. Melting profiles of the amplicons were generated by increasing
the reaction temperature from 70 oC to 96
oC in 0.1
oC increments. Fluorescence was
monitored after each annealing step and every 0.4 oC to 0.5
oC during melting. Genomic
DNA extracted from F. culmorum (F-070373) and F. pseudograminearum (F-100413)
isolates served as positive controls. Negative controls consisted of the same reaction
ingredients but included nanopure water instead of template DNA.

122
Generation of standard curves
DNA was quantified according to standard curves developed on the basis of
known concentrations of DNA extracted from isolates from the PNW Fusarium spp.
collection. DNA standards were quantified prior to Q-PCR runs using fluorometry in a
200-µL volume in 96-well plates using Hoescht 33258 dye and a Safire fluorescence
plate reader (TECAN Research, Triangle Park, NC). DNA concentrations were
standardized to ~5ng/ µL Standard curves were developed for FPG and OPT primers sets
using positive controls for the F. pseudograminearum and F. culmorum isolates,
respectively, five 10-fold dilution DNA standards ranging from 500 fg/ µL to 10 ng/ µL.
Data was analysed with LightCycler Software version 3. The data was used to generate
standard curves and standard errors and efficiencies of each DNA concentration was
calculated. Results for the range of DNA quantities were plotted.
Data Analysis
Treatments were arranged with fields as a fixed effect and independent variables
were fields (48) and samples treated as replications (3). The dependent variables were
crown rot severity score and DNA concentration. Three samples were randomly selected
within each field and treated as the replication effect. Duncan multiple range test least
significant difference (LSD) mean separation and ANOVA was performed with SAS
statistical software (Version 6.12; SAS Institute Inc., Cary NC).

123
RESULTS
A single primer set, „FPG‟ and „OPT‟, were selected and standard curves were
generated for F. pseudograminearum and F. culmorum with each respective primer set.
Standard curves were successfully generated using positive controls of each respective
species with reproducible amplification and correlation efficiency values (Figures 1 and
2). The slopes for each species were similar with amplification efficiencies of 94% for
the F. pseudograminearum positive control amplified with the „FPG‟ primer set and 96%
for the F. culmorum positive control amplified with the „OPT‟ primer set.
Figure 1. Standard curves generated using Q-PCR with the „FPG‟ primers developed by
Williams et al. (2002) for identification and quantification.
y = -3.3088x + 32.465r² = 0.9846
0
5
10
15
20
25
30
35
40
-1 0 1 2 3 4 5
Cyc
le n
um
be
r
Log DNA Concentration
Error = 0.0165Efficiency = 0.94

124
Figure 2. Standard curves generated using Q-PCR with the „OPT‟ primers developed by
Schilling et al. (1996) for identification and quantification.
When the conidial samples were extracted using the FastDNA kit in the first
experiment, there was positive amplification with four of the eight samples with the
„OPT‟ primers. Three of the four „OPT‟ amplifications for F. culmorum agreed with
morphological F. culmorum identifications, whereas one was morphologically identified
as F. pseudograminearum in culture (Table 1). None of the conidial extraction samples
that were identified as F. pseudograminearum amplified with the „FPG‟ primer set. The
overall amplification frequency from the conidial extraction was 50%.
Preliminary experiments showed that DNA extractions and subsequent Q-PCR
from crown rot infected wheat stems were more effective using the Mo-Bio extraction kit
rather than the FastDNA kit (data not shown). DNA extraction for EE-2 from infected
y = -3.2288x + 33.399r² = 0.99
0
5
10
15
20
25
30
35
40
-1 0 1 2 3 4 5
Cyc
le n
um
be
r
Log DNA concentration
Error = 0.007Efficiency = 0.96

125
plant stems was performed using the FastDNA kit (Table 2). Grinding plant tissue with
liquid nitrogen was compared to bead beating treatments using the addition of a second
ceramic bead according to Hogg et al. (2007). Two of eight samples from sample 170
amplified with the „FPG‟ primer set using conventional PCR for both grinding treatments
when DNA was not diluted. When these samples were diluted (1:10), six of the eight
samples amplified with conventional PCR; however, none of these samples amplified
with Q-PCR, even following dilution (data not shown).
When DNA extraction was performed using the Mo-Bio kit in EE-3 (utilizing the
liquid nitrogen grinding technique prior to homogenization), 6 of 8 samples amplified
with Q-PCR, 3 with the „OPT‟, and 3 with the „FPG‟ primer sets, respectively (Table 3).
It is important to note that morphological identifications and DNA extractions were
carried out on separate stems within a given sample. Two separate stems within samples
215 and 170 that were identified as F. pseudograminearum amplified with the „OPT‟
primer set. Likewise, two of the stems within samples that were identified as F.
culmorum amplified with the „FPG‟ primer set. One sample identified as F.
crookwellense amplified with the „FPG‟ primer set and one sample identified as F.
pseudograminearum amplified with the „FPG‟ primer set.

126
Table 1. Results from the Fusarium spp. conidial DNA extraction experiment (EE-1)
using the FastDNA extraction kit.
Extract Morphological Conventional
Sample1 Sample
2 Field
3 Location
4 species ID in culture
5 PCR Product
6
1 11 3 Pendleton, OR F. pseudograminearum -----
2 41 9 Moro, OR F. culmorum OPT7
3 115 23 Pomeroy, WA F. pseudograminearum -----
4 125 25 Waitsburg, WA F. culmorum OPT
5 194 39 Odessa, WA F. pseudograminearum OPT
6 241 49 Coulee City, WA F. culmorum OPT
7 245 49 Coulee City, WA F. pseudograminearum -----
8 261 53 Douglas Co. WA F. culmorum -----
1 Extract sample represents the chronological order of samples for experiment EE-1.
2 Sample represents a stem sample taken from one of five 1-m samples taken from within
a field. 3 Field number represents the field number that was surveyed in 2008.
4 The location represents the nearest town location of the field surveyed during the 2008
Fusarium survey. 5 Morphological species identifications were conducted by culturing on SNA media and
identifying the respective species based on conidial morphology according to Lesley et
al. (2006). 6
Samples were analyzed with conventional PCR and products. Each cycle included a
denaturing temperature of 92 oC for 45 seconds, an annealing temperature of 60
oC for 45
seconds, and an extension temperature of 72 oC for 1 minute. The PCR product was
visualized on a 1% agarose gel, stained with Ethidium bromide (EtBr). 7 Primers analysed for EE-1 were FPG for F. pseudograminearum and OPT for F.
culmorum.

127
Table 2. Results from the DNA extraction experiment (EE-2) using the FastDNA kit
comparing grinding techniques for wheat stem/crown tissue extractions.
Tissue Conv.
Extract weight Grinding Morphological PCR
Sample1 Sample
2 Field
3 (mg)
4 Method
5 species ID in culture
6 Product
7
1 169 34 21 Liquid nitrogen F. pseudograminearum ----
2 169 34 21 Bead beat w/out LN F. pseudograminearum ----
3 170 34 16 Liquid nitrogen F. pseudograminearum 8FPG
4 170 34 22 Bead beat w/out LN F. pseudograminearum FPG
5 172 35 15 Liquid nitrogen F. culmorum -----
6 172 35 10 Bead beat w/out LN F. culmorum -----
7 465 93 20 Liquid nitrogen F. crookwellense -----
8 465 93 16 Bead beat w/out LN F. crookwellense 8OPT
1 Extract sample represents the chronological order of samples for experiment EE-2.
2 Sample represents a stem sample taken from one of five 1-m samples taken from within
a field. 3 Field number represents the field number that was surveyed in 2008. Samples were
taken from fields 34 and 35 near Connell, WA, and field 93 in Douglas Co., WA. 4 Tissue was weighed after grinding for liquid nitrogen treatments and prior to placement
in the lysing tubes without grinding for bead beat treatments. Numbers represent
milligrams of tissue. 5 Treatments were imposed on wheat stems by grinding into a fine powder with liquid
nitrogen prior to placement into lysing tubes prior to grinding with the Fast Prep. Bead
beat samples were not ground with liquid nitrogen but placed into the lysing tubes with
an extra ceramic bead prior to grinding in the Fast Prep. 6 Morphological species identifications were conducted by culturing on SNA media and
identifying the respective species based on conidial morphology according to Lesley et
al. (2006). 7 Samples were analyzed with conventional PCR and products. Each cycle included a
denaturing temperature of 92 oC for 45 seconds, an annealing temperature of 60
oC for 45
seconds, and an extension temperature of 72 oC for 1 minute. The PCR product was
visualized on a 1% agarose gel, stained with Ethidium bromide (EtBr). 8 Primers analysed for EE-2 were FPG to identify F. pseudograminearum and OPT to
identify F. culmorum.

128
Table 3. DNA extraction experiment (EE-3) from various fields and samples showing
significant levels of crown rot where different species were isolated using the Mo-Bio
Ultra Clean Soil kit and Q-PCR analysis of DNA.
Extract Morphological Quantitative
Sample1 Sample
2 Field
3 species ID in culture
4 PCR Product
5
1 169 34 F. pseudograminearum -----
2 170 34 F. pseudograminearum 6OPT
3 172 35 F. culmorum 6FPG
4 465 93 F. crookwellense FPG
5 23 5 F. pseudograminearum -----
6 115 23 F. pseudograminearum FPG
7 215 43 F. pseudograminearum OPT
8 234 47 F. culmorum FPG
1 Extract sample represents the chronological order of samples for experiment EE-3.
2 Sample represents a stem sample taken from one of five 1-m samples taken from within
a field. 3 Field number represents the field number that was surveyed in 2008. Samples were
taken from field 5 in Moro Co. northern OR, field 23 near Pomeroy, WA, fields 34 and
35 near Connell, WA, field 43 near St. John WA, field 47 near Creston WA, and field 93
in Douglas Co., WA. 4 Morphological species identifications were conducted by culturing on SNA media and
identifying the respective species based on conidial morphology according to Lesley et
al. (2006). 5 Samples were analyzed with real-time Q-PCR. Amplification was performed at 95
oC
for 10 minutes, up to 50 cycles at 95 oC for 10 s for denaturing, 5 s at 65
oC for annealing,
and 72 oC for 10 s for extension.
6‟OPT‟ primers correspond to the identification of F. culmorum; „FPG‟ primers
correspond to the presence of F. pseudograminearum.

129
In EE-4, the experiment comparing the FastDNA and Mo-Bio extraction kits, all
of the Mo-Bio kit extractions amplified, but none of the extractions from the FastDNA kit
amplified by Q-PCR (Table 4). All of the samples that amplified did so with the „FPG‟
primer set. The morphological fungal identifications did not coincide with the Q-PCR
amplifications in this experiment. The FastDNA extractions were later diluted 1:10 and
still did not result in positive Q-PCR amplifications. Results showed that the Mo-Bio kits
allowed for more efficient extraction of DNA with more consistent Q-PCR amplification
over several experiments.
To further evaluate the Mo-Bio kit for extracting DNA from infected wheat stems
for Q-PCR amplification, DNA extraction efficiency treatments with bead beating, liquid
nitrogen grinding, and soaking treatments were compared as stand-alone treatments in
EE-5. Generally, bead beating and liquid nitrogen grinding combined resulted in the
greatest amount of DNA (Table 5), with the exception of the bead beat treatment for
sample 115, which had the greatest DNA concentration. The two grinding treatments
were not significantly different from each other across treatments. All of the treatments
amplified with the „FPG‟ primer set regardless of the morphological identification of F.
pseudograminearum or F. culmorum from other stems within those samples. The
exception was that of sample 115 control treatment without any soaking or bead beating,
which had been morphologically identified as F. pseudograminearum and amplified with
the „OPT‟ primer set (amplifying F. culmorum according to Shilling et al. 1996).

130
Table 4. Comparison of DNA extraction with the Mo-Bio and FastDNA extraction kits
(EE-4) for 12 field samples identified morphologically with various Fusarium spp.
Extract Extraction Weight Morphological Q-PCR CP
Sample1 Sample
2 Kit
3 (mg) tissue
4 identification in culture
5 product
6 value
7
1 172 Mo-Bio 77 F. culmorum FPG 33.7
2 115 Mo-Bio 89 F. pseudograminearum FPG 26.3
3 215 Mo-Bio 107 F. pseudograminearum FPG 34.3
4 234 Mo-Bio 123 F. culmorum FPG 39.7
5 169 Mo-Bio 67 F. pseudograminearum FPG 34.1
6 465 Mo-Bio 144 F. crookwellense ------
7 172 FastDNA 74 F. culmorum ------
8 115 FastDNA 89 F. pseudograminearum ------
9 215 FastDNA 108 F. pseudograminearum ------
10 234 FastDNA 133 F. culmorum ------
11 169 FastDNA 69 F. pseudograminearum ------
12 465 FastDNA 133 F. crookwellense ------
13 Positive Control - F. pseudograminearum FPG 22.9 1 Extract sample number represents the chronological order of extraction samples.
2 Sample represents a stem sample taken from one of five 1-m samples taken from within
a field. 3 Extractions were made with the Mo-Bio kit or FastDNA kit.
4 Tissue was weighed after grinding for liquid nitrogen treatments and prior to placement
in the lysing tubes without grinding for bead beat treatments. Numbers represent
milligrams of tissue. 5 Morphological species identifications were conducted by culturing on SNA media and
identifying the respective species based on conidial morphology according to Lesley et
al. (2006). 6
Samples were analyzed with real-time Q-PCR. Amplification was performed at 95 oC
for 10 minutes, up to 50 cycles at 95 oC for 10 s for denaturing, 5 s at 65
oC for annealing,
and 72 oC for 10 s for extension. „FPG‟ primers correspond to the presence of F.
pseudograminearum. 7 CP Value = crossing point value and represents the amplification cycle when DNA
quantities increase above a threshold.
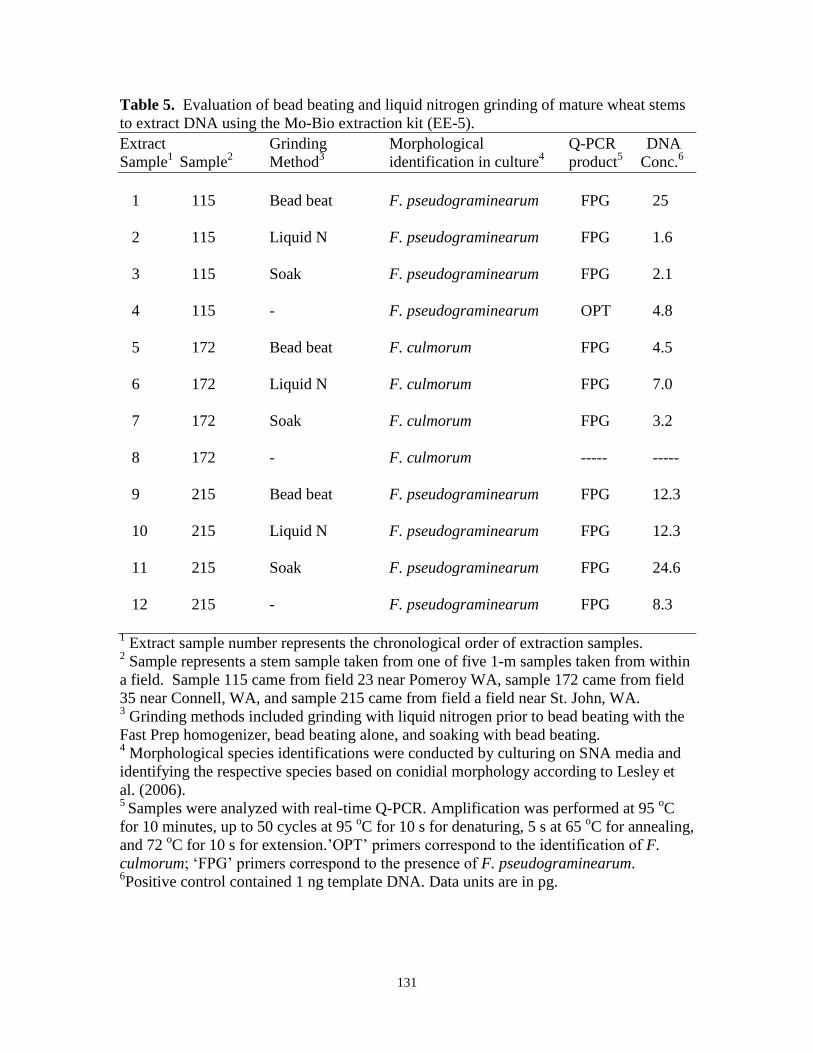
131
Table 5. Evaluation of bead beating and liquid nitrogen grinding of mature wheat stems
to extract DNA using the Mo-Bio extraction kit (EE-5).
Extract Grinding Morphological Q-PCR DNA
Sample1 Sample
2 Method
3 identification in culture
4 product
5 Conc.
6
1 115 Bead beat F. pseudograminearum FPG 25
2 115 Liquid N F. pseudograminearum FPG 1.6
3 115 Soak F. pseudograminearum FPG 2.1
4 115 - F. pseudograminearum OPT 4.8
5 172 Bead beat F. culmorum FPG 4.5
6 172 Liquid N F. culmorum FPG 7.0
7 172 Soak F. culmorum FPG 3.2
8 172 - F. culmorum ----- -----
9 215 Bead beat F. pseudograminearum FPG 12.3
10 215 Liquid N F. pseudograminearum FPG 12.3
11 215 Soak F. pseudograminearum FPG 24.6
12 215 - F. pseudograminearum FPG 8.3
1 Extract sample number represents the chronological order of extraction samples.
2 Sample represents a stem sample taken from one of five 1-m samples taken from within
a field. Sample 115 came from field 23 near Pomeroy WA, sample 172 came from field
35 near Connell, WA, and sample 215 came from field a field near St. John, WA. 3 Grinding methods included grinding with liquid nitrogen prior to bead beating with the
Fast Prep homogenizer, bead beating alone, and soaking with bead beating. 4 Morphological species identifications were conducted by culturing on SNA media and
identifying the respective species based on conidial morphology according to Lesley et
al. (2006). 5
Samples were analyzed with real-time Q-PCR. Amplification was performed at 95 oC
for 10 minutes, up to 50 cycles at 95 oC for 10 s for denaturing, 5 s at 65
oC for annealing,
and 72 oC for 10 s for extension.‟OPT‟ primers correspond to the identification of F.
culmorum; „FPG‟ primers correspond to the presence of F. pseudograminearum. 6Positive control contained 1 ng template DNA. Data units are in pg.

132
A small preliminary experiment (EE-6) was conducted in an attempt to correlate
crown rot severity ratings and DNA concentrations from infected stems. Unfortunately
there was not any direct correlation that could be drawn between crown rot severity
ratings and DNA concentrations (Table 6). Those with the lowest crown rot severity
ratings and identified as F. pseudograminearum had the greatest DNA concentrations
with the „FPG‟ primer set. Q-PCR was not completely correlated to the morphological
species identification. Although two samples (treatments 1 and 3) morphologically
identified as F. pseudograminearum amplified with the FPG primer set, those that were
morphologically identified as F. culmorum (treatment 6) and F. crookwellense (treatment
8) also amplified with the FPG primer set (Table 6).
In the experiment EE-7, the Fast Prep grinding speed and sample preparation
(soaking and grinding treatments with an extra ceramic bead) were compared to further
optimize DNA extractions. Soaking combined with bead beating with the addition of a
ceramic bead (from the FastDNA kit) to the Mo-Bio kit enhanced the DNA extraction.
However, when bead beating and soaking treatments were combined with a Fast Prep
speed of 6, the DNA concentrations dropped off substantially (Table 7). It was
postulated that DNA concentrations declined at a Fast Prep speed of 6 due to over-
maceration of plant tissue and shearing of fungal DNA. DNA quality was not evaluated
on a gel.
EE-8 was conducted to evaluate sample preparation with liquid nitrogen grinding,
soaking in the extraction buffer, the addition of a ceramic bead, the need for the addition
of PVPP to the extraction process, and the Fast Prep speed with the Mo-Bio kit. The
optimal treatments were grinding with liquid nitrogen followed by soaking for 1 hour in

133
the extraction buffer solutions (60 µL of S1 and 200 µL of IRS), the addition of a ceramic
bead and a Fast Prep speed of 5 (Table 7).
Table 6. DNA extractions from various samples within fields from the 2008 Fusarium
survey samples with the Mo-Bio DNA extraction kit to correlate DNA quantity to crown
rot severity ratings (EE-6).
(0 to 10)
Extract Rating Morphological species Q-PCR Results
Sample1 Field
2 Sample
3 category
4 identification from culture
5 (DNA conc.)
6
1 39 192 Low (1-3) F. pseudograminearum (FPG) 24.8
2 51 254 Low (1-3) F. culmorum -----
3 13 65 Medium (3-6) F. pseudograminearum (FPG) 22.4
4 35 173 Medium (3-6) F. culmorum -----
5 38 190 High (6-10) F. pseudograminearum -----
6 62 310 High (6-10) F. culmorum (FPG) 18.7
7 93 465 Medium (3-6) F. crookwellense -----
8 95 474 High (6-10) F. crookwellense (FPG) 4.09
1 Extract sample represents the chronological order of samples for experiment EE-3.
2 Field number represents the field number that was surveyed in 2008. Samples were
taken from field 13 in Moro Co. northern OR, field 35 near Connell, WA, fields 38 and
39 near Odessa, WA, fields 51 and 93 near Mansfield, WA, field 62 near Quincy
(irrigated field), and field 95 near Pullman, WA. 3 Sample represents a stem sample taken from one of five 1-m samples taken from within
a field. 4 Samples were visually rated for crown rot severity on 0 to 10 scale (10 = heavy disease)
and placed into three rating categories: Low (rating = 1 to 3), Medium (rating = 3 to 6),
and High (rating = 6 to 10). 5 Morphological species identifications were conducted by culturing on SNA media and
identifying the respective species based on conidial morphology according to Lesley et
al. (2006). 6 Samples were analyzed with real-time Q-PCR. Amplification was performed at 95
oC
for 10 minutes, up to 50 cycles at 95 oC for 10 s for denaturing, 5 s at 65
oC for annealing,
and 72 oC for 10 s for extension.‟OPT‟ primers correspond to the identification of F.
culmorum; „FPG‟ primers correspond to the presence of F. pseudograminearum. Data
units are in pg.

134
Table 7. Comparison of sample preparation (EE-8) with liquid nitrogen grinding,
soaking, bead beating, the addition of PVPP, and the Fast Prep speed to optimize DNA
extractions from 2008 Fusarium Survey wheat stem samples infected with crown rot.
DNA
Tissue Wt. CP conc. per
Field1 Grinding method
2 (mg)
3 Value
4 mg tissue
5
40 Liquid nitrogen + Soaking + Bead Beating 22 28.53 5.045
40 Liquid nitrogen + Bead Beating 20 31.31 0.960
40 Bead beating 20 31.55 0.825
40 Liquid nitrogen (with PVPP standard) 14 30.83 1.843
40 Liquid nitrogen + Bead beating (without PVPP) 20 33.87 0.200
23 Liquid nitrogen + Bead beating (Fast Prep Speed 5) 19 26.89 16.36
23 Liquid nitrogen + Bead beating (Fast Prep Speed 6) 18 28.16 7.778
--- Positive Control --- 24.94 ------
1
Field represents the field number that was surveyed in 2008. Samples were taken from
field 40 near Lind, WA and field 23 near St. John, WA. 2 Grinding methods included grinding with liquid nitrogen prior to bead beating with the
Fast Prep homogenizer, bead beating alone, and soaking with bead beating. The Fast
Prep homogenization speed was set at 5 unless otherwise indicated (field 23 samples). 3 Tissue was weighed after grinding for liquid nitrogen treatments and prior to placement
in the lysing tubes without grinding for bead beat treatments. Numbers represent
milligrams of tissue. 4 Samples were analyzed with real-time Q-PCR. Amplification was performed at 95
oC
for 10 minutes, up to 50 cycles at 95 oC for 10 s for denaturing, 5 s at 65
oC for annealing,
and 72 oC for 10 s for extension. „FPG‟ primers were used to analyse these samples for
the presence of F. pseudograminearum. The CP value represents the crossing point value
or the number of cycles where DNA was detected above a threshold. 5 DNA concentration is expressed in pg DNA per mg tissue.

135
In an experiment to further evaluate the correlation of crown rot severity ratings
to DNA concentrations (EE-9), 24 survey field sample samples were taken from single
stems 3 cm in length. There were seven positive amplifications for the „FPG‟ primer set
from the 24 samples. Crown rot severity ratings for the seven amplifications were
positively correlated to DNA concentrations with an r2 value of 0.61 for the seven
samples that showed amplification (Figure 3).
Figure 3. Regression (r2=0.61; p<0.0001) relationship between DNA
concentration and crown rot rating, using single wheat stem extractions with the
Mo-Bio kit and the „FPG‟ primer set (EE-9).
y = 0.8822x - 2.7696r² = 0.61
0
1
2
3
4
5
6
7
0 1 2 3 4 5 6 7 8 9
DN
A C
on
cen
trat
ion
(D
NA
(n
g)/m
g ti
ssu
e)
Crown Rot Rating

136
Results from EE-10 evaluating the correlation of DNA concentration to visual
crown rot severity ratings showed 74 (51%) amplifications with the „FPG‟ primers and
30 (20%) amplifications with the „OPT‟ primers (Table 8), while 16 (11%) sample stem
samples were amplified with both primer sets (FPG and OPT). There were16 sample
DNA samples that amplified for both the FPG and OPT primer sets. Although regression
analysis indicated a negative correlation between the DNA concentrations of the species
within a stem (r2=-0.14;P=0.60), it was not significant. There was a trend for one species
to dominate in the DNA concentrations in these extracted samples that amplified with
both primer sets. There were significant differences between fields for the 74 FPG
amplifications (P<0.0001) and crown rot ratings (P<0.0001) but not for the 30 OPT
amplifications (P=0.457).
Table 8. Results of amplification with „FPG‟ and „OPT‟ primers (EE-10) from 144 DNA
extractions made from 48 fields and the respective morphological identifications
(Fusarium spp.) of the amplified samples.
Percent of each amplified
Number sample morphologically
Primer1 Amplified
2 identified as:
F. pseudograminearum3 F. culmorum
3
FPG 74 50% 28%
OPT 30 43% 40%
1 Samples were analyzed with real-time Q-PCR. Amplification was performed at 95
oC
for 10 minutes, up to 50 cycles at 95 oC for 10 s for denaturing, 5 s at 65
oC for annealing,
and 72 oC for 10 s for extension.‟OPT‟ primers correspond to the identification of F.
culmorum; „FPG‟ primers correspond to the presence of F. pseudograminearum. 2 Number amplified represents the number of samples out of 144 total extractions that
amplified with each respective primer set. 3 Numbers represent the proportions of morphological identifications cultured on SNA
and identified according to Lesley et al. (2006) for each respective species. Each
morphologically identified stem was taken from the same field sample but from a
different stem than that amplified with Q-PCR.
137
Of the 74 amplifications with the „FPG‟ primers, 50% of the isolations of separate
stems within those samples were identified as F. pseudograminearum and 28% were
identified as F. culmorum. Of the 30 amplifications with the „OPT‟ primers, 43% of the
isolations from separate stems within those samples were identified as F.
pseudograminearum, whereas 40% had been identified as F. culmorum (Table 8). In this
experiment there was no significant correlation between crown rot severity and Q-PCR
DNA concentrations for the amplifications of either the FPG or OPT primers (Figures 4
and 5).
Figure 4. Relationship between DNA concentration and crown rot severity score,
from 144 DNA extractions (EE-10) made with the Mo-Bio Ultra Clean Soil
extraction kit and Q-PCR with the „FPG‟primers.
y = 3.485x + 0.0245r² = 0.011
0
20
40
60
80
100
120
140
160
180
200
0 1 2 3 4 5 6
DN
A C
on
cen
trat
ion
(p
g /
mg
tiss
ue
)
Crown score (0 to 10)

138
Figure 5. Relationship between DNA concentration and crown rot severity score,
from 144 DNA extractions (EE-10) made with the Mo-Bio Ultra Clean Soil
extraction kit and Q-PCR with the „OPT‟primers.
y = -0.087x + 0.6275r² = 0.0112
0
1
2
3
4
5
6
0 1 2 3 4 5 6
DN
A C
on
cen
trat
ion
(p
g/m
g ti
ssu
e)
Crown Score

139
DISCUSSION
Our results are the first to use species-specific Q-PCR assays to quantify DNA in
wheat stems infected with crown rot pathogens under natural conditions from a region-
wide PNW crown rot survey. Hogg et al. (2007) and Strausbaugh et al. (2005) used non-
species-specific „TaqMan‟ based primers from the tri-5 genetic region to amplify F.
graminearum, F. pseudograminearum, and F. culmorum. Although DNA was
successfully quantified from naturally occurring field residues, there has not been any
report of Q-PCR DNA quantities from naturally occurring fields being correlated to
disease severity ratings or indexes (Strausbaugh et al. 2005; Hogg et al. 2007). The only
reports of correlations between crown rot severity scores and DNA concentrations have
been in inoculated field and greenhouse experiments (Strausbaugh et al. 2005; Hogg et al.
2007).
Others have reported difficulty in finding associations between crown rot severity
and DNA quantities (Nicholson et al. 1998). Nicholson et al. (1998) reported that
although plants receiving more inoculum tended to have more disease, visual assessments
were not always an accurate indicator of inoculum levels. The authors concluded that
competitive PCR revealed a clearer measure of inoculum concentration.
Strausbaugh et al. (2005) detected DNA through Q-PCR in roots highly infected
with F. culmorum (67% isolation frequency) under natural levels of inoculum in field
conditions. However, DNA concentrations were not correlated to a disease severity
index. Strausbaugh et al. (2005) did report a correlation between percentage of infected
roots and Q-PCR DNA concentrations in inoculated greenhouse experiments.
140
Hogg et al. (2007) found correlations between a calculated field disease severity
score (DSS) from inoculated field plots and Q-PCR DNA concentrations. The authors
attributed that the success of this correlation was due to the highly virulent F.
pseudograminearum inoculum source in inoculated field experiments. Furthermore they
reported that the relationship between DNA quantities of Fusarium spp. and traditional
FCR disease measures was unstable over the 2 years of the study. The instability across
years was attributed to low disease intensity in 2005 (the second year) from cooler and
wetter climatic conditions and over-inflated disease severity ratings. The authors
concluded that Q-PCR can be an effective method for assessing crown rot disease
severity in mature wheat stems, but only under certain conditions that increase disease
severity and symptoms. The authors noted that under conditions of low environmental
stress, low pathogen populations, and less disease development the assay was not an
improvement over traditional methods of culturing and isolation (Hogg et al. 2007).
Hogg et al. (2010) found Q-PCR quantities to be significantly less, approximately 0.4%,
from natural field inoculation compared to artificial inoculation with F.
pseudograminearum.
In the current study we used Q-PCR and species-specific primers to quantify
DNA from infected wheat stems collected from a range of crown rot severity ratings
under natural field inoculum conditions. Our assays were able to successfully detect both
F. pseudograminearum and F. culmorum at a rate of 49% and 20%, respectively for each
species, using the Mo-Bio DNA extraction kit. DNA quantifications were not directly
related to morphological identifications for each species from each respective field
collection location across experiments. In this study, DNA concentration was not

141
correlated to crown rot severity ratings in the evaluation of 48 fields involving 144 DNA
extractions. This could potentially be due to the nature of infection under natural
inoculum pressure, as others have had difficulty correlating disease severity to DNA
concentrations under natural conditions (Strausbaugh et al. 2005).
It is likely that the morphological identifications were not correlated to species-
specific primer DNA amplifications from infected wheat stems for several reasons.
Firstly, the morphological identifications and DNA extractions were made from separate
stems within the same field or sample in these extraction experiments. There were fields
in the survey where more than one Fusarium spp. occurred within the same field. It is
likely that more than one species occurred in separate stems within a given field or
sample. The fact that 20% of the amplified samples in EE-10 from within 48 fields
amplified with both primer sets (OPT and FPG) coming from the same DNA extraction
sample suggests there is the potential that both species may co-exist within a given stem.
Secondly, there is a possibility that both species could potentially reside within the same
stem in a field situation where both species occurred within a given field. Thirdly the
species-specific primers used in this study were developed on the basis of Fusarium spp.
in Australia (FPG) and Germany (OPT). The potential exists that amplification of PNW
Fusarium spp. isolates may not all completely amplify using the species-specific primers
used in this study (FPG and OPT).
Results from the current study showed that one of the conidial extraction samples
which had been morphologically identified as F. pseudograminearum amplified with the
OPT primer set, whereas all the other amplifications were accurate (i.e. F. culmorum
cultures amplified with the OPT primer set). Williams et al. (2002) reported
142
amplification of F. crookwellense fungal DNA samples with both the OPT and FPG
primer sets. It is possible that this F. pseudograminearum isolate could have been
misidentified and actually was F. crookwellense and subsequently amplified with the
OPT primer set.
Preliminary evaluations from our research with 24 DNA extractions from single
stems from the survey with natural inoculum field levels showed a significant correlation
between crown rot severity ratings and DNA concentration (r2 = 0.61; p<0.0001).
However, in the larger experiment involving 50 fields (150 DNA extractions), samples
were pooled from each survey sample similar in methodology to Hogg et al. (2007), and
there were not correlations between crown rot severity ratings and DNA concentrations.
Pooling the samples may have introduced variation and reduced overall DNA
concentrations to the point where disease severity rating could not be accurately
correlated to DNA concentrations.
The reason for this lack of correlation between crown rot severity scores and
DNA concentration could have occurred for a number of reasons. First of all, there has
been no report of a correlation between crown rot severity score and DNA concentration
in naturally infected field samples. The only correlations between these parameters have
been with inoculated experiments in the greenhouse and field (Strausbaugh et al. 2005;
Hogg et al. 2007). One reason could be the lack of inoculation pressure in naturally
occurring inoculum in fields. Hogg et al. (2010) showed DNA concentration in naturally
occurring fields to be substantially less (0.4%) than that of inoculated field plots.
Secondly, the crown rot score seems to be normally distributed and linear
between fungal occurrence and symptoms, whereas DNA concentrations are more

143
logarithmic in nature (Liddell et al. 1986; Nicholson et al. 1998). For example a rating of
6.0 could have 100 times more DNA than that at 5.5, whereas a rating of 3.0 may have
100 times more DNA than a rating of 1.0. Also with the pooling of symptomatic stems
as was conducted by Hogg et al. (2007), there is greater likelihood that a single stem with
high DNA concentration could exist that would disrupt the linear relationship between
symptoms and DNA concentrations. Results show that inoculation may create more of a
linear relationship between symptoms and DNA concentration (Strausbaugh et al. 2005;
Hogg et al. 2007; Hogg et al. 2010).
This research demonstrated the ability to detect naturally occurring levels of
Fusarium species in the field using species-specific primers in a Q-PCR assay. At the
current stage of crown rot diagnostics research it may be more sensible, economical, and
efficient to use conventional PCR to diagnose diseased stems to identify causal species.
Other applications could potentially be explored for the use of Q-PCR as a tool for
quantifying disease. Currently QTL identification relies on tedious rating systems to
appropriately find chromosomal locations of disease resistance. If Q-PCR were validated
as an accurate tool to relate visual disease severity ratings, especially under inoculated
conditions, there may be an application of the technology for QTL identification.
Currently the literature supports the ability to correlate disease ratings and DNA
concentrations. This research should be explored with various isolates from the PNW
Fusarium survey.
If further research were to be conducted for the use of Q-PCR as a diagnostic tool,
it would have the most efficient application in accurately quantifying DNA
concentrations in relation to visual disease ratings. If this research were pursued, there is
144
a need to evaluate the tri-5 „TaqMan‟ primer set on naturally inoculated survey samples
used by Strausbaugh et al. (2005) and Hogg et al. (2007). Further research also needs to
be conducted to evaluate the effectiveness of correlating the extraction of DNA from
single stems to crown rot severity ratings using a pooling of stems within survey samples
over two consecutive years. Further research comparing natural and inoculated field
conditions may shed more light on the relationship between inoculum levels, disease
development, and DNA concentrations from Q-PCR quantification with species-specific
primer sets. Others have shown that cultural factors (nitrogen levels and planting dates)
as well as water availability at the time of disease colonization during grain filling affect
the rate of disease development (Papendick and Cook, 1974). It would be of interest to
investigate cultural effects on the quantity of DNA under natural versus artificial
inoculation to better explain the role of environmental conditions in plant stress and
disease development.

145
LITERATURE CITED
Backhouse, D. and Burgess, L.W. 2002. Climatic analysis of the distribution of
Fusarium graminearum, F. pseudograminearum and F. culmorum on cereals in
Australia. Australas. Plant Path. 31:321-327.
Burgess, L.W., Wearing, A.H., and Toussoun, T.A. 1975. Surveys of Fusaria associated
with crown rot of wheat in eastern Australia. Aust. J. Agric. Res. 26:791- 799.
Burgess, L.W., Backhouse, D., Summerell, B.A., and Swan, L.J. 2001. Chapter 20 –
Crown rot of wheat: in Fusarium – Paul E. Nelson Memorial Symposium. Edited
by Summerell, B.A., Leslie, J.F., Backhouse, D., Bryden, W.L., Burgess, L.W.
American Phytopathological Society Press, St. Paul, MN.
Chakraborty, S., C.J. Liu, V. Mitter, J.B. Scott, O.A. Akinsanmi, S. Ali, R. Dill-Macky,
J. Nicol, D. Backhouse, and S. Simpfendorfer. 2006. Pathogen population
structure and epidemiology are keys to wheat crown rot and Fusarium head blight
management. Australas. Plant Path. 35:643-655.
Cook, R.J. 1968. Fusarium root and foot rot of cereals in the Pacific Northwest.
Phytopathology 58:127-131.
Cook, R.J. 1992. Wheat root health management and environmental concerns.
Can. J. Plant Pathol. 14:76-85.
Cook, R. J., and Veseth, R. J. 1991. Wheat Health Management. American
Phytopathological Society Press, St. Paul, MN.
Dodman, R.L., and Wildermuth, G.B. 1987. Inoculation methods for assessing
resistance in wheat to crown rot caused by Fusarium graminearum Group 1. Aust.
J. Agric. Res. 38: 473-486.

146
Hekimhan, H., Ahmet B.S., Nicol, J.M., Arisoy, R.Z., Taner, S., and Sahin, M. 2004.
Dryland root rot: a major threat to winter cereal production under sub-optimal
growing conditions. Crop Science Congress, Brisbane Australia: 26 Sept. to 1
Oct. 2004. p. 1232-1336.
Hogg, A. C., Johnston, R.H, and Dyer A.T. 2007. Applying real-time quantitative PCR
to Fusarium crown rot of wheat. Plant Dis. 91:1021-1028.
Hogg, A.C., Johnston, R.H., Johnston, J.A., Klouser, L., Kephart, K.D., and Dyer, A.T.
2010. Monitoring Fusarium crown rot populations in spring wheat residues using
quantitative real-time polymerase chain reaction. Phytopathology 100:49-57.
Kane, R.T., Smiley, R.W., and Sorrells M.E. 1987. Relative pathogenicity of selected
Fusarium species and Microdochium bolleyi to winter wheat in New York. Plant
Dis. 71:177-181.
Klein, T.A., Burgess, L.W, and Ellison, F.W. 1991. The incidence and spatial patterns
of wheat plants infected by Fusarium graminearum Group 1 and the effect of
crown rot on yield. Aust. J. Agric. Res. 42:399-407.
Kohl, J., de Hass, B.H., Kastelein, K., Burgers, S.L., and Waalwijk, C. 2007. Population
dynamics of Fusarium spp. and Microdochium nivale in crops and crop residues
of winter wheat. Phytopathology 97:971-978.
Leisova, L., Kucera, L., Chrpova, J., Sykorova, S., Sip, V., and Ovesna, J. 2006.
Quantification of Fusarium culmorum in wheat and barley tissues using real-time
PCR in comparison with DON content. J. of Phytopathology 154:603-611.
Lesley, J.F., Summerell, B.A., Bullock, S. 2006. The Fusarium laboratory manual.
Blackwell pub. Ames, Iowa. p. 1-388.

147
Mitter, V., Zhang, M.C., Liu, C.J., Ghosh, R., Ghosh, M., and Chakraborty, S. 2006. A
high-throughput greenhouse bioassay to detect crown rot resistance in wheat
germplasm. Plant Path. 55:433-441.
Nelson, P.E., Toussou, T.A., and Cook, R.J. 1981. Fusarium: Diseases, Biology and
Taxonomy. The Pennsylvania State University Press, University Park, PA.
Nicol, J.M, Rivoal, R., Trethowan, R.M., van Ginkel, M., Meroum, M., and Singh, R.P.
2001. CIMMYT‟s approach to identify and use resistance to nematodes and soil-
borne fungi, in developing superior wheat germplasm. In: 'Wheat in a Global
Environment'. Ed. Z. Bedo and L. Lang, Proceedings of the 6th International
Wheat Conference, 5-9 June 2000, Budapest, Hungary. Kluwer Academic
Publishers, Netherlands. pg. 381-389.
Nicol, J.M., Bolat, N., Bagci, A., Trethowan, R.T., William, M., Hekimhan, H., Yildirim,
A.F., Sahin, E., Elekcioglu, H., Toktay, H., Tunali, B., Hede, A., Taner, S., Braun,
H.J., van Ginkel, M., Keser, M., Arisoy, Z., Yorgancilar, A., Tulek, A., Erdurmus,
D., Buyuk, O., and Aydogdu, M. 2006. The international breeding strategy for
the incorporation of resistance in bread wheat against the soil-borne pathogens
(dryalnd root rot and cyst and lesion cereal nematodes) using conventional and
molecular tools. 7th
International Wheat Congress, Mar del Plata, Argentina,
November 2006.
Nicholson, P., Lees, A.K., Maurin, N., Parry, D.W., and Rezanoo, H.N. 1996.
Development of PCR assays to identify and quantify Microdochium nivale var.
nivale and Microdochium nivale var. majus in wheat. Phys. and Mol. Plant Path.
48:257-271.

148
Nicholson, P., Simpson, D.R., Weston, G., Rezanoor, H.N., Lees, A.K., Parry, D.W., and
Joyce, D. 1998. Detection and quantification of Fusarium culmorum and
Fusarium graminearum in cereals using PCR assays. Physiol. and
Mol. Plant Path. 53:17-38.
Nirenberg, H.I. 1976. Untersuchungen über die morphologische und biologische
Differenzierung in der Fusarium Sektion Liseola. Mitteilungen aus der
Biologischen Bundesanstalt Für Land- und Forstwirtschaft (Berlin – Dahlem)
169:1-117.
Okubara, P.A., Schroeder, K.L., and Paulitz, T.C. 2005. Real-time polymerase chain
reaction: applications to studies on soil-borne pathogens. Can. J. Plant Path.
27:300-3133.
Paulitz, T.C., Smiley, R.W., and Cook, R.J. 2002. Insights into the prevalence and
management of soil-borne cereal pathogens under direct seeding in the Pacific
Northwest, U.S.A. Can. J. Plant Path. 24:416-428.
Purss, G.S. 1970. Resistance to common root rot (Cochliobolus sativus) in wheat in
Queensland. Aust. J. of Exp. Agric. and Anim. Husb. 10:497-501.
Schilling, A.G., Moller, E.M., and Geiger, H.H. 1996. Polymerase chain reaction-based
assays for species-specific detection of Fusarium culmorum, F. graminearum, and
F. avenaceum. Phytopathology 86:515-522.
Schroeder, K.L., Okubara, P.A., Tambong, J.T., Lévesque, C.A., and Paulitz, T.C. 2006.
Identification and quantification of pathogenic Pythium spp. from soils in eastern
Washington using real-time polymerase chain reaction. Phytopathology 96:637-
647.
149
Sitton, J.W. and Cook, R.J. 1981. Comparative morphology and survival of
chlamydospores of Fusarium roseum „Culmorum‟ and „Graminearum‟.
Phytopathology 71:85-90.
Smiley, R.W., Gourlie, J. A., Easley, S. A., Patterson, L.-M., and Whittaker, R.G.
2005a. Crop damage estimates for crown rot of wheat and barley in the Pacific
Northwest. Plant Dis. 89:595-604.
Smiley, R.W., Gourlie, J. A., Easley, S. A., Patterson, L.-M., and Whittaker, R.G.
2005b. Pathogenicity of fungi associated with the wheat crown complex in
Oregon and Washington. Plant Dis. 89:949-957.
Strausbaugh, C.A., Bradley, C.A., Koehn, A.C., and Forster, R.L. 2004. Survey of root
disease of wheat and barley in southeastern Idaho. Can. J. Plant Pathol. 26:167-
176.
Strausbaugh, C.A., Overturf, K., and Koehn, A.C. 2005. Pathogenicity and real-time
PCR detection of Fusarium spp. in wheat and barley roots. Can. J. Plant Pathol.
27:430-438.
Waalwijk, C., van der Heide, R., de Vries, I., van der Lee, T., Shoen, C., Costrel de
Coraineville, G., Haeuser Hahn, I., Kastelein, P., Kohl, J., Lonnet, P., Demarquet,
T., and Kema, G.H. 2004. Quantitative detection of Fusarium species in wheat
using TaqMan. Eur. J. Plant Pathol. 110:481-494.
Wildermuth, G.B., and McNamara, R.B. 1994. Testing wheat seedlings for resistance to
crown rot caused by Fusarium graminearum Group 1. Plant Dis. 78:949-953.

150
Williams, K.J., Dennis, J.I., Smyl, C., and Wallwork, H. 2002. The application of
species-specific assays based on the polymerase chain reaction to analyze
Fusarium crown rot of durum wheat. Australas. Plant Path. 31:119-127.

151
CHAPTER 4

152
CHAPTER 4
EVALUATION OF INOCULATION METHODS TO ASSAY SPRING WHEAT
FOR RESISTANCE TO FUSARIUM CROWN ROT IN A CONTROLLED
GROWTH ENVIRONMENT
Poole, G.1, Ozdemir, F.
2, Nicol, J.
3, Erginbas, G.
3, Murray, T
1., Smiley, R.
4, Campbell,
K.5, and Paulitz, T.
5.
1Washington State University, Dept. of Plant Pathology Pullman,
WA, 99164 USA; E-mail: [email protected]; FAX: 509-335-9581; 2
Bahri Dagdas
International Agricultural Research Institute, Konya, Turkey; 3CIMMYT (International
Maize and Wheat Improvement Centre) P.O. Box. 39 Emek 06511 Ankara, Turkey;
4Oregon State University, Pendleton, OR. 97331;
5 USDA-Agricultural Research Service,
Pullman, WA.
ABSTRACT
Crown rot is major biotic constraint on rain fed wheat production systems throughout the
world and in the Pacific Northwest (PNW) region of the U.S. Caused by a complex of
Fusarium species, of which F. pseudograminearum and F. culmorum are the most
important, crown rot reduces wheat yields by an average of 9% in the PNW. Adequate
Fusarium screening systems must be established to appropriately phenotype mapping
populations for accurate QTL identification. The objective of this research was to find an
inoculation method with the greatest consistency and least variation. Two Fusarium
pseudograminearum isolates from the PNW were used in a study to evaluate the effect of
inoculation method on the performance of four spring wheat cultivars varying in

153
susceptibility to Fusarium crown rot. Three different rating systems were compared and
variance was estimated for each method of inoculation. Methods of inoculation were;
growing Fusarium on millet seed and placing near the germinated seedling; soaking
germinated seedlings in a liquid conidial suspension (106 conidia per ml) reported as
„Nicol method‟; placing a 10 μl droplet of a liquid conidial suspension (106 conidia per
ml) in water or methylcellulose on the stem base (10 days post-germination) reported as
the „Mitter method‟; and placing an agar-based slurry containing conidia (106 conidia per
ml) in short 4-cm drinking straws at the base of the stem (10 days post germination).
Rating systems were; Nicol rating (0 to 10 scale: 10=dead); Rating of four leaf sheaths on
a 0 to 4 scale (4=dead) and adding up ratings of the three outside leaves); and Mitter
index, which was a crown rot index calculated by taking the (seedling height / disease
lesion length) x the number of leaf sheaths with symptoms. The inoculation method that
resulted in the most consistent difference between resistant („2-49‟) and susceptible
(„Seri‟) cultivars and least amount of variation were the millet and conidial slurry. Of
these, the colonized millet seed method gave the most reliable phenotype ratings and was
used to screen two mapping populations from Sunco/Macon and Sunco/Otis crosses.
The Nicol rating of 0 to 10 yielded the most conclusive results with the least amount of
variation and can be most easily applied to a high-throughput QTL mapping study. The
millet seed inoculation utilizing the Nicol rating on a scale from 0 to 10 was used to
screen mapping populations for identification of crown rot resistance QTL.
INTRODUCTION
Fusarium crown rot (F. pseudograminearum (O‟Donnell & Aoki) (= F.
graminearum group I, = Gibberella coronicola) and F. culmorum (Wm. G. Sm.) Sacc.) is

154
one of the most detrimental soil-borne diseases of dry land wheat in the PNW (Cook,
1992; Smiley and Patterson, 1996; Smiley et al. 2005a). Cook (2001) estimated that soil-
borne root diseases cost the U.S. about 10 million tons in wheat production annually. F.
pseudograminearum and F. culmorum have been documented as the dominant species
causing crown rot in wheat in the PNW (Cook, 1968; Smiley and Patterson, 1996; Smiley
et al. 2005b; Strausbaugh et al. 2004).
In an economic analysis conducted in 1994 from 13 fields evaluated for the
impact of crown rot, yield loss was estimated to represent 97 million kg (3.5 million bu.)
in production at a value of $13 million for the PNW region of the USA (Smiley et al.
2005). Yield from crown rot has been documented to range from 9% to 89%, with
average of 9% in the PNW, and world-wide losses exceeding 30% (Cook, 1992; Kane,
1987; Burgess et al. 2001; Dodman and Wildermuth, 1987; Klein et al. 1991; Hekimham
et al., 2004). Smiley et al. (2005) documented yield loss in the PNW as high as 61%
resulting following artificial inoculation with F. pseudograminearum. Yield loss
estimates for bread wheat from surveys in Turkey have ranged from 24% to 42% from
natural field infections (Hekimhan et al. 2004; Nicol et al. 2006).
Crown rot is typically associated with wheat production in semi-arid areas where
wheat matures under hot-dry conditions (Burgess et al., 2001). Symptoms and adverse
affects of crown rot are much more pronounced under drought conditions in dry-land
wheat producing regions throughout Australia, Europe, North America, North and South
Africa, and West Asia (Burgess et al. 2001; Smiley et al., 2005a; Nicol et al. 2006). The
disease causes a rotting of the stems, crown, and root tissue and a chocolate brown to

155
reddish brown lesions on the crown roots and the basal portion of stems (Cook and
Veseth, 1991; Paulitz et al. 2002).
Cook (2001) reported that host plant resistance was the most effective and
affordable approach to combating soil-borne diseases such as crown rot. Genetic
resistance to crown rot has been well documented (Purss, 1966; Wildermuth and
McNamara, 1994; Wallwork et al. 2004; Collard et al. 2005; Bovill et al. 2006; Nicol et
al. 2006; Smiley and Yan, 2009). However, Smiley and Yan (2009) reported that while
spring wheat phenotypic tolerance to Fusarium crown rot (caused by F.
pseudograminearum) could be accurately described in inoculated field trials in the PNW,
those for winter wheat could not easily be described due to year and location effects.
Although winter wheat cultivars have been screened for tolerance to crown rot in
naturally infested soils for four decades, due to a high degree of variation in the disease
over years and test sites cultivars exhibiting consistent tolerance have not been identified
(Smiley and Yan, 2009).
Wallwork et al. (2004) reported that screening of plants in field-sown trials often
is complicated by uneven natural infection, contamination by other pathogens, or adverse
environmental conditions. The authors developed an improved method for screening
wheat plants grown in open ended tubes in an outdoor sand-based terrace allowing for the
inoculation of plants in a semi-controlled environment. The outdoor terrace screening
system was used to successfully detect adult wheat plant resistance to F.
pseudograminearum and F. culmorum and a crown rot resistance QTL located on
chromosome 4B.

156
From evaluations of cultivars for crown rot resistance over the years, a
phenomenon of adult and seedling resistance has been documented (Wallwork et al.
2004; Mitter et al. 2006). Wallwork et al. (2004) postulated that the advantage of adult
plant screening systems were that more intermediate levels of genetic resistance could be
reliably detected, whereas seedling screens detected only high levels of resistance.
Wildermuth and McNamara (1994) reported that field screening techniques were time
consuming and laborious and that selections in controlled greenhouse environments were
more efficient for screening large amounts of germplasm efficiently. Mitter et al. (2006)
reported that outdoor screening systems developed by Wallwork et al. (2004) were
difficult to reproduce.
Although adult plant screening systems are useful for detecting moderate levels of
resistance, seedling screens are an attractive alternative because they are not limited by
growing season time-constraints and can be evaluated in a relatively short time (22 days)
(Wildermuth and McNamara, 1994). Evaluation of wheat seedlings in the greenhouse
has been reported (Purss, 1966; Liddell et al. 1986; Wildermuth and McNamara, 1994;
Smiley et al. 2005b; Mitter et al. 2006; Li et al. 2008). Because the main objective of
resistance screening is to discover durable field resistance, there have been extensive
efforts with this research to validate seedling assays in the greenhouse with adult plant
assays in the field (Nicol et al. 2006).
Although Purss (1966) did not report significant confirmations of crown rot
resistance between greenhouse and field trials, later reports indicated significant
correlations (Wildermuth and McNamara, 1994; Mitter et al. 2006). Liddell et al. (1986)
showed that with greenhouse screening systems, sufficient inoculum was needed to cause

157
uniform infection, but excessive amounts of inoculum often skewed results by causing
pre-mature death of wheat plants. Wildermuth and McNamara (1994) showed significant
correlations between relative susceptibility in the field (% diseased tillers of test cultivars
/ % diseased tillers of susceptible „Puseas‟) with seedling disease ratings with an r=0.78
(p<0.01) when plants were inoculated with F. pseudograminearum. Others have
continued seedling evaluations to improve greenhouse screening efficiency and validate
results with field assays.
Mitter et al. (2006) developed a high throughput method for screening a greater
number of seedlings for F. pseudograminearum resistance in the greenhouse. Single
seedlings were grown in square seedling pots, inoculated 13 to 14 days after planting
with F. pseudograminearum, and incubated in nearly saturated relative humidity
conditions for 48 hours at 25 oC. Following the incubation period, the original growing
conditions were restored. Crown rot severity was assessed 35 days after inoculation.
Sixteen cultivars were compared using this technique in the greenhouse followed by in-
field evaluations where the plants were rated at maturity. Field and greenhouse
screenings were highly correlated according to Spearman‟s rank correlation coefficient (rs
= 0.987), proving that the greenhouse screening technique is sufficient to appropriately
screen cultivars for resistance to F. pseudograminearum (Mitter et al., 2006).
Li et al. (2008) conducted the most recent research evaluating a recent inoculation
method to evaluate crown rot resistance. Experiments were conducted in the greenhouse
to evaluate the soaking of seedlings (age 1 to 4 days old) in a conidial suspension varying
in concentration ranging from 5 x 10⁵ to 1 x 10
7 conidia per mL of solution (water +
0.1% tween (v/v)). In addition to these treatments, the duration of inoculation (1 to 10
158
minutes of soaking), incubation period (0, 24, and 48 hours at 100% relative humidity
and darkness), the effect of water stress on crown rot symptom development, and
comparisons to the Mitter et al. (2006) stem droplet method were conducted. Plants were
rated on the basis of a 0 to 5 scale (0=no disease; 5=severe crown rot symptoms). Results
showed no statistical differences in the duration of inoculation and incubation period but
increasing disease development up to a conidial concentration of 1 x 10⁶ conidia per mL.
Overall disease severity was significantly greater than plants inoculated with the stem
droplet method described by Mitter et al. (2006). The authors concluded that the seedling
dip inoculation was a simple reliable method for screening resistant wheat germplasm,
but did note that there was a high mortality among the most susceptible cultivars
evaluated.
Others have used other methods of inoculation utilizing liquid conidial
suspensions with Fusarium spp. and Pseudocercosporella sp. to inoculate wheat plants
(Mitter et al. 2006; de la Peña and Murray, 1994). De la Peña and Murray (1994)
developed an improved method for screening wheat plants for resistance to P.
herpitrichoides by placing 250 µL of a conidial agar slurry in 1.5-cm drinking straws (6-
mm diam.) placed at the base of seedlings to improve the uniformity of contact with the
stem base. Another potential inoculation method done by placing a relatively high
volume (1 mL) of conidial suspension on the soil surface at the base of the seedling stem
had not been previously reported. There remains the need for evaluating other methods
of inoculating seedlings in the greenhouse to reduce variation in results and increase
reproducibility for screening large numbers of genotypes efficiently.
159
Mitter et al. (2006) reported the need for a robust greenhouse screening system
that had reasonable control over the environment and the use of well characterized
pathogen isolates. The authors also stressed the need for standardized inoculation,
incubation, and rating assessment systems to adequately quantify genetic resistance to
crown rot and ability to screen a large amount of germplasm in the greenhouse.
Furthermore they reported that the nature of crown rot resistance is partial and requires
well refined screening systems with the ability to detect small differences in resistance.
The objectives of this series of experiments were to; 1. evaluate the relative
virulence of five PNW isolates collected (Smiley and Patterson, 1996) and characterized
by Smiley et al. (2005b) in the greenhouse on the Australian cultivars „2-49‟ (partially
resistant) and „Seri‟ (susceptible) and PNW cultivars with unknown levels of resistance in
the greenhouse in three replicated experiments; 2. compare the current method of
inoculation using colonized millet outlined by Smiley et al. 2005b with the stem base
droplet method outlined by Mitter et al. (2006), the application of the conidial agar slurry
placed in a 1.5-cm drinking straw at the stem base outlined by de la Peña and Murray
(2004) to F. pseudograminearum isolates, the seedling dip method outlined by Li et al.
(2008) at different conidial concentrations, and the soil-based 1-mL inoculation method
on the aforementioned cultivars using three different rating systems; the sum of three leaf
sheaths rating (0 to 12) outlined by Wildermuth and McNamara (1994), the 0 to 10 rating
system outlined by Nicol et al. (2001), and the crown rot severity index outlined by
Mitter et al. (2006); 3. identify the most reliable F. pseudograminearum isolate,
inoculation method, and rating system for identifying plant resistance QTL in two
recombinant inbred line mapping populations (Sunco/Macon and Sunco/Otis).

160
MATERIALS AND METHODS
A series of greenhouse-growth room assays were conducted to evaluate the
resistance of several spring wheat cultivars with known Fusarium resistance or
susceptibility to assess crown rot resistance in seedlings (Table 1). A total of seven
growth room screening assays (labeled AE-1, AE-2, AE-3, AE-4, AE-5, AE-6, and AE-7
respectively) were conducted at the Plant Growth Facility in Pullman, WA during 2007,
2008, and 2009. The dimensions of the growthrooms and growth chambers for these
experiments were 384 ft3 and 69 ft
3, respectively (Conviron, Winnipeg, Canada).
Seed preparation
Seeds for AE-1 and AE-5 were not surface disinfested or pre-germinated.
For AE-2, AE-3, AE-4, AE-6, and AE-7, seeds of each cultivar were surface disinfested
in 95% EtOH (ethanol) for 6 min, rinsed in de-ionized distilled water for 1 min, then
placed in 0.5% NaOCl for 10 min, followed by six rinses (1 min each) in de-ionized
distilled water. Following surface disinfestation, seeds were placed on moist filter paper
and placed in direct sunlight for germination for 3 days. Following germination seedlings
were placed at 4 º C for 4 to 5 days to obtain consistent germination.
Planting and growth room conditions
For all greenhouse assays seedlings were grown for 52 to 60 days in a growth
chamber at 60/80 (±5)% day/night RH, a 12- hour photoperiod, and temperatures of
25/15 oC day/night temperatures for the duration of the experiment according to Mitter et
al. (2006). Seedlings were planted into a medium comprised of 50% sand and 50% peat
(v/v) (Greensmix Sphagnum Peat Moss, Wuapaca Northwoods llc., Wuapaca, WI) in 3.8-
cm diameter x 20.5-cm long “cone-tainers” (Stuewe and Sons Inc, Corvallis, OR)

161
arranged in plastic trays (7 rows x 14 columns), unless otherwise specified. To more
appropriately mimic field conditions, inoculation methods experiments AE-4, AE-5, AE-
6, and AE-7 utilized a 70:29:1 mix of Thatuna silt loam field soil:sand:peat (Peat source
was Greensmix Sphagnum Peat Moss, Wuapaca Northwoods llc., Wuapaca, WI).
Inoculum preparation
In all greenhouse experiments where millet was used as an inoculum source, with
the exception of AE-5, inoculum preparation was done similar to Smiley et al. (2005b)
using the following method. Inoculum of five respective PNW F. pseudograminearum
isolates (082-03, 006-13, 044-09, 081-11, 032-06) collected and described by Smiley and
Patterson (1996) was prepared on sterilized autoclaved white pearl millet seed (Table 1).
Table 1. Background information for five Fusarium pseudograminearum isolates used in
greenhouse and terrace screening experiments.
Isolate1
Disease index
in greenhouse:
0-7 scale2
Host, site and year of collection3
Host tissue Nearest town County State Year
1. 082-03 5.0 WW crown Waitsburg Walla Walla WA 1993
2. 006-13 6.0+ WW crown Dufur Wasco OR 1994
3. 044-09 5.3 WW crown Moro Sherman OR 1994
4. 081-11 6.3 WW crown Prescott Walla Walla WA 1994
5. 032-06 6.4 WW crown Moro Sherman OR 1994 1 Isolates were collected in a survey conducted by Smiley and Patterson, 1996 and
reported to have significant virulence on wheat according to Smiley et al. 2005b. 2 The disease rating scale was used in Smiley et al. 2005b in the greenhouse on the basis
of 0 to 7; 0 = apparently healthy plant with no discoloration of any tissue; 1 = browning
of scutellar node; 2 = browning of scutellar node and either the sub-crown internode or
leaf sheaths; 4 = dying plant with browning of sub-crown internode, leaf sheaths, and
lower culm; 5 = dying plant with rotted culm base; 6 = dead plant with rotted stem base
(plants had matured to produce more than 3 leaves); and 7 = plant death by rotting of
seed or by pre-emergence damping-off of seedling. Isolates were chosen due to a high
degree and variation in virulence to function in inoculation mixtures for future field and
greenhouse studies to quantify resistance. 3 Explains that isolates were collected from winter wheat (WW) crown tissue and the
respective locations, Counties, States, and years of collection.

162
To prepare inoculum, 200 grams of millet seed was placed into 0.5 or 1-L Mason
jars and autoclaved twice over a 2-day interval at a temperature of 121 oC for 45 minutes
(15 atm. psi.). The five isolates of F. pseudograminearum were grown in 20% potato
dextrose agar (PDA) for 10 days under fluorescent lights set at a 12-hour photoperiod at
26 oC. Eight 1-cm squares were cut from each PDA plate for each PNW F.
pseudograminearum isolate and added to the jars then incubated at 22 oC for 21 days
prior to growth chamber inoculations. Jars containing inoculated millet grain were stored
at 4 oC until use.
To prepare liquid macroconidia inoculum for AE- 4 and AE-5 PNW isolates were
grown on Synthetischer Nährstoffärmer agar (SNA) plates for 10 days at 20-22 ºC under
a combination of cool white and black fluorescent lights with a 12-h photoperiod
(Nirenberg, 1976). Macroconidia were harvested by flooding plates with distilled water,
which were then filtered through several layers of Kimwipes® and the concentration
adjusted to 1 x 10⁶
conidia per mL (Dodman and Wildermuth, 1987; Mitter et al. 2006).
For AE-6 and AE-7 liquid conidial suspensions were made by placing inoculated millet
grain in three layers of cheesecloth within a funnel. The millet was flushed with distilled
water in 50 to 100 mL aliquots. The concentration of macroconidia in subsequent
suspensions was confirmed with a haemocytometer. For AE-4 suspension fluids for the
seedling dipping method and stem droplet method were deionized-distilled water and
methylcellulose (1%), respectively. For AE-5, AE-6, and AE-7 deionized-distilled water
served as the liquid suspension base.
For AE-4, AE-6, and AE-7 an agar conidial slurry was made by mixing an agar
suspension with a distilled water-based conidial suspension. The agar slurry was made

163
by grinding water agar plates containing 1.5% water agar in a blender. The conidial
slurry containing 1 x 10⁶ and 1.6 x 10
6 conidia per mL was made in distilled water. The
water based conidial solution was added to the heated ground slurry of water agar at a
ratio of 50:50 to make a final concentration of 0.5 x 10⁶ or 0.8 x 10
6 conidia per ml in the
agar suspension (Table 3).
Rating systems
Experiments (AE-1 through AE-7) were rated for crown rot severity at 35 days
after inoculation according to three rating systems. The first rating system known as the
„leaf sheath sum‟ was outlined by McNamara and Wildermuth (1994) by taking the
ratings of three leaf stems (LS1, LS2, and LS3) from 0 to 4 (4=dead leaf) and summing
them to make a total leaf sheath summed rating of 0 to 12 (12=dead plant). The second
system utilized a crown rot severity index calculated according to Mitter et al. (2006) in
the following equation: Crown rot severity index = (length of stem
discoloration/seedling height) x (number of leaf sheath layers with necrosis). The third
rating system was devised by Nicol et al. (2001) based on an overall rating of the
seedling base crown region from 0 to 10. The symptom rating system was based on the
following scale; 0=no disease; 1 to 2 = minor symptoms on crown within the first
internode region; 3 to 4 = obvious symptoms on crown within the first internode region; 5
to 6 = pronounced symptoms on crown with obvious darkened plant tissue due to
infection; 8 to 9 = advanced darkened symptoms with severe stunting and near death due
to disease infection; 10 = dead plant with severe disease symptoms) for crown rot
severity.

164
Assay Experiment 1 (AE-1)
The objective of AE-1 was to evaluate 11 cultivars with previously determined
levels of resistance and susceptibility to crown rot under growth room conditions (Table
2). In AE-1 each cone-tainer was inoculated using one of two inoculation methods. The
first method, denoted „Early Inoculation Method‟, was inoculated at the time of planting
by placing the seed into moist planting medium, 2.5-cm of soil over the top, then
inoculum of each of the 5 respective PNW isolates covered by another 2.5-cm of soil.
The second method, denoted by „delayed inoculation method‟ adapted from Wallwork et
al. (2004), was inoculated as outlined in the „Early Inoculation Method‟, but delayed 10
days after seedling emergence. Plants from AE-1 were assessed according to the leaf
sheath sum rating outlined by McNamara and Wildermuth (1994). Plants from the
delayed inoculation method were allowed to mature in the growth chamber and overall
stem ratings were assigned from 0 to 4 (4=dead plant). All methods of inoculation using
the colonized method in all subsequent experiments (AE-2 through AE-7) were made
using the delayed inoculation method adapted from Wallwork et al. (2004).
Assay Experiment 2 (AE-2)
The objective of AE-2 was to evaluate the virulence of the five PNW F.
pseudograminearum isolates on four different cultivars Sunco (PR), Macon (S), 2-49
(PR), and Seri (S) with a greater number of replications (n=17). Six inoculated millet
seeds were placed according to the previously outlined delayed inoculation method
adapted from Smiley et al. (2005b). Plants from AE-2 were rated according to
Wildermuth and McNamara (1994) and Mitter et al. (2006).

165
Table 2. List of cultivars screened in AE-1 for Fusarium crown rot resistance with their
respective market class and relative resistance / susceptibility.
Cultivar1
Market Class2
Resistance/Susceptibility
to Fusarium crown rot3
1. OR942504 Hard white winter Unknown
2. KS93U161 Hard red winter Unknown
3. Sunco Hard white spring Partially Resistant
4. Macon Hard white spring Susceptible
5. Pelsart Hard white spring Partially Resistant
6. Seri Hard white spring Susceptible
7. 2-49 Hard white spring Partially Resistant
8. Gluyas Early Hard white spring Partially Resistant
9. Gala Hard white spring Partially Resistant
10. Baxter Hard white spring Partially Resistant
11. Chinese Spring Hard red spring Unknown 1 Cultivars were chosen on the basis of prior greenhouse screens according to
Widlermuth and McNamara (1994) and R.W. Smiley (personal comm.) for varying
degrees of resistance to crown rot to quantify the ril mapping population parents „Sunco‟
and „Macon‟. 2 The market class of each respective variety was hard white or hard red sping wheat.
3 The degree of resistance was estimated based on previous published results and
preliminary greenhouse experiments from R.W. Smiley and J. Nicol (personal comm.),
Windermuth and McNamara (1994), Wallwork et al. (2004), and Mitter et al. (2006).
Assay Experiment 3 (AE-3)
AE-3 was designed to evaluate consistent performance of the most virulent
isolates from previous AE-1 and AE-2 studies for PNW F. pseudograminearum Isolates
2 (006-13), 4 (081-11), and 5 (032-06). The second objective of AE-3 was to find the
maximum threshold number of replications (n=20). Plants were rated according to
Wildermuth and McNamara (1994) and Mitter et al. (2006).
Assay Experiment 4 (AE-4)
The objective of AE-4 was to evaluate methods of inoculation with F.
pseudograminearum on crown rot symptom development and performance of four
cultivars (Seri (S), 2-49 (PR), Sunco (PR), and Macon (S)) (Table 3). The experiment
was planted on January 8 and harvested March 4, 2008.

166
Table 3. Description of six inoculation methods for AE-4 to evaluate the effects of
inoculation methods on the performance of four cultivars (Seri (S), 2-49 (PR), Sunco
(PR), and Macon (S)) inoculated with two PNW F. pseudograminearum isolates 4 (081-
11) and 5 (032-06) during 2008.
Method of Inoculation1 Description
1. Seedling dip2 Pre-germinated 4-day-old seedlings were placed in a
conidial suspension (concentration = 1 x 10⁶) of
distilled water for one minute then planted.
2. Seedling dip2 Pre-germinated 4-day-old seedlings were placed in a
conidial suspension (concentration = 1 x 10⁶) of 1%
methyl cellulose for one minute then planted.
3. Stem base droplet3 A 10 µL droplet of conidial suspension (concentration
= 1 x 10⁶) of distilled water was placed at the base of
10- day-old seedlings (14 days after emergence).
4. Stem base droplet3 A 10 µL droplet of conidial suspension (concentration
= 1 x 10⁶) of 1% methyl cellulose was placed at the
base of 10-day-old seedlings (14 days after emergence).
5. Colonized millet4 Grain millet (white pearl) was colonized with each
grain respective isolate of F. pseudograminearum.
Approximately 8 to 10 grains were placed at the base of
each seedling 4 days after emergence covered with the
potting mix and water applied.
6. Agar straw conidial An agar conidial solution was made with 50% (1.5%)
suspension5 agar and 50% conidial suspension (concentration 1 to
1.6 x 10⁶). 250 µL of solutions consisting of 5.0 x 10
5
and 8.0 x 10⁵ conidial concentrated agar were placed in
straws positioned at stem bases of 10-day-old seedlings.
1Control treatments complimented each inoculation method and consisted of sterile
distilled water, 1 % sterile MC (methyl cellulose), or agar solution without any conidia
for the seedling dip, stem base droplet, and agar straw treatments, respectively. For the
colonized millet, control treatments consisted of millet not colonized with F.
pseudograminearum. 2 The seedling dip method was adapted from Li et al. (2008).
3 The stem base droplet method was adapted from Mitter et al. (2006).
4 The colonized grain millet method was adapted from Smiley et al. (2005b).
5 The agar straw conidial suspension method was adapted from de la Peña and Murray
(1994).

167
For the stem based droplet treatments, the plastic tube racks were placed on their
side at 10 days following seedling emergence and placed in large storage tubs (76 cm x
91 cm) (Sterilite Co., Townsend, MA). A 10 µL droplet of each respective water-based
and methyl cellulose (MC) based treatment was placed at the base of each stem. Covers
were immediately placed on the tubs and water added to the base of the tubs to ensure
high relative humidity for 48 hours according to Mitter et al. (2006). For the agar straw
inoculation method, plastic drinking straws were cut to a length of approximately 4 to 5
cm with a slit in the side to allow straw removal at seedling harvest. Straws were placed
around germinating seedlings around 1 week after planting. Each method of inoculation
treatment outlined in Table 3 was accompanied by a non-inoculated control treatment
arranged as another isolate treatment. Control grain colonization treatments consisted of
sterilized millet without conidia. Seedling dip and stem based droplet non-inoculated
control treatments were soaked in de-ionized distilled water and sterile methyl cellulose
(1%) without conidia. For the stem base droplet method, control treatments consisted of
placing a droplet of sterile distilled water or sterile methyl cellulose (1%) at the base of
the stem 1 cm from the soil line (Table 3).
Assay Experiment 5 (AE-5)
The objective of AE-5 was to evaluate the effect of inoculating non-germinated
seed with a liquid conidial solution. Treatments consisted of soaking non-germinated
seeds in a conidial suspension of PNW Isolate 4 (081-11) (concentration of 1 x 10⁶) for 1
minute, soaking seeds in sterile distilled water for 1 minute, and non-soaked seeds. AE-5
was rated according to Nicol et al. (2001).

168
Experimental Assay 6 (AE-6)
AE-6 was planted May 5 and harvested June 30, 2009 to confirm the results of
AE-4. Two additional treatments were added including inoculation of non-germinated
grain (similar to that of AE-5) and the application of 1 mL of conidial suspension
(conidial concentration = 1 x 10⁶) to the soil at the base of the seedling (Table 4). The
isolate used for this experiment was PNW Isolate 2 (006-13) selected on the basis of AE-
3 for screening the recombinant inbred line (RIL) mapping populations Sunco / Otis and
Sunco / Macon. The experiment was rated on March 4, 2009 according to Wildermuth
and McNamara (1994), Mitter et al. (2006), and Nicol et al. (2001).
Assay Experiment 7 (AE-7)
AE-7 was planted July 1 and rated September 1, 2009 to investigate additional
conidial concentrations (2.5 x 10⁵ and 5.0 x 10
5) published by Li et al. (2008) for the
seedling dip method (Table 4). This experiment was held at 4 oC in the growth chamber
for 10 days following inoculation to slow plant growth and lengthen the time for
infection. AE-7 was rated at approximately 45 days after inoculation on September 1,
2009 according to the three rating systems previously described (Wildermuth and
McNamara 1994; Mitter et al. 2006; Nicol et al. 2001).

169
Table 4. Treatment methods of inoculation used in Experiment AE-6 and AE-7 to
evaluate six inoculation methods with F. pseudograminearum PNW Isolate 2 (006-13) on
four spring wheat cultivars (Sunco (PR), Otis (S), 2-49 (PR), and Seri (S)).
Method of Inoculation Description
1. Seedling dip1 Pre-germinated 4-day-old seedlings were placed in a
conidial suspension (AE-6 concentration = 1 x 10⁶) of
distilled water for one minute. Low conidial
concentrations were 2.5 x 10⁵ and high conidial
concentrations were 5 x 10⁵ in AE-7.
2. Stem base droplet2 A 10 µL droplet of conidial suspension (concentration
= 1 x 10⁶) of distilled water was placed at the base of 10
after emergence (~14-day-old seedlings).
3. Colonized millet3 Grain millet (white pearl) was colonized with PNW
grain Isolate 2 (006-13) of F. pseudograminearum.
Approximately 8 to 10 grains were placed at the base of
each seedling 4 days after emergence covered with the
potting mix and water applied.
4. Dry seedling dip4 Non-pre germinated seeds were soaked in a conidial
(AE-6 only) suspension (concentration 1 x 10⁶) for 1 minute,
allowed to dry for 30 minutes, and planted.
5. Soil based inoculation 1 mL of conidial suspension (concentration 1 x 10⁶)
was applied to the soil near the stem base
approximately 10 days after emergence (~14-day-old
seedlings).
6. Agar straw conidial An agar conidial solution was made with 50% (1.5%)
suspension5 agar and 50% water-based conidial suspension
(concentration 2 x 10⁶). 250 µL of solutions consisting
of 1.0 x 10⁶ conidial concentrated agar were placed in
straws positioned at stem bases of 10-day-old seedlings.
1 The seedling dip method was adapted from Li et al. (2008). Conidial suspension
concentrations for AE-6 were 1 x 10⁶ while low concentration (2.5 x 10
5) and high
concentration (5 x 10⁵) conidial suspensions were evaluated in AE-7.
2 The stem base droplet method was adapted from Mitter et al. (2006).
3 The colonized grain millet method was adapted from Smiley et al. 2005b.
4 The dry seedling dip method was conducted only on AE-6 and was adapted from Nicol
et al. (2004). 5 The agar straw conidial suspension method was adapted from de la Peña and Murray
(1994).

170
Data Analysis
Experimental units for all assay experiments (AE-1 through AE-7) were the
individual plants grown in cones arranged in a split-plot experimental design. Cultivars
were considered fixed effects because they did not represent a group or continuum of
genotypes as they were specifically selected for their resistance and susceptibility to
crown rot from previous research. Isolates were considered to be fixed effects as they
were selected by R.W. Smiley on the basis of their virulence response.
AE-1 was arranged with isolate as the main plot and cultivar as the sub-plot with
2 replications. AE-2 was arranged with cultivar as the main plot and the isolate as the
sub-plot with 17 replications. AE-3 was arranged with the cultivar as the main plot and
the isolate as the sub-plot, since the isolate effect of PNW Isolates 2 (006-13), 4 (081-11),
and 5 (032-06) was of greatest interest in the assay. AE-3 had 20 replications. AE-4 was
arranged with cultivar as the main plot and factorial subplots of 6 methods x 2 isolates x
2 controls for a total of 24 subplots with 10 replications. AE-5, AE-6, and AE-7 were
arranged with method of inoculation as the main plot and cultivar as the subplot with
four, ten, and seven replications, respectively. The data were analysed using PROC
GLM SAS statistical software (Version 6.12; SAS Institute Inc., Cary NC). Least square
means (lsmeans) were obtained using ANOVA and differences among means were
determined using Fischer‟s least significant difference (LSD).

171
RESULTS
Assay Experiment 1
Significant differences were apparent in the level of crown rot severity between
cultivars (p<0.0001) and PNW F. pseudograminearum isolates (p=0.0001) (Table 5).
Much of the variation within the ANOVA was accounted for by the isolate main-plot
effect. There was a significant isolate by cultivar interaction (p=0.01) (Table 6).
Within the partially resistant cultivars, Isolate 2 (006-13) had the greatest effect
on Sunco, while Isolate 5 (032-06) had the greatest effect on 2-49 (Figure 1). Within the
susceptible cultivars, Isolate 5 (032-06) had the greatest effect on Seri, while Isolate 1
(082-03) had the greatest effect on Macon (Figure 1). Isolates 1 (082-03) and 2 (006-13)
were generally more virulent on Seri, Macon, Pelsart, KS93U161, and OR942504.
Isolate 2 (006-13) resulted in the greatest disease severity on Gala, Sunco, and Chinese
Spring. Isolate 4 (081-11) caused the most disease on Gluyas Early and the least on
OR942504 and Chinese Spring. Isolate 5 (032-06) resulted in the most disease on Seri,
2-49, and Baxter. Isolate 2 (006-13) was rated as causing the most disease across
cultivars (Table 5). The mean crown rot severity score for Sunco was significantly lower
than Macon (Table 5).
The plants from the „late inoculation method‟ were rated at maturity. Crown rot
severity was significant for isolates (p<0.0001) but not for cultivars (p=0.14). The CV
for crown rot severity was 49 for the late inoculation method. Overall crown rot severity
was much lower for the „early inoculation method‟ sub-experiment taken to maturity
(µ=2.0) than for the „delayed inoculation method‟ (µ=4.8), which was used as the
standard for inoculating seedlings with colonized millet rated at the seedling stage.

172
Table 5. Crown rot severity of 11 wheat cultivars in screen AE-1 treated with five PNW
F. pseudograminearum isolates with the „Early inoculation method‟.
Cultivar
Name1
Isolate 12
(082-03)
Isolate 2
(006-13)
Isolate 3
(044-09)
Isolate 4
(081-11)
Isolate 5
(032-06)
Mean3
LSD=1.9
Percent
Infection
of Seri4
1. Seri 8.5 9.5 2.0 9.5 11.0 8.1 a 100%
2. Macon 12.0 8.5 3.0 4.5 4.5 6.5 b 80%
3. Gala 4.0 10.0 1.5 7.5 7.5 6.1 bc 75%
4. Pelsart 7.5 6.0 2.5 5.5 6.0 5.5 bc 68%
5. Baxter 4.0 5.5 0.0 4.0 12.0 5.1 bcd 63%
6. KS93U161 8.5 5.5 2.0 4.5 1.5 4.4 cde 54%
7. Sunco 4.0 7.5 2.5 2.5 4.5 4.2 cde 52%
8. Gluyas Early 4.0 5.0 1.0 7.5 3.0 4.1 de 51%
9. OR942504 5.0 6.0 3.5 2.0 3.0 3.9 de 48%
10. Chinese
Spring 2.5 7.5 1.5 1.0 3.0 3.1 de 38%
11. '2-49' 1.5 4.5 1.0 1.5 5.5 2.8 e 35%
Mean 5.59 6.86 1.86 4.55 5.59 4.89 60% 1 Cultivars were selected from previous studies to evaluate for their degree of resistance
or susceptibility to crown rot (Wildermuth and McNamara, 1994; Mitter et al. 2006).
Chinese spring was included as it is a common check in genetic studies. 2 Isolates were collected during the survey conducted by Smiley and Patterson (1996) and
rated for virulence in Smiley et al. (2005b) where they were assigned the respective
isolate numbers (082-03, 006-13, 044-09, 081-11, and 032-06). 3 Means and Fischers LSD values were calculated with SAS. Numbers followed by the
same letter within a column are not significantly different at P=0.05. 4 Proportions represent an infection percent of Seri, the susceptible check similar to that
of Puseas in Wildermuth and McNamara (1994).
Table 6. The ANOVA results for AE-1, seedling screen of 11 cultivars with 5 PNW F.
pseudograminearum isolates in a split plot experimental design.
Source df1 Mean Square F-Value P-value
2
Main Plot3
Replicate block4 1 0.74 0.19 0.6662
Isolate 4 61.7 6.83 0.0001
Isolate*Replicate block 4 11.7 2.99 0.0358
Sub Plot3
Cultivar 10 22.7 5.79 0.0001
Cultivar*Replicate block 10 10.1 2.57 0.0241
Cultvar*Isolate5 40 9.03 2.30 0.0118
1 df = degrees of freedom (number of samples (n) -1).
2 P-value was considered significant at P=0.05.
3 Experimental design was a split-plot with isolate as the main plot effect and cultivar as
the subplot effect. 4 Replicate block effect was the number of replications (n=2).
5 Cultivar*Isolate designates the cultivar by isolate interaction term (P=0.0118).

173
Figure 1. Crown rot severity of 11 wheat cultivars in screen AE-1 treated with five
PNW F. pseudograminearum isolates rated according to the leaf sheath sum method.
Bars represent Fischers LSD value = 1.9 at P=0.05. PNW Isolate numbers are
represented by the corresponding survey collection code outlined in Table 1 (Smiley and
Patterson, 1996).
Assay Experiment 2
Four cultivars were screened with the five PNW F. pseudograminearum isolates
with 17 replications with significant differences between isolates (p<0.0001) but not
cultivars (p=0.73) for both the leaf sheath sum rating (Figure 2) and crown rot severity
index calculated according to Mitter et al. (2006) (Figure 3). All of the inoculation
treatments had statistically more disease than the untreated checks. Over 95% of the
overall variation was accounted for by the isolate random main effect. The CV was 59.4
for this experiment and within the acceptable range reported by Mitter et al. (2006).
Isolates 2, 4, and 5 caused significantly more disease than isolates 1 and 3. Although
0.0
2.0
4.0
6.0
8.0
10.0
12.0Le
af s
he
ath
su
m (
0-1
2:1
2=s
eve
re d
ise
ase
)
Variety
Isolate 1 (082-03)Isolate 2 (006-13)Isolate 3 (044-09)Isolate 4 (081-11)Isolate 5 (032-06)

174
isolate 1 caused more disease in AE-1, it was not consistent in causing disease in AE-2
(Figure 2). There were consistencies in isolate performance and statistical differences
between the Wildermuth and McNamara (1994) (Figure 2) rating method and that of the
crown rot index calculated according to Mitter et al. (2006) (Figure 3). The CV for the
Mitter crown rot severity index was substantially higher (CV = 153) than that of the leaf
sheath sum calculated according to Wildermuth and McNamara (1994) (CV = 59). The
reason for this was that the Mitter crown rot severity index is a much more specific and
quantitative measure of disease levels than that of the Wildermuth and McNamara rating.
Isolate 2 was consistent in virulence between experiments AE-1 and AE-2.
Figure 2. Crown rot severity rated according to the leaf sheath sum (0 to 12) according
to Wildermuth and McNamara (1994) of five PNW F. pseudograminearum isolates for
four spring wheat cultivars (Seri, 2-49, Sunco, and Macon) evaluated in AE-2 during
September and October 2007 (LSD = 0.81; CV = 59). Bars with the same letter are not
significantly different according to Fischers LSD at P=0.05.

175
Figure 3. Crown rot severity index calculated [(seedling height/disease lesion length) x
total number of leaf sheaths with lesions] according to Mitter et al. (2006) of five PNW
F. pseudograminearum isolates for four spring wheat cultivars (Seri, 2-49, Sunco, and
Macon) evaluated in AE-2 (LSD = 13.3; CV = 153). Bars with the same letter are not
significantly different according to Fischers LSD at P=0.05.
Assay Experiment 3
A seedling screen was conducted to evaluate three PNW F. pseudograminearum
isolates with 20 replications for four spring wheat cultivars (Sunco, Macon, 2-49, and
Seri) with the leaf sheath sum rating documented by Wildermuth and McNamara (1994)
and the crown rot index calculated according to Mitter et al. (2006) (Table 7). With the
leaf sheath sum rating significant differences were realized only in isolates (p<0.0001).
There were significant differences in the crown rot severity index among cultivars
(p=0.04) and isolates (p<0.0001). Sunco and Macon had significantly higher crown rot
severity indices than 2-49, while Seri was not significantly different from either grouping
(data not shown).

176
Table 7. Mean crown rot severity of three PNW F. pseudograminearum isolates
averaged over four wheat cultivars (Sunco, Macon, 2-49, and Seri) for two rating systems
in screen AE-3.
Isolate treatment1 Leaf Sheath Sum (0 to 12)
2 Crown rot severity index
3
Isolate 2 (006-13) 5.5 a1 0.22 a
Isolate 4 (081-11) 5.1 a 0.24 a
Isolate 5 (032-06) 2.9 b 0.11 b
Untreated control 0.0 c 0.00 c
LSD4 1.05 0.06
CV 79 111
1 Isolates were collected during the Smiley and Patterson (1996) field survey and
collection data is outlined in Table 1. 2 A total of 3 leaf sheaths was rated from 0 to 4 and summed for a total of 0 to 12
according to Wildermuth and McNamara (1994). 3 A crown rot severity index was calculated by (length of stem discoloration/seedling
height) x total number of leaf sheaths with lesions according to Mitter et al. (2006). 4 According to the least significant difference numbers within columns followed by the
same letter are not significantly different at P=0.05.
PNW Isolates 2 and 4 were significantly more virulent than Isolate 5 for both
rating systems. The disease level with inoculation was statistically greater than that of
the untreated control. Isolate 2 consistently caused the most disease compared to other
isolates screened across greenhouse assays AE-1, AE-2, and AE-3. Although there were
not any statistical differences between cultivars with the leaf sheath sum rating across
AE-2 and AE-3, Isolate 2 resulted in the most consistent and logical numeric mean
separation between the parents of the RIL mapping population, Sunco and Macon. For
this reason it was chosen to screen the Sunco / Macon ril mapping population.
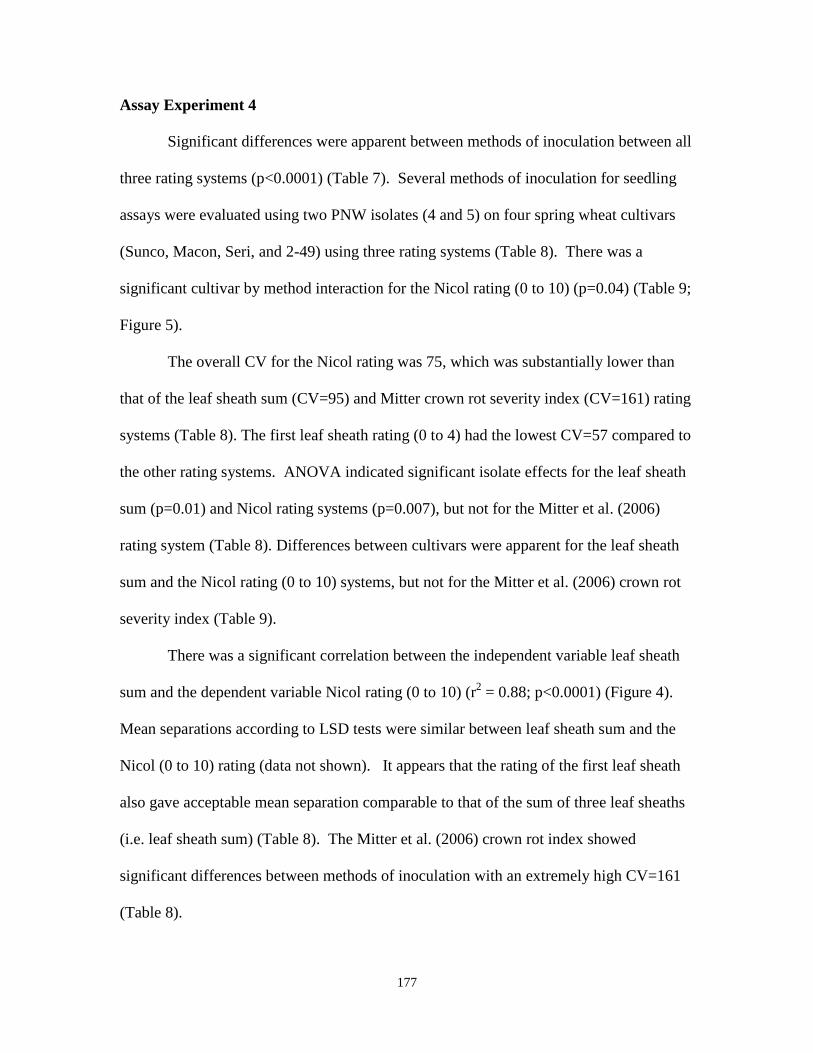
177
Assay Experiment 4
Significant differences were apparent between methods of inoculation between all
three rating systems (p<0.0001) (Table 7). Several methods of inoculation for seedling
assays were evaluated using two PNW isolates (4 and 5) on four spring wheat cultivars
(Sunco, Macon, Seri, and 2-49) using three rating systems (Table 8). There was a
significant cultivar by method interaction for the Nicol rating (0 to 10) (p=0.04) (Table 9;
Figure 5).
The overall CV for the Nicol rating was 75, which was substantially lower than
that of the leaf sheath sum (CV=95) and Mitter crown rot severity index (CV=161) rating
systems (Table 8). The first leaf sheath rating (0 to 4) had the lowest CV=57 compared to
the other rating systems. ANOVA indicated significant isolate effects for the leaf sheath
sum (p=0.01) and Nicol rating systems (p=0.007), but not for the Mitter et al. (2006)
rating system (Table 8). Differences between cultivars were apparent for the leaf sheath
sum and the Nicol rating (0 to 10) systems, but not for the Mitter et al. (2006) crown rot
severity index (Table 9).
There was a significant correlation between the independent variable leaf sheath
sum and the dependent variable Nicol rating (0 to 10) (r2 = 0.88; p<0.0001) (Figure 4).
Mean separations according to LSD tests were similar between leaf sheath sum and the
Nicol (0 to 10) rating (data not shown). It appears that the rating of the first leaf sheath
also gave acceptable mean separation comparable to that of the sum of three leaf sheaths
(i.e. leaf sheath sum) (Table 8). The Mitter et al. (2006) crown rot index showed
significant differences between methods of inoculation with an extremely high CV=161
(Table 8).

178
Figure 4. Linear regression of the leaf sheath sum (0 to 12) rating outlined by
Wildermuth and McNamara (1994) and the Nicol rating (0 to 10) systems (r2 = 0.88;
p<0.0001) averaged across four cultivars and six method of inoculation treatments in the
AE-4 experiment.
y = 0.8895x + 0.7156r² = 0.88
0
1
2
3
4
5
6
7
8
9
0 1 2 3 4 5 6 7 8 9
Nic
ol R
atin
g (0
to
10
; 1
0 =
se
vere
cro
wn
ro
t sy
mp
tom
s)
Leaf sheath sum (0 to 12; 12 = severe crown rot symptoms)

179
Table 8. Summary of methods of inoculation for three rating systems with two PNW F.
pseudograminearum isolates 4 (081-11) and 5 (032-06) evaluated in AE-4.
(0 to 4) (0 to 12)
Method of First Leaf Crown rot
Inoculation leaf sheath1 sheath sum
2 severity index
3
Is. 4 Is. 5 Is. 4 Is. 5
1. Seedling dip5 2.9 a
4 2.8 a 5.3 ab 5.4 ab 0.94 a
Water suspension
2. Seedling dip5 2.6 ab 2.4 abc 6.0 ab 4.4 bc 0.87 a
1% MC suspension
3. Stem droplet6 1.9 cd 0.9 e 3.6 cd 1.5 e 0.15 c
Water suspension
4. Stem droplet6 1.6 cd 0.9 e 2.5 de 1.5 e 0.05 c
1% MC suspension
5. Colonized 0.4 e 2.8 a 0.9 e 6.2 a 0.56 b
Millet grain7
6. Agar straw 2.1 bcd 2.1 bcd 4.9 abc 4.7 abc 0.27 c
8.0 x 10⁵ conc.
8
7. Agar straw 1.5 d ----- 3.3 cd ---- 0.14 c
5.0 x 10⁵ conc.
8
Mean 2.1 1.9 4.3 3.9 0.39
LSD8 (P=0.05) 0.5 0.5 1.7 1.7 0.25
CV9 57 95 161
1 First leaf sheath rating was taken as a subset of the Wildermuth and McNamara (1994)
0 to 4 rating of the first leaf sheath only. 2 Leaf sheath sum rating was conducted by rating the three oldest stems from 0 to 4 and
adding each stem rating to total 0 to 12 according to Wildermuth and McNamara (1994). 3 A crown rot severity index was calculated (length of stem discoloration/seedling height)
x total number of leaf sheaths with lesions according to Mitter et al. (2006). 4
Numbers followed by the same letter within a column are not significantly different at
P=0.05. 5 The seedling dip method was adapted from Li et al. (2008) at a conidial concentration
of 1 x 10⁶ in water and 1% methyl cellulose suspensions, respectively.
6 The stem droplet method was the placement of a 10 µL droplet at the stem base at 10
days after emergence according to Mitter et al. (2006). 7 The colonized grain millet method was conducted according to Smiley et al. (2005b) in
the greenhouse. 8 The agar straw method was done by placing a cut plastic straw at the stem base and
filling it with a 0.75 % agar conidial solution. 9CV = Coefficient of variation calculated by √ (sample variance/mean)*100.

180
Table 9. Mean crown rot severity for four cultivars evaluated in AE-4 over seven
methods of inoculation using three rating systems and the first leaf sheath rating (0 to 4)
of the leaf sheath sum.
First Leaf
Cultivar1 leaf sheath
2 sheath sum
3 Crown rot severity index
4
1. Seri (S) 2.2 a5 4.6 a 0.47 a
2. 2-49 (PR) 1.8 b 3.6 b 0.33 a
3. Sunco (PR) 1.7 b 3.3 b 0.34 a
4. Macon (S) 2.3 a 5.0 a 0.42 a
LSD (P=0.05) 0.29 0.82 0.24 (ns)6
1 Two check varieties 2-49 (PR=partially resistant) and Seri (S=susceptible) and two ril
mapping population parents Sunco (PR) and Macon (MS=moderately susceptible) were
selected on the basis of their varying degrees of susceptibility and partial resistance. 2 First leaf sheath rating was taken as a subset of the Wildermuth and McNamara (1994)
0 to 4 rating of the first leaf sheath only. 3 Leaf sheath sum rating was conducted by rating the three oldest stems from 0 to 4 and
adding each stem rating to total 0 to 12 according to Wildermuth and McNamara (1994). 4 A crown rot severity index was calculated by (length of stem discoloration/seedling
height) x total number of leaf sheaths with lesions according to Mitter et al. (2006). 5Numbers followed by the same letter within a column are not significantly different at
P=0.05. 6 (ns) = not statistically significant at P=0.05.
The seedling dip and colonized millet grain methods of inoculation resulted in the
greatest disease severity for crown rot severity across the three rating systems, with the
exception of the colonized millet grain treatment with Isolate 4 (Table 8). For the leaf
sheath sum rating the seedling dip, colonized millet grain, and agar straw treatments were
not significantly different from each other in crown rot severity. For the Mitter et al.
(2006) crown rot severity index the seedling dip methods of inoculation had significantly
greater severity than all other treatments, followed by the colonized grain treatment. For
181
this rating system the agar straw and stem drop methods of inoculation were not
significantly different from each other in crown rot severity.
For all three rating systems the stem droplet method of Mitter et al. (2006)
resulted in the least amount of disease severity, with the exception of the colonized grain
treatment with Isolate 4 (Table 8). For the first leaf sheath rating the seedling dip and
colonized grain method treatments resulted in the greatest disease severity and were not
significantly different from each other for Isolate 5. For the first leaf sheath and the leaf
sheath sum ratings the agar straw method (8 x 10⁵ conidial concentration) resulted in
significantly greater disease than that of the 5 x 10⁵ conidial concentration. Isolate 4
generally produced a greater amount of disease than Isolate 5, with the exception of the
colonized grain inoculation method (Table 8).
There were statistical differences between cultivars for the leaf sheath sum and
first leaf sheath rating systems, but not for the crown rot severity index (Table 9). There
was a distinct mean separation between partially resistant and susceptible cultivars for the
leaf sheath sum and first leaf sheath rating systems. For the leaf sheath sum rating, the
susceptible check Seri and susceptible RIL mapping population parent Macon were not
statistically different in disease severity. Likewise the partially resistant check 2-49 and
parent Sunco were not statistically different from each other, but were significantly
different from both susceptible checks (Table 9).
There was a significant cultivar by method of inoculation interaction (p=0.04) for
the Nicol rating (0 to 10) system (Figure 5; Table 10). The seedling dip and stem droplet
methods of inoculation resulted in greater disease severity in Seri than 2-49, whereas that
of the colonized millet grain and agar straw treatments produced numerically greater

182
disease severity in 2-49 over Seri for this rating system only (Figure 5). The colonized
millet grain and agar straw treatments produced more disease with Macon compared to
Sunco (Table 10). The CV was the lowest for the seedling dip with a water based
conidial suspension (CV=51), colonized grain millet (CV=61), and agar straw methods (8
x 105 conidial concentration) of inoculation (CV=68). As disease severity decreased
among the inoculation treatments, the CV seemed to increase, especially in the stem
droplet treatments. Data from the colonized grain millet treatment was eliminated from
further analyses for Isolate 4 due to a non-typical low level of disease severity.
Significant differences between cultivars within inoculation treatments were
observed for the seedling dip with water-based conidial suspension (P=0.04) and
marginally with the stem droplet in the 1% methyl cellulose conidial suspension
(P=0.06), rated according to the Nicol rating system (Table 10). With the seedling dip
water based conidial suspension treatment, the partially resistant check 2-49 had
significantly less disease than the susceptible check Seri. However, for the seedling dip
treatment, neither Sunco nor Macon were significantly different from the susceptible
check Seri. There were significant numbers of dead or non-emerged plants for Sunco and
Macon from the seedling dip treatments (data not shown). Although differences between
Sunco and Macon were not statistically significant for the colonized grain millet
treatment, numerical differences were pronounced with Macon showing substantially
more crown rot severity than Sunco (Table 10).

183
Table 10. Summary statistics for crown rot severity of seven methods of inoculation
evaluated with four cultivars rated according to the Nicol rating system (0 to 10) in AE-4.
Variety1
Method of
Inoculation CV2 Sunco (PR) Macon (S) 2-49 (PR) Seri (S)
1. Seedling dip 51 6.16 a3 6.34 a 3.66 b 8.27 a
Water suspension4
2. Seedling dip 76 4.08 3.73 4.44 7.06
1% MC suspension4
3. Stem droplet 131 1.40 2.05 1.84 2.86
Water suspension5
4. Stem droplet 79 1.05 b 1.50 ab 1.38 ab 2.18 a
1% MC suspension5
5. Colonized 61 4.44 7.89 6.00 5.75
Millet grain6
6. Agar straw 68 4.02 4.45 4.16 3.66
8.0 x 10⁵ conc.
7
7. Agar straw 98 2.00 3.35 2.66 2.40
5.0 x 10⁵ conc.
7
1 Two check varieties 2-49 (PR=partially resistant) and Seri (S=susceptible) and two ril
mapping population parents Sunco (PR) and Macon (S) were selected on the basis of
their varying degrees of susceptibility and partial resistance. 2
CV = Coefficient of variation calculated by √(sample variance/mean)*100. 3
Numbers followed by the same letter within a row are not significantly different at
P=0.05. 4 The seedling dip method was adapted from Li et al. (2008) at a conidial concentration
of 1 x 10⁶ in water and 1% methyl cellulose suspensions, respectively and was significant
for cultivars with the water based suspension (LSD = 2.44; P=0.04). 5 The stem droplet method was the placement of a 10 µL droplet at the stem base at 10
days after emergence according to Mitter et al. (2006). The stem droplet treatment with
the 1% methyl cellulose suspension was significant for cultivars (LSD = 0.82; P=0.06). 6 The colonized grain millet method was conducted according to Smiley et al. (2005b) in
the greenhouse method. 7 The agar straw method was done by placing a cut plastic straw at the stem base and
filling it with a 0.75 % agar conidial solution.

184
Figure 5. Response of four spring wheat cultivars to six different methods of inoculation
using the Nicol (0 to 10) rating system. The interaction between cultivars and methods of
inoculation was significant (P=0.04) according to ANOVA.

185
Assay Experiment 5
ANOVA indicated significant differences between seedling soaking
inoculation treatments (p<0.0001) but not for cultivars (Table 11). ANOVA showed that
the inoculation effect accounted for 96% of the total variation. The seedling soaking
method was significantly greater than those of the sterile control treatments as expected.
Although there were not any statistical differences in crown rot severity between
cultivars, Sunco had lower numerical values of crown rot severity than Macon. There
were a high degree of missing non-emerged plants in the Seri and Macon treatments.
Table 11. Crown rot severity of four spring wheat cultivars evaluated with a non-
germinated seedling dipping method in a conidial suspension of 1.0 x 10⁶ conidia per mL
distilled water with F. pseudograminearum PNW Isolate 4 (081-11) in AE-5.
Leaf Sheath Sum1 Nicol rating
2
(0 to 12) (0 to 10)
Cultivar4 (ns)
3 (ns)
3
1. Sunco (PR) 7.0 4.8
2. Macon (S) 9.3 8.3
3. 2-49 (PR) 9.5 7.0
4. Seri (S) 12.0 10.0
CV5 30 38
1 Leaf sheath sum rating was conducted by rating the three oldest stems from 0 to 4 and
adding each stem rating to total 0 to 12 according to Wildermuth and McNamara (1994). 2 The Nicol rating represented a single objective rating of disease severity on the entire
stem from 0 to 10 according to Nicol et al. (2001). 3 (ns) = treatments were not significantly different at P=0.05.
4 Two check varieties 2-49 (PR=partially resistant) and Seri (S=susceptible) and two ril
mapping population parents Sunco (PR) and Macon (MS=moderately susceptible) were
selected on the basis of their varying degrees of susceptibility and partial resistance. 5
CV = Coefficient of variation calculated by √(sample variance/mean)*100.
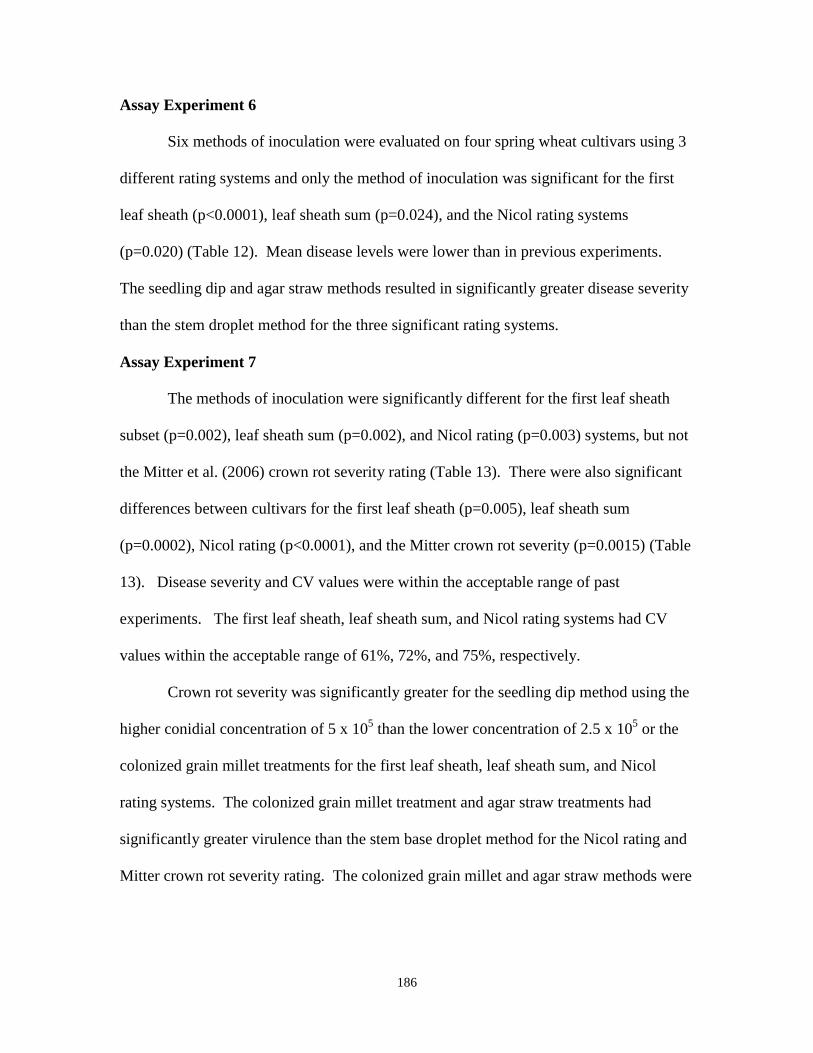
186
Assay Experiment 6
Six methods of inoculation were evaluated on four spring wheat cultivars using 3
different rating systems and only the method of inoculation was significant for the first
leaf sheath (p<0.0001), leaf sheath sum (p=0.024), and the Nicol rating systems
(p=0.020) (Table 12). Mean disease levels were lower than in previous experiments.
The seedling dip and agar straw methods resulted in significantly greater disease severity
than the stem droplet method for the three significant rating systems.
Assay Experiment 7
The methods of inoculation were significantly different for the first leaf sheath
subset (p=0.002), leaf sheath sum (p=0.002), and Nicol rating (p=0.003) systems, but not
the Mitter et al. (2006) crown rot severity rating (Table 13). There were also significant
differences between cultivars for the first leaf sheath (p=0.005), leaf sheath sum
(p=0.0002), Nicol rating (p<0.0001), and the Mitter crown rot severity (p=0.0015) (Table
13). Disease severity and CV values were within the acceptable range of past
experiments. The first leaf sheath, leaf sheath sum, and Nicol rating systems had CV
values within the acceptable range of 61%, 72%, and 75%, respectively.
Crown rot severity was significantly greater for the seedling dip method using the
higher conidial concentration of 5 x 10⁵ than the lower concentration of 2.5 x 10
5 or the
colonized grain millet treatments for the first leaf sheath, leaf sheath sum, and Nicol
rating systems. The colonized grain millet treatment and agar straw treatments had
significantly greater virulence than the stem base droplet method for the Nicol rating and
Mitter crown rot severity rating. The colonized grain millet and agar straw methods were

187
moderate in disease severity and not significantly different from each other for any of the
rating methods (Table 13).
Table 12. Mean crown rot severity for six methods of inoculation used in AE-6
inoculated with F. pseudograminearum PNW Isolate 2 (006-13) on four spring wheat
cultivars (Sunco (PR), Otis (S), 2-49 (PR), and Seri (S)).
(0 to 4) (0 to 12) (0 to 10)
Method of Inoculation1 First Leaf Leaf Sheath Nicol Crown rot
Sheath2 Sum
3 Rating
4 severity rating
5
1. Seedling dip 1.1 a6 2.5 a 1.8 a 0.120 a
2. Stem base droplet 0.3 c 0.6 b 0.3 c 0.009 a
3. Colonized millet 0.4 bc 0.7 b 0.5 bc 0.014 a
grain
4. Dry seedling dip 0.7 abc 1.5 ab 0.9 abc 0.035 a
5. Soil based inoculation 0.7 abc 1.6 ab 1.2 abc 0.100 a
6. Agar straw conidial 0.8 ab 2.2 a 1.4 ab 0.060 a
Suspension
Mean 0.60 0.54 1.03 0.059
LSD7 0.47 1.28 0.96 0.76
1 The seedling dip method was adapted from Li et al. (2008) at a conidial concentration
of 1 x 10⁶ in distilled water. The stem base droplet method was the placement of a 10 µL
droplet at the stem base at 10 days after emergence according to Mitter et al. (2006). The
colonized grain millet method was conducted according to Smiley et al. (2005b) in the
greenhouse. The agar straw method was done by placing a cut plastic straw at the stem
base and filling it with a 0.75 % agar conidial solution of 1 x 10⁶ conidia per mL.
2 First leaf sheath rating was taken as a subset of the Wildermuth and McNamara (1994)
0 to 4 rating of the first leaf sheath only. 3 Leaf sheath sum rating was conducted by rating the three oldest stems from 0 to 4 and
adding each stem rating to total 0 to 12 according to Wildermuth and McNamara (1994). 4 The Nicol rating represented a single objective rating of disease severity on the entire
stem from 0 to 10 according to Nicol et al. (2001). 5 A crown rot severity index was calculated by taking (length of stem
discoloration/seedling height) x total number of leaf sheaths with lesions according to
Mitter et al. (2006). 6 Numbers followed by the same letter within a column are not significantly different at
P=0.05. 7
LSD = Fischers LSD calculated with SAS.

188
Table 13. Mean crown rot severity for six methods of inoculation used in AE-7
inoculated with F. pseudograminearum PNW Isolate 2 (006-13) on four spring wheat
cultivars (Sunco (PR), Otis (S), 2-49 (PR), and Seri (S)).
(0 to 4) (0 to 12) (0 to 10)
Method of Inoculation1 First Leaf Leaf Sheath Nicol Crown rot
Sheath2 Sum
3 Rating
4 severity rating
5
1. Seedling dip 2.4 a 5.9 a 4.6 a 0.07 b
(Conidial conc. 5 x 10⁵)
2. Seedling dip 1.5 c6 3.4 bc 2.7 bcd 0.07 b
(Conidial conc. 2.5 x 10⁵)
3. Stem base droplet 1.2 c 2.6 c 1.8 d 0.07 b
4. Colonized millet 1.8 bc 4.1 bc 3.2 bc 0.24 a
grain
5. Soil based inoculation 1.5 c 2.9 c 2.3 cd 0.10 ab
6. Agar straw conidial 2.1 ab 5.0 ab 3.7 ab 0.19 ab
Suspension
Mean 1.7 3.8 2.9 0.14
LSD7 0.6 1.6 1.3 0.16
1 The seedling dip method was adapted from Li et al. (2008) at two conidial
concentrations of 5 x 10⁵ (treatment 1) and 2.5 x 10
5 (treatment 2) in distilled water. The
stem base droplet method was the placement of a 10 µL droplet at the stem base at 10
days after emergence according to Mitter et al. (2006). The colonized grain millet
method was conducted according to Smiley et al. (2005b) in the greenhouse. The agar
straw method was done by placing a cut plastic straw at the stem base and filling it with a
0.75 % agar conidial solution of 1 x 10⁶ conidia per mL adapted from de la Peña and
Murray (1994). 2 First leaf sheath rating was taken as a subset of the Wildermuth and McNamara (1994)
0 to 4 rating of the first leaf sheath only. 3 Leaf sheath sum rating was conducted by rating the three oldest stems from 0 to 4 and
adding each stem rating to total 0 to 12 according to Wildermuth and McNamara (1994). 4 The Nicol rating represented a single objective rating of disease severity on the entire
stem from 0 to 10 according to Nicol et al. (2001). 5 A crown rot severity index was calculated by (length of stem discoloration/seedling
height) x total number of leaf sheaths with lesions according to Mitter et al. (2006). 6 Numbers followed by the same letter within a column are not significantly different at
P=0.05. 7
LSD = Fischers LSD calculated with SAS.
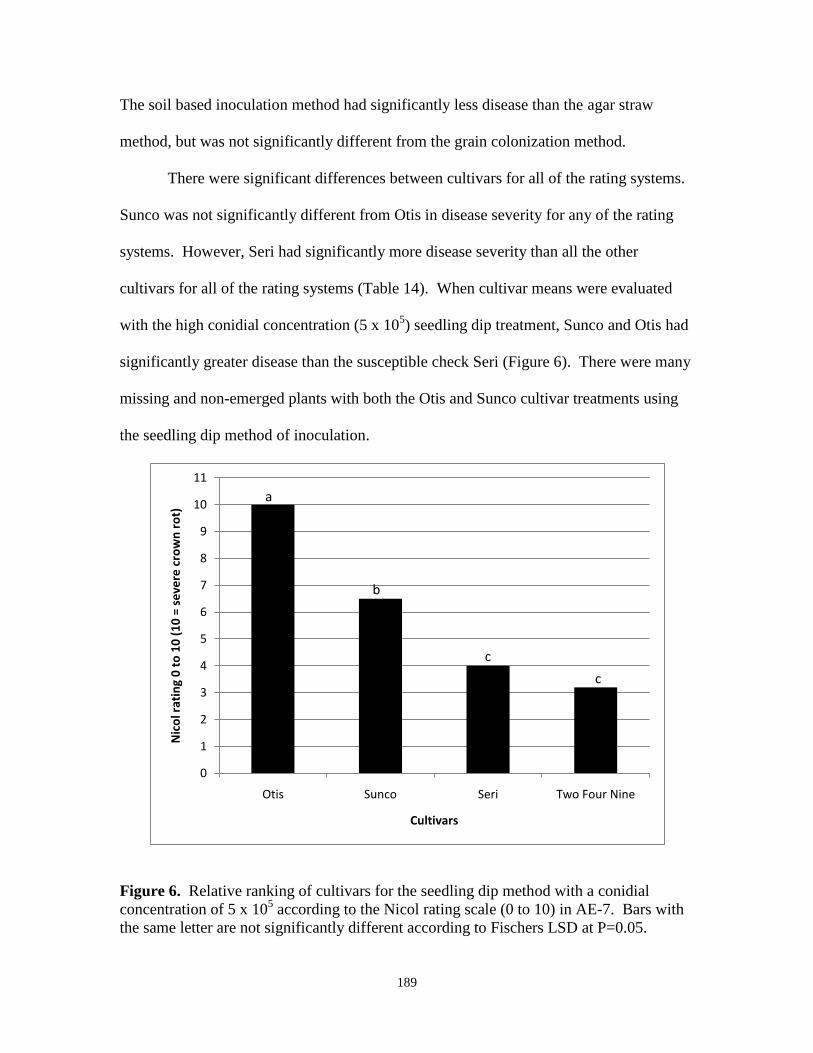
189
The soil based inoculation method had significantly less disease than the agar straw
method, but was not significantly different from the grain colonization method.
There were significant differences between cultivars for all of the rating systems.
Sunco was not significantly different from Otis in disease severity for any of the rating
systems. However, Seri had significantly more disease severity than all the other
cultivars for all of the rating systems (Table 14). When cultivar means were evaluated
with the high conidial concentration (5 x 10⁵) seedling dip treatment, Sunco and Otis had
significantly greater disease than the susceptible check Seri (Figure 6). There were many
missing and non-emerged plants with both the Otis and Sunco cultivar treatments using
the seedling dip method of inoculation.
Figure 6. Relative ranking of cultivars for the seedling dip method with a conidial
concentration of 5 x 10⁵ according to the Nicol rating scale (0 to 10) in AE-7. Bars with
the same letter are not significantly different according to Fischers LSD at P=0.05.
0
1
2
3
4
5
6
7
8
9
10
11
Otis Sunco Seri Two Four Nine
Nic
ol r
atin
g 0
to
10
(1
0 =
se
vere
cro
wn
ro
t)
Cultivars
b
c
c
a

190
Table 14. Mean crown rot severity for four cultivars in AE-7 inoculated with F.
pseudograminearum PNW Isolate 2 (006-13) averaged across six methods of inoculation
treatments.
(0 to 4) (0 to 12) (0 to 10)
First Leaf Leaf Sheath Nicol Crown rot
Cultivar1 Sheath
2 Sum
3 Rating
4 severity rating
5
1. Sunco (PR) 1.5 b6 3.4 b 2.7 b 0.10 b
2. Otis (S) 1.4 b 3.2 b 2.4 b 0.07 b
3. 2-49 (PR) 1.4 b 2.9 b 2.1 b 0.07 b
4. Seri (S) 2.3 a 5.5 a 4.3 a 0.28 a
Mean 1.6 3.7 2.8 0.13
LSD 0.5 1.4 1.2 0.17
1 Two check varieties 2-49 (PR=partially resistant) and Seri (S=susceptible) and two ril
mapping population parents Sunco (PR) and Otis (S) were selected on the basis of their
varying degrees of susceptibility and partial resistance. 2 First leaf sheath rating was taken as a subset of the Wildermuth and McNamara (1994)
0 to 4 rating of the first leaf sheath only. 3 Leaf sheath sum rating was conducted by rating the three oldest stems from 0 to 4 and
adding each stem rating to total 0 to 12 according to Wildermuth and McNamara (1994). 4 The Nicol rating represented a single objective rating of disease severity on the entire
stem from 0 to 10 according to Nicol et al. (2001). 5 A crown rot severity index was calculated by taking (length of stem
discoloration/seedling height) x total number of leaf sheaths with lesions according to
Mitter et al. (2006). 6
Numbers followed by the same letter within a column are not significantly different at
P=0.05 according to Fischers LSD.

191
DISCUSSION
Smiley and Patterson (1996) reported that the dominant species isolated from
PNW wheat fields in association with crown rot symptoms was F. pseudograminearum.
Smiley et al. (2005b) evaluated the relative pathogenicity of F. pseudograminearum
isolates collected in that survey in the greenhouse and field. The authors reported that F.
pseudograminearum isolates were the most pathogenic species in greenhouse screens
compared to the five major species involved in the crown rot infection complex. Smiley
et al. (2005b) also found that there was a high level of variation in pathogenicity of these
isolates and reported that recognition and management of this variation was important for
evaluating resistance or tolerance in wheat.
Results from the current study agree with that of Smiley et al. (2005b). The
degree of disease severity response of 11 cultivars with varying levels of partial
resistance in AE-1, varied significantly. There was a significant variety x cultivar
interaction (P=0.04) indicating that the degree of disease severity caused by F.
pseudograminearum isolates varied among cultivars. However, according to ANOVA
the isolate effect accounted for the greatest amount of variation in AE-1, suggesting that
isolates have a greater effect on variation than cultivars. Across all the cultivars
evaluated in two other greenhouse screens (AE-2 and AE-3), the most pathogenic isolates
were Isolate 2 (006-13), Isolate 4 (081-11), and Isolate 5 (032-06). These results agree
with the degree of pathogenicity of these isolates performed in the greenhouse (Table 1;
Smiley et al. 2005b). Mitter et al. (2006) also described significant isolate x cultivar
interactions where similar cultivars (Sunco, Baxter, and Puseas) were evaluated in
inoculated greenhouse seedling screens conducted in Australia.

192
The ultimate objective of this research was to quanitify the current sources of
resistance, and unknown PNW sources, against Fusarium spp. important to the PNW
region in greenhouse screens for QTL identification. These results report the first relative
response of Australian resistant sources (Sunco and 2-49) to F. pseudograminearum
isolates collected in the PNW in greenhouse evaluations. The relative partial resistance
of Sunco and parital susceptibility of two recombinant inbred line (ril) mapping
population parents Macon and Otis, were quantified with various PNW F.
pseudograminearum isolates. While the leaf sheath sum assessment and the crown rot
severity index showed similar cultivar responses to isolates in mean seperations (Fischers
LSD) in the first three greenhouse screens (AE-1, AE-2, and AE-3), the latter was a much
more quantitative measure of disease severity. Isolate 2 (006-13) caused the most
consistent crown rot severity in three greenhouse screens (AE-1, AE-2, and AE-3)
utilizing a colonized millet grain method of inoculation method developed by Smiley et
al. (2005b) and was used to screen two ril mapping populations to identify resistance
QTL.
Reliable screening systems are required for accurate quantification of resistance
and identification of resistance QTL (Wildermuth and McNamara, 1994; Wallwork et al.
2004; Mitter et al. 2006). Wildermuth and McNamara (1994) suggested that disease
assessments must be accurate as not all rating systems and assessment methods permit
detection of resistant lines/cultivars. Other methods of inoculation have been developed
with different objectives and potential applications with the overall intent to screen a high
number of individuals with the least degree of variation (Wallwork et al. 2004; Mitter et
al. 2006; Li et al. 2008).

193
Three greenhouse experiments (AE-4, AE-6, and AE-7) were performed to
evaluate the effect of five methods of inoculation including the seedling dip (at varying
concentrations), stem droplet (10 µL droplet on the stem base), colonized millet grain,
soil based inoculation, and agar conidial slurry placed in a straw at the stem base from
previous reports (Li et al. 2008; Mitter et al. 2006; Smiley et al. 2005b; de la Peña and
Murray, 1994). These experiments were assessed with three rating assessment systems
that had been previously reported. Results showed that there can be significant variation
introduced by different inoculation methods and rating assessments that can affect the
measured cultivar response.
The cultivar response in crown rot severity in AE-4 was logical for the first leaf
sheath and leaf sheath sum rating systems where the checks 2-49 and Seri were
significantly different from each other. In addition Sunco was significantly different
from Macon but not 2-49. In AE-7 the overall cultivar response was similar in that Seri
had significantly greater disease than all other cultivars, but Sunco was not significantly
different from Otis or 2-49 regardless of the rating system. There was a significant
isolate effect in AE-4, mainly due to decreased pathogenicity of the colonized grain
millet method with Isolate 4 (081-11). It is unknown why Isolate 4 failed to result in
causing disease in AE-4, but could have had to do with inoculum age and lack of viable
conidia.
The seedling dipping method of inoculation described by Li et al. (2008) resulted
in the greatest crown rot severity on wheat seedlings in all three greenhouse screens.
There was not an enhanced effect of adding 1% methyl cellulose to the conidial
suspension for the seedling dip treatment in AE-4. When conidial concentrations were

194
reduced from 1x 10⁶ conidia per ml (AE-4) to 5 x 10
5 conidia per ml (AE-7) with the
seedling dip method, the mean crown rot severity with the leaf sheath sum rating was 6.2
(AE-4 - Isolate 5) and 5.9 (AE-7 - Isolate 2), respectively. However, the cultivar
response was compromised with the seedling dip method. While Seri had significantly
greater crown rot severity than 2-49 at conidial concentrations of 1 x 10⁶ conidia per mL
suspension in AE-4, Sunco and Macon were not significantly different in disease
severity. In AE-7 a similar response resulted at the conidial concentration of 5 x 10⁵
where Sunco and Otis both had greater levels of disease severity than the susceptible
check Seri. At lower conidial concentrations of 2.5 x 10⁵, the cultivar response in disease
severity was not significant (P=0.56, data not shown).
Li et al. (2008) reported a crown rot severity rating of between 2 and 3 with
Sunco based on a 0 to 5 scale using the seedling dip method with a spore suspension
concentration of 5 x 10⁶ conidia per ml. The authors compared the seedling dip method
to the stem drop method described by Mitter et al. (2006) (concentration of 1 x 10⁶
conidia/ml) and found that the stem drop method resulted in much less disease severity
where Sunco was rated <1 and Ballaroi, a susceptible check, was rated <2 on the same 0
to 5 scale.
The seedling dip method treatment in the present study consistently resulted in a
disproportionate number of non-emerged plants in the Sunco treatment. The seedling dip
treatment in all three greenhouse screens resulted in significantly greater disease than the
stem drop method described by Mitter et al. (2006). Evaluation of inoculation methods
showed that while the seedling dipping method of inoculation reported by Li et al. (2008)
was rapid to use in screening greater volumes of plant material and resulted in logical

195
cultivar responses with stronger plant resistance (i.e. 2-49 and Seri), moderate levels of
disease resistance could not be quantified. Wallwork et al. (2004) described Sunco as
carrying a partial level of resistance, less than that of 2-49. Screens AE-1, AE-2 and AE-
3 of the current study showed that Macon and Otis may carry a slight level of resistance
as certain isolates did not cause significant crown rot severity.
A fourth experiment (AE-5) was adapted from the seedling dip method by dipping
non-germinated seedlings in a conidial suspension (suspension concentration = 1 x 10⁶).
This inoculation method has been successfully used by Nicol et al. (2007) for field
evaluation of cultivars. The theory was dipping non-germinated seeds would be less
damaging than dipping pre-germinated seedlings with exposed root radical tissue.
Although there were pronounced numerical differences with this method, treatments were
not statistically different due to a high degree of plant mortality in the Seri and 2-49
treatments.
The colonized millet grain method has been successfully utilized by Smiley et al.
(2005b) in field and greenhouse studies to inoculate plants. In AE-4 the colonized grain
millet method did not statistically differ from the seedling dip method for Isolate 5 (032-
06). In AE-6 the colonized grain millet method did not result in significant disease
severity. In AE-7 the colonized grain millet method resulted in significantly less crown
rot severity than the seedling dip method (conidial concentration = 5 x 10⁵) for two of the
three main rating systems.
The colonized grain millet method resulted in the most reasonable and logical
cultivar response. In AE-7 Seri had significantly greater crown rot severity than Sunco,
Otis, and 2-49, in that order of decreasing severity. Although there was not a statistical

196
difference in cultivar response to the colonized millet grain method in AE-4 with any of
the rating systems, numerical values showed a prominent difference in the mean crown
rot severity between Sunco (4.4) and Macon (7.8) with the Nicol 0 to 10 rating system.
However, with this inoculation method, 2-49 (6.0) had slightly greater numerical crown
rot severity than Seri (5.7), which resulted in the significant cultivar by method
interaction with the Nicol 0 to 10 rating system. The response of the mapping population
parent Otis in crown rot severity seemed to be less with these seedling greenhouse
screens and inoculation methods. QTL mapping for the Sunco/Otis revealed that Otis
exhibited two minor QTL for crown rot resistance in greenhouse, terrace and field
screens (unpublished data).
In the current study the agar straw method adapted from de la Peña and Murray
(1994) resulted in reliable and consistent results in adequate infection and cultivar
response. In all experiments where it was evaluated (AE-4, AE-6, and AE-7) crown rot
severity was not significantly different from that of the seedling dip, with the exception
of the AE-4 Isolate 5 (032-06) treatment with the leaf sheath sum rating system. In AE-7
the agar straw method was not significantly different from the colonized millet grain
method with any of the three rating systems. Although cultivars were not significantly
different within the agar straw inoculation treatment, rankings were logical. The soil-
based inoculation method resulted in crown rot severity ratings that were not significantly
different from the colonized grain millet method in AE-7. The agar straw and soil-based
methods have adequate application for Fusarium crown rot screening as they are reliable
and relatively easy to apply and should be evaluated further as a comparable method to
the colonized millet grain for identifying intermediate or moderate sources of resistance.
197
Three rating assessment systems were reported for use with seedling screens in
the greenhouse in this research. Several methods of assessment exist and have been used
by others including crown rot severity indices (Mitter et al. 2006), discoloration of tiller
bases, numbers of whiteheads (Nicol et al. 2007), yield (Smiley et al. 2005a), number of
healthy seedlings, percent diseased tissue (Wildermuth and McNamara, 1994). For the
purposes of this research the 0 to 10 assessment adapted from Nicol et al. (2001) was the
most efficient rating assessment method in terms of time, ease of use, and repeatability.
The 0 to 10 rating system was highly correlated to the Wildermuth and McNamara (1994)
leaf sheath sum (r2=0.88; P<0.0001) and was able to accurately detect the significant
cultivar by method interaction in AE-4.
The assessment methods of leaf sheath sum described and crown rot index are
very accurate and repeatable, but time consuming and tedious compared to the 0 to 10
rating. The leaf sheath sum rating requires that 3 leaf sheaths be peeled back and
assessed, while the crown rot index requires that plant height, lesion length, and the
number of leaves with lesions be recorded. The 0 to 10 assessment is a simple visual
rating that takes seconds to visualize and assess infected plants. Time and accuracy is
important in genetic studies that require the screening of thousands of lines.
For the purposes of screening moderate to partial resistance in a greenhouse
environment the colonized grain millet and agar straw methods are the most reliable and
preferred. Future research should focus on the refinement of the agar straw conidial
slurry inoculation method on a wider range of cultivars. Future research also needs to be
conducted in the areas of reducing conidial concentrations for non-pre-germinated seed
inoculation to modify AE-5 and the application of the soil-based inoculation method.

198
LITERATURE CITED
Backhouse, D., Abubakar, A.A., Burgess, L.W., Dennis, J.I., Hollaway, G.J.,
Wildermuth, G.B., Wallwork, H., and Henry, F.J. 2004. Survey of Fusarium
species associated with crown rot of wheat and barley in eastern Australia.
Australas. Plant Path. 33:255-261.
Bovill, W.D., Ma, W., Ritter, K., Collard, B.C.Y, Davis, M., Wildermuth, G.B. and
Sutherland, M.W. 2006. Identification of novel QTL for resistance to crown rot
in the doubled haploid wheat population „W21MMT70‟ x „Mendos‟. Plant
Breeding 125:538-543.
Burgess, L.W., Backhouse, D., Summerell, B.A., and Swan, L.J. 2001. Chapter 20 in:
Fusarium – Paul E Nelson Memorial Symposium. Edited by Summerell, B.A.,
Leslie, J.F., Backhouse, D., Bryden, W.L., Burgess, L.W. APS Press, the
American Phytopathological Society, St. Paul, MN.
Collard, B.C.Y., Grams, R.A., Bovill, C.D., Percy, C.D., Jolley, R., Lehmensiek, A.,
Wildermuth, G., and Sutherland, M.W. 2005. Development of molecular
markers for crown rot resistance in wheat: mapping of QTL for seedling
resistance in a „2-49‟ x „Janz‟ population. Plant Breeding 124:532-537.
Cook, R.J. 1992. Wheat root health management and environmental concern.
Can. J. Plant Pathol. 14:76-85.
Cook, R.J. 2001. Management of wheat and barley root diseases in modern farming
systems. Australas. Plant Pathology 30:119-126.
Cook, R. J. and Veseth, R. J. 1991. Wheat Health Management. American
Phytopathological Society, St. Paul, MN.

199
De la Peña, R.C., and Murray, T.D. 1994. Identifying wheat genotypes resistant to
eyespot disease with a B-glucuronidase-transformed strain of
Pseudocercosporella herpitrichoides. Phytopathology 84:972-977.
Dodman, R.L., and Wildermuth, G.B. 1987. Inoculation methods for assessing
resistance in wheat to crown rot caused by Fusarium graminearum Group 1. Aust.
J. Agric. Res. 38: 473-486.
Hekimhan, H., Ahmet B.S., Nicol, J.M., Arisoy, R.Z., Taner, S., and Sahin, M. 2004.
Dryland root rot: a major threat to winter cereal production under sub-optimal
growing conditions. Crop Science Congress, Brisbane Australia: 26 Sept. to 1
Oct. 2004. p. 1232-1336.
Kane, R.T., Smiley, R.W., and Sorrells, M.E. 1987. Relative pathogenicity of selected
Fusarium species and Microdochium bolleyi to winter wheat in New York. Plant
Dis. 71:177-181.
Klein, T.A., Burgess, L.W, and Ellison, F.W. 1991. The incidence and special patterns
of wheat plants infected by Fusarium graminearum Group 1 and the effect
of crown rot on yield. Aust. J. Agric. Res. 42:399-407.
Li, Y., Liu, C., Chakraborty, S., Manners, J., and Kazan, K. 2008. A simple method for
the assessment of crown rot disease severity in wheat seedlings inoculated with
Fusarium pseudograminearum. J. Phytopathology 156:751.
Liddell, C.M., Burgess, L.W., and Taylor, P.W.J. 1986. Reproduction of crown rot of
wheat caused by Fusarium graminearum group 1 in the greenhouse. Plant
Dis. 70:632-635.

200
Liu, B.H. 1998. Statistical Genomics: Linkage, Mapping, and QTL Analysis. CRC
Press, New York, USA. Pgs. 1-83.
Mitter, V., Zhang, M.C., Liu, C.J., Ghosh, R., Ghosh, M., and Chakraborty, S. 2006. A
high-throughput greenhouse bioassay to detect crown rot resistance in wheat
germplasm. Plant Path. 55:433-441.
Nicol, J.M, Rivoal, R., Trethowan, R.M., van Ginkel, M., Meroum, M., and Singh, R.P.
2001. CIMMYT‟s approach to identify and use resistance to nematodes and soil-
borne fungi, in developing superior wheat germplasm. In: 'Wheat in a Global
Environment'. Ed. Z. Bedo and L. Lang, Proceedings of the 6th International
Wheat Conference, 5-9 June 2000, Budapest, Hungary. Kluwer Academic
Publishers, Netherlands. pg. 381-389.
Nicol, J.M., Bolat, N., Bagci, A., Trethowan, R.T., William, M., Hekimhan, H., Yildirim,
A.F., Sahin, E., Elekcioglu, H., Toktay, H., Tunali, B., Hede, A., Taner, S., Braun,
H.J., van Ginkel, M., Keser, M., Arisoy, Z., Yorgancilar, A., Tulek, A., Erdurmus,
D., Buyuk, O., and Aydogdu, M. 2006. The international breeding strategy for
the incorporation of resistance in bread wheat against the soil-borne pathogens
(dryalnd root rot and cyst and lesion cereal nematodes) using conventional and
molecular tools. 7th
International Wheat Congress, Mar del Plata, Argentina,
November 2006. 1-6.
Nirenberg, H.I. 1976. Untersuchungen über die morphologische und biologische
Differenzierung in der Fusarium Sektion Liseola. Mitteilungen aus der
Biologischen Bundesanstalt Für Land- und Forstwirtschaft (Berlin – Dahlem)
169:1-117.
201
Purss, G.S. 1966. Studies on varietal resistance to crown rot of wheat caused by
Fusarium graminearum. Queensland Journal of Agricultural and Animal
Sciences. 23:475.
Smiley, R.W. and Patterson, L.M. 1996. Pathogenic fungi associated with Fusarium foot
rot of winter wheat in the semiarid Pacific Northwest USA. Plant Dis. 80:944-
949.
Smiley, R.W., Gourlie, J. A., Easley, S. A., Patterson, L.-M., and Whittaker, R.G.
2005a. Crop damage estimates for crown rot of wheat and barley in the Pacific
Northwest. Plant Dis. 89:595-604.
Smiley, R.W., Gourlie, J. A., Easley, S. A., Patterson, L.-M., and Whittaker, R.G.
2005b. Pathogenicity of fungi associated with the wheat crown complex in
Oregon and Washington. Plant Dis. 89:949-957.
Smiley, R.W., and Yan, H. 2009. Variability of Fusarium crown rot tolerances among
cultivars of spring and winter wheat. Plant Dis. 93:954-961.
Wallwork, H., Butt, M., Cheong, J. P. E., Williams, K. J. 2004. Resistance to crown rot
in wheat identified through an improved method for screening adult plants.
Australas.. Plant Path. 33:1-7.
Wildermuth, G.B., and McNamara, R.B. 1994. Testing wheat seedlings for resistance to
crown rot caused by Fusarium graminearum Group 1. Plant Dis. 78:949-953.

202
CHAPTER 5

203
CHAPTER 5
IDENTIFYING QUANTITATIVE TRAIT LOCI FOR FUSARIUM CROWN ROT
RESISTANCE (F. PSEUDOGRAMINEARUM) IN THE SPRING WHEAT
CULTIVAR SUNCO
Grant Poole1, Richard W. Smiley
2, Timothy D. Murray
1, Julie M. Nicol
3, Timothy C.
Paulitz4, and
Kimberly Garland-Campbell
4.
1Washington State University, Dept. of Plant
Pathology, Pullman, WA, 99164-6430; E-mail: [email protected]; FAX: 509-335-9581;
2USDA-Agricultural Research Service, Pendleton, OR.;
3CIMMYT (International Maize
and Wheat Improvement Centre) P.O. Box. 39 Emek 06511 Ankara, Turkey. 4
USDA-
Agricultural Research Service, Pullman, WA.
ABSTRACT
Fusarium crown rot (FCR), caused by a complex of Fusarium species, of which
F. pseudograminearum and F. culmorum are the most important, reduces wheat yields in
the Pacific Northwest (PNW) of the U.S. by an average of 9%. Currently there is not any
consistent durable resistant in PNW wheat cultivars and plant host resistance is the most
reliable and efficient means of controlling root diseases on a wide geographic scale. The
advent of DNA-based markers has facilitated the application of marker assisted selection.
Several significant QTL for crown rot resistance have been documented on chromosomes
1A, 1D, 2B, 3B, and 4B from resistant cultivars in Australia. Our objective was to
identify major quantitative trait loci for Fusarium crown rot resistance in the Australian

204
spring wheat cultivar „Sunco‟. Two mapping populations consisting of 151 F5:F6 and 219
F6:F7 recombinant inbred lines (RIL), were derived from crosses between Sunco
(partially resistant) by Otis (susceptible) and Sunco by Macon (susceptible), respectively.
A single PNW F. pseudograminearum isolate (006-13) was used to inoculate trials
conducted in growth chamber, outdoor terrace and field assays during 2008 and 2009.
Stem base crown tissues of seedlings (for the growth chamber assay) or adult plants (the
terrace bed and field assays) were rated for disease severity on a numeric scale from 0-10.
Genotypes of the parents and Sunco/Otis RIL population were evaluated with 354 DArT
(Triticarte®) and 30 microsatellite SSR polymorphic markers. The parents and
Sunco/Macon RIL population were evaluated with 328 DArT and 18 microsatellite SSR
polymorphic markers. A total of five significant QTL were identified on chromosomes
3B, 4B, 4A, and 7A with LOD scores ranging from 3.0 to 14.3. The most significant
QTL was inherited from Sunco and identified on chromosome 3BL across all three
seedling growth chamber assays for the Sunco/ Macon population and one of the two
growth chamber assays for the Sunco/Otis mapping population with maximum LOD
scores of 14.3 and 10.0 explaining 28% and 23% of the variation, respectively for each
population. This QTL covered a 3.8 cM region and was verified in the same
chromosomal location of 3BL with field data for the Sunco/Macon population. SSR
microsatellite markers will be evaluated in this QTL region for potential use in marker
assisted selection for improving Fusarium crown rot resistance in PNW germplasm.

205
INTRODUCTION
Wheat (Triticum aestivum L.) production was approximately 659.3 million tons in
2009, which was second to maize (796.3 tons) and higher than rice (433.5) according to
Foreign Agricultural Service production statistics (USDA-FAS, 2009). Due to its
diversity of uses, protein content, and storage qualities, it is the most common staple food
crop for more than one-third of the world‟s population (Sleper and Poehlman, 2006).
Cook (2001) estimated that soil-borne root diseases cost the U.S. about 10 million tones
in wheat production annually. Crown rot is one of the most detrimental soil-borne
diseases of dryland wheat throughout the world, and in the Pacific Northwest (PNW) of
the United States (Cook, 1992; Burgess et al., 2001; Backhouse et al. 2004; Nicol et al.,
2007). The disease is caused by a complex of species of which F. pseudograminearum
(O‟Donnell & Aoki) (= F. graminearum group I, = Gibberella coronicola) and F.
culmorum (Wm. G. Sm.) Sacc.) are the most significant world wide (Burgess et al. 2001;
Smiley et al. 2005a; Nicol et al. 2007). Yield loss from crown rot have been documented
to be from 9% to 89%, with an accepted average of 9% in the PNW, with world wide
losses exceeding 30% (Cook, 1992; Kane, 1987; Burgess et al. 2001; Dodman and
Wildermuth, 1987; Klein et al. 1991; Hekimham et al., 2004)
Symptoms of crown rot are described by the dark brown discoloration (with an
occasional pink tinge) of the crown region and lower one, two, or sometimes three
internodes (Cook, 1968; Cook and Veseth, 1991). Crown rot is typically associated with
wheat production in semi-arid areas where wheat matures under hot-dry conditions
because the fungus colonizes stressed plants during the grain filling period (Burgess et
al., 2001). Fusarium crown rot pathogens survive in the soil as chlamydospores and thick

206
walled conidial cells in dead organic matter and plant debris infecting plants in the fall or
spring (Cook and Veseth, 1991; Paulitz et al. 2002). Control of the disease has relied on
cultural practices including late planting and moderate nitrogen fertilization to discourage
large vegetative plants that tend to experience more stress during grain filling (Cook and
Veseth, 1991).
Host plant resistance has been documented as being the most efficient and reliable
approach to reducing wheat yield loss due to crown rot (Cook, 2001). Evaluation of
resistance to Fusarium crown rot dates back to the 1960‟s in Australia (McKnight and
Hart, 1966; Purss, 1966). Evaluations of PNW germplasm by Smiley and Yan (2009)
showed there is a high degree of variation in response to Fusarium crown rot over years
and across sites. As a result no cultivars in the PNW have been identified as being
consistently resistant to the disease. Thus there is a need to introgress resistance into
cultivars adapted to the PNW.
Resistance to crown rot has been described as „polygenic‟, or from several
potential resistance genes (Purss, 1970; Burgess et al. 2001; Collard et al. 2005; Bovill et
al. 2006; Ma et al. 2009). Adult and seedling resistance have each been separately
documented (Wallwork et al. 2004; Mitter et al. 2006). It appears that the most resistant
genotypes can be detected in seedling bioassays, but genotypes with adult-plant
resistance (such as that of the Australian cultivar „Sunco‟) cannot be detected in seedling
assays. Adult plant screening systems were reported to be necessary to identify resistant
germplasm and quantitative trait loci (QTL) useful for breeding and to reduce the
potential for significant crown rot resistance to remain undetected in seedling screening
programs (Wallwork et al. 2004). Seedling resistance can be evaluated during the first 45

207
days of the seedling phase of growth. Adult plant resistance is documented by evaluating
mature plants for crown rot symptoms and damage. Wallwork et al. (2004) described an
outdoor terrace system and supplemental irrigation to facilitate the inoculation of plants
with Fusarium spp. and subsequent plant growth and disease development. This system
can be utilized in a breeding program to effectively screen for adult plant resistance.
Because crown rot is difficult to evaluate and subject to environmental variability,
the use of genetic markers as indirect selection tools will facilitate breeding efforts.
Genetic markers flanking QTL that are associated with resistance have been identified in
four genetic studies (Wallwork et al. 2004; Collard et al. 2005; Bovill et al. 2006; Ma et
al. 2009). Wallwork et al. (2004) used the outdoor terrace screening system and reported
the first QTL for crown rot resistance in wheat on chromosome 4B near the dwarfing
gene Rht-B1 (within 20 cM) in a population generated from a cross between „Kukri‟ and
„Janz‟. Kukri was the resistant parent. Collard et al. (2005) confirmed this QTL on 4B,
19.8 cM from the Rht-B1 gene using a seedling assay similar to that developed by
Wildermuth and McNamara (1994).
Collard et al. (2005) evaluated a doubled haploid population derived from a cross
between „2-49‟ (partially resistant) and „Janz‟ (susceptible) using a growth chamber assay
in which seedlings were rated (Wildermuth and McNamara, 1994). The largest QTL
were located on chromosomes 1D and 1A, with LOD scores of 7.5 and 3.2 explaining
21% and 9% of the variation, respectively. These resistance alleles were inherited from
2-49, but additional alleles were discovered on chromosome 2B that were inherited from
the susceptible parent „Janz‟. Bovill et al. (2006) also utilized a seedling assay similar to
that of Collard et al. (2005) to evaluate a doubled haploid population derived from a cross
208
between parental lines „W21MMT70‟ (partially resistant) x „Mendos‟ (moderately
susceptible). Three putative QTL were identified and located on chromosomes 2B, 2D,
and 5D with LOD scores of 5.6, 2.2, and 9.4, respectively, but were not significant for all
three seedling screening assays. The authors postulated that the resistance locus on 2BS
was possibly from an introgression from T. timopheevii. This introgression has been
documented in „Sunco‟ (Kammholz et al. 2001).
Ma et al. (2009) reported QTL for resistance to Fusarium crown rot using a
seedling dip inoculation method followed by a seedling assay for both F.
pseudograminearum and F. graminearum resistance as outlined in Li et al. (2008). Two
significant QTL were identified in a RIL population derived from CSCR6
(resistant)/Lang (susceptible), on chromosomes 3BL and 4B.. Both resistant alleles were
derived from CSCR6. The QTL on 3BL had a combined LOD score of 11.1, explaining
41.6% of the variation in the data, and was named „Qcrs.cpi-3B‟. The flanking DArT
markers for the major QTL on chromosome 3BL were wPt10505 and wPt2277. The
authors postulated that crown rot resistance was not species-specific as both Fusarium
graminearum and F. pseudograminearum isolates returned similar QTL with the same
chromosomal location (3BL).
Sunco is an additional source of partial resistance that also possesses useful
properties to introgress into PNW breeding programs. Currently there is not any
information on the genetic location of the resistance in the partially resistant cultivar
Sunco. Identification of QTL would allow for the potential use of marker assisted
selection (MAS) for applications of gene pyramiding and rapid backcrossing of crown rot
resistance genes into locally adapted PNW wheat cultivars. The objective of this research

209
were to identify QTL in the cultivar Sunco using two recombinant inbred line populations
derived from Sunco by PNW cultivars.
MATERIALS AND METHODS
Plant materials
Two recombinant inbred line (RIL) mapping populations were developed between
2006 and 2008 in greenhouses at the Plant Growth Facility at Washington State
University, Pullman, WA. Two hundred and nineteen F6:F7 recombinant inbred lines
were generated from the Sunco/Macon cross. One hundred and fifty-one F5:F6
recombinant inbred lines were generated from a cross between the Sunco/Otis cross.
Sunco is a hard white spring bread wheat (Triticum aestivum L.) released from Australia
in 1986 with partial resistance to stem and leaf rust and carries partial resistance to
Fusarium crown rot (Woolston, 2000; Wheat pedigree and identified alleles of genes on-
line, 2006, http://genbank.vurv.cz/wheat/pedigree/krizeni2.asp?id=48411). Otis is a
Pacific Northwest hard white spring bread wheat cultivar released in 2005 and known for
its adaptation to arid and intermediate rainfall zones, high yield potential, and high
temperature adult plant resistance to local races of stripe rust, partial resistance to Hessian
fly, and dual purpose end use quality for noodle and bread making (Kidwell et al. 2006).
Macon is a Pacific Northwest hard white spring wheat released in 2002 and adapted to
intermediate to high rainfall non-irrigated growing conditions known for its Hessian fly
resistance and bread and noodle making qualities (Kidwell et al. 2003).
Phenotypic screening
A single Fusarium pseudograminearum isolate (006-13) collected near Durfur,
Wasco County, Oregon by Smiley and Patterson (1996) and documented in field

210
screening assays according to Smiley and Yan (2009) was used for screening both RIL
mapping populations in this study. This single isolate was used to screen both the
Sunco/Macon RIL population and the Sunco/Otis RIL population in seedling growth
chamber assays (similar to Wildermuth and McNamara, 1994 and Mitter et al. 2006), an
outdoor terrace screening method similar to that of Wallwork et al. (2004), and
inoculated field trials in North Central Washington.
The procedure for inoculum preparation for the seedling evaluation conducted in
the growth chamber and adult plant evaluation using outdoor terrace screening trials was
similar to that used by Smiley et al. (2005a) and Smiley and Yan (2009). To prepare
inoculum, 100 grams of white pearl millet seed were placed into 0.5-Liter Mason jars and
autoclaved twice over a two-day interval at a temperature of 121 oC at 15 atm. psi for 45
minutes. PNW isolate 006-13 of F. pseudograminearum was grown in 20% potato
dextrose agar (PDA) for 10 days under fluorescent lights set at a 12-hour photoperiod at
26 oC. Four 1 cm squares of the PNW F. pseudograminearum isolate (006-13) was
added to the jars and incubated at 22 oC for 21 days prior to growth chamber and terrace
inoculations.
Field trials were inoculated with a liquid conidial suspension of the same single F.
pseudograminearum isolate (006-13) (Nicol et al. 2007). To prepare liquid inoculum, the
respective isolate was grown on colonized millet as described previously. Approximately
100 g of colonized millet was placed in cheesecloth and flushed with de-ionized distilled
water to make approximately 125 mL of conidial solution. Conidial concentrations were
checked with a haemocytometer and adjusted to 250,000 conidia per mL of solution
(Mitter et al. 2006; Nicol et al. 2004). Seeds of each line were placed in plastic weigh

211
boats and soaked in 1 mL of the conidial suspension (500,000 conidia per mL) for 1 to 3
minutes and dried approximately two days prior to planting.
Growth chamber seedling screening
Three runs of the growth chamber assay were conducted for the Sunco/Macon
RILs; harvested and rated on July 7 (2008), Sept. 20th
(2008), and Sept. 15th
(2009). Two
growth chamber assays were conducted for the Sunco/Otis RILs; harvested and rated on
July 15th
and Sept. 17th
, 2009. For the growth chamber assays, seeds of each cultivar
were surface disinfested in 95% EtOH (ethanol) for 6 minutes, rinsed in de-ionized
distilled water for 1 minute, then placed in 0.5% NaOCl for 10 minutes, followed by six
rinses (1 minute each) in de-ionized distilled water. Following surface disinfestation,
seeds were placed on moist filter paper and incubated for 3 days. Seedlings were placed
in a 4 C for 4 to 5 days to obtain consistent germination.
Seedlings were planted into a medium comprised of 50% sand and 50% peat
(Greensmix Sphagnum Peat Moss, Wuapaca Northwoods LLC., Wuapaca, WI) (v/v) in 4
cm diameter x 20.5 cm long cone-tainers (Stuewe and Sons, Corvallis, OR) arranged in
plastic trays and arranged in a randomized complete block design with 10 replications.
The experiment was conducted in three 964 ft3 (Conviron, Winnipeg, CA.) growthrooms
located at the WSU Plant Growth Facility in Pullman WA. Each growth chamber could
only contain ~1,200 plants. Therefore, the Sunco/Macon RILs were split into two groups
for testing with common check and parental genotypes included in each growth chamber.
Genotypes within growth room sets were arranged in a randomized complete block
design, with 10 replications.
212
Seedlings were grown at 60/80 (±5)% day/night RH, a 12 hour photoperiod, and
25/15 oC day/night temperatures for the duration of the experiment, 35 days after
inoculation. Plants were allowed to dry and symptoms were rated on dried tissue. Crown
rot disease symptoms were rated using a 0 to 10 scale (0=no disease observed, 10 =
stunted and dead) according to Nicol et al. (2004). The 0 to 10 symptom rating system
was based on the following scale; 0=no disease; 1 to 2 = minor symptoms on crown
within the first internode region; 3 to 4 = obvious symptoms on crown within the first
internode region; 5 to 6 = pronounced symptoms on crown with obvious darkened plant
tissue due to infection; 8 to 9 = advanced darkened symptoms with severe stunting and
near death due to disease infection; 10 = dead plant with severe disease symptoms) for
crown rot severity. Seedling height from the base of the soil to the tip of the longest leaf
was also recorded.
Outdoor terrace adult plant screening
Two runs of the outdoor terrace screening assay were conducted for the
Sunco/Macon RILs and one was conducted for the Sunco/Otis RILs from mid-May
through late August during the 2008 and 2009 growing seasons. A single seed was
planted into a medium comprised of 50% sand and 50% peat (Greensmix Sphagnum Peat
Moss, Wuapaca Northwoods llc., Wuapaca, WI) (v/v) in 6 cm diameter x 24 cm long
cone-tainers (Ray Leach Container, Canby, OR), similar to that of growth chamber
screens. Genotypes were divided into four sets to control for variability in the sand bed.
Each set of genotypes included parents and check genotypes. Genotypes within sets were
arranged in a randomized complete block design, with 10 replications. Fertilizer

213
(Osmocote Classic grade 14-14-14 (%N-%P-%K)) was added to each pot at a rate of ~1.0
gram per pot.
Following seedling emergence, millet colonized with F. pseudograminearum
isolate 006-13 was placed approximately 2 cm above the seed and covered with potting
mix. Water was immediately applied to the pots to activate the inoculum and begin
infection. Plots were irrigated on a daily schedule of 1 hour per day during emergence,
then irrigations were scheduled over longer intervals of two to four hours and were
infrequent to encourage root growth. The irrigation was discontinued in late July and
disease symptoms were rated in late August 2008 and 2009 on dried plant tissue. The 0
to 10 scale was used for the outdoor terrace bed screening, and the number of nodes
showing symptoms was also recorded.
Field screening
A single field trial located near Mansfield WA was planted May 13th
and 20th
2009 for the Sunco/Otis RILs and Sunco /Macon RILs, respectively. Following seed
inoculation as described above, approximately 30 seeds were planted in a 1.5 m linear
row per to a depth of 5 cm with a deep furrow hand planting apparatus. Plots were
spaced 25 cm apart. The experiments were arranged as randomized complete blocks with
three replications for Sunco/Otis and two replications for Sunco/Macon. The location
was typical of dryland wheat growing conditions in North Central Washington with a
sandy loam soil (type = Timentwa-Siweeka complex with bedrock: source
http://websoilsurvey.nrcs.usda.gov) receiving approximately 25 cm of rainfall in a
season. After the growing season, when the wheat had senesced, approximately 10 plants
were harvested per plot from which 5 stems were randomly selected and rated for crown

214
rot severity on a scale from 0 to 10, similar to that of the growth chamber and outdoor
terrace evaluations.
Statistical analysis for crown rot disease screening
A single rating scale was used (0 to 10; 10 = dead plant) for the growth chamber,
outdoor terrace and field screens. Experimental units were individual plant stems that
were scored for all growth room, terrace, and field data sets. The mean growth room,
terrace, and field ratings from each respective screen and year based on the 0 to 10 scale
were used for QTL mapping.
Growth room crown rot screening
Growth room screens were blocked with all treatments and replications for
individual lines within one room (i.e. all ten replications for lines 1 through 120 for
Sunco/Macon were in one room). For each Sunco/Macon screen three growth rooms
were used, whereas two were used for each Sunco/Otis growth room screen. Ten
replications were used for the first two growth room screens for Sunco/Macon and first
screen for Sunco/Otis. In the remaining screens seven replications were used for each
respective population. The ANOVA model consisted of the independent variables
genotypes (random effect), growth rooms (fixed effect), and replications within
growthrooms. The dependent variable was the crown rot severity rating (1 to 10 scale).
Least squares means were calculated for genotypes (growth room) to account for
variation between growthrooms and used in QTL analysis. Proc General Linear Models
analysis was conducted with SAS v. 6.12 (SAS Institute Inc., Cary, NC).
215
Terrace crown rot screening
Experimental units for the outdoor terrace screening system were individual
plants planted in cone-tainers. Ten replications were used for all data sets and all years
involved in the analysis. All replications and genotypes were blocked within four
locations located throughout the terrace screening area (i.e. block 1 included all
replications for genotypes 1 through 80). The ANOVA model consisted of the
independent variables genotypes, blocks, and replications within blocks. The dependent
variable was the crown rot severity rating (1 to 10 scale). Least squares means were
calculated for genotypes(blocks) to account for variation between blocks within the
terrace plot with SAS.
Field screening
Experimental units for the field screen were each of the five individual stems
randomly subsampled from within each replicated plot and scored on a 0 to 10 scale for
crown rot severity. Means were calculated for five stems within each plot. Data was
analyzed across three replications from the Sunco/Otis field plot and two replications
from the Sunco/Macon plots both arranged in a randomized complete block design. The
independent effects genotypes (random) and replication were analyzed with Proc GLM
ANOVA and least squares means (lsmeans) with SAS.
Pearson correlations were calculated on the basis of means for each parameter
data set (i.e. growth room, terrace, and field) using Microsoft Office Excel® 2007 Ed.
Regression analysis was calculated on significant correlations where terrace and field
served as the independent Y variable and growth room served as the dependent X
variable using Microsoft Office Excel® 2007 Ed. Broad sense heritability (H
2) was

216
calculated for all locations using the formula: H2 = Var(G)/Var(P) (where Var(G) is the
variance of the genotypic effect and Var(P) is the variance of the phenotypic effect) using
the SAS code provided by Holland et al. (2003).
Molecular marker analysis
Fresh leaf tissue of each RIL from the F6:F7 Sunco/Macon and F5:F6 Sunco/Otis
RIL populations, plus parents, were collected at the 5 leaf stage and stored at -80 oC until
processing. Samples were ground to a fine powder in liquid nitrogen with mortar and
pestle and DNA was extracted using the following protocol. DNA extraction buffer
consisted of 625 mL ddH2O, 100 mL of 0.5-M EDTA (pH=8.0), 100 mL Tris (pH=8.0),
100 mL 5-M NaCl, 62 mL 20% SDS (sodium dodecyl sulphate), and 3.80 g sodium
bisulfate. The pH of the buffer solution was adjusted to 8.0 with 4 M NaOH.
Approximately 300 to 400 mg of plant tissue was placed in a 50 mL tube. DNA
extraction buffer was added to a total volume of 25 mL in the tube. Samples were placed
in a water bath set at 65 oC for 45 minutes and agitated every 10 minutes. After
incubation in the water bath, approximately 25 mL of chloroform was added to make a
total volume of 45 mL and mixed thoroughly by twisting. Tubes were centrifuged for 15
minutes at 10,000 g. Supernatant was transferred to a clean tube; 45 mL of chilled 95%
EtOh was added to elute DNA and mixed gently. Tubes were incubated for 20 minutes at
4 oC, then extracted plant DNA was transferred to another clean tube and re-suspended in
70% EtOH then placed at -20 oC overnight. Precipitated DNA was collected and dried
for 3 to 5 hours, then re-suspended in 500 mL pure water (water volume was adjusted
according to DNA content) and placed at 4 oC until use.
217
Two marker systems, DArT and SSR, were utilized to generate a linkage map for
each population. DArT genotyping was carried out on both mapping populations by
Triticarte Pty. Ltd. (Yarralumla, ACT., Australia; http://www.triticarte.com.au) using the
wheat DArT arrays of 1,500 and 1,200 random markers for Sunco/Otis and
Sunco/Macon, respectively. Procedures for hybridization of genomic DNA to the DArT
array were conducted according to the description in Akbari et al. (2006). In addition to
DArT markers, 70 polymorphic SSR markers were screened across the parents and both
RIL mapping populations.
SSR analysis was conducted according to PCR conditions modified by Röder et
al. (1998) with the exception that primers carried the addition of M13 tails for
amplification on an ABI 3130xl (Oetting et al. 1995). One µL of template sample DNA
(100 ng/ µL) was added to a 10 µL PCR master mix solution for the PCR reaction. The
master mix solution consisted of 7.6 µL of nanopure ddH2O, 1.2 µL of loading buffer,
0.48 µL of 25 mM MgCl2, 0.96 µL of oligonuceotides (2.5 mM), 0.06 µL of forward
primer (M13 tail), 0.3 µL reverse primer, 0.24 µL of 10 mM of appropriate fluorophores
for ABI (Applied Biosystems, Foster City, CA), 0.12 µL (5 units per µL) of Taq DNA
polymerase. Samples were amplified with an initial denaturation at 94 oC for 5 minutes,
followed by 43 cycles of 30 s denaturation at 94oC, 45 s annealing at 50 to 65
oC
(depending on primers), and a 1 minute extension at 72 oC. Amplified samples were
analyzed on an ABI 3130xl.
Linkage map construction and QTL analysis
Segregation ratios of markers were tested using a Chi-square goodness-of-fit test
to a 1:1 ratio at a significance level of P=0.05. Linkage analysis was conducted using

218
MapMaker v3.0 (Lander et al. 1987). For smaller linkage groups with markers of 15 or
less, three point linkage analysis was performed using the “compare” command to
determine the most likely order of markers. The “try” command was used to add markers
to a framework map set of markers which was verified with the “ripple” command. For
larger linkage groups, of 15 markers or more, three point linkage analysis was conducted
on the entire group with the “three point” command and then ordered with the “order”
command. Once a linkage group was established, it was verified with the “ripple”
command. The Kosambi mapping function was used to calculate genetic distances in
centimorgans (cM) between ordered markers (Kosambi, 1944). Each individual ordered
linkage group was then assigned to a chromosome based collinearity with the map of
Somers et al. (2004) and other previously published DArT maps made available by
Triticarte Pty. Ltd. (available online at
http://www.triticarte.com.au/content/further_development.html).
QTL analysis was carried out utilizing WinQTL Cartographer v2.5 (NC State
Univ., Statistical Genetics, Raleigh, NC) (Basten et al. 1997). For the analysis, trait
values were expressed as means over the 10 replications within each screening system
and run, adjusted for the effects of growth chamber or set (for the growth chamber and
terrace bed assays). Single-marker analysis using one-way ANOVA with a comparison-
wise probability level of p<0.01 was used to identify single markers linked to crown rot
resistance. QTL locations were also determined using composite interval mapping
(CIM). In order to detect QTL a LOD threshold of 3.0 was used.

219
RESULTS
Crown rot evaluation for Sunco/Macon
A total of three growth chamber, two terrace, and one field screening runs were
carried out during 2008 and 2009 for the Sunco/Macon RIL population (Table 1).
Significant genotype effects were evident across all screens (p<0.0001). There were also
significant differences between growth chamber screening runs and between years for the
terrace screens. Sunco/Macon growth chamber screen 3 had significantly less crown rot
severity than screen 1 (p=0.006), however screens 1 and 2 were not significantly different
(Table 1). For the terrace screens, year 1 had significantly less crown rot severity than
year 2 (p<0.0001) (Table 1).
There were significant differences between growth chambers within each run for
the three seedling screens as well as differences between four blocked locations within
the terrace experiment (range in values from p<0.0001 to p<0.0018) which were partially
accounted for by analyzing the results for genotypes within sets.
Mean crown rot severity was normally distributed across the three growth
chamber screens around a mean of 2.8 and standard deviation of 0.9 (Figure 1).
Transgressive segregation toward susceptibility was observed in the population (Table 1;
Figure 1). Sunco had slightly less crown rot severity compared to Macon, with the
exception of screen 1 where Sunco was not statistically different from Macon. The mean
crown rot severity across the three growth chamber screens was less for Sunco than
Macon (Table 1). The mean crown rot severity and range of ratings was the lowest for
the field screen compared to that of the growth chamber and terrace systems. The
coefficient of variation (36%) was the lowest for the field screening method compared to

220
those of the growth chamber and terrace screening methods. Overall heritabilities (H2)
were very low due to the extreme amount of variation in disease expression characteristic
of crown rot (Table 1).
In the 2008 terrace experiment crown rot severity was lower for Sunco compared
to Macon, but significantly greater for Sunco in the 2009 terrace experiment. The mean
crown rot severity was significantly greater (4.0) in 2009 for the terrace experiment
compared to 2008 (2.9) due to uneven irrigation distribution within the terrace plots.
The terrace 2009 data were not strongly correlated to that of 2008 (R-value = 0.10)
(Table 2).
The growth chamber screening method was slightly correlated to that of the field
(r-= 0.14, p=0.03) (Table 2; Figure 2). The mean terrace crown rot severity was
moderately correlated to that of the growth chamber (r= 0.33, p<0.0001), but not
correlated to that of the field (r= 0.08, p<0.28). There was a slight negative correlation
between plant height and crown rot severity (r= -0.22; p=0.0008).
Crown rot evaluation for Sunco/Otis
A total of two growth chamber, one terrace, and one field screen were carried out
during 2008 and 2009 for the Sunco / Otis RIL population (Table 4). Significant
genotype effects were evident across all screens (p<0.0001). There were also significant
differences between the two growth chamber screening runs (p<0.0001). Sunco / Otis
growth chamber screen 2 had significantly less crown rot severity than screen 1
(p<0.0001). The mean crown rot severity was numerically similar between growth
chamber screen 1 (µ=3.9) and the terrace screen in 2009 (µ=4.0) (Table 4).

221
Mean crown rot severity was normally distributed across the two growth chamber
screens around a mean of 3.5 and standard deviation of 0.9 (Figure 3). Transgressive
segregation was observed in the Sunco / Otis population (Table 4; Figure 3) toward
susceptibility. Sunco had slightly less crown rot severity compared to Otis for growth
chamber screen 1. The crown rot severity was slightly higher for Sunco than Otis for the
mean of the two growth chamber screens, yet the two were not statistically different.
Crown rot severity was numerically less for Sunco (µ=1.8) compared to Otis (µ=2.5) for
the 2009 field screen.
The mean crown rot severity and range of ratings was the lowest for the field
screen compared to that of the growth chamber and terrace systems, as was the case for
Sunco / Macon. Mean crown rot severity ratings between the growth chamber and
terrace screening systems were within similar ranges. Similarly to Sunco / Macon, the
heritabilities were very low due to the extreme amount of variation in disease expression,
which is characteristic of crown rot (Table 4). There were no significant correlations of
the genotype means of the screening methods for the Sunco / Otis population.
Linkage map construction
Over 1,225 and 1,544 DArT markers were polymorphic between the parents
Sunco and Macon and Sunco and Otis, respectively. In addition 70 SSR markers
polymorphic between the parents were analyzed as known chromosomal „anchors‟, or
markers from previously published regions at the distal ends of chromosomes and
roughly every 50 cM of the 21 haploid wheat chromosomes (Somers et al. 2004). Over
530 and 832 DArT markers were eliminated from the mapping analysis for Sunco/Macon
and Sunco/Otis, respectively, due to a failure of a Chi-square test fit to a 1:1 ratio. A

222
total of 695 DArT and 18 SSR markers were analyzed in the development of the
Sunco/Macon linkage map. Of these a total of 328 DArT and 18 SSR markers (346 total)
were included in the genetic linkage map construction to form 39 linkage groups at LOD
= 5. Of these linkage groups 27 were assigned to all 21 haploid chromosomes with a
total genetic distance of 1,778 cM for Sunco/Macon. For Sunco/Macon, three linkage
groups were assigned to chromosome 1A. Chromosomes 3A, 3B, 7A, and 7B each were
comprised of two linkage groups. The only under represented linkage group for the
Sunco/Macon population contained only 4 markers was assigned to chromosome 4D.
A total of 712 DArT and 30 SSR markers were analyzed in the development of
the Sunco/Otis linkage map. Of these a total of 354 DArT and 30 SSR markers were
included in the genetic linkage map construction to form 39 linkage groups at LOD = 5,
of which 26 were assigned to all 21 haploid chromosomes with a total genetic distance of
2,451 cM for Sunco/Otis. The average distance between markers was 5.1 and 6.3 for
Sunco/Macon and Sunco/Otis, respectively. A total of 40 and 24 markers were mapped
to the major linkage group on chromosome 3B for Sunco/Macon and Sunco/Otis,
respectively. Chromosomes 2B, 3B, 4A, 6A, and 7D each were comprised of two
linkage groups. In the Sunco/Otis population there were not any unrepresented
chromosomes as all 26 linkage groups were assigned to the 21 chromosomes. However,
chromosomes 3D, 4D, 5D, and 6D had only 5, 4, 4, and 5 markers within those respective
linkage groups assigned to those chromosomes. These chromosomes could be considered
to be underrepresented with so few markers.

223
Crown rot resistance QTL identification
Sunco/Macon
Single marker analysis revealed significant QTL (P=0.05) on chromosomes 1A,
1B, 1D, 2B, 3B, 4B, 4D, and 7A in growth chamber, terrace, and field screens (Table 5).
Utilizing CIM, one major QTL, that was inherited from Sunco, was identified on
chromosome 3B. The 3B QTL was detected in all 3 growth chamber screens and in the
field screen. Across the three growth chamber screens LOD values for the 3B QTL
ranged from 2.5 to 14.3 and explained from 5% to 28% of the variation in the growth
chamber phenotypic data. This QTL was also identified in the field screen with a LOD =
2.2, explaining 4% of the variation in the phenotypic data (Figure 4; Table 5). Following
convention, this QTL was named Qcrs.wsu-3BL, where „crs‟ stands for “crown rot
severity” and „wsu‟ stands for “Washington State University”. To date we have not
found any SSR markers linked to the crown rot resistance QTL Qcrs.sm-3BL but this
work is in progress. Other less significant QTL were identified on chromosomes 1D, 2B,
and 4B. These were only detected in a single assay but have been reported by others on
those chromosomes (Wallwork et al. 2004; Collard et al. 2005; Bovill et al. 2006).
Heritability ranged from 0.04 to 0.17 for the growth chamber screens.
There was a significant plant height QTL in the Sunco /Macon population on
chromosome 4B (LOD = 8.8 explaining 31% of the variation for plant height). Wallwork
et al. (2004) reported that the Rht-B1 locus mapped to chromosome 4B in a Kukri/Janz
background. Kukri and Sunco share similar parentage (cv. Cook) and could both carry
the Rht-B1 locus. The Rht-B1 locus was originally located on chromosome 4B (McVittie
et al. 1978; Somers et al. 2004).

224
Sunco/Otis
Single marker analysis revealed significant QTL (P=0.05) on chromosomes 1A,
2A, 2B, 3A, 3B, 4A, 4B, 5B, and 7A. CIM analysis identified one major QTL on
chromosome 3B across both growth chamber data sets with LOD scores of 10 and 1.5
explaining 23% and 4% of the variation for growth chamber screen 1 and 2, respectively
(Figure 5; Table 6). The mean growth chamber rating had a LOD = 8.8 explaining 20%
of the variation (Table 6). Another QTL located 15 cM in proximal to the major QTL on
3BL was identified in the field screen. This second 3B QTL was inherited from Otis and
had a LOD = 2.6 explaining 8% of the variation in the phenotypic data. The major
seedling QTL identified in growth room assays inherited from Sunco was named by
convention “Qcrs.wsu-3BL”, where „crs‟ stands for crown rot severity and „wsu‟ stands
for “Washington State University” as it may be the same QTL as that identified in the
Sunco/Macon population. However, this conclusion needs further research and
validation with more growth room screens for the Sunco/Otis population. The SSR
marker „gwm247‟ is linked to this resistance QTL and appears to be a possible candidate
for validation in wheat backgrounds for potential use in marker assisted selection.
Another major QTL on chromosome 7A was inherited from Otis and identified in
one terrace screen from 2009 with a LOD = 5.1 and explained 20% of the variation and
was located 31 cM from the SSR marker wmc646. Other significant QTL were inherited
from Otis and identified on chromosome 4B from the terrace screen and growth chamber
screen 2 with LOD scores ranging from 2.7 to 3.2 and both explained 7% of the variation
in the data. The growth chamber data showed a slightly significant QTL on chromosome
4A with a LOD = 3.0 and 2.2 explaining 6% and 8% of the variation in the data for

225
growth chamber screens 1 and 2, respectively. The least significant QTL was inherited
from Otis and identified in growth chamber screen 2 on chromosome 1A with a LOD =
2.9 and explained 7% of the variation. CIM showed other less significant QTL on
chromosomes 2A, 2B, 3A, and 5B for the Sunco/Otis population (Table 6).
The markers in common on chromosome 3B between Sunco/Macon and
Sunco/Otis were wmc777, wPt-3342, wPt-6945, and wPt-6239. These markers were in
similar locations on each genetic linkage map. Markers were within approximately 1 to
12 cM from each other. The only DArT marker in common within the 3BL QTL region
between the Sunco/Macon and Sunco/Otis populations was „wPt-3342‟.

226
DISCUSSION
The most recent and significant QTL identified for crown rot resistance was
located at the distal end of chromosome 3BL and designated Qcrs.cpi-3B with an average
LOD = 10.2 explaining 44% of the variation over two seedling growth chamber screens
with an F. pseudograminearum isolate (Ma et al. 2009). The resistant source of this QTL
was a cultivar known as „CSCR6‟ and was of the species T. spelta. The authors reported
that their intent was to discover novels sources of resistance by mapping wheat from a
species other than T. aestivum which had been used to identify all of the resistance QTL
to date (Wallwork et al. 2004; Collard et al. 2005; Bovill et al. 2006).
To date there has not been a report of significant crown rot resistance QTL on
chromosome 3BL in the cultivated T. aestivum cultivar Sunco. This research reports a
novel major crown rot resistance QTL with an average growth chamber mean (three
screens) LOD score = 14.3 and 10.3 in Sunco/Macon and Sunco/Otis, respectively,
explaining 28% of the variation in the phenotypic data on chromosome 3BL inherited
from the T. aestivum source „Sunco‟ in two mapping populations.
The potential does exist that the 3BL QTL inherited from „CSCR6‟ published by
Ma et al. (2009) could be in a similar location to that of the Sunco/Otis population in the
current study as both QTL regions contain DArT markers „wPt-8206‟ and „wPt-0324‟ of
each respective population. Neither of these markers were polymorphic in the 3BL QTL
region of the Sunco/Macon population. In fact there were not any DArT or SSR markers
that were polymorphic in both populations within the QTL region of chromosome 3BL
between the Sunco/Macon and the CSCR6/Lang population published by Ma et al.
(2009). DArT marker „wPt-3342‟ was the only polymorphic marker in common between

227
the 3BL QTL region of Sunco/Macon and Sunco/Otis reported here. There were only
four polymorphic markers in common between the entire chromosome 3B maps of
Sunco/Otis and Sunco/Macon. Additional markers are being tested for that region and
may reveal additional collinearity. In the meantime, crosses between resistant RILs
possessing the 3BL QTL from both populations may reveal whether QTL are shared or
different.
Collard et al. (2005) reported a major QTL located on chromosome 1DL (LOD =
8.5 explaining 21% of the variation) from a single growth chamber assay that was tightly
linked (<1 cM) to the SSR marker wmc149. Results from the current study show a minor
adult plant QTL from the Sunco/Macon terrace screen mean (LOD = 2.5 explaining 6%
of the variation) on chromosome 1DL within 6 cM of the SSR marker wmc149.
The adult plant QTL reported by Wallwork et al. (2004) located on chromosome
4B (LOD = 54 explaining 48% of the variation) was 7.7 cM from SSR marker gwm149.
Wallwork et al. (2004) reported a major QTL on chromosome 4B inherited from Kukri.
The authors indicated that the nature of the partial resistance in Sunco was similar to that
of Kukri as they both inherited their partial resistance from the cultivar Cook. However,
the significant QTL reported here in the Sunco/Otis population was inherited from Otis.
The minor QTL identified on chromosome 4B in this study were located approximately
49 cM and 41 cM from the SSR marker gwm149 in the Sunco/Macon and Sunco/Otis
populations, respectively. Therefore, these minor QTL appear to be in different locations
than that reported by Wallwork et al. (2004).
Although Wallwork et al. (2004) reported a negative correlation of r = -0.59
between crown rot severity and plant height, that is taller plants were more resistant and

228
lacked the Rht-B1 allele for reduced plant height, only a slight negative correlation and
significant regression (p=0.0008) between plant height and crown rot severity was found
in the Sunco/Macon population (r= -0.22). Plant height was measured in the growth
chamber and field and a significant QTL for those data sets were found on chromosome
4B (LOD = 8.8 explaining 31% of the variation for the growth chamber plant height) in
the Sunco/Macon population. This correlation and QTL on 4B may further validate the
accuracy of the Sunco/Macon genetic linkage map in this study (Wallwork et al. 2004).
Significant QTL found in similar locations to other minor QTL reported in
previous studies on chromosome 2B cannot be easily assessed as they do not share
similar markers of interest (Bovill et al. 2006). To date there have not been any reports
of a significant QTL on chromosome 7A. This study reported a significant QTL on
chromosome 7A (LOD = 5.1 explaining 20% of the variation) in the Sunco/Otis
population from a single terrace data set (inherited from Otis). Further screening is
needed to further validate this QTL.
Previous researchers utilized either adult plant terrace screening systems or
growth chamber screening assays to identify QTL for crown rot resistance (Wallwork et
al. 2004; Collard et al. 2005; Bovill et al. 2006; Ma et al. 2009). This study is the first to
confirm the identification of the major 3BL seedling QTL from growth chamber screens
with field screening in the Sunco/Macon population. Although these results may suggest
the possibility that seedling and adult plant resistance could potentially coincide in some
instances, the significant QTL identified with seedling growth chamber screens did not
appear in either of the terrace screens for either Sunco/Macon or Sunco/Otis.

229
The concept of adult plant and seedling resistance requires further study with
different sources of resistance. Although Wallwork et al. (2004) reported that the
response of resistant cultivars was similar between F. pseudograminearum and F.
culmorum in Australia, this needs further evaluation with PNW isolates of each
respective species. The findings reported here and by others have confirmed the concept
that resistance to crown rot is polygenic and subject to a great deal of environmental
variation (Collard et al. 2005; Bovill et al. 2006). However, these current findings and
those of Ma et al. (2009) (3BL QTL explaining 44% of the variation) and Wallwork et al.
(2004) (4B QTL explaining 48% of the variation) do also suggest that strong single gene
sources of host plant resistance may exist for crown rot.
Future work needs to be conducted to identify SSR markers in the regions of the
major 3BL QTL identified in this study. Once markers are identified, there is a need to
validate polymorphisms in the background of PNW germplasm for their potential use in
marker assisted selection. Secondly, Sunco needs to be evaluated against a subset of F.
pseudograminearum and F. culmorum isolates collected from a recent Fusarium crown
rot survey of the PNW to measure the variation in resistance response at both the seedling
and adult plant stage (Poole, PhD Doctoral Dissertation, 2010). The subject matter of the
nature of adult plant and seedling resistance needs to be further evaluated with sources of
resistance that exhibit each of these responses individually by evaluating them over
several years in growth chamber , terrace, and field trials.

230
LITERATURE CITED
Akbari, M., Wenzl, P., Caig, V., Carling, J., Xia, L., Yang, S., Uszynski, G., Mohler, V.,
Lehmensiek, A., Kuchel, H., Hayden, M., Howes, N., Sharp, P., Vaughan, P.,
Rathmell, B., Huttner, E., and Kilian, A. 2006. Diversity Arrays Technology
(DArT) for high-throughput profiling of the hexaploid wheat genome. Theor.
Appl. Genet. 113:1409-1420.
Backhouse, D., Abubakar, A.A., Burgess, L.W., Dennis, J.I., Hollaway, G.J.,
Wildermuth, G.B., Wallwork, H., and Henry, F.J. 2004. Survey of Fusarium
species associated with crown rot of wheat and barley in eastern Australia.
Australas. Plant Path. 33:255-261.
Basten, J.C., Weir, B.S., and Zeng, Z.B. 1997. QTL cartographer. A reference manual
and tutorial for QTL mapping. Department of Statistics, North Carolina State
University, Raleigh, N.C.
Bovill, W.D., Ma, W., Ritter, K., Collard, B.C.Y, Davis, M., Wildermuth, G.B. and
Sutherland, M.W. 2006. Identification of novel QTL for resistance to crown rot
in the doubled haploid wheat population „W21MMT70‟ x „Mendos‟. Plant
Breeding 125:538-543.
Burgess, L.W., Backhouse, D., Summerell, B.A., and Swan, L.J. 2001. Crown rot in
wheat – Chapter 20 in Fusarium – Paul E Nelson Memorial Symposium. Edited
by Summerell, B.A., Leslie, J.F., Backhouse, D., Bryden, W.L., Burgess, L.W.
APS Press, the American Phytopathological Society, St. Paul, MN.

231
Collard, B.C.Y., Grams, R.A., Bovill, C.D., Percy, C.D., Jolley, R., Lehmensiek, A.,
Wildermuth, G., and Sutherland, M.W. 2005. Development of molecular
markers for crown rot resistance in wheat: mapping of QTL for seedling
resistance in a „2-49‟ x „Janz‟ population. Plant Breeding 124:532-537.
Cook, R.J. 1968. Fusarium root and foot rot of cereals in the Pacific Northwest.
Phytopathology 58:127-131.
Cook, R.J. 1992. Wheat root health management and environmental concern.
Can. J. Plant Pathol. 14:76-85.
Cook, R.J. 2001. Management of wheat and barley root diseases in modern farming
systems. Australas. Plant Pathology 30:119-126.
Cook, R. J., and Veseth, R. J. 1991. Wheat Health Management. American
Phytopathological Society, St. Paul, MN.
Dodman, R.L., and Wildermuth, G.B. 1987. Inoculation methods for assessing
resistance in wheat to crown rot caused by Fusarium graminearum Group 1. Aust.
J. Agric. Res. 38: 473-486.
Gale, M.D. and Marshall, G.A. 1976. The chromosomal location of GA1 and Rht1 genes
for gibberellin insensitivity and semi-dwarfism, in a derivative of Norin 10 wheat.
Heredity 37:283-289.
Hekimhan, H., Ahmet B.S., Nicol, J.M., Arisoy, R.Z., Taner, S., and Sahin, M. 2004.
Dryland root rot: a major threat to winter cereal production under sub-optimal
growing conditions. Crop Science Congress, Brisbane Australia: 26 Sept. to 1
Oct. 2004. p. 1232-1336.
232
Holland, J.B., Nyquist, W.E., Cervantes-Martinez, C.T. 2003. Estimating and
interpreting heritability for plant breeding: an update. In: Janick J (ed) Plant
breeding reviews, vol 22. pp 9-112. Wiley, Hoboken.
Kammholz, S.J., Campbell, A.W., Sutherland, M.W., Hollamby, G.J., Martin, P.J.,
Eastwood, R.F., Barclay, I., Wilson, R.E., Brennan, P.S., and Sheppard, J.A.
2001. Establishment and characterization of wheat genetic mapping populations.
Aust. J. Agric. Res. 52:1079-1088.
Kane, R.T., Smiley, R.W., and Sorrells M.E. 1987. Relative pathogenicity of selected
Fusarium species and Microdochium bolleyi to winter wheat in New York. Plant
Dis. 71:177-181.
Kidwell, K.K., DeMacon, V.L., Shelton, G.B., Burns, J.W., Carter, B.P., Morris, C.F.,
Chen, X.M., Bosque-Perez, and N.A. 2003. Registration of 'Macon' wheat.
Crop Sci. 43:1566–1567.
Kidwell, K.K., DeMacon, V.L., Shelton, G.B., Burns, J.W., Carter, B.P., Morris, C.F.,
Chen, X.M., Bosque-Perez, and N.A.. 2006. Registration of 'Otis' wheat.
Crop Sci. 46:1386–1387.
Klein, T.A., Burgess, L.W., and Ellison, F.W. 1990. Survey of the incidence of
whiteheads in wheat crops grown in northern New South Wales, 1976-1981.
Aust. J. Exp. Ag. 30:621-627.
Kosambi, D.D. 1944. The estimation of map distances from recombination values. Ann.
Eugen. 12:172-175.

233
Lander, E.S., Green, P., Abrahamson, J., Barlow, A., Daly, J.M., Lincoln, S.E., and
Newberg, L. 1987. Mapmaker: an interactive computer package for constructing
primary genetic linkage maps of experimental and natural populations. Genomics
1:174-181.
Li, Y., Liu, C., Chakraborty, S., Manners, J., and Kazan, K. 2008. A simple method for
the assessment of crown rot disease severity in wheat seedlings inoculated with
Fusarium pseudograminearum. J. Phytopathology 156:751.
Ma, J., Li, H., Zhang, C., Yang, X., Liu, Y., Yan, G., and Liu, C. 2009. Identification
and validation of a major QTL conferring crown rot resistance in hexaploid
wheat. Theor. Appl. Genet. 6:1119-1128.
McKnight, T., and Hart, J. 1966. Some field observations on crown rot disease of wheat
caused by Fusarium graminearum. Queensland Journal of Agricultural and
Animal Sciences 23:373.
McVittie, J.A., Gale, M.D., Marshal, G.A., and Westcott, B. 1978. The intra-
chromosomal mapping of Norin-10 and Tom Thumb genes. Heredity 40:67-70.
Mitter, V., Zhang, M.C., Liu, C.J., Ghosh, R., Ghosh, M., and Chakraborty, S. 2006. A
high-throughput greenhouse bioassay to detect crown rot resistance in wheat
germplasm. Plant Path. 55:433-441.
Nicol, J.M., Bolat, N., Bağcı,., M., Hekimkan, H., Tunalı., B., Bolat, N., Braun, H, J.,
Trethowan, and R. 2004. Strategy for the identification and breeding of
resistance to dryland root rot complex for international spring and winter breeding
programs. 4th International Crop Science Congress, Brisbane, Australia, 2004.

234
Nicol, J.M, Rivoal, R., Trethowan, R.M., van Ginkel, M., Meroum, M., and Singh, R.P.
2001. CIMMYT‟s approach to identify and use resistance to nematodes and soil-
borne fungi, in developing superior wheat germplasm. In: 'Wheat in a Global
Environment'. Ed. Z. Bedo and L. Lang, Proceedings of the 6th International
Wheat Conference, 5-9 June 2000, Budapest, Hungary. Kluwer Academic
Publishers, Netherlands. pg. 381-389.
Nicol, J.M., Bolat, N., Bagci, A., Trethowan, R.T., William M., Hekimhan, H., Yildirim,
A.F., Sahin, E., Eleckcioglu, H., Toktay, H., Tunali, B., Hede, A., Taner, S.,
Braun, H.J., Van Ginkel, M., Arisoy, Z., Yorgancilar, A., Tulek, A., Erdurmus,
D., Buyuk, O., and M. Aydogdu. 2007. The International breeding strategy for
the incorporation of resistance in bread wheat against the soil-borne pathogens
(dryland root rot and cyst and lesion cereal nematodes) using conventional and
molecular tools. In: Wheat Production in Stressed Environments, H.T. Buck et
al. (eds.), Springerp. 125-137.
Oetting, W.S., Lee, H.K., Flanders, D.J., Wiesner, G.L., Sellers, T.A., and King, R.A.
1995. Linkage analysis with multiplexed short tandem repeat polymorphisms
using infrared fluorescence and M13 tailed primers. Genomics 30:450-458.
Paulitz, T.C., Smiley, R.W., and Cook, R.J. 2002. Insights into the prevalence and
management of soil-borne cereal pathogens under direct seeding in the Pacific
Northwest, U.S.A. Can. J. Plant Path. 24:416-428.

235
Poole, G.J. 2010. Identification of molecular markers for resistance to Fusarium crown
rot in wheat and survey of Fusarium pseudograminearum and F. culmorum in the
Pacific Northwestern U.S.. Washington State University, Dept. of Plant
Pathology. Doctoral dissertation.
Purss, G.S. 1966. Studies on varietal resistance to crown rot of wheat caused by
Fusarium graminearum. Queensland J Agric and Animal Sci. 23:475.
Purss, G.S. 1970. Resistance to common root rot (Cochliobolus sativus) in wheat in
Queensland. Australian Journal of Experimental Agriculture and Animal
Husbandry. 10:497-501.
Roder, M.S., Korzun, V., Wendehake, K., Plaschke, J., Tixier, M.H., Leroy, P., and
Ganal, M.W. 1998. A microsatellite map of wheat. Genetics 149:2007-2023.
Sleper, D.A. and Poehlman, J.M. 2006. Breeding Field Crops. 5th
Ed. Blackwell
Publishing, Ames, Iowa. Pgs. 221-235.
Smiley, R.W. and Patterson, L.M. 1996. Pathogenic fungi associated with Fusarium foot
rot of winter wheat in the semiarid Pacific Northwest USA. Plant Dis. 80:944-
949.
Smiley, R.W., Gourlie, J. A., Easley, S. A., Patterson, L.-M., and Whittaker, R.G.
2005a. Crop damage estimates for crown rot of wheat and barley in the Pacific
Northwest. Plant Dis. 89:595-604.
Smiley, R.W., and Yan, H. 2009. Variability of Fusarium crown rot tolerances among
cultivars of spring and winter wheat. Plant Dis. 93:954-961.
Somers, D. J., Isaac, P., and Edwards, K. 2004. A high-density microsatellite consensus
map for bread wheat (Triticum aestivum L.). Theor. Appl. Genet. 109:1105-1114.

236
Wallwork, H., Butt, M., Cheong, J. P. E., and Williams, K. J. 2004. Resistance to crown
rot in wheat identified through an improved method for screening adult plants.
Aust. Plant Path. 33:1-7.
Wildermuth, G.B., and McNamara, R.B. 1994. Testing wheat seedlings for resistance to
crown rot caused by Fusarium graminearum Group 1. Plant Dis. 78:949-953.
William, H.M., Trethowan, R., and Crosby-Galvan, E.M. 2007. Wheat breeding assisted
by markers: CIMMYT‟s experience. Euphytica 10: 1-13.
Woolston, J.E. 2000. Wheat, barley, and triticale cultivars: A list of publications in
which national cereal scientists have noted their cooperation or germplasm they
received from CIMMYT. Wheat special report No. 19. Fourth Ed. Mexico DF:
CIMMYT p. 15.

1
Table 1. Crown rot severity summary statistics including minimum and maximum ranges, standard deviations, coefficient of
variation (CV) and broad sense heritability (H2) for the Sunco/Macon RIL (219 lines) mapping population.
Parent1 Population
2
Trial Sunco Macon Min Max Mean SD CV (H2)3 SE
3
Growth chamber screen July 20084 2.3 1.8 0.5 7.1 3.0 1.3 86 0.63 0.03
Growth chamber screen Sept. 20084 2.1 3.2 0.4 6.2 2.9 1.2 114 0.59 0.04
Growth chamber screen July 20094 1.4 2.0 0.7 6.0 2.7 1.2 71 0.07 0.10
Growth chamber mean5 1.9 2.3 0.9 5.8 2.8 0.9 90 0.60 0.04
Terrace screen 20084 2.8 3.3 1.1 4.9 2.9 0.7 66 0.22 0.07
Terrace screen 20094 5.1 3.3 1.4 9.7 4.0 1.2 53 0.61 0.04
Terrace mean5 4.0 3.3 1.7 5.0 3.4 0.7 59 - -
Field screen 20096 2.5 2.3 0.2 4.2 1.9 0.5 36 0.17 0.11
1 Parents of the ril mapping population (Sunco and Macon).
2 Descriptive statistics of the Sunco/Macon recombinant inbred line mapping population consisting of 219 individials.
3 Broad sense heritability (H
2) of each respective growth chamber, terrace, and field screen calculated by H
2 = Var(G)/Var(P) (where
Var(G) is the variance of the genotypic effect and Var(P) is the variance of the phenotypic effect) using the SAS code provided by
Holland et al. (2003). Each respective standard error (SE) of variance was calculated for heritability estimates. 4 Growth room and Terrace screens were carried out in 2008 and 2009. Ten replications were included in the 2008 screens and 2009
terrace screen, while 7 replications were used in the 2009 growth room screen. Plants were rated from 0 to 10 according to Nicol et al.
2001; 0=no disease; 1 to 2 = minor symptoms on crown within the first internode region; 3 to 4 = obvious symptoms on crown within
the first internode region; 5 to 6 = pronounced symptoms on crown with obvious darkened plant tissue due to infection; 8 to 9 =
advanced darkened symptoms with severe stunting and near death due to disease infection; 10 = dead plant with severe disease
symptoms) for crown rot severity. For all screens lines were blocked to include all replications within 3 growth rooms and 4 blocks in
the terrace. Least square means (Lsmeans) were analysed using SAS. When data was analyzed including sets accounting for variation
between four block sets within the terrace screening system, heritabilities were lower for 2008 and 2009 at 0.03 (SE=0.01) and 0.14
(SE=0.02) for each year respectively. 5 Means were calculated for each set of respective growth room and terrace screens.
6 A field screen was conducted in Douglas Co. WA with 5 sub-samples rated from 0 to 10 according to Nicol et al. (2001) from 2
replicate blocks as described for growth room and terrace screens.
23
7

238
2
36
Table 2. Correlation coefficients for the Sunco/Macon population assessed for crown rot
severity among mean growth chamber screens, mean terrace screens, and one field
screen.
Growth chamber1 Terrace Field
Growth chamber1 1.00
Terrace 2 0.33 1.00
(p<0.0001)4
Field3 0.14 0.08 1.00
(p=0.03) 1 Growth chamber value is based on a mean of 3 growth room screens carried out during
2008 and 2009. Plants were rated on a 0 to 10 rating scale developed by Nicol et al.
(2001). 2 Terrace value is based on a mean of 2 terrace screens carried out in 2008 and 2009.
Plants were rated on a 0 to 10 rating scale developed by Nicol et al. (2001). 3 Field value is based on one year of data. Means from 5 sub-sampled stems from 2
replicated plots were rated according to Nicol et al. (2001) on a 0 to 10 scale. 4
P-values were reported only for significant correlations calculated according to
regression analysis.

25
2
Table 3. Correlation coefficients for the Sunco/Macon population assessed for crown rot severity among three growth chamber
screens, two terrace screens, and one field screen.
Growth chamber 1 Growth chamber 2 Growth chamber 3 Terrace ‟08 Terrace „09 Field
Growth chamber 1 1.00
Growth chamber 2 0.50 1.00
(p<0.0001)1
Growth chamber 3 0.13 0.23 1.00
(p=0.07) (p<0.0001)
Terrace ‟08 0.08 0.10 0.39 1.00
(p<0.0001)
Terrace „09 0.05 0.18 0.33 0.10 1.00
(p=0.005) (p<0.0001)
Field 0.07 0.09 0.14 0.06 0.06 1.00
(p=0.02)
1P-values were reported only for significant correlations calculated according to regression analysis.
23
9

Table 4. Crown rot severity summary statistics including minimum and maximum ranges, standard deviations, coefficient of
variation (CV) and broad sense heritability (H2) for the Sunco/Otis RIL mapping population.
Parent1 Population
2
Trial Sunco Otis Min Max Mean SD CV (H2)3 SE
3
Growth chamber screen July 20094 2.6 2.7 1.7 10.0 3.9 1.1 74 0.48 0.06
Growth chamber screen Sept. 20094 3.7 3.0 1.6 5.5 3.1 0.8 59 0.39 0.06
Growth chamber Mean5 3.1 2.8 2.0 5.2 3.5 0.7 67 0.60 0.07
Terrace screen 20094 6.4 5.8 1.5 7.0 4.0 1.1 51 0.28 0.09
Field screen 20096 1.8 2.5 1.3 3.5 2.3 0.5 30 0.29 0.10
1 Parents of the ril mapping population were Sunco and Otis.
2 Descriptive statistics of the Sunco/Otis recombinant inbred line mapping population consisting of 151 individials.
3 Broad sense heritability (H
2) of each respective growth chamber, terrace, and field screen calculated by H
2 = Var(G)/Var(P) (where
Var(G) is the variance of the genotypic effect and Var(P) is the variance of the phenotypic effect) using the SAS code provided by
Holland et al. (2003). Each respective standard error (SE) of variance was calculated for heritability estimates. 4 Growth room and Terrace screens were carried out in 2008 and 2009. Ten replications were included in the 2008 screens and 2009
terrace screen, while 7 replications were used in the 2009 growth room screen. Plants were rated from 0 to 10 according to Nicol et al.
2001; 0=no disease; 1 to 2 = minor symptoms on crown within the first internode region; 3 to 4 = obvious symptoms on crown within
the first internode region; 5 to 6 = pronounced symptoms on crown with obvious darkened plant tissue due to infection; 8 to 9 =
advanced darkened symptoms with severe stunting and near death due to disease infection; 10 = dead plant with severe disease
symptoms) for crown rot severity. For all screens lines were blocked to include all replications within 3 growth rooms and 4 blocks in
the terrace. Least square means (Lsmeans) were analysed using SAS. 5 Means were calculated by averaging each respective growth room screen.
6 A field screen was conducted in Douglas Co. WA with 5 sub-samples rated from 0 to 10 according to Nicol et al. (2001) from 2
replicate blocks as described for growth room and terrace screens.
24
0
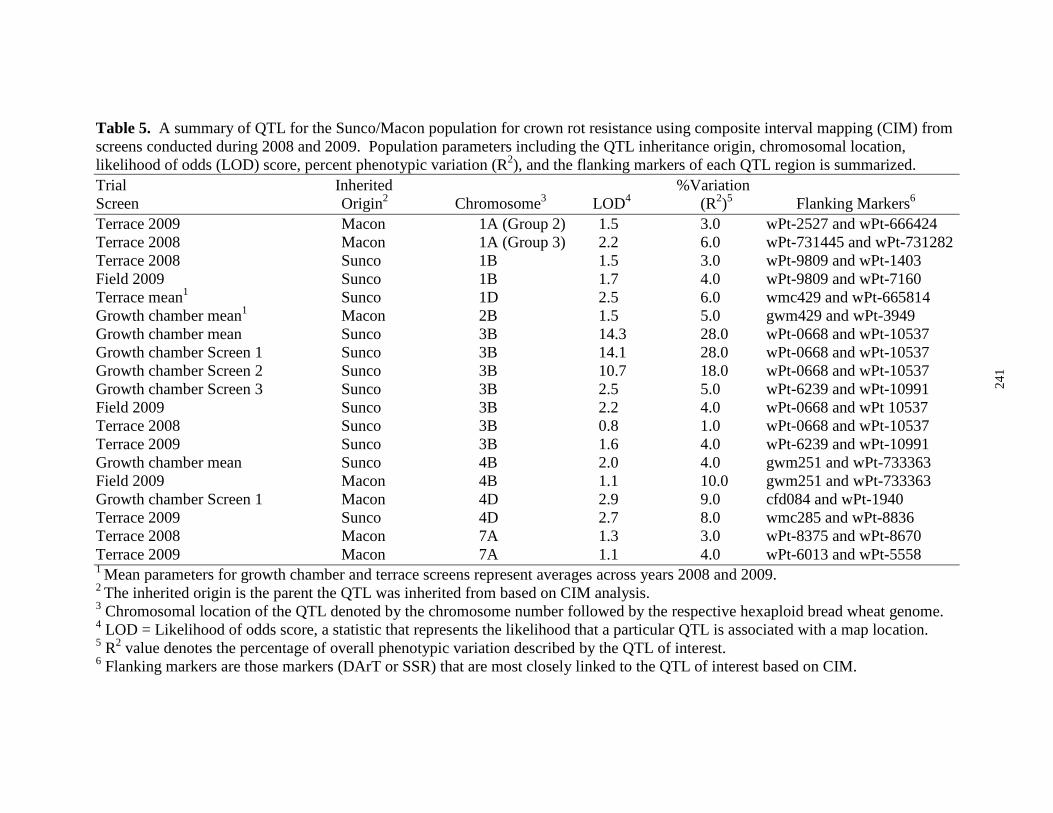
Table 5. A summary of QTL for the Sunco/Macon population for crown rot resistance using composite interval mapping (CIM) from
screens conducted during 2008 and 2009. Population parameters including the QTL inheritance origin, chromosomal location,
likelihood of odds (LOD) score, percent phenotypic variation (R2), and the flanking markers of each QTL region is summarized.
Trial Inherited %Variation
Screen Origin2 Chromosome
3 LOD
4 (R
2)5 Flanking Markers
6
Terrace 2009 Macon 1A (Group 2) 1.5 3.0 wPt-2527 and wPt-666424
Terrace 2008 Macon 1A (Group 3) 2.2 6.0 wPt-731445 and wPt-731282
Terrace 2008 Sunco 1B 1.5 3.0 wPt-9809 and wPt-1403
Field 2009 Sunco 1B 1.7 4.0 wPt-9809 and wPt-7160
Terrace mean1 Sunco 1D 2.5 6.0 wmc429 and wPt-665814
Growth chamber mean1 Macon 2B 1.5 5.0 gwm429 and wPt-3949
Growth chamber mean Sunco 3B 14.3 28.0 wPt-0668 and wPt-10537
Growth chamber Screen 1 Sunco 3B 14.1 28.0 wPt-0668 and wPt-10537
Growth chamber Screen 2 Sunco 3B 10.7 18.0 wPt-0668 and wPt-10537
Growth chamber Screen 3 Sunco 3B 2.5 5.0 wPt-6239 and wPt-10991
Field 2009 Sunco 3B 2.2 4.0 wPt-0668 and wPt 10537
Terrace 2008 Sunco 3B 0.8 1.0 wPt-0668 and wPt-10537
Terrace 2009 Sunco 3B 1.6 4.0 wPt-6239 and wPt-10991
Growth chamber mean Sunco 4B 2.0 4.0 gwm251 and wPt-733363
Field 2009 Macon 4B 1.1 10.0 gwm251 and wPt-733363
Growth chamber Screen 1 Macon 4D 2.9 9.0 cfd084 and wPt-1940
Terrace 2009 Sunco 4D 2.7 8.0 wmc285 and wPt-8836
Terrace 2008 Macon 7A 1.3 3.0 wPt-8375 and wPt-8670
Terrace 2009 Macon 7A 1.1 4.0 wPt-6013 and wPt-5558 1
Mean parameters for growth chamber and terrace screens represent averages across years 2008 and 2009. 2
The inherited origin is the parent the QTL was inherited from based on CIM analysis. 3 Chromosomal location of the QTL denoted by the chromosome number followed by the respective hexaploid bread wheat genome.
4 LOD = Likelihood of odds score, a statistic that represents the likelihood that a particular QTL is associated with a map location.
5 R
2 value denotes the percentage of overall phenotypic variation described by the QTL of interest.
6 Flanking markers are those markers (DArT or SSR) that are most closely linked to the QTL of interest based on CIM.
24
1

Table 6. A summary of QTL for the Sunco/Otis population for crown rot resistance using composite interval mapping (CIM) from
screens conducted during 2008 and 2009. Population parameters including the QTL inheritance origin, chromosomal location,
likelihood of odds (LOD) score, percent phenotypic variation (R2), and the flanking markers of each QTL region is summarized.
Trial Inherited %Variation
Screen Origin2 Chromosome
3 LOD
4 (R
2)5 Flanking Markers
6
Growth chamber Screen 2 Otis 1A 2.9 7.0 wPt-731445 and wPt-665379
Growth chamber mean1 Otis 1A 1.8 3.0 wPt-731445 and wPt-665379
Growth chamber Screen 2 Sunco 2A 2.7 9.0 wPt-9320 and wPt-6711
Growth chamber Screen 1 Sunco 2B 2.0 4.0 wPt-733641 and wPt-8916
Growth chamber mean1 Otis 3A 2.1 6.0 wPt-9422
Terrace 2009 Otis 3A 1.6 15.0 wPt-734079 and wPt-4859
Growth chamber Screen 1 Sunco 3B 10.0 23.0 gwm247 and wPt-0324
Growth chamber Screen 2 Sunco 3B 1.5 4.0 gwm247 and wPt-0324
Growth chamber mean1 Sunco 3B 8.8 20.0 gwm247 and wPt-0324
Field 2009 Otis 3B 2.6 8.0 wPt-7301 and wPt-672088
Growth chamber Screen 1 Otis 4A 3.0 6.0 wPt-0162 and wPt-800509
Growth chamber Screen 2 Otis 4A 2.2 8.0 wPt-3810 and wPt-671707
Growth chamber mean1 Otis 4A 1.4 3.0 wPt-0162 and wPt-800509
Terrace 2009 Otis 4B 3.2 7.0 wPt-1046 and wPt-732448
Growth chamber Screen 2 Otis 4B 2.7 7.0 wPt-1046 and wPt-732448
Terrace 2009 Otis 5B 2.3 6.0 wPt-0819 and wPt-5246
Terrace 2009 Otis 7A 5.1 20.0 wPt-3393 and wPt-3702
1
Mean parameters for growth chamber screens represent averages across years 2008 and 2009. 2
The inherited origin is the parent the QTL was inherited from based on CIM analysis. 3 Chromosomal location of the QTL denoted by the chromosome number followed by the respective hexaploid bread wheat genome.
4 LOD = Likelihood of odds score, a statistic that represents the likelihood that a particular QTL is associated with a map location.
5 R
2 value denotes the percentage of overall phenotypic variation described by the QTL of interest.
6 Flanking markers are those markers (DArT or SSR) that are most closely linked to the QTL of interest based on CIM.
24
2

243
25
6
25
9
Figure 1. Frequency distribution of crown rot severity ratings (0 to 10; 10 = severe
disease) based on a mean of the three growth chamber screens for the Sunco/Macon
population.
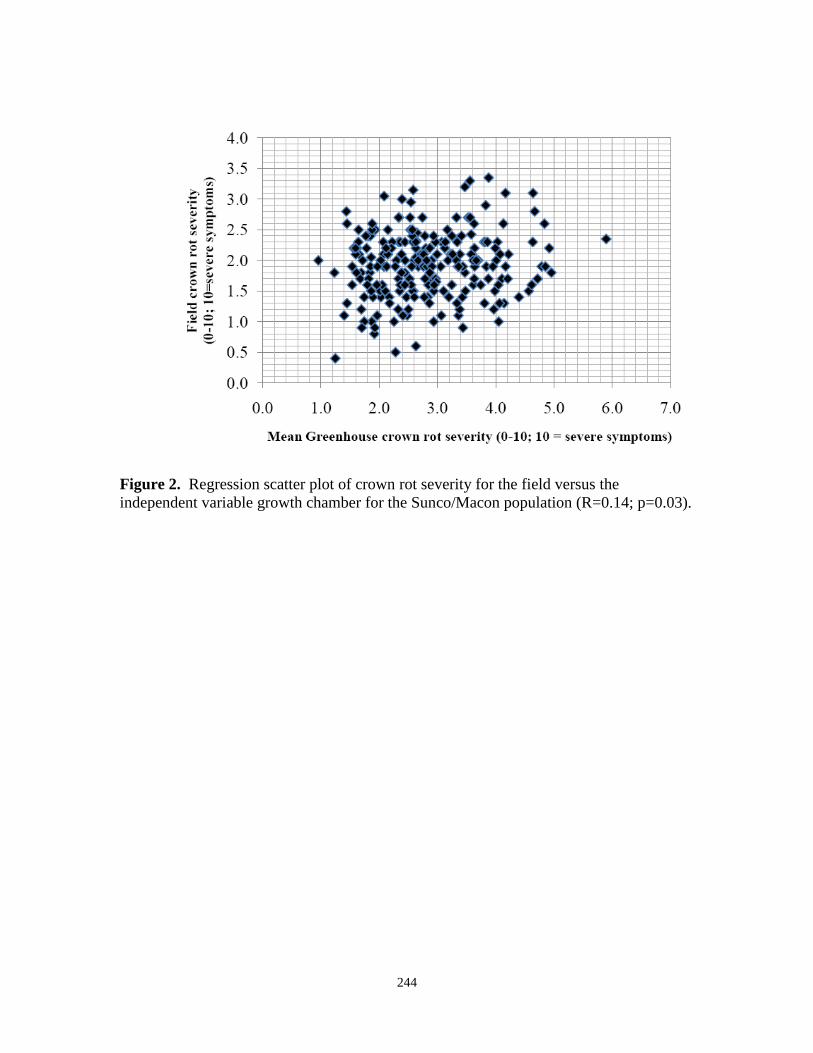
244
Figure 2. Regression scatter plot of crown rot severity for the field versus the
independent variable growth chamber for the Sunco/Macon population (R=0.14; p=0.03).

245
25
8
25
9
Figure 3. Frequency distribution of crown rot severity ratings (0 to 10; 10 = severe
disease) based on a mean of the three growth chamber screens for the Sunco/Otis
population.
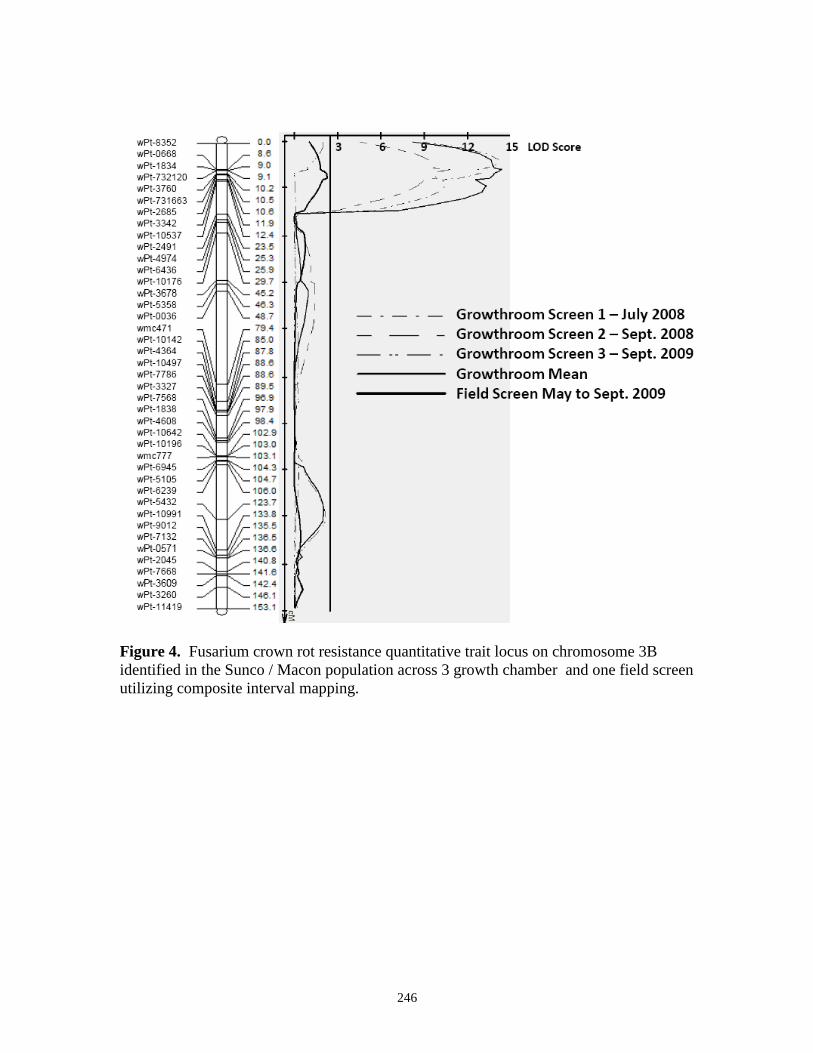
246
25
9
25
9
Figure 4. Fusarium crown rot resistance quantitative trait locus on chromosome 3B
identified in the Sunco / Macon population across 3 growth chamber and one field screen
utilizing composite interval mapping.

247
24
6
25
9
Figure 5. Two crown rot resistance quantitative trait loci on chromosome 3B identified
in the Sunco/Otis population across two growth chamber (inherited from Sunco) and one
field screen (inherited from Otis) utilizing composite interval mapping.

248
CHAPTER 6

249
24
6
25
9
CHAPTER 6
SUMMARY OF FINDINGS AND CONCLUSIONS
Crown rot is a disease of world wide distribution and importance. Prior to this
research crown rot had been identified and surveyed throughout the PNW region with an
average yield loss to wheat of 9% reported (Cook 1968; Smiley et al. 2005). The causal
fungi (Fusarium spp.) are so widespread because they are able to overwinter in dryland
wheat residue as fungal hyphae and thick walled chlamydospores in wheat stubble
residue throughout the dryland fallow period of production common to the wheat
producing areas of the PNW region. Although growers are aware of the disease,
especially in drought areas where the disease persists (i.e. white heads during grain
ripening), previous control measures have focused on adjusting cultural practices
including planting date and controlling nitrogen fertility to maintain plant vigor and
prevent moisture stress during grain filling. Plant host resistance seems to be the most
reliable and effective control measure for a disease such as crown rot with such a wide-
spread distribution and occurrence.
Smiley and Patterson (1996) conducted field surveys (288 fields from 19
counties) during 1993 and 1994 and began to document the wide-spread distribution of
crown rot in the PNW region. They found that F. pseudograminearum and F. culmorum
were the most dominant pathogens associated with crown rot symptoms. Following these
results there was a need to survey an expanded region to encompass additional climatic
areas to better compare and characterize the geographic distribution of crown rot in the
region.

250
Intensive surveys were conducted during 2008 and 2009 covering 210 dryland
and irrigated spring and winter wheat fields in 13 Washington and 5 northern Oregon
counties. Fusarium spp. were isolated from 99% and 97% of the fields surveyed in 2008
and 2009, respectively. Crown rot symptoms were reported in every field in both years
with a crown rot severity rating (0 to 10 scale) ranging from 0.2 to 5.1 in 2008 and 0.5 to
5.4 in 2009. F. culmorum and F. pseudograminearum were the two fungal species
isolated most frequently from symptomatic stem tissue at proportions of 31% and 30%,
respectively, averaged over both survey years. Other minor species isolated from infected
stems, included F. crookwellense, F. acuminatum, F. equisiti, and Bipolaris sorokiniana
at 13%, 1%, 1%, and 2%, respectively.
These results agree with that of Smiley and Patterson (1996) and other surveys in
the PNW and the world showing the wide-spread distribution of crown rot symptoms and
the association of the species F. pseudograminearum and F. culmorum with disease
occurrence. In addition to these two main species causing crown rot, F. crookwellense
was isolated from 13% of the fields surveyed over both years according to conidia
morphology outlined by Lesley et al. (2006). Pending confirmation of these
morphological identifications with conventional PCR primers, as this finding would be
the first report of F. crookwellense in the PNW.
Burgess et al. (2001) reported that F. crookwellense is often isolated regularly in
association with crown rot in Australia. Others have reported isolating F. crookwellense
from crown rot surveys in Turkey and Australia (Tunali et al. 2006; Bentley et al. 2006).
In a genetic characterization of F. pseudograminearum isolates using AFLPs and
sequence data for F. crookwellense isolates from Australia, Bentley et al. (2006) reported

251
24
6
25
9
that several F. crookwellense isolates were misidentified as F. pseudograminearum based
on conidia morphologically. In comparative studies in Australia on durum wheat, F.
crookwellense was reported to have caused more severe symptoms than F.
pseudograminearum. Lesley et al. (2006) reported that conidia morphology of F.
crookwellense also resembles that of F. culmorum. Although there is a potential that this
species could exist in the PNW region as it was identified in equal proportions across
both survey years (12% and 13% in 2008 and 2009, respectively) and play a minor role in
the crown rot complex, the conidia morphological identifications in this study need to be
confirmed with conventional PCR primers (CRO-C) designed to amplify F.
crookwellense.
The occurrence of crown rot and the two main causal Fusarium spp. was
significantly different between agronomic zones of the PNW (Douglas et al. 1990).
Regions 1 and 4, characterized by cool winters with sufficient winter moisture and
relatively dry summers had significantly less crown rot severity on the stems and a
greater frequency of F. culmorum isolations. Region 5 characterized as predominantly
summer-fallow transition zones, had significantly greater levels of crown rot severity and
a greater frequency of F. pseudograminearum isolations according to t-tests in the current
study. Regions 2 and 6, characterized by high moisture and irrigation, respectively, had
greater proportions of both species isolated within a field. Backhouse et al. (2004)
reported the association between the occurrence of F. culmorum with cooler areas
receiving more precipitation (>500 mm). Sitton and Cook (1981) reported that F.
pseudograminearum occurred in drier and warmer counties (temperatures at 31 oC) in
Washington state. Smiley and Patterson (1996) suggested similar correlations. Findings

252
24
6
25
9
of the current study suggest that F. culmorum may persist in cooler wetter regions
whereas F. pseudograminearum may persist in hotter and drier regions. However,
further study is needed with the appropriate experimental design to further characterize
the occurrence of causal Fusarium spp. of crown rot within certain climatic zones in the
PNW.
Another association of interest for future research would be the occurrence and
location of crown rot symptoms. Cook (1968), Strausbaugh et al. (2004), and others
suggest that F. culmorum causes symptoms and is associated with colonization on the
roots whereas F. pseudograminearum causes symptoms and is more associated with the
crown and subsequent internodes. The average number of symptomatic nodes in this
study was 1.3, suggesting that crown rot symptoms persisted within the first internode.
F. culmorum and F. pseudograminearum were equally isolated from a 2 cm section of the
first internode region in nearly equal proportions over the course of the two year survey.
In analyzing the climatic region results it appeared that where F. culmorum isolations
were most frequent, crown rot severity symptoms on the stems were less. On the
contrary, where F. pseudograminearum isolations were most frequent, crown rot severity
symptoms on the stems were greater. The infection area, symptom development, and
activity of these two fungal species in the crown rot complex need further research. Cook
(1968) reported that F. culmorum “enters crowns of cereal plants via infected crown root
and wounds made by crown root emergence 4-6 weeks after planting”. Q-PCR
techniques could be utilized to further localize infection points for these two fungi to
confirm root infections with F. culmorum versus stem infections with F.
pseudograminearum.

253
24
6
25
9
The advent of Q-PCR technology and PCR-based primers that are species-specific
has allowed for quick and efficient identification and quantification of the fungi which
cause crown rot. Morphological identifications are tedious and require mycological
expertise to isolate pathogenic fungi into culture and to identify conidial morphology.
Prior to this study there was a single report of the use of Q-PCR technology with Taq-
Man based primers to quantify and identify Fusarium spp. causing crown rot. The
method utilized a DNA extraction kit (FastDNA) where the extraction protocol was
modified. In the current study we used this method to attempt to extract and amplify
target pathogenic Fusarium spp. utilizing species-specific primers. The final objective of
this research was to successfully quantify plant DNA extract from infected wheat stems
from the 2008 Fusarium survey and evaluate the correlation of DNA concentrations to
visual crown rot severity ratings. Preliminary attempts to use the FastDNA kit (designed
for extracting plant DNA) to extract and amplify pathogen DNA from wheat stems
infected with crown rot from the 2008 Fusarium survey were not successful. Later, it
was discovered that several inhibitors (phenolic compounds) exist in wheat stems that
limit Q-PCR amplification which are not removed by the FastDNA extraction kit.
Hogg et al. (2007) modified the extraction protocol with dilutions and an extra
step utilizing a SpeedVac to vacuum dry samples at the binding matrix stage to remove
residual ethanol that could inhibit Q-PCR amplification. These modifications were
attempted in extracting DNA from survey wheat stems infected with crown rot and were
not successful. The Ultra Clean Soil DNA kit manufactured by Mo-Bio produced the
most consistent DNA extractions and subsequent Q-PCR amplifications in eight DNA
extraction optimization experiments.

254
24
6
25
9
To correlate DNA concentrations from infected stems to crown rot severity scores
an experiment was conducted with 24 stems from 8 rating categories and 3 replicate
samples within each rating category. DNA extractions were performed on 3 cm sections
of single stems. Results showed 7 positive amplifications with the FPG primer set that
were positively correlated to crown rot severity ratings of 0 to 10 (R2=0.61). Another
experiment was conducted to further examine this correlation by pooling infected stems
from 3 randomly selected samples within 48 fields, for a total of 144 DNA extractions
with the Mo-Bio kit. Results showed 49% amplification with the FPG primer set and
21% amplification with the OPT primer set. Although there were 16 amplifications with
both primer sets from the same extracted sample, the amplifications were weakly
(negatively) associated (r=-0.14) suggesting that one species dominated over another
within a stem. DNA concentrations amplified with either primer set (FPG or OPT) were
not correlated to crown rot severity ratings in this study for. Results showed substantial
variation in species occurrence within a field and sample. These studies did not show a
strong association between morphological identification and Q-PCR species
amplification from separate stems within a field sample.
Although Hogg et al. (2007) was the first to report strong correlations between
DNA concentration from Q-PCR and visual crown rot disease severity rating scores, their
experiments were conducted under inoculated conditions in the field. Smiley et al.
(2005) reported yield loss as high as 61% under inoculated field conditions. Strausbaugh
et al. (2005) reported an association between disease severity root ratings and DNA
concentrations under inoculated greenhouse conditions but also reported the difficulty in
finding significant correlations between visual crown rot severity ratings and DNA

255
24
6
25
9
concentrations from naturally occurring inoculum in the field. It is important to note that
the current study isolated DNA from non-inoculated naturally infected wheat stems from
a survey of random fields. Hogg et al. (2010) reported that DNA concentrations in
naturally occurring field soils were 0.4% that of inoculated field soil.
Currently, the use conventional PCR techniques to diagnose and identify field
samples to the species level would suffice for genetic identification of samples. The
ability to quantify and correlated DNA concentrations with visual ratings with Q-PCR
techniques would be beneficial in studies depending on accurate disease quantification,
such as those required for QTL analysis. Future research on the use of Q-PCR to
quantify disease expression should focus on the isolation and extraction of pathogenic
fungal DNA from crown rot infected wheat stems from inoculated and non-inoculated
naturally occurring field and greenhouse trials for the advancement of the use of Q-PCR
as a diagnostic tool. Further research could also include a comparison between fungal
isolation and subsequent morphological identification with Q-PCR fungal DNA
amplification.
Additional research could be done to develop Fusarium spp. specific primers
sequenced from local PNW isolates to ensure more accurate Q-PCR amplification of
local isolates as was conducted by Schroeder et al. (2006) for Pythium spp. Regardless of
the potential limitations, results from the current studies with Q-PCR optimized the
methods of extracting pathogen DNA from crown rot infected wheat stems for
diagnosing Fusarium crown rot in the field. Two other objectives of this research
focused on quantifying host plant resistance QTL to aid in marker assisted selection for
Fusarium crown rot.

256
Cook (2001) stated that the most effective means for control of many wide-spread
soil-borne pathogens is host plant resistance. Research began in Australia in the 1960‟s
to find plant host resistance in wheat. Eventually resistant cultivars were released in the
1980‟s, including Sunco the resistant used in the current study. The cultivars currently
grown on a wide-spread scale in the PNW region do not show significant levels of
resistance to the disease. Recently efforts have been made in the local PNW region to
begin introgressing crown rot resistance into PNW cultivars. Recent advances in
molecular biology have allowed for the use of microsatellite SSR markers to function as a
tool to aid in selection for traits such as Fusarium crown rot resistance. The first step in
identifying molecular markers linked to disease resistance is to identify QTL, or the
genomic DNA region where the trait of interest (i.e. disease resistance is to lie).
In this study two RIL mapping populations (Sunco/Macon and Sunco/Otis) were
developed at Washington State University in cooperation with Oregon State University.
Prior to screening the mapping populations for resistance to Fusarium crown rot to map
subsequent QTL there needed to be effective and efficient screening systems developed
in the greenhouse and outdoor terrace growing systems to quantify seedling and adult
plant resistance. The seedling screening system is done in a relatively short period of
time and requiring efficient inoculation and disease infection to adequately quantify
disease severity for QTL mapping. Several greenhouse inoculation trials were conducted
during 2007, 2008, and 2009 to evaluate the virulence of local PNW isolates on the
parents (Sunco, Macon, and Otis) and partially resistant (2-49) and susceptible checks
(Seri) as well as different inoculation methods. PNW Isolate 2 (006-13) collected near
Durfur, OR. was selected as the most consistently virulent isolate across optimization

257
24
6
25
9
experiments to screen the RIL mapping populations. The parents were significantly
different from each other in crown rot susceptibility, where Macon was more susceptible
than Sunco in initial screens.
Several methods of inoculation for use in the greenhouse were evaluated
including dipping seedlings in a conidial suspension (seedling dip method), placing a
droplet of conidial suspension on the plants (stem droplet method), placing a conidial
agar based solution in a plastic straw around the base of the seedling (agar straw method),
and placing colonized millet under the soil 4 days after emergence (colonized grain millet
method). The most consistent and efficient method of inoculation that logically separated
the partially resistant and moderately susceptible parents with the most reasonable CV
was the colonized grain millet inoculation method.
The colonized grain millet method was used to screen both RIL mapping
populations in the greenhouse and terrace during 2008 and 2009. During 2009 an
additional field trial location was placed in Douglas County that utilized the seed dip
method of inoculation in a conidial suspension of 2.5 x 10⁵ conidia per mL. There were
significant differences between genotypes within each mapping population for crown rot
severity with PNW Isolate 2 (006-13). Differences were more pronounced in crown rot
severity between the parents Sunco and Macon in seedling screens compared to Sunco
and Otis.
Plant genomic DNA was extracted from the parents and both RIL mapping
populations. A genetic linkage map was developed for the Sunco / Otis RIL population
using 354 DArT and 30 microsatellite SSR polymorphic markers while the genetic
linkage map for Sunco / Macon RIL population was developed with 328 DArT and 18
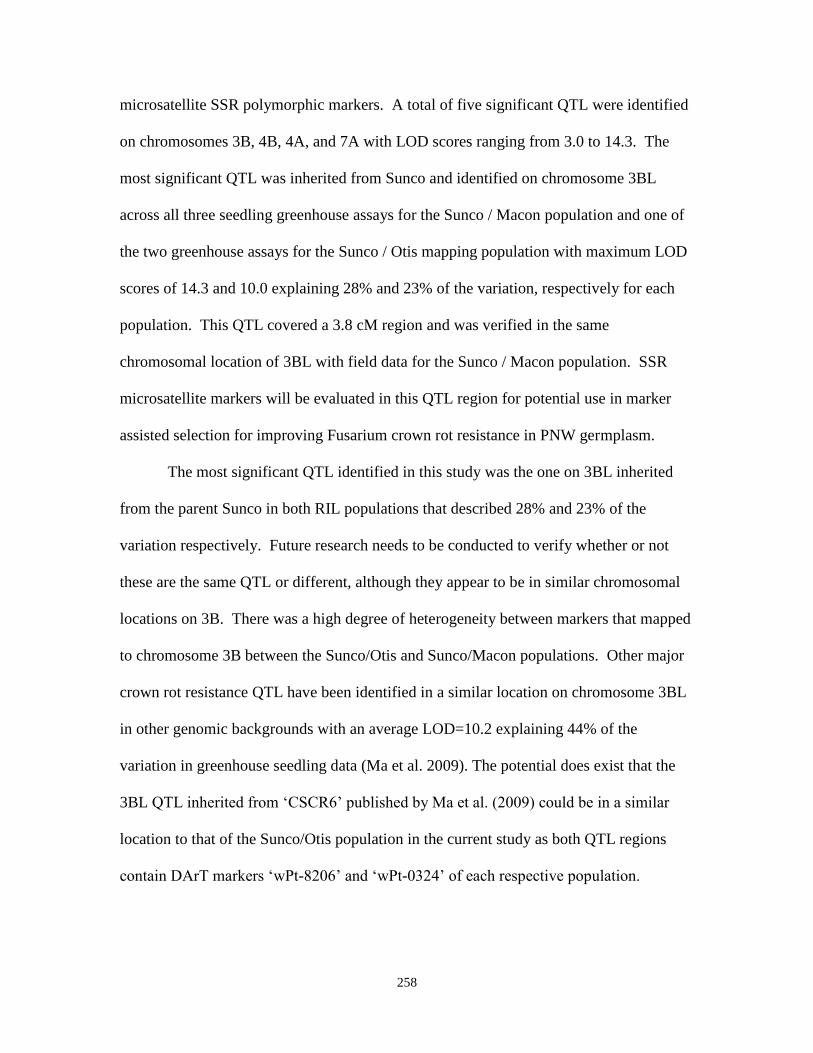
258
24
6
25
9
microsatellite SSR polymorphic markers. A total of five significant QTL were identified
on chromosomes 3B, 4B, 4A, and 7A with LOD scores ranging from 3.0 to 14.3. The
most significant QTL was inherited from Sunco and identified on chromosome 3BL
across all three seedling greenhouse assays for the Sunco / Macon population and one of
the two greenhouse assays for the Sunco / Otis mapping population with maximum LOD
scores of 14.3 and 10.0 explaining 28% and 23% of the variation, respectively for each
population. This QTL covered a 3.8 cM region and was verified in the same
chromosomal location of 3BL with field data for the Sunco / Macon population. SSR
microsatellite markers will be evaluated in this QTL region for potential use in marker
assisted selection for improving Fusarium crown rot resistance in PNW germplasm.
The most significant QTL identified in this study was the one on 3BL inherited
from the parent Sunco in both RIL populations that described 28% and 23% of the
variation respectively. Future research needs to be conducted to verify whether or not
these are the same QTL or different, although they appear to be in similar chromosomal
locations on 3B. There was a high degree of heterogeneity between markers that mapped
to chromosome 3B between the Sunco/Otis and Sunco/Macon populations. Other major
crown rot resistance QTL have been identified in a similar location on chromosome 3BL
in other genomic backgrounds with an average LOD=10.2 explaining 44% of the
variation in greenhouse seedling data (Ma et al. 2009). The potential does exist that the
3BL QTL inherited from „CSCR6‟ published by Ma et al. (2009) could be in a similar
location to that of the Sunco/Otis population in the current study as both QTL regions
contain DArT markers „wPt-8206‟ and „wPt-0324‟ of each respective population.

259
Future research in the area of plant host resistance as it pertains to Fusarium
crown rot in the PNW region should focus on; 1.) finding SSR markers in the 3BL QTL
region of Sunco/Macon and Sunco/Otis to be used as potential markers in MAS; 2.)
screening recent Fusarium survey isolates from 2008 and 2009 for virulence on current
mapping population parents and resistant checks. With the confirmation of the 3BL QTL
in the field data from Douglas County, field screening at various locations should be
explored as an option for screening mapping populations in addition to growth chamber
and the outdoor terrace systems.
From the results of this study and others it appears that seedling greenhouse
screens still serve as the quickest and most reliable screening method for quantifying
crown rot resistance. However, in my opinion this would not negate the need for mature
plant field screening systems to verify seedling greenhouse evaluations. The outdoor
terrace data returned few significant QTL. This could have been due to a high degree of
variation within the terrace plots. The terrace system needs to be optimized to reduce
variation by utilizing sub-irrigation in the bed earlier in the season. Also different levels
of millet grain inoculum could be explored to find an optimal level of inoculation in the
outdoor terrace system.
It appears that the colonized millet grain inoculation method returns the best
results for the parents Sunco, Macon, and Otis. However, if future parents carrying
crown rot resistance are considered for crossing they should be evaluated with the
inoculation methods outlined herein this research as cultivars can respond differentially
to different inoculation methods, especially if they are going to be used for QTL
mapping. From this research the seedling dip method was the quickest most efficient
260
24
6
25
9
method of inoculation for cultivars carrying a higher degree of resistance, such as 2-49,
but caused too much disease to differentiate reactions on the moderately resistant cultivar
Sunco. Those are the considerations for future crown rot resistance screening systems.
LITERATURE CITED
Backhouse, D., Abubakar, A.A., Burgess, L.W., Dennis, J.I., Hollaway, G.J.,
Wildermuth, G.B., Wallwork, H., and Henry, F.J. 2004. Survey of Fusarium
species associated with crown rot of wheat and barley in eastern Australia.
Aust. Plant Path. 33:255-261.
Bentley, A.R., Cromey, M.G., Farrokhi-Nejad, R., Leslie, J.F., Summerell, B.A., and
Burgess, L.W. 2006. Fusarium crown and root rot pathogens associated with
wheat and grass stem bases on the South Island of New Zealand. Aust. Plant
Path. 35:495-502.
Burgess, L.W., Backhouse, D., Summerell, B.A., and Swan, L.J. 2001. Chapter 20 in
Fusarium – Chapter Title: Crown rot of wheat. Paul E Nelson Memorial
Symposium. Edited by Summerell, B.A., Leslie, J.F., Backhouse, D., Bryden,
W.L., Burgess, L.W. APS Press, the American Phytopathological Society, St.
Paul, MN.
Cook, R.J. 1968. Fusarium root and foot rot of cereals in the Pacific Northwest.
Phytopathology 58:127-131.
Cook, R.J. 2001. Management of wheat and barley root diseases in modern farming
systems. Australas. Plant Pathology 30:119-126.

261
24
6
25
9
Douglas, C.L., Wysocki, D.J., Zuzel, J.F, Rickman, R.W., and Klepper, B.L. 1990.
Agronomic zones for the dryland Pacific Northwest. A Pacific Northwest
Extension Publication. PNW No. 354: 1-8.
Hogg, A. C., Johnston, R.H, and Dyer A.T. 2007. Applying real-time quantitative PCR
to Fusarium crown rot of wheat. Plant Dis. 91:1021-1028.
Hogg, A.C., Johnston, R.H., Johnston, J.A., Klouser, L., Kephart, K.D., and Dyer, A.T.
2010. Monitoring Fusarium crown rot populations in spring wheat residues using
quantitative real-time polymerase chain reaction. Phytopathology 100:49-57.
Lesley, J.F., Summerell, B.A., Bullock, S. 2006. The Fusarium laboratory manual.
Blackwell pub. Ames, Iowa. p. 1-388.
Ma, J., Li, H., Zhang, C., Yang, X., Liu, Y., Yan, G., and Liu, C. 2009. Identification
and validation of a major QTL conferring crown rot resistance in hexaploid
wheat. Theor. Appl. Genet. 6:1119-1128. (doi:10.1007/s00122-009-1239-3).
Schroeder, K.L., Okubara, P.A., Tambong, J.T., Lévesque, C.A., and Paulitz, T.C. 2006.
Identification and quantification of pathogenic Pythium spp. from soils in eastern
Washington using real-time polymerase chain reaction. Phytopathology 96:637-
647.
Sitton, J.W. and Cook, R.J. 1981. Comparative morphology and survival of
chlamydospores of Fusarium roseum „Culmorum‟ and „Graminearum‟.
Phytopathology 71:85-90.
Smiley, R.W. and Patterson, L.M. 1996. Pathogenic fungi associated with Fusarium foot
rot of winter wheat in the semiarid Pacific Northwest USA. Plant Dis. 80:944-
949.
262
Smiley, R.W., Gourlie, J. A., Easley, S. A., Patterson, L.-M., and Whittaker, R.G.
2005. Crop damage estimates for crown rot of wheat and barley in the Pacific
Northwest. Plant Dis. 89:595-604.
Strausbaugh, C.A., Bradley, C.A., Koehn, A.C., and Forster, R.L. 2004. Survey of root
disease of wheat and barley in southeastern Idaho. Can. J. Plant Pathol. 26:167-176.
Strausbaugh, C.A., Overturf, K., and Koehn, A.C. 2005. Pathogenicity and real-time
PCR detection of Fusarium spp. in wheat and barley roots. Can. J. Plant Pathol.
27:430-438.
Tunali, B., Nicol, J., Yelda Erol, F., and Altiparmak, G. 2006. Pathogenicity of Turkish
crown and head scab isolates on stem bases on winter wheat under greenhouse
conditions. Plant Path. J. 5:143-149.
26
1
26
0