Effect of Artemisia annua and Artemisia afra tea infusions ...
1
Characterization of Flavonoids from Artemisia annua
A Major Qualifying Project Report
Submitted to the Faculty of
WORCESTER POLYTECHNIC INSTITUTE
in partial fulfillment of the requirements
for the Degree of Bachelor of Science
By
____________________________________________
Megan Barriga
April 25, 2013
Approved:
____________________________________________
Dr. Pamela J. Weathers, Advisor
2
Table of Contents Table of Contents .......................................................................................................................... 2
Table of Figures ............................................................................................................................. 4
Table of Tables .............................................................................................................................. 5
Acknowledgements ........................................................................................................................ 6
Abstract .......................................................................................................................................... 7
1.0 Introduction ............................................................................................................................. 8
2.0 Background .............................................................................................................................. 9 2.1 Malaria ............................................................................................................................................... 9
2.1.1 Life Cycle of Malaria Parasite ...................................................................................................... 9 2.1.2 Statistics and Groups Most Affected .......................................................................................... 10 2.1.3 Taking Action against Malaria ................................................................................................... 10
2.2 Artemisia annua ............................................................................................................................... 11 2.3 Artemisinin ....................................................................................................................................... 12
2.3.1 History of Artemisinin and its Medicinal Uses .......................................................................... 13 2.4 Resistance to Antimalarials ............................................................................................................ 14 2.5 Implementation of ACT .................................................................................................................. 15 2.6 Poverty and the Challenges in Treating Malaria ......................................................................... 16 2.7 Implications and Synergistic Effects of Flavonoids when Combined with Artemisinin ........... 17
2.7.1 Administration of Artemisinin and Flavonoids .......................................................................... 19 2.8 Flavonoids ........................................................................................................................................ 20
2.8.1 History of Flavonoids ................................................................................................................. 20 2.8.2 Overview of Flavonoids ............................................................................................................. 21 2.8.3 Classification of Flavonoids ....................................................................................................... 22 2.8.4 Generic Structure of Flavonoids and the Three of Interest to This Project ................................ 23 2.8.5 Nomenclature of Flavonoids ...................................................................................................... 24 2.8.6 Biosynthesis of Flavonols and Flavones .................................................................................... 25 2.8.7 Previous Methods of Extraction and Isolation of Flavonoids .................................................... 25
2.8.7.1 Extraction and Isolation of Chrysosplenol-D (CRYD) ....................................................................... 26 2.8.7.2 Extraction and Isolation of Cirsilineol (CRS) ..................................................................................... 27 2.8.7.3 Extraction and Isolation of Chrysoplenetin (CRY) ............................................................................. 28 2.8.7.4 Roberts et al. (1980) ............................................................................................................................ 28 2.8.7.5 Marco et al. (1988) .............................................................................................................................. 28 2.8.7.6 Liu et al. (1992) ................................................................................................................................... 30 2.8.7.7 Shilin et al. (1989) ............................................................................................................................... 30 2.8.7.8 Saleh et al. (1987) ............................................................................................................................... 31 2.8.7.9 Greenham et al. (2003) ........................................................................................................................ 32
2.8.8 Previous NMR Analyses of Flavonoids ..................................................................................... 32
4.0 Objectives ............................................................................................................................... 35
5.0 Methods .................................................................................................................................. 36
3
5.1 Preliminary Extraction and TLC Experiments ............................................................................ 36 5.1.1 CH2Cl2 as the Extraction Solvent ............................................................................................... 37 5.1.2 Extraction of Dried SAM Whole Plant Material (February 2010 Lab Harvest) using Hexanes, Et2O, and EtOAc .................................................................................................................................. 38 5.1.3 Extraction of Fresh SAM Shoot Tips ......................................................................................... 40 5.1.4 TLC and GC/MS Analysis of SAM Tip vs. CAS, K, and ART in 2:1, Toluene-EtOAc ........... 40
5.2 Detection of CRYD in SAM Tip through TLC Analysis ............................................................. 41 5.2.1 TLC of SAM Tip to Compare Rf of CAS, ART, and Q in Solvent Systems Reported by Roberts et al. (1980) .......................................................................................................................................... 41 5.2.2 TLC of SAM Tip to Compare to Rf of CAS, ART, and Q in TLC Conditions other than Those Reported by Roberts et al. (1980) ....................................................................................................... 42
5.3 Detection of CRS in SAM Tip through TLC Analysis ................................................................. 42 5.3.1 TLC of SAM Tip Extract to Compare to Rf of CAS and Q using the TLC Conditions Reported by Voirin et al. (1999) and Grayer et al. (1996) .................................................................................. 42 5.3.2 TLC of SAM Tip Extract to Compare to Rf of CAS, Q, ART and AN using the TLC Conditions Reported by Saleh et al. (1987) and Various TLC Visualization Reagents ..................... 43
5.4 Development of Acquired Standards CRY and CRYD on Silica Gel in (36:9:5) Benzene-Pyridine-Formic Acid (Saleh et al., 1987) ............................................................................................ 43 5.5 TLC Analysis and Visualization of AN and AT, as Compared to SAM Tip Extract ................ 44 5.6 TLC Analysis and Visualization of Fresh SAM Leaves Extract vs. Fresh SAM Tip Extract .. 44 5.7 NMR Analyses of Crude SAM Shoot Tip Extract, CRY, CRYD, and CAS .............................. 45
6.0 Results .................................................................................................................................... 46 6.1 Crude Extraction of Flavonoids from Plant Material .................................................................. 46 6.2 Identification of Spots 1-5 from SAM tip Extract using GC/MS ................................................ 48 6.3 TLC Conditions for Separation of Artemisia annua Compounds in Attempt to Quantify CRYD and CRS ..................................................................................................................................... 49 6.4 Possible Interactions between Flavonoids from the Crude Fresh SAM Tip Extract ................ 65 6.5 NMR analysis of Crude Plant Extract (Fresh SAM Tip), CAS, CRY, and CRYD ................... 65 6.6 Staining TLC Plates for Analysis of Flavonoids and Terpenoids in SAM Tip Extracts .......... 68 6.7 Fresh SAM Leaf Extract vs. Fresh SAM Tip Extract .................................................................. 74 6.8 TLC Analysis of CRY and CRYD ................................................................................................. 77
7.0 Discussion ............................................................................................................................... 78
References: ................................................................................................................................... 80
Appendix I .................................................................................................................................... 85 Synonyms of chrysoplenetin, chrysosplenol-D, and cirsilineol ......................................................... 85
Appendix II .................................................................................................................................. 86 Other TLC Data ..................................................................................................................................... 86
Appendix III ................................................................................................................................. 87 Preparation of TLC visualization reagents ......................................................................................... 87
Appendix IV ................................................................................................................................. 88 1H and 13C NMR spectra of plant extract, CAS, CRY, and CRYD .................................................. 88
4
Table of Figures FIG. 1. CHEMICAL STRUCTURE OF ARTEMISININ AND ARTEMISITENE. ........................................................................................... 12 FIG. 2. ARTEMISININ AND ITS SEMI-‐SYNTHETIC DERIVATIVES. .................................................................................................... 14 FIG. 3. ARTEMISININ AND FLAVONOIDS OF INTEREST. .............................................................................................................. 17 FIG. 4. GENERIC STRUCTURE OF FLAVONOIDS. ........................................................................................................................ 21 FIG. 5. SUBCLASSES OF FLAVONOIDS BASED ON THEIR STRUCTURAL VARIATIONS. .......................................................................... 23 FIG. 6. STRUCTURES OF CHRYSOPLENETIN, CIRSILINEOL, AND CHRYSOSPLENOL-‐D. ......................................................................... 24 FIG. 7. BIOSYNTHETIC PATHWAY OF FLAVONOLS AND FLAVONES. THE FOLLOWING ABBREVIATIONS FOR THE ENZYMES ARE GIVEN:
FLAVANONE 3’ HYDROXYLASE (F3H), FLAVONOL SYNTHASE (FLS), AND FLAVONE SYNTHASE ISOFORMS (FSI AND FSII) (WINKEL-‐SHIRLEY, 2001). ..................................................................................................................................................... 26
FIG. 8. EXAMPLE OF FRESH SAM SHOOT TIP EXTRACTED. ......................................................................................................... 40 FIG. 9. COMPARISON OF THREE SUCCESSIVE CH2CL2 (10-‐30 ML) EXTRACTIONS OF 0.1 G FLV5 (L1-‐L3) AND A THIRD SUCCESSIVE
EXTRACTION (30 ML) OF 0.5 G FLV5. ......................................................................................................................... 47 FIG. 10. COMPARISON OF SUCCESSIVE EXTRACTION OF SAM TIP WITH HEXANES, ET2O, AND ETOAC, FOLLOWED BY CH2CL2. .............. 47 FIG. 11A & B. TLC OF SAM TIP EXTRACT VS. CAS, K, AND ART. ............................................................................................. 48 FIG. 12. SPOT 1 GC/MS SPECTRUM ................................................................................................................................... 50 FIG. 13. SPOT 2 GC/MS SPECTRUM ................................................................................................................................... 51 FIG. 14. SPOT 3 GC/MS SPECTRUM ................................................................................................................................... 52 FIG. 15. SPOT 4 GC/MS SPECTRUM ................................................................................................................................... 53 FIG. 16. SPOT 5 GC/MS SPECTRUM ................................................................................................................................... 54 FIG. 17. COMPARISON OF 1 µL (1.15 MG RESIDUE), 2 µL (2.3 G), AND 3 µL (3.4 G) SAM TIP EXTRACT AND 5 µG ART. ................... 55 FIG. 18. SECOND DIMENSION OF 2-‐D TLC EXPERIMENT: 230 µG SAM TIP EXTRACT + 2.5 µG ART VS. 2 µG ART. ............................ 56 FIG. 19. CAS, SAM TIP EXTRACT, AND ART IN 15 % HOAC. .................................................................................................. 57 FIG. 20. PREP TLC OF SAM TIP EXTRACT IN 15 % HOAC. ....................................................................................................... 57 FIG. 21A-‐D. CAS AND ART IN 3:1:1,T-‐BUOH-‐HOAC-‐H2O (A), 15 % HOAC (B) 1:2, TOLUENE-‐ACN (C), AND 3:1:1:5, T-BUOH-
HOAC-H2O-ET2O (D). ....................................................................................................................................... 59 FIG. 25. Q VS. SAM TIP EXTRACT IN 1:1:3, ACN-‐HOAC-‐H2O. ................................................................................................ 60 FIG. 24. SAM TIP EXTRACT, CAS, AND Q IN 1:4, ACN-‐CH2CL2 ON SILICA GEL, CELLULOSE, AND POLYAMIDE TLC PLATES, RESPECTIVELY. 61 FIG. 22. SAM TIP EXTRACT, CAS, AND Q IN 2:1, TOLUENE-‐ETOAC ON SILICA GEL, CELLULOSE, AND POLYAMIDE TLC PLATES,
RESPECTIVELY. ........................................................................................................................................................ 61 FIG. 23. SAM TIP EXTRACT, CAS, AND Q IN 3:1:1, T-‐BUOH-‐HOAC-‐H2O ON SILICA GEL, CELLULOSE, AND POLYAMIDE TLC PLATES,
RESPECTIVELY. ........................................................................................................................................................ 61 FIG. 27. CAS AND Q VS. SAM TIP EXTRACT IN 5 % MEOH IN CHCL3. ....................................................................................... 62 FIG. 26. CAS AND Q VS. SAM TIP EXTRACT IN 4:6, HOAC-‐H2O. ............................................................................................. 62 FIG. 30. TWO TRIALS OF CAS AND Q VS. SAM TIP EXTRACT ON SILICA GEL WITH 36:9:5, BENZENE-‐PYRIDINE-‐FORMIC ACID. ................ 64 FIG. 28. CAS AND Q VS. SAM TIP EXTRACT IN 12:5:3, TOLUENE-‐MEK-‐MEOH. ......................................................................... 64 FIG. 29A & B. CAS AND Q VS. SAM TIP EXTRACTION ON POLYAMIDE IN (60:60:7:7) BENZENE-PETROLEUM ETHER (B.PT. 35-
60°C)-METHYL ETHYL KETONE-MEOH. ............................................................................................................. 64 FIG. 31. CAS AND Q VS. SAM TIP EXTRACT ON POLYAMIDE WITH 36:9:5, BENZENE-‐PYRIDINE-‐FORMIC ACID. .................................... 65 FIG. 32A & B. CAS VS. SPOT 1 OF SAM TIP EXTRACT IN 2:1, TOLUENE-‐ETOAC AND IN 1:2, TOLUENE-‐ACN .................................... 66 FIG. 33. COMPARISON OF PROTON NMR SPECTRA OF CRYD, CRY, CAS, AND PLANT EXTRACT ...................................................... 67 FIG. 42A-‐D. ART, AN, CAS, SAM TIP EXTRACT AND Q IN 36:9:5, BENZENE-‐PYRIDINE-‐FORMIC ACID ON SILICA GEL AND TRIAL STAINING
WITH P-‐ANISALDEHYDE SOLUTION. .............................................................................................................................. 69
5
FIG. 43. AN AND SAM TIP EXTRACT ON SILICA GEL IN 36:9:5, BENZENE-‐PYRIDINE-‐FORMIC ACID AND STAINED WITH P-‐ANISALDEHYDE SOLUTION. ............................................................................................................................................................. 70
FIG. 44. DEVELOPMENT OF SAM TIP EXTRACT IN 36:9:5, BENZENE-‐PYRIDINE-‐FORMIC ACID, FOLLOWED BY STAINING WITH P-‐ANISALDEHYDE SOLUTION AND 2 % ALCL3 IN MEOH. .................................................................................................... 71
FIG. 45. DEVELOPMENT OF SAM TIP EXTRACT, AN, CAS, AND AT ON SILICA GEL IN 36:9:5, BENZENE-‐PYRIDINE-‐FORMIC ACID, FOLLOWED
BY STAINING WITH P-‐ANISALDEHYDE. ........................................................................................................................... 72 FIG. 46. AT AND AN ON SILICA GEL IN 36:9:5, BENZENE-‐PYRIDINE-‐FORMIC ACID WITH P-‐ANISALDEHYDE. ......................................... 73 FIG. 47. COMPARISON OF SAM TIP AND LEAF EXTRACT, AND AN (PLATE 2) AND CAS (PLATE 1) IN 36:9:5, BENZENE-‐PYRIDINE-‐FORMIC
ACID, FOLLOWED BY STAINING OF PLATE 2 WITH P-‐ANISALDEHYDE AND OF PLATE 1 WITH ALCL3. ............................................. 75 FIG. 48. CAS, CRY, SAM TIP EXTRACT, AND CRYD ON SILICA GEL IN 36:9:5, BENZENE-‐PYRIDINE-‐FORMIC ACID UNDER UV-‐LIGHT. ....... 77 FIG. 49A AND B. CAS AND Q VS. SAM TIP EXTRACT IN 60:60:7:7) BENZENE-‐PETROLEUM ETHER (B.PT. 35-‐60°C)-‐METHYL ETHYL
KETONE-‐MEOH ON POLYAMIDE. ................................................................................................................................ 86 FIG. 34. PROTON NMR SPECTRUM OF PLANT EXTRACT (FRESH SAM TIP). ................................................................................. 88 FIG. 35. PROTON NMR SPECTRUM OF CAS. ......................................................................................................................... 89 FIG. 36. PROTON NMR SPECTRUM OF CRY. ......................................................................................................................... 90 FIG. 37. PROTON NMR SPECTRUM OF CRYD. ...................................................................................................................... 91 FIG. 38. CARBON NMR SPECTRUM OF PLANT EXTRACT (FRESH SAM TIP). ................................................................................. 92 FIG. 39. CARBON NMR SPECTRUM OF CAS. ......................................................................................................................... 93 FIG. 40. CARBON NMR SPECTRUM OF CRY. ......................................................................................................................... 94 FIG. 41. CARBON NMR SPECTRUM OF CRYD. ...................................................................................................................... 95
Table of Tables TABLE I: THE IN VITRO ANTIPLASMODIAL ACTIVITY OF COMPOUNDS PRESENT IN A. ANNUA (FROM LIU ET AL., 1992). .......................... 18 TABLE II: CHROMATOGRAPHY METHODS SUITABLE FOR PROFILING CASTICIN, KAEMPFEROL, EUPATORIN, MYRICETIN, CHRYSOSPLENOL D,
CIRSILINEOL, CHRYSOPLENETIN, AND ARTEMETIN IN ARTEMISIA ANNUA AS REPORTED BY OTHER LITERARY WORKS. ...................... 27 TABLE III: CHROMATOGRAPHY METHODS SUITABLE FOR PROFILING CASTICIN, KAEMPFEROL, EUPATORIN, MYRICETIN, CHRYSOSPLENOL D,
CIRSILINEOL, CHRYSOPLENETIN, AND ARTEMETIN IN ARTEMISIA ANNUA AS DOCUMENTED IN THIS REPORT. ................................ 37 TABLE IV: TWO EXTRACTION PROTOCOLS FOR EXTRACTING FLAVONOIDS. .................................................................................... 39 TABLE V: GCMS DETERMINED PEAK AREAS AND ESTIMATES OF CONCENTRATION OF ARTEMETIN AND CASTICIN IN SPOTS 1 AND 2 (FIG. 12
AND 13). ............................................................................................................................................................... 49 TABLE VI: RF VALUES OF AN, CAS, AND COMPOUNDS IN SAM LEAF AND TIP EXTRACTS. ................................................................ 76

6
Acknowledgements
I would like to thank Dr. Pamela Weathers for providing me guidance for my project.
I would also like to thank Dr. John MacDonald for all the help and advice on my extractions and thin layer chromatography experiments.
I would like to thank Dr. Marion Emmert and Dr. Zhou’s lab for providing me solvents.
I would like to thank Dr. Robert Connors for getting my lab equipment out of a tight situation.
I would like to thank Dr. Melissa Towler for TLC advice and help in the lab.
I would like to thank the graduate students Ying Yang and Liwen Fei for their help in the lab and ideas for my project.
I would like to thank Prof. James Dittami for helping me understand previously documented methods.
I would like to thank Andrew Butler for his help with the NMR analyses.
I would like to acknowledge the NIH Grant (2R15 GM069562-03).
I would like to thank Christopher Molica and my parents for their support.
7
Abstract
Malaria is a malicious disease that still prevails in the world. Efforts to find a treatment
have been in progress for decades, especially since the plasmodia parasites have begun to build a
resistance against present antimalarials, specifically artemisinin, a sesquiterpene lactone. This
project aimed to advance the search for some of the synergistic compounds present in the plant,
namely flavonoids. To verify the identities of several flavonoids of interest, chrysosplenol-D,
chrysoplenetin, and cirsilineol, various TLC mobile and solid phases were compared and then
used to analyze fresh plant extracts from both plant shoot tip extracts and mature leaves. To
profile the many flavonoids and terpenes in this species the best TLC method used was the
mobile phase 36:9:5, benzene-pyridine-formic acid with silica gel as the stationary phase.
Analysis of the two major plant extracts showed there were at least six flavonoids and six
terpenes present. These results will improve our understanding of the changes in these
compounds as plants grow to maturity and will help further the work on using this plant for
treatment of malaria.
8
1.0 Introduction
The original objective of this Major Qualifying Project was to extract, isolate, and verify
the identities of three specific flavonoids, chrysoplenetin (CRY), chrysosplenol-D (CRYD) and
cirsilineol (CRS) from the plant Artemisia annua. Flavonoids, a subclass of polyphenols, were
found to act synergistically with artemisinin (AN), a sesquiterpene lactone found in A. annua,
giving greater aid in the treatment of malaria than when AN was administered alone. The
challenge of this project included the limited journal articles that specified a procedure to extract
only those three aforementioned flavonoids, and the process itself of separating the three
flavonoids of strikingly similar structures from the 46 known flavonoids discovered in A. annua.
This project was foreseen to advance the search for a treatment for malaria and cancer, as there
were, to our knowledge at the time, no standards for the three desired flavonoids, nor any studies
that tested their action in combination with AN against diseases other than malaria. Now we
know that the standards for the three desired
flavonoids are obtainable; however, they are very
expensive.
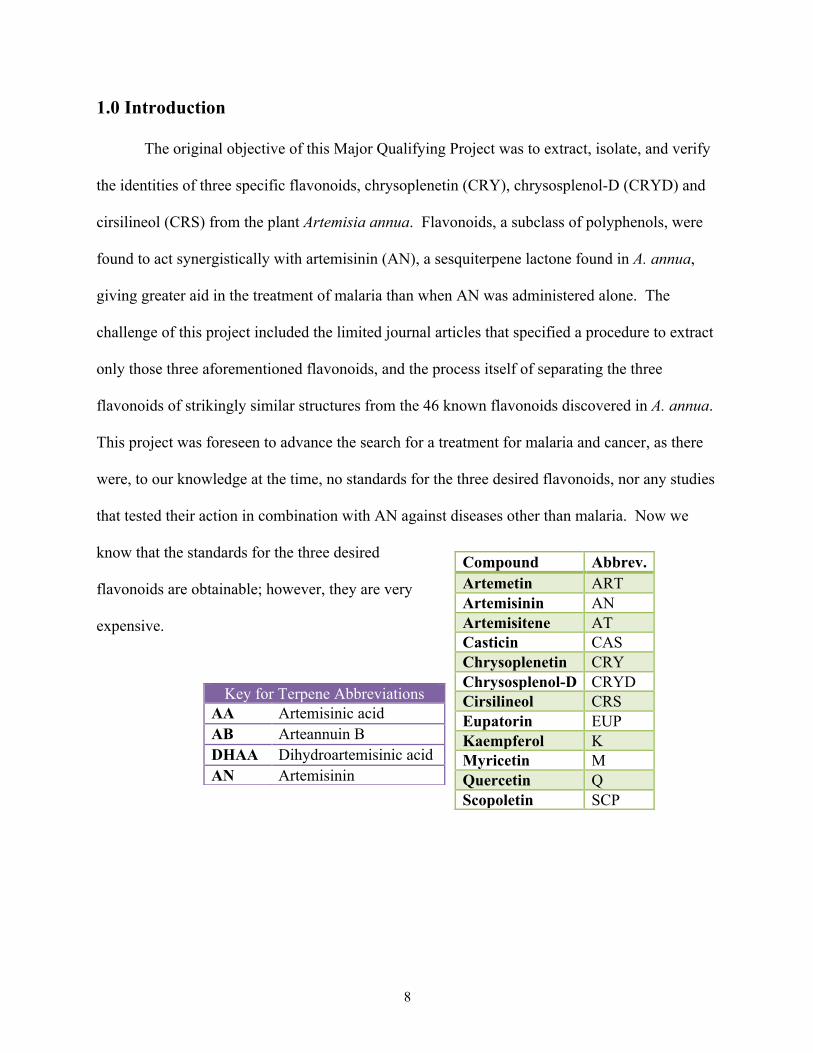
Compound Abbrev. Artemetin ART Artemisinin AN Artemisitene AT Casticin CAS Chrysoplenetin CRY Chrysosplenol-D CRYD Cirsilineol CRS Eupatorin EUP Kaempferol K Myricetin M Quercetin Q Scopoletin SCP
Key for Terpene Abbreviations AA Artemisinic acid AB Arteannuin B DHAA Dihydroartemisinic acid AN Artemisinin
9
2.0 Background
2.1 Malaria Protozoan plasmodia parasites cause malaria, a vector-borne infectious disease (de
Ridder et al., 2008). The five types of Plasmodium species are P. falciparum, P. vivax, P.
malariae, P. ovale, and P. knowlesi (de Ridder et al. 2008; Alonso et al., 2011). The main
species of malaria existing in sub-Saharan Africa is P. falciparum (Breman and Brandling-
Bennett, 2011). While P. vivax is often the most prevalent malaria infection in tropical and
subtropical areas, P. falciparum is responsible for most malaria-induced deaths, and is thus the
greater focus of research (Clemente and Corigliano, 2012).
2.1.1 Life Cycle of Malaria Parasite The life cycle of the malaria parasite is complicated to the extent that procuring a
diagnosis and preventing the disease can be difficult, especially during the initial diagnostic
period, when the four Plasmodium species, P. falciparum, P. vivax, P. ovale, and P. malaria,
have analogous clinical presentations (Bledsoe, 2005). Initially, the Anopheles mosquito feeds
on an infected human, taking in male and female Plasmodium gametocytes, which combine
sexually and reproduce countless sporozoites in the stomach lining of the mosquito (Bledsoe,
2005). The sporozoites can be transferred to healthy humans and infect them through the
salivary glands of the mosquito, when they drink human blood (Bledsoe, 2005). After entering
the blood stream, the sporozoites journey to the liver and asexually reproduce, inducing a
dormant stage that continues for about eight to thirty days (Bledsoe, 2005). Then merozoites
form in the liver, are released into the bloodstream, and invade erythrocytes, red blood cells,
where they develop into trophozoites, then schizonts (Bledsoe, 2005; Perez-Jorge and Herchline,
2012). Erythrocytes lyse after 48-72 hours, causing signs of fever and the release of merozoites,
10
which then infect healthy red blood cells and spread the infection, resulting in a repeat of the life
cycle (Bledsoe, 2005; Perez-Jorge and Herchline, 2012).
2.1.2 Statistics and Groups Most Affected According to Alonso et al. (2011), about one-fifth of the world’s population in 2009 was
living in regions that were at high risk for transmission of malaria. The 81 out of 106 countries
where malaria transmission was reported were focusing their sights on control, whereas 25 were
in pre-elimination, elimination, and prevention of re-introductory phases (Alonso et al., 2011).
Of estimated deaths due to malaria worldwide in 2010, about 86 percent (655,000) were children
under five years old infected with P. falciparum in Africa (WHO, 2011). Malaria can be
detrimental to women who are pregnant, as well as to the fetus they are carrying, since some of
the immunity built up by adults after repeated infections does not transfer to the fetus
(Greenwood and Mutabingwa, 2002). If women are living in an area of low transmission,
malaria can lead to an abortion or stillbirth, while in areas of high malarial transmission, the
placenta may become infected with P. falciparum, which may impair placental function,
resulting in low birth weight of the baby, as well as increased infant mortality (Greenwood and
Mutabingwa, 2002).
2.1.3 Taking Action against Malaria Finding a cure or a way to eliminate malaria is a daunting feat, as the five Plasmodium
species are transmitted by over 30 different female Anopheline mosquito species with various
breeding and feeding habits, and result in a variety clinical presentations in different population
target groups and epidemiological settings (Alonso et al., 2011). Other barriers to the
elimination of malaria include differences in parasite, vector, human, social, and environmental
factors, underperforming health services, lack of political will, insufficient financial, social, and
human resources, as well as insufficient tools, such as drugs or vaccines, to interrupt
11
transmission given an especially high level of transmission (Alonso et al., 2011). Some of the
measures taken to prevent malaria have been the distribution of insecticide-treated nets,
intermittent preventive treatments during pregnancy, and insecticide residual spraying (Breman
and Brandling-Bennett, 2011).
Quinine, an alkaloid found in Cinchona bark, was a popular antimalarial of the past;
however, the P. falciparum parasite built up resistance to not only this drug, but to its synthetic
analogs, such as chloroquine (Brown, 2010; Smith et al., 2010). The resistance to these
antimalarials led to the use of AN, a sesquiterpene lactone extracted from the plant Artemisia
annua, which was later recommended by the World Health Organization (WHO) to be used in
combination with another effective blood schizontocide, for instance mefloquine, and is referred
to as artemisinin-based combination therapy (ACT). ACT is documented, by WHO in the World
Malaria Report 2010 to have been one of the factors, along with long-lasting insecticide-treated
nets, to have helped decrease malaria cases in numerous African countries since 2000 (Smith et
al., 2010; Breman and Brandling-Bennett, 2011).
2.2 Artemisia annua Artemisia annua L. is also referred to by the English common names sweet annie, sweet
wormwood, and annual wormwood, and by the Chinese name qing hao, which translates closely
to ‘green herb’ (de Ridder et al. 2008; Ferreira and Janick, 2009). There are between 200 and
400 species of the large, diversified Artemisia genus that are members of the Asteraceae family,
which is the second largest flowering plant family in the world (de Ridder et al. 2008). A. annua
is a sturdy, annual herb, native of Asia, naturally growing in the northern regions of China’s
Chahar and Suiyuan provinces as part of steppe vegetation. It is also now presently cultivated in
other countries, such as Russia, Brazil, the United States, Africa, and India (de Ridder et al.
12
2008; Ferreira and Janick, 2009). This aromatic herb prefers to grow in temperate climates and
can grow over 2.0 m tall, with its single stem, recurring branches from the bottom of the stem to
the tip, and alternating, aromatic leaves (de Ridder et al. 2008; Ferreira and Janick, 2009). A.
annua is pollinated “by insects, self-pollination, and wind distribution” (de Ridder et al. 2008).
A. annua is an herb found beneficial to many facets of life. Not only has this plant been
proposed for use by the livestock industry due to its antioxidant, anti-bacterial, and anti-
protozoal properties, but also for human medicinal purposes (Ferreira and Janick, 2009). A.
annua is the only known source of artemisinin, a drug administered to treat malaria and used as
an infusion tea in China for over 2,000 years (Brown, 2010).
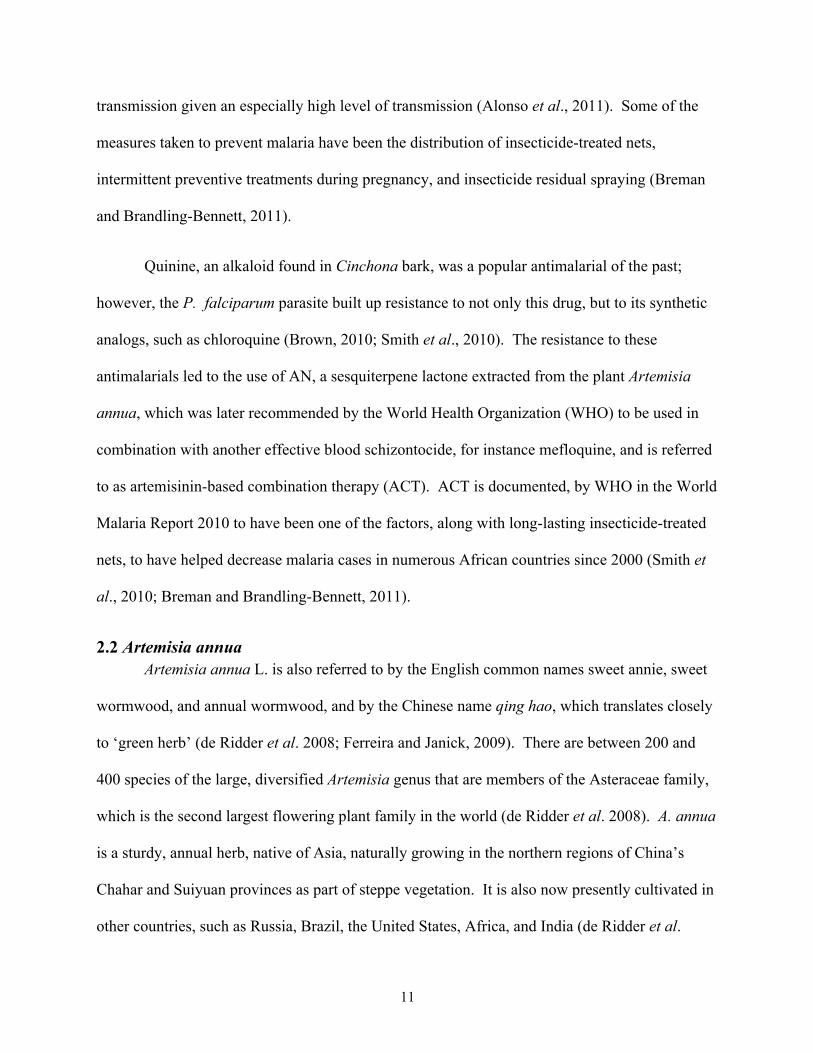
2.3 Artemisinin Artemisinin (AN) is a secondary metabolite of A. annua and a sesquiterpene lactone, with
an endoperoxide bridge, as depicted in Fig. 1, which is responsible for its activity against malaria
(Smith et al., 2010; Ferreira and Janick, 1996).
Fig. 1. Chemical structure of artemisinin and artemisitene.
13
A. annua stores much of its AN content in the glandular trichomes of its leaves, floral buds, and
flowers (de Ridder et al. 2008; Weathers et al., 2010). The sesquiterpene lactones and
monoterpenes found in the fluid of the glandular trichomes probably function as the plant’s mode
of protection against hungry herbivores in the environment (Ferreira and Janick, 1995).
Depending on the amount of dry leaf material used for extraction, environmental conditions,
extraction methods, and the cultivation strain, between 0.01 and 1.4 % (w/w) AN can be
extracted (de Ridder et al. 2008; Brown, 2010).
2.3.1 History of Artemisinin and its Medicinal Uses During the Vietnam War (1965-1975), the Chinese government jumped to the aid of the
Vietnamese army by investing in a program aimed at discovering antimalarial drugs in plants (de
Ridder et al. 2008). Not until 1972, after Prof. Tu’s observation that cold ethereal extracts of A.
annua showed activity against the malarial parasite in mice, was AN finally isolated and
determined to be the active constituent in the herb (Brown, 2010). Artemisinin was given the
name “Qinghaosu”, which means “principle from Qinghao” (Brown, 2010). Before the
identification of AN in A. annua, the leaves of the plant were brewed in a tea for aiding the
treatment of chills, lice, fever, and wounds; the plant was also prescribed as a food supplement
(de Ridder et al. 2008). A. annua also helped to relieve low-grade fever and summer heat stroke,
due to its ability to subdue “heat” syndromes (Brown, 2010). Since recent research has resolved
that AN is nearly insoluble in water, the past success in using A. annua for the treatment of
various ailments may be attributed either to the other herbs added to the concoction or to other
constituents in A. annua, which strengthened the therapeutic effects of AN against such illnesses
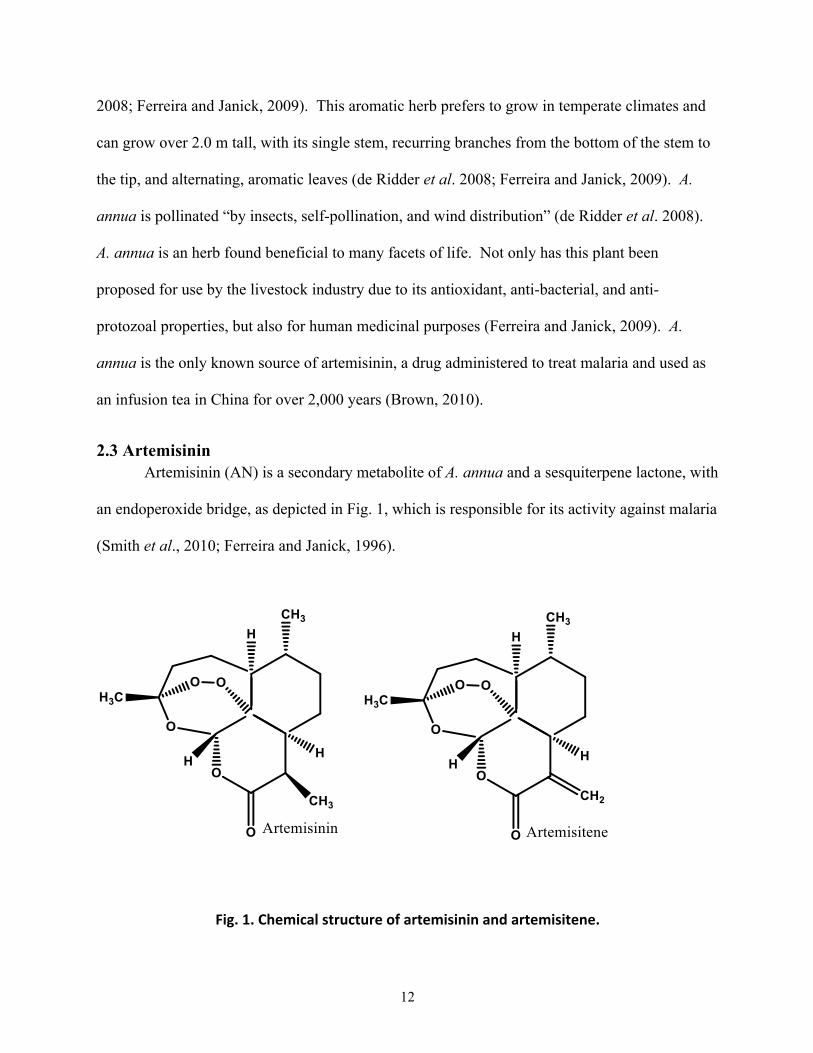
as malaria (Brown, 2010). Because of AN’s low insolubility in water and oil, semi-synthetic
derivatives of AN—namely artemether, arteether, and artesunate (Fig. 2)—were developed that
14
unveiled greater therapeutic and pharmacological potential, in addition to enhanced solubility
(Brown, 2010).
2.4 Resistance to Antimalarials Over the years, evidence has emerged of the resistance of P. falciparum to various
antimalarials employed today, including chloroquine, mefloquine, quinine, amodiaquine, and
sulfadoxine-pyrimethamine; the appearance of the parasite’s resistance to AN has also
Fig. 2. Artemisinin and its semi-‐synthetic derivatives.
15
now occurred in Cambodia (de Ridder et al. 2008; Rasoanaivo et al., 2011). The gradual
increase in resistance to AN may have arisen due to use of a single purified chemical entity and
also to its mechanism of action involving the endoperoxide bridge (Brown, 2010). Pandey et al.
(1999) and Wiwanitkit (2010) posited the drug’s mechanism of action. When the parasite
ingests hemoglobin inside its digestive vacuole, after entering the red blood cell, “free heme, an
iron-porphyrin complex”, is released. The heme or iron cleaves the endoperoxide bridge of AN,
converting it to an unstable radical, which spurs a series of reactions, “selective alkylation of
malarial proteins”, and ultimately destroys the parasite. Artemisinins are fast-acting, imposing
their effects within an hour after use, which may be attributed to inhibition of hemoglobin
decomposition, heme polymerization, and direct interaction of the antimalarial with the malarial
pigment within the digestive vacuole (Pandey et al., 1999). The high rate of recrudescence that
results when administering AN as a monotherapy may be connected to its short half-life
(Rasoanaivo et al., 2011). An alternative to monotherapy is administering combinations of
antimalarials, which, although increasing cost, may increase efficacy, shorten duration of
treatment, and decrease the risk of parasites developing resistance through mutation during
treatment (Kremsner and Krishna, 2004).
2.5 Implementation of ACT In 2006 WHO strongly encouraged the administration of AN along with a second
antimalarial drug to help combat malaria more fiercely and beat down the threat of resistance of
the malarial parasite to monotherapies. This combination of AN plus an older antimalarial drug
is ACT, artemisinin combination therapy. ACT is defined as taking two independently acting
drugs, with differing biochemical targets in the malarial parasite, to improve efficacy and to
delay emergence of resistance to either drug. If one of the drugs happens to be resisted by the
16
parasite, then the other drug will kill the lethal invader. WHO (2001) lists some of the following
benefits of implementing ACTs:
• Capability of AN derivatives to quickly treat and exterminate parasites
• Chance to delay resistance to available antimalarials that are inexpensive and efficient
• Incompetent first-line treatments presently used in many countries
The ensuing disadvantages mentioned by WHO (2001) repressed the immediate support of
ACTs:
• Little is known about ACT with or without AN derivatives
• Potential drug misuse
• The effort and cost required to change the treatment policy
• Higher cost of AN derivatives
Being able to attain the benefits of using an effective, low-cost ACT, without the disadvantages,
would be worthwhile and one step closer toward achieving global eradication of malaria.
2.6 Poverty and the Challenges in Treating Malaria Today, treatment of malaria without sufficiently adequate ACTs is a struggle for much of
the poor, malaria-stricken population of Africa and Asia. Africa in particular lacks a strong
health-care infrastructure, and essential medicines are also limited (de Ridder et al., 2008).
Households often do not have the luxury of paying for febrile illnesses and must treat themselves
at home with over-the-counter drugs (de Ridder et al., 2008). For a family to provide their child
one full treatment, they would lose approximately 10 % of their monthly income and rural
families, where the disease is most prevalent are especially hard hit (de Ridder et al., 2008).
Clearly, better and cheaper antimalarials are urgently needed. The cost of introducing ACTs into
17
societies infected with malaria are more than ten times that of the monotherapies used in Africa
(WHO, 2001). The limited supply and availability of AN may continue to keep the cost high in
the future (de Ridder et al., 2008). Finding a low-cost means to administer AN in combination
with flavonoids has been a research pursuit of particular interest; flavonoids, while not as
effective against malaria as AN, are present in A. annua and exhibit the potential to synergize the
therapeutic activity of AN (Ferreira et al., 2010).
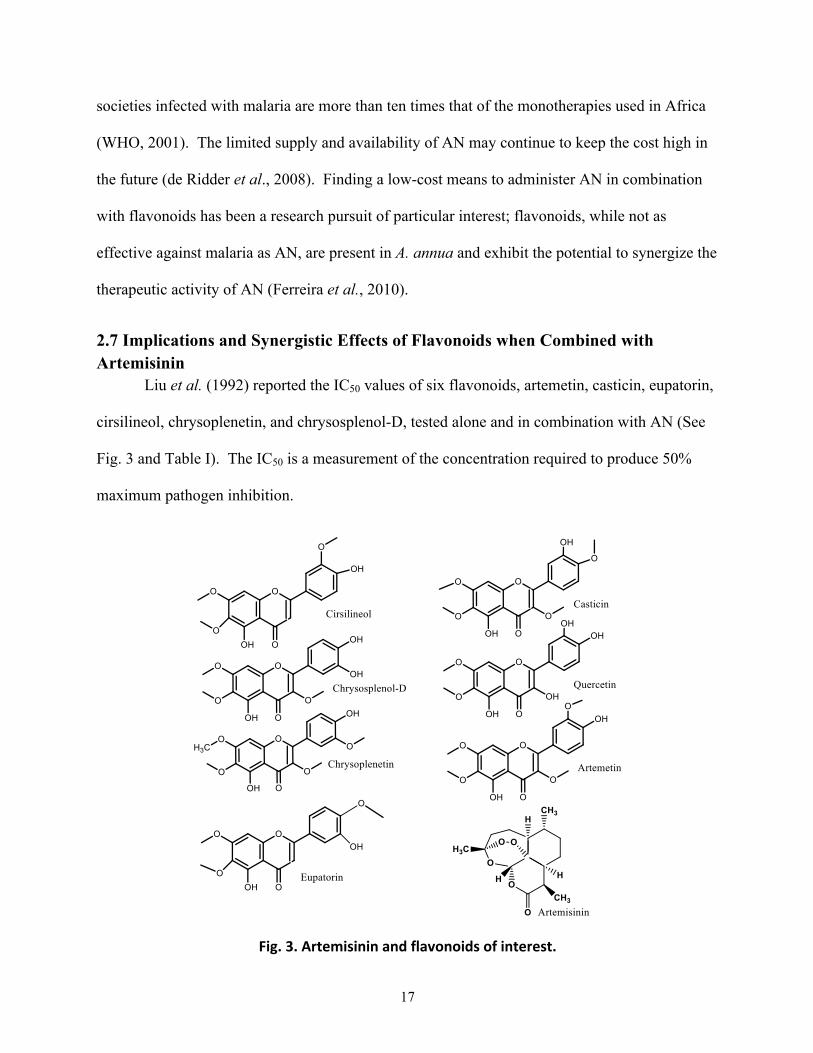
2.7 Implications and Synergistic Effects of Flavonoids when Combined with Artemisinin Liu et al. (1992) reported the IC50 values of six flavonoids, artemetin, casticin, eupatorin,
cirsilineol, chrysoplenetin, and chrysosplenol-D, tested alone and in combination with AN (See
Fig. 3 and Table I). The IC50 is a measurement of the concentration required to produce 50%
maximum pathogen inhibition.
Fig. 3. Artemisinin and flavonoids of interest.
18
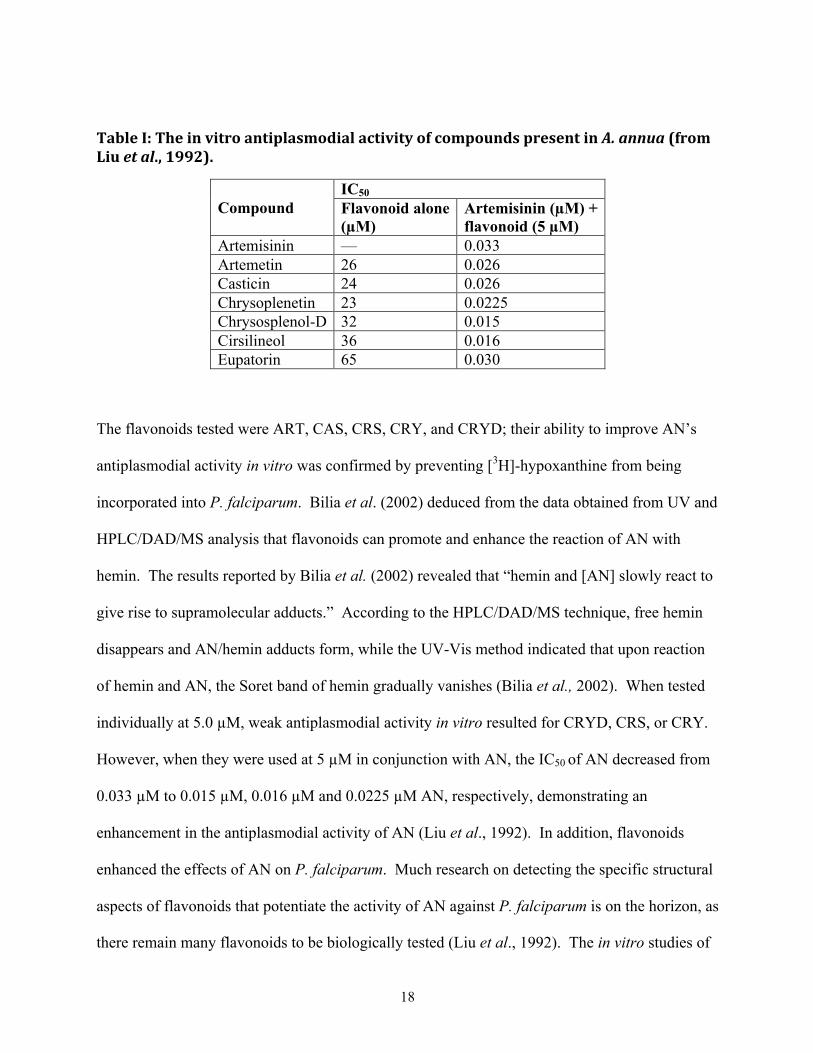
Table I: The in vitro antiplasmodial activity of compounds present in A. annua (from Liu et al., 1992).
Compound IC50 Flavonoid alone (µM)
Artemisinin (µM) + flavonoid (5 µM)
Artemisinin — 0.033 Artemetin 26 0.026 Casticin 24 0.026 Chrysoplenetin 23 0.0225 Chrysosplenol-D 32 0.015 Cirsilineol 36 0.016 Eupatorin 65 0.030
The flavonoids tested were ART, CAS, CRS, CRY, and CRYD; their ability to improve AN’s
antiplasmodial activity in vitro was confirmed by preventing [3H]-hypoxanthine from being
incorporated into P. falciparum. Bilia et al. (2002) deduced from the data obtained from UV and
HPLC/DAD/MS analysis that flavonoids can promote and enhance the reaction of AN with
hemin. The results reported by Bilia et al. (2002) revealed that “hemin and [AN] slowly react to
give rise to supramolecular adducts.” According to the HPLC/DAD/MS technique, free hemin
disappears and AN/hemin adducts form, while the UV-Vis method indicated that upon reaction
of hemin and AN, the Soret band of hemin gradually vanishes (Bilia et al., 2002). When tested
individually at 5.0 µM, weak antiplasmodial activity in vitro resulted for CRYD, CRS, or CRY.
However, when they were used at 5 µM in conjunction with AN, the IC50 of AN decreased from
0.033 µM to 0.015 µM, 0.016 µM and 0.0225 µM AN, respectively, demonstrating an
enhancement in the antiplasmodial activity of AN (Liu et al., 1992). In addition, flavonoids
enhanced the effects of AN on P. falciparum. Much research on detecting the specific structural
aspects of flavonoids that potentiate the activity of AN against P. falciparum is on the horizon, as
there remain many flavonoids to be biologically tested (Liu et al., 1992). The in vitro studies of
19
Elford et al. (1987) revealed that in the presence of methoxylated flavones, such as CAS and
ART, the antimalarial activity of AN was noticeably enhanced, but no significant antimalarial
activity was observed when these two flavones were used alone. There was a 3 to 5 fold
reduction in the ID50 value, which is the concentration needed to achieve 50 % inhibition of an
infection, for AN, when CAS was present; however, ART was not as effective in enhancing the
antimalarial activity of AN (Elford et al., 1987; Fung et al., 1992). Not only have the
antimalarial activity of flavonoids and ART been examined in vitro, research has also been done
in vivo on the bioavailability of AN and flavonoids in tea infusions and mice.
2.7.1 Administration of Artemisinin and Flavonoids Currently there has been a resurging interest in the use of tea for treating malaria, because
of the simplicity and low cost of its use, and the reported synergistic effects of flavonoids from in
vitro studies (Elford et al., 1987; Liu et al., 1992). However, according to Weathers and Towler
(2012), resorting to tea may prove a vain attempt to treat malaria. Following a tea infusion
protocol, Weathers and Towler (2012) discovered that although AN was efficiently extracted
from an A. annua tea infusion, up to almost 93%, and stable at room temperature for 24 hr, “the
flavonoids casticin and artemetin were poorly extracted” and became unstable when stored at
room temperature. These results indicated that a tea infusion may lose synergistic potential, and
thus its capacity to treat malaria. Weathers et al. (2011) proposed administering compacted dried
leaves of A. annua in a capsule. The results from the mouse study of Weathers et al. (2011)
showed that more AN was detected in the blood of mice from the in planta form than from > 40
times more pure AN administered to the mice. After administering 1,400 µg of pure AN to
mice, only 0.074 mg L-1 remained in the blood after an hour, whereas, 30 minutes after feeding
the mice ground A. annua leaves, containing only 31 µg AN, serum levels reached nearly the
same level, 0.087 mg AN L-1 (Weathers et al., 2011). This suggested that other chemical
20
constituents in A. annua enhanced the bioavailability of AN, further encouraging more research
into the use of A. annua as an ACT in the treatment of malaria, as well as cancer, and various
other ailments such as Pneumocystis carinii, Schistosoma, and Herpes simplex viruses (Efferth,
2007). In another study reported by Elfawal et al. (2012), the oral delivery of dried leaves of
whole plant A. annua to mice infected with Plasmodium chabaudi proved more effective than an
equal dose of pure AN. The efficiency of whole plant A. annua in treating malaria may be
attributed to the synergy between flavonoids present in A. annua and AN (Elfawal et al., 2012).
Although the synergistic potential achieved when administering flavonoids in combination with
other antimalarials had not been realized until several decades ago, natural medicinal remedies
that contain flavonoids have been used for thousands of years in various regions of the world.
2.8 Flavonoids
2.8.1 History of Flavonoids Centuries ago, healers prepared medicine composed of flavonoids and administered them
to the sick. For instance, in Ancient Greece, Hippocrates recommended propolis to those
suffering from sores and ulcers (Cushine and Lamb, 2005). In China, the herbal medicine
Scutellaria baicalensis, containing baicalein, the flavone responsible for its antimicrobial
activity, was long applied to infected oral wounds and periodontal diseases (Cushine and Lamb,
2005). Europeans used plants as traditional folk medicines that are thought to have contained
flavonoids holding therapeutic activity (Jäger and Saaby, 2011). Apigenin was the flavone
confirmed as the constituent accountable for the calming effect of camomile flowers; quercetin
provided the nerve calming effect from heather; the combined application of quercetin and
kaempferol produced a sedative effect when Linden flowers were used (Jäger and Saaby, 2011).
The use of tea was first documented in 2700 BC, while Eisai, a Japanese monk, first recorded its
therapeutic effects in 1211 (Principles, 2011). Tea extracts were taken by 16th century European
21
adventurers to ease “fever, headache, stomach ache, and joint pain” (Principles, 2011).
Antioxidants, polyphenols, such as catechins and flavones, are thought to be the elements in tea
responsible for its therapeutic potential (Principles, 2011). In the 1930s, Albert Szent-Györgyi
was the first to isolate rutin, a flavonoid glycoside, from oranges, which he discovered gave
strength to capillary walls by a means that vitamin C could not; flavonoids were originally called
vitamin P, but due to the diversity of flavonoids found in nature, they could not be labeled as a
single vitamin (Kale et al., 2008; Principles, 2011).
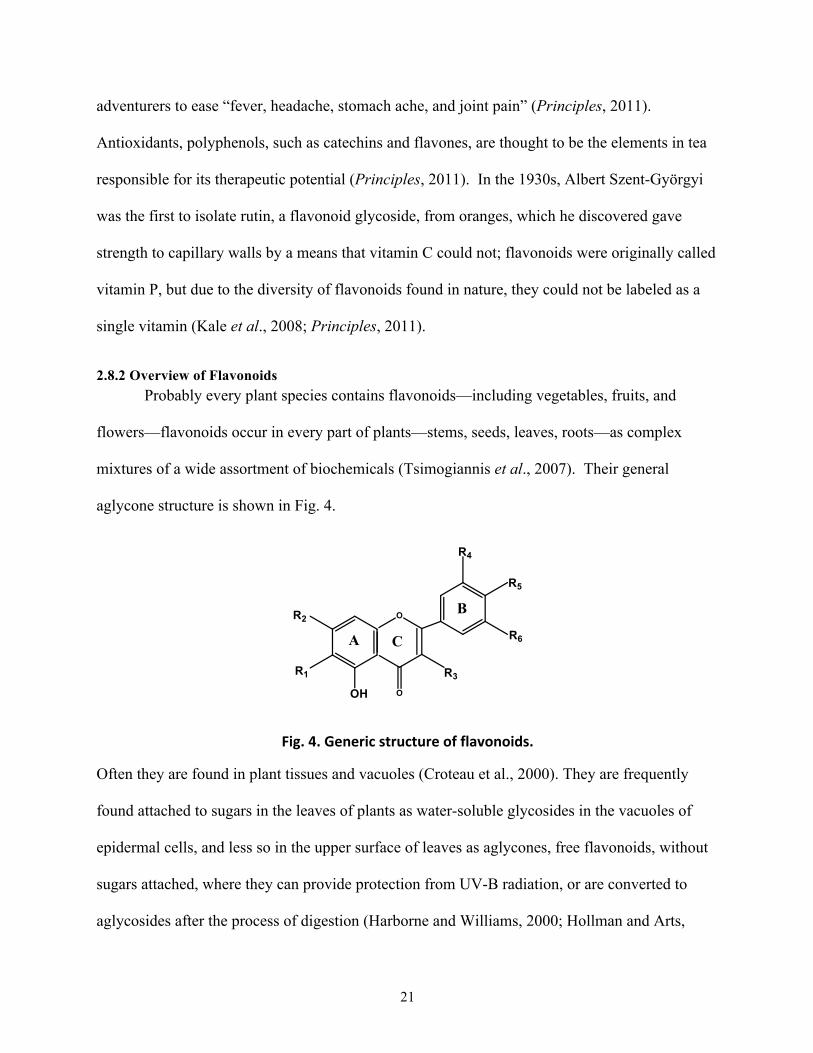
2.8.2 Overview of Flavonoids Probably every plant species contains flavonoids—including vegetables, fruits, and
flowers—flavonoids occur in every part of plants—stems, seeds, leaves, roots—as complex
mixtures of a wide assortment of biochemicals (Tsimogiannis et al., 2007). Their general
aglycone structure is shown in Fig. 4.
Fig. 4. Generic structure of flavonoids.
Often they are found in plant tissues and vacuoles (Croteau et al., 2000). They are frequently
found attached to sugars in the leaves of plants as water-soluble glycosides in the vacuoles of
epidermal cells, and less so in the upper surface of leaves as aglycones, free flavonoids, without
sugars attached, where they can provide protection from UV-B radiation, or are converted to
aglycosides after the process of digestion (Harborne and Williams, 2000; Hollman and Arts,
22
2000). They can also exist as conjugated forms with aliphatic acids, isoprenyl, methoxyl, and
methylenedioxy substituents (Ferreira et al., 2010). In leaves, flavonoids are masked by the
green chlorophylls, but are attractively visible as colorful pigments in flower petals (Harborne
and Williams, 2000) as a means of attracting pollinators and seed dispersers (Croteau et al.,
2000). For example, the pelargonidins give plants their orange, salmon, pink, and red hue; the
cyandins attribute to magenta and crimson pigments; the delphinidins contribute to the purple,
blue, and mauve colors of flowers (Croteau et al., 2000). Flavonoids occur in wine, tea, honey,
and propolis, which is a resin mixed with wax that honeybees collect from plants and use to seal
open spaces to keep out unwanted visitors, and furthermore, to smooth out surfaces in their hives
(Park et al., 2002; Cushine and Lamb, 2005). In the US, a few hundred to a thousand milligrams
of mixtures of flavonoids per person are consumed daily (Cushine and Lamb, 2005). Flavonoids
are referred to as phytonutrients, nontraditional nutrients, and phytochemicals—bioactive
compounds designated as pharmacologically safe (Beecher, 2003; Kale et al., 2008). Since
flavonoids are consumed on a daily basis in a large array of plants and beverages, and have been
incorporated into medicine for hundreds of years, there is little chance that they are toxic, if at
all, however further research needs to be pursued to evaluate the toxicity of individual flavonoids
(Cushine and Lamb, 2005). In addition, flavonoids are not considered traditional nutrients or
vitamins because their removal from diets does not induce deficiency diseases (Beecher, 2003).
On the other hand, flavonoids that are classified into separate subgroups, are well recognized as
health-promoting anti-oxidants (Pietta, 2000).
2.8.3 Classification of Flavonoids More than 4,500 flavonoids have been separated and identified, with over 40 present in
A. annua (Ferreira et al., 2010; Rasoanaivo et al., 2011). Flavonoids are a subclass of
polyphenols, which are further grouped under phenolics, phenolic phytochemicals. Flavonoids
23
are subdivided into flavones, flavonols, flavanols or catechins, dihydroflavonols, chalcones,
aurones, isoflavonoids, bioflavonoids, and anthocyanins (Ferreira et al., 2010). The three
flavonoids of interest in this research endeavor are CRY and CRYD, both of which are flavonols,
and CRS, a flavone. The general structures of a few of the aforementioned flavonoid subclasses
are shown in Fig. 5.
Fig. 5. Subclasses of flavonoids based on their structural variations.
2.8.4 Generic Structure of Flavonoids and the Three of Interest to This Project Flavonoids have the structural characteristic of an aromatic ring and a benzopyran ring
with a phenyl group attached; they also have at least one hydroxyl group as a substituent of the
aromatic ring and phenyl group (See Fig. 4). The structures of CRS, CRY, and CRYD are
shown in Fig. 6. All three are methoxylated at R1 and R2. However, CRS lacks the methoxyl
group at position R3, as well as a substituent at R6, found in CRY and CRYD. Chrysoplenetin
and CRYD differ in that CRYD has a hydroxyl group at R6, whereas CRY has a methoxyl group
24
at R6. The closely related structures and their similarities in polarity make isolation and
identification, including association of their observed activity, of the three targeted flavonoids of
Fig. 6. Structures of chrysoplenetin, cirsilineol, and chrysosplenol-‐D.
this project a challenge (Tsimogiannis et al., 2007). Flavonoids are named on the basis of their
structure using various systems of nomenclature.
2.8.5 Nomenclature of Flavonoids In addition to the oxidation state and substituents of the C ring, flavonoids are divided
into subclasses based on the connection of the B ring to the C ring, as seen in Fig. 4 (Beecher,
2003). They are also classified and identified individually based on hydroxylation and
conjugation patters of rings A, B, and C (Beecher, 2003). Flavonoids can be given trivial names,
which can designate their class or plant source; for example, the suffix ‘etin’ implies a flavonol,
and the compound hypolaetin was elicited from plants of the genus Hypolaena (Cushine and
Lamb, 2005). They can be named semi-systematically based on trivial names, for example,
chalcone as the parent structure in 3,3’,4’,5,7-pentahydroxyflavone (Cushine and Lamb, 2005).
A third, inconvenient method of naming flavonoids is to appoint them systematic chemical
names, like 3,4-dihydro-2-phenyl-2H-benzopyran for flavan (Cushine and Lamb, 2005). The
25
synonyms of the three flavonoids of interest are in Appendix I. The biosynthesis of the various
subclasses of flavonoids occurs through an intricate pathway catalyzed by specific enzymes.
2.8.6 Biosynthesis of Flavonols and Flavones After general phenylpropanoid metabolism occurs, the first step leading to the flavonoid
subgroups is catalyzed by chalcone synthase (CHS), requiring 4-coumaroyl CoA and malonyl
CoA as substrates (Winkel-Shirley, 2001). The resulting chalcone is then isomerized by
chalcone isomerase (CHI), to a flavanone, which through one mechanism can transform into a
dihydroflavonol by the enzyme flavanone 3’ hydroxylase (F3H), which then can be converted
into flavonols, when catalyzed by flavonol synthase (FLS) (Winkel-Shirley, 2001). Through an
alternative mechanism, the flavanone is catalyzed into a flavone through flavone synthase, which
occurs in two isoforms (FSI, FSII) (Winkel-Shirley, 2001). The biosynthetic pathway of
flavonols and flavones is summarized in Fig. 7.
2.8.7 Previous Methods of Extraction and Isolation of Flavonoids Methods of extraction and isolation of the three flavonoids of interest to this project from
dried A. annua plant material and other plant species have been reported in the past, but most
were too vague to replicate. Those reports are first organized by flavonoid and briefly described,
then the key literature reports are described more in depth. Table II contains the chromatography
methods suitable for profiling CAS, CRYD, CRS, and ART, as reported in the literature.
26
General Phenylpropanoid Pathway: Phenylalanine 4-coumaroyl CoA + malonyl CoA
CHS
Chalcone
CHI
Flavanone
F3H
3-OH-Flananone (dihydroflanonol) Flavone
FLS
Flavonol
Fig. 7. Biosynthetic pathway of flavonols and flavones. The following abbreviations for the enzymes are given: flavanone 3’ hydroxylase (F3H), flavonol synthase (FLS), and flavone synthase isoforms (FSI and FSII) (Winkel-‐Shirley, 2001).
2.8.7.1 Extraction and Isolation of Chrysosplenol-D (CRYD) Chrysosplenol-D was isolated from the plants Brickellia veronicaefolia and A. hispanica,
as reported by Roberts et al. (1980) and Marco et al. (1988), respectively. A purified form of
CRYD was also isolated from A. annua L. as reported by Liu et al. (1992) and Shilin et al.
(1989). The isolation procedures reported by the aforementioned authors involved using MeOH
for extraction of the plant material, successive partitioning between organic solvents, and
running through a series of columns (polyclar, Sephadex LH-20, silica gel, polyamide).
FSI FSII
27
Table II: Chromatography methods suitable for profiling casticin, kaempferol, eupatorin, myricetin, chrysosplenol D, cirsilineol, chrysoplenetin, and artemetin in Artemisia annua as reported by other literary works.
Compound Sample
suspension solvent
Stationary phase Mobile phase Rf Reference
ART 1:1, CHCl3-‐MeOH
Paper Whatman 3MM
3:1:1, t-‐BuOH-‐H2O-‐HOAc
0.82
Roberts et al.
1980 CRYD CH2Cl2 0.82
ART 1:1,
CHCl3-‐MeOH
TLC Cellulose 300
15 % HOAc 0.16
CRYD CH2Cl2 0.18
CAS
1:1,
CHCl3-‐MeOH
TLC Si gel GF254
2:1, Toluene-‐Ethyl Acetate 0.26 Hoberg, E.
1999
CRS CH2Cl2 5 % MeOH in CHCl3 0.44 Grayer et al. 1996
CAS 1:1,
CHCl3-‐MeOH
36:9:5, benzene-‐pyridine-‐formic acid
0.69
Saleh et al. 1987
CRS CH2Cl2 0.60
CAS 1:1,
CHCl3-‐MeOH
TLC Polyamide
60:60:7:7, benzene-‐petrol (60-‐80) methyl ethyl ketone-‐
methanol
0.45
CRS CH2Cl2 0.26
2.8.7.2 Extraction and Isolation of Cirsilineol (CRS) Saleh et al. (1987) reported that CRS was detectable in A. herba-alba, A. mesatlantica, A.
monosperma, and A. capillaris, and isolated CRS from A. herba-alba. Marco et al. (1988)
isolated CRS from A. hispanica, whereas Liu et al. (1992) and Shilin et al. (1989) isolated CRS
from A. annua L. The methods of extraction reported by Liu et al. (1992), Marco et al. (1988),
and Shilin et al. (1989) used MeOH extracts that were eluted through a series of columns
(Sephadex LH-20, silica gel, and polyamide), while the procedure reported by Saleh et al. (1987)
involved crude extraction of the plant material using EtOH, followed by elution through a series
28
of columns (polyamide and Sephadex LH-20). Greenham et al. (2003) reported analyzing the
flavones, one of which was CRS, in their lab using HPLC, TLC, and UV-Vis techniques.
2.8.7.3 Extraction and Isolation of Chrysoplenetin (CRY) Chrysoplenetin was isolated from A. hispanica as reported by Marco et al. (1988),
whereas Liu et al. (1992) and Shilin et al. (1989) isolated CRY from A. annua L. The reported
methodology described for isolating CRY included extraction using MeOH and elution of the
extracts through a series of columns (Sephadex LH-20, silica gel, polyamide, Polyclar AT).
2.8.7.4 Roberts et al. (1980) Ground leaf material (80 g) of B. veronicaefolia was extracted (x5) with 6 L 80 % and 6
L 50% aq. MeOH (Roberts et al., 1980). The extracts were combined and dried at room
temperature until only water remained (Roberts et al., 1980). The aqueous layer was
successively extracted with n-hexane (2 L), CHCl3 (3 L) , and finally EtOAc (3 L). The
remaining aqueous layer was dried to a volume of 200 mL. The hexane and CHCl3 extracts were
combined, however, since the three flavonoids of interest to this project were not found in that
combined extract, further procedures for that specific fraction are not described here. The
EtOAc extract (20 g) was first eluted through a polyclar column (7.5 x 100 cm, 500 g) with
CHCl3-MeOH-EtOAc-2,4-pentanedione (20:10:5:1), then with CHCl3-MeOH-EtOAc-2,4-
pentanedione (10:10:5:1), increasing the polarity of the solvent until the column was finally
eluted with MeOH. CRYD (15 mg), the only flavonoid of interest to this project, was isolated
using this column, but the volume of the fractions collected was not specified.
2.8.7.5 Marco et al. (1988) Plant material of A. hispanica (1 kg) was extracted at room temperature with 80 %
MeOH (10 L, 5 days) and 50 % MeOH (10 L, 5 days). The extracts were combined, dried in
vacuo to 2 L, and extracted successively with hexane (3 x 2 L), Et2O (4 x 2 L), and EtOAc (4 x 2
29
L). Since the hexane extract contained mostly waxes and essential oils, it was not further
studied.
The Et2O extract (6.7 g) was chromatographed on a polyamide column (50 x 60 cm) with
toluene-MeOH mixtures of increasing MeOH percentage. Three main fractions were made,
corresponding to percentages of up to 15 % MeOH (E-1), 15 to 25 % MeOH (E-2) and 25 %
MeOH (E-3). The three main fractions were made after TLC inspection, the exact method of
which was not described.
Fraction E-1 was re-chromatographed on silica gel with CHCl3- Et2O mixtures of
increasing Et2O percentage. After inspection by TLC, fractions E-11 to E-13 were collected.
None of the three flavonoids of interest to this project were reported to be fraction E-11.
Therefore, further procedures for separation and isolation of components in E-11 are not
described here. Fraction E-12 was also re-chromatographed on silica gel, eluting with hexane-
Et2O mixtures, giving CRY, which was further purified by column chromatography on Sephadex
LH-20 (elution with MeOH), yielding 25 mg of CRY (Marco et al., 1988). Fraction E-13 was
re-chromatographed on silica gel (elution with hexane- Et2O mixtures). The flavonoid fractions
were submitted to column chromatography on polyamide, eluting with toluene-MeOH mixtures,
then Sephadex LH-20 (MeOH or 80 % MeOH), giving arteanoflavone (6 mg), penduletin (7
mg), CRS (46 mg), and more CRY (12 mg).
Fraction E-2 was re-chromatographed on polyamide, using the eluent toluene-MeOH,
10:1. Two main fractions, E-21 and E-22, were collected after TLC inspection, the exact method
of which was not mentioned. Fraction E-21 was subjected to column chromatography on
Sephadex LH-20 (elution with MeOH) to give two fractions, one of which contained CRYD (20
30
mg). The other fraction, which was not identified, was purified by prep TLC on polyamide and
then by percolation through Sephadex LH-20 (elution with MeOH) to give methyl caffeate (160
mg) and a second fraction, which was submitted to paper partition chromatography (35 %
HOAc). The main bands were eluted with MeOH and percolated through Sephadex LH-20
(MeOH) to give more CRYD (5 mg) and 5,3’,4’-trihydroxy-6,7,5’-trimethoxyflavone (3 mg).
Since Fraction E-3 did not contain the three flavonoids of interest to this project, further
chromatographic and separation procedures for this fraction are not described here. Column
dimensions and fraction volumes were not provided.
2.8.7.6 Liu et al. (1992) Seeds of A. annua L. were extracted with CHCl3 and subjected to column
chromatography on Sephadex LH-20, using MeOH as the eluent. Column dimensions and
fraction volumes were not provided. Fraction 3 of the five fractions obtained contained
flavonoids as major constituents; this fraction was further separated on a silica gel column (silica
gel 5-25 µm particle size) under N2 gas at 725 µPa, eluting with CHCl3, and gradually increasing
the relative concentration of MeOH from 1-50 %. The fractions eluted from the column with
CHCl3 were observed to contain flavonoids. These mixtures of flavonoids were purified using
HPLC, after which CRY (0.06 % DW), CRYD (0.06 % DW), and CRS (0.05 % DW) were
collected. The unspecified flavonoids were subjected to TLC using silica gel GF254 plates, using
CHCl3-MeOH (9:1) as the mobile phase and NH3 for the detection of flavonoids.
2.8.7.7 Shilin et al. (1989) Plant material (19 kg) of A. annua L. was extracted with MeOH. The amount of MeOH
used for extraction was not indicated, nor was the length of time the material extracted with
MeOH. The solution of MeOH and organic compounds was concentrated, and 970 g of extract
were obtained. The residue was partitioned between water and the series of solvents, n-hexane,
31
CHCl3, EtOAc, and lastly, n-BuOH. The residues obtained from each extraction were 172 g, 224
g, 21.2 g, and 288 g, respectively.
The hexane extract was subjected to column chromatography (CC) on polyclar AT; the
size of the column was not denoted. Elution was with CHCl3, and gradually introduced MeOH
to 100 %. CRY and CAS were collected from this column. However, Shilin et al. (1989) did
not indicate the fractions from the column that CAS and CRY were collected from nor the
amount of volume collected in each fraction. Likewise, the column dimensions were not
provided. These flavonoids were further purified using prep TLC on silica gel in CHCL3-MeOH
(9:1).
CRYD, CRY, and CRS were eluted from the CHCl3 extract using the same method
applied to the hexane extract. The amount of CRYD, CRY, and CRS collected from the
fractions was 12 mg, 35 mg, and 2 mg, respectively.
2.8.7.8 Saleh et al. (1987) The procedure for extraction and isolation detailed by Saleh et al. (1987) was especially
ambiguous. Neither the elution solvents used nor the resulting amount of flavonoids collected
was reported. Based on other previously established works, CRS is detected in A. herba-alba, A.
mesatlantica, A. monosperma, and A. capillaris. Plant material from A.herba-alba was extracted
with 70% EtOH and the extracts were concentrated and eluted through a polyamide column. The
flavonoid glycoside fractions were further purified on Sephadex LH-20, and the aglycones
fractions were subjected to prep TLC on polyamide plates, then separated on Sephadex LH-20.
A TLC method was included that claimed that on polyamide TLC plates, in a mobile phase of
benzene-petrol (60-80) methyl ethyl ketone (MEK)-MeOH (60:60:7:7), CAS ran at an Rf of 0.45,
and CRS at 0.26. Another TLC method maintained that CAS had an Rf of 0.69, and CRS had an
32
Rf of 0.60 when run on a silica gel TLC plate in the solvent system benzene-pyridine-formic acid
(36:9:5). These TLC methods were considered potentially useful to the project in determining
the presence of CRS in A. annua.
2.8.7.9 Greenham et al. (2003) Greenham et al. (2003) investigated the possible value of HPLC in combination with
TLC and UV spectral analysis as a means of identifying the lipophilic flavones in their
laboratory. An HPLC with diode array detection, using a Waters Bondapak phenyl C18 reverse-
phase column (300 x 3.9 mm i.d.) at 25°C was used for analysis. The Rf values of CRS in three
different solvent systems on two stationary phases were reported:
1) Silica gel layer eluted with toluene: acetic acid (4:1). Rf: 0.37
2) Microcrystalline cellulose layer eluted with acetic acid: water (3:10). Rf: 0.25
3) Microcrystalline cellulose layer eluted with acetic acid: water (1:1). Rf: 0.63
When using UV-light (365 nm) to detect CRS, it is visible as a dark spot on a UV-irradiated TLC
plate (Greenham et al., 2003).
2.8.8 Previous NMR Analyses of Flavonoids
The chemical shift values of CRY, CRYD and CRS in certain NMR solvents and
conditions have been documented. These NMR values may be useful for future reference to
compare the purity of the fractions collected by column chromatography to that of the flavonoid
standards, as well as the purity of the flavonoid standards that were obtained from outside
sources. Calcagno-Pissarelli et al. (2010) reported chemical shift values for the 1H and 13C NMR
spectra of CRY obtained, using CDCl3 and DMSO-d6 as the NMR solvent. Kraus and Roy
33
(2008) reported the 1H NMR chemical shift values of CRYD, using CDCl3 as the solvent. Ono
et al. (2000) also reported the 1H and 13C NMR chemical shift values for CRYD, using DMSO-
d6 as the solvent. Hammoud et al. (2012) reported the chemical shift values of CRS, from the 1H
and 13C NMR spectra obtained, using MeOH-d4 as the solvent.
34
3.0 Hypothesis
If CRYD, CRY, and CRS, can be successfully and efficiently isolated with their identities
confirmed, then further research can be undertaken to track these flavonoids in A. annua extracts
to determine how these flavonoids are produced in tandem with AN.
35
4.0 Objectives
Because pure standards were obtained in early 2013 for CRY and CRYD, the original
objectives for this project aimed at reaching the desired result of collecting separate, pure
samples of CRY, CRS, and CRYD from A. annua were modified as follows:
1. To test various solvent systems and determine which best extracts flavonoids, while extracting
the least amount of chlorophyll
2. To determine how many successive extractions are sufficient to remove greater than or equal
to 90 percent of flavonoids from plant samples, using the least volume of solvent
3. To determine what solvent systems are best suited to extract each flavonoid separately using
TLC
4. To validate the presence of CRY in the SAM cultivar of A. annua
5. To compare the TLC profiles of compounds extracted from fresh SAM shoot tip and fresh
SAM main stem leaves by visualizing the TLC plates with UV-light and 2 % AlCl3 in MeOH
for flavonoids, and with an anisaldehyde solution for AN and terpenoids
36
5.0 Methods
The plant material used in this project was that of finely ground, dried leaves of A. annua
L., clone SAM or FLV5; the former is a WPI isolated clone and the latter is from a seed
propagated cultivar from Brazil. Fresh shoot tips and leaves of SAM were also harvested and
extracted. The standards CRY (5 mg) and CRYD (5 mg) were obtained at great expense and
after a long wait, from a source in China, while a source for CRS has only recently been
identified and purchase is pending. All TLC plates were photographically recorded using a 3.2
megapixel camera.
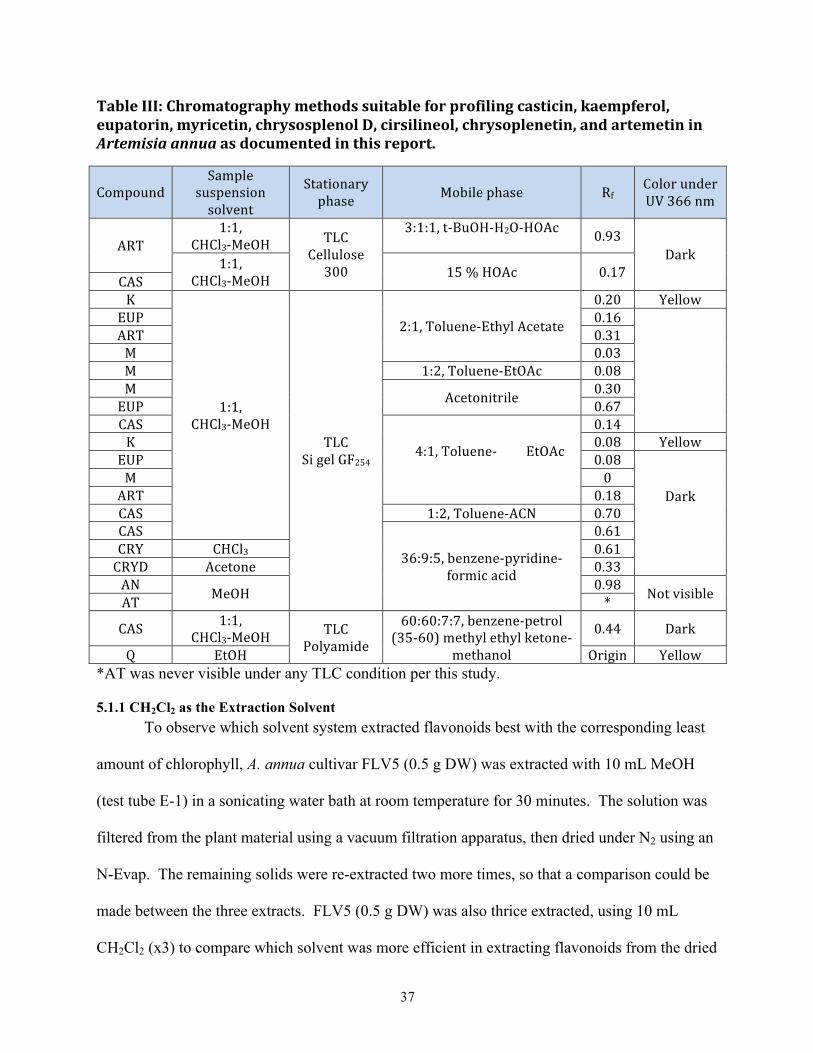
5.1 Preliminary Extraction and TLC Experiments The chromatography methods suitable for profiling CAS, Q, K, EUP, M, CRYD, CRS,
CRY, ART, AN, and AT as reported by experiments in this report can be found in Table III. The
standards were resuspended in one of several suitable solvent systems as indicated in Table III,
spotting from 1-5 µg of the stocks on silica gel 60 F254 TLC plates (EMD Chemicals Inc.,
Catalog No. M57357), polyamide (Sorbent Technologies, Catalog No. 3522126), or on cellulose
300 TLC plates (Sorbent Technologies, Catalog No. 0322126) depending on the experiment. All
dried TLC plates were viewed under UV-light (366 nm). The standards were run in various
solvent systems because CRY and CRD were similar in structure to M, while CRS was similar to
that of EUP. Therefore, if sufficient separation between the standards and movement along the
TLC plate could be achieved, then the conjecture was made that the three flavonoids of interest
to this project would run in a similar manner, and could be separated using the designated
solvent system. Also, with the addition of CRY and CRYD to the collection of standards, a
small amount of both would be tested using the most efficient TLC solvent system for separating
the flavonoids of SAM as empirically determined.
37
Table III: Chromatography methods suitable for profiling casticin, kaempferol, eupatorin, myricetin, chrysosplenol D, cirsilineol, chrysoplenetin, and artemetin in Artemisia annua as documented in this report.
Compound Sample
suspension solvent
Stationary phase Mobile phase Rf
Color under UV 366 nm
ART 1:1,
CHCl3-‐MeOH TLC Cellulose 300
3:1:1, t-‐BuOH-‐H2O-‐HOAc 0.93
Dark 1:1, CHCl3-‐MeOH
15 % HOAc 0.17 CAS K
1:1, CHCl3-‐MeOH
TLC Si gel GF254
2:1, Toluene-‐Ethyl Acetate
0.20 Yellow EUP 0.16
ART 0.31 M 0.03 M 1:2, Toluene-‐EtOAc 0.08 M Acetonitrile 0.30 EUP 0.67 CAS
4:1, Toluene-‐ EtOAc
0.14 K 0.08 Yellow EUP 0.08
Dark
M 0 ART 0.18 CAS 1:2, Toluene-‐ACN 0.70 CAS
36:9:5, benzene-‐pyridine-‐formic acid
0.61 CRY CHCl3 0.61 CRYD Acetone 0.33 AN MeOH 0.98 Not visible AT *
CAS 1:1, CHCl3-‐MeOH TLC
Polyamide
60:60:7:7, benzene-‐petrol (35-‐60) methyl ethyl ketone-‐
methanol
0.44 Dark
Q EtOH Origin Yellow *AT was never visible under any TLC condition per this study.
5.1.1 CH2Cl2 as the Extraction Solvent To observe which solvent system extracted flavonoids best with the corresponding least
amount of chlorophyll, A. annua cultivar FLV5 (0.5 g DW) was extracted with 10 mL MeOH
(test tube E-1) in a sonicating water bath at room temperature for 30 minutes. The solution was
filtered from the plant material using a vacuum filtration apparatus, then dried under N2 using an
N-Evap. The remaining solids were re-extracted two more times, so that a comparison could be
made between the three extracts. FLV5 (0.5 g DW) was also thrice extracted, using 10 mL
CH2Cl2 (x3) to compare which solvent was more efficient in extracting flavonoids from the dried
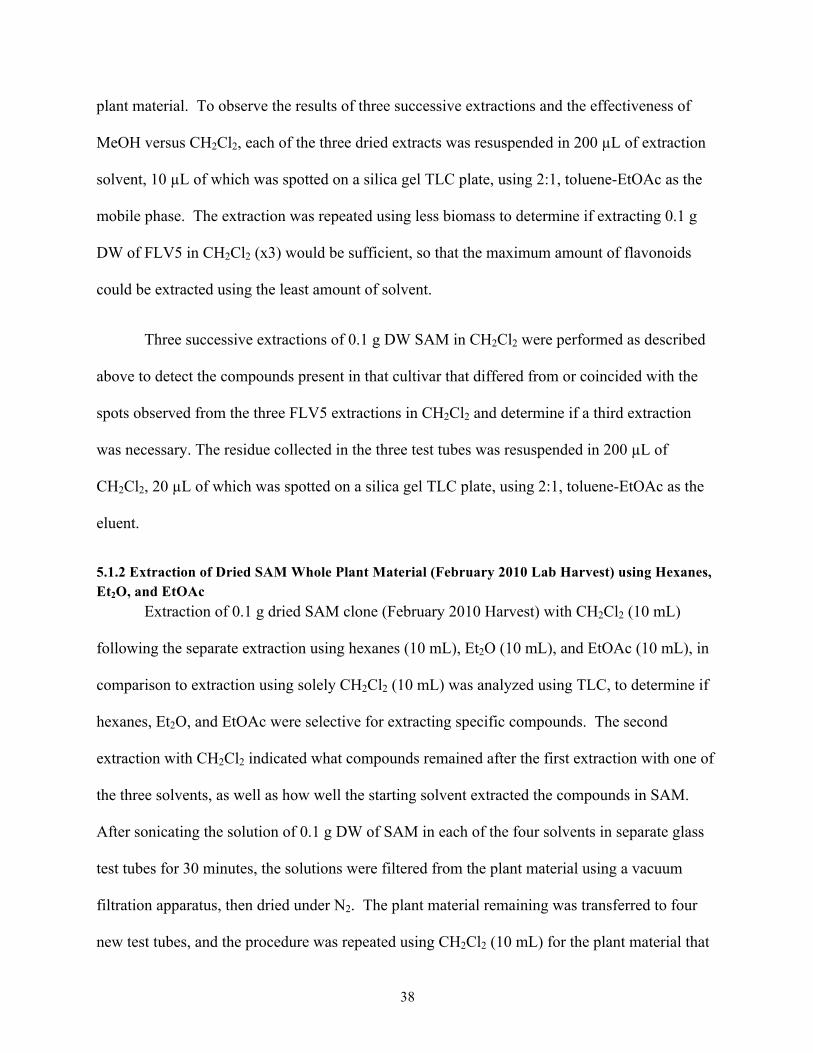
38
plant material. To observe the results of three successive extractions and the effectiveness of
MeOH versus CH2Cl2, each of the three dried extracts was resuspended in 200 µL of extraction
solvent, 10 µL of which was spotted on a silica gel TLC plate, using 2:1, toluene-EtOAc as the
mobile phase. The extraction was repeated using less biomass to determine if extracting 0.1 g
DW of FLV5 in CH2Cl2 (x3) would be sufficient, so that the maximum amount of flavonoids
could be extracted using the least amount of solvent.
Three successive extractions of 0.1 g DW SAM in CH2Cl2 were performed as described
above to detect the compounds present in that cultivar that differed from or coincided with the
spots observed from the three FLV5 extractions in CH2Cl2 and determine if a third extraction
was necessary. The residue collected in the three test tubes was resuspended in 200 µL of
CH2Cl2, 20 µL of which was spotted on a silica gel TLC plate, using 2:1, toluene-EtOAc as the
eluent.
5.1.2 Extraction of Dried SAM Whole Plant Material (February 2010 Lab Harvest) using Hexanes, Et2O, and EtOAc Extraction of 0.1 g dried SAM clone (February 2010 Harvest) with CH2Cl2 (10 mL)
following the separate extraction using hexanes (10 mL), Et2O (10 mL), and EtOAc (10 mL), in
comparison to extraction using solely CH2Cl2 (10 mL) was analyzed using TLC, to determine if
hexanes, Et2O, and EtOAc were selective for extracting specific compounds. The second
extraction with CH2Cl2 indicated what compounds remained after the first extraction with one of
the three solvents, as well as how well the starting solvent extracted the compounds in SAM.
After sonicating the solution of 0.1 g DW of SAM in each of the four solvents in separate glass
test tubes for 30 minutes, the solutions were filtered from the plant material using a vacuum
filtration apparatus, then dried under N2. The plant material remaining was transferred to four
new test tubes, and the procedure was repeated using CH2Cl2 (10 mL) for the plant material that
39
was first extracted with hexanes, Et2O, and EtOAc. The plant residue collected from the
extractions, which involved the seven different combinations of solvents, was analyzed by TLC.
The plant residue collected in each of the seven test tubes was resuspended in 100 µL of the
following solvents, 10 µL of which was spotted on a silica gel TLC plate (20 cm x 8.5 cm), and
run in the mobile phase 2:1, toluene-EtOAc:
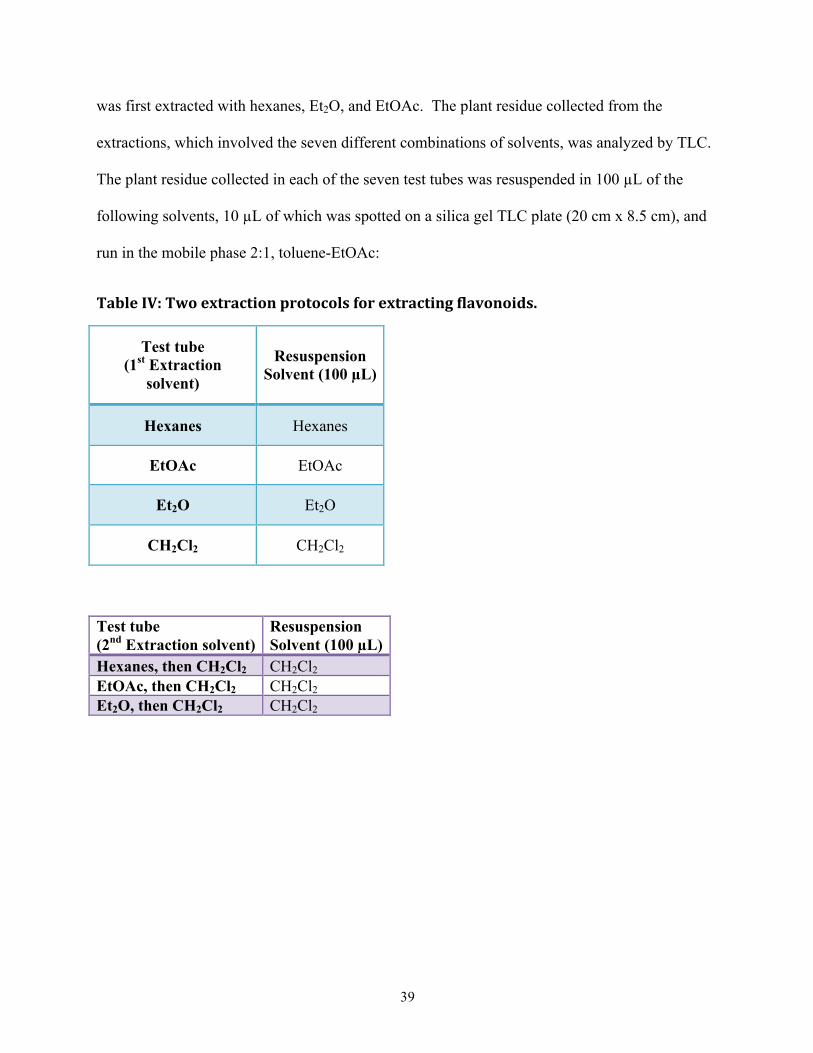
Table IV: Two extraction protocols for extracting flavonoids.
Test tube (1st Extraction
solvent)
Resuspension Solvent (100 µL)
Hexanes Hexanes
EtOAc EtOAc
Et2O Et2O
CH2Cl2 CH2Cl2
Test tube (2nd Extraction solvent)
Resuspension Solvent (100 µL)
Hexanes, then CH2Cl2 CH2Cl2 EtOAc, then CH2Cl2 CH2Cl2 Et2O, then CH2Cl2 CH2Cl2
40
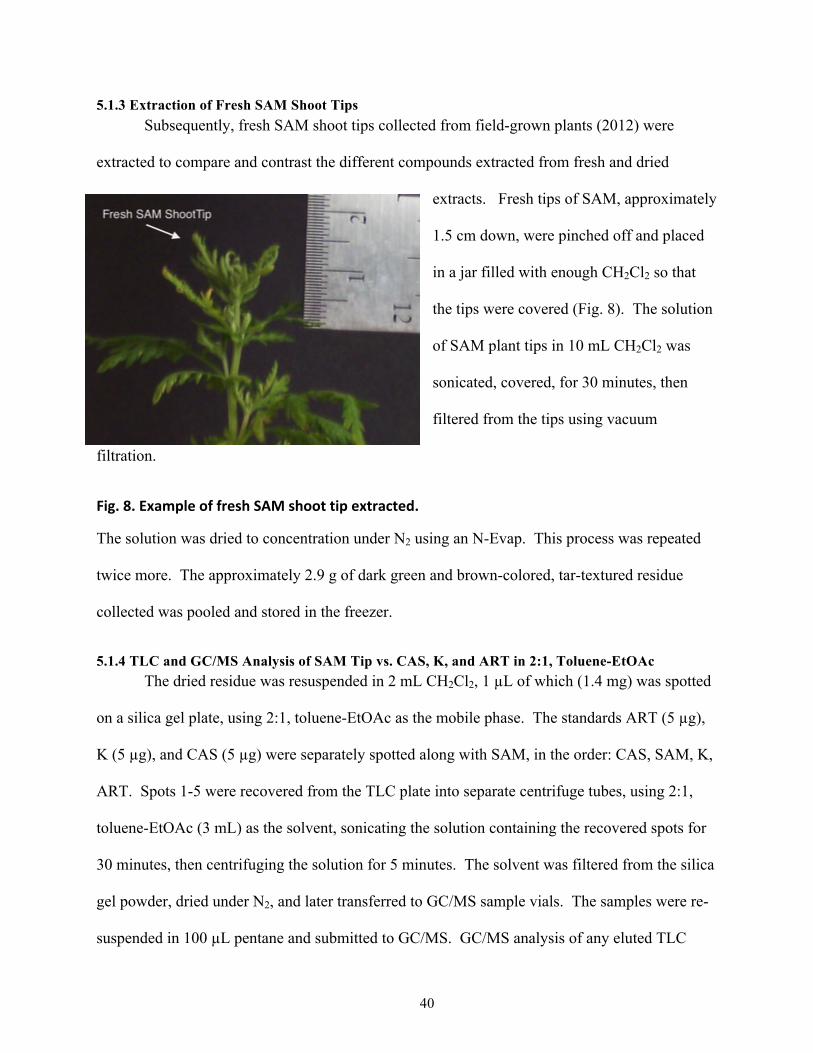
5.1.3 Extraction of Fresh SAM Shoot Tips Subsequently, fresh SAM shoot tips collected from field-grown plants (2012) were
extracted to compare and contrast the different compounds extracted from fresh and dried
extracts. Fresh tips of SAM, approximately
1.5 cm down, were pinched off and placed
in a jar filled with enough CH2Cl2 so that
the tips were covered (Fig. 8). The solution
of SAM plant tips in 10 mL CH2Cl2 was
sonicated, covered, for 30 minutes, then
filtered from the tips using vacuum
filtration.
Fig. 8. Example of fresh SAM shoot tip extracted.
The solution was dried to concentration under N2 using an N-Evap. This process was repeated
twice more. The approximately 2.9 g of dark green and brown-colored, tar-textured residue
collected was pooled and stored in the freezer.
5.1.4 TLC and GC/MS Analysis of SAM Tip vs. CAS, K, and ART in 2:1, Toluene-EtOAc The dried residue was resuspended in 2 mL CH2Cl2, 1 µL of which (1.4 mg) was spotted
on a silica gel plate, using 2:1, toluene-EtOAc as the mobile phase. The standards ART (5 µg),
K (5 µg), and CAS (5 µg) were separately spotted along with SAM, in the order: CAS, SAM, K,
ART. Spots 1-5 were recovered from the TLC plate into separate centrifuge tubes, using 2:1,
toluene-EtOAc (3 mL) as the solvent, sonicating the solution containing the recovered spots for
30 minutes, then centrifuging the solution for 5 minutes. The solvent was filtered from the silica
gel powder, dried under N2, and later transferred to GC/MS sample vials. The samples were re-
suspended in 100 µL pentane and submitted to GC/MS. GC/MS analysis of any eluted TLC
41
spots or any plant extracts was done according to Weathers and Towler (2012) and spectra of
spots 1-5 are shown in the Results.
5.2 Detection of CRYD in SAM Tip through TLC Analysis The detection and separation of CRYD from other compounds in fresh SAM shoot tip
was pursued using the methodology of Roberts et al. (1980), which allowed the use of ART
standard as a reference point. CAS was also used as a standard flavonoid and solvent systems
other than that reported by Roberts et al. (1980) were experimented used.
5.2.1 TLC of SAM Tip to Compare Rf of CAS, ART, and Q in Solvent Systems Reported by Roberts et al. (1980)
The procedure reported by Roberts et al. (1980) was followed, but cellulose 300 TLC
plates were used instead of Whatman 3MM paper. To determine the amount of SAM tip to spot
on the TLC plate that would result in resolved spots, 2.87 g residue of SAM tip extracts were
resuspended in 2.5 mL CH2Cl2, spotting1 µL (1.15 mg) residue, 2 µL (2.3 mg), and 3 µL (3.4
mg) of the solution, along with two spots of 5 µg ART on a cellulose 300 TLC plate (11 cm x 11
cm). The plate was developed in the solvent system 3:1:1,t-BuOH-HOAc-H2O (Roberts et al.,
1980).
A 2-D TLC experiment was run in similar conditions to those described by Roberts et al.
(1980). For the first dimension, 2.5 µg ART and approximately 230 µg SAM tip extract residue
were spotted on the same position of a cellulose 300 TLC plate (20 cm x 20 cm) and run in
3:1:1,t-BuOH-HOAc-H2O. After the plate had developed and dried, the plate was rotated 90
degrees clockwise to develop the second dimension. To provide an ART standard for the second
dimension, ART (2 µg) was spotted above the solvent front, after running the first dimension.
The plate was placed into the TLC developing chamber in the second solvent system, 15 %
HOAc. The Rf of ART (2 µg) on an 11cm x 3 cm cellulose TLC plate developed in 15 % HOAc
42
was also measured. In another run also using 15 % HOAc, the standards Q (3 µg) and CAS (3
µg) were spotted in the same position on either side of the line of SAM tip extract (5,750 µg) on
a cellulose TLC plate (20 cm x 20 cm) in the mobile phase 15 % HOAc.
5.2.2 TLC of SAM Tip to Compare to Rf of CAS, ART, and Q in TLC Conditions other than Those Reported by Roberts et al. (1980)
ART (2.5 µg) and CAS (3 µg) were spotted on a cellulose 300 TLC plate (12.5 cm x 3
cm) and developed in the mobile phase 1:2, toluene-ACN. The standards CAS (3 µg) and ART
(3 µg) were spotted on a cellulose TLC plate (15.5 cm x 3.5 cm) and the plate was developed in
the solvent system 3:1:1:5, t-BuOH-HOAc-H2O-Et2O.
The standards CAS (1.5 µg), Q (1.5 µg), and SAM tip extract (approx. 77 µg) were
developed on three different stationary phases (silica gel, cellulose, and polyamide) in three
different mobile phases (2:1, toluene-EtOAc, 3:1:1, t-BuOH-HOAc-H2O, and 1:4, ACN-
CH2Cl2). The residue of fresh SAM tip extract (approx. 77 µg) and 1 µg Q were applied to a
silica gel TLC plate (9 cm x 3 cm). The TLC plate was developed in the mobile phase 1:1:3,
ACN-HOAc-H2O.
5.3 Detection of CRS in SAM Tip through TLC Analysis The TLC conditions of conditions reported by Voirin et al. (1999), Grayer et al. (1996),
and Saleh et al. (1987) were repeated in the experiments documented here.
5.3.1 TLC of SAM Tip Extract to Compare to Rf of CAS and Q using the TLC Conditions Reported by Voirin et al. (1999) and Grayer et al. (1996) To observe how CAS and Q would move in comparison to compounds from SAM tip
extract, using the TLC conditions reported by Voirin et al. (1999), CAS (1 µg), Q (1 µg), and
SAM tip extract (77 µg) were spotted on a cellulose TLC plate (9 cm x 3 cm). The plate was
developed in the mobile phase 4:6, HOAc-H2O. The TLC conditions reported by Grayer et al.

43
(1996) were also followed. The standards CAS (1 µg) and Q (1 µg) were developed along with
SAM tip extract (77 µg) in the mobile phase 5 % MeOH in CHCl3 on a silica gel TLC plate (9
cm x 3 cm).
5.3.2 TLC of SAM Tip Extract to Compare to Rf of CAS, Q, ART and AN using the TLC Conditions Reported by Saleh et al. (1987) and Various TLC Visualization Reagents CAS (1 µg), and Q (1 µg) were used as an added reference, and SAM tip extract (77 µg)
were either applied onto a polyamide TLC plate and developed in the solvent system (12:5:3)
toluene-MEK-MeOH or (60:60:7:7) benzene-petroleum ether (b.pt. 35-60°C)-MEK-MeOH, or
the compounds were applied onto a silica gel TLC plate and developed in the mobile phase
(36:9:5) benzene-pyridine-formic acid. Q (1 µg), ART (1 µg), and AN (1-2 µg) were also
spotted with Q and SAM tip to determine their Rf values in the solvent system (36:9:5) benzene-
pyridine-formic acid on silica gel TLC plates to determine their Rf values under those TLC
conditions. Plates were sprayed with either 2 % AlCl3 in MeOH to visualize additional
flavonoids beyond those observed under UV-light, after allowing the plate to dry, or with the p-
anisaldehyde solution (50:1:0.5, glacial acetic acid-sulfuric acid-p-anisaldehyde) to visualize
AN. The protocols for preparing the p-anisaldehyde and AlCl3 solutions can be found in
Appendix III. After spraying the plate with the p-anisaldehyde solution, the TLC plate had to be
heated at 105°C for approximately 10 minutes in order for the stained spots to appear (Pras et al.,
1991).
5.4 Development of Acquired Standards CRY and CRYD on Silica Gel in (36:9:5) Benzene-Pyridine-Formic Acid (Saleh et al., 1987) Fresh SAM tip extract (77 µg), CAS (1 µg), CRY (1 µg), and CRYD (1 µg) were applied
to a silica gel TLC plate (14.5 cm x 3 cm). The TLC plate was developed in the solvent system
36:9:5, benzene-pyridine-formic acid.
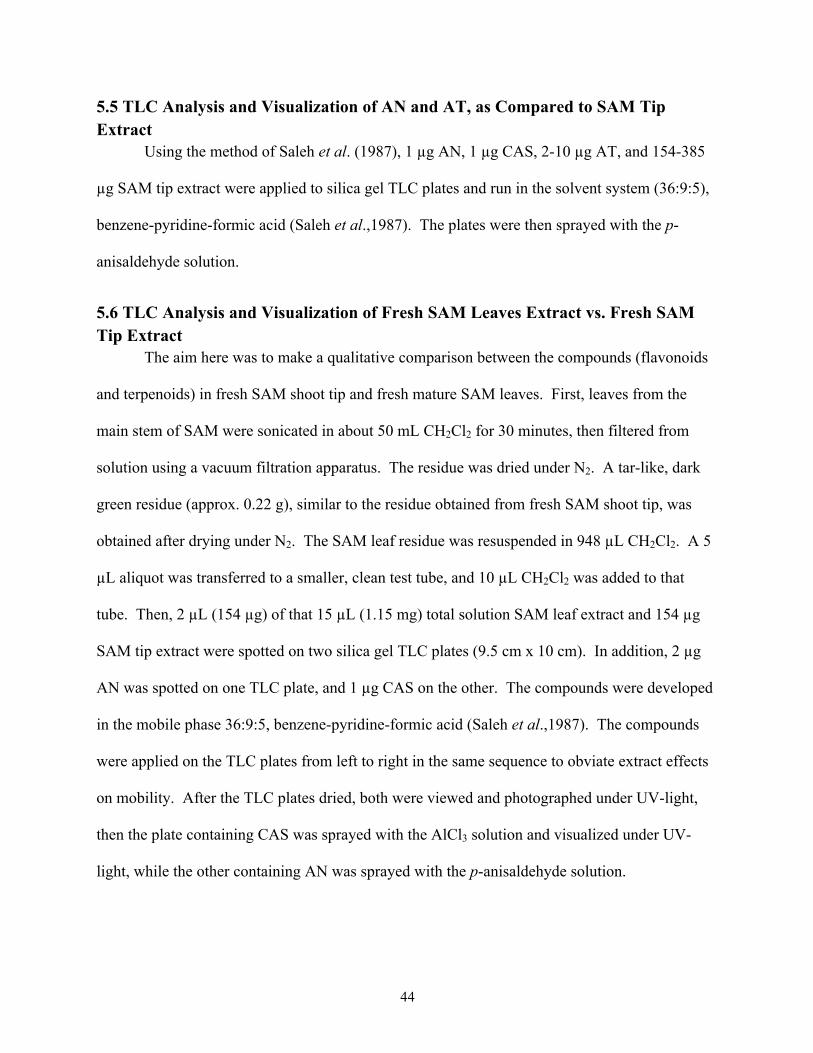
44
5.5 TLC Analysis and Visualization of AN and AT, as Compared to SAM Tip Extract Using the method of Saleh et al. (1987), 1 µg AN, 1 µg CAS, 2-10 µg AT, and 154-385
µg SAM tip extract were applied to silica gel TLC plates and run in the solvent system (36:9:5),
benzene-pyridine-formic acid (Saleh et al.,1987). The plates were then sprayed with the p-
anisaldehyde solution.
5.6 TLC Analysis and Visualization of Fresh SAM Leaves Extract vs. Fresh SAM Tip Extract The aim here was to make a qualitative comparison between the compounds (flavonoids
and terpenoids) in fresh SAM shoot tip and fresh mature SAM leaves. First, leaves from the
main stem of SAM were sonicated in about 50 mL CH2Cl2 for 30 minutes, then filtered from
solution using a vacuum filtration apparatus. The residue was dried under N2. A tar-like, dark
green residue (approx. 0.22 g), similar to the residue obtained from fresh SAM shoot tip, was
obtained after drying under N2. The SAM leaf residue was resuspended in 948 µL CH2Cl2. A 5
µL aliquot was transferred to a smaller, clean test tube, and 10 µL CH2Cl2 was added to that
tube. Then, 2 µL (154 µg) of that 15 µL (1.15 mg) total solution SAM leaf extract and 154 µg
SAM tip extract were spotted on two silica gel TLC plates (9.5 cm x 10 cm). In addition, 2 µg
AN was spotted on one TLC plate, and 1 µg CAS on the other. The compounds were developed
in the mobile phase 36:9:5, benzene-pyridine-formic acid (Saleh et al.,1987). The compounds
were applied on the TLC plates from left to right in the same sequence to obviate extract effects
on mobility. After the TLC plates dried, both were viewed and photographed under UV-light,
then the plate containing CAS was sprayed with the AlCl3 solution and visualized under UV-
light, while the other containing AN was sprayed with the p-anisaldehyde solution.
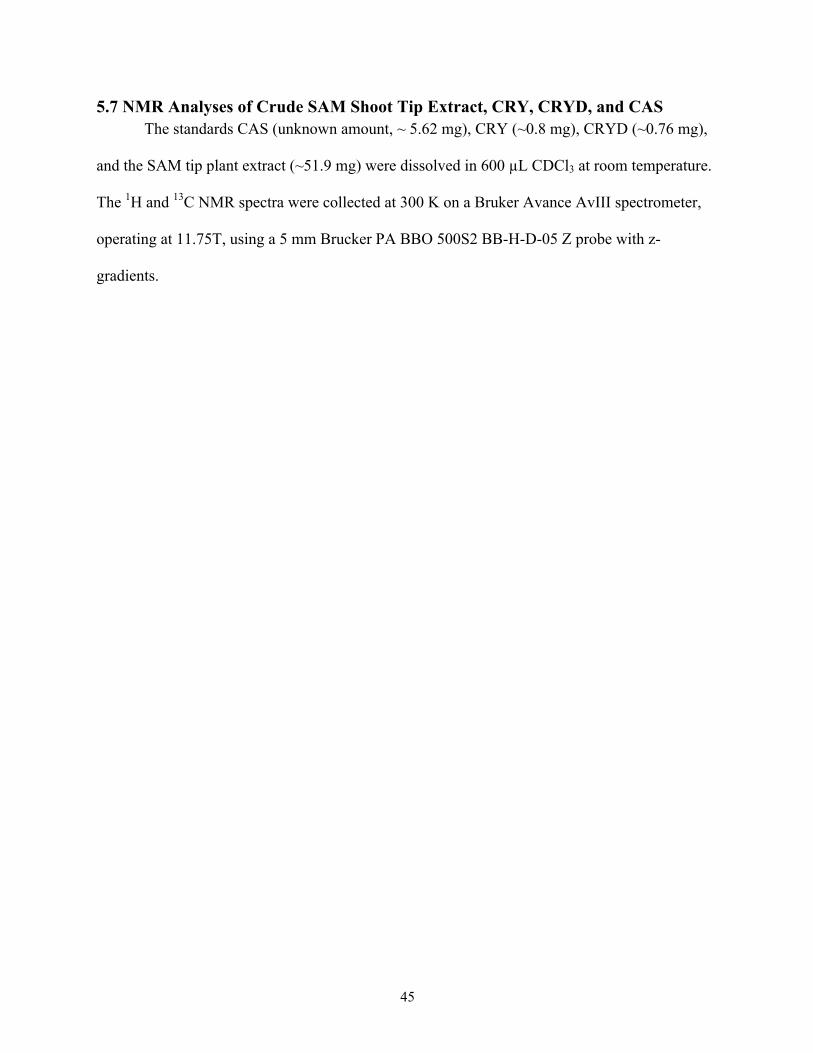
45
5.7 NMR Analyses of Crude SAM Shoot Tip Extract, CRY, CRYD, and CAS The standards CAS (unknown amount, ~ 5.62 mg), CRY (~0.8 mg), CRYD (~0.76 mg),
and the SAM tip plant extract (~51.9 mg) were dissolved in 600 µL CDCl3 at room temperature.
The 1H and 13C NMR spectra were collected at 300 K on a Bruker Avance AvIII spectrometer,
operating at 11.75T, using a 5 mm Brucker PA BBO 500S2 BB-H-D-05 Z probe with z-
gradients.
46
6.0 Results
6.1 Crude Extraction of Flavonoids from Plant Material The first objective of this project was to determine what solvent system best extracted the
greatest amount of flavonoids from Artemisia annua with minimum chlorophyll content and
waste of solvent. A TLC analysis, using 2:1, toluene-EtOAc and a silica gel TLC plate, of 0.1 g
DW of FLV5 in 10 mL CH2Cl2 (x3) showed that only a small amount of biomass (0.1 mg/10 µL
CH2Cl2) was needed to observe the diversity of compounds that clearly separated out of the
extract, and with the least amount of chlorophyll. As shown in Fig. 9, the compounds in the 0.5
g DW FLV5 extract, which used a single volume of 30 mL CH2Cl2 (C3), contained more
chlorophyll than the 0.1 g DW FLV5 extracted with only 10 mL CH2Cl2 (L1). Extraction with
other solvents, such as hexanes, Et2O, and EtOAc, did not prove as effective as CH2Cl2, which
extracted the most compounds from dried whole plant SAM (See Fig. 10). Extraction with
hexanes did not yield many flavonoids, and the white fluorescing spot was visible in all but the
hexanes extraction. The EtOAc extraction resulted in an overloaded TLC plate, therefore, no
spots could be easily defined, only a streak was observed. The ether extraction seemed specific
for two spots at Rf 0.26 and 0.39. Ether did not extract all of what comprised the contents of
these two spots from the plant material, because the two spots were still evident after the plant
material was extracted with the second solvent, CH2Cl2. The solvent, CH2Cl2, extracted
flavonoids the most efficiently, while ether and EtOAc were the second best solvents for
extraction (Fig. 10).
47
Fig. 9. Comparison of three successive CH2Cl2 (10-‐30 mL) extractions of 0.1 g FLV5 (L1-‐L3) and a third successive extraction (30 mL) of 0.5 g FLV5. 0.1 g DW of FLV5 was extracted in 10 mL CH2Cl2 (x3). The residue of the three successive extractions was collected in separate test tubes, which were resuspended in 200 µL CH2Cl2, 20 µL of which was applied to a silica gel TLC plate (17.2 cm x 4.9 cm). The third successive extraction of 0.5 g DW FLV5 was also resuspended in 200 µL CH2Cl2, 20 µL of which was applied to the same plate. The mobile phase was 2:1, toluene-EtOAc.
Fig. 10. Comparison of successive extraction of SAM tip with hexanes, Et2O, and EtOAc, followed by CH2Cl2. SAM tip extracts were spotted on a silica gel TLC plate (17.2 cm x 3.5 cm) and with mobile phase 2:1, toluene-EtOAc. The compounds were spotted on the plate in the order: H1, EA, Et2O, MC, HMC, EAM, and Et2OM. H1, EA, Et2O, and MC refer to the first extraction in hexanes, EtOAc, and Et2O, and CH2Cl2, respectively. HMC, EAM, and Et2OM, refer to the second sequential extraction of the plant material in CH2Cl2. (Refer to Section 5.1.2 for details.) The plate was visualized under UV-light, 366 nm.
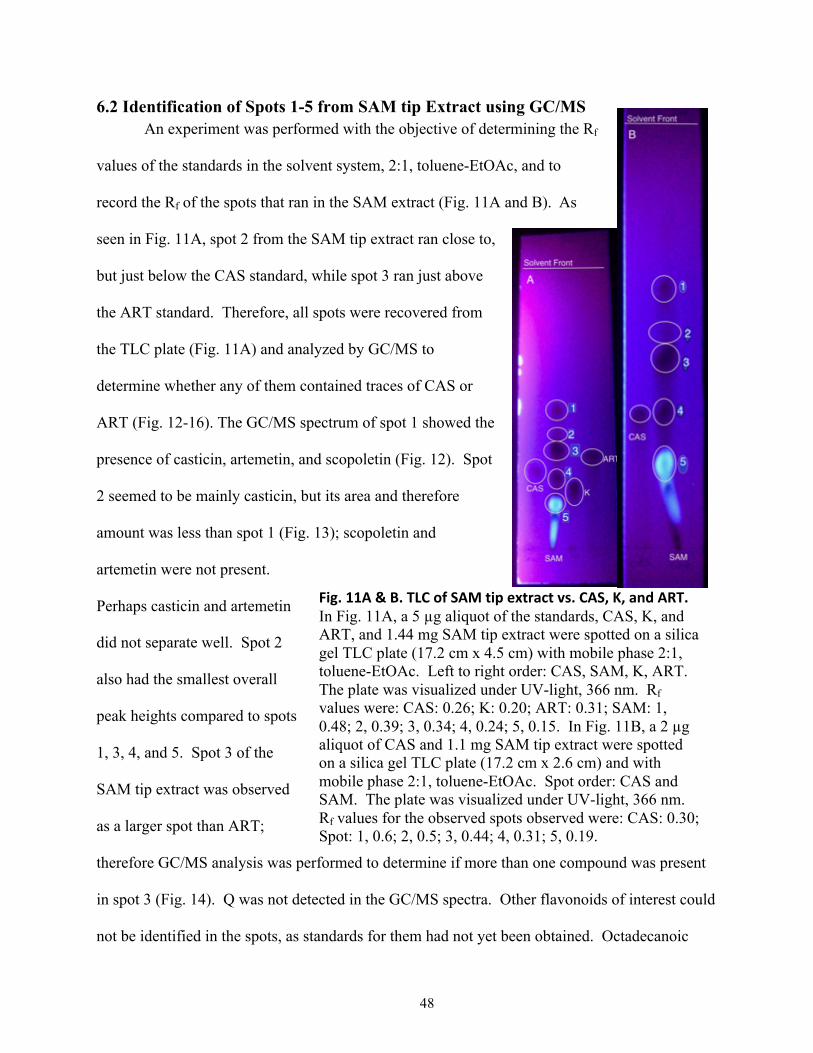
48
6.2 Identification of Spots 1-5 from SAM tip Extract using GC/MS An experiment was performed with the objective of determining the Rf
values of the standards in the solvent system, 2:1, toluene-EtOAc, and to
record the Rf of the spots that ran in the SAM extract (Fig. 11A and B). As
seen in Fig. 11A, spot 2 from the SAM tip extract ran close to,
but just below the CAS standard, while spot 3 ran just above
the ART standard. Therefore, all spots were recovered from
the TLC plate (Fig. 11A) and analyzed by GC/MS to
determine whether any of them contained traces of CAS or
ART (Fig. 12-16). The GC/MS spectrum of spot 1 showed the
presence of casticin, artemetin, and scopoletin (Fig. 12). Spot
2 seemed to be mainly casticin, but its area and therefore
amount was less than spot 1 (Fig. 13); scopoletin and
artemetin were not present.
Perhaps casticin and artemetin
did not separate well. Spot 2
also had the smallest overall
peak heights compared to spots
1, 3, 4, and 5. Spot 3 of the
SAM tip extract was observed
as a larger spot than ART;
therefore GC/MS analysis was performed to determine if more than one compound was present
in spot 3 (Fig. 14). Q was not detected in the GC/MS spectra. Other flavonoids of interest could
not be identified in the spots, as standards for them had not yet been obtained. Octadecanoic
Fig. 11A & B. TLC of SAM tip extract vs. CAS, K, and ART. In Fig. 11A, a 5 µg aliquot of the standards, CAS, K, and ART, and 1.44 mg SAM tip extract were spotted on a silica gel TLC plate (17.2 cm x 4.5 cm) with mobile phase 2:1, toluene-EtOAc. Left to right order: CAS, SAM, K, ART. The plate was visualized under UV-light, 366 nm. Rf values were: CAS: 0.26; K: 0.20; ART: 0.31; SAM: 1, 0.48; 2, 0.39; 3, 0.34; 4, 0.24; 5, 0.15. In Fig. 11B, a 2 µg aliquot of CAS and 1.1 mg SAM tip extract were spotted on a silica gel TLC plate (17.2 cm x 2.6 cm) and with mobile phase 2:1, toluene-EtOAc. Spot order: CAS and SAM. The plate was visualized under UV-light, 366 nm. Rf values for the observed spots observed were: CAS: 0.30; Spot: 1, 0.6; 2, 0.5; 3, 0.44; 4, 0.31; 5, 0.19.
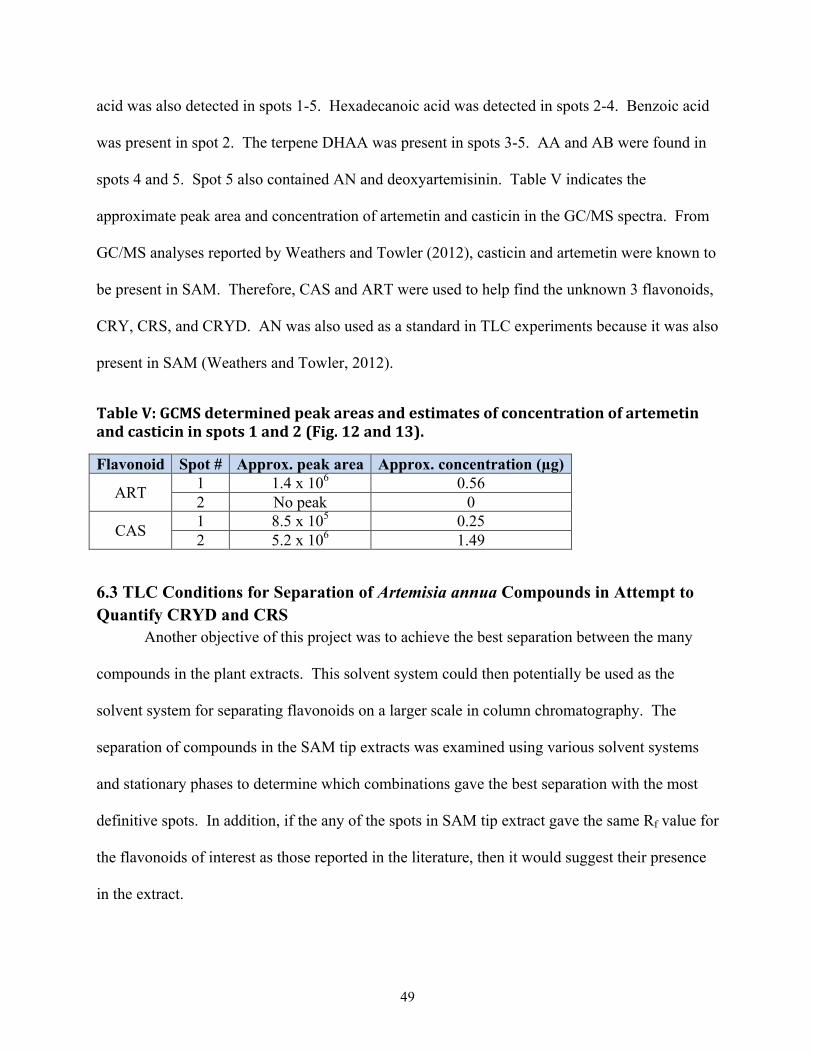
49
acid was also detected in spots 1-5. Hexadecanoic acid was detected in spots 2-4. Benzoic acid
was present in spot 2. The terpene DHAA was present in spots 3-5. AA and AB were found in
spots 4 and 5. Spot 5 also contained AN and deoxyartemisinin. Table V indicates the
approximate peak area and concentration of artemetin and casticin in the GC/MS spectra. From
GC/MS analyses reported by Weathers and Towler (2012), casticin and artemetin were known to
be present in SAM. Therefore, CAS and ART were used to help find the unknown 3 flavonoids,
CRY, CRS, and CRYD. AN was also used as a standard in TLC experiments because it was also
present in SAM (Weathers and Towler, 2012).
Table V: GCMS determined peak areas and estimates of concentration of artemetin and casticin in spots 1 and 2 (Fig. 12 and 13).
Flavonoid Spot # Approx. peak area Approx. concentration (µg)
ART 1 1.4 x 10⁶ 0.56 2 No peak 0
CAS 1 8.5 x 10⁵ 0.25 2 5.2 x 10⁶ 1.49
6.3 TLC Conditions for Separation of Artemisia annua Compounds in Attempt to Quantify CRYD and CRS
Another objective of this project was to achieve the best separation between the many
compounds in the plant extracts. This solvent system could then potentially be used as the
solvent system for separating flavonoids on a larger scale in column chromatography. The
separation of compounds in the SAM tip extracts was examined using various solvent systems
and stationary phases to determine which combinations gave the best separation with the most
definitive spots. In addition, if the any of the spots in SAM tip extract gave the same Rf value for
the flavonoids of interest as those reported in the literature, then it would suggest their presence
in the extract.
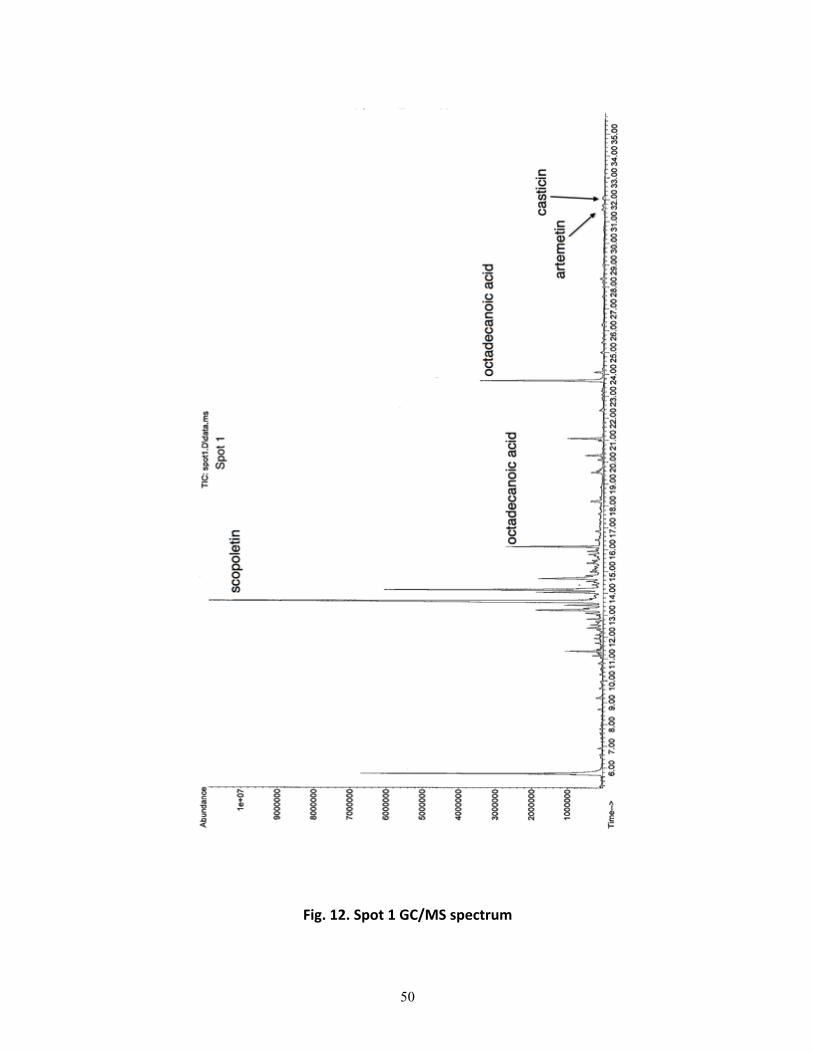
50
Fig. 12. Spot 1 GC/MS spectrum
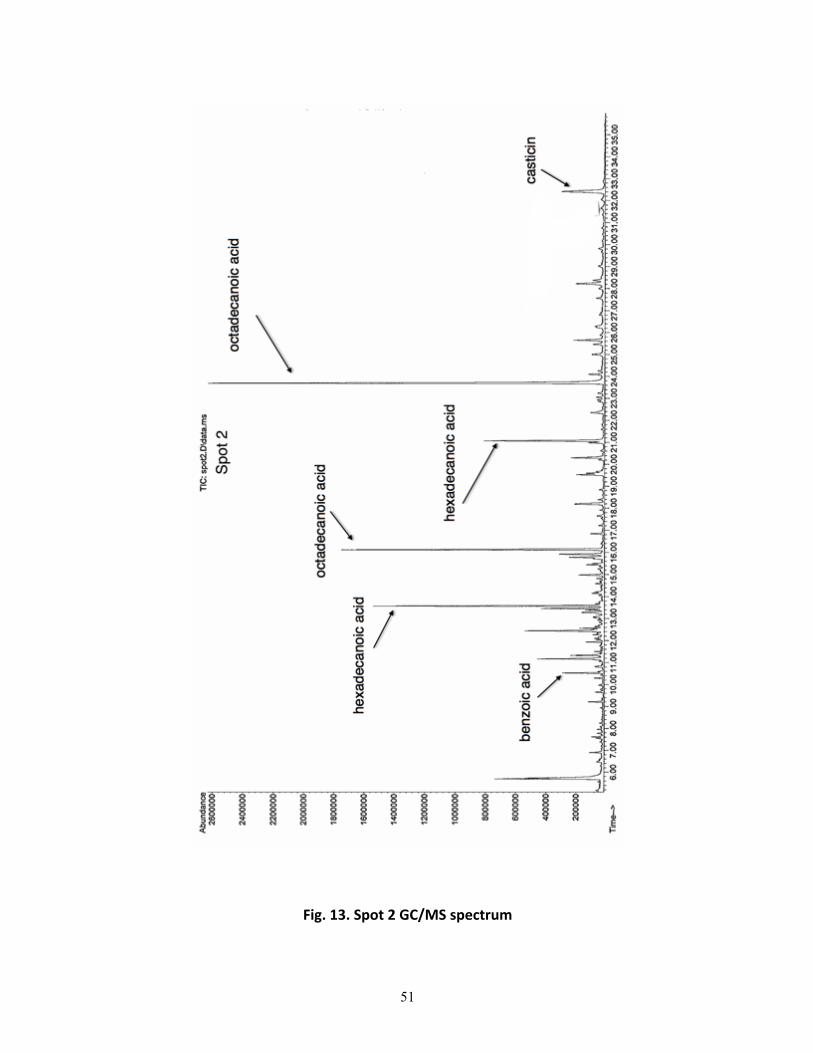
51
Fig. 13. Spot 2 GC/MS spectrum
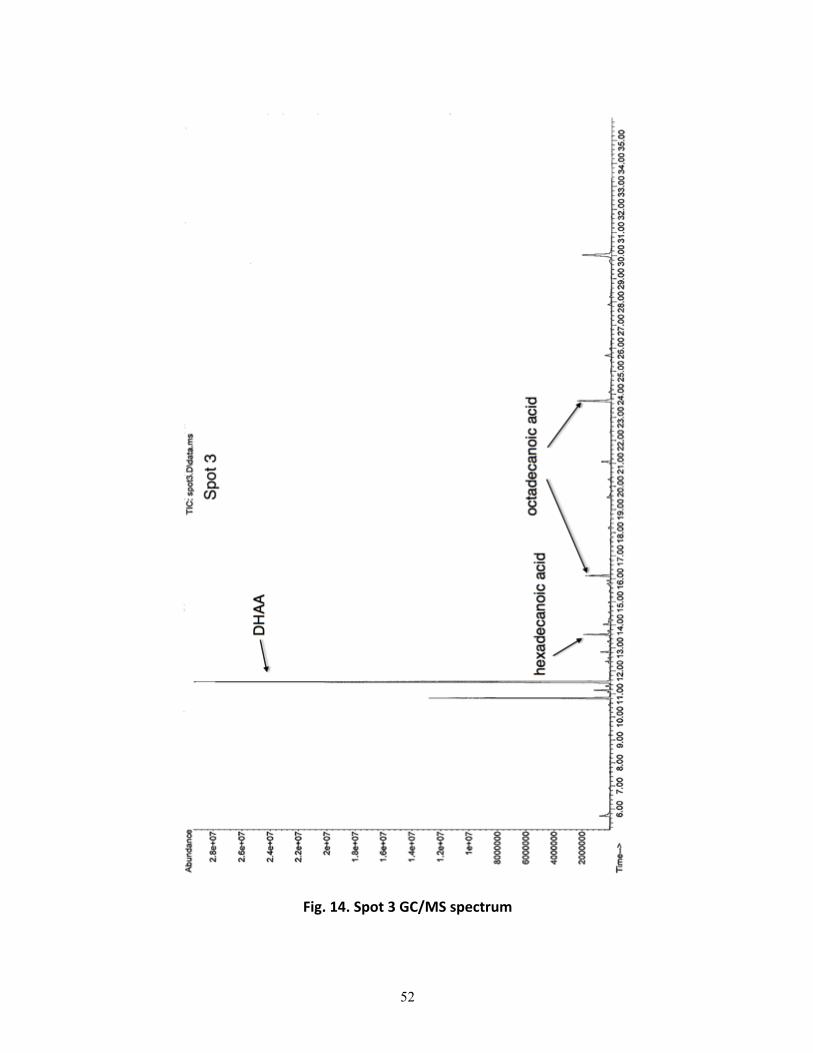
52
Fig. 14. Spot 3 GC/MS spectrum
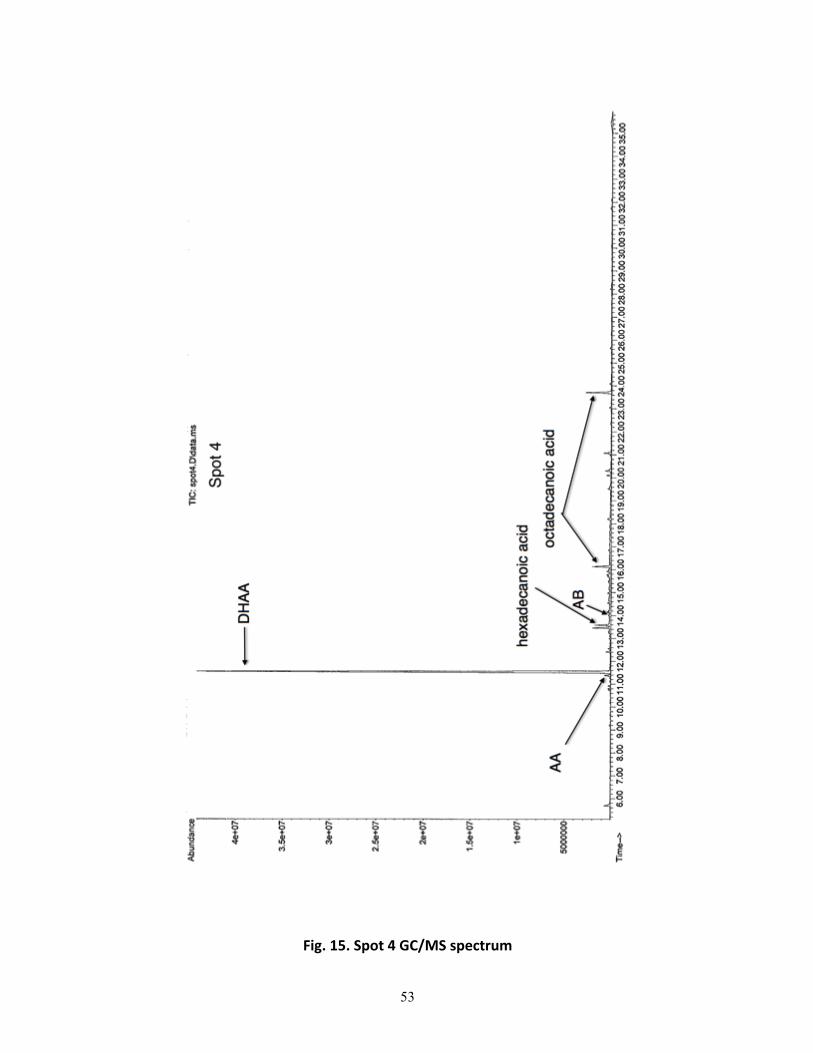
53
Fig. 15. Spot 4 GC/MS spectrum
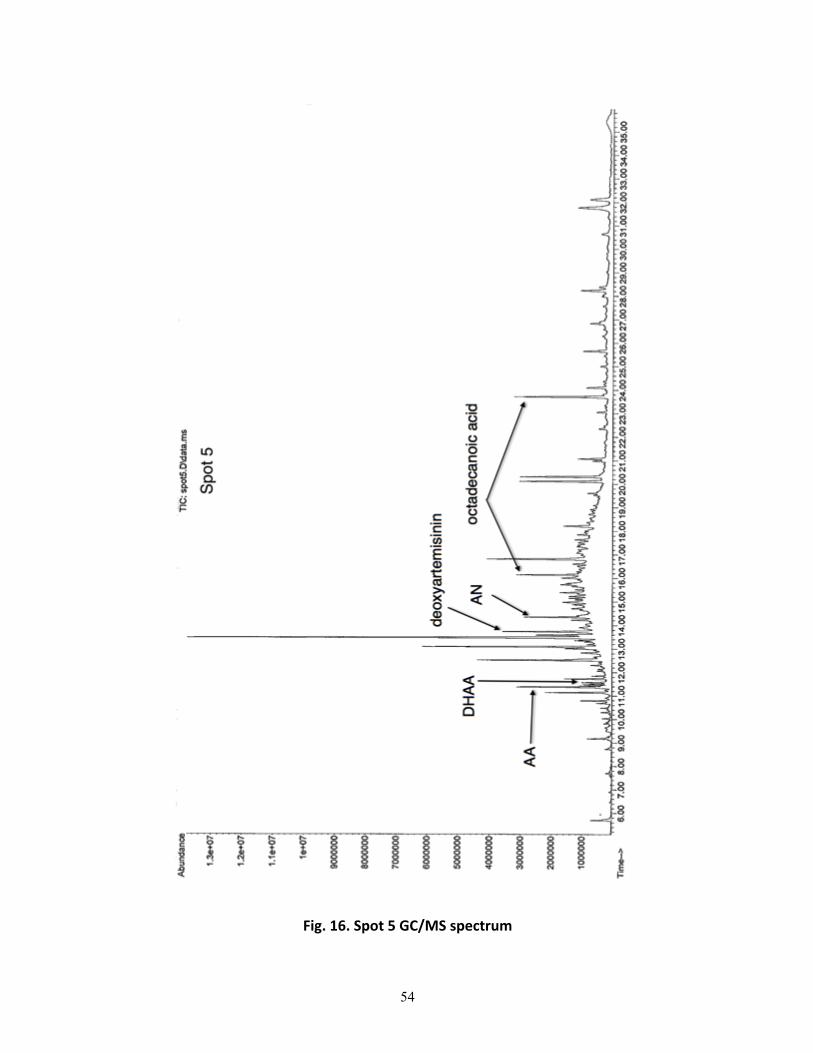
54
Fig. 16. Spot 5 GC/MS spectrum
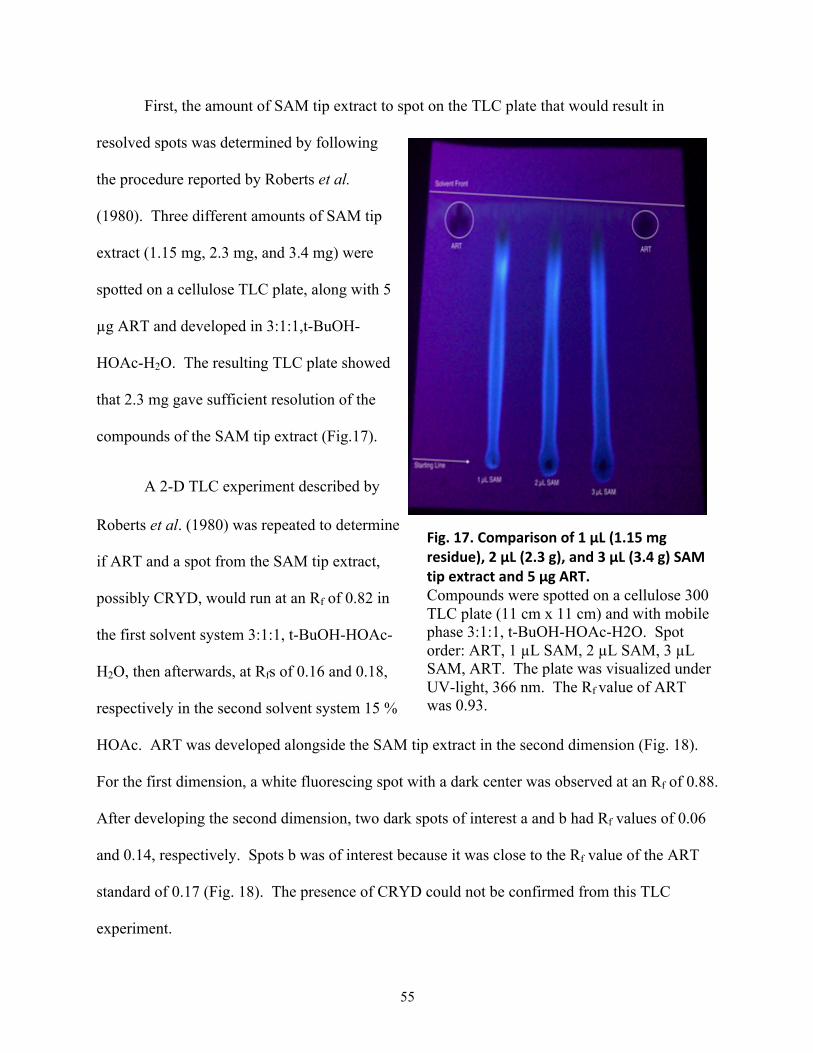
55
First, the amount of SAM tip extract to spot on the TLC plate that would result in
resolved spots was determined by following
the procedure reported by Roberts et al.
(1980). Three different amounts of SAM tip
extract (1.15 mg, 2.3 mg, and 3.4 mg) were
spotted on a cellulose TLC plate, along with 5
µg ART and developed in 3:1:1,t-BuOH-
HOAc-H2O. The resulting TLC plate showed
that 2.3 mg gave sufficient resolution of the
compounds of the SAM tip extract (Fig.17).
A 2-D TLC experiment described by
Roberts et al. (1980) was repeated to determine
if ART and a spot from the SAM tip extract,
possibly CRYD, would run at an Rf of 0.82 in
the first solvent system 3:1:1, t-BuOH-HOAc-
H2O, then afterwards, at Rfs of 0.16 and 0.18,
respectively in the second solvent system 15 %
HOAc. ART was developed alongside the SAM tip extract in the second dimension (Fig. 18).
For the first dimension, a white fluorescing spot with a dark center was observed at an Rf of 0.88.
After developing the second dimension, two dark spots of interest a and b had Rf values of 0.06
and 0.14, respectively. Spots b was of interest because it was close to the Rf value of the ART
standard of 0.17 (Fig. 18). The presence of CRYD could not be confirmed from this TLC
experiment.
Fig. 17. Comparison of 1 µL (1.15 mg residue), 2 µL (2.3 g), and 3 µL (3.4 g) SAM tip extract and 5 µg ART. Compounds were spotted on a cellulose 300 TLC plate (11 cm x 11 cm) and with mobile phase 3:1:1, t-BuOH-HOAc-H2O. Spot order: ART, 1 µL SAM, 2 µL SAM, 3 µL SAM, ART. The plate was visualized under UV-light, 366 nm. The Rf value of ART was 0.93.
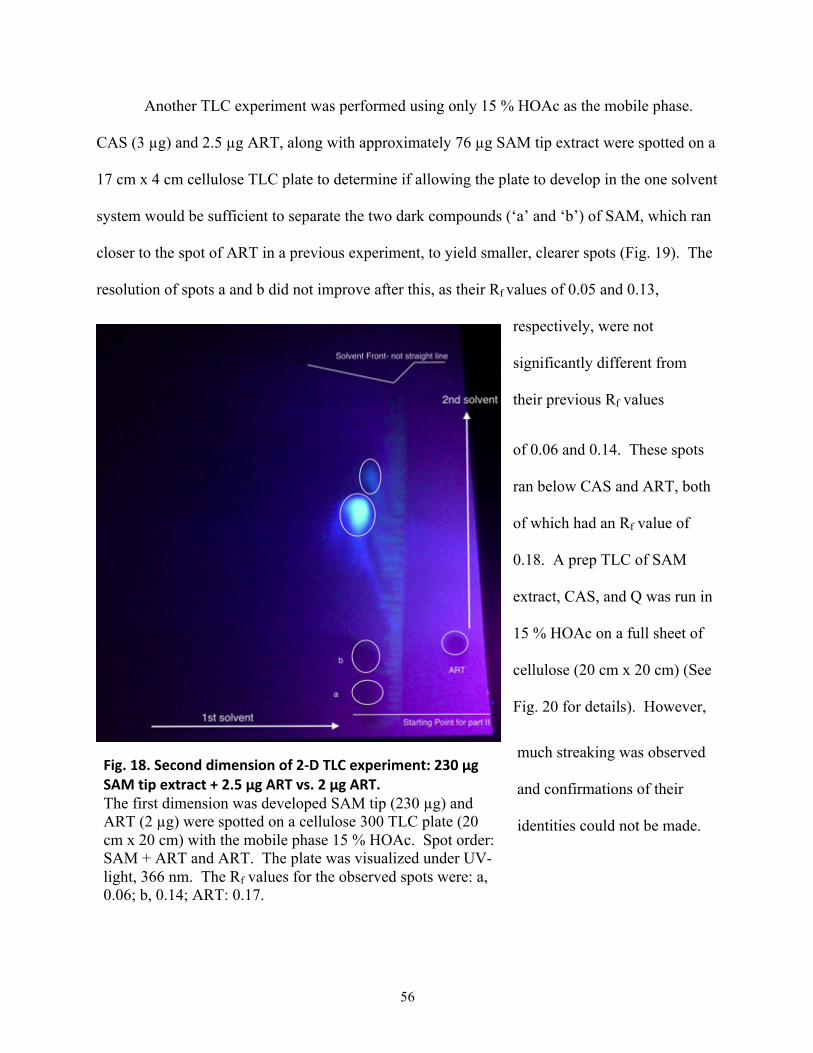
56
Another TLC experiment was performed using only 15 % HOAc as the mobile phase.
CAS (3 µg) and 2.5 µg ART, along with approximately 76 µg SAM tip extract were spotted on a
17 cm x 4 cm cellulose TLC plate to determine if allowing the plate to develop in the one solvent
system would be sufficient to separate the two dark compounds (‘a’ and ‘b’) of SAM, which ran
closer to the spot of ART in a previous experiment, to yield smaller, clearer spots (Fig. 19). The
resolution of spots a and b did not improve after this, as their Rf values of 0.05 and 0.13,
respectively, were not
significantly different from
their previous Rf values
of 0.06 and 0.14. These spots
ran below CAS and ART, both
of which had an Rf value of
0.18. A prep TLC of SAM
extract, CAS, and Q was run in
15 % HOAc on a full sheet of
cellulose (20 cm x 20 cm) (See
Fig. 20 for details). However,
much streaking was observed
and confirmations of their
identities could not be made.
Fig. 18. Second dimension of 2-‐D TLC experiment: 230 µg SAM tip extract + 2.5 µg ART vs. 2 µg ART. The first dimension was developed SAM tip (230 µg) and ART (2 µg) were spotted on a cellulose 300 TLC plate (20 cm x 20 cm) with the mobile phase 15 % HOAc. Spot order: SAM + ART and ART. The plate was visualized under UV-light, 366 nm. The Rf values for the observed spots were: a, 0.06; b, 0.14; ART: 0.17.
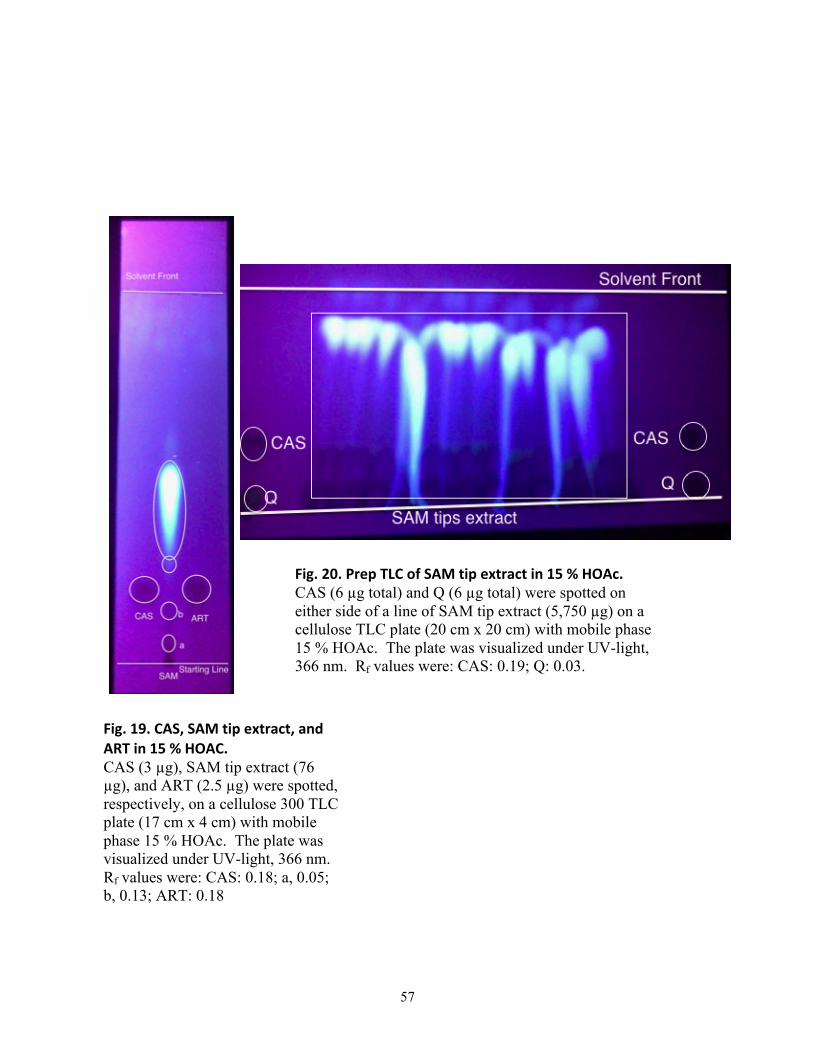
57
Fig. 19. CAS, SAM tip extract, and ART in 15 % HOAC. CAS (3 µg), SAM tip extract (76 µg), and ART (2.5 µg) were spotted, respectively, on a cellulose 300 TLC plate (17 cm x 4 cm) with mobile phase 15 % HOAc. The plate was visualized under UV-light, 366 nm. Rf values were: CAS: 0.18; a, 0.05; b, 0.13; ART: 0.18
Fig. 20. Prep TLC of SAM tip extract in 15 % HOAc. CAS (6 µg total) and Q (6 µg total) were spotted on either side of a line of SAM tip extract (5,750 µg) on a cellulose TLC plate (20 cm x 20 cm) with mobile phase 15 % HOAc. The plate was visualized under UV-light, 366 nm. Rf values were: CAS: 0.19; Q: 0.03.
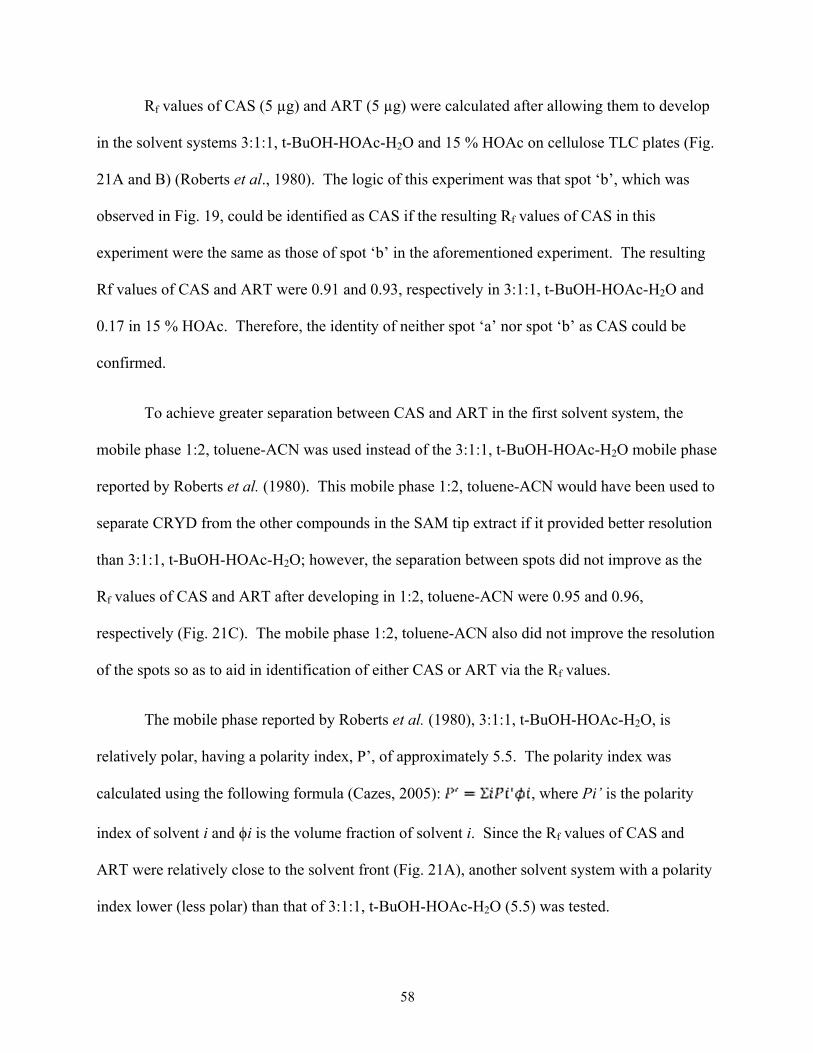
58
Rf values of CAS (5 µg) and ART (5 µg) were calculated after allowing them to develop
in the solvent systems 3:1:1, t-BuOH-HOAc-H2O and 15 % HOAc on cellulose TLC plates (Fig.
21A and B) (Roberts et al., 1980). The logic of this experiment was that spot ‘b’, which was
observed in Fig. 19, could be identified as CAS if the resulting Rf values of CAS in this
experiment were the same as those of spot ‘b’ in the aforementioned experiment. The resulting
Rf values of CAS and ART were 0.91 and 0.93, respectively in 3:1:1, t-BuOH-HOAc-H2O and
0.17 in 15 % HOAc. Therefore, the identity of neither spot ‘a’ nor spot ‘b’ as CAS could be
confirmed.
To achieve greater separation between CAS and ART in the first solvent system, the
mobile phase 1:2, toluene-ACN was used instead of the 3:1:1, t-BuOH-HOAc-H2O mobile phase
reported by Roberts et al. (1980). This mobile phase 1:2, toluene-ACN would have been used to
separate CRYD from the other compounds in the SAM tip extract if it provided better resolution
than 3:1:1, t-BuOH-HOAc-H2O; however, the separation between spots did not improve as the
Rf values of CAS and ART after developing in 1:2, toluene-ACN were 0.95 and 0.96,
respectively (Fig. 21C). The mobile phase 1:2, toluene-ACN also did not improve the resolution
of the spots so as to aid in identification of either CAS or ART via the Rf values.
The mobile phase reported by Roberts et al. (1980), 3:1:1, t-BuOH-HOAc-H2O, is
relatively polar, having a polarity index, P’, of approximately 5.5. The polarity index was
calculated using the following formula (Cazes, 2005): , where Pi’ is the polarity
index of solvent i and ϕi is the volume fraction of solvent i. Since the Rf values of CAS and
ART were relatively close to the solvent front (Fig. 21A), another solvent system with a polarity
index lower (less polar) than that of 3:1:1, t-BuOH-HOAc-H2O (5.5) was tested.
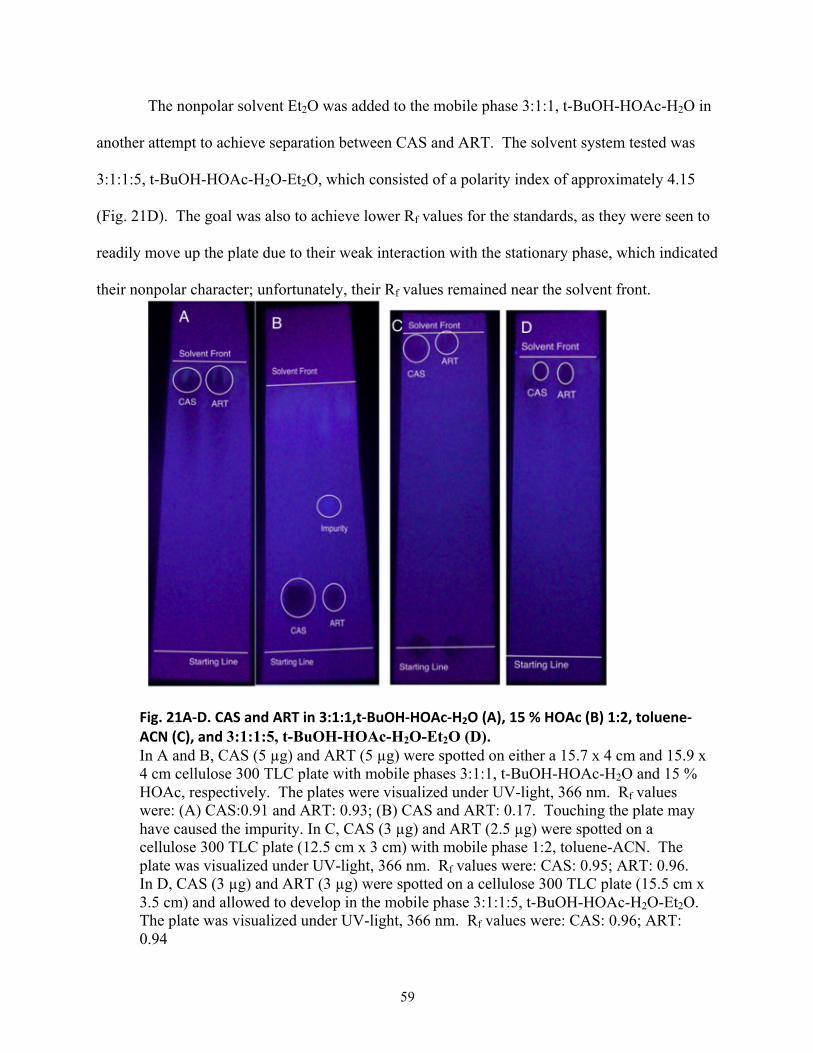
59
The nonpolar solvent Et2O was added to the mobile phase 3:1:1, t-BuOH-HOAc-H2O in
another attempt to achieve separation between CAS and ART. The solvent system tested was
3:1:1:5, t-BuOH-HOAc-H2O-Et2O, which consisted of a polarity index of approximately 4.15
(Fig. 21D). The goal was also to achieve lower Rf values for the standards, as they were seen to
readily move up the plate due to their weak interaction with the stationary phase, which indicated
their nonpolar character; unfortunately, their Rf values remained near the solvent front.
Fig. 21A-‐D. CAS and ART in 3:1:1,t-‐BuOH-‐HOAc-‐H2O (A), 15 % HOAc (B) 1:2, toluene-‐ACN (C), and 3:1:1:5, t-BuOH-HOAc-H2O-Et2O (D). In A and B, CAS (5 µg) and ART (5 µg) were spotted on either a 15.7 x 4 cm and 15.9 x 4 cm cellulose 300 TLC plate with mobile phases 3:1:1, t-BuOH-HOAc-H2O and 15 % HOAc, respectively. The plates were visualized under UV-light, 366 nm. Rf values were: (A) CAS:0.91 and ART: 0.93; (B) CAS and ART: 0.17. Touching the plate may have caused the impurity. In C, CAS (3 µg) and ART (2.5 µg) were spotted on a cellulose 300 TLC plate (12.5 cm x 3 cm) with mobile phase 1:2, toluene-ACN. The plate was visualized under UV-light, 366 nm. Rf values were: CAS: 0.95; ART: 0.96. In D, CAS (3 µg) and ART (3 µg) were spotted on a cellulose 300 TLC plate (15.5 cm x 3.5 cm) and allowed to develop in the mobile phase 3:1:1:5, t-BuOH-HOAc-H2O-Et2O. The plate was visualized under UV-light, 366 nm. Rf values were: CAS: 0.96; ART: 0.94
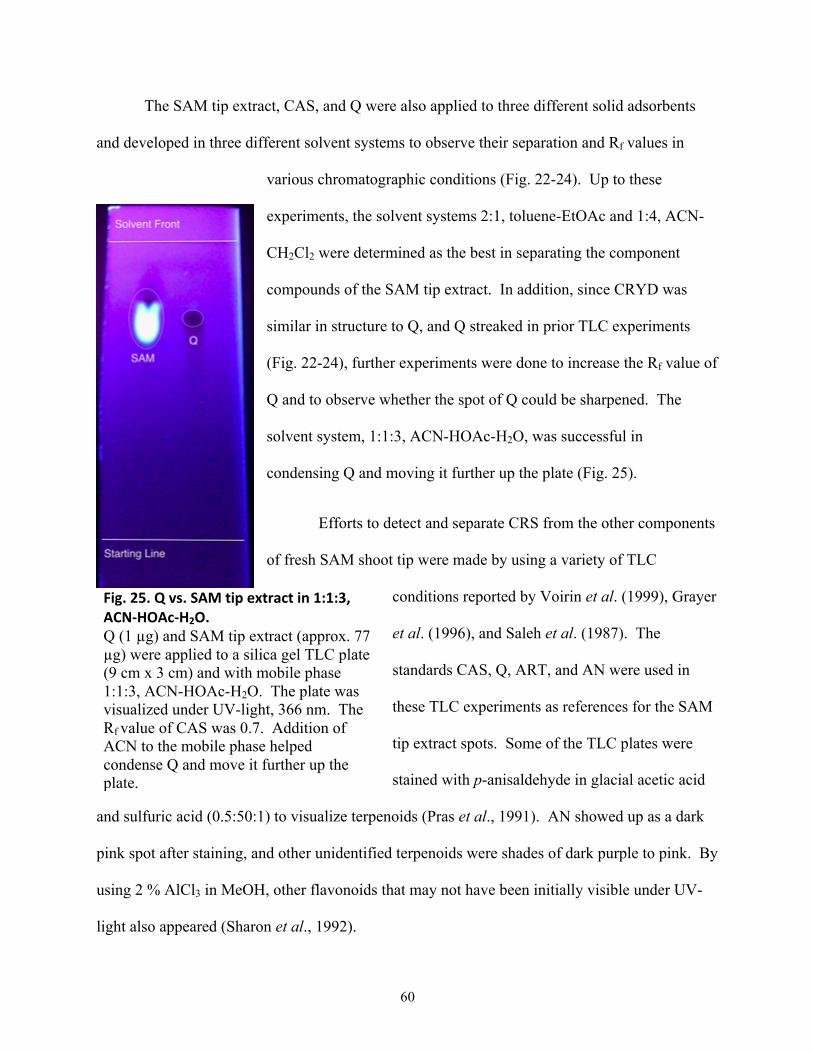
60
The SAM tip extract, CAS, and Q were also applied to three different solid adsorbents
and developed in three different solvent systems to observe their separation and Rf values in
various chromatographic conditions (Fig. 22-24). Up to these
experiments, the solvent systems 2:1, toluene-EtOAc and 1:4, ACN-
CH2Cl2 were determined as the best in separating the component
compounds of the SAM tip extract. In addition, since CRYD was
similar in structure to Q, and Q streaked in prior TLC experiments
(Fig. 22-24), further experiments were done to increase the Rf value of
Q and to observe whether the spot of Q could be sharpened. The
solvent system, 1:1:3, ACN-HOAc-H2O, was successful in
condensing Q and moving it further up the plate (Fig. 25).
Efforts to detect and separate CRS from the other components
of fresh SAM shoot tip were made by using a variety of TLC
conditions reported by Voirin et al. (1999), Grayer
et al. (1996), and Saleh et al. (1987). The
standards CAS, Q, ART, and AN were used in
these TLC experiments as references for the SAM
tip extract spots. Some of the TLC plates were
stained with p-anisaldehyde in glacial acetic acid
and sulfuric acid (0.5:50:1) to visualize terpenoids (Pras et al., 1991). AN showed up as a dark
pink spot after staining, and other unidentified terpenoids were shades of dark purple to pink. By
using 2 % AlCl3 in MeOH, other flavonoids that may not have been initially visible under UV-
light also appeared (Sharon et al., 1992).
Fig. 25. Q vs. SAM tip extract in 1:1:3, ACN-‐HOAc-‐H2O. Q (1 µg) and SAM tip extract (approx. 77 µg) were applied to a silica gel TLC plate (9 cm x 3 cm) and with mobile phase 1:1:3, ACN-HOAc-H2O. The plate was visualized under UV-light, 366 nm. The Rf value of CAS was 0.7. Addition of ACN to the mobile phase helped condense Q and move it further up the plate.
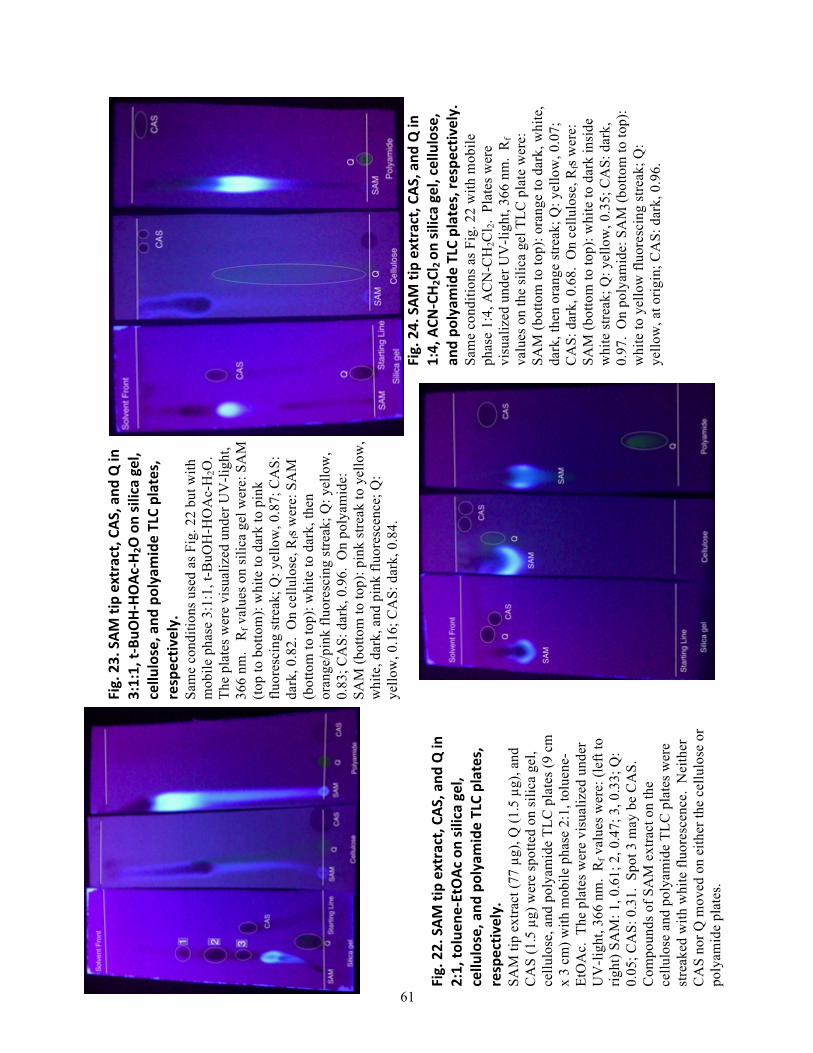
61
Fig. 24. SAM
tip extract, CA
S, and
Q in
1:4, ACN
-‐CH 2Cl
2 on
silica gel, cellu
lose,
and po
lyam
ide TLC plates, respe
ctively.
Sam
e co
nditi
ons a
s Fig
. 22
with
mob
ile
phas
e 1:
4, A
CN
-CH
2Cl 2.
Pla
tes w
ere
visu
aliz
ed u
nder
UV
-ligh
t, 36
6 nm
. R
f va
lues
on
the
silic
a ge
l TLC
pla
te w
ere:
SA
M (b
otto
m to
top)
: ora
nge
to d
ark,
whi
te,
dark
, the
n or
ange
stre
ak; Q
: yel
low
, 0.0
7;
CA
S: d
ark,
0.6
8. O
n ce
llulo
se, R
fs w
ere:
SA
M (b
otto
m to
top)
: whi
te to
dar
k in
side
w
hite
stre
ak; Q
: yel
low
, 0.3
5; C
AS:
dar
k,
0.97
. O
n po
lyam
ide:
SA
M (b
otto
m to
top)
: w
hite
to y
ello
w fl
uore
scin
g st
reak
; Q:
yello
w, a
t orig
in; C
AS:
dar
k, 0
.96.
Fig. 22. SAM
tip extract, CA
S, and
Q in
2:1, to
luen
e-‐EtOAc
on silica gel,
cellu
lose, and
polyamide TLC plates,
respectiv
ely.
SAM
tip
extra
ct (7
7 µg
), Q
(1.5
µg)
, and
C
AS
(1.5
µg)
wer
e sp
otte
d on
silic
a ge
l, ce
llulo
se, a
nd p
olya
mid
e TL
C p
late
s (9
cm
x 3
cm) w
ith m
obile
pha
se 2
:1, t
olue
ne-
EtO
Ac.
The
pla
tes w
ere
visu
aliz
ed u
nder
U
V-li
ght,
366
nm.
Rf v
alue
s wer
e: (l
eft t
o rig
ht) S
AM
: 1, 0
.61;
2, 0
.47;
3, 0
.33;
Q:
0.05
; CA
S: 0
.31.
Spo
t 3 m
ay b
e C
AS.
C
ompo
unds
of S
AM
ext
ract
on
the
cellu
lose
and
pol
yam
ide
TLC
pla
tes w
ere
stre
aked
with
whi
te fl
uore
scen
ce.
Nei
ther
C
AS
nor Q
mov
ed o
n ei
ther
the
cellu
lose
or
poly
amid
e pl
ates
.
Fig. 23. SAM
tip extract, CA
S, and
Q in
3:1:1, t-‐Bu
OH-‐HO
Ac-‐H
2O on silica gel,
cellu
lose, and
polyamide TLC plates,
respectiv
ely.
Sam
e co
nditi
ons u
sed
as F
ig. 2
2 bu
t with
m
obile
pha
se 3
:1:1
, t-B
uOH
-HO
Ac-
H2O
. Th
e pl
ates
wer
e vi
sual
ized
und
er U
V-li
ght,
366
nm.
Rf v
alue
s on
silic
a ge
l wer
e: S
AM
(to
p to
bot
tom
): w
hite
to d
ark
to p
ink
fluor
esci
ng st
reak
; Q: y
ello
w, 0
.87;
CA
S:
dark
, 0.8
2. O
n ce
llulo
se, R
fs w
ere:
SA
M
(bot
tom
to to
p): w
hite
to d
ark,
then
or
ange
/pin
k flu
ores
cing
stre
ak; Q
: yel
low
, 0.
83; C
AS:
dar
k, 0
.96.
On
poly
amid
e:
SAM
(bot
tom
to to
p): p
ink
stre
ak to
yel
low
, w
hite
, dar
k, a
nd p
ink
fluor
esce
nce;
Q:
yello
w, 0
.16;
CA
S: d
ark,
0.8
4.
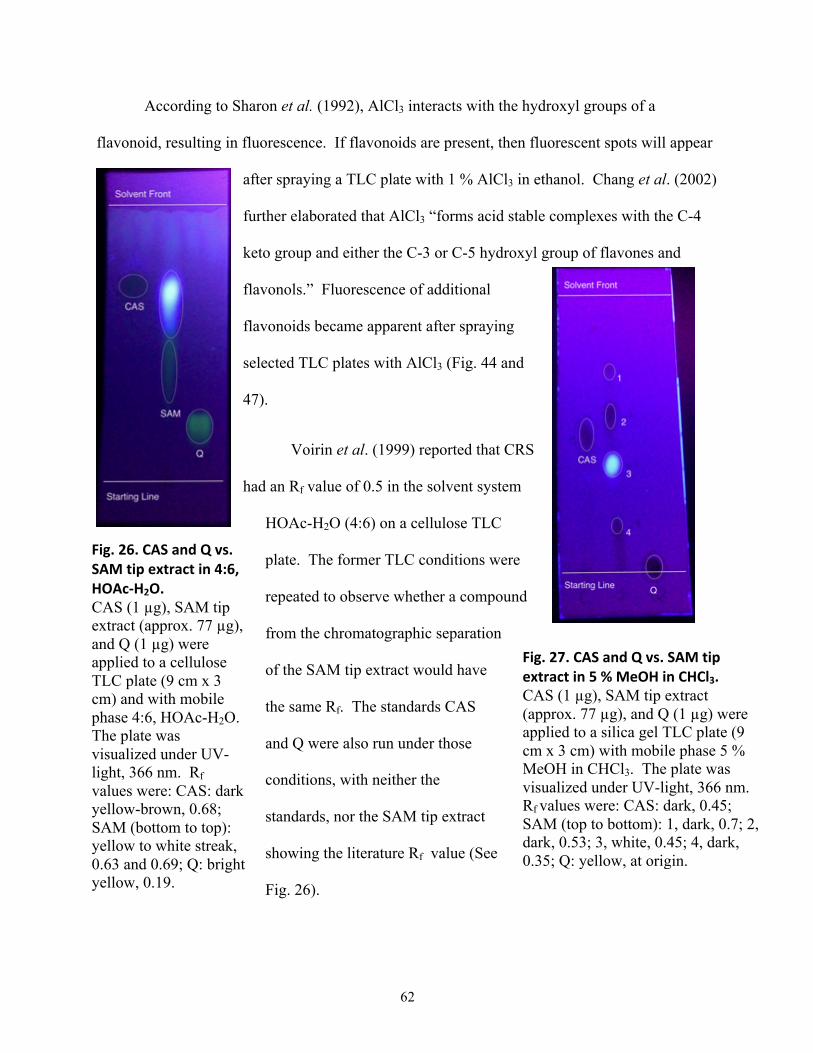
62
According to Sharon et al. (1992), AlCl3 interacts with the hydroxyl groups of a
flavonoid, resulting in fluorescence. If flavonoids are present, then fluorescent spots will appear
after spraying a TLC plate with 1 % AlCl3 in ethanol. Chang et al. (2002)
further elaborated that AlCl3 “forms acid stable complexes with the C-4
keto group and either the C-3 or C-5 hydroxyl group of flavones and
flavonols.” Fluorescence of additional
flavonoids became apparent after spraying
selected TLC plates with AlCl3 (Fig. 44 and
47).
Voirin et al. (1999) reported that CRS
had an Rf value of 0.5 in the solvent system
HOAc-H2O (4:6) on a cellulose TLC
plate. The former TLC conditions were
repeated to observe whether a compound
from the chromatographic separation
of the SAM tip extract would have
the same Rf. The standards CAS
and Q were also run under those
conditions, with neither the
standards, nor the SAM tip extract
showing the literature Rf value (See
Fig. 26).
Fig. 27. CAS and Q vs. SAM tip extract in 5 % MeOH in CHCl3. CAS (1 µg), SAM tip extract (approx. 77 µg), and Q (1 µg) were applied to a silica gel TLC plate (9 cm x 3 cm) with mobile phase 5 % MeOH in CHCl3. The plate was visualized under UV-light, 366 nm. Rf values were: CAS: dark, 0.45; SAM (top to bottom): 1, dark, 0.7; 2, dark, 0.53; 3, white, 0.45; 4, dark, 0.35; Q: yellow, at origin.
Fig. 26. CAS and Q vs. SAM tip extract in 4:6, HOAc-‐H2O. CAS (1 µg), SAM tip extract (approx. 77 µg), and Q (1 µg) were applied to a cellulose TLC plate (9 cm x 3 cm) and with mobile phase 4:6, HOAc-H2O. The plate was visualized under UV-light, 366 nm. Rf values were: CAS: dark yellow-brown, 0.68; SAM (bottom to top): yellow to white streak, 0.63 and 0.69; Q: bright yellow, 0.19.
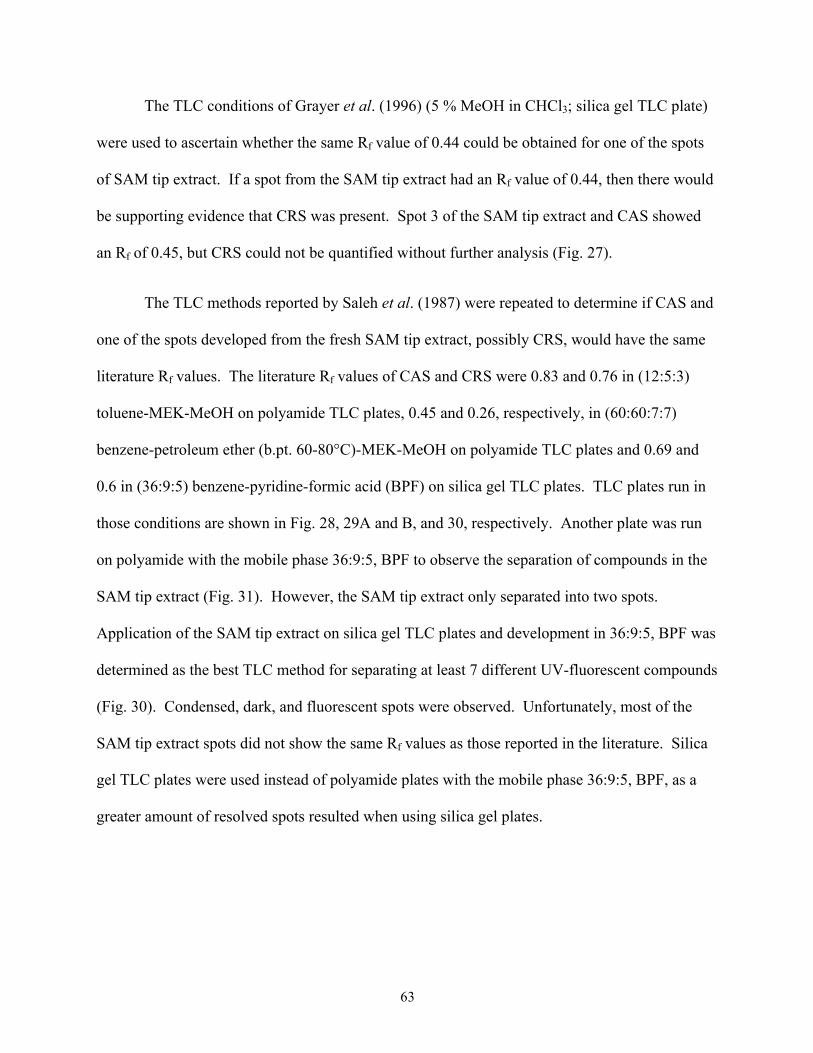
63
The TLC conditions of Grayer et al. (1996) (5 % MeOH in CHCl3; silica gel TLC plate)
were used to ascertain whether the same Rf value of 0.44 could be obtained for one of the spots
of SAM tip extract. If a spot from the SAM tip extract had an Rf value of 0.44, then there would
be supporting evidence that CRS was present. Spot 3 of the SAM tip extract and CAS showed
an Rf of 0.45, but CRS could not be quantified without further analysis (Fig. 27).
The TLC methods reported by Saleh et al. (1987) were repeated to determine if CAS and
one of the spots developed from the fresh SAM tip extract, possibly CRS, would have the same
literature Rf values. The literature Rf values of CAS and CRS were 0.83 and 0.76 in (12:5:3)
toluene-MEK-MeOH on polyamide TLC plates, 0.45 and 0.26, respectively, in (60:60:7:7)
benzene-petroleum ether (b.pt. 60-80°C)-MEK-MeOH on polyamide TLC plates and 0.69 and
0.6 in (36:9:5) benzene-pyridine-formic acid (BPF) on silica gel TLC plates. TLC plates run in
those conditions are shown in Fig. 28, 29A and B, and 30, respectively. Another plate was run
on polyamide with the mobile phase 36:9:5, BPF to observe the separation of compounds in the
SAM tip extract (Fig. 31). However, the SAM tip extract only separated into two spots.
Application of the SAM tip extract on silica gel TLC plates and development in 36:9:5, BPF was
determined as the best TLC method for separating at least 7 different UV-fluorescent compounds
(Fig. 30). Condensed, dark, and fluorescent spots were observed. Unfortunately, most of the
SAM tip extract spots did not show the same Rf values as those reported in the literature. Silica
gel TLC plates were used instead of polyamide plates with the mobile phase 36:9:5, BPF, as a
greater amount of resolved spots resulted when using silica gel plates.
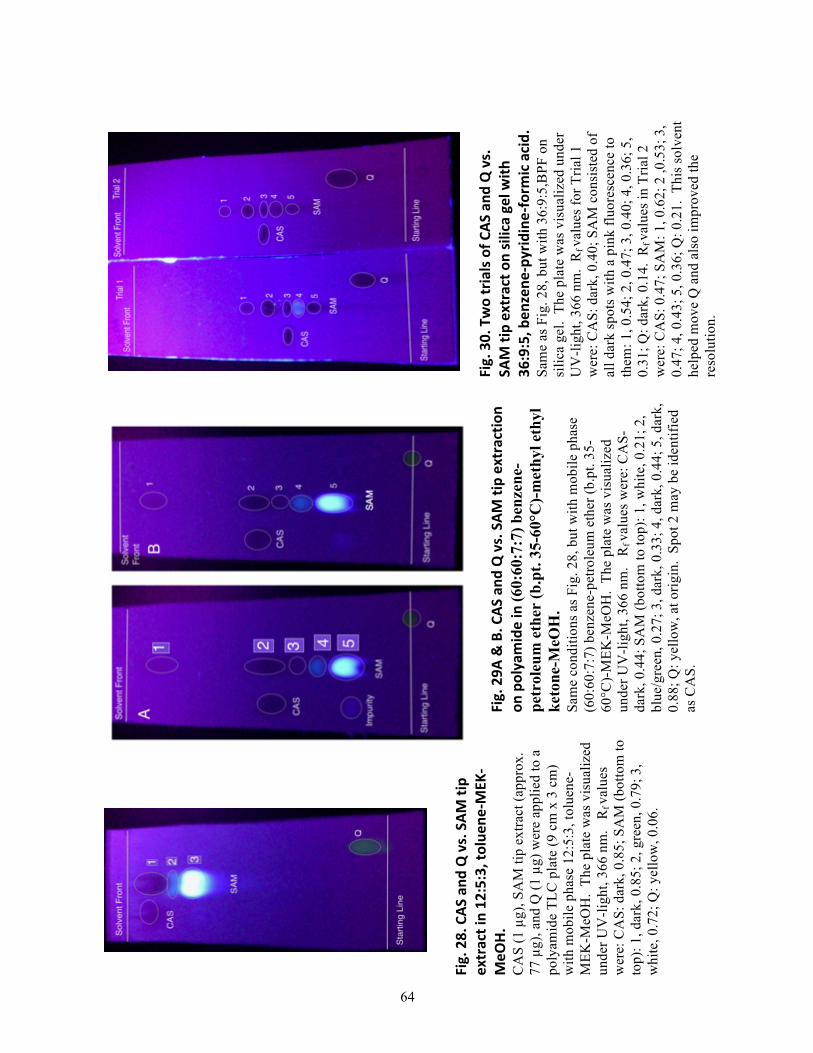
64
Fig. 30. Two trials of C
AS and
Q vs.
SAM tip extract o
n silica gel w
ith
36:9:5, b
enzene
-‐pyridine-‐form
ic acid.
Sam
e as
Fig
. 28,
but
with
36:
9:5,
BPF
on
silic
a ge
l. T
he p
late
was
vis
ualiz
ed u
nder
U
V-li
ght,
366
nm.
Rf v
alue
s for
Tria
l 1
wer
e: C
AS:
dar
k, 0
.40;
SA
M c
onsi
sted
of
all d
ark
spot
s with
a p
ink
fluor
esce
nce
to
them
: 1, 0
.54;
2, 0
.47;
3, 0
.40;
4, 0
.36;
5,
0.31
; Q: d
ark,
0.1
4. R
f val
ues i
n Tr
ial 2
w
ere:
CA
S: 0
.47;
SA
M: 1
, 0.6
2; 2
,0.5
3; 3
, 0.
47; 4
, 0.4
3; 5
, 0.3
6; Q
: 0.2
1. T
his s
olve
nt
help
ed m
ove
Q a
nd a
lso
impr
oved
the
reso
lutio
n.
Fig. 28. CAS
and
Q vs. SAM
tip
extract in 12:5:3, tolue
ne-‐M
EK-‐
MeO
H.
CA
S (1
µg)
, SA
M ti
p ex
tract
(app
rox.
77
µg)
, and
Q (1
µg)
wer
e ap
plie
d to
a
poly
amid
e TL
C p
late
(9 c
m x
3 c
m)
with
mob
ile p
hase
12:
5:3,
tolu
ene-
MEK
-MeO
H.
The
plat
e w
as v
isua
lized
un
der U
V-li
ght,
366
nm.
Rf v
alue
s w
ere:
CA
S: d
ark,
0.8
5; S
AM
(bot
tom
to
top)
: 1, d
ark,
0.8
5; 2
, gre
en, 0
.79;
3,
whi
te, 0
.72;
Q: y
ello
w, 0
.06.
Fig. 29A
& B. C
AS and
Q vs. SAM
tip extractio
n on
polyamide in (6
0:60
:7:7
) ben
zene
-pe
trol
eum
eth
er (b
.pt.
35-6
0°C
)-m
ethy
l eth
yl
keto
ne-M
eOH.
Sam
e co
nditi
ons a
s Fig
. 28,
but
with
mob
ile p
hase
(6
0:60
:7:7
) ben
zene
-pet
role
um e
ther
(b.p
t. 35
-60
°C)-
MEK
-MeO
H.
The
plat
e w
as v
isua
lized
un
der U
V-li
ght,
366
nm.
Rf v
alue
s wer
e: C
AS-
da
rk, 0
.44;
SA
M (b
otto
m to
top)
: 1, w
hite
, 0.2
1; 2
, bl
ue/g
reen
, 0.2
7; 3
, dar
k, 0
.33;
4, d
ark,
0.4
4; 5
, dar
k,
0.88
; Q: y
ello
w, a
t orig
in.
Spot
2 m
ay b
e id
entif
ied
as C
AS.
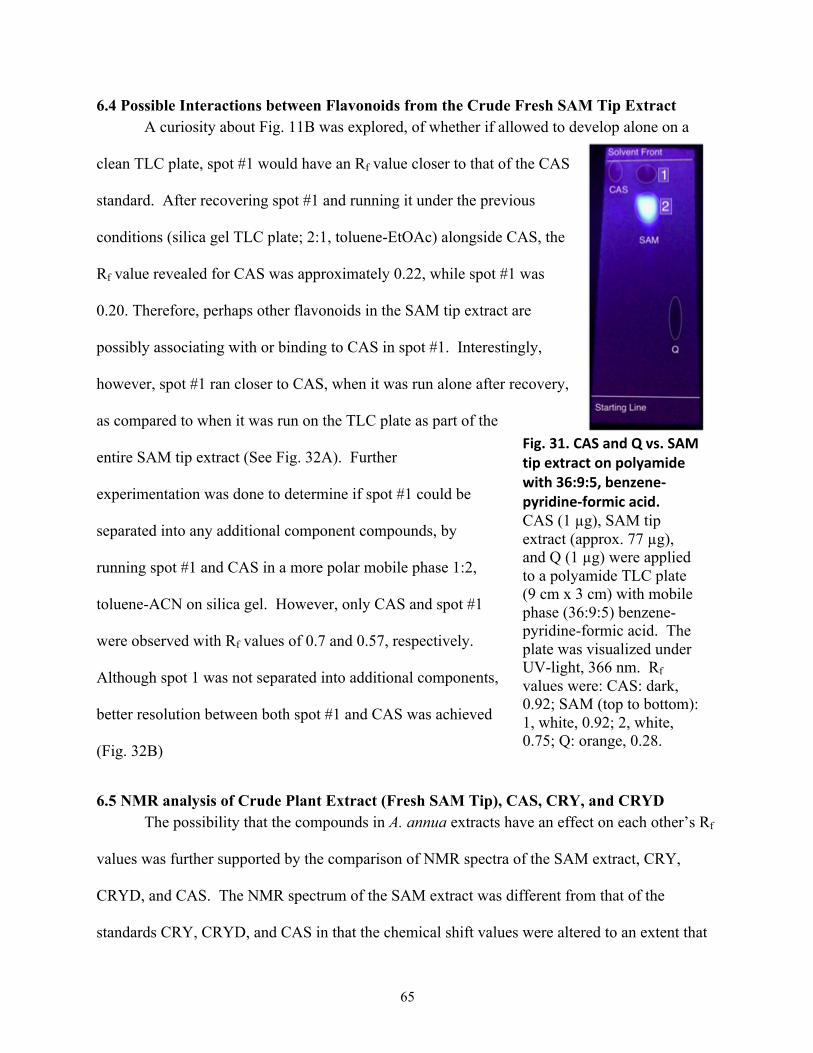
65
6.4 Possible Interactions between Flavonoids from the Crude Fresh SAM Tip Extract A curiosity about Fig. 11B was explored, of whether if allowed to develop alone on a
clean TLC plate, spot #1 would have an Rf value closer to that of the CAS
standard. After recovering spot #1 and running it under the previous
conditions (silica gel TLC plate; 2:1, toluene-EtOAc) alongside CAS, the
Rf value revealed for CAS was approximately 0.22, while spot #1 was
0.20. Therefore, perhaps other flavonoids in the SAM tip extract are
possibly associating with or binding to CAS in spot #1. Interestingly,
however, spot #1 ran closer to CAS, when it was run alone after recovery,
as compared to when it was run on the TLC plate as part of the
entire SAM tip extract (See Fig. 32A). Further
experimentation was done to determine if spot #1 could be
separated into any additional component compounds, by
running spot #1 and CAS in a more polar mobile phase 1:2,
toluene-ACN on silica gel. However, only CAS and spot #1
were observed with Rf values of 0.7 and 0.57, respectively.
Although spot 1 was not separated into additional components,
better resolution between both spot #1 and CAS was achieved
(Fig. 32B)
6.5 NMR analysis of Crude Plant Extract (Fresh SAM Tip), CAS, CRY, and CRYD The possibility that the compounds in A. annua extracts have an effect on each other’s Rf
values was further supported by the comparison of NMR spectra of the SAM extract, CRY,
CRYD, and CAS. The NMR spectrum of the SAM extract was different from that of the
standards CRY, CRYD, and CAS in that the chemical shift values were altered to an extent that
Fig. 31. CAS and Q vs. SAM tip extract on polyamide with 36:9:5, benzene-‐pyridine-‐formic acid. CAS (1 µg), SAM tip extract (approx. 77 µg), and Q (1 µg) were applied to a polyamide TLC plate (9 cm x 3 cm) with mobile phase (36:9:5) benzene-pyridine-formic acid. The plate was visualized under UV-light, 366 nm. Rf values were: CAS: dark, 0.92; SAM (top to bottom): 1, white, 0.92; 2, white, 0.75; Q: orange, 0.28.
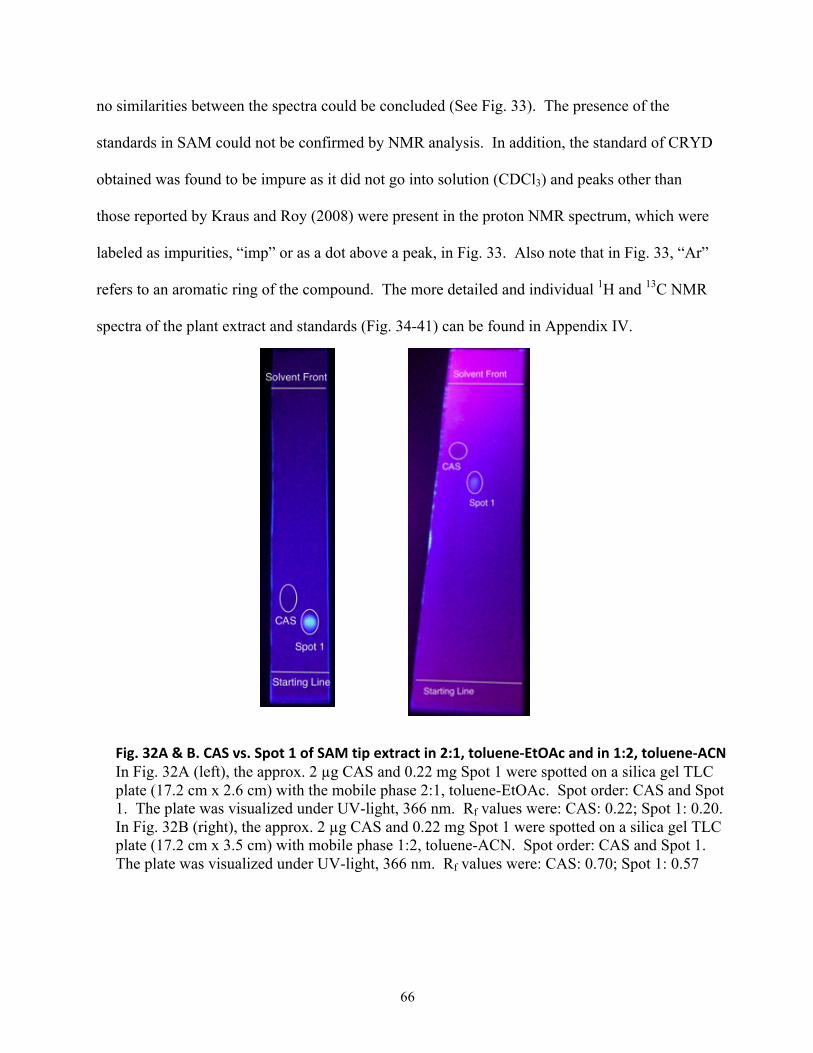
66
no similarities between the spectra could be concluded (See Fig. 33). The presence of the
standards in SAM could not be confirmed by NMR analysis. In addition, the standard of CRYD
obtained was found to be impure as it did not go into solution (CDCl3) and peaks other than
those reported by Kraus and Roy (2008) were present in the proton NMR spectrum, which were
labeled as impurities, “imp” or as a dot above a peak, in Fig. 33. Also note that in Fig. 33, “Ar”
refers to an aromatic ring of the compound. The more detailed and individual 1H and 13C NMR
spectra of the plant extract and standards (Fig. 34-41) can be found in Appendix IV.
Fig. 32A & B. CAS vs. Spot 1 of SAM tip extract in 2:1, toluene-‐EtOAc and in 1:2, toluene-‐ACN In Fig. 32A (left), the approx. 2 µg CAS and 0.22 mg Spot 1 were spotted on a silica gel TLC plate (17.2 cm x 2.6 cm) with the mobile phase 2:1, toluene-EtOAc. Spot order: CAS and Spot 1. The plate was visualized under UV-light, 366 nm. Rf values were: CAS: 0.22; Spot 1: 0.20. In Fig. 32B (right), the approx. 2 µg CAS and 0.22 mg Spot 1 were spotted on a silica gel TLC plate (17.2 cm x 3.5 cm) with mobile phase 1:2, toluene-ACN. Spot order: CAS and Spot 1. The plate was visualized under UV-light, 366 nm. Rf values were: CAS: 0.70; Spot 1: 0.57
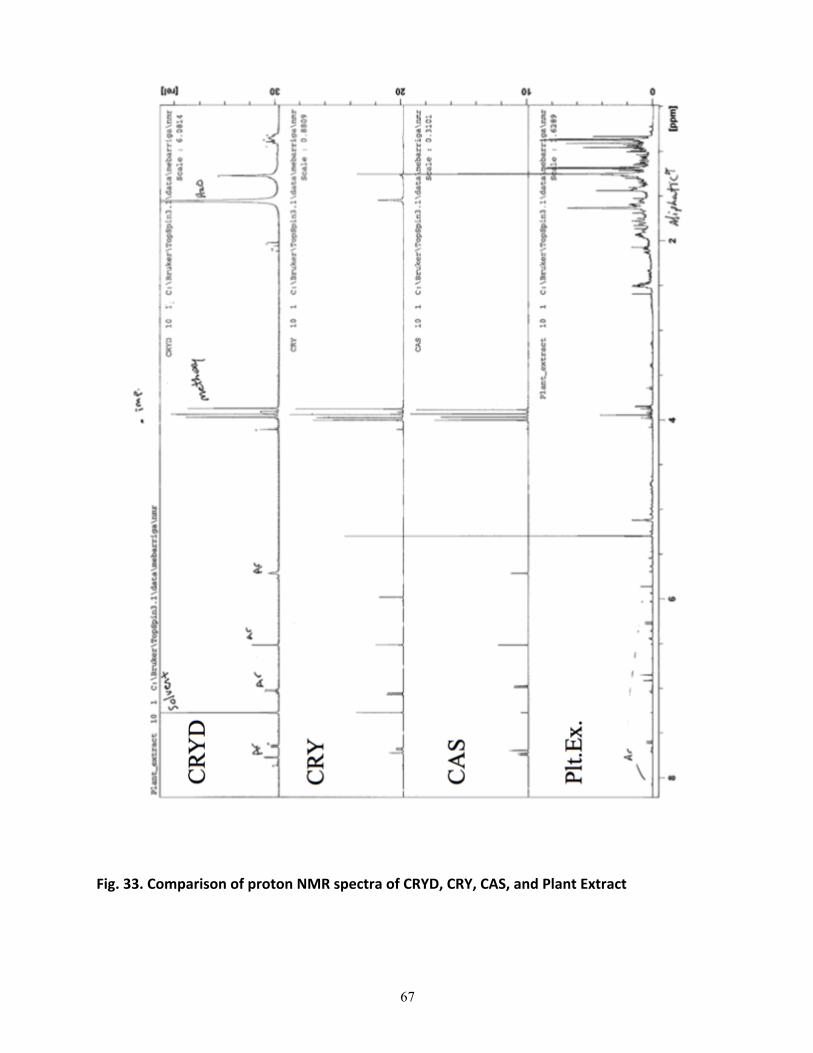
67
Fig. 33. Comparison of proton NMR spectra of CRYD, CRY, CAS, and Plant Extract
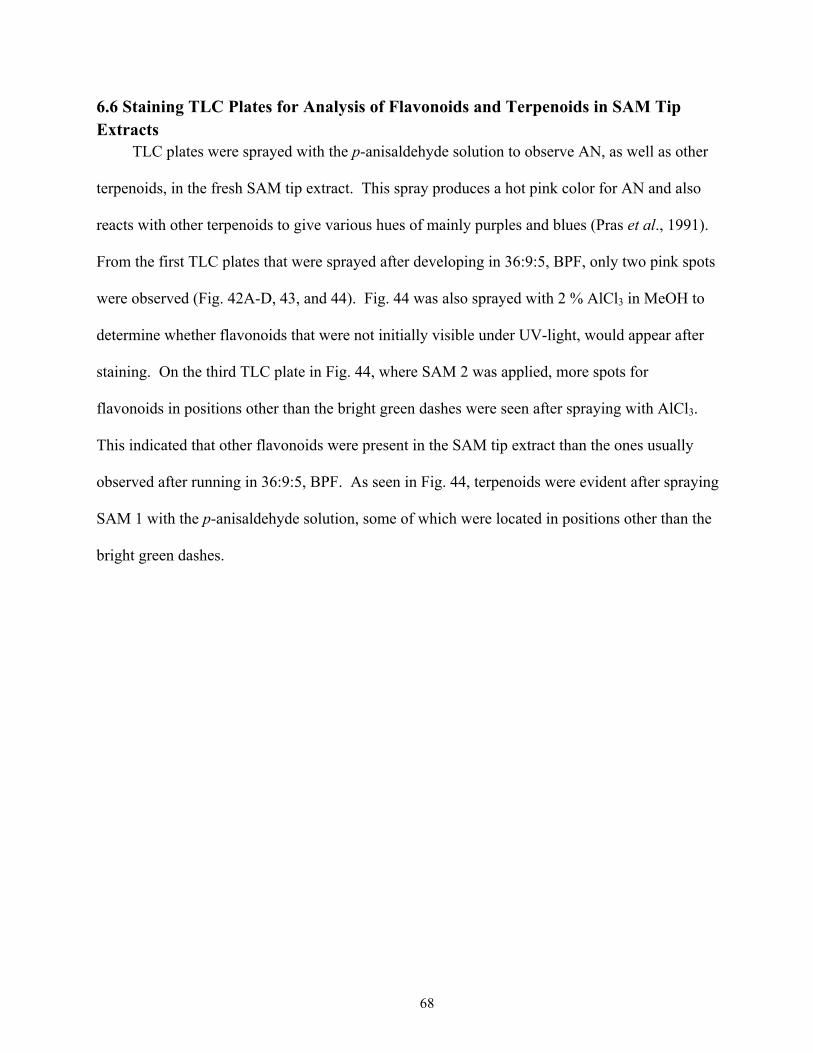
68
6.6 Staining TLC Plates for Analysis of Flavonoids and Terpenoids in SAM Tip Extracts TLC plates were sprayed with the p-anisaldehyde solution to observe AN, as well as other
terpenoids, in the fresh SAM tip extract. This spray produces a hot pink color for AN and also
reacts with other terpenoids to give various hues of mainly purples and blues (Pras et al., 1991).
From the first TLC plates that were sprayed after developing in 36:9:5, BPF, only two pink spots
were observed (Fig. 42A-D, 43, and 44). Fig. 44 was also sprayed with 2 % AlCl3 in MeOH to
determine whether flavonoids that were not initially visible under UV-light, would appear after
staining. On the third TLC plate in Fig. 44, where SAM 2 was applied, more spots for
flavonoids in positions other than the bright green dashes were seen after spraying with AlCl3.
This indicated that other flavonoids were present in the SAM tip extract than the ones usually
observed after running in 36:9:5, BPF. As seen in Fig. 44, terpenoids were evident after spraying
SAM 1 with the p-anisaldehyde solution, some of which were located in positions other than the
bright green dashes.
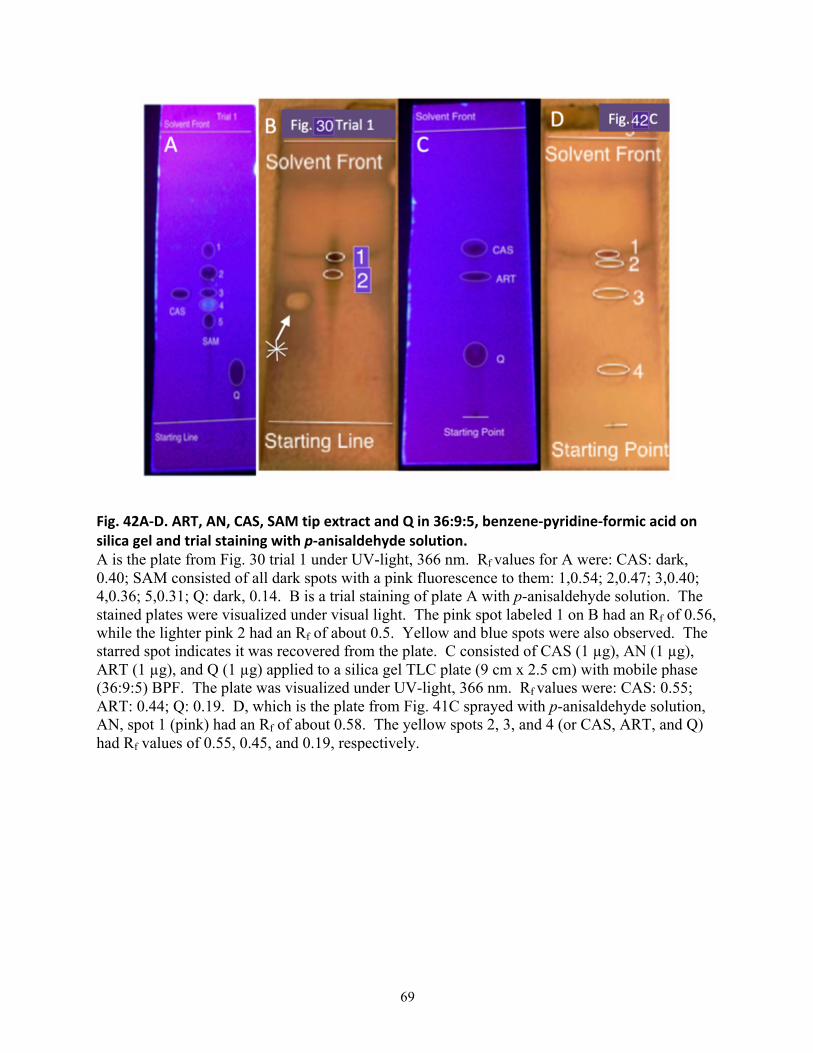
69
Fig. 42A-‐D. ART, AN, CAS, SAM tip extract and Q in 36:9:5, benzene-‐pyridine-‐formic acid on silica gel and trial staining with p-‐anisaldehyde solution. A is the plate from Fig. 30 trial 1 under UV-light, 366 nm. Rf values for A were: CAS: dark, 0.40; SAM consisted of all dark spots with a pink fluorescence to them: 1,0.54; 2,0.47; 3,0.40; 4,0.36; 5,0.31; Q: dark, 0.14. B is a trial staining of plate A with p-anisaldehyde solution. The stained plates were visualized under visual light. The pink spot labeled 1 on B had an Rf of 0.56, while the lighter pink 2 had an Rf of about 0.5. Yellow and blue spots were also observed. The starred spot indicates it was recovered from the plate. C consisted of CAS (1 µg), AN (1 µg), ART (1 µg), and Q (1 µg) applied to a silica gel TLC plate (9 cm x 2.5 cm) with mobile phase (36:9:5) BPF. The plate was visualized under UV-light, 366 nm. Rf values were: CAS: 0.55; ART: 0.44; Q: 0.19. D, which is the plate from Fig. 41C sprayed with p-anisaldehyde solution, AN, spot 1 (pink) had an Rf of about 0.58. The yellow spots 2, 3, and 4 (or CAS, ART, and Q) had Rf values of 0.55, 0.45, and 0.19, respectively.
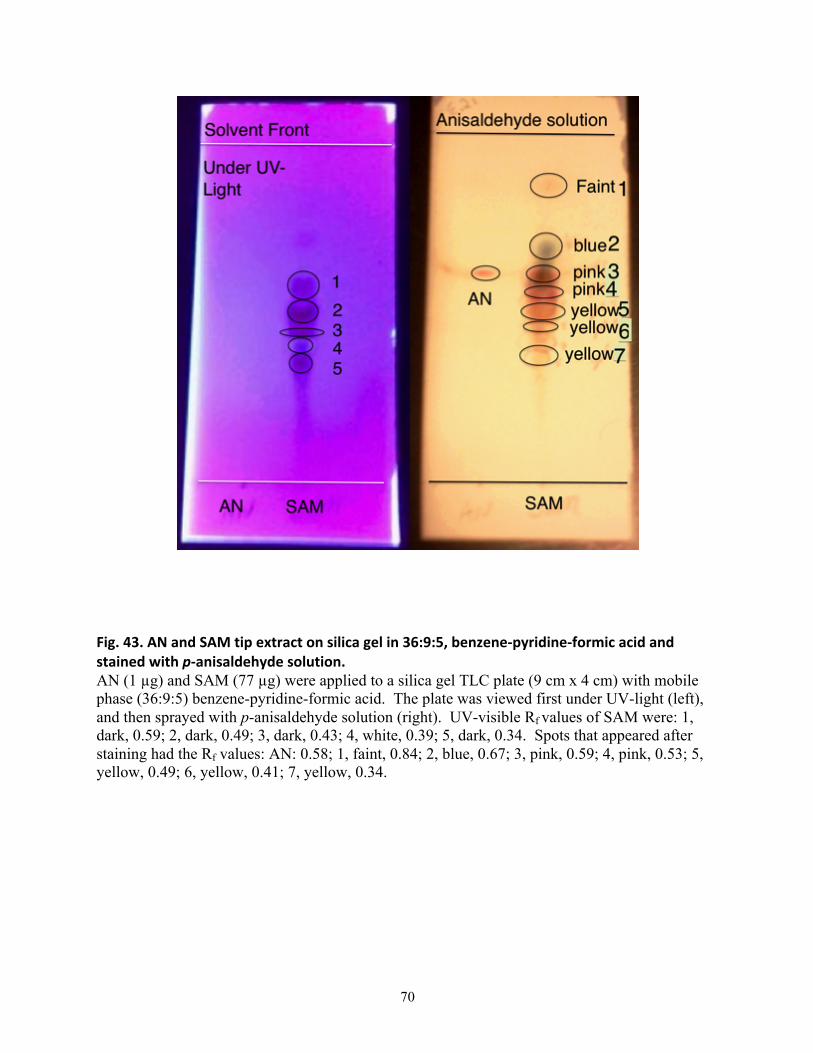
70
Fig. 43. AN and SAM tip extract on silica gel in 36:9:5, benzene-‐pyridine-‐formic acid and stained with p-‐anisaldehyde solution. AN (1 µg) and SAM (77 µg) were applied to a silica gel TLC plate (9 cm x 4 cm) with mobile phase (36:9:5) benzene-pyridine-formic acid. The plate was viewed first under UV-light (left), and then sprayed with p-anisaldehyde solution (right). UV-visible Rf values of SAM were: 1, dark, 0.59; 2, dark, 0.49; 3, dark, 0.43; 4, white, 0.39; 5, dark, 0.34. Spots that appeared after staining had the Rf values: AN: 0.58; 1, faint, 0.84; 2, blue, 0.67; 3, pink, 0.59; 4, pink, 0.53; 5, yellow, 0.49; 6, yellow, 0.41; 7, yellow, 0.34.
71
Fig. 44. Development of SAM tip extract in 36:9:5, benzene-‐pyridine-‐formic acid, followed by staining with p-‐anisaldehyde solution and 2 % AlCl3 in MeOH. SAM tip extract (77 µg, x2) was applied to a 14.5 cm x 4 cm silica gel TLC plate with mobile phase (36:9:5) benzene-pyridine-formic acid. The plate was visualized under UV-light, 366 nm, then cut in half. Rf values for the 7 spots visible under UV-light were: 1, dark, 0.62; 2, dark, 0.58; 3, dark, 0.48; 4, dark with pink center, 0.46; 5, hot pink, 0.45; 6, dark, 0.42; 7, dark, 0.37. SAM 1 was stained with p-anisaldehyde solution and observed under visible light. Rf values of spots in SAM1 were: dark pink 1, 0.69; light pink 2, 0.54; yellow 3, 0.47; green 4, 0.45. SAM2 was stained with 2 % AlCl3 in MeOH and then viewed under UV-light. Rf values of spots in SAM2 were: yellow 1, 0.62; yellow 2, 0.47; white 3, 0.40. The bright green dashes indicate where spots were first visible under only UV-light were located.
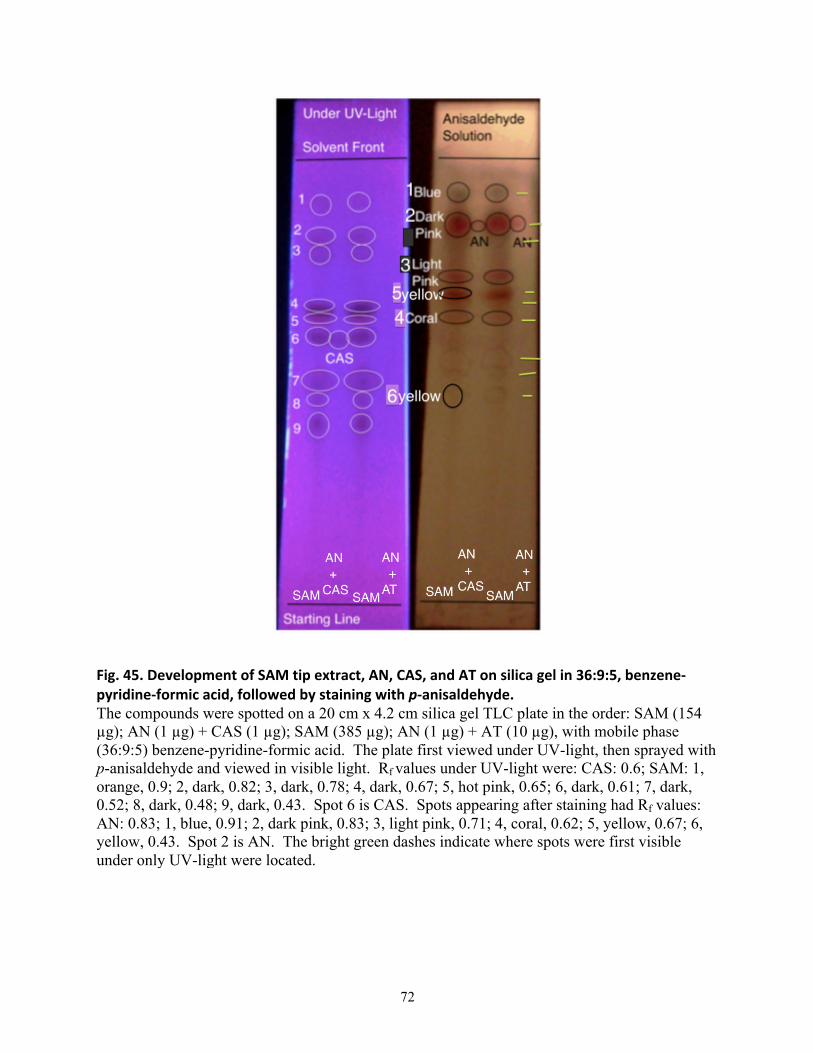
72
Fig. 45. Development of SAM tip extract, AN, CAS, and AT on silica gel in 36:9:5, benzene-‐pyridine-‐formic acid, followed by staining with p-‐anisaldehyde. The compounds were spotted on a 20 cm x 4.2 cm silica gel TLC plate in the order: SAM (154 µg); AN (1 µg) + CAS (1 µg); SAM (385 µg); AN (1 µg) + AT (10 µg), with mobile phase (36:9:5) benzene-pyridine-formic acid. The plate first viewed under UV-light, then sprayed with p-anisaldehyde and viewed in visible light. Rf values under UV-light were: CAS: 0.6; SAM: 1, orange, 0.9; 2, dark, 0.82; 3, dark, 0.78; 4, dark, 0.67; 5, hot pink, 0.65; 6, dark, 0.61; 7, dark, 0.52; 8, dark, 0.48; 9, dark, 0.43. Spot 6 is CAS. Spots appearing after staining had Rf values: AN: 0.83; 1, blue, 0.91; 2, dark pink, 0.83; 3, light pink, 0.71; 4, coral, 0.62; 5, yellow, 0.67; 6, yellow, 0.43. Spot 2 is AN. The bright green dashes indicate where spots were first visible under only UV-light were located.
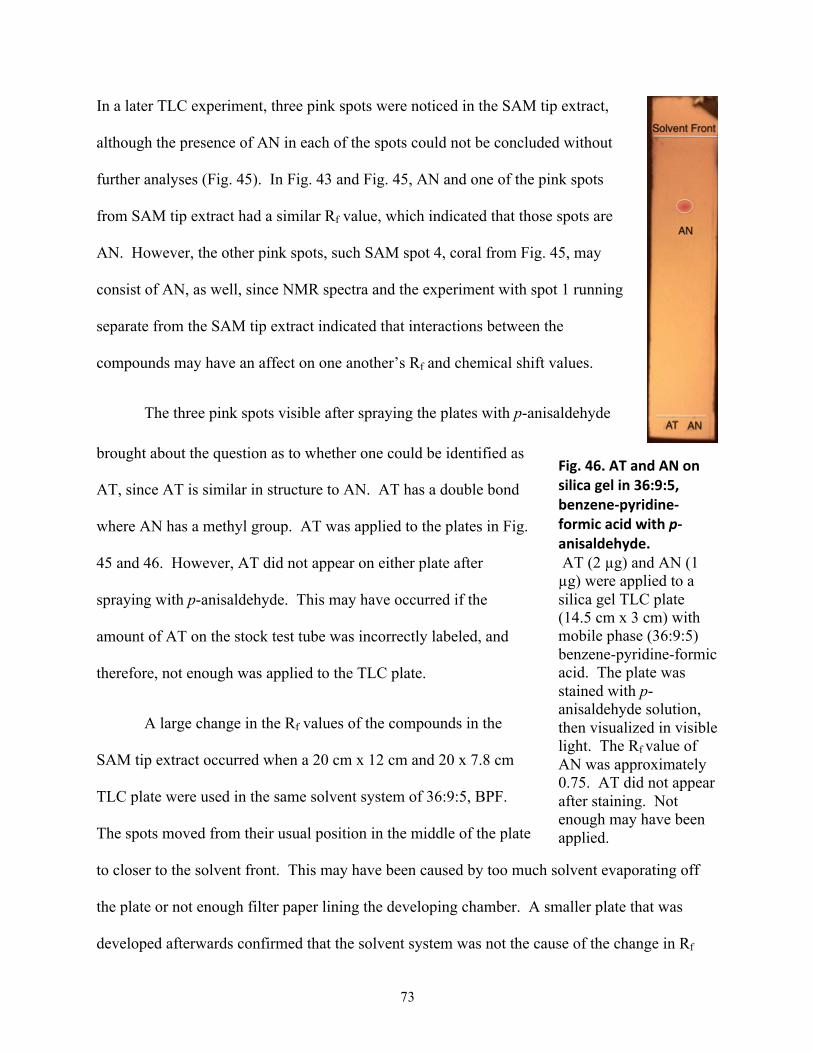
73
In a later TLC experiment, three pink spots were noticed in the SAM tip extract,
although the presence of AN in each of the spots could not be concluded without
further analyses (Fig. 45). In Fig. 43 and Fig. 45, AN and one of the pink spots
from SAM tip extract had a similar Rf value, which indicated that those spots are
AN. However, the other pink spots, such SAM spot 4, coral from Fig. 45, may
consist of AN, as well, since NMR spectra and the experiment with spot 1 running
separate from the SAM tip extract indicated that interactions between the
compounds may have an affect on one another’s Rf and chemical shift values.
The three pink spots visible after spraying the plates with p-anisaldehyde
brought about the question as to whether one could be identified as
AT, since AT is similar in structure to AN. AT has a double bond
where AN has a methyl group. AT was applied to the plates in Fig.
45 and 46. However, AT did not appear on either plate after
spraying with p-anisaldehyde. This may have occurred if the
amount of AT on the stock test tube was incorrectly labeled, and
therefore, not enough was applied to the TLC plate.
A large change in the Rf values of the compounds in the
SAM tip extract occurred when a 20 cm x 12 cm and 20 x 7.8 cm
TLC plate were used in the same solvent system of 36:9:5, BPF.
The spots moved from their usual position in the middle of the plate
to closer to the solvent front. This may have been caused by too much solvent evaporating off
the plate or not enough filter paper lining the developing chamber. A smaller plate that was
developed afterwards confirmed that the solvent system was not the cause of the change in Rf
Fig. 46. AT and AN on silica gel in 36:9:5, benzene-‐pyridine-‐formic acid with p-‐anisaldehyde. AT (2 µg) and AN (1 µg) were applied to a silica gel TLC plate (14.5 cm x 3 cm) with mobile phase (36:9:5) benzene-pyridine-formic acid. The plate was stained with p-anisaldehyde solution, then visualized in visible light. The Rf value of AN was approximately 0.75. AT did not appear after staining. Not enough may have been applied.
74
values. Therefore, smaller TLC plates were used in the TLC analyses of the fresh SAM leaves
extract.
6.7 Fresh SAM Leaf Extract vs. Fresh SAM Tip Extract The compounds from fresh leaves of SAM were extracted to observe how they differed
qualitatively and quantitatively from the fresh SAM shoot tip extract. The fresh SAM leaf
extract applied to the silica gel TLC plate, showed fewer compounds and lower levels than the
fresh SAM tip extract (Fig. 47). This shows that after tips expand and develop into mature
leaves, some compounds decline in content and/or disappear. Table VI contains Rf values for the
plates. The SAM leaf and tip extracts showed the same spots on plate 2 after spraying with p-
anisaldehyde. Overall, the SAM tip extract seemed to have more flavonoids and terpenoids per
milligram than the SAM leaf extract. After staining with AlCl3, three flavonoids, T2, T3, and
T5, were present in the SAM tip extract that were not present in the SAM leaf extract. The
flavonoids in the SAM leaf extract that correlated with those in the tip extract were: L2 and T1;
L3 and T4; L4 and T6; L5 and T7; L6 and T8.
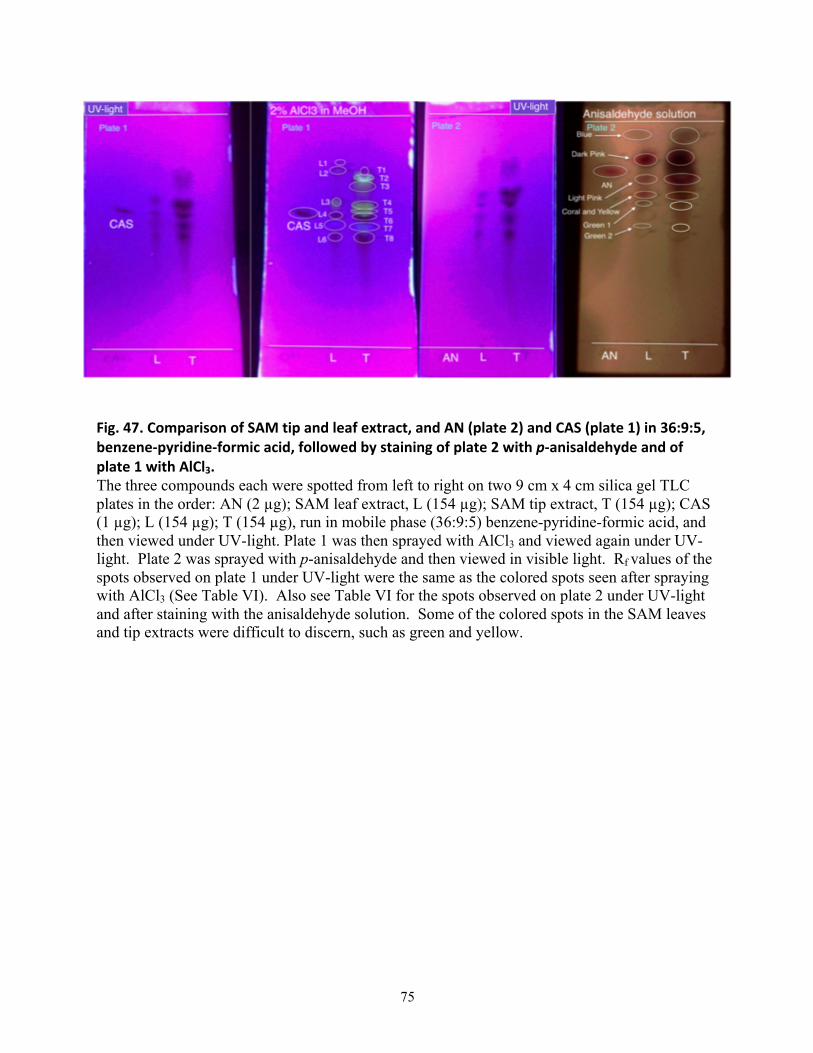
75
Fig. 47. Comparison of SAM tip and leaf extract, and AN (plate 2) and CAS (plate 1) in 36:9:5, benzene-‐pyridine-‐formic acid, followed by staining of plate 2 with p-‐anisaldehyde and of plate 1 with AlCl3. The three compounds each were spotted from left to right on two 9 cm x 4 cm silica gel TLC plates in the order: AN (2 µg); SAM leaf extract, L (154 µg); SAM tip extract, T (154 µg); CAS (1 µg); L (154 µg); T (154 µg), run in mobile phase (36:9:5) benzene-pyridine-formic acid, and then viewed under UV-light. Plate 1 was then sprayed with AlCl3 and viewed again under UV-light. Plate 2 was sprayed with p-anisaldehyde and then viewed in visible light. Rf values of the spots observed on plate 1 under UV-light were the same as the colored spots seen after spraying with AlCl3 (See Table VI). Also see Table VI for the spots observed on plate 2 under UV-light and after staining with the anisaldehyde solution. Some of the colored spots in the SAM leaves and tip extracts were difficult to discern, such as green and yellow.
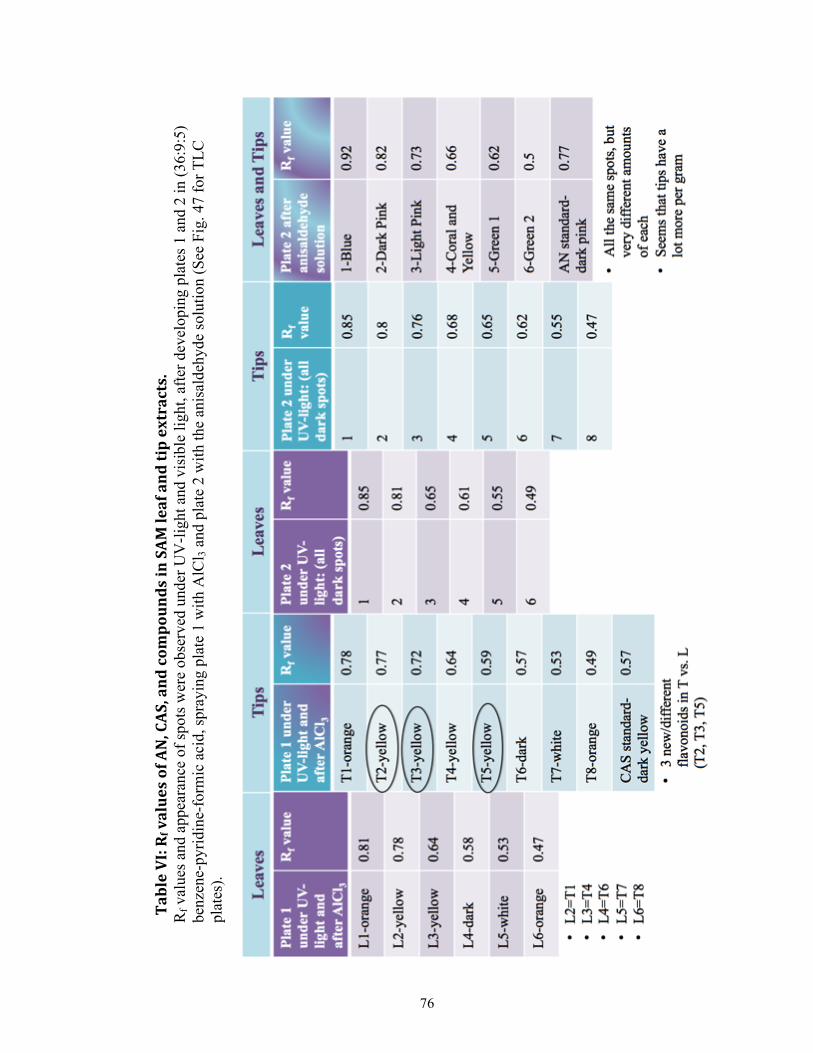
76
Table VI: R
f values of AN, CAS, and com
pounds in SAM
leaf and tip extracts.
Rf v
alue
s and
app
eara
nce
of sp
ots w
ere
obse
rved
und
er U
V-li
ght a
nd v
isib
le li
ght,
afte
r dev
elop
ing
plat
es 1
and
2 in
(36:
9:5)
be
nzen
e-py
ridin
e-fo
rmic
aci
d, sp
rayi
ng p
late
1 w
ith A
lCl 3
and
plat
e 2
with
the
anis
alde
hyde
solu
tion
(See
Fig
. 47
for T
LC
plat
es).
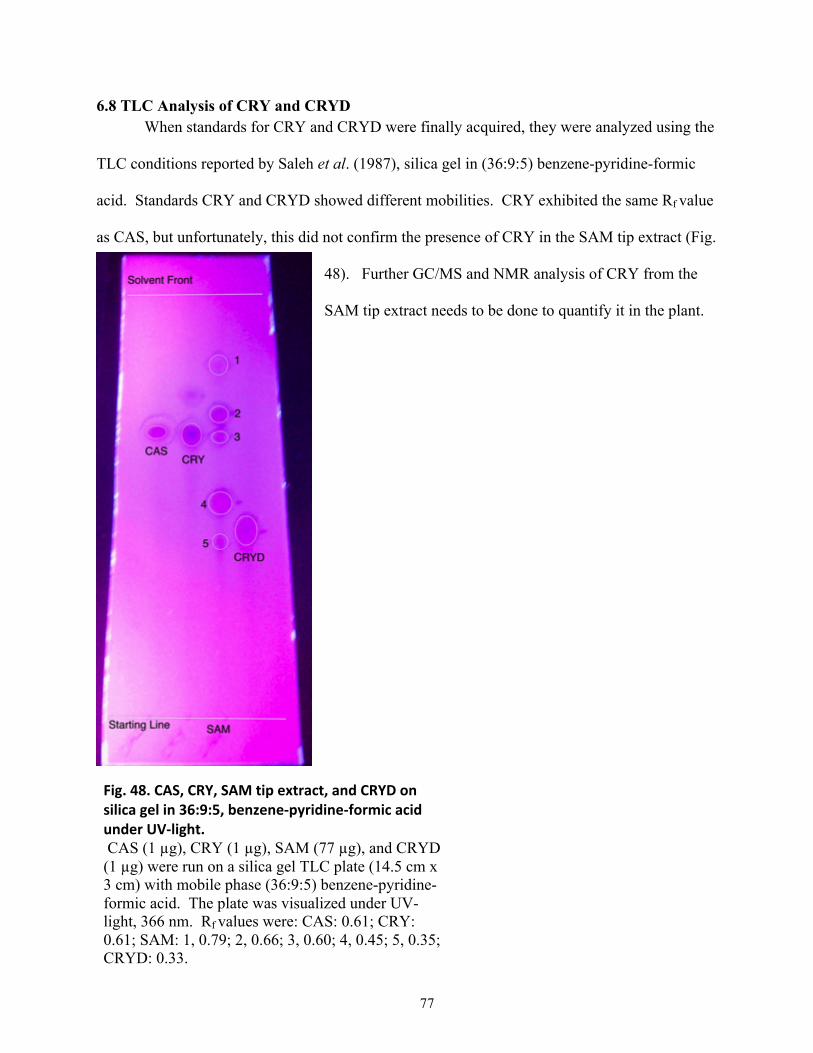
77
6.8 TLC Analysis of CRY and CRYD When standards for CRY and CRYD were finally acquired, they were analyzed using the
TLC conditions reported by Saleh et al. (1987), silica gel in (36:9:5) benzene-pyridine-formic
acid. Standards CRY and CRYD showed different mobilities. CRY exhibited the same Rf value
as CAS, but unfortunately, this did not confirm the presence of CRY in the SAM tip extract (Fig.
48). Further GC/MS and NMR analysis of CRY from the
SAM tip extract needs to be done to quantify it in the plant.
Fig. 48. CAS, CRY, SAM tip extract, and CRYD on silica gel in 36:9:5, benzene-‐pyridine-‐formic acid under UV-‐light. CAS (1 µg), CRY (1 µg), SAM (77 µg), and CRYD (1 µg) were run on a silica gel TLC plate (14.5 cm x 3 cm) with mobile phase (36:9:5) benzene-pyridine-formic acid. The plate was visualized under UV-light, 366 nm. Rf values were: CAS: 0.61; CRY: 0.61; SAM: 1, 0.79; 2, 0.66; 3, 0.60; 4, 0.45; 5, 0.35; CRYD: 0.33.
78
7.0 Discussion
Some researchers, such as Shilin et al. (1989) reported using MeOH and extracting with
MeOH for 5 days (Marco et al., 1988). However, MeOH extracted more chlorophyll than
methylene chloride and was therefore not as proficient an extraction solvent as CH2Cl2. Bilia et
al. (2006) also analyzed infusions, decoctions, an n-hexane extract, and ethanol tinctures of A.
annua L. for extraction efficiency of AN and flavonoids. A 60 % v/v tincture with ethanol was
the most proficient, having an extraction efficiency of 40 % for AN and 29.5 % for flavonoids
(Bilia et al., 2006). Future analyses may be performed with the SAM tip extract to determine the
extraction efficiency of ethanol and how the results compare to those reported by Bilia et al.
(2006).
In this project, the appearance and Rf values of compounds of the flavonoids of interest,
CRY and CRYD, and the standards available in the lab, K, Q, CAS, AN, M, AT, EUP, and ART
in various mobile phases and stationary phases were recorded (Table II and III). Often times, the
experimental Rf values did not match the literature values. In addition, there were many gaps in
the methodologies reported by researchers, which made attempts to replicate their experiments
unfeasible. Previous reports declared extracting the flavonoids of interest in mixtures, along
with other flavonoids, which implied the difficulty in separating these flavonoids that are very
similar in structure.
The NMR spectra of the crude extract versus CRY, CRYD, and CAS indicated that
further purification of the crude extract may help verify the presence of the flavonoids of interest.
The chemical shift values of the crude plant extract did not correlate with those of the standards,
which implied that the flavonoids are most likely interacting with each other in such a strong
way that they affected each other’s chemical shift values. However, a TLC analysis of CRY did
79
suggest that it is present in at least the SAM tip extract. The confirmation of the presence of
CRY in the SAM leaf extract is yet to be done.
In the comparison of SAM tip and leaf extracts, more flavonoids and terpenoids were
observed on a per gram basis in the tips than the leaves. The SAM tip extract also contained
three other flavonoids that the leaf extract did not (Fig. 47). Although to our knowledge, no
analyses have been done specifically on the tips and mature leaves of A. annua to make an
absolute comparison, Baraldi et al. (2008) distinguished the production of AN and flavonoids,
namely eupatin, ART, and an inseparable mixture of CAS and CRY, in various aerial parts of A.
annua L. at the pre-flowering, full bloom, and post-flowering stages. Baraldi et al. (2008) did
not analyze the leaves during only the vegetative stage, which is prior to reproduction
(flowering). Both leaves and flowers had the highest content of flavonoids at full bloom; AN, on
the other hand, was highest in the leaves than in the flowers at full bloom (Baraldi et al., 2008).
An interesting endeavor would be to study the inflorescences further using TLC and column
chromatography.
The original objective of this project changed from isolating and identifying CRY, CRS,
and CRYD to clarifying the compounds found in fresh SAM tip and leaf extracts, and
maximizing the number of compounds that could be separated and visualized from them.
Having a limited supply of the expensive standard flavonoids of interest to this project near the
end also restricted the experiments where they could be used in, such as column
chromatography. Although the original objectives were not possible to attain, new information
profiling the constituents found in young growing shoot tips and mature leaves was achieved.
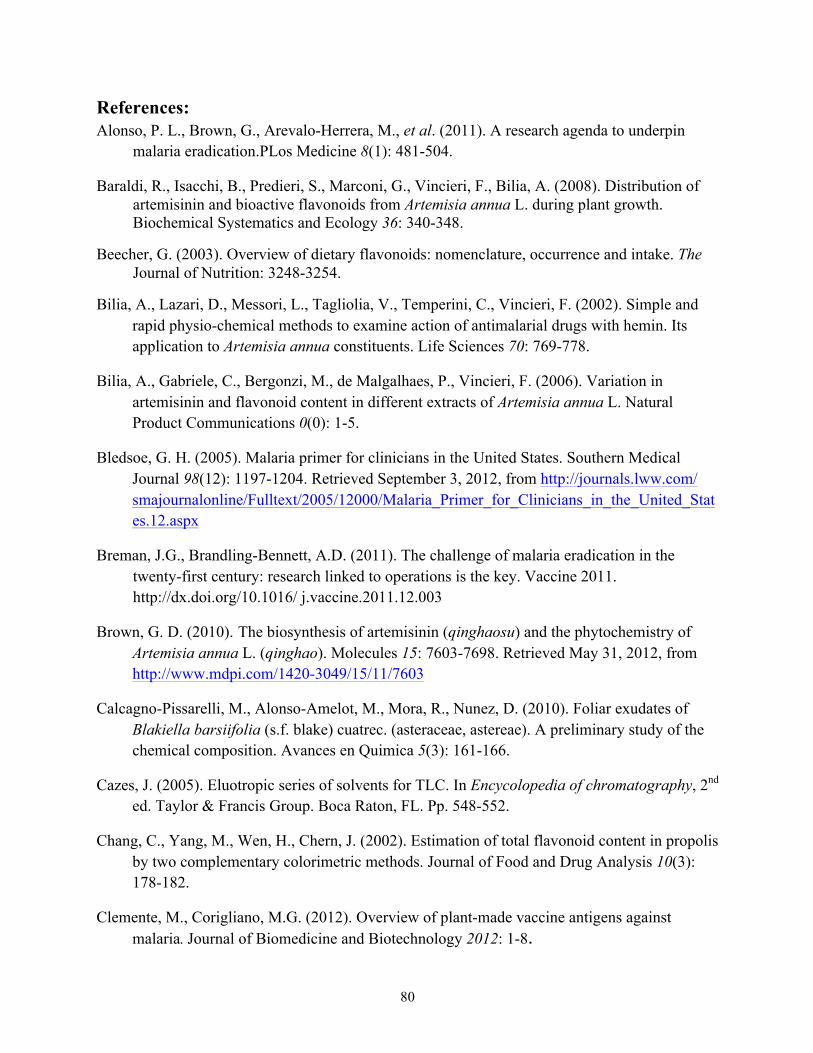
80
References: Alonso, P. L., Brown, G., Arevalo-Herrera, M., et al. (2011). A research agenda to underpin
malaria eradication.PLos Medicine 8(1): 481-504.
Baraldi, R., Isacchi, B., Predieri, S., Marconi, G., Vincieri, F., Bilia, A. (2008). Distribution of artemisinin and bioactive flavonoids from Artemisia annua L. during plant growth. Biochemical Systematics and Ecology 36: 340-348.
Beecher, G. (2003). Overview of dietary flavonoids: nomenclature, occurrence and intake. The Journal of Nutrition: 3248-3254.
Bilia, A., Lazari, D., Messori, L., Tagliolia, V., Temperini, C., Vincieri, F. (2002). Simple and rapid physio-chemical methods to examine action of antimalarial drugs with hemin. Its application to Artemisia annua constituents. Life Sciences 70: 769-778.
Bilia, A., Gabriele, C., Bergonzi, M., de Malgalhaes, P., Vincieri, F. (2006). Variation in artemisinin and flavonoid content in different extracts of Artemisia annua L. Natural Product Communications 0(0): 1-5.
Bledsoe, G. H. (2005). Malaria primer for clinicians in the United States. Southern Medical Journal 98(12): 1197-1204. Retrieved September 3, 2012, from http://journals.lww.com/ smajournalonline/Fulltext/2005/12000/Malaria_Primer_for_Clinicians_in_the_United_States.12.aspx
Breman, J.G., Brandling-Bennett, A.D. (2011). The challenge of malaria eradication in the twenty-first century: research linked to operations is the key. Vaccine 2011. http://dx.doi.org/10.1016/ j.vaccine.2011.12.003
Brown, G. D. (2010). The biosynthesis of artemisinin (qinghaosu) and the phytochemistry of Artemisia annua L. (qinghao). Molecules 15: 7603-7698. Retrieved May 31, 2012, from http://www.mdpi.com/1420-3049/15/11/7603
Calcagno-Pissarelli, M., Alonso-Amelot, M., Mora, R., Nunez, D. (2010). Foliar exudates of Blakiella barsiifolia (s.f. blake) cuatrec. (asteraceae, astereae). A preliminary study of the chemical composition. Avances en Quimica 5(3): 161-166.
Cazes, J. (2005). Eluotropic series of solvents for TLC. In Encycolopedia of chromatography, 2nd ed. Taylor & Francis Group. Boca Raton, FL. Pp. 548-552.
Chang, C., Yang, M., Wen, H., Chern, J. (2002). Estimation of total flavonoid content in propolis by two complementary colorimetric methods. Journal of Food and Drug Analysis 10(3): 178-182.
Clemente, M., Corigliano, M.G. (2012). Overview of plant-made vaccine antigens against malaria. Journal of Biomedicine and Biotechnology 2012: 1-8.
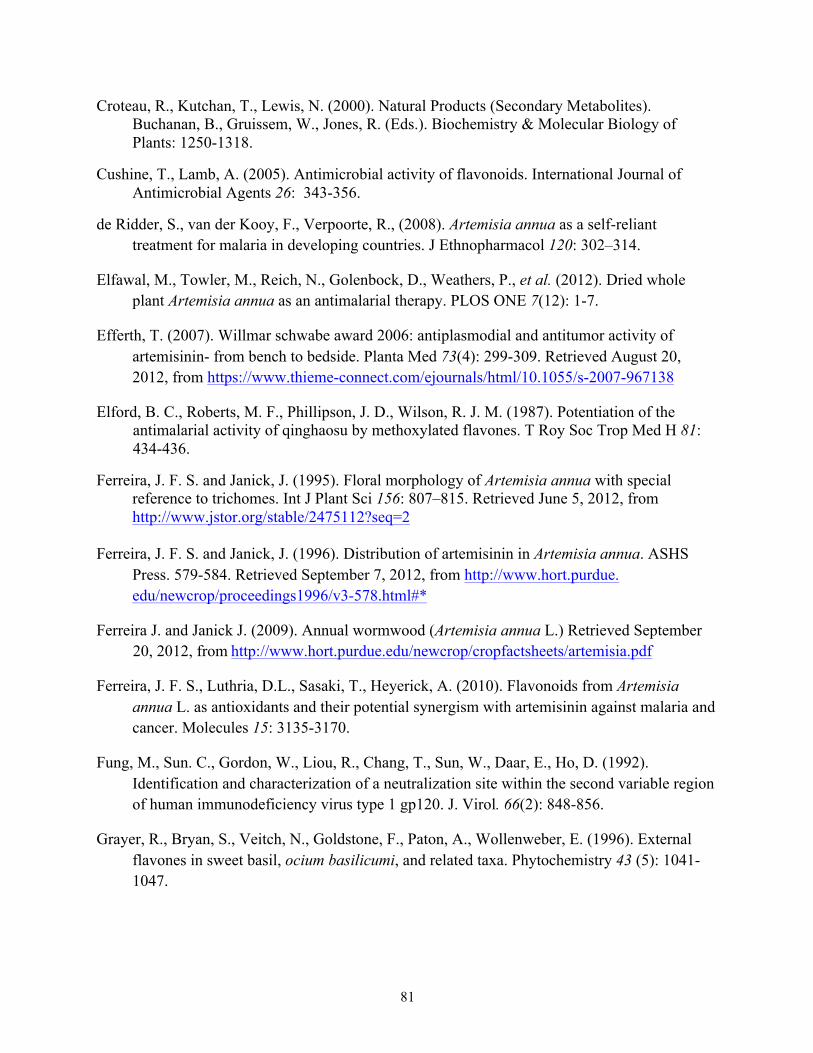
81
Croteau, R., Kutchan, T., Lewis, N. (2000). Natural Products (Secondary Metabolites). Buchanan, B., Gruissem, W., Jones, R. (Eds.). Biochemistry & Molecular Biology of Plants: 1250-1318.
Cushine, T., Lamb, A. (2005). Antimicrobial activity of flavonoids. International Journal of Antimicrobial Agents 26: 343-356.
de Ridder, S., van der Kooy, F., Verpoorte, R., (2008). Artemisia annua as a self-reliant treatment for malaria in developing countries. J Ethnopharmacol 120: 302–314.
Elfawal, M., Towler, M., Reich, N., Golenbock, D., Weathers, P., et al. (2012). Dried whole plant Artemisia annua as an antimalarial therapy. PLOS ONE 7(12): 1-7.
Efferth, T. (2007). Willmar schwabe award 2006: antiplasmodial and antitumor activity of artemisinin- from bench to bedside. Planta Med 73(4): 299-309. Retrieved August 20, 2012, from https://www.thieme-connect.com/ejournals/html/10.1055/s-2007-967138
Elford, B. C., Roberts, M. F., Phillipson, J. D., Wilson, R. J. M. (1987). Potentiation of the antimalarial activity of qinghaosu by methoxylated flavones. T Roy Soc Trop Med H 81: 434-436.
Ferreira, J. F. S. and Janick, J. (1995). Floral morphology of Artemisia annua with special reference to trichomes. Int J Plant Sci 156: 807–815. Retrieved June 5, 2012, from http://www.jstor.org/stable/2475112?seq=2
Ferreira, J. F. S. and Janick, J. (1996). Distribution of artemisinin in Artemisia annua. ASHS
Press. 579-584. Retrieved September 7, 2012, from http://www.hort.purdue. edu/newcrop/proceedings1996/v3-578.html#*
Ferreira J. and Janick J. (2009). Annual wormwood (Artemisia annua L.) Retrieved September 20, 2012, from http://www.hort.purdue.edu/newcrop/cropfactsheets/artemisia.pdf
Ferreira, J. F. S., Luthria, D.L., Sasaki, T., Heyerick, A. (2010). Flavonoids from Artemisia annua L. as antioxidants and their potential synergism with artemisinin against malaria and cancer. Molecules 15: 3135-3170.
Fung, M., Sun. C., Gordon, W., Liou, R., Chang, T., Sun, W., Daar, E., Ho, D. (1992). Identification and characterization of a neutralization site within the second variable region of human immunodeficiency virus type 1 gp120. J. Virol. 66(2): 848-856.
Grayer, R., Bryan, S., Veitch, N., Goldstone, F., Paton, A., Wollenweber, E. (1996). External flavones in sweet basil, ocium basilicumi, and related taxa. Phytochemistry 43 (5): 1041-1047.
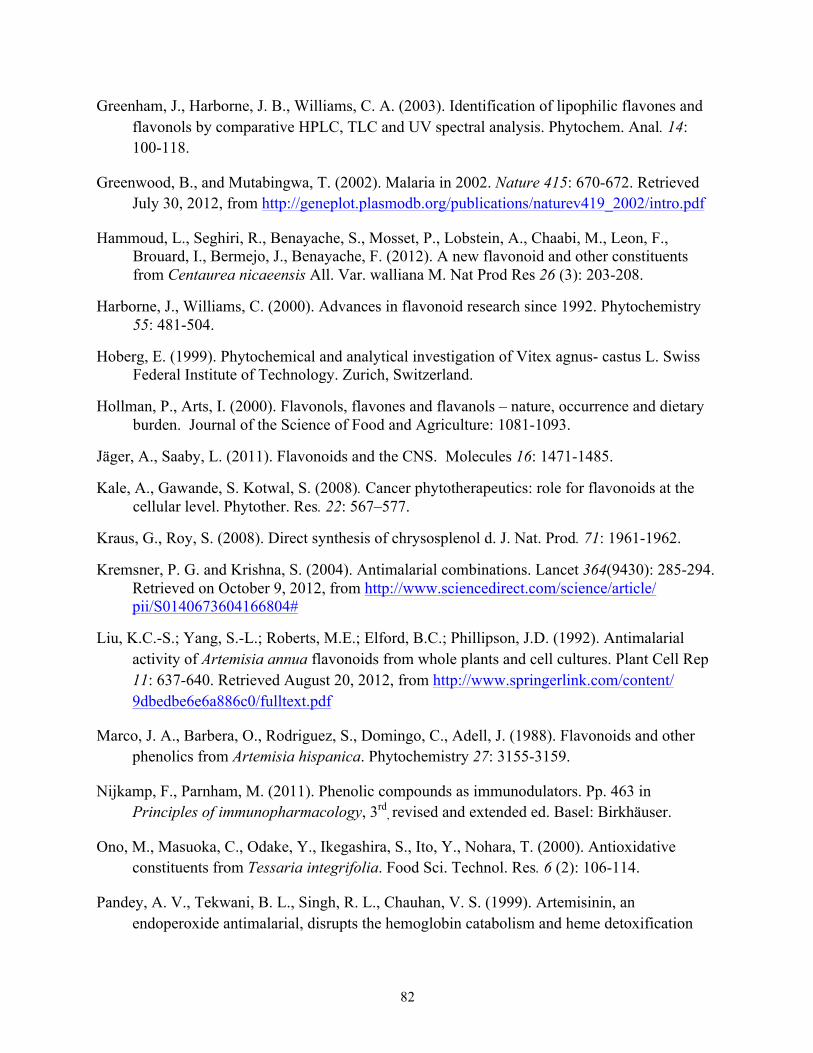
82
Greenham, J., Harborne, J. B., Williams, C. A. (2003). Identification of lipophilic flavones and flavonols by comparative HPLC, TLC and UV spectral analysis. Phytochem. Anal. 14: 100-118.
Greenwood, B., and Mutabingwa, T. (2002). Malaria in 2002. Nature 415: 670-672. Retrieved July 30, 2012, from http://geneplot.plasmodb.org/publications/naturev419_2002/intro.pdf
Hammoud, L., Seghiri, R., Benayache, S., Mosset, P., Lobstein, A., Chaabi, M., Leon, F., Brouard, I., Bermejo, J., Benayache, F. (2012). A new flavonoid and other constituents from Centaurea nicaeensis All. Var. walliana M. Nat Prod Res 26 (3): 203-208.
Harborne, J., Williams, C. (2000). Advances in flavonoid research since 1992. Phytochemistry 55: 481-504.
Hoberg, E. (1999). Phytochemical and analytical investigation of Vitex agnus- castus L. Swiss Federal Institute of Technology. Zurich, Switzerland.
Hollman, P., Arts, I. (2000). Flavonols, flavones and flavanols – nature, occurrence and dietary burden. Journal of the Science of Food and Agriculture: 1081-1093.
Jäger, A., Saaby, L. (2011). Flavonoids and the CNS. Molecules 16: 1471-1485.
Kale, A., Gawande, S. Kotwal, S. (2008). Cancer phytotherapeutics: role for flavonoids at the cellular level. Phytother. Res. 22: 567–577.
Kraus, G., Roy, S. (2008). Direct synthesis of chrysosplenol d. J. Nat. Prod. 71: 1961-1962.
Kremsner, P. G. and Krishna, S. (2004). Antimalarial combinations. Lancet 364(9430): 285-294. Retrieved on October 9, 2012, from http://www.sciencedirect.com/science/article/ pii/S0140673604166804#
Liu, K.C.-S.; Yang, S.-L.; Roberts, M.E.; Elford, B.C.; Phillipson, J.D. (1992). Antimalarial activity of Artemisia annua flavonoids from whole plants and cell cultures. Plant Cell Rep 11: 637-640. Retrieved August 20, 2012, from http://www.springerlink.com/content/ 9dbedbe6e6a886c0/fulltext.pdf
Marco, J. A., Barbera, O., Rodriguez, S., Domingo, C., Adell, J. (1988). Flavonoids and other phenolics from Artemisia hispanica. Phytochemistry 27: 3155-3159.
Nijkamp, F., Parnham, M. (2011). Phenolic compounds as immunodulators. Pp. 463 in Principles of immunopharmacology, 3rd
, revised and extended ed. Basel: Birkhäuser.
Ono, M., Masuoka, C., Odake, Y., Ikegashira, S., Ito, Y., Nohara, T. (2000). Antioxidative constituents from Tessaria integrifolia. Food Sci. Technol. Res. 6 (2): 106-114.
Pandey, A. V., Tekwani, B. L., Singh, R. L., Chauhan, V. S. (1999). Artemisinin, an endoperoxide antimalarial, disrupts the hemoglobin catabolism and heme detoxification
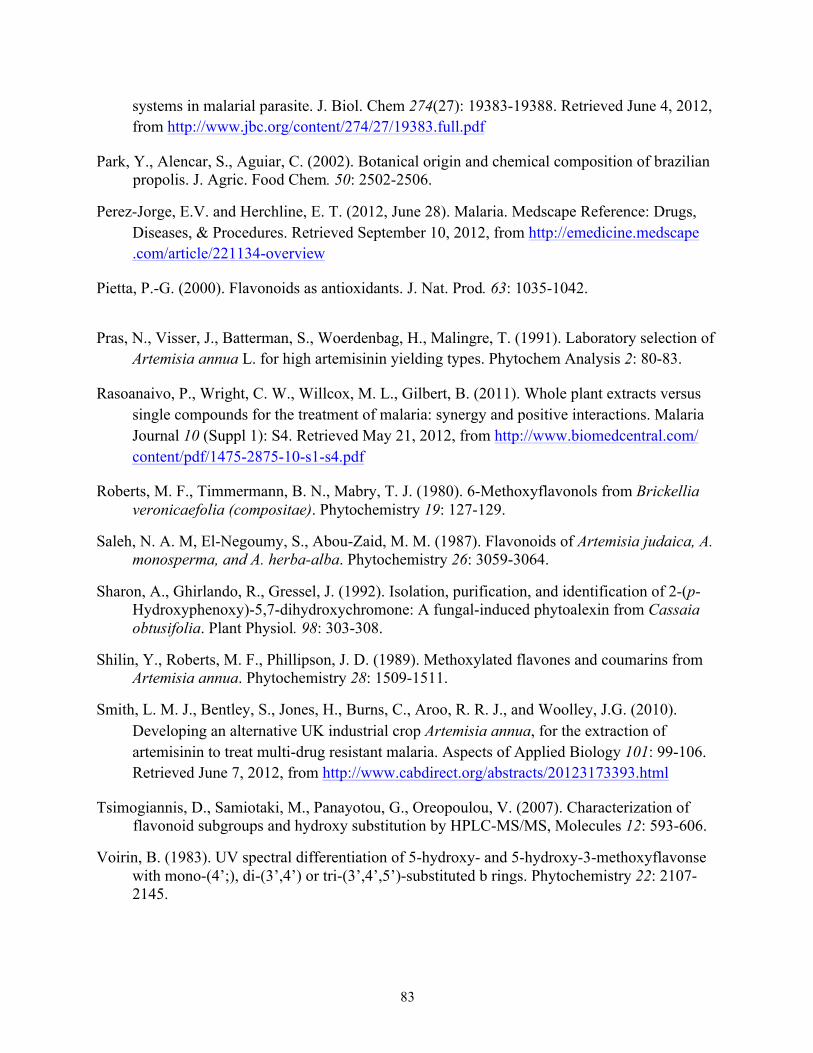
83
systems in malarial parasite. J. Biol. Chem 274(27): 19383-19388. Retrieved June 4, 2012, from http://www.jbc.org/content/274/27/19383.full.pdf
Park, Y., Alencar, S., Aguiar, C. (2002). Botanical origin and chemical composition of brazilian propolis. J. Agric. Food Chem. 50: 2502-2506.
Perez-Jorge, E.V. and Herchline, E. T. (2012, June 28). Malaria. Medscape Reference: Drugs, Diseases, & Procedures. Retrieved September 10, 2012, from http://emedicine.medscape .com/article/221134-overview
Pietta, P.-G. (2000). Flavonoids as antioxidants. J. Nat. Prod. 63: 1035-1042.
Pras, N., Visser, J., Batterman, S., Woerdenbag, H., Malingre, T. (1991). Laboratory selection of Artemisia annua L. for high artemisinin yielding types. Phytochem Analysis 2: 80-83.
Rasoanaivo, P., Wright, C. W., Willcox, M. L., Gilbert, B. (2011). Whole plant extracts versus single compounds for the treatment of malaria: synergy and positive interactions. Malaria Journal 10 (Suppl 1): S4. Retrieved May 21, 2012, from http://www.biomedcentral.com/ content/pdf/1475-2875-10-s1-s4.pdf
Roberts, M. F., Timmermann, B. N., Mabry, T. J. (1980). 6-Methoxyflavonols from Brickellia veronicaefolia (compositae). Phytochemistry 19: 127-129.
Saleh, N. A. M, El-Negoumy, S., Abou-Zaid, M. M. (1987). Flavonoids of Artemisia judaica, A. monosperma, and A. herba-alba. Phytochemistry 26: 3059-3064.
Sharon, A., Ghirlando, R., Gressel, J. (1992). Isolation, purification, and identification of 2-(p-Hydroxyphenoxy)-5,7-dihydroxychromone: A fungal-induced phytoalexin from Cassaia obtusifolia. Plant Physiol. 98: 303-308.
Shilin, Y., Roberts, M. F., Phillipson, J. D. (1989). Methoxylated flavones and coumarins from Artemisia annua. Phytochemistry 28: 1509-1511.
Smith, L. M. J., Bentley, S., Jones, H., Burns, C., Aroo, R. R. J., and Woolley, J.G. (2010). Developing an alternative UK industrial crop Artemisia annua, for the extraction of artemisinin to treat multi-drug resistant malaria. Aspects of Applied Biology 101: 99-106. Retrieved June 7, 2012, from http://www.cabdirect.org/abstracts/20123173393.html
Tsimogiannis, D., Samiotaki, M., Panayotou, G., Oreopoulou, V. (2007). Characterization of flavonoid subgroups and hydroxy substitution by HPLC-MS/MS, Molecules 12: 593-606.
Voirin, B. (1983). UV spectral differentiation of 5-hydroxy- and 5-hydroxy-3-methoxyflavonse with mono-(4’;), di-(3’,4’) or tri-(3’,4’,5’)-substituted b rings. Phytochemistry 22: 2107-2145.
84
Voirin, B., Bayet, C., Faure, O., Jullien, F. (1999). Free flavonoid aglycones as markers of parentage in Mentha aquatic, M. citrate, M. spicata and M. x piperita. Phytochemistry 50: 1189-1193.
Weathers, P. J., Arsenault, P. R., Covello, P. S., McMickelle, A., Teoh, K. H., Reed, D. W. (2011). Artemisinin production in Artemisia annua: studies in planta and results of a novel delivery method for treating malaria and neglected diseases. Phytochem Rev. 10: 173-183.
Weathers, P. J., Towler, M. J. (2012). The flavonoids casticin and artemetin are poorly extracted and unstable in an Artemisia annua tea infusion. Planta Med 78: 1024-1026.
WHO (2001). Antimalarial drug combination therapy: report of a WHO technical consultation. April 4-5. Geneva, Switzerland. Retrieved June 20, 2012, from http://whqlibdoc .who.int/hq/2001/WHO_CDS_RBM_2001.35.pdf
WHO (2011). World malaria report 2011. Geneva, Switzerland. Retrieved October 7, 2012, from http://www.who.int/malaria/world_malaria_report_2011/ WMR2011_noprofiles_lowres.pdf
Winkel-Shirley, B. (2001). Flavonoid Biosynthesis. A Colorful Model for Genetics, Biochemistry, Cell Biology, and Biotechnology. Plant Physiol. 126: 485-493.
Wiwanitkit, V. (2010). New emerging drug-resistant malaria. Int. J. Gen. Med. 3: 327-329. Retrieved June 7, 2012, from www.dovepress.com/getfile.php?fileID=7893
85
Appendix I
Synonyms of chrysoplenetin, chrysosplenol-D, and cirsilineol
Chrysoplenetin/ Chrysosplenetin 1
Chrysosplenol-D/ Chrysoplenol D 2
Cirsilineol 3
5,4’-Dihydroxy-3,6,7,3’- tetramethoxy flavone Quercetagetin-3,6-7,3’-tetramethyl ether Chrysosplenetin B
Chrysosplel D CHRYSOSPLENOLD chrysophenol D 3,6,7-Trimethoxy-3',4',5-trihydroxyflavone 2-(3,4-Dihydroxyphenyl)-5-hydroxy-3,6,7-trimethoxy-4H-1-benzopyran-4-one 5,3',4'-Trihydroxy-3,6,7-trimethoxyflavone Quercetagetin 3,6,7-Trimethyl ether
3’,4’,5,6,7-Pentahydroxyflavone 3’,6,7-tri methylether 4’,5-Dihydroxy-3’,6,7- trimethoxyflavone 3’,4’,5,6,7-Pentahydroxyflavone 6,7-dimethyl ether 3’,4’,5-Trihydroxy-6,7-dimethoxyflavone Anisomelin 5,4'-Dihydroxy-6,7,3'-trimethoxyflavone 5-Hydroxy-2-(4-hydroxy-3-methoxyphenyl)-6,7-dimethoxy-4H-1-benzopyran-4-one 2-(4-Hydroxy-3-methoxyphenyl)-5-hydroxy-6,7-dimethoxy-4H-1-benzopyran-4-one 4',5-Dihydroxy-3',6,7-trimethoxyflavone
1Source: http://pubchem.ncbi.nlm.nih.gov/summary/summary.cgi?sid=12216 2Sources: http://www.chemicalbook.com/ChemicalProductProperty_EN_CB81404010 .htm; http://biolod.org/PosMed/search?actionType=searchexec&condition= GeneIds&geneIds1=KID:C00004692&keyword=plant+WHERE+synapse&posSelectMode=false&rankScore=squ
3Sources: Brown, 2010; Saleh et al., 1987; http://www.chemicalbook.com/ ChemicalProductProperty_EN_CB91387604.htm; http://www.chemicalbook .com/ ProductChemicalPropertiesCB91387604_EN.htm
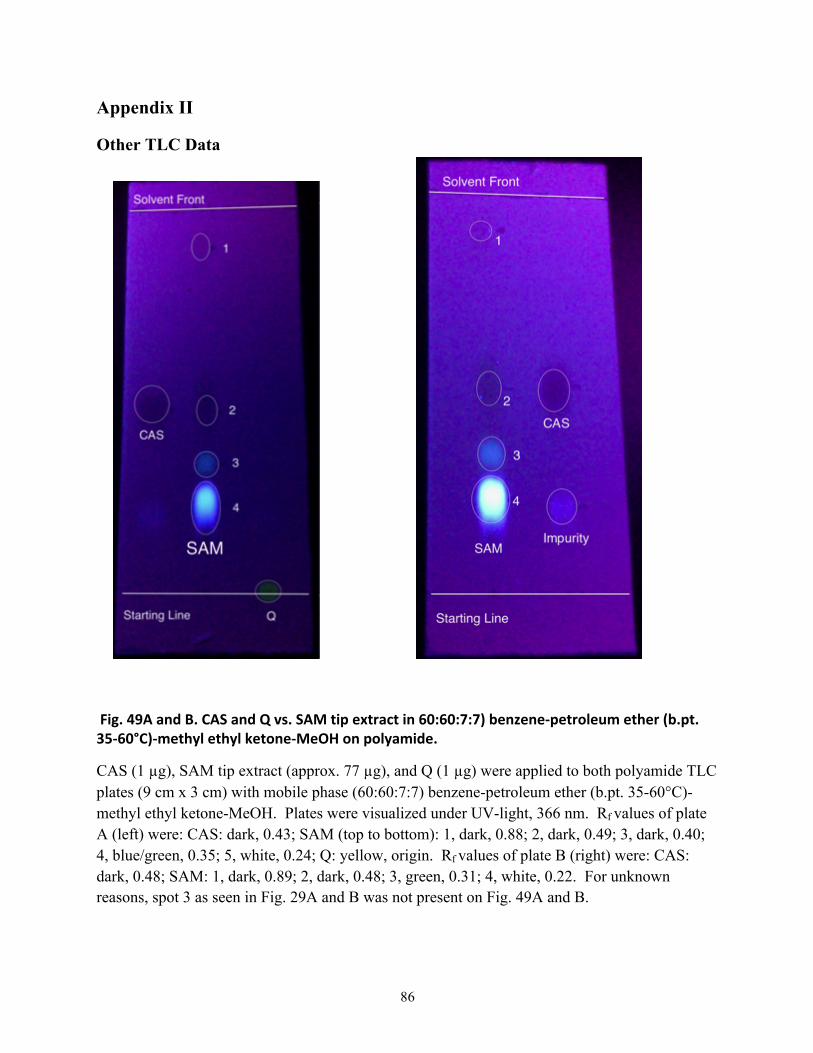
86
Appendix II
Other TLC Data
Fig. 49A and B. CAS and Q vs. SAM tip extract in 60:60:7:7) benzene-‐petroleum ether (b.pt. 35-‐60°C)-‐methyl ethyl ketone-‐MeOH on polyamide.
CAS (1 µg), SAM tip extract (approx. 77 µg), and Q (1 µg) were applied to both polyamide TLC plates (9 cm x 3 cm) with mobile phase (60:60:7:7) benzene-petroleum ether (b.pt. 35-60°C)-methyl ethyl ketone-MeOH. Plates were visualized under UV-light, 366 nm. Rf values of plate A (left) were: CAS: dark, 0.43; SAM (top to bottom): 1, dark, 0.88; 2, dark, 0.49; 3, dark, 0.40; 4, blue/green, 0.35; 5, white, 0.24; Q: yellow, origin. Rf values of plate B (right) were: CAS: dark, 0.48; SAM: 1, dark, 0.89; 2, dark, 0.48; 3, green, 0.31; 4, white, 0.22. For unknown reasons, spot 3 as seen in Fig. 29A and B was not present on Fig. 49A and B.
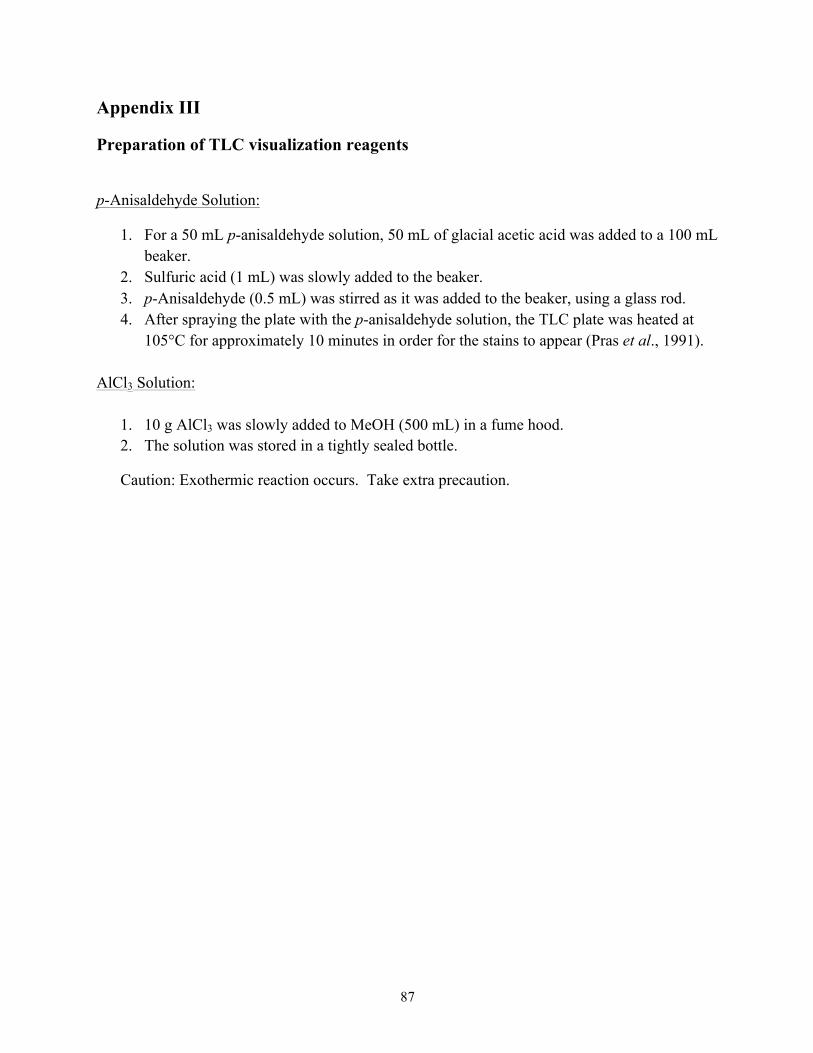
87
Appendix III
Preparation of TLC visualization reagents
p-Anisaldehyde Solution:
1. For a 50 mL p-anisaldehyde solution, 50 mL of glacial acetic acid was added to a 100 mL beaker.
2. Sulfuric acid (1 mL) was slowly added to the beaker. 3. p-Anisaldehyde (0.5 mL) was stirred as it was added to the beaker, using a glass rod. 4. After spraying the plate with the p-anisaldehyde solution, the TLC plate was heated at
105°C for approximately 10 minutes in order for the stains to appear (Pras et al., 1991).
AlCl3 Solution:
1. 10 g AlCl3 was slowly added to MeOH (500 mL) in a fume hood. 2. The solution was stored in a tightly sealed bottle.
Caution: Exothermic reaction occurs. Take extra precaution.
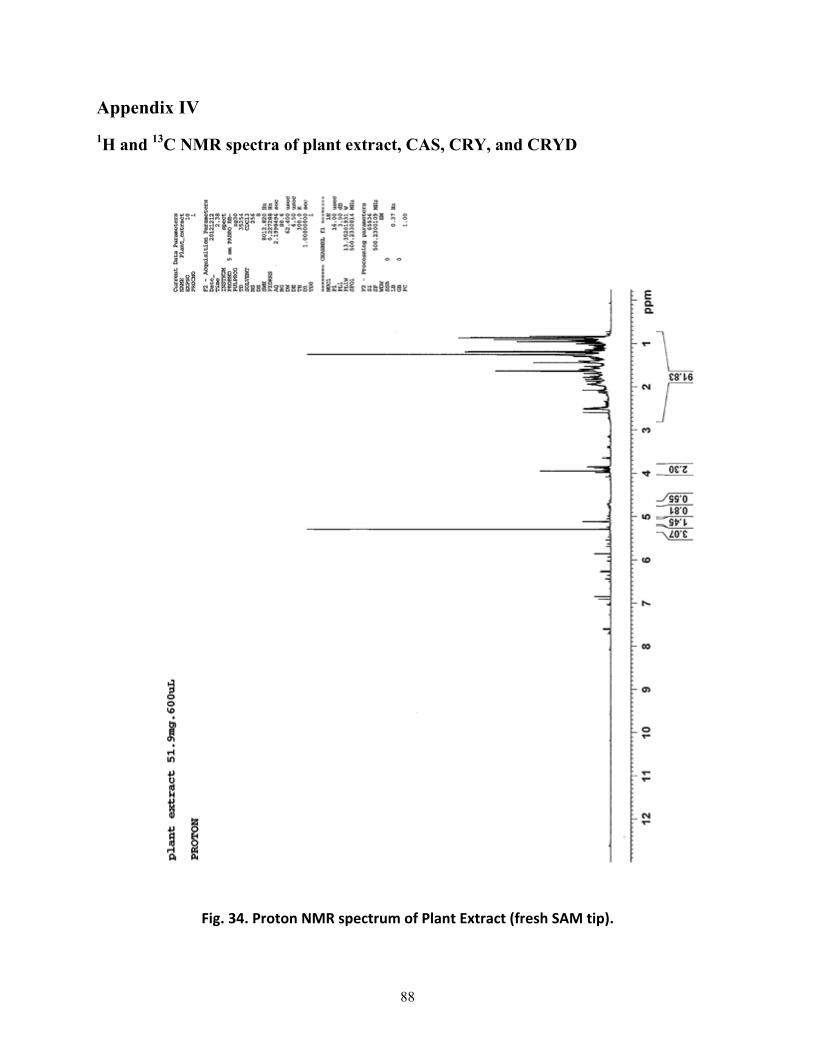
88
Appendix IV 1H and 13C NMR spectra of plant extract, CAS, CRY, and CRYD
Fig. 34. Proton NMR spectrum of Plant Extract (fresh SAM tip).
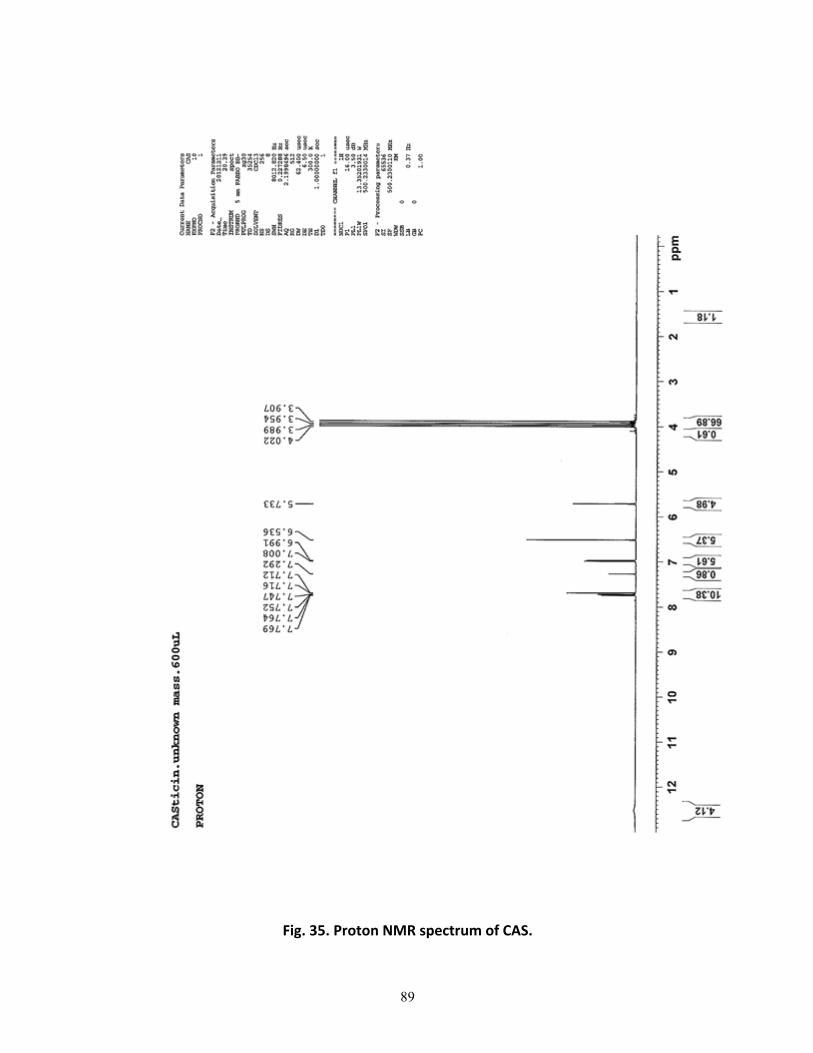
89
Fig. 35. Proton NMR spectrum of CAS.
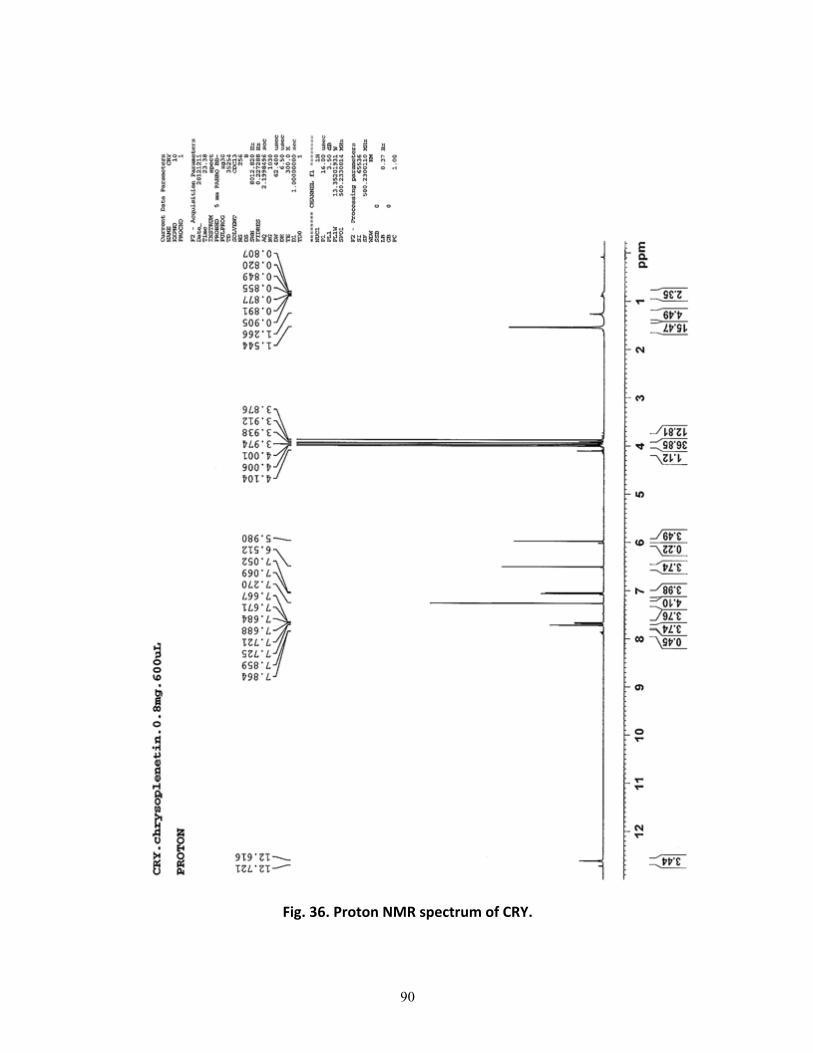
90
Fig. 36. Proton NMR spectrum of CRY.
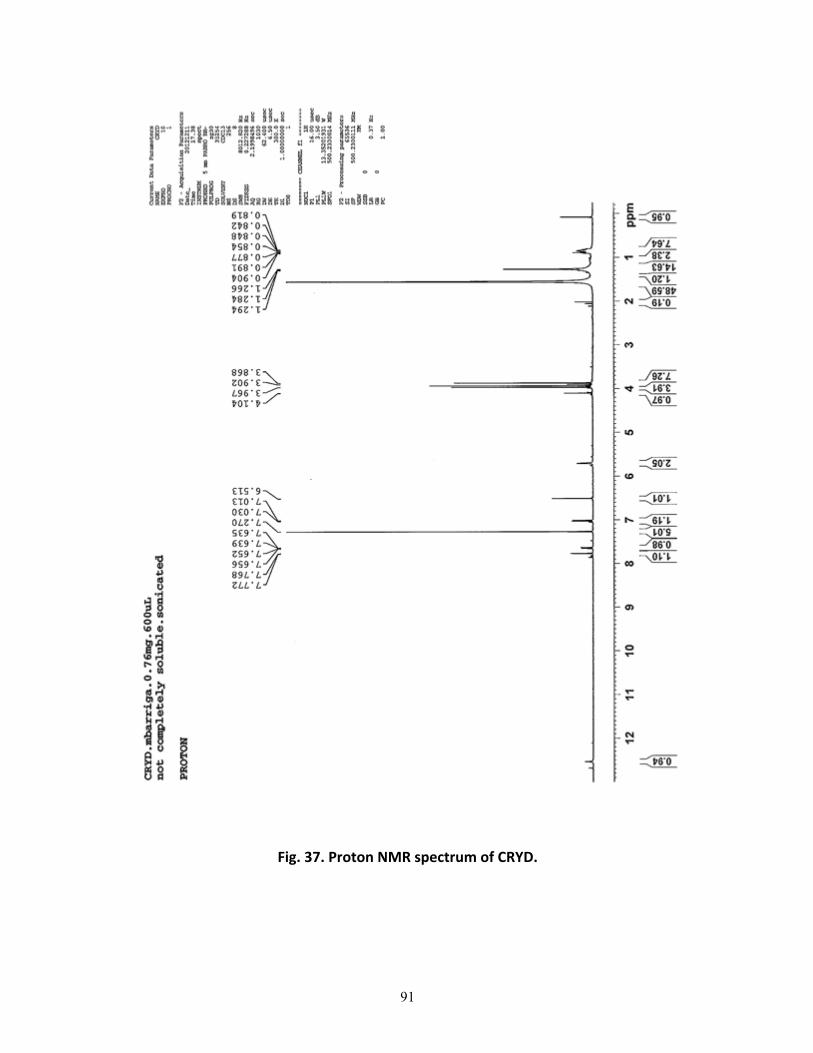
91
Fig. 37. Proton NMR spectrum of CRYD.
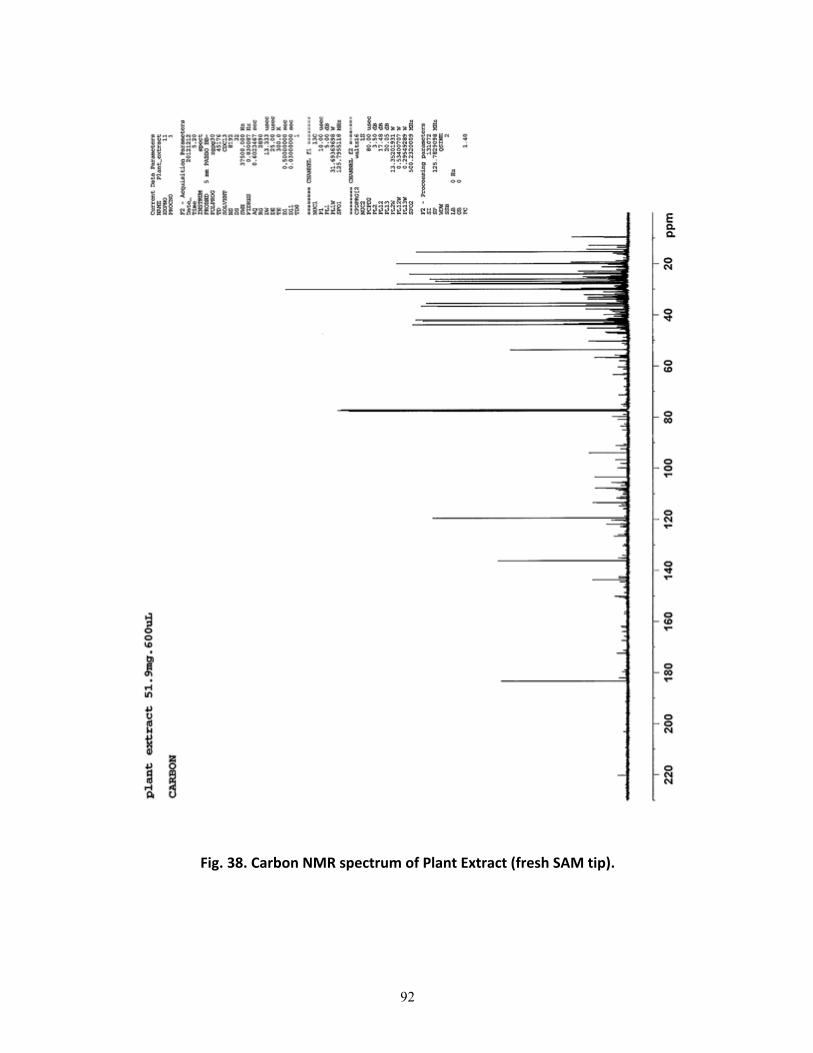
92
Fig. 38. Carbon NMR spectrum of Plant Extract (fresh SAM tip).
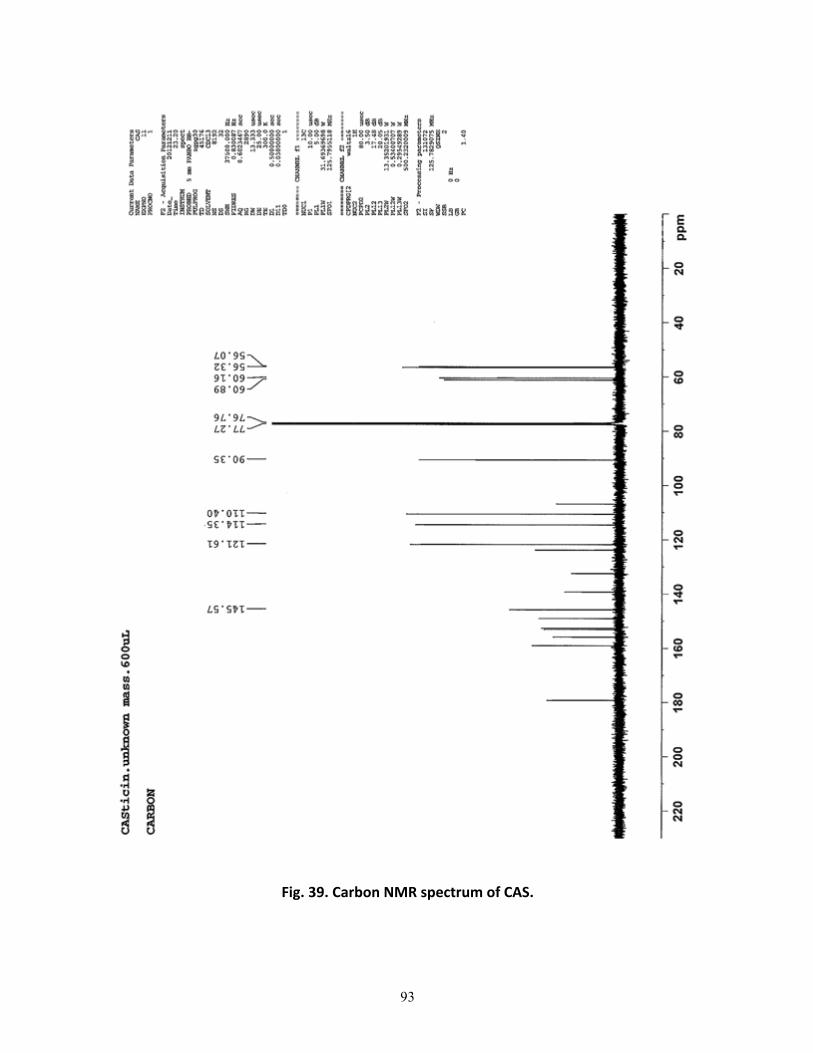
93
Fig. 39. Carbon NMR spectrum of CAS.
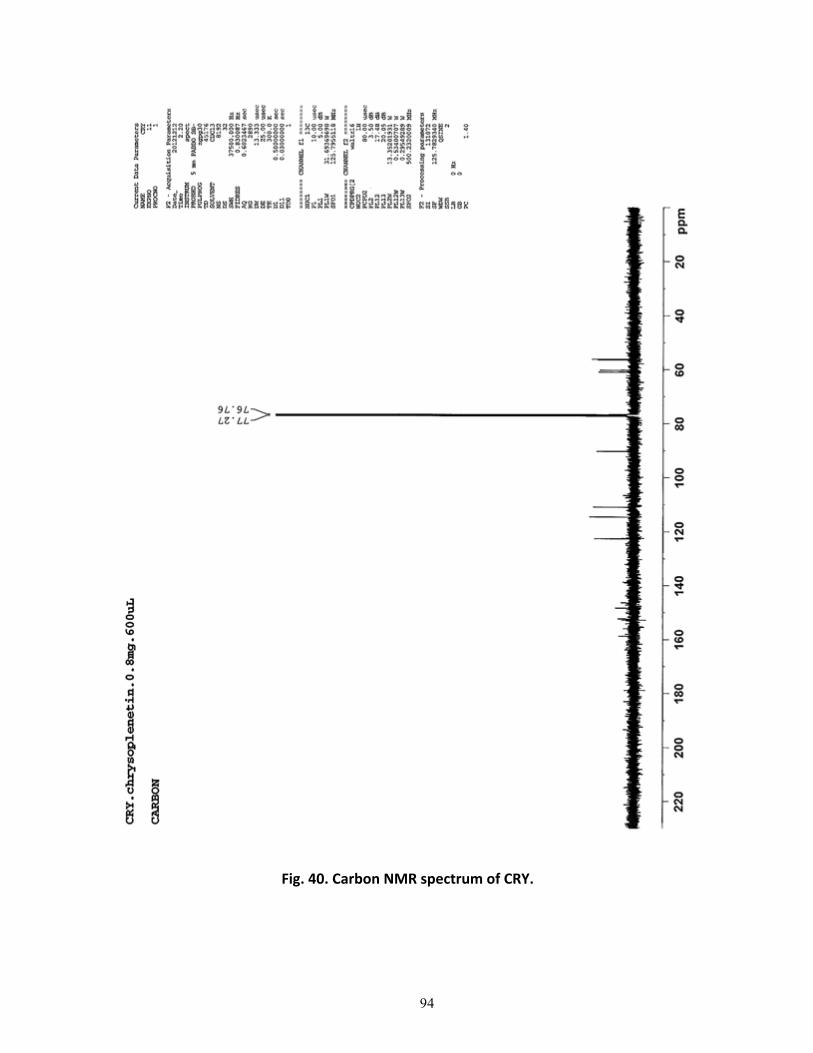
94
Fig. 40. Carbon NMR spectrum of CRY.
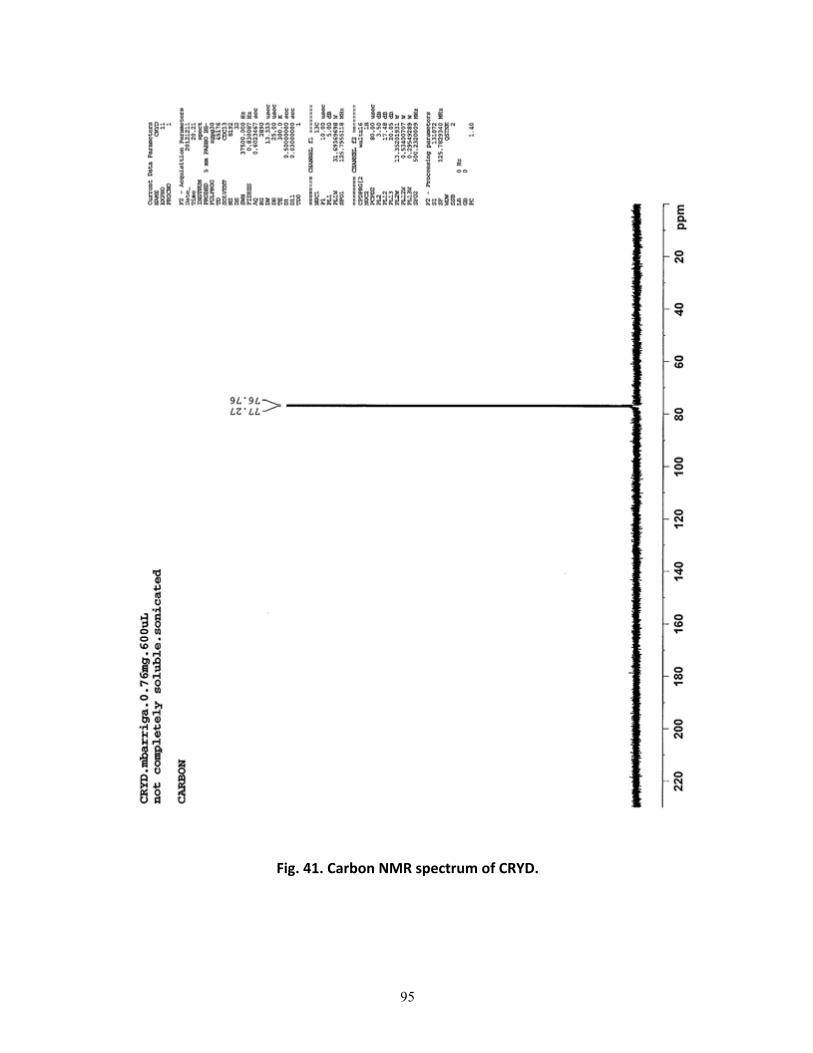
95
Fig. 41. Carbon NMR spectrum of CRYD.


![Flavonoids from Artemisia annua L. as Antioxidants and ... › IMG › pdf › 2010_flavonoids...derivatives like resveratrol, and other phenolic compounds [18]. Phenolic compounds](https://static.fdocuments.net/doc/165x107/5f17e4047d6b8a3e7351e6af/flavonoids-from-artemisia-annua-l-as-antioxidants-and-a-img-a-pdf-a-2010flavonoids.jpg)