Characterization of exocrine secretory glands in the ...
90
1 From the Institute of Anatomy and Cell Biology, Department of Neuroanatomy Faculty of Medicine, University of Saarland, Homburg/Saar Characterization of exocrine secretory glands in the digestive tract of CSP knockout mice Inaugural Dissertation presented to the Faculty of Medicine, University of Saarland, Homburg, Germany, in order to obtain the degree of Dr. med. By: Josif Mirceski Born on 16.10.1979, in Prilep, Republic of Macedonia Homburg 2008
Transcript of Characterization of exocrine secretory glands in the ...

1
From the Institute of Anatomy and Cell Biology, Department of Neuroanatomy
Faculty of Medicine, University of Saarland,
Homburg/Saar
Characterization of exocrine secretory glands in the
digestive tract of CSP knockout mice
Inaugural Dissertation presented to the Faculty of Medicine, University of
Saarland, Homburg, Germany, in order to obtain the degree of Dr. med.
By: Josif Mirceski
Born on 16.10.1979, in Prilep, Republic of Macedonia
Homburg
2008

2
Date of promotion:
Dean:
Correspondent:

3
Table of Contents
1. Summary ........................................................................................................... 12
2. Introduction ........................................................................................................ 14
2.1. Molecular anatomy of CSP proteins ........................................................... 14
2.1.1. J-domain ............................................................................................. 15
2.1.2. Linker domain ...................................................................................... 15
2.1.3. The cysteine string .............................................................................. 16
2.1.4. The variable C-terminus ...................................................................... 16
2.1.5. The N- terminus .................................................................................. 17
2.2. Hypothesis on CSP function ....................................................................... 17
2.2.1. Involvement in Ca2+ channel function .................................................. 17
2.2.2. Regulation of exocytosis ..................................................................... 18
2.2.3. Chaperone function ............................................................................. 20
2.3. Analysis of CSP function in CSP deficient flies .......................................... 21
2.4. Analysis of CSP function in CSP KO mice ............................................ 21
2.5. Exocrine secretory glands in the gastrointestinal tract ............................... 25
2.5.1. General aspects of food digestion ....................................................... 25
2.5.2. Histology and physiology of major exocrine glands in the digestive
tract……. ........................................................................................................... 26
2.6. Mast cells ................................................................................................ 28
2.7. Aim of the present study: CSP protein and the pancreas ....................... 28
3. Materials and Methods ...................................................................................... 30
3.1. Chemicals and materials ............................................................................ 30
3.2. Experimental animals ................................................................................. 33
3.3. Electron microscopy ................................................................................... 34

4
3.3.1. Preparation of the solutions and buffers used for washing, fixing and
embedding the tissues ....................................................................................... 34
3.3.2. Preparation of Richardson Blue stain .................................................. 36
3.3.3. Organs harvesting, fixing and embedding for electron microscopy ..... 36
3.3.4. Trimming and cutting ........................................................................... 39
3.3.5. Section-contrasting ............................................................................. 39
3.3.6. Analysis by transmission electron microscopy .................................... 40
3.3.7. Morphometric and statistical analysis of data ...................................... 40
3.4. RNA extraction and purification .................................................................. 40
3.4.1. Parotid gland ....................................................................................... 40
3.4.2. Mast cells ............................................................................................ 41
3.4.3. Pancreas ............................................................................................. 41
3.4.4. Testis .................................................................................................. 42
3.5. Reverse transcriptase polymerase chain reaction (RT-PCR) ..................... 42
3.5.1. Reverse transcription .......................................................................... 42
3.5.2. PCR .................................................................................................... 43
3.6. DNA extraction and purification for CSP genotyping .................................. 44
3.6.1. Phenol-chloroform extraction method ................................................. 45
3.6.2. Two-step method for DNA extraction .................................................. 45
3.7. Genotyping for the wild type (WT) and knockout (KO) CSP allele ............. 46
3.8. Agarose gel electrophoresis ....................................................................... 47
4. Results .............................................................................................................. 48
4.1. General remarks on EM quantifications .................................................. 48
4.2. Qualitative and quantitative transmission electron microscopy of exocrine
pancreatic acinar cells in CSP KO and WT control animals ............................ 51
4.2.1. Number of zymogen granules per acinar cell ...................................... 53

5
4.2.2. Zymogen granules diameter ................................................................ 53
4.2.3. Serial sections, average maximum diameter and average volume of the
zymogen granules ............................................................................................. 55
4.2.4. Distribution of zymogen granules in exocrine pancreatic acinar cells . 56
4.3. Quantitative transmission electron microscopy of parotid acinar cells in
CSP KO and WT control animals ........................................................................ 58
4.3.1. Zymogen granule diameter ................................................................. 60
4.3.2. Average granule number per acinar cell ............................................. 61
4.3.3. Distribution of zymogen granules in parotid acinar cells ..................... 62
4.4. Quantitative transmission electron microscopy of submandibular serous
acinar cells in CSP KO and WT control animals ................................................. 64
4.4.1. Zymogen granule diameter ................................................................. 66
4.4.2. Average granule number per acinar cell ............................................. 67
4.4.3. Distribution of zymogen granules in submandibular serous cells ........ 68
4.5. Mast cells ................................................................................................... 70
4.6. CSP isoforms genotyping ........................................................................... 72
5. Discussion ......................................................................................................... 74
6. Conclusion ......................................................................................................... 79
7. References ........................................................................................................ 80
8. Acknowledgements ........................................................................................... 88
9. Curriculum Vitae ................................................................................................ 89

6
Table of figures
Figure 1: Scheme of the CSP domain structure ....................................................... 15
Figure 2: Schematic representation of pancreatic exocrine acinus (applicable also for
parotid and submandibular glands) .......................................................................... 26
Figure 3: Schematic representation of an acinar cell and measuring the distribution of
the granules in the cell .............................................................................................. 49
Figure 4: Scheme of single (left) and serial sectioning (right) of the zymogen granules
................................................................................................................................. 50
Figure 5: The phenotype of the exocrine pancreatic acinar cells in CSP wild-type and
CSP knockout animals. ............................................................................................ 52
Figure 6: Granules number in pancreatic acinar cell ................................................ 53
Figure 7: Zymogen granule diameter in pancreatic acinar cells ................................ 54
Figure 8: Diameter and volume of zymogen granules from serial sectioning............ 56
Figure 9: Distribution of the granules in the pancreatic acinar cells .......................... 57
Figure 10: The morphology in the acinar cells of the parotid gland in CSP KO and
WT animals ............................................................................................................... 59
Figure 11: Zymogen granule diameter in the parotid acinar cells ............................. 60
Figure 12: Granule number in the parotid acinar cells .............................................. 61
Figure 13: Quantification of distribution of zymogen granules in parotid acinar cells 62
Figure 14: Morphology of the acinar cell from the submandibular gland of CSP wild-
type and CSP knockout mice. ................................................................................... 65
Figure 15: Some of the heteromorphous granules in the submandibular gland of CSP
knockout animals at higher magnification ................................................................. 66
Figure 16: Zymogen granule diameter in the submandibular acinar cells ................. 67
Figure 17: Zymogen granule number per acinar cell ................................................ 68
7
Figure 18: Distribution of the zymogen granules in the serous acinar cells of the
submandibular gland ................................................................................................ 69
Figure 19: Peritoneal mast cells ............................................................................... 70
Figure 20: Mast cells parameters quantification results ............................................ 71
Figure 21: CSP Isotyping in the bone marrow mast cells ......................................... 72
Figure 22: CSP Isotyping in the exocrine pancreas and the parotid gland ............... 73

8
List of tables
Table 1: Chemicals and reagents used in the experimental procedures .................. 31
Table 2: Laboratory hardware equipment ................................................................. 33
Table 3: Software packages used in the processing of the digital data .................... 33
Table 4: Solutions and buffers (and their composition) used for washing, fixing and
embedding the tissues .............................................................................................. 35
Table 5: Composition of the PCR mixture used for reverse transcription ................. 42
Table 6: Composition of the PCR mixture added at step 2 of the reverse transcription
................................................................................................................................. 43
Table 7: Composition of the PCR mixture used for generating the second strand of
the DNA .................................................................................................................... 43
Table 8: Primers and their sequences used for CSP RT-PCR ................................. 44
Table 9: Thermal cycler PCR conditions used in the CSP isotyping ......................... 44
Table 10: Master Mix of reagents used for the WT PCR reaction ............................. 46
Table 11: Master Mix of reagents used for the KO PCR reaction ............................. 46
Table 12: Thermal cycler conditions used for the CSP genotyping .......................... 47
9
Abbreviations
GDI GDP dissociation inhibitor
ATP Adenosine triphosphate
BMMC Bone marrow mast cells
bp Base pairs
CSP Cysteine string protein
CSP Cysteine string protein, isoform or
DDSA Dodecenyl succinic anhydride
DEPC Diethyl pyrocarbonate
DMP30 2,4-tri(dimethylaminoethyl)phenol
DNA Deoxyribonucleic acid
dNTP Deoxy nucleotide tri-phosphate
DTT Dithiothreitol
EDTA Ethylenediamine tetraacetic acid
ERG Electroretinogram
EM Electron Microscope, electron microscopy
EPON Epoxy resin
GABA -aminobutyric acid
GABAB -aminobutyric acid receptor type B
GAD Glutamate decarboxylase
GDP Guanosine diphosphate
10
GTP Guanosine triphosphate
Hsc70 Heat-shock cognate of 70kDa
Hsp40 Heat-shock protein of 40kDa
Hsp70 Heat-shock protein of 70kDa
kDa Kilodaltons
KO Knockout
L Lumen
LDCV Large dense-core vesicles
N Nucleus
NMA Nadic methyl anhydride
NMJ Neuro-muscular junction
OD Optical density
PBS Phosphate-buffered saline
PCR Polymerase chain reaction
PFA Paraformaldehyde
Px Postnatal day X
r Radius
RNA Ribonucleic acid
rpm Rounds per minute
RT Room temperature
RT-PCR Reverse transcriptase polymerase chain reaction
SGT Small glutamine-rich TRP protein

11
SNARE Soluble N-ethylmaleimide-sensitive factor attachment protein receptor
SV Synaptic vesicle
TAE Tris-acetate buffer with EDTA
TRP Tetratricopeptide repeat
UA Uranyl acetate
UV Ultraviolet
V Volume
VAMP Vesicle-associated membrane protein
vGAT Vesicular GABA transporter
WT Wild-type

12
1. Summary
CSPs (cysteine string proteins) are relatively small proteins originally discovered in
brain homogenates of Drosophila melanogaster. They are associated with the
membrane of the synaptic vesicles, as well as with secretory vesicles of other, non-
neuronal cell types. Since their discovery, there have been several hypothesis of their
function: namely, that they are involved in regulation of voltage-dependent Ca2+
channels, that they regulate exocytosis and acting as a part of an Hsp70 chaperone
complex.
To further study and characterize the functions of CSP, CSP knockout (KO) mice
were generated (Fernandez-Chacon et al. 2004). The CSP KO mice are viable at
birth and develop normally in the beginning, but after about two weeks of age, they
stop gaining weight, suffer from vision impairments and develop fatal sensorimotor
disorder. The mutant mice lacking the CSP gene die at the age of ~2 months
(Fernandez-Chacon et al. 2004). This late onset of the symptoms combined with the
neuro-muscular junction (NMJ) and Calyx synapses’ degeneration only after certain
period (~2-3 weeks of age), strongly favors a chaperone function of CSP.
Particularly, proteins involved in the exocytosis undergo constant cycles of assembly
and disassembly. After extended usage, these proteins age and in the animals that
lack the chaperone machinery, they cannot be repaired and recycled. These effects
lead to the degeneration of the synapses.
CSP is found also on the secretory vesicles (zymogen granules) of the pancreatic
acinar cells (Brown et al. 1998). The CSP KO mice exhibit disturbances in the
weight gain. These changes could be contributed to alterations in the exocrine
pancreas. This study aims to look for possible alterations in the pancreatic exocrine

13
cells that could lead to defects of secretion of digestive enzymes and therefore
disturbances in weight gain. In addition, other exocrine glands in the digestive system
(parotid and the submandibular) were examined. This study shows that all of the
secretory glands have structural alterations. Particularly, the exocrine zymogen
granules of the mutant animals showed altered characteristics: they were bigger in
diameter (pancreas, parotid and submandibular), more in number (pancreas and
submandibular, but not parotid gland) and had an altered intracellular distribution
(regarding the polarity of the cell) in every organ observed. Not all of the cells in the
mutant animals were affected. No changes were observed in mast cells.
Mechanistically, the overall changes observed in the glands could be attributed to the
inability of the cellular machinery to recycle important proteins (SNAREs, Rabs). It
has been suggested that Rab3D (which interacts with a complex that contains CSP)
is responsible for maintaining normal size of the granules. In addition, the inability to
efficiently form SNARE complexes, therefore inability to perform exocytosis, could
lead to accumulation of granules in the cell. These results favour the theory that
CSP acts primarily as a chaperone, recycling important cellular components. How
exactly these changes occur at a molecular level needs to be addressed by future
investigations.

14
2. Introduction
Cysteine-string proteins (CSP) are relatively small proteins, originally discovered in
Drosophila melanogaster using a monoclonal antibody raised against a crude brain
homogenate (Zinsmaier et al. 1990). CSPs are associated with the cytosolic face of
the membranes of synaptic vesicles. They have also been localized on the
membranes of secretory vesicles of chromaffin cells (chromaffin granules;
Chamberlain and Burgoyne 1998), exocrine pancreatic cells (zymogen granules;
Braun and Scheller 1995), insulin-containing large dense-core secretory granules of
neuroendocrine -cells (Zhang et al. 1998), and secretory granules of the rat
neurohypophysis (Jacobsson and Meister 1996).
CSP proteins are ubiquitously found in the animal world. They are expressed in
invertebrates as well as in vertebrates. In invertebrates, like Drosophila, there is one
gene that codes for CSP1, as well as its C-terminal splice isoform CSP2. In
mammals, there are three genes that code the three isoforms so far known- CSP
and . CSP is ubiquitously express in various tissues, but highly enriched in brain.
The other two isoforms, CSPß and are testis specific (Fernandez-Chacon et al.
2004).
2.1. Molecular anatomy of CSP proteins
CSPs are characterized by typical domain structure: they contain a J-domain at the
N-terminus of the protein, a cysteine-rich string towards the C-terminus of the protein,
a linker region connecting them, and the highly conserved C-terminus
(Mastrogiacomo and Gundersen 1995) (Figure 1).

15
Figure 1: Scheme of the CSP domain structure
N: N-terminus, C: C-terminus
2.1.1. J-domain
The J-domain was initially described in bacteria (bacterial DnaJ protein) and it is the
signature domain of Hsp40-type co-chaperones. It comprises a stretch of 70 amino-
acids evolutionary conserved from E. coli to man. It is well established that the J-
domain mediates binding of the Hsp40 co-chaperones to Hsp70 chaperone proteins
(Caplan et al. 1993; Silver and Way 1993). So far, a considerable number of
eukaryotic proteins have been found that contain a “J” domain. For most of them it
has been shown that they interact with and regulate the functions of members of the
Hsp70 chaperone group (Cheetham and Caplan 1998; for review, see Chamberlain
and Burgoyne 2000). Several studies demonstrated that CSP interacts with Hsc70 in
an ATP-dependent matter (Braun et al. 1996). This interaction that stimulates the
ATP-ase activity of both Hsc/Hsp70 several fold (Chamberlain and Burgoyne 1997) is
mediated by the DnaJ domain of the CSP (Braun et al. 1996; Stahl et al. 1999).
2.1.2. Linker domain
The linker domain (~20 amino acids) is highly conserved region, and is found
between the J-domain and the cysteine string. Its function is still unknown, though it
has been suggested to be important for the effects of CSP on secretion (Zhang et al.
1999).

16
2.1.3. The cysteine string
The cysteine string, after which the protein is named, contains a high number of
cysteine residues (14) in a 24 amino acid span (for Torpedo and mammalian CSPs),
which are heavily palmitoylated. This string is responsible for the localization of the
CSP to the membranes of the secretory vesicles (Gundersen et al. 1994;
Mastrogiacomo et al. 1994; Mastrogiacomo and Gundersen 1995; Chamberlain and
Burgoyne 1998). The palmitoylation of these cysteine residues gives the protein an
amphipathic structure, which could mediate the correct membrane association of the
CSP (Gundersen et al. 1994). Complete depalmitoylation, however, does not
displace the CSP from the membranes, indicating that palmitoylation is required for
initial membrane targeting, but not stable membrane association (van de Goor and
Kelly 1996; Chamberlain and Burgoyne 1998). In a recent study (Ohyama et al.
2007) it is suggested that, in Drosophila, the Huntingtin-interacting protein 14 (hip14)
which acts as a palmitoyl transferase, is responsible for the palmitoylation of CSP.
hip14 mutants show exocytic defects or nearly complete loss of synaptic
transmission, and also severe mislocalization of CSP in the synapses.
2.1.4. The variable C-terminus
This part of the CSP is the most variable domain and strongly varies between the
different CSP isoforms as well as among different species. In Drosophila, deletion in
the C- terminus does not affect membrane targeting of the CSP (Arnold et al. 2004).
Also, it has been found that the C- terminus mediates the homodimerization of CSP
and its Ca2+-dependent interactions with the SNARE protein VAMP2, but not with its
isoform VAMP3 (Boal et al. 2004).
17
2.1.5. The N- terminus
The N- terminus of the CSP is another part of the protein which is variable. Its
importance is largely unknown. It has been shown that it is not required for targeting
of CSP to the membranes of the vesicles (Boal et al. 2004).
2.2. Hypothesis on CSP function
2.2.1. Involvement in Ca2+ channel function
The first hypothesis for CSP function suggested an involvement of CSP in the
regulation of Ca2+ channel function. Based on overexpression studies, it has been
observed that CSP antisense RNA inhibits expression of the N-type Ca2+ channels
when coinjected with Torpedo electric lobe mRNA into Xenopus oocytes (Gundersen
and Umbach 1992). Furthermore, it was found that voltage-gated Ca2+ influx was
impaired in CSP mutant Drosophila synapses and that neurotransmitter release could
be rescued in these flies by application a Ca2+ ionophore (Ranjan et al. 1998).
Introduction of recombinant CSP into chick nerve terminals increased Ca2+ channel
activity (Chen et al. 2002) and CSP may bind to vertebrate Ca2+ channel proteins
(Leveque et al. 1998) or to G protein subunits regulating Ca2+ channels (Magga et al.
2000). The idea that CSP mediates the assembly or regulation of Ca2+ channels at
the active zone is attractive in view of the localization of CSP on synaptic vesicles.
This hypothesis of CSP regulating Ca2+-channels was tested by fluorometric Ca2+
measurements that demonstrated that nerve terminals from Drosophila CSP mutants
display an increase, and not a decrease, in Ca2+ influx (Dawson-Scully et al. 2000)
and by measurements of Ca2+ currents in peptidergic terminals from CSP mutant flies
(Morales et al. 1999). In addition, this hypothesis was also tested in the Calyx of Held
18
synapse of the CSP KO mutant mice. When investigating the presynaptic Ca2+
channel function in the mutant mice, no significant changes were observed
(Fernandez-Chacon et al. 2004). What was observed was close similarity in the
activation time course and voltage dependence of the Ca2+ currents.
The proposition that CSP regulates G protein modulation of the Ca2+ channels was
also tested in these synapses. As these synapses express presynaptic GABAB
receptors, which, when activated cause a characteristic slowing of Ca2+ channel
opening, a selective GABAB receptor agonist (50 µm Baclofen) was applied. Once
more, no differences between the CSP KO mutants and the wild-type controls were
observed (Fernandez-Chacon et al. 2004), implying that CSP is not directly involved
in Ca2+ channel function and thus not important for Ca2+-channel regulation.
2.2.2. Regulation of exocytosis
Based on overexpression studies, it has been suggested that CSP functions in
regulating exocytosis. It has been found that CSP interacts with syntaxin and
synaptotagmin in pulldown experiments (Nie et al. 1999; Evans and Morgan 2002;
but see Leveque et al. 1998; Matos et al. 2000 for alternative results). Moreover,
transmitter release is depressed in Drosophila CSP mutants despite higher than
normal Ca2+ levels indicating a role for CSP in determining the Ca2+ sensitivity of
secretory apparatus (Dawson-Scully et al. 2000). Furthermore, overexpression of
CSP in neuroendocrine cells altered exocytosis but had no effect on Ca2+ channel
activity (Brown et al. 1998; Chamberlain and Burgoyne 1998; Zhang et al. 1998;
Graham and Burgoyne 2000).
Fernandez-Chacon et al. 2004 tested this hypothesis on Calyx of Held synapses from
the CSP KO mice, examining the initial synaptic responses, finding no significant
19
differences between the mutant and the wild-type mice. In addition, no significant
differences were found for the synaptic responses during stimulus trains, and for the
quantal properties of transmitter release, implying that CSP is not directly involved in
the regulation of exocytosis. On the other hand, it has been shown that CSP plays
important role in the assembly of the SNARE complex, as the formation of this
complex is impaired in the CSP KO mice (Chandra et al. 2005).
CSP has been shown that regulates the uptake of -aminobutiric acid (GABA) into
the synaptic vesicles (Hsu et al. 2000). CSP associates with the enzyme that
synthesizes the GABA- glutamate decarboxylase (GAD) - and the vesicular GABA
transporter (vGAT), indirectly through its interactions with the Hsp70 (Hsu et al. 2000,
for review, see Evans et al. 2003). In these studies, it is suggested that CSP acts in
the tethering of GAD to the membrane of the synaptic vesicle (SV) by its interaction
with Hsc70, since Hsc70 directly binds GAD and the three are found in complex on
SV membranes. Together with other proteins that bind directly to vGAT, they could
form a large complex responsible for GABA filling of SV (Evans et al. 2003).
CSP has also been identified as a component of a chaperone complex containing
GDI, Hsp90 and Hsc70 (Sakisaka et al. 2002; reviewed in Evans et al. 2003). GDI
(-GDP dissociation inhibitor) is a specific effector of the vesicle cycling of the Rab3A
proteins. Rabs are a family of proteins involved in targeting and docking of vesicle
fusion in all membrane trafficking events in the cell (Zerial and McBride 2001). Rab3A
is a key member of this family, involved in the targeting of the SV to the presynaptic
terminal plasma membrane. When the vesicle is formed, Rab3A-GTP binds to the SV
membrane, and later, when the SV is fused to the plasma membrane, Rab3A
hydrolyzes the GTP to GDP, thus enabling the GDI to remove the Rab3A-GDP from
the membrane (Luan et al. 1999). After that, Rab3A undergoes new cycle of GDP-
20
GTP exchange and is recruited to a new vesicle. On the other hand, in another study
(Riedel et al. 2002) it is suggested that Rab3D is not responsible for vesicle docking,
but for maintenance of normally sized granules. Rab3D KO mice exhibited increase
of the zymogen granules’ size in the parotid and pancreatic acinar cells, but this
deletion did not show effects on the exocytosis (Riedel et al. 2002).
Being part of such a complex gives an important role to CSP in the membrane fusion
events, involving it in the association and dissociation of the Rabs to and from the SV
membrane.
2.2.3. Chaperone function
Based on the observation that CSP contains a DnaJ domain, another hypothesis
emerges. Namely, DnaJ domains are characteristic of co-chaperones of the Hsp40
family, and they functionally collaborate with the DnaK domains of Hsc70 proteins
(reviewed in Kelley 1998; Hartl and Hayer-Hartl 2002). In another study, it was shown
that CSP activates the ATPase activity of Hsc70 (Braun et al. 1996; Chamberlain and
Burgoyne 1997) and forms a trimeric complex with Hsc70 and a tetratricopeptide
repeat protein called small glutamine-rich tetratricopeptide repeat protein (SGT,
Tobaben et al. 2001). In this study, it was shown that this new member, discovered in
a yeast-two hybrid screening, could bind both the CSP and the Hsc70 and
simultaneously activate the ATPase activity of the Hsc70. So far, the complex CSP-
Hsc70-SGT is known to catalyze the ATP-dependent refolding of denatured
luciferase in vitro (Tobaben et al. 2001), which suggests that this could be another
chaperone- co-chaperone complex. Human SGT has been shown to take important
part in the cell division (Winnefeld et al. 2004), but whether this is achieved through
its interactions with Hsc70 and CSP is still unknown.

21
This role for CSP as a compensatory chaperone to renature nerve terminal proteins
that misfold during the continuous operation of the synaptic vesicle cycle is very
attractive one.
2.3. Analysis of CSP function in CSP deficient flies
To analyse the functions of CSP in-situ, many studies were done on Drosophila
mutants that lack CSP. In Drosophila, CSP is important for evoked neurotransmitter
release. Most flies that lack CSP die during development, but there is still a small
percentage that survives into adulthood. These survivors are characterized with a
temperature-sensitive paralytic phenotype (Umbach et al. 1994; Zinsmaier et al.
1994). Studies of the neuromuscular junction of larvae from surviving mutant flies
revealed that deletion of CSP severely depressed evoked neurotransmitter release at
the permissive temperature and nearly abolished release at the non-permissive
temperature (Umbach et al. 1994; Zinsmaier et al. 1994). These temperature-
dependant effects on evoked synaptic transmission support the chaperone
hypothesis of CSP function.
2.4. Analysis of CSP function in CSP KO mice
Recently, mice with genomic deletion of CSP were generated (Fernandez-Chacon
et al. 2004), enabling in vivo characterization the roles of the CSP. These mice are
viable at birth, but show progressive and rapid neurodegeneration and die at
relatively young age. In the first two postnatal weeks, survival and body weight of the
KO mice are not different from the WT or heterozygous littermate controls. But at two
to three weeks of age the mutants show signs of progressive weakness. They stop

22
gaining weight at the age of P15 and later enter into lethargic state and start to die in
the third postnatal week, with most of them dying in the second postnatal month.
None of the KO mice survived more than 3 months. These mice are also
characterized by progressive sensorimotor impairment, expressed in their muscle
weakness (Fernandez-Chacon et al. 2004), and their progressive blindness (Schmitz
et al. 2006).
As the CSP KO mice are characterized by progressive neuromuscular dysfunction,
they have been subject to different neurological examinations. What was obvious
from these examinations is that the CSP KO mice exhibit impaired sensorimotor
performance and neuromuscular function. Namely, already at P15, they showed loss
of spontaneous activity; muscle weakness manifested by lack of gripping strength;
typical posture with the position of the legs like “inverted champagne bottles”; inability
to stay on a turning rode; difficulties in getting up when placed on side (Fernandez-
Chacon et al. 2004). All of these data suggest that the NMJ might be dysfunctional.
When examining the function of the NMJ by electromyographic responses, it has
been found that in the CSP KO mice, stimulus trains elicit enhanced synaptic
depression, observed already at P15, which becomes more severe at P23 and 47.
The mean amplitude of the compound muscle action potentials at P15 showed no
difference in the mutant mice compared to their littermate controls, but at P43
deteriorated. All of these data give strong suggestion that the CSP KO mice have
impaired function of the NMJ that becomes more severe with progressing age, and
raise the question about the morphological changes in the NMJ. And, in deed, the
NMJ showed changes in the morphology which become more apparent with the age.
Namely, as observed with fluorescence and electron microscopy, the pre- and
postsynaptic terminal of the NMJ developed normally initially, but with progressive

23
age and increasing demands on the synapse, the presynaptic terminal degenerated.
The signs of degeneration (vacuoles, multilamellar bodies and Schwann cell
protrusions) were evident at all ages examined, but occurring much more often at
later stages than in young mice (at P7). It is worth noting that not all of the NMJs in
the CSP KO mice were affected by the degeneration.
In another study involving these mice, (Schmitz et al. 2006) have found similar type
of age-dependent degeneration in the photoreceptors of the retina. In the initial 2
weeks of postnatal life, the retina of the CSP KO mice shows no or little differences
compared to the wild-type controls, as monitored by electroretinography, electron and
fluorescence microscopy. Differences start to occur immediately after eye opening
(after P14) and tend to become sharper with age. At P14, ERG responses show
some differences in the mutant mice as compared to their wild-type controls, and
these differences become more apparent at later stages of development, with
complete abolishment of vision after 4 weeks of age.
In addition, immediately after eye opening, at P15, no dramatic changes have been
observed concerning the distribution of synaptic proteins and the ultrastructural
morphology of the ribbon synapses. These changes became obvious only in later
stages of the development, namely at P28 and later, consisting of mislocalization of
some synaptic proteins (ribeye, synaptophysin, synaptotagmin) and reduced
abundance of these. The strong changes were also visible at the ultrastructural level,
showing signs of severe degeneration (Schmitz et al. 2006).
It is worth noting that no changes were observed in the inner hair cells, which is due
to the expression of another CSP isoform, CSPß, in these cells. This isoform on the
other hand is not expressed in the retina, and in the inner hair cells is compensating
the effects of the CSP deletion (Schmitz et al. 2006).

24
In another study involving the CSP KO mice (Chandra et al. 2005), it has been
suggested that CSP is important for the assembly of the SNARE complexes. There it
has been shown that CSP KO mice have decreased ability for assembly of SNARE
complexes.
All of these data, namely, the progressive sensorimotor impairment as obtained from
the neurological examinations, the enhanced depression of stimulus response at the
NMJ and its progressive morphological degeneration (Fernandez-Chacon et al.
2004), the progressive loss of vision and blindness (Schmitz et al. 2006), decreased
formation of SNARE complexes (Chandra et al. 2005), combined with the previous
studies (Braun et al. 1996 ; Chamberlain and Burgoyne 1997; Tobaben et al. 2001),
strongly support the idea that CSP acts as a compensatory chaperone in the
presynaptic terminal at the synapse.
The Hsp70/CSP complex binds to short stretches of exposed, hydrophobic amino-
acid residues, which are exposed on partially or completely unfolded proteins and/or
protein intermediates. With this, they ensure the proper folding of newly synthesized
proteins, as well as the refolding of denatured or partially denatured ones. This
function of the Hsp70 chaperones makes them very important part of the cellular
rescue machinery.
Chaperone activity is very important at the presynaptic terminal in particular, where a
continuous process of exo- and endocytosis takes place. Depending on the location
of the terminal in the nervous system, tens to hundreds synaptic vesicles are being
exocytosed at regular or irregular intervals, utilising many different proteins
responsible for the transport, priming, docking and other processes involved in the
exocytosis. This regulated secretion implies conformational rearrangement for
assembly or disassembly of these proteins and the complexes they form, thus
25
requiring chaperone activity to proceed. By helping these proteins to change the
conformation, or refolding the damaged ones, chaperones allow the terminal to stay
efficient for prolonged period and properly respond to stimuli. This statement is most
probably also valid for other cell types where regulated exocytosis takes place, like
the endocrine and exocrine glands.
2.5. Exocrine secretory glands in the gastrointestinal tract
2.5.1. General aspects of food digestion
Upon feeding, food is taken into the mouth cavity, where it is mechanically
processed. The secretion from the salivary glands (parotid, submandibular,
sublingual and other small salivary glands), containing amylase, softens the food and
initiates the chemical processing of the food, mainly the complex sugars. After
passing through the oesophagus and the stomach, the processed food enters the
small intestine, where the final steps of the enzymatic degradation take place. The
exocrine pancreas, the biggest gland of the digestive system, is the most important
gland for the alimentary digestion. It secretes its many enzymes into the duodenum
(initial part of the small intestine). Pancreatic enzymes are then activated and
degrade the food. If at any point the exocrine pancreas is obstructed in delivering its
enzymes to the duodenum, the food cannot be fully utilized, which at the end causes
inability to gain weight.

26
2.5.2. Histology and physiology of major exocrine glands in the digestive tract
2.5.2.1. Pancreas
The exocrine pancreas is a secretory gland of epithelial origin with cells organized in
acini. The acinar cells are polarized cells with clearly distinguishable larger baso-
lateral pole, and a smaller apical pole. In an acinus, all of the cells are oriented with
the apical pole towards the lumen of the acinus (Figure 2).
Figure 2: Schematic representation of pancreatic exocrine acinus (applicable also for parotid
and submandibular glands)
In this simplified diagram a pancreatic acinus is presented, consisting of many acinar cells with
different sizes. Their basal pole is oriented outwards (light blue arrowheads) and the apical pole (grey
arrows) is oriented towards the lumen of the acinus. Secretory products (zymogens) are synthesized
in the rough endoplasmic reticulum (RER, green colour) and transferred to the Golgi network (G, blue
colour). There the zymogens are packed in the zymogen granules (black circles) and destined for
exocytosis into the lumen of the acinus (Palade 1975; Cook et al. 1996).
The secretory products of the acinar cells are packed in the zymogen granules and
upon stimulation, the zymogens are secreted into the lumen of the acinus. The actual
membrane fusion of zymogen granules with the apical plasma membrane is believed

27
to be mediated by SNARE proteins in a manner similar to other membrane fusion
events (for review, see Gaisano 2000; Williams 2006). Different members of the
SNARE family have been identified in the pancreatic acinar cells. (Braun et al. 1994;
Gaisano et al. 1996; Gaisano et al. 1997; Hansen et al. 1999; Wang et al. 2004; for
review, see Gaisano 2000; Williams 2006). Different combinations of these SNAREs
are responsible for different events of membrane fusion- apical exocytosis, granule-
granule fusion, baso-lateral exocytosis and lysosome-granule fusion (reviewed in
Gaisano 2000; Williams 2001; Williams 2006; Cosen-Binker and Gaisano 2007),
enabling specificity of the fusion process.
2.5.2.2. Parotid gland
The parotid gland is a salivary gland, originating from the epithelia. Similar to the
exocrine pancreas, it is exclusively serous gland with its cells organized in acini (Fig
2). The cells are secreting several hydrolytical enzymes which are responsible for
the initial digestion of the food in the mouth cavity. Similar to the pancreas, the
enzymes precursors are densely packed in zymogen granules and released into the
lumen of the acinus upon stimulation (Stevens and Lowe 1992). It is suggested that,
similar to other types of tissues, exocytosis in parotid acinar cells is mediated via the
SNARE proteins. There are several members of the SNARE proteins already
identified in the parotid cells (Imai et al. 2001; Imai et al. 2003; Wang et al. 2007).
2.5.2.3. Submandibular gland
The submandibular glands are typically mixed glands, containing both serous and
mucous cells, with serous cells predominating. Cells are organized in acini (Figure 2),
which sometimes contain both types of cells. The serous cells, similar to the exocrine
pancreas and parotid gland, contain zymogen granules (Stevens and Lowe 1992).

28
So far, there is not any literature reference identifying SNARE isoforms in the
submandibular glands.
2.6. Mast cells
Another cell type with secretory granules and regulated exocytosis is the mast cell.
The mast cells are part of the immune system, and one of the defense mechanisms
of the organism against foreign agents. Mast cells reside in support tissues,
especially beneath epithelia, around blood vessels and serous cavities. They are
characterized by the presence of secretory granules, containing histamine and other
biologically active substances (Stevens and Lowe 1992). Upon stimulation, these
vesicles are exocytosed (process often called “degranulation”) in the proximity of the
target. It is well established that exocytosis in the mast cells is mediated via different
members of the SNARE family of proteins (for review, see Blank et al. 2002; Logan et
al. 2003; Pickett and Edwardson 2006).
2.7. Aim of the present study: CSP protein and the pancreas
It has been reported that CSP is present on the zymogen granules of the pancreatic
acinar cells (Braun and Scheller 1995). In addition, CSP KO mice are characterized,
among else, with their inability to gain weight after P15.
The exocrine pancreas is very important gland for the digestion of the nutrients. The
pancreatic acinar cells deliver their enzymes to the acinar lumen packed in zymogen
granules via exocytosis, process mediated by members of the SNARE family
proteins. Disturbance of exocytosis of secretory granules of digestive glands could

29
theoretically explain the postnatal developmental defect in weight gain of the CSP
KO mice.
This study aims at identifying ultrastructural changes in the pancreatic acinar cells,
that could help understand the function of CSP in the body and that could explain
the inability to gain weight in the CSP knockout mice.
In addition, exocrine glands of epithelial origin (parotid and submandibular) having
zymogen granules are also examined, as well as peritoneal mast cells.
30
3. Materials and Methods
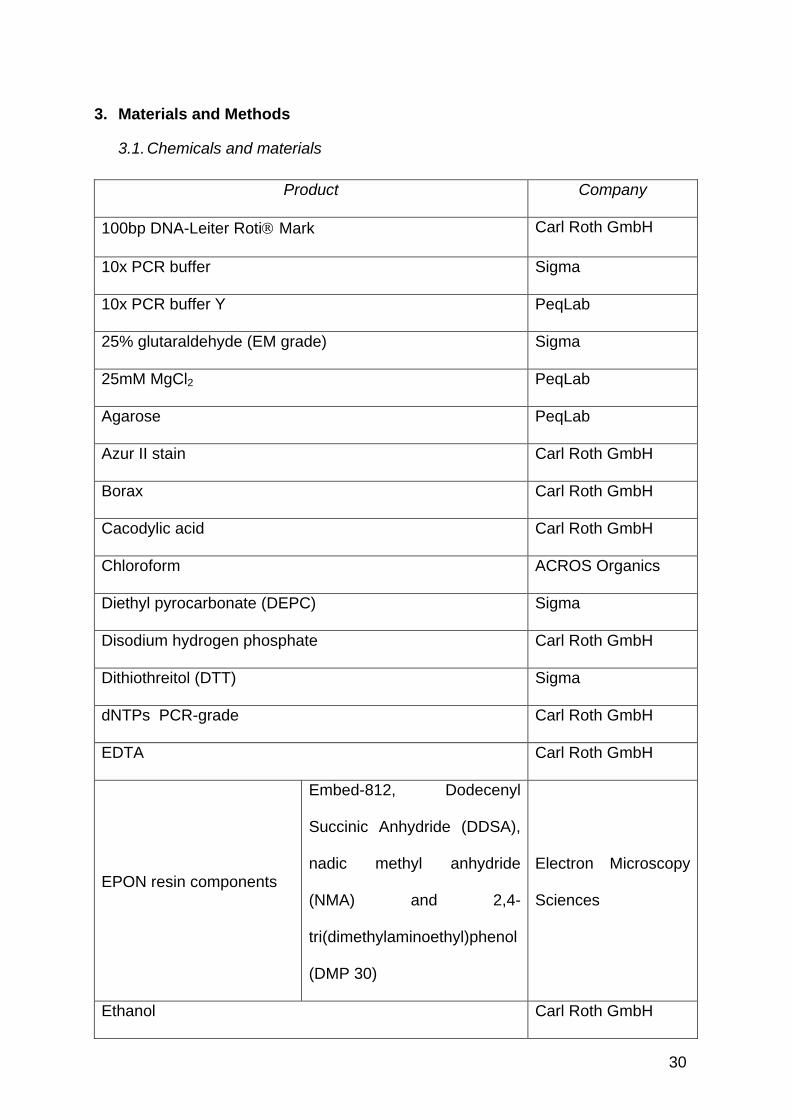
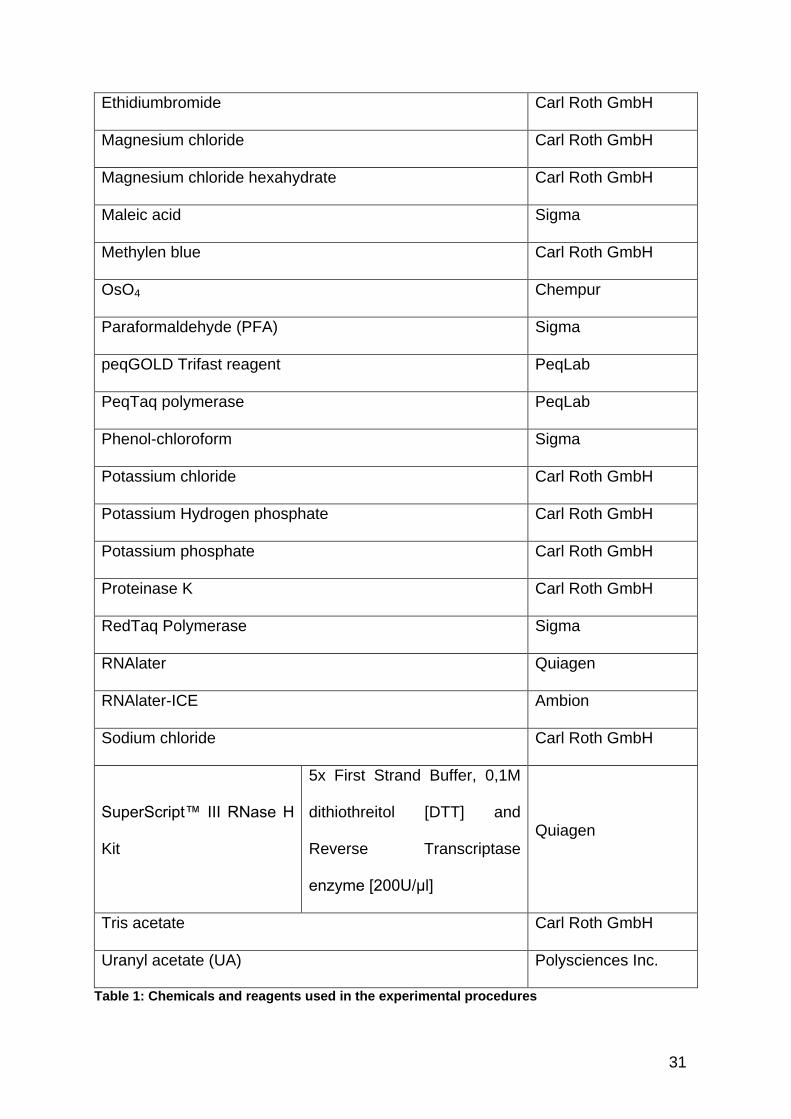
3.1. Chemicals and materials
Product Company
100bp DNA-Leiter Roti Mark Carl Roth GmbH
10x PCR buffer Sigma
10x PCR buffer Y PeqLab
25% glutaraldehyde (EM grade) Sigma
25mM MgCl2 PeqLab
Agarose PeqLab
Azur II stain Carl Roth GmbH
Borax Carl Roth GmbH
Cacodylic acid Carl Roth GmbH
Chloroform ACROS Organics
Diethyl pyrocarbonate (DEPC) Sigma
Disodium hydrogen phosphate Carl Roth GmbH
Dithiothreitol (DTT) Sigma
dNTPs PCR-grade Carl Roth GmbH
EDTA Carl Roth GmbH
EPON resin components
Embed-812, Dodecenyl
Succinic Anhydride (DDSA),
nadic methyl anhydride
(NMA) and 2,4-
tri(dimethylaminoethyl)phenol
(DMP 30)
Electron Microscopy
Sciences
Ethanol Carl Roth GmbH
31
Ethidiumbromide Carl Roth GmbH
Magnesium chloride Carl Roth GmbH
Magnesium chloride hexahydrate Carl Roth GmbH
Maleic acid Sigma
Methylen blue Carl Roth GmbH
OsO4 Chempur
Paraformaldehyde (PFA) Sigma
peqGOLD Trifast reagent PeqLab
PeqTaq polymerase PeqLab
Phenol-chloroform Sigma
Potassium chloride Carl Roth GmbH
Potassium Hydrogen phosphate Carl Roth GmbH
Potassium phosphate Carl Roth GmbH
Proteinase K Carl Roth GmbH
RedTaq Polymerase Sigma
RNAlater Quiagen
RNAlater-ICE Ambion
Sodium chloride Carl Roth GmbH
SuperScript™ III RNase H
Kit
5x First Strand Buffer, 0,1M
dithiothreitol [DTT] and
Reverse Transcriptase
enzyme [200U/μl]
Quiagen
Tris acetate Carl Roth GmbH
Uranyl acetate (UA) Polysciences Inc.
Table 1: Chemicals and reagents used in the experimental procedures
32
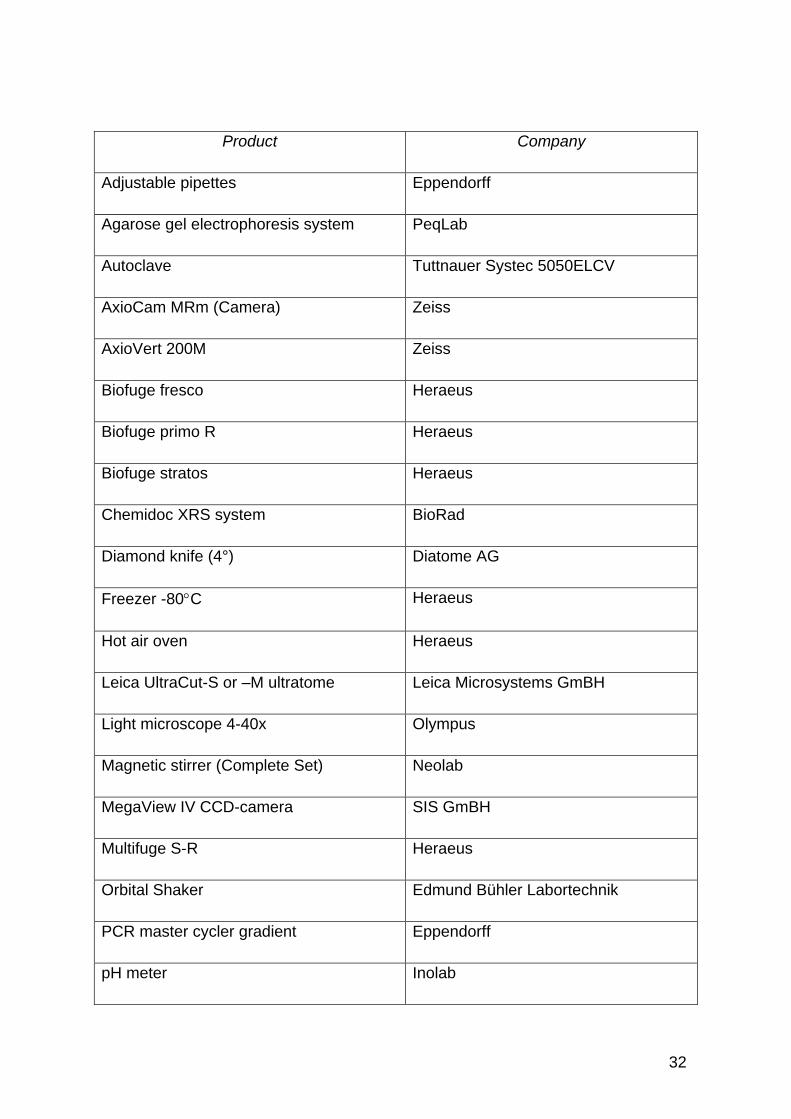
Product Company
Adjustable pipettes Eppendorff
Agarose gel electrophoresis system PeqLab
Autoclave Tuttnauer Systec 5050ELCV
AxioCam MRm (Camera) Zeiss
AxioVert 200M Zeiss
Biofuge fresco Heraeus
Biofuge primo R Heraeus
Biofuge stratos Heraeus
Chemidoc XRS system BioRad
Diamond knife (4°) Diatome AG
Freezer -80C Heraeus
Hot air oven Heraeus
Leica UltraCut-S or –M ultratome Leica Microsystems GmBH
Light microscope 4-40x Olympus
Magnetic stirrer (Complete Set) Neolab
MegaView IV CCD-camera SIS GmBH
Multifuge S-R Heraeus
Orbital Shaker Edmund Bühler Labortechnik
PCR master cycler gradient Eppendorff
pH meter Inolab

33
Rugged rotator Neolab
Sterile filtration device Millipore
Tecnai Bio-Twin 12 electron microscope FEI
Thermo mixer compact Eppendorff
Vortex VWR International
Weighing balance CP64 Sartorius
Table 2: Laboratory hardware equipment
Software Company
Adobe Photoshop Adobe Inc.
analySIS SIS GmBH
AxioVision v. 4.x Zeiss
ImageJ National Institute of Health (NIH)
Microsoft Excel 2003 Professional Microsoft
Quantity One package BioRad Laboratories GmBH
Table 3: Software packages used in the processing of the digital data
3.2. Experimental animals
For studying the ultrastructural changes in the secretory glands of the digestive tract
in CSP KO mice, animals at postnatal day 17 (P17) were used. The mutant animals
were previously generated (Fernandez-Chacon et al. 2004) and the animal line was
kept by mating CSP heterozygous parents. The animals were kept at the
Department of Experimental Surgery at the Saarland University in constant light/dark
12h cycles. At P15-17 the entire respective litter was taken to the Institute of
34
Anatomy and Cell Biology, Department of Neuroanatomy where the dissection took
place. The animals were dissected in the afternoon hours around 14:00h. The
animals’ tails were collected in separate microcentrifuge tubes, properly labelled, and
used for DNA isolation and genotyping. The age of the animals was chosen at P15-
17 because at this age the changes in the CSPα mice are initiating (see chapter 2.4).
3.3. Electron microscopy
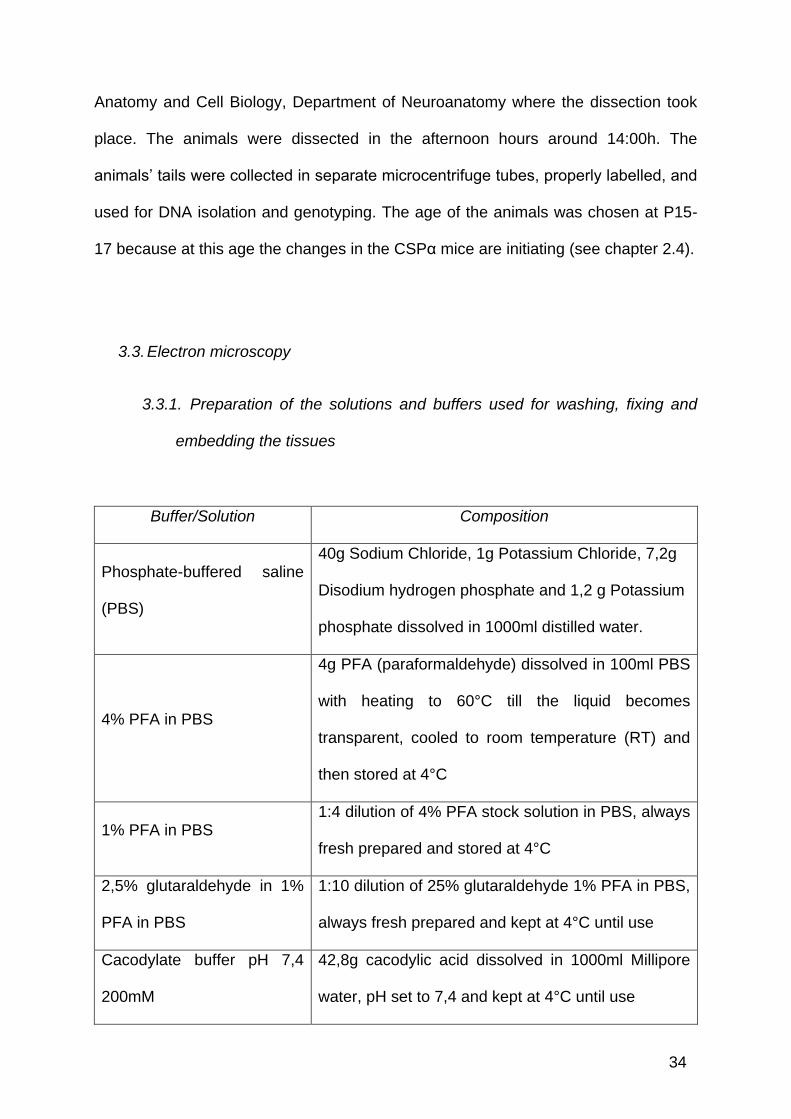
3.3.1. Preparation of the solutions and buffers used for washing, fixing and
embedding the tissues
Buffer/Solution Composition
Phosphate-buffered saline
(PBS)
40g Sodium Chloride, 1g Potassium Chloride, 7,2g
Disodium hydrogen phosphate and 1,2 g Potassium
phosphate dissolved in 1000ml distilled water.
4% PFA in PBS
4g PFA (paraformaldehyde) dissolved in 100ml PBS
with heating to 60°C till the liquid becomes
transparent, cooled to room temperature (RT) and
then stored at 4°C
1% PFA in PBS 1:4 dilution of 4% PFA stock solution in PBS, always
fresh prepared and stored at 4°C
2,5% glutaraldehyde in 1%
PFA in PBS
1:10 dilution of 25% glutaraldehyde 1% PFA in PBS,
always fresh prepared and kept at 4°C until use
Cacodylate buffer pH 7,4
200mM
42,8g cacodylic acid dissolved in 1000ml Millipore
water, pH set to 7,4 and kept at 4°C until use

35
Cacodylate buffer pH 7,4
100mM
21,4g cacodylic acid dissolved in 1000ml Millipore
water, pH set to 7,4 and kept at 4°C until use
0,05M maleate buffer pH 5,0 5,53g maleic acid dissolved in 1000ml Aqua dest,
pH set to 5,0 and kept at 4°C until use
4% OsO4
1g OsO4 dissolved in 25ml Millipore water in dark
bottle in cold room with constant shaking for ~3
days. The solution aliquoted in 1ml aliquots and
stored at -20°C until use.
2% OsO4 1:1 dilution of 4% OsO4 with 200mM cacodylate
buffer pH 7,4 prior to use.
2% uranyl acetate (UA) for
block-contrasting
2g UA dissolved in 100ml 0,05mol maleate buffer
pH 5,0 in a light-protected beaker. Prior to use,
solution filtered through 0,2µm filter.
2% uranyl acetate (UA) for
section-contrasting
2g of uranyl acetate dissolved in 100ml Millipore
water in a light-protected beaker, filtered through
0,2µm filter and stored at 4°C until further use
EPON-mixture
26g EPON-812, 11g DDSA, 16g NMA and 0,4g
DMP30 weighed in a 50ml falcon tube, shaken
vigorously till the mixture gets orange-reddish,
always fresh prepared or used within 2 days when
stored at room temperature.
Table 4: Solutions and buffers (and their composition) used for washing, fixing and embedding
the tissues
Safety note: the OsO4 waste always collected in separate plastic or glass
containers, gathered in special plastic container and removed from the lab by
authorized personnel.

36
Safety note: the uranyl acetate waste always collected in separate plastic or glass
containers, gathered in dark glass bottle and removed from the lab by authorized
personnel.
Safety note: EPON-mixture waste was collected in separate plastic containers,
polymerized at 60°C for at least 24 hours and then discarded.
3.3.2. Preparation of Richardson Blue stain
Solution A: 0,5g Azur II stain were dissolved in 50ml Aqua dest.
Solution B: 0,5g methylen blue and 0,5g borax were dissolved in 50ml Aqua dest.
Richardson Blue stain was prepared by mixing the two solutions in equal parts,
mixing them on the shaker for ~1h and then filtering it trough filter paper to remove
undissolved particles or precipitates. The stain solution was then kept at RT.
3.3.3. Organs harvesting, fixing and embedding for electron microscopy
3.3.3.1. Organs harvesting and protein fixing
A. Dissection of pancreas, gut, adrenal glands, salivary glands, cerebellum and
pituitary gland
The animals were anesthetized with diethyl ether and kept under constant
anaesthesia during the procedure. After opening the thorax, big venous vessel (V.
cava sup. or inf.) was cut open and the animals were perfused trough the left
ventricle first with ~4ml of PBS, followed by ~4ml of 2,5% glutaraldehyde in 1% PFA
in PBS, applied manually with moderate pressure using 2,5ml syringe with 27G
(gauge) needle. The organs of interest (pancreas, gut (jejunum), adrenal glands,
parotid gland, submandibular gland, cerebellum, pituitary gland) were harvested and
37
immediately transferred to scintillation vials containing ~3ml of fixative (2,5%
glutaraldehyde in 1% PFA in PBS). The organs were fixed overnight, at 4°C.
2,5% glutaraldehyde in 1% PFA in PBS fixes the proteins. The rest of the tissues
processing is described in the section 3.3.3.2.
B. Collecting mast cells by peritoneal lavage
The mast cells were collected as described in (Ribeiro et al. 2000), with some
modifications. Namely, the animals were anaesthetized with diethyl-ether and kept
under mild anaesthesia. The abdominal skin was gently removed, avoiding any
damage to the abdominal muscles and peritoneum. About 3ml of cold PBS were
injected with 27G needle into the abdominal cavity and the abdomen was gently
massaged for 1-2 min. With another needle the liquid was absorbed, transferred to
microcentrifuge tube and the cells were pelleted for 5min, 5000rpm, RT. After that
they were fixed with 2,5% glutaraldehyde in 1% PFA in PBS overnight, at 4°C, and
then processed as in 3.3.3.2. From time to time during the processing, the cells were
pelleted down at 5000rpm, 1-2min, at 4°C.
3.3.3.2. Embedding for electron microscopy
The procedure for conventional electron microscopy consists of several consecutive
steps:
A. Fixing of the proteins: it is the initial step of fixing, described in 3.3.3.1.
B. Fixing of the lipids:
Washing in PBS, 3x 10min, 4°C.
Washing in 100mM cacodylate buffer pH 7,5, 3x 10min, 4°C.

38
Fixing with 2% OsO4 in 100mM cacodylate buffer pH 7,5, 1h, 4°C.
Washing in 100mM cacodylate buffer pH 7,5, 3x10 min, 4°C.
Washing in Aqua dest, 3x 10min, 4°C.
C. Contrasting of the proteins
Washing in 0,05M maleate buffer pH 4,5, 3x 15min, 4°C.
Block-contrasting of the proteins with 2% uranyl acetate in 0,05M maleate
buffer pH 4,5, 3 h, 4°C.
Washing in 0,05M maleate buffer pH 4,5 3x 15min, 4°C.
Washing in Aqua dest. 3x 10min, 4°C.
D. Dehydration of the specimen
Initial partial dehydration in increasing ethyl-alcohol concentrations (30%, 50%
and 70%), 30min. each, at 4°C.
Another partial dehydration in increasing ethyl-alcohol concentrations (80%,
90% and 2x 99%), 30 min. each, at room temperature.
Final dehydration in propylenoxyde for 30min. at room temperature, under
fume hood.
E. Infiltration of the samples with Epoxy resin
Initial infiltration with Epon: propylenoxyde mixture (volume ratio 1:3, total
volume per vial 6-7ml), overnight, under the fume hood, RT and opened vials.
Overnight infiltration ensures evaporation of the propylenoxyde and good infiltration
of the specimen with the resin.

39
Infiltrating with pure Epon (~3ml per vial), 5h to overnight, at room
temperature. In the meantime, samples were kept under vacuum for 1h to ensure
complete removal of air.
Second infiltration with pure Epon (~3ml per vial), 3-5h at room temperature.
Transferring the samples into labelled block moulds and application of final
Epon mixture (~0,5ml per specimen).
Polymerization of the resin at 60°C for at least 36h.
3.3.4. Trimming and cutting
After the polymerization, the blocks’ front surface was trimmed to a trapezoid form
with up to 3mm width and up to 5mm height and was polished with self-made glass
knives. For histological identification, semi-thin (500nm thick) sections were cut,
heat-fixed to glass slides at 80°C, dyed with Richardson-Blue and observed with
Olympus light microscope, 4-40x objective magnification. The ultra-thin sections (60-
70nm thick, silver to silver-gray colour on the refraction chart) were cut with diamond
knife (4° angle) with water-bath (Table 2), stretched with chloroform vapors, collected
on copper or nickel mesh grids and stored in grid storage boxes until further use.
The cutting of the semi and ultra-thin sections was performed on Leica UltraCut-S or
–M ultratome (Table 2).
3.3.5. Section-contrasting
The collected ultra-thin sections were section-contrasted by immersing the copper or
nickel mesh grids into 70µl drop of 2% uranyl acetate in Millipore water for 25 min.
RT, in dark. Then they were washed 5-6x 5min. in Millipore water, air-dried and
stored in the grid-storage boxes.

40
3.3.6. Analysis by transmission electron microscopy
The section-contrasted ultra-thin sections were observed under Tecnai Bio-Twin 12
electron microscope (Table 2) at 100 kV accelerating voltage and 3-8µA emission
current. The images were taken by MegaView IV CCD-camera, which was controlled
by analySIS software package (Table 3). The contrast of the images was corrected
using Adobe Photoshop or ImageJ (Table 3).
3.3.7. Morphometric and statistical analysis of data
Morphometric analysis was performed with analySIS software package. The results
were collected and imported in Microsoft Excel sheets (Table 3), where the statistical
analysis was performed, using unpaired Student’s T-test. The value of p<0,05 was
taken as significant.
3.4. RNA extraction and purification
3.4.1. Parotid gland
The parotid gland was dissected immediately after the death of the animal. It was
immediately homogenized in 300µl of peqGOLD Trifast reagent with teflon
homogenizer and the homogenate was transferred to a clean sterile 1,5ml
microcentrifuge tube in which the Trifast reagent was filled up to 1ml. 200µl of
chloroform was added and the whole suspension was vortexed for 15 seconds. After
10 minutes incubation at room temperature, it was centrifuged at 13000rpm, 10
minutes, 4°C, which separated the fluid in three phases: the upper fluid clear phase
containing RNA, thick inter-phase containing proteins, and a fluid and more viscous
lower phase which contains DNA and proteins. About 400µl of the upper phase was
carefully transferred to new microcentrifuge tube and 1 ml of isopropranol was added.

41
After 45 minutes incubation at -20°C, it was centrifuged at 13000rpm, 15 min. 4°C,
the supernatant was discarded and the pellet was washed in 500µl 75% ethanol with
brief vortexing. Then it was centrifuged again at 13000rpm, 10 minutes, 4°C, the
supernatant was discarded, the pellet was air-dried under hood for 20 minutes and
resuspended in 40µl of RNase-free DEPC-treated water. After incubation at 55°C for
5 minutes, the tube was transferred to ice for 2 minutes and the optical density (OD)
at 260 and 280 nm, the concentration in µg/ml and the OD260/280 was measured.
Finally, the tube with the RNA was stored at -80°C until further experiments.
3.4.2. Mast cells
The BMMC were kind gift from Prof. Marc Freichel from the Department of
Pharmacology and Toxicology, University of Saarland, Homburg (Vennekens et al.
2007). The cell pellet provided contained 10x 1010 cells, which were resuspended in
4ml of the peqGOLD Trifast reagent, divided into four equal parts and processed
under the same protocol as for the parotid gland (3.4.1).
3.4.3. Pancreas
For RNA isolation, pancreatic tissue was processed in several ways.
1. After dissecting the tissue from the sacrificed animal, it was homogenized
(the whole organ or just part of it) in 500µl of peqGOLD Trifast reagent;
2. Immediately incubated in 1ml of RNAlater stabilization reagent, stored at -
20°C until homogenization or homogenized immediately as previously described
(3.4.1);
3. Immediately incubated in pre-chilled at -80°C RNAlater-ICE and stored at
-20°C overnight;
42
4. Immediately pulverized in liquid N2 using ceramic mortar and pestle (pre-
chilled on ice) and then resuspending the pulver in 1 ml of the peqGOLD reagent.
For each of these methods of homogenizing and stabilizing the tissue, it was
processed under the same protocol as described for the parotid gland (3.4.1).
3.4.4. Testis
The testes were dissected from the male animals, homogenized and processed in
same way as the parotid gland (see 3.4.1).
3.5. Reverse transcriptase polymerase chain reaction (RT-PCR)
RT-PCR experiments were performed using the following protocol:
3.5.1. Reverse transcription
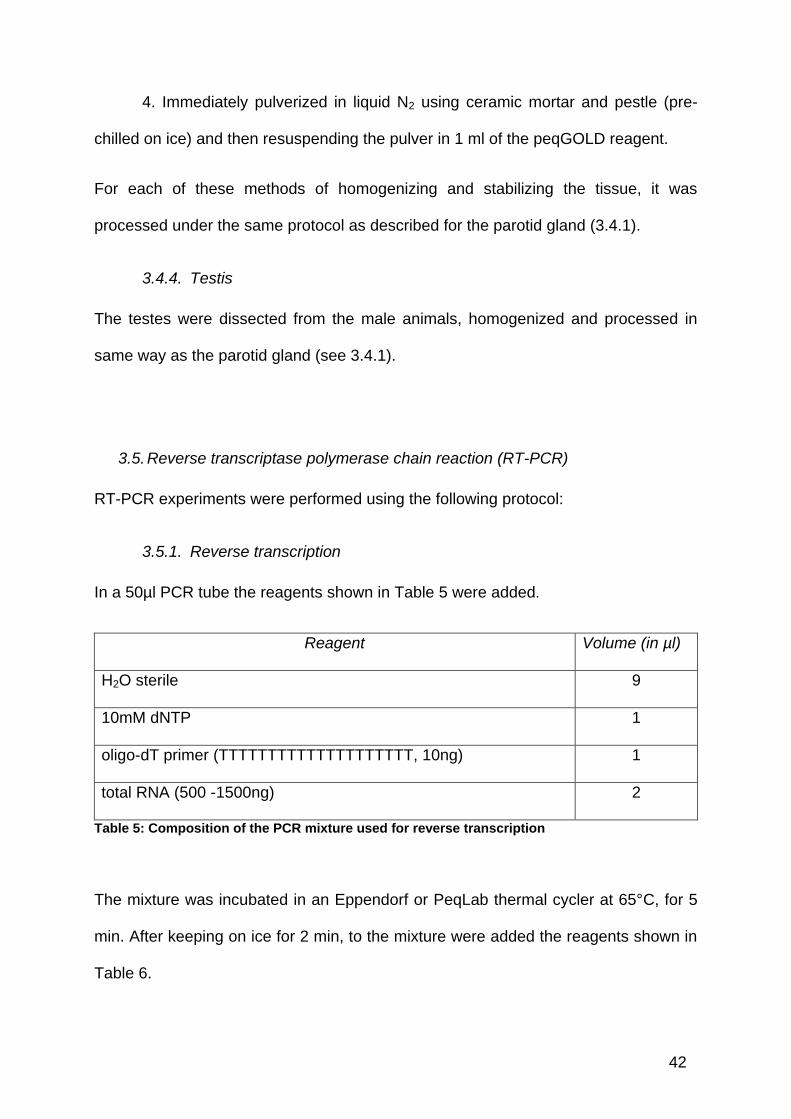
In a 50µl PCR tube the reagents shown in Table 5 were added.
Reagent Volume (in µl)
H2O sterile 9
10mM dNTP 1
oligo-dT primer (TTTTTTTTTTTTTTTTTTTT, 10ng) 1
total RNA (500 -1500ng) 2
Table 5: Composition of the PCR mixture used for reverse transcription
The mixture was incubated in an Eppendorf or PeqLab thermal cycler at 65°C, for 5
min. After keeping on ice for 2 min, to the mixture were added the reagents shown in
Table 6.
43
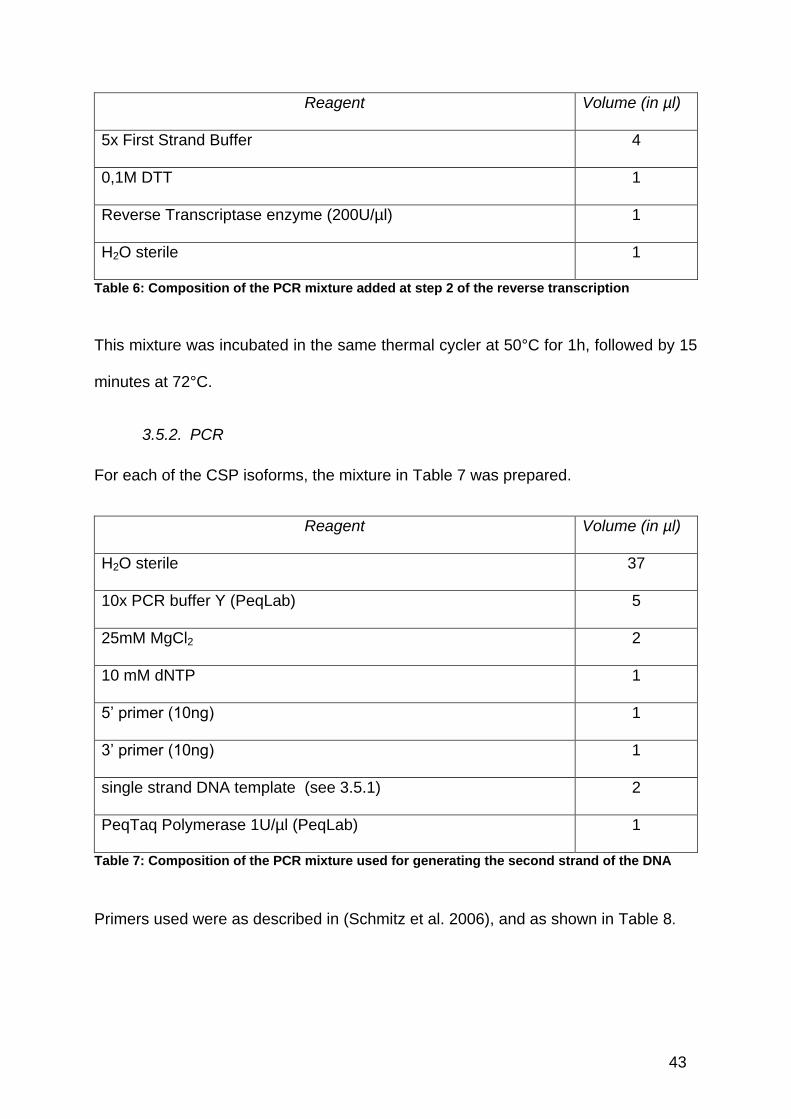
Reagent Volume (in µl)
5x First Strand Buffer 4
0,1M DTT 1
Reverse Transcriptase enzyme (200U/µl) 1
H2O sterile 1
Table 6: Composition of the PCR mixture added at step 2 of the reverse transcription
This mixture was incubated in the same thermal cycler at 50°C for 1h, followed by 15
minutes at 72°C.
3.5.2. PCR
For each of the CSP isoforms, the mixture in Table 7 was prepared.
Reagent Volume (in µl)
H2O sterile 37
10x PCR buffer Y (PeqLab) 5
25mM MgCl2 2
10 mM dNTP 1
5’ primer (10ng) 1
3’ primer (10ng) 1
single strand DNA template (see 3.5.1) 2
PeqTaq Polymerase 1U/µl (PeqLab) 1
Table 7: Composition of the PCR mixture used for generating the second strand of the DNA
Primers used were as described in (Schmitz et al. 2006), and as shown in Table 8.
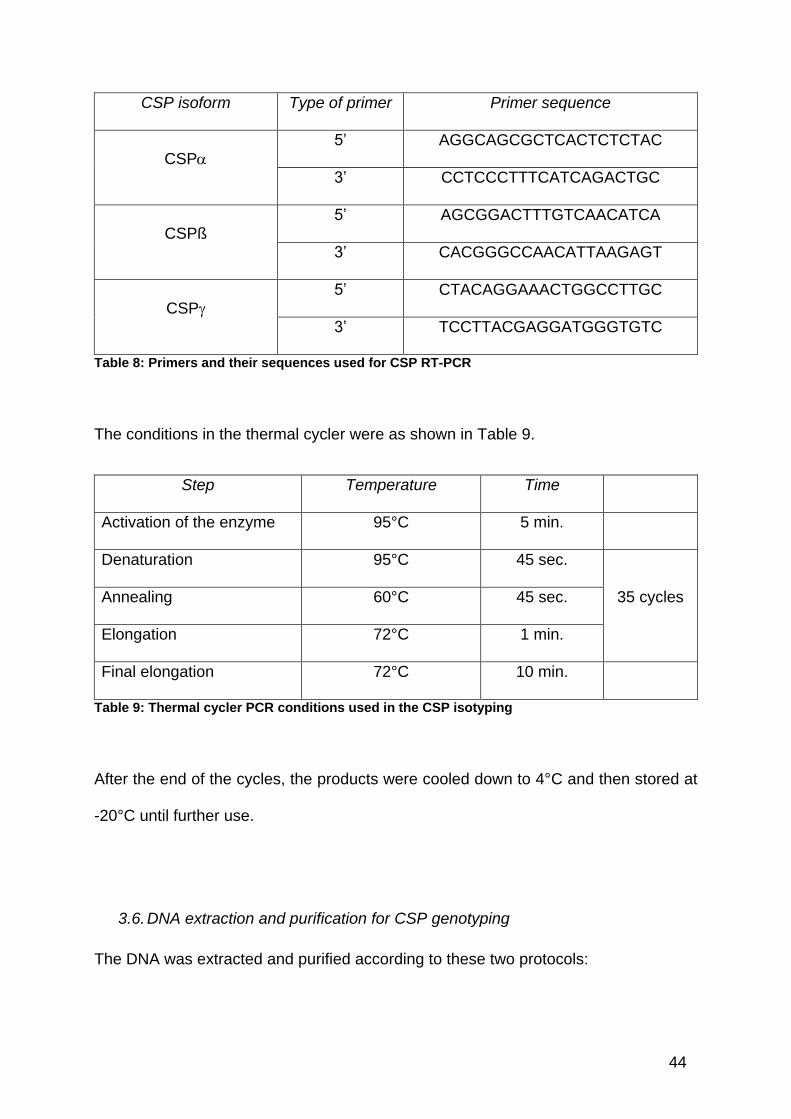
44
CSP isoform Type of primer Primer sequence
CSP
5’ AGGCAGCGCTCACTCTCTAC
3’ CCTCCCTTTCATCAGACTGC
CSPß 5’ AGCGGACTTTGTCAACATCA
3’ CACGGGCCAACATTAAGAGT
CSP
5’ CTACAGGAAACTGGCCTTGC
3’ TCCTTACGAGGATGGGTGTC
Table 8: Primers and their sequences used for CSP RT-PCR
The conditions in the thermal cycler were as shown in Table 9.
Step Temperature Time
Activation of the enzyme 95°C 5 min.
Denaturation 95°C 45 sec.
35 cycles Annealing 60°C 45 sec.
Elongation 72°C 1 min.
Final elongation 72°C 10 min.
Table 9: Thermal cycler PCR conditions used in the CSP isotyping
After the end of the cycles, the products were cooled down to 4°C and then stored at
-20°C until further use.
3.6. DNA extraction and purification for CSP genotyping
The DNA was extracted and purified according to these two protocols:
45
3.6.1. Phenol-chloroform extraction method
About 1-2mm of mouse tail probe was digested for 5h to overnight by incubating in
600µl SNET buffer (1% SDS, 400mM NaCl, 5mM Na2-EDTA, 20mM Tris-HCl pH 8,0)
and 2µl Proteinase K (20mg/ml) at 55°C, 800 rpm. After cooling to room temperature
for 10min. 600µl of phenol-chloroform (lower phase) was added and the Eppendorf
tubes were gently mixed. The centrifugation at 13000rpm, 10min, RT separated the
fluids in 3 phases- upper one containing the DNA, an interphase containing proteins,
and a lower fluid phase containing RNA. About 500µl of the upper phase was
transferred to a new tube, and 1ml of isopropranol was added, mixed gently and then
centrifuged again at 13000rpm, 10min, RT. Then the supernatant was discarded and
the remaining pellet was washed in 500µl 70% ethanol by centrifuging at 13000rpm
10 minutes, RT. After discarding the supernatant, the pellet was air-dried under hood
for 20-30 minutes, resuspended in 200-400µl 150mM Tris-HCl pH 8,5 and the
concentration of the DNA was measured at 260 nm.
3.6.2. Two-step method for DNA extraction
A small peace of mouse tail probe (~2 mm long) was incubated in 50µl alkaline lysis
reagent (25mM NaOH, 0,2mM EDTA) at 65°C, 1400rpm, for 30 min. followed by
15min. at 98°C, 1400rpm. After that it was transferred to ice and 50µl of neutralizing
reagent (40mM Tris-HCl pH 4,8) were added. This was centrifuged at 13000rpm for
1-2min. and 50µl of the supernatant was transferred to new microcentrifuge tube,
which was stored at -20°C till further use. This is a simple and fast method, but very
“dirty” way to get genomic DNA. This method does not include precipitation of DNA
with alcohol.

46
3.7. Genotyping for the wild type (WT) and knockout (KO) CSP allele
After measuring the concentration of the DNA at 260 nm, it was corrected to final
concentration of 20ng/µl. The following mixtures for the PCR reaction were prepared
either as master mixes for more samples or for single reaction (see Table 10 for WT
and Table 11 for KO PCR reaction).
Reagent Volume (in µl)
H2O sterile 14
10x PCR buffer 2,5
25mM MgCl2 4,5
10mM dNTP 0,5
5’ primer, 10ng (ACTGTTAAAGAGACTGTCATGAAAAAGG) 1
3’ primer, 10ng (GGGGGAGGGAATGTGGGTGAGTGTAGTTAG) 1
RedTaq Polymerase (1U/µl) 0,5
Table 10: Master Mix of reagents used for the WT PCR reaction
Reagent Volume (in µl)
H2O sterile 18
10x PCR buffer 2,5
25mM MgCl2 1,5
10mM dNTP 0,5
5’ primer, 10ng (TTGGCCCACCAGCTGGAGAGTAC) 0,5
3’ primer, 10ng (GAGCGCGCGCGGCGGAGTTGTTGAC) 0,5
RedTaq Polymerase (1U/µl) 0,5
Table 11: Master Mix of reagents used for the KO PCR reaction

47
The conditions in the thermal cycler were as shown in Table 12.
Step Temperature Time
Activation of the enzyme 95°C 5 min.
Denaturation 95°C 45 sec.
40 cycles Annealing 60°C 45 sec.
Elongation 72°C 1 min.
Final elongation 72°C 10 min.
Table 12: Thermal cycler conditions used for the CSP genotyping
After the end of the cycles, the products were cooled down to 4°C and then stored at
-20°C until further use. The expected size for the PCR product of the WT allele was
about 600bp, and for the KO allele about 900bp.
3.8. Agarose gel electrophoresis
All of the PCR and RT-PCR products were cast in 1 or 1,5% agarose gel pre-treated
with ethidium bromide, electrophoresed at 80-130mV in 1x TAE buffer and visualized
under UV exposure in Chemidoc XRS system (BioRad Laboratories GmBH,
Germany). The size of the respective DNA bands was compared against 100bp DNA
ladder standards. Images were acquired using Quantity One package (Table 3) and
stored in digital format.

48
4. Results
4.1. General remarks on EM quantifications
For standardization of EM quantifications, only pancreatic acinar cells
were considered for further analysis when the central lumen of the acinus was clearly
visible. Additionally, only cells which contained a clearly visible nucleus were included
for quantitative analysis. By this procedure, it is ensured that only cross-sections of
cells from the central parts of the exocrine acinar cell, but not peripheral sections with
untypical distribution of organelles were used for further analysis.
For each experiment al least 3 animals were analyzed.
For standardizing the distribution of the granules in the cell, the
following procedure was performed. First, the length of the cell was measured (line
AB, Figure 3). The line was drawn from the middle point of the apical plasma
membrane (point A, Figure 3), through the center of the nucleus (point C, Figure 3) to
a point at the plasma membrane of the basal cell pole (point B, Figure 3). The
granule closest to the basal pole was determined and a normal line from its center
was put perpendicular to the AB line. The point of intersection of the two lines is point
D. The relative length of the AD (line AB, Figure 3, expressed as percentage of the
entire apico-basal cell length) is a parameter for quantitative determination of the
granular distribution in the apico-basal direction.
These same criteria were applied when quantifying the distribution of the zymogen
granules in the parotid and submandibular glands, too.
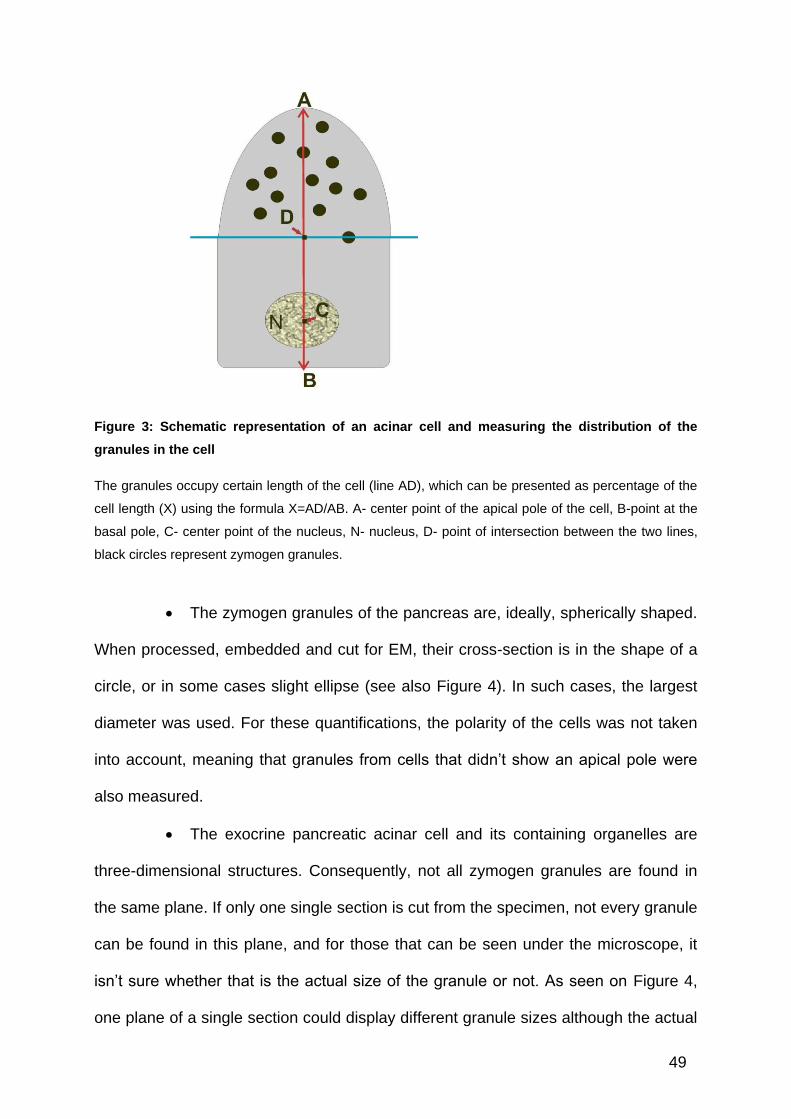
49
Figure 3: Schematic representation of an acinar cell and measuring the distribution of the
granules in the cell
The granules occupy certain length of the cell (line AD), which can be presented as percentage of the
cell length (X) using the formula X=AD/AB. A- center point of the apical pole of the cell, B-point at the
basal pole, C- center point of the nucleus, N- nucleus, D- point of intersection between the two lines,
black circles represent zymogen granules.
The zymogen granules of the pancreas are, ideally, spherically shaped.
When processed, embedded and cut for EM, their cross-section is in the shape of a
circle, or in some cases slight ellipse (see also Figure 4). In such cases, the largest
diameter was used. For these quantifications, the polarity of the cells was not taken
into account, meaning that granules from cells that didn’t show an apical pole were
also measured.
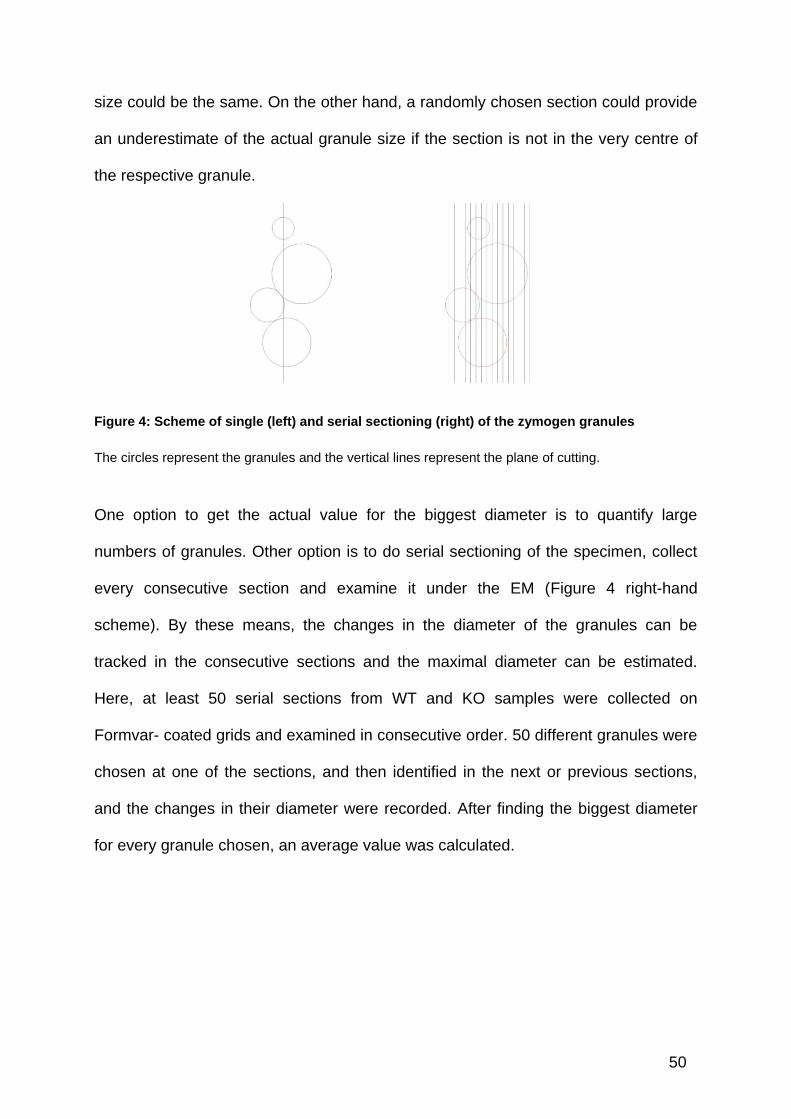
The exocrine pancreatic acinar cell and its containing organelles are
three-dimensional structures. Consequently, not all zymogen granules are found in
the same plane. If only one single section is cut from the specimen, not every granule
can be found in this plane, and for those that can be seen under the microscope, it
isn’t sure whether that is the actual size of the granule or not. As seen on Figure 4,
one plane of a single section could display different granule sizes although the actual
50
size could be the same. On the other hand, a randomly chosen section could provide
an underestimate of the actual granule size if the section is not in the very centre of
the respective granule.
Figure 4: Scheme of single (left) and serial sectioning (right) of the zymogen granules
The circles represent the granules and the vertical lines represent the plane of cutting.
One option to get the actual value for the biggest diameter is to quantify large
numbers of granules. Other option is to do serial sectioning of the specimen, collect
every consecutive section and examine it under the EM (Figure 4 right-hand
scheme). By these means, the changes in the diameter of the granules can be
tracked in the consecutive sections and the maximal diameter can be estimated.
Here, at least 50 serial sections from WT and KO samples were collected on
Formvar- coated grids and examined in consecutive order. 50 different granules were
chosen at one of the sections, and then identified in the next or previous sections,
and the changes in their diameter were recorded. After finding the biggest diameter
for every granule chosen, an average value was calculated.
51
4.2. Qualitative and quantitative transmission electron microscopy of exocrine
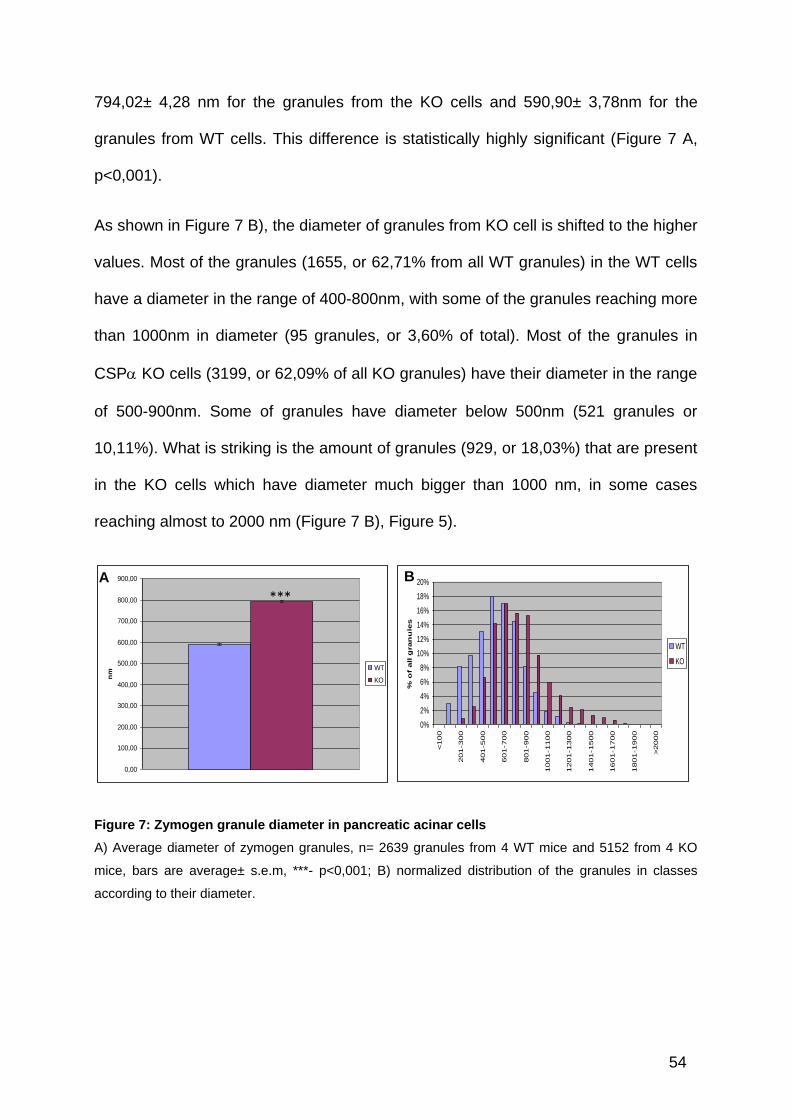
pancreatic acinar cells in CSP KO and WT control animals
The wild-type acinar exocrine cells of the pancreas displayed the well-known typical
ultrastructural morphology (Figure 5 A, C, and E). The usually pyramidal-shaped
acinar cells showed a polarized distribution of intracellular organelles: the basal pole
was filled with large amount of rough endoplasmic reticulum (RER), whereas the
zymogen granules were strongly concentrated in the apical portion of the cell. In
contrast to this, the acinar exocrine cells of the pancreas in the CSP KO mice
showed a strongly different morphology when compared to the acinar cells from WT
mice. Transmission electron microscopy analysis revealed that the pancreatic acinar
cells from KO animals have more secretory granules, which are bigger and
distributed widely in the cells (Figure 5 B, D and F). In the CSP KO mice, normal
looking cells were seen next to altered ones. In order to confirm the described
structural alterations in the exocrine pancreatic acinar cell, quantitative electron
microscopy analysis was performed and the results are explained in the following
chapters.

52
Figure 5: The phenotype of the exocrine pancreatic acinar cells in CSP wild-type and CSP
knockout animals.
Ultra-thin sections of exocrine pancreatic acinar cells of CSP wild-type (A, C, E) and CSP knockout
animals (B, D, F) were analyzed by transmission electron microscopy. Note the number and size of
the granules in the CSP KO pancreatic acinar cells in B), D) and F) as compared to the WT cells in
A), C) and E). The cells in B) contain many granules which reach to the basal pole of the acinar cells;
the cells in D) and F) have many granules with big diameter (red asterisks). N- nucleus, L- lumen,
arrows point to the baso-lateral pole of the cell.
N
N
N
N N
N N
N
N
N
N N
N
N
N
L
L
L L
L
L
L
L
A B
C D
E F
CSP+/+ CSP-/-

53
4.2.1. Number of zymogen granules per acinar cell
The average number of granules per cell section in the KO animals was 26.97± 1,08,
which is significantly higher than that of 21,46± 1,33 for the WT control mice (p<0,01)
(Figure 6 A). 45,74% of the cells from the KO animals have less than 20 zymogen
granules per cross-section and thus fall into the category of “normal” cells (Figure 6
B, first 2 KO bars). The rest of the cells have higher number of zymogen granules,
with some of them (22 cells, 9,87% of all cells from KO animals) having more than 50
granules. 63,39% of the 112 cells from the WT animals have less than 20 granules
per cross-section. Only 5 cells (4,46% from all WT pancreatic acinar cells) have more
than 50 zymogen granules per cross-section (Figure 6 B).
0,00
5,00
10,00
15,00
20,00
25,00
30,00
35,00
40,00
nu
mb
er
of
gra
nu
les
WT
KO
0,00%
5,00%
10,00%
15,00%
20,00%
25,00%
30,00%
35,00%
40,00%
45,00%
50,00%
0-10 11-20 21-30 31-40 41-50 51-60 61-70 71-80 81-90 >91
number of granules
% o
f all c
ells
WT
KO
Figure 6: Granules number in pancreatic acinar cell
A) Number of granules per cell, n= 156 cells from 4 WT and 228 cells from 4 CSP KO animals, **-
p<0,01; B) normalized distribution of the cells according to the amount of granules.
4.2.2. Zymogen granules diameter
Quantitative electron microscopy suggested a strong increase in the diameter of the
zymogen granules in pancreatic acinar cells from the CSP knockout animals. The
average diameter of the zymogen granules in KO cells is bigger that the average
diameter of the zymogen granules from the WT cells. The respective means are
A B
**
54
794,02± 4,28 nm for the granules from the KO cells and 590,90± 3,78nm for the
granules from WT cells. This difference is statistically highly significant (Figure 7 A,
p<0,001).
As shown in Figure 7 B), the diameter of granules from KO cell is shifted to the higher
values. Most of the granules (1655, or 62,71% from all WT granules) in the WT cells
have a diameter in the range of 400-800nm, with some of the granules reaching more
than 1000nm in diameter (95 granules, or 3,60% of total). Most of the granules in
CSP KO cells (3199, or 62,09% of all KO granules) have their diameter in the range
of 500-900nm. Some of granules have diameter below 500nm (521 granules or
10,11%). What is striking is the amount of granules (929, or 18,03%) that are present
in the KO cells which have diameter much bigger than 1000 nm, in some cases
reaching almost to 2000 nm (Figure 7 B), Figure 5).
0,00
100,00
200,00
300,00
400,00
500,00
600,00
700,00
800,00
900,00
nm
WT
KO
0%
2%
4%
6%
8%
10%
12%
14%
16%
18%
20%
<100
201-300
401-500
601-700
801-900
1001-1100
1201-1300
1401-1500
1601-1700
1801-1900
>2000
% o
f a
ll g
ran
ule
s
WT
KO
Figure 7: Zymogen granule diameter in pancreatic acinar cells
A) Average diameter of zymogen granules, n= 2639 granules from 4 WT mice and 5152 from 4 KO
mice, bars are average± s.e.m, ***- p<0,001; B) normalized distribution of the granules in classes
according to their diameter.
A B
***

55
4.2.3. Serial sections, average maximum diameter and average volume of the
zymogen granules
At least 50 serial sections from WT and KO samples were collected on Formvar-
coated grids and examined in consecutive order to determine average maximum
diameter and average volume as described above (chapter 4.1). 50 different
granules were chosen at one of the sections, and then identified in the next or
previous sections, and the changes in diameter were recorded. After finding the
largest diameter for every analyzed granule, an average value was calculated (Figure
8 A). Once again, the diameter of granules in CSP KO animals is bigger than in WT
control animals. The average maximal diameter as measured by serial sectioning
shows bigger values (for both WT and KO animals) than the average diameter
previously measured (Figure 7). This larger value is expected because with the
second method only the maximal diameter of granules was taken into account. In the
previous quantifications shown in Figure 7 A), the diameter was measured in only
one randomly picked plane in which the respective granule must not necessarily have
its maximal diameter. With serial sectioning, the maximal diameter was always
measured.
Using the value of the average maximal diameter, the average volume of the
granules was calculated, according to the formula for the volume of a sphere:
V=4/3r3. The average volume of granules from CSP KO mice is 1,36μm3± 0,08,
which is significantly bigger than that of 0,51μm3±0,02 for the WT animals (p<0,001).

56
0,00
200,00
400,00
600,00
800,00
1000,00
1200,00
1400,00
1600,00
1 2
nm
WT
KO
0,00
0,20
0,40
0,60
0,80
1,00
1,20
1,40
1,60
µm
^3 WT
KO
Figure 8: Diameter and volume of zymogen granules from serial sectioning
A) Average diameter of the pancreatic zymogen granules: 1- calculated from at least 50 serial
sections; 2- calculated from normal cross-sections. B) Average volume of the zymogen granules in WT
and KO pancreatic acinar cells, ***- p<0,001.
4.2.4. Distribution of zymogen granules in exocrine pancreatic acinar cells
Figure 5 indicated that there are not only changes of size and number of secretory
granules in CSP KO mice, but also differences in the intracellular distribution of the
granules.
Remarkably, in many KO cells, the zymogen granules were not only found in the
apical pole, but also at the basal pole of the cell. Most of the times, these are the
same cells that contain an increased number of zymogen granules that are bigger in
size. Not all cells were altered though. There were cells (~42%) that looked
comparable to the cells from the WT pancreas.
In an attempt to compare the distribution of the granule pool in the cells from the
CSPα KO and their respective WT littermate controls, the following measurements
were done. Object of quantification were only cells satisfying the criteria in 4.1.
A B
***
***
***

57
0,00%
10,00%
20,00%
30,00%
40,00%
50,00%
60,00%%
of
cell len
gth
WT
KO
0%
5%
10%
15%
20%
25%
30%
35%
0-10% 0-20% 0-30% 0-40% 0-50% 0-60% 0-70% 0-80% 0-90% 0-
100%
% of cell length
% o
f all c
ells
WT
KO
Figure 9: Distribution of the granules in the pancreatic acinar cells
A) Average distance of the granule pool from the apex of the cell, B) normalized distribution of the
cells in classes; n=156 cells from 4 WT animals, 228 cells from 4 KO animals; ***- p<0,001.
The diagram in Figure 9 B) shows that there is difference in the distribution of the
secretory granules in the acinar cell. In average, the zymogen granules are more
widely distributed in the cell cytoplasm in the cells from the KO animals. Their
distribution range comprises up to 55,53%± 1,25 of the cell length, which is
significantly higher than that of 40,32%± 1,06 for the WT cells (p<0,001). Cells with
differently distributed granules are found next to cells with normal phenotype (Figure
9 B). Most of the WT cell (129, or 82,69%) have their granules in up to 50% of the
cell length, with only 27 or 17,31% of the cells having their granules widely distributed
(in more than 50% of the cell length). In contrast to this, part of the KO acinar cells
(97, or 42,54%) have their granules distributed in the first 50% of the cell length and
the majority of the cells (132, or 57,46%) having their granules widely distributed
(Figure 9 B).
A B ***
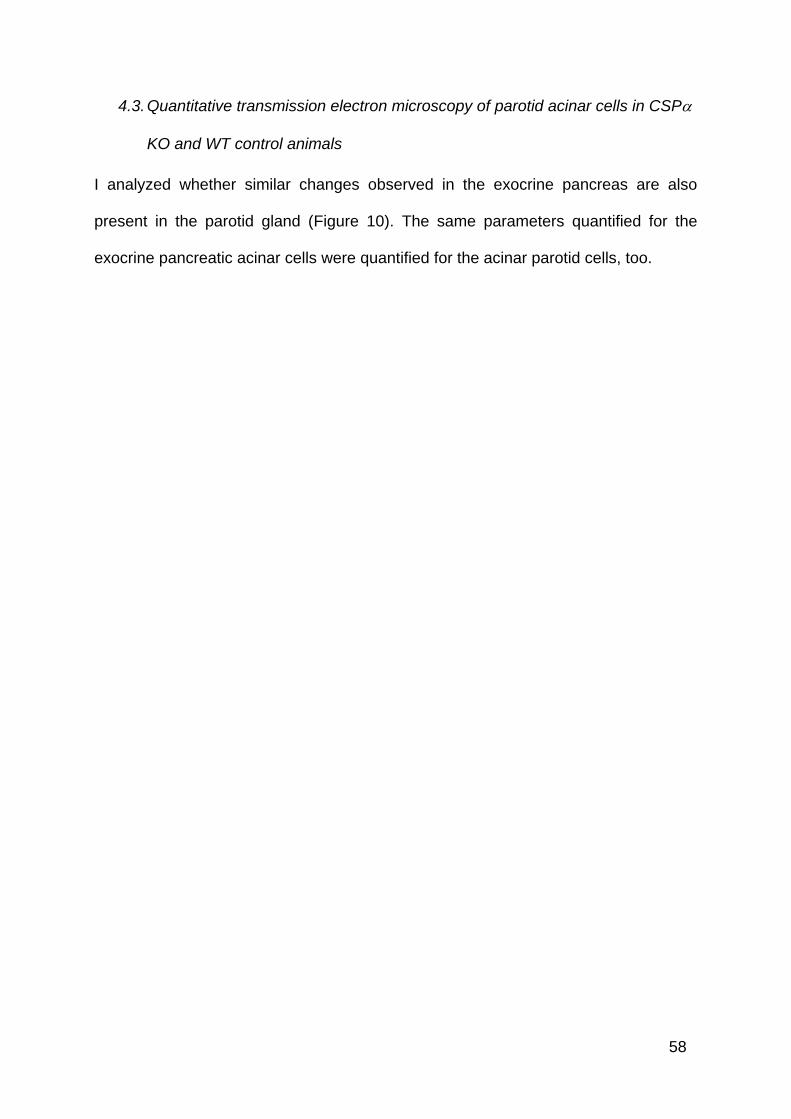
58
4.3. Quantitative transmission electron microscopy of parotid acinar cells in CSP
KO and WT control animals
I analyzed whether similar changes observed in the exocrine pancreas are also
present in the parotid gland (Figure 10). The same parameters quantified for the
exocrine pancreatic acinar cells were quantified for the acinar parotid cells, too.
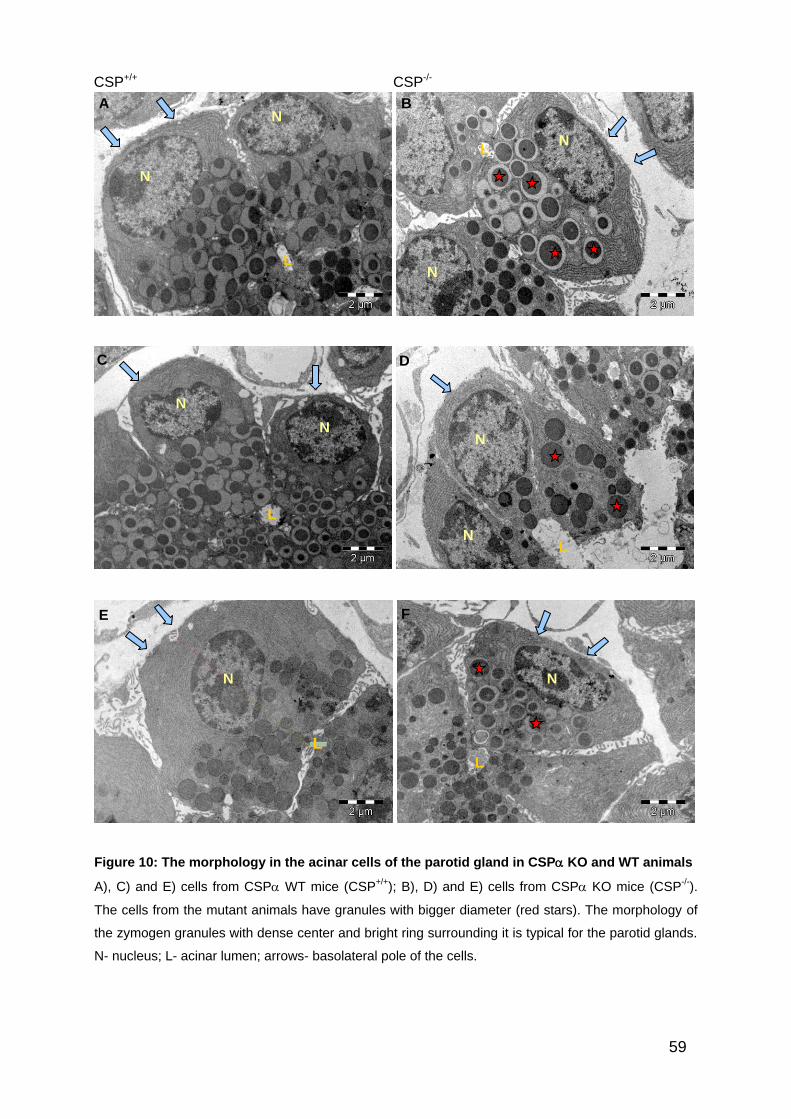
59
Figure 10: The morphology in the acinar cells of the parotid gland in CSP KO and WT animals
A), C) and E) cells from CSP WT mice (CSP+/+
); B), D) and E) cells from CSP KO mice (CSP-/-
).
The cells from the mutant animals have granules with bigger diameter (red stars). The morphology of
the zymogen granules with dense center and bright ring surrounding it is typical for the parotid glands.
N- nucleus; L- acinar lumen; arrows- basolateral pole of the cells.
A B
C D
E F
N
N N
N
N
N
N
N N
N
L
L
L
L
L
L
CSP+/+ CSP-/-

60
4.3.1. Zymogen granule diameter
Similar to the pancreatic acinar cells, the zymogen granules of the cells from parotid
gland of the CSP KO animals are bigger than the zymogen granules from the WT
animals (Figure 10). Zymogen granules from the CSP KO mice have average
diameter of 803,94±4,93nm which is significantly bigger than that of 694,27±2,35nm
in WT mice (Figure 11 A, p<0,001).
0,00
100,00
200,00
300,00
400,00
500,00
600,00
700,00
800,00
900,00
nm
WT
KO
0%
5%
10%
15%
20%
25%
0-3
00
301-4
00
401-5
00
501-6
00
601-7
00
701-8
00
801-9
00
901-1
000
1001-1
100
1101-1
200
1201-1
300
1301-1
400
1401-1
500
>1500
nm
% o
f all
gran
ule
sWT
KO
Figure 11: Zymogen granule diameter in the parotid acinar cells
A) Average zymogen granule diameter in WT and KO cells; n= 3469 zymogen granules from 3
animals for WT and n= 4312 granules from 3 animals for KO. Bars: average ± s.e.m, ***- p<0,001; B)
distribution of these granules in classes according to their diameter.
In addition, the overall distribution of the granules according to their diameter is
shifted to the higher values (Figure 11 B), showing that the increased average
diameter is not coming just from one or several sub-populations of the granules, but it
is a systematic shift. As shown in Figure 11 B), the diameter of granules from KO cell
is shifted to the higher values. Most of the granules (4799, or 69,66% from all WT
granules) in the WT cells have a diameter in the range of 500-900nm, with some of
the granules reaching more than 1000nm in diameter (422 granules, or 6,13% of
total). Most of the granules in CSP KO cells (2020, or 58,23% of all KO granules)
***
A B
61
have their diameter in the range of 600-1000nm. Some of granules have diameter
below 600nm (746 granules or 21,50%). Similar to the pancreatic acinar cells, there
are a lot of granules (703, or 20,27%) that are present in the KO cells which have
diameter much bigger than 1000 nm. The biggest granule measured in the KO cells
had diameter of 1615,12nm.
4.3.2. Average granule number per acinar cell
Surprisingly, the average number of granules in the acinar cells of the parotid gland
shows different characteristics than that observed in the pancreatic acinar cells. As
shown in Figure 12 A), there is significant difference (p<0,001) in the average granule
number of the acinar cells of the parotid gland, but in contrast to the pancreas,
exocrine cells form the wild-type animals’ parotid gland have on average more
granules (18,69±0,59) than the cells from the KO animals (15,21±0,73).
0,00
5,00
10,00
15,00
20,00
25,00
WT
KO
0%
5%
10%
15%
20%
25%
30%
35%
0-5
6-1
0
11-1
5
16-2
0
21-2
5
26-3
0
31-3
5
36-4
0
41-4
5
>45
granules per cell
% o
f all c
ells
WT
KO
Figure 12: Granule number in the parotid acinar cells
A) Average granule number in the parotid acinar cells, WT n= 4 animals, 193 cells, KO n= 3 animals
114 cells, bars: average± s.e.m; ***- p<0,001; B) normalized distribution of parotid acinar cells in
classes according to their granule count.
***
A B

62
The majority of the WT cells (176, or 91,16%) contain up to 30 granules, with the rest
having up to 45 granules per cell. In contrast to this, 97,37%) of the KO cells (or 111)
have 30 or less granules, with 2 cells (1,75%) having 30-35 granules and only 1
(0,88%) having more than 45 granules (Figure 12 B).
4.3.3. Distribution of zymogen granules in parotid acinar cells
Quantifications of the distribution of secretory granules were done in same way as for
the pancreas and as shown in Figure 9 A). Similar to the pancreas, the granules in
the parotid cells in the KO animals are more widely distributed in the cell cytoplasm
when compared with the cell from the WT animals (Figure 13 A). In the WT animals,
the total granule pool reaches on average up to 47,73±0,94% of the total length of
the cell, while in the cells from the KO animals the total granule pool reaches up to
53,54±1,58% of the length of the cell. This difference is significant (p<0,01).
0%
10%
20%
30%
40%
50%
60%
% o
f cell len
gth
WT
KO
0,00%
5,00%
10,00%
15,00%
20,00%
25,00%
30,00%
35,00%
0-1
0%
11-2
0%
21-3
0%
31-4
0%
41-5
0%
51-6
0%
61-7
0%
71-8
0%
81-9
0%
91-1
00%
% of cell length
% o
f all c
ells
WT
KO
Figure 13: Quantification of distribution of zymogen granules in parotid acinar cells
A) Average distance of the granule pool from the apex of the cell, bars: average ± s.e.m, n= 102 cells
from 3 KO animals and 207 cells from 4 WT littermate controls; B) normalized distribution of parotid
acinar cells in classes according to distribution of the granules in the cell.
A B
63
Similar to the pancreatic acinar cells from the CSP KO animals, the majority of the
population are cells with widely distributed granules (55 cells, or 53,92%). Part of the
KO parotid cells (47, or 46,08%) have their granules distributed in the first 50% of
the cell length. Most of the WT cell (123, or 59,42%) have their granules in up to 50%
of the cell length, with 84 or 40,58% of the cells having their granules widely
distributed (in more than 50% of the cell length).
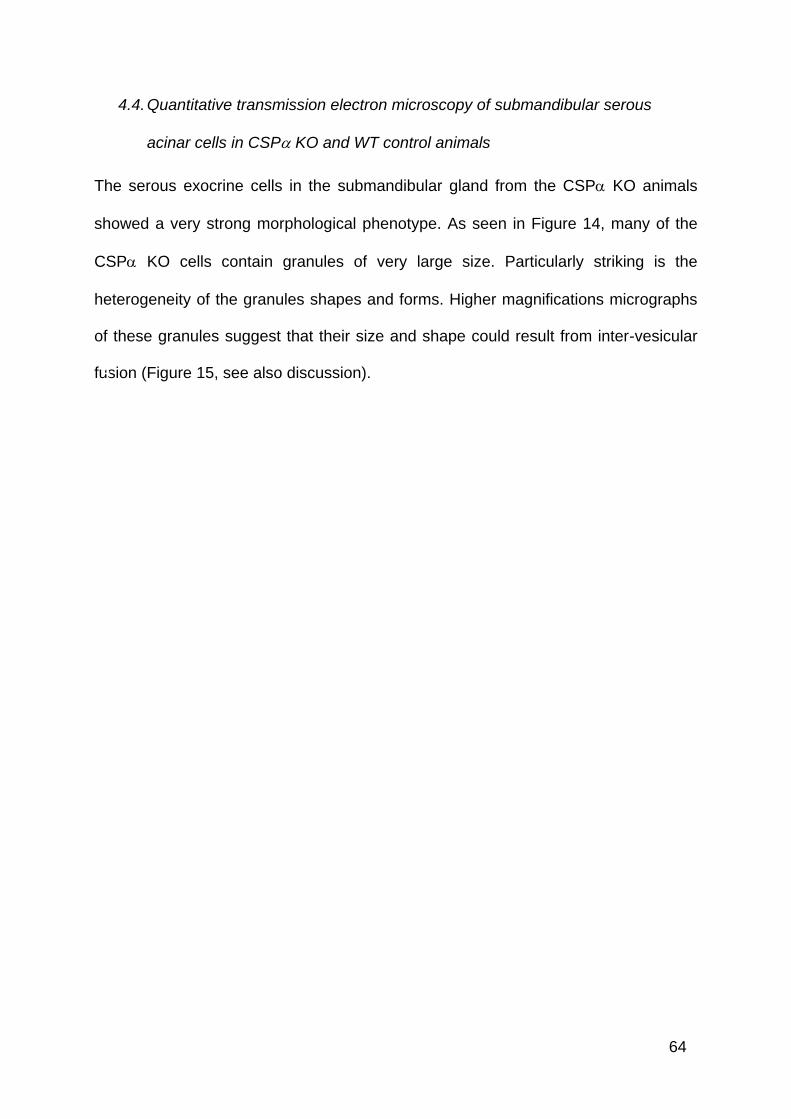
64
4.4. Quantitative transmission electron microscopy of submandibular serous
acinar cells in CSP KO and WT control animals
The serous exocrine cells in the submandibular gland from the CSP KO animals
showed a very strong morphological phenotype. As seen in Figure 14, many of the
CSP KO cells contain granules of very large size. Particularly striking is the
heterogeneity of the granules shapes and forms. Higher magnifications micrographs
of these granules suggest that their size and shape could result from inter-vesicular
fusion (Figure 15, see also discussion).
A

65
Figure 14: Morphology of the acinar cell from the submandibular gland of CSP wild-type (A, C,
E) and CSP knockout (B, D, F) mice.
Many large zymogen granules (red asterisks) are seen in the cells from the CSP KO animals (CSP-/-
B, D, F). This kind of granules is not observed in the cells originating from the WT controls (CSP+/+
; A,
C, E). N- nucleus, L- lumen, arrows point to the baso-lateral pole of the cells.
N
N N
N
N
N
N
N N
L
L
L
L
L
L
A B
C D
E F
CSP+/+ CSP-/-

66
Figure 15: Some of the heteromorphous granules in the submandibular gland of CSP knockout
animals at higher magnification
A) Overview of a submandibular serous acinar cell from CSP KO mouse (CSP-/-
) containing many
heterogeneously sized granules. The red rectangle surrounds an area shown at higher magnification
in B). Yellow arrows point to possible separate granules fused together.
4.4.1. Zymogen granule diameter
Also for this exocrine gland, the size of the granules was measured. Some of the
granules had spherical form, but some of the granules had very heterogeneous
shapes. In such cases, the longest diameter was measured. When quantifying the
diameter of the granules in the serous submandibular cells, the average granule
diameter of the mutant animals is 1144,59± 8,32nm and that of the wild-type
littermate controls it is 844,30± 5,01nm (Figure 16 A). This difference is highly
significant (p<0,001). When observing the normalized distribution of the granules in
classes according to their diameter, one can see an enormous difference between
the wild-type and mutant animals. In the WT animals, most of the granules (1778, or
65,58%) have their diameter in the range of 600-1100 nm (Figure 16 B). Only a small
part (433, or 15,97%) of the WT granules are larger than 1100nm in diameter. WT
granules having a diameter less than 600nm are in total 500, or 18,44%. In contrast
B A
CSP-/-

67
to this, only 1309 (or 42,01%) of the KO granules had diameter in the range from
600-1100nm. 1521 granules (or 48,81% of total) had diameter larger than 1100nm,
with 8 granules (or 0,26%) having diameter larger than 3μm (Figure 16 B). The rest
of the KO granules (286, or 9,18%) had diameter less than 600nm (Figure 16 B).
0
200
400
600
800
1000
1200
1400
nm
WT
KO
0%
2%
4%
6%
8%
10%
12%
14%
16%
<200nm
401-5
00
701-8
00
1001-1
100
1301-1
400
1601-1
700
1901-2
000
2201-2
300
2501-2
600
2801-2
900
WT
KO
Figure 16: Zymogen granule diameter in the submandibular acinar cells
A) Average diameter of the zymogen granules, n=2711 granules from 3 WT animals and n=3116
granules from 3 KO animals, bars: average ± s.e.m, ***- p<0,001 B) distribution of these granules in
classes according to their diameter.
4.4.2. Average granule number per acinar cell
Similar as in the pancreatic acinar cells, the mutant animals have more granules in
their submandibular cells than the WT controls. On average, the acinar cells from the
CSP KO animals have 46,14±3,63 granules per cell, which is significantly higher
than that of 29,42±1,83 granules from acinar cells of WT controls (Figure 17,
p<0,001). Most of the WT cells (48, or 81,36%) have 40 or less granules per cell. The
cells containing more than 41 granules are only 18,64% of the total amount of WT
cells analyzed (Figure 17 B). In contrast to this, KO cells with less than 40 granules
per cell section are 30 in total (or 52,63%). The rest of the cells have more than 40
granules per cell section (Figure 17 B).
A B

68
0
10
20
30
40
50
60
WT
KO
Distribution of cells according to their granule count
0,00%
5,00%
10,00%
15,00%
20,00%
25,00%
30,00%
35,00%
0-10
11-2
0
21-3
0
31-4
0
41-5
0
51-6
0
61-7
0
71-8
0
81-9
0>9
0
WT
KO
Figure 17: Zymogen granule number per acinar cell
A) Average number of granules per submandibular acinar cell, for the WT n=59 cells from 3 animals
and for the KO n= 57 cells from 3 animals, bars: average± s.e.m; B) normalized distribution of the cells
according to the number of granules.
4.4.3. Distribution of zymogen granules in submandibular serous cells
Similar to the pancreas and parotid gland, the zymogen granules in the
submandibular serous cells from the CSP KO animals are widely distributed in the
cytoplasm of the cells (Figure 14). In average, the granules in the CSP KO animals
take up to 87,86±1,90% of the cell length, which is significantly higher than that of
61,14± 1,94% for the WT cells (Figure 18 A), p<0,001). 6,78% of the WT cells have
their granules in up to 50% of the cell length, with 28,81% of the cells having their
granules widely distributed (within 91-100% of the cell length). In contrast to this, part
of the CSP KO submandibular acinar cells (1,75%) have their granules distributed
in the first 50% of the cell length and the majority of the cells (61,48%) having their
granules distributed throughout the entire cell (91-100% of cell length, Figure 18 B).
A B
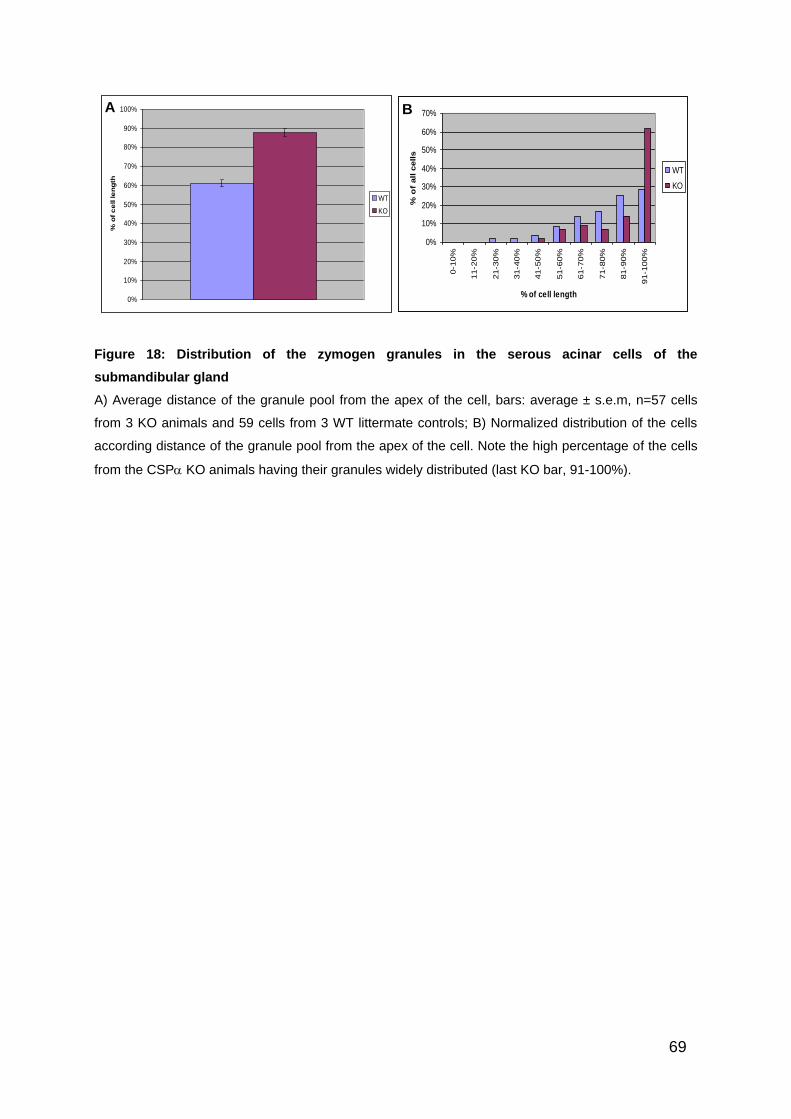
69
0%
10%
20%
30%
40%
50%
60%
70%
80%
90%
100%%
of
ce
ll le
ng
th
WT
KO
0%
10%
20%
30%
40%
50%
60%
70%
0-1
0%
11-2
0%
21-3
0%
31-4
0%
41-5
0%
51-6
0%
61-7
0%
71-8
0%
81-9
0%
91-1
00%
% of cell length
% o
f all c
ells
WT
KO
Figure 18: Distribution of the zymogen granules in the serous acinar cells of the
submandibular gland
A) Average distance of the granule pool from the apex of the cell, bars: average ± s.e.m, n=57 cells
from 3 KO animals and 59 cells from 3 WT littermate controls; B) Normalized distribution of the cells
according distance of the granule pool from the apex of the cell. Note the high percentage of the cells
from the CSP KO animals having their granules widely distributed (last KO bar, 91-100%).
A B

70
4.5. Mast cells
Figure 19: Peritoneal mast cells
No visible differences can be observed; the cells from the WT (CSP+/+
; A, C) and KO (CSP-/-
; B, D)
animals look identical; N-nucleus, arrows point to secretory granules
When ultra-thin sections of the mast cells were observed under the EM, no obvious
differences between the cells from the CSP KO and WT animals could be seen
(Figure 19). This lack of difference was confirmed by several quantifications. There
were no differences in the cell size (6,92±0,89μm for the KO and 7,12±0,15μm for the
WT cells, measured as diameter and only for cells that had nicely visible nucleus, as
seen in Figure 19). Also, no differences were found for number of granules per cell
(46,92±1,47 for the KO and 49,24±1,65 for the WT cells), or diameter of the granules
(546,88±5,34nm for the WT and 547,53±4,14nm for the KO animals, Figure 20 A). It
A B
C D
CSP+/+ CSP-/-
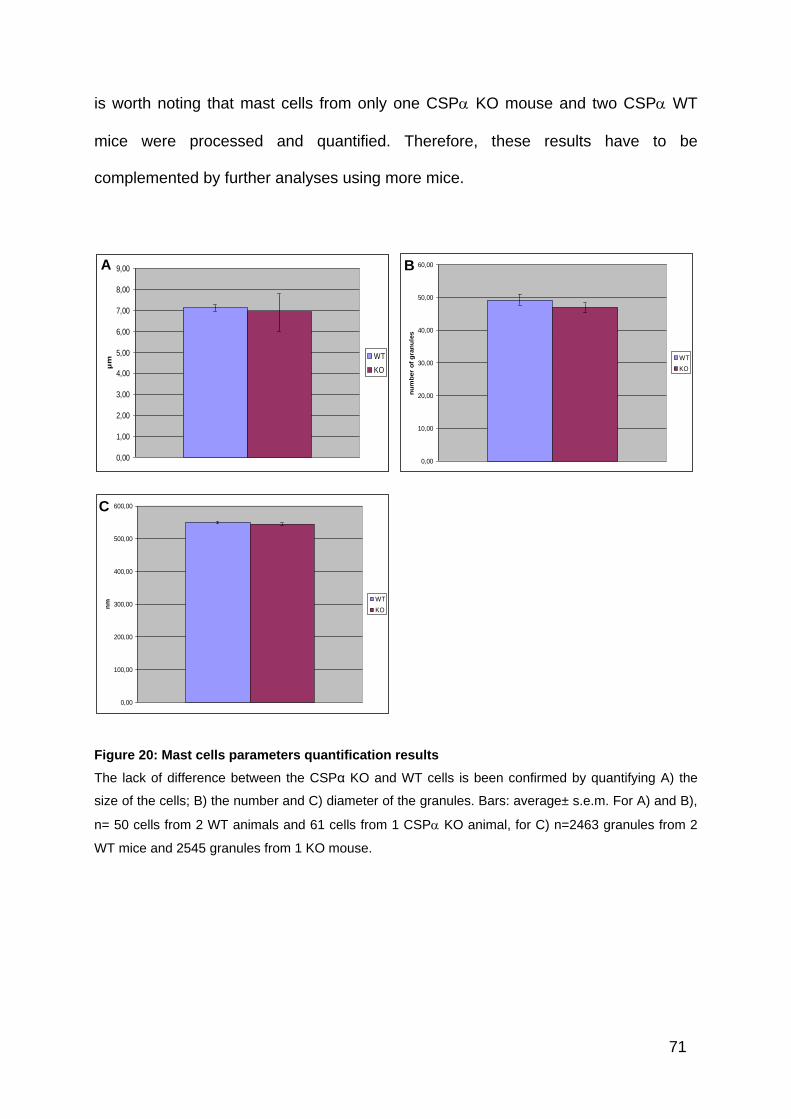
71
is worth noting that mast cells from only one CSP KO mouse and two CSP WT
mice were processed and quantified. Therefore, these results have to be
complemented by further analyses using more mice.
0,00
1,00
2,00
3,00
4,00
5,00
6,00
7,00
8,00
9,00
µm
WT
KO
0,00
10,00
20,00
30,00
40,00
50,00
60,00
nu
mb
er
of
gra
nu
les
WT
KO
0,00
100,00
200,00
300,00
400,00
500,00
600,00
nm
WT
KO
Figure 20: Mast cells parameters quantification results
The lack of difference between the CSPα KO and WT cells is been confirmed by quantifying A) the
size of the cells; B) the number and C) diameter of the granules. Bars: average± s.e.m. For A) and B),
n= 50 cells from 2 WT animals and 61 cells from 1 CSP KO animal, for C) n=2463 granules from 2
WT mice and 2545 granules from 1 KO mouse.
A B
C
72
4.6. CSP isoforms genotyping
CSP has three isoforms encoded by different genes: and . CSP is ubiquitously
expressed, but highly enriched in brain, while CSPß and are testis specific. It has
been shown that in some cells, like the inner hair cells, CSPß can act as a substitute
for the lacking CSP (Schmitz et al. 2006). To check for the presence of the other
isoforms in the organs already examined with electron microscopy, total RNA was
extracted from them and RT-PCR experiments were performed (see Materials and
Methods, 3.5 and 3.6). As shown in Figure 21 and Figure 22, in all of the organs
examined, CSP is the only isoform present.
+ ++++ +-- -- - -H2O H2OH2O
CS
Palp
ha
in p
GB
KT7
Mast cells Mast cellsMast cellsTestes TestesTestes
+ ++++ +-- -- - -H2O H2OH2O
CS
Palp
ha
in p
GB
KT7
Mast cells Mast cellsMast cellsTestes TestesTestes
+ ++++ +-- -- - -H2O H2OH2O
CS
Palp
ha
in p
GB
KT7
Mast cells Mast cellsMast cellsTestes TestesTestes
Figure 21: CSP Isotyping in the bone marrow mast cells
CSPα is the only isoform of CSP in the BMMC. Testis, which contains all of the isoforms, was used as
positive control alongside with CSPα in pGBKT7 plasmid vector. +: reaction with reverse transcription,
cDNA used as a template, -: reaction without reverse transcription, total RNA used as a template.
Arrows point to 500bp band of the DNA standard. Expected size of bands: CSPα ~500bp, CSPß and γ
~600bp.
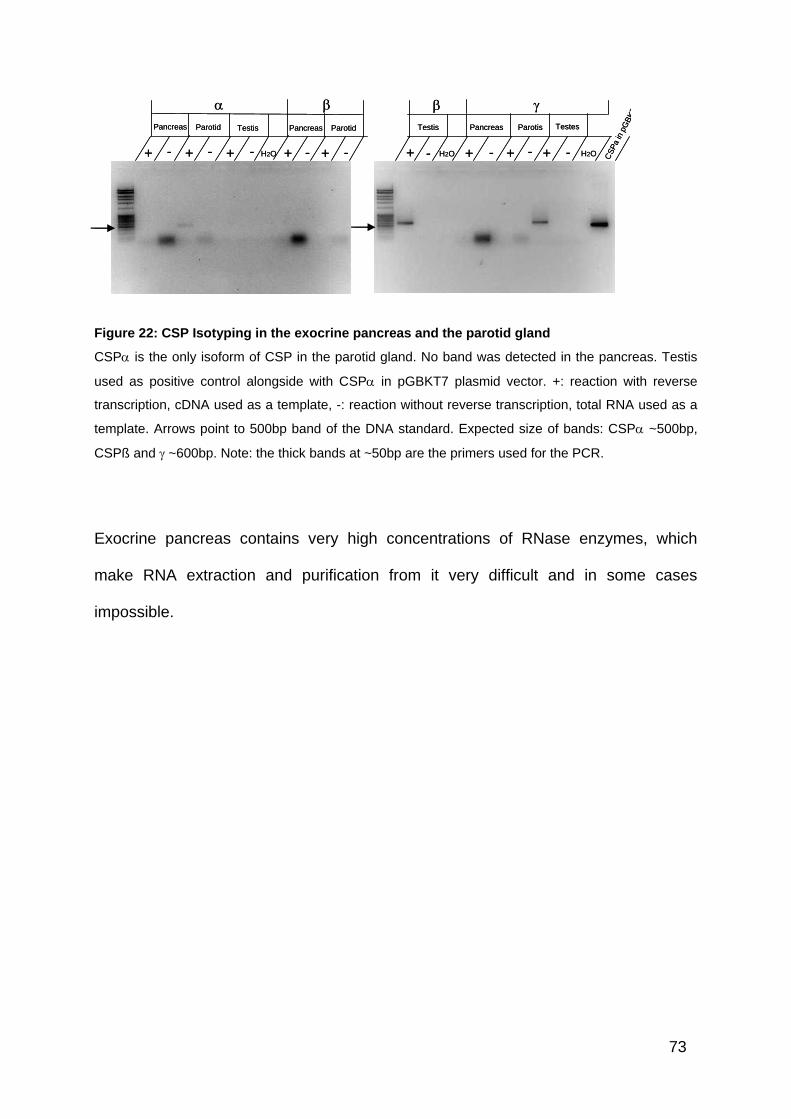
73
+ ++ +-- - -H2O H2O
Pancreas PancreasParotid Testis
++ -- H2O
CS
Pa in
pG
BK
T7
Parotis Testes
+
Testis
-
Pancreas Parotid
++ --+ ++ +-- - -H2O H2O
Pancreas PancreasParotid Testis
++ -- H2O
CS
Pa in
pG
BK
T7
Parotis Testes
+
Testis
-
Pancreas Parotid
++ --
Figure 22: CSP Isotyping in the exocrine pancreas and the parotid gland
CSP is the only isoform of CSP in the parotid gland. No band was detected in the pancreas. Testis
used as positive control alongside with CSP in pGBKT7 plasmid vector. +: reaction with reverse
transcription, cDNA used as a template, -: reaction without reverse transcription, total RNA used as a
template. Arrows point to 500bp band of the DNA standard. Expected size of bands: CSP ~500bp,
CSPß and ~600bp. Note: the thick bands at ~50bp are the primers used for the PCR.
Exocrine pancreas contains very high concentrations of RNase enzymes, which
make RNA extraction and purification from it very difficult and in some cases
impossible.
74
5. Discussion
CSP KO mice are characterized by their progressive sensorimotor impairment as a
result of the neurodegenerative processes taking place at the NMJ, Calyx of Held
(Fernandez-Chacon et al. 2004) and photoreceptor synapses (Schmitz et al. 2006).
Another characteristic of these KO mice is their inability to gain weight after the age
of P15, and the very high rate of mortality, with none of the mutant mice surviving
more than 3 months (Fernandez-Chacon et al. 2004). Inability to gain weight could be
result of animals’ disability to utilise the food as a result of alterations in the digestive
tract. The exocrine glands of the digestive system (exocrine pancreas, parotid and
submandibular gland) are essential for digestion. In the present study, I asked
whether alterations are present in these exocrine glands in CSP KO mice that could
account for the dramatic inability to gain weight in these KO mice.
This study shows that, in deed, ultrastructural changes are present in the secretory
glands, particularly the exocrine pancreas. In pancreatic acinar cells of CSP KO
mice there are more granules, which are bigger in diameter and are distributed widely
across the cytoplasm. Some of the granules reach near the baso-lateral pole of the
cell.
What could be the mechanism for the observed morphological changes is not clear. It
is possible that due to the lack of the CSP, these granules cannot be exocytosed
and they accumulate into the cell. There, the granules could fuse among themselves
(or with the lysosomes) and grow in size. CSP is implied to chaperone the SNARE
complex (Chandra et al. 2005). The lack of CSP could decrease the formation of the
SNARE complex, therefore exhibiting its effects on regulating the exocytosis. Without
proper assembly of the SNAREs, the vesicles cannot be exocytosed and they

75
accumulate. As a support to this is the finding that the levels of SNAP-25, one of the
members of the SNARE complex, are decreased by 30-40% in the CSP KO mice.
In addition, work on VAMP8/endobrevin KO mice (Wang et al. 2004) has indicated a
major physiological role of VAMP8 in regulated exocytosis in exocrine pancreas,
placing it as a member of the SNARE complex responsible for exocytosis in exocrine
pancreas. VAMP8/endobrevin KO mice, similar to the CSP KO mice, accumulate
zymogen granules in the pancreatic acinar cells (Wang et al. 2004).
With the deletion of the CSPα, the SNAREs in the pancreas are not chaperoned,
exocytosis is hindered and therefore the CSPα KO mice accumulate zymogen
granules in the cytoplasm of the pancreatic acinar cells (Figure 5 and Figure 6).
Nevertheless, the connection between CSP chaperoning the SNAREs on one hand
and the morphological changes in the pancreatic acinar cell on the other is still
hypothetical, and needs further investigation.
In addition, CSP is known to take part in the recycling of Rab3 proteins (Sakisaka et
al. 2002; Evans et al. 2003). In non-neuronal tissues, Rab3D is predominant isoform
(Riedel et al. 2002). The analysis of Rab3D KO mice has suggested that Rab3D is
not important for exocytosis, bur for maintenance of normally sized granules in the
pancreas and the parotid gland (Riedel et al. 2002). Similar to the CSP KO mice,
the pancreatic and parotid cells from the Rab3D KO mice have zymogen granules
with bigger diameter when compared to their controls. In that study, it is suggested
that Rab3D has an inhibitory effect on the granule-granule fusion and has a role in
the maturation of the zymogen granules. In the absence of CSP, the multi-protein
chaperone complex that recycles Rab3D may not function properly. Therefore,
Rab3D could not recycle and could not accomplish its effects upon the size-control of
the granules. On the other hand, granule-granule fusion is mediated via different
76
members of the SNARE family (Wang et al. 2004), reviewed in (Gaisano 2000).
These proteins may not be subject of CSP chaperone activity, thus avoiding the
effects of CSP deletion upon membrane fusion. Not being under control of CSP
activity, the granules can fuse among themselves, but not with the apical plasma
membrane. This granule-granule fusion leads to increased diameter of the zymogen
granules in the CSPα KO mice (Figure 5, Figure 7 and Figure 8). However, this
remark is not supported by previous studies and is only hypothetical. It can serve as
a starting point for future assessments.
The parotid and submandibular glands are exocrine glands of epithelial origin that
contain secretory granules. The ultrastructural changes observed in the exocrine
pancreas of CSP KO mice, were in general, also observed in the parotid and
submandibular glands (Figure 10, 11, 12, 13 and Figure 14, 16, 17 and 18).
However, in the parotid gland, the acinar cells from the CSPα KO animals have less
zymogen granules than the cells from the WT controls. This difference found in the
parotid gland can be attributed to different development of the glands.
In particular, the development of the parotid gland is mouse strain-specific. Namely,
in C57BL/6 mice (the background strain of the CSPα KO mice, (Fernandez-Chacon
et al. 2004) the parotid gland reaches its full potential after the 3rd postnatal week
(Domon and Kurabayashi 1987). At P17, the gland is not fully developed and is not
fully functional. Therefore, the CSP chaperone activity may not yet be necessary.
Another point regarding the differences observed is that, although many of the
SNARE isoforms have been identified in the parotid gland (Imai et al. 2001; Imai et
al. 2003; Wang et al. 2007), it remains still uncertain whether the SNARE machinery
is involved in the regulated exocytosis in the salivary glands (Takuma et al. 2000), for
review, see (Turner and Sugiya 2002). Another possible explanation for the
77
heterogeneity of the observed morphological changes found is the expression of
another CSP isoform in the parotid cell. As found in the inner hair cells of the CSP
KO mice, CSPß is expressed there and substitutes the deletion of CSP (Schmitz et
al. 2006). However, when searching for possible CSP isoforms in the parotid and
submandibular glands used in this study, the CSP was the only isoform found in all
of them. It remains unclear why there is decrease in the number of granules in the
parotid cells originating from the CSP mutant mice.
For the submandibular gland, the proteins involved in regulating the exocytosis are
not yet clear. In one study, it was even suggested that the secretion of amylase from
this gland is probably a constitutive, non-regulated phenomenon, independent of
extracellular or intracellular signals (Busch et al. 2002). So far, there are no reports of
such gigantic granules (Figure 14 and Figure 15) found in the acinar cells of this
gland in any mouse or other animal model. As mentioned above for the pancreas, the
proteins responsible for inter-granular fusion might not be substrates for CSPα
chaperone activity, therefore enabling zymogen granule-granule fusion (Figure 15),
but not exocytosis and therefore enabling the accumulation of the zymogen granules
in the cells.
Nevertheless, the exact molecular mechanisms of the membrane fusion in the
submandibular gland remain to be addressed and the proteins involved in these
processes to be discovered. This will shed light on the phenotype observed in the
submandibular gland of the CSPα KO mice.
This study did not find any morphological changes in the peritoneal mast cells. This
can be attributed to low number of experimental animals (1 KO and 2 WT mice) and
to young age of the animals. According to unpublished data from a collaborative

78
laboratory, mast cells from CSP KO mice show differences in exocytosis but evident
in older age (after ~P30). Nevertheless, further experiments are necessary to inspect
the role of CSP in the mast cells functions.
The overall finding in the exocrine glands that not all of the cells are affected by the
loss of CSP is supportive to the theory that CSP acts in a chaperone manner.
Physiologically, some cells exhibit higher levels of activity than others do. In those
parts (or cells) of the organ with higher activity, it is logical that the relevant proteins
are exposed to higher stress. Consequently, they age sooner and become unable to
perform their roles. Lacking the chaperone machinery, their recycling is hindered.
Because of this, the effects of the CSP deletion become obvious sooner or to
greater extent in these cells than in those that have lower levels of activity. This could
explain why some cells in the CSPα KO animals’ glands have normal values of their
parameters (Figure 6, 7 and 9 for pancreas, Figure 11, 12 and 13 for parotid and
Figure 16, 17 and 18 for submandibular gland).

79
6. Conclusion
This study aimed at identifying possible defects in the digestive tract of the CSP KO
mice, which can be responsible for the animals’ inability to gain weight. Morphological
changes are present in the exocrine glands of the digestive system, which are
indicative for pathological processes. These findings occur as a result of “removing”
the CSP chaperone activity, rendering decreased SNARE complex formation (thus
accumulation of granules) and decreased control of Rab3D recycling (thus increased
size of the granules). However, the exact cellular mechanisms of these effects are
not subject of this study and remain to be addressed in future experimental work.
Furthermore, the CSPα KO mice could die as a consequence of the changes
observed in the exocrine glands of the digestive system, but considering the
ubiquitous expression of CSPα, it is possible that they die of yet unidentified
dysfunction of some of the animals’ organs.

80
7. References
Arnold, C., N. Reisch, C. Leibold, S. Becker, K. Prufert, K. Sautter, D. Palm, S.
Jatzke, S. Buchner and E. Buchner (2004). "Structure-function analysis of the
cysteine string protein in Drosophila: cysteine string, linker and C terminus." J
Exp Biol 207(Pt 8): 1323-34.
Blank, U., B. Cyprien, S. Martin-Verdeaux, F. Paumet, I. Pombo, J. Rivera, M. Roa
and N. Varin-Blank (2002). "SNAREs and associated regulators in the control
of exocytosis in the RBL-2H3 mast cell line." Mol Immunol 38(16-18): 1341-5.
Boal, F., H. Zhang, C. Tessier, P. Scotti and J. Lang (2004). "The variable C-terminus
of cysteine string proteins modulates exocytosis and protein-protein
interactions." Biochemistry 43(51): 16212-23.
Braun, J. E., B. A. Fritz, S. M. Wong and A. W. Lowe (1994). "Identification of a
vesicle-associated membrane protein (VAMP)-like membrane protein in
zymogen granules of the rat exocrine pancreas." J Biol Chem 269(7): 5328-
35.
Braun, J. E. and R. H. Scheller (1995). "Cysteine string protein, a DnaJ family
member, is present on diverse secretory vesicles." Neuropharmacology
34(11): 1361-9.
Braun, J. E., S. M. Wilbanks and R. H. Scheller (1996). "The cysteine string secretory
vesicle protein activates Hsc70 ATPase." J Biol Chem 271(42): 25989-93.
Brown, H., O. Larsson, R. Branstrom, S. N. Yang, B. Leibiger, I. Leibiger, G. Fried, T.
Moede, J. T. Deeney, G. R. Brown, G. Jacobsson, C. J. Rhodes, J. E. Braun,
R. H. Scheller, B. E. Corkey, P. O. Berggren and B. Meister (1998). "Cysteine
string protein (CSP) is an insulin secretory granule-associated protein
regulating beta-cell exocytosis." Embo J 17(17): 5048-58.
Busch, L., L. Sterin-Borda and E. Borda (2002). "Differences in the regulatory
mechanism of amylase release by rat parotid and submandibular glands."
Archives of Oral Biology 47(10): 717-722.
81
Caplan, A. J., D. M. Cyr and M. G. Douglas (1993). "Eukaryotic homologues of
Escherichia coli DnaJ: a diverse protein family that functions with hsp70 stress
proteins." Mol Biol Cell 4(6): 555-63.
Chamberlain, L. H. and R. D. Burgoyne (1997). "Activation of the ATPase activity of
heat-shock proteins Hsc70/Hsp70 by cysteine-string protein." Biochem J 322 (
Pt 3): 853-8.
Chamberlain, L. H. and R. D. Burgoyne (1997). "The molecular chaperone function of
the secretory vesicle cysteine string proteins." J Biol Chem 272(50): 31420-6.
Chamberlain, L. H. and R. D. Burgoyne (1998). "The cysteine-string domain of the
secretory vesicle cysteine-string protein is required for membrane targeting."
Biochem J 335 ( Pt 2): 205-9.
Chamberlain, L. H. and R. D. Burgoyne (2000). "Cysteine-string protein: the
chaperone at the synapse." J Neurochem 74(5): 1781-9.
Chandra, S., G. Gallardo, R. Fernandez-Chacon, O. M. Schluter and T. C. Südhof
(2005). "Alpha-synuclein cooperates with CSPalpha in preventing
neurodegeneration." Cell 123(3): 383-96.
Cheetham, M. E. and A. J. Caplan (1998). "Structure, function and evolution of DnaJ:
conservation and adaptation of chaperone function." Cell Stress Chaperones
3(1): 28-36.
Chen, S., X. Zheng, K. L. Schulze, T. Morris, H. Bellen and E. F. Stanley (2002).
"Enhancement of presynaptic calcium current by cysteine string protein." J
Physiol 538(Pt 2): 383-9.
Cook, L. J., O. A. Musa and R. M. Case (1996). "Intracellular transport of pancreatic
enzymes." Scand J Gastroenterol Suppl 219: 1-5.
Cosen-Binker, L. I. and H. Y. Gaisano (2007). "Recent insights into the cellular
mechanisms of acute pancreatitis." Can J Gastroenterol 21(1): 19-24.
82
Dawson-Scully, K., P. Bronk, H. L. Atwood and K. E. Zinsmaier (2000). "Cysteine-
string protein increases the calcium sensitivity of neurotransmitter exocytosis
in Drosophila." J Neurosci 20(16): 6039-47.
Domon, M. and T. Kurabayashi (1987). "Postnatal development of the duct system in
the mouse parotid gland." Anat Rec 217(4): 391-4.
Evans, G. J. and A. Morgan (2002). "Phosphorylation-dependent interaction of the
synaptic vesicle proteins cysteine string protein and synaptotagmin I."
Biochem J 364(Pt 2): 343-7.
Evans, G. J., A. Morgan and R. D. Burgoyne (2003). "Tying everything together: the
multiple roles of cysteine string protein (CSP) in regulated exocytosis." Traffic
4(10): 653-9.
Fernandez-Chacon, R., M. Wolfel, H. Nishimune, L. Tabares, F. Schmitz, M.
Castellano-Munoz, C. Rosenmund, M. L. Montesinos, J. R. Sanes, R.
Schneggenburger and T. C. Südhof (2004). "The synaptic vesicle protein CSP
alpha prevents presynaptic degeneration." Neuron 42(2): 237-51.
Gaisano, H. Y. (2000). "A hypothesis: SNARE-ing the mechanisms of regulated
exocytosis and pathologic membrane fusions in the pancreatic acinar cell."
Pancreas 20(3): 217-26.
Gaisano, H. Y., L. Sheu, G. Grondin, M. Ghai, A. Bouquillon, A. Lowe, A. Beaudoin
and W. S. Trimble (1996). "The vesicle-associated membrane protein family of
proteins in rat pancreatic and parotid acinar cells." Gastroenterology 111(6):
1661-9.
Gaisano, H. Y., L. Sheu, P. P. Wong, A. Klip and W. S. Trimble (1997). "SNAP-23 is
located in the basolateral plasma membrane of rat pancreatic acinar cells."
FEBS Lett 414(2): 298-302.
Graham, M. E. and R. D. Burgoyne (2000). "Comparison of cysteine string protein
(Csp) and mutant alpha-SNAP overexpression reveals a role for csp in late
steps of membrane fusion in dense-core granule exocytosis in adrenal
chromaffin cells." J Neurosci 20(4): 1281-9.
83
Gundersen, C. B., A. Mastrogiacomo, K. Faull and J. A. Umbach (1994). "Extensive
lipidation of a Torpedo cysteine string protein." J Biol Chem 269(30): 19197-9.
Gundersen, C. B. and J. A. Umbach (1992). "Suppression cloning of the cDNA for a
candidate subunit of a presynaptic calcium channel." Neuron 9(3): 527-37.
Hansen, N. J., W. Antonin and J. M. Edwardson (1999). "Identification of SNAREs
involved in regulated exocytosis in the pancreatic acinar cell." J Biol Chem
274(32): 22871-6.
Hartl, F. U. and M. Hayer-Hartl (2002). "Molecular chaperones in the cytosol: from
nascent chain to folded protein." Science 295(5561): 1852-8.
Hsu, C. C., K. M. Davis, H. Jin, T. Foos, E. Floor, W. Chen, J. B. Tyburski, C. Y.
Yang, J. V. Schloss and J. Y. Wu (2000). "Association of L-glutamic acid
decarboxylase to the 70-kDa heat shock protein as a potential anchoring
mechanism to synaptic vesicles." J Biol Chem 275(27): 20822-8.
Imai, A., T. Nashida and H. Shimomura (2001). "mRNA expression of membrane-
fusion-related proteins in rat parotid gland." Arch Oral Biol 46(10): 955-62.
Imai, A., T. Nashida, S. Yoshie and H. Shimomura (2003). "Intracellular localisation
of SNARE proteins in rat parotid acinar cells: SNARE complexes on the apical
plasma membrane." Arch Oral Biol 48(8): 597-604.
Jacobsson, G. and B. Meister (1996). "Molecular components of the exocytotic
machinery in the rat pituitary gland." Endocrinology 137(12): 5344-56.
Kelley, W. L. (1998). "The J-domain family and the recruitment of chaperone power."
Trends Biochem Sci 23(6): 222-7.
Leveque, C., S. Pupier, B. Marqueze, L. Geslin, M. Kataoka, M. Takahashi, M. De
Waard and M. Seagar (1998). "Interaction of cysteine string proteins with the
alpha1A subunit of the P/Q-type calcium channel." J Biol Chem 273(22):
13488-92.
84
Logan, M. R., S. O. Odemuyiwa and R. Moqbel (2003). "Understanding exocytosis in
immune and inflammatory cells: the molecular basis of mediator secretion." J
Allergy Clin Immunol 111(5): 923-32; quiz 933.
Luan, P., W. E. Balch, S. D. Emr and C. G. Burd (1999). "Molecular dissection of
guanine nucleotide dissociation inhibitor function in vivo. Rab-independent
binding to membranes and role of Rab recycling factors." J Biol Chem
274(21): 14806-17.
Magga, J. M., S. E. Jarvis, M. I. Arnot, G. W. Zamponi and J. E. Braun (2000).
"Cysteine string protein regulates G protein modulation of N-type calcium
channels." Neuron 28(1): 195-204.
Mastrogiacomo, A. and C. B. Gundersen (1995). "The nucleotide and deduced amino
acid sequence of a rat cysteine string protein." Brain Res Mol Brain Res 28(1):
12-8.
Mastrogiacomo, A., S. M. Parsons, G. A. Zampighi, D. J. Jenden, J. A. Umbach and
C. B. Gundersen (1994). "Cysteine string proteins: a potential link between
synaptic vesicles and presynaptic Ca2+ channels." Science 263(5149): 981-2.
Matos, M. F., J. Rizo and T. C. Südhof (2000). "The relation of protein binding to
function: what is the significance of munc18 and synaptotagmin binding to
syntaxin 1, and where are the corresponding binding sites?" Eur J Cell Biol
79(6): 377-82.
Morales, M., A. Ferrus and M. Martínez-Padron (1999). "Presynaptic calcium-channel
currents in normal and csp mutant Drosophila peptidergic terminals." Eur J
Neurosci 11(5): 1818-26.
Nie, Z., R. Ranjan, J. J. Wenniger, S. N. Hong, P. Bronk and K. E. Zinsmaier (1999).
"Overexpression of cysteine-string proteins in Drosophila reveals interactions
with syntaxin." J Neurosci 19(23): 10270-9.
Ohyama, T., P. Verstreken, C. V. Ly, T. Rosenmund, A. Rajan, A. C. Tien, C.
Haueter, K. L. Schulze and H. J. Bellen (2007). "Huntingtin-interacting protein
14, a palmitoyl transferase required for exocytosis and targeting of CSP to
synaptic vesicles." J Cell Biol 179(7): 1481-96.
85
Palade, G. (1975). "Intracellular Aspects of the Process of Protein Synthesis."
Science 189(4206): 867.
Pickett, J. A. and J. M. Edwardson (2006). "Compound exocytosis: mechanisms and
functional significance." Traffic 7(2): 109-16.
Ranjan, R., P. Bronk and K. E. Zinsmaier (1998). "Cysteine string protein is required
for calcium secretion coupling of evoked neurotransmission in drosophila but
not for vesicle recycling." J Neurosci 18(3): 956-64.
Ribeiro, R. A., M. L. Vale, S. M. Thomazzi, A. B. Paschoalato, S. Poole, S. H.
Ferreira and F. Q. Cunha (2000). "Involvement of resident macrophages and
mast cells in the writhing nociceptive response induced by zymosan and acetic
acid in mice." Eur J Pharmacol 387(1): 111-8.
Riedel, D., W. Antonin, R. Fernández-Chacón, G. Alvarez de Toledo, T. Jo, M.
Geppert, J. A. Valentijn, K. Valentijn, J. D. Jamieson, T. C. Südhof and R.
Jahn (2002). "Rab3D is not required for exocrine exocytosis but for
maintenance of normally sized secretory granules." Mol Cell Biol 22(18): 6487-
97.
Sakisaka, T., T. Meerlo, J. Matteson, H. Plutner and W. E. Balch (2002). "Rab-
alphaGDI activity is regulated by a Hsp90 chaperone complex." Embo J
21(22): 6125-35.
Schmitz, F., L. Tabares, D. Khimich, N. Strenzke, P. de la Villa-Polo, M. Castellano-
Muñoz, A. Bulankina, T. Moser, R. Fernández-Chacón and T. C. Südhof
(2006). "CSPalpha-deficiency causes massive and rapid photoreceptor
degeneration." Proc Natl Acad Sci U S A 103(8): 2926-31.
Silver, P. A. and J. C. Way (1993). "Eukaryotic DnaJ homologs and the specificity of
Hsp70 activity." Cell 74(1): 5-6.
Stahl, B., S. Tobaben and T. C. Südhof (1999). "Two distinct domains in hsc70 are
essential for the interaction with the synaptic vesicle cysteine string protein."
Eur J Cell Biol 78(6): 375-81.

86
Stevens, A. and J. Lowe (1992). Histology. London, New York, Gower Medical
Publishing
Takuma, T., T. Arakawa and Y. Tajima (2000). "Interaction of SNARE proteins in rat
parotid acinar cells." Arch Oral Biol 45(5): 369-75.
Tobaben, S., P. Thakur, R. Fernandez-Chacon, T. C. Südhof, J. Rettig and B. Stahl
(2001). "A trimeric protein complex functions as a synaptic chaperone
machine." Neuron 31(6): 987-99.
Turner, R. J. and H. Sugiya (2002). "Understanding salivary fluid and protein
secretion." Oral Dis 8(1): 3-11.
Umbach, J. A., K. E. Zinsmaier, K. K. Eberle, E. Buchner, S. Benzer and C. B.
Gundersen (1994). "Presynaptic dysfunction in Drosophila csp mutants."
Neuron 13(4): 899-907.
van de Goor, J. and R. B. Kelly (1996). "Association of Drosophila cysteine string
proteins with membranes." FEBS Lett 380(3): 251-6.
Vennekens, R., J. Olausson, M. Meissner, W. Bloch, I. Mathar, S. E. Philipp, F.
Schmitz, P. Weissgerber, B. Nilius, V. Flockerzi and M. Freichel (2007).
"Increased IgE-dependent mast cell activation and anaphylactic responses in
mice lacking the calcium-activated nonselective cation channel TRPM4." Nat
Immunol 8(3): 312-20.
Wang, C. C., C. P. Ng, L. Lu, V. Atlashkin, W. Zhang, L. F. Seet and W. Hong (2004).
"A role of VAMP8/endobrevin in regulated exocytosis of pancreatic acinar
cells." Dev Cell 7(3): 359-71.
Wang, C. C., H. Shi, K. Guo, C. P. Ng, J. Li, B. Q. Gan, H. Chien Liew, J. Leinonen,
H. Rajaniemi, Z. H. Zhou, Q. Zeng and W. Hong (2007). "VAMP8/endobrevin
as a general vesicular SNARE for regulated exocytosis of the exocrine
system." Mol Biol Cell 18(3): 1056-63.
Williams, J. A. (2001). "Intracellular signaling mechanisms activated by
cholecystokinin-regulating synthesis and secretion of digestive enzymes in
pancreatic acinar cells." Annu Rev Physiol 63: 77-97.

87
Williams, J. A. (2006). "Regulation of pancreatic acinar cell function." Curr Opin
Gastroenterol 22(5): 498-504.
Winnefeld, M., J. Rommelaere and C. Cziepluch (2004). "The human small
glutamine-rich TPR-containing protein is required for progress through cell
division." Exp Cell Res 293(1): 43-57.
Zerial, M. and H. McBride (2001). "Rab proteins as membrane organizers." Nat Rev
Mol Cell Biol 2(2): 107-17.
Zhang, H., W. L. Kelley, L. H. Chamberlain, R. D. Burgoyne and J. Lang (1999).
"Mutational analysis of cysteine-string protein function in insulin exocytosis." J
Cell Sci 112 ( Pt 9): 1345-51.
Zhang, H., W. L. Kelley, L. H. Chamberlain, R. D. Burgoyne, C. B. Wollheim and J.
Lang (1998). "Cysteine-string proteins regulate exocytosis of insulin
independent from transmembrane ion fluxes." FEBS Lett 437(3): 267-72.
Zinsmaier, K. E., K. K. Eberle, E. Buchner, N. Walter and S. Benzer (1994).
"Paralysis and early death in cysteine string protein mutants of Drosophila."
Science 263(5149): 977-80.
Zinsmaier, K. E., A. Hofbauer, G. Heimbeck, G. O. Pflugfelder, S. Buchner and E.
Buchner (1990). "A cysteine-string protein is expressed in retina and brain of
Drosophila." J Neurogenet 7(1): 15-29.

88
8. Acknowledgements
I would like to express my gratitude to Prof. Dr. Frank Schmitz for giving me the
opportunity to enter the scientific community and for his guidance, confidence and
patience.
I would like to thank Dr. Ivan Bogeski for his limitless support during my thesis work.
I am very grateful to Gabi Kiefer and Gerlinde Kühnreich for introducing me to the
details of the Electron Microscopy techniques. In addition, I would like to express my
gratitude to Venkat Giri Magupalli, Kannan Alpadi, Dr. Karin Schwarz, Jagadeesh
Venkatesian, Sivaraman Natarajan and Sylvia Brundaler for their friendship, advices
and help.
I wish to express my deepest gratitude to my family, especially to my wife Julija and
my late father Ilija, for the never-ending support.
Thank you all!

89
9. Curriculum Vitae
Name
Josif Mirceski
Date and place of birth
16.10.1979 in Prilep, Republic of Macedonia
Education
Doctorate in Medicine (Dr. med) (2005 to present)
Institute for Anatomy and Cell Biology, Dept. of Neuroanatomy, University of
Saarland, Germany
Masters in Medicine
Medical Faculty, Medical University Pleven, Bulgaria (1998- 2005)
Primary and secondary school
Prilep, Republic of Macedonia (1986-1998)
Research experience
MD thesis (2005 till present)
“Characterization of CSPalpha KO mice”- ultrastructural morphological investigation
of exocrine secretory glands of the digestive system
Prof. Dr. Frank Schmitz Dept. of Neuroanatomy Institute for Anatomy and Cell
Biology, University of Saarland (UdS), Homburg, Germany
German-Spanish collaborative research exchange program
Prof. Dr. Rafael Fernandez-Chacon, Department of Physiology, University of Seville,
Spain
Teaching experience
Tutor- Gross Anatomy course for the medical students at the University of Saarland
Tutor- Electron Microscopy techniques for the Graduate Program “Ca2+ signalling
and cellular nanodomains” at the University of Saarland
90
Professional experience
Physician training-Departments of Internal Medicine and Urology, General Hospital in
Prilep, Macedonia (2005)
Technical experience
Electron microscopy techniques- TEM and tomography
Light microscopy, Fluorescence and Confocal microscopy
Live cell imaging- Time lapse microscopy
Handling and surgery of laboratory animals
Electrophysiology (whole-cell patch clamping)
Basic molecular biology techniques