Characterization of deep weathering and nanoporosity ...
40
1 Characterization of deep weathering and nanoporosity development in shale – a neutron study Lixin Jin 1 *, Gernot Rother 2 , David R. Cole 2 , David Mildner 3 , Susan L. Brantley 1 1. Center for Environmental Kinetics Analysis, Earth and Environmental Systems Institute, Pennsylvania State University, State College, PA 16803, USA 2. Chemical Sciences Division, Oak Ridge National Laboratory, Oak Ridge, TN 37831, USA 3. NIST Center for Neutron Research, National Institute of Standards and Technology, Gaithersburg, MD 20899, USA * Corresponding author: [email protected] ; 814-865-9384; 503 Deike Building, Penn State University, State College, PA 16803. Abstract: The bedrock - regolith interface is characterized by critical changes in porosity, surface area, chemistry, and mineralogy. Here, we use a combination of small-angle and ultra small- angle neutron scattering (SANS/USANS), mineralogical, and geochemical observations to characterize the evolution of nanoscale features formed by weathering of the Rose Hill shale chips from within the Susquehanna/Shale Hills Observatory (SSHO). The SANS/USANS techniques, here referred to as neutron scattering (NS), can characterize connected and unconnected pores or fractures ranging from about 3 nm to several μm in dimension that develop as bedrock transforms into regolith. The primary pores interrogated by NS in unweathered Rose Hill bedrock are isolated, intraparticle pores that comprise ~5-6% of the total rock volume. As the bedrock fragments and alters, secondary pores grow. Porosity of carbonate-poor shale chips is relatively constant above the depth marked by dissolution of carbonate around 22 m but increases in the zone of feldspar weathering that begins at 6 m depth. In that upper zone, physical processes related to peri-glacial conditions at 15 ka have also increased the porosity. The regolith, defined as the zone that is accessible by hand augering, is generally 20 to 300 cm in depth in SSHO. Centimeters below the bedrock-regolith interface, chlorite and illite begin to dissolve significantly, leading to increased porosity and surface area. As clay dissolution proceeds in rock chips throughout the regolith zone, intraparticle pores progressively connect to form large interparticle pores, changing the mineral-pore interface from a mass fractal to a surface fractal. NS documents that the pore geometry is anisotropic at depth but becomes isotropic with intense weathering.
Transcript of Characterization of deep weathering and nanoporosity ...

1
Characterization of deep weathering and nanoporosity development in shale – a
neutron study
Lixin Jin1*, Gernot Rother2, David R. Cole2, David Mildner3, Susan L. Brantley1
1. Center for Environmental Kinetics Analysis, Earth and Environmental Systems Institute,
Pennsylvania State University, State College, PA 16803, USA
2. Chemical Sciences Division, Oak Ridge National Laboratory, Oak Ridge, TN 37831,
USA
3. NIST Center for Neutron Research, National Institute of Standards and Technology,
Gaithersburg, MD 20899, USA
* Corresponding author: [email protected]; 814-865-9384; 503 Deike Building, Penn State
University, State College, PA 16803.
Abstract: The bedrock - regolith interface is characterized by critical changes in porosity, surface
area, chemistry, and mineralogy. Here, we use a combination of small-angle and ultra small-
angle neutron scattering (SANS/USANS), mineralogical, and geochemical observations to
characterize the evolution of nanoscale features formed by weathering of the Rose Hill shale
chips from within the Susquehanna/Shale Hills Observatory (SSHO). The SANS/USANS
techniques, here referred to as neutron scattering (NS), can characterize connected and
unconnected pores or fractures ranging from about 3 nm to several μm in dimension that develop
as bedrock transforms into regolith. The primary pores interrogated by NS in unweathered Rose
Hill bedrock are isolated, intraparticle pores that comprise ~5-6% of the total rock volume. As
the bedrock fragments and alters, secondary pores grow. Porosity of carbonate-poor shale chips is
relatively constant above the depth marked by dissolution of carbonate around 22 m but increases
in the zone of feldspar weathering that begins at 6 m depth. In that upper zone, physical
processes related to peri-glacial conditions at 15 ka have also increased the porosity. The
regolith, defined as the zone that is accessible by hand augering, is generally 20 to 300 cm in
depth in SSHO. Centimeters below the bedrock-regolith interface, chlorite and illite begin to
dissolve significantly, leading to increased porosity and surface area. As clay dissolution
proceeds in rock chips throughout the regolith zone, intraparticle pores progressively connect to
form large interparticle pores, changing the mineral-pore interface from a mass fractal to a
surface fractal. NS documents that the pore geometry is anisotropic at depth but becomes
isotropic with intense weathering.

2
As clay minerals become more depleted, quartz surfaces are exposed, causing the total
mineral-pore interfacial area eventually to decrease and become smoother. Smoothening of
weathering surfaces could be also consistent with reactions occurring close to equilibrium, as
expected when transport limits chemical weathering. In the most weathered rock chips, kaolinite
and Fe oxyhydroxides have precipitated, possibly blocking some of the previously connected
porosity. All the NS and geochemical observations agree with a conceptual model where the
conversion of bedrock to regolith at SSHO is largely due to mineral dissolution reactions and the
advance is rate-limited by the rate of diffusion of reactants into the rock. To our knowledge this
is the first NS study to investigate the growth of nanopore features during rock weathering from
depths of tens of meters to the Earth’s surface, providing novel and important information about
the mechanics of weathering.
Key Words: SANS/USANS, regolith, porosity, fractal dimension, clay minerals, surface area

3
1. INTRODUCTION:
Regolith formation is controlled by the coupled physical, chemical and biological
processes that comprise weathering (e.g., Anderson, 2005; Dietrich and Perron, 2005; Schaetzl
and Anderson, 2005; Brantley et al., 2006; Fletcher et al., 2006; Anderson et al., 2007; Yoo et al.,
2009). Without these reactions, life on the continents would be limited by the lack of surface area
available for nutrient and energy processing (Brantley et al., 2006; Anderson et al., 2007; Graham
et al., 2010). Regolith development starts when water enters the bedrock through fractures,
eventually creating new surface area (Molnar et al., 2004; Fletcher et al., 2006). Fractures allow
reactive gases, water, and biota to penetrate the bedrock and promote biogeochemical weathering
reactions. As mineral dissolution and precipitation progress, porosity increases making bedrock
more vulnerable to further dissolution and disaggregation. The transition from bedrock to regolith
is thus comprised of an upward overall increase in physical surface area, porosity and chemical
alteration. Eventually, at the surface, regolith becomes so disaggregated and biologically
impacted that it is easily mobilized: this uppermost layer is referred to here as the mobile soil.
Despite the importance of understanding the processes by which bedrock disaggregates
and water-induced chemical and biogeochemical reactions turn bedrock into regolith, little is
known about the initiation and development of porosity during incipient weathering of bedrock
(Merino et al., 1993; Oguchi , 2004; Fletcher et al., 2006; Green et al., 2006; Brantley and White,
2009; Navarre-Sitchler et al., 2009; Rossi and Graham et al., 2010; Ma et al., 2010). One way to
study the advance rate of weathering into bedrock is to analyze weathering rind development on
clasts. In one well-studied rind system, Fe oxidation appears as the first weathering reaction
within basalt clasts in alluvial terraces of Costa Rica (Sak et al., 2004; Navarre-Sitchler et al.,
2009). This reaction is followed by dissolution of plagioclase that opens up porosity.
These same reactions, Fe oxidation followed by plagioclase dissolution, are shown to be
important in controlling the advance of the bedrock/saprolite interface in quartz diorite of Puerto
Rico (Fletcher et al., 2006). In that system, water enters the rock through relatively vertical joints
and fractures. Unlike the basalt clasts, however, concentric fractures form in both vertical and
horizontal 30-cm thick sets that disaggregate the bedrock into coherent onionskin-like rindlets.
These rindlets exhibit decreasing bulk density and an increase in microcrack density with
increasing distance from the unaltered corestone (Buss et al., 2008). Petrographic examination
indicates that iron oxidation in biotite, presumably accompanying its transformation to a K-
deficient and Fe(III)-enriched ‘altered biotite’ phase, occurs within the previously unaltered rock.
This reaction is inferred to be accompanied by a volume increase that induces the spheroidal
fracturing (Fletcher et al., 2006; Royne et al., 2008; Graham et al., 2010). However, this complex

4
interplay of fracturing and chemical reaction is also accompanied by biological activity: a
microbial ecosystem is growing at the bedrock-saprolite interface that may also be involved in Fe
oxidation at the bedrock-saprolite interface (Buss et al., 2005). Furthermore, mycorrhizal fungi
exude organic acids to form cylindrical pores of diameter 3-6 μm in rocks, presumably
contributing to transformation of bedrock to regolith in some localities (Jongmans et al., 1997;
van Breemen, 2000).
This production of regolith from bedrock at depth is paralleled at the surface by
production of a mobile soil layer within regolith. Researchers have suggested that the soil
production rate may either exhibit a hump function (increase and then decrease with soil depth) or
simply decrease exponentially with increasing soil thickness (e.g., Cox, 1980; Heimsath et al.,
1997; Minasny and McBratney, 1999; Ma et al., 2010). The decline in the rate of mobile soil
production with increasing soil depth could result strictly from chemical effects related to the
decrease in reactivity of infiltrating fluids as these fluids move closer towards chemical saturation
with depth (Jin et al., 2008; White et al., 2009). Alternately, the soil production function could
be dictated largely by physical processes. For example, fracturing by frost wedging occurs in
polar and alpine regions when water trapped in cracks expands upon freezing (Murton et al.,
2006; Matsuoka and Murton, 2008). Shear deformation and freeze-thaw cycling has been
hypothesized to decrease with depth as the range of soil temperatures decreases with depth.
Insolation may also induce fractures in densities that decrease with depth when the stress from
thermal gradients exceeds the tension limit in the upper layers of arid and semi-arid regions
(McFadden et al., 2005). However, biota are also implicated in the production of mobile soil,
such as animal burrowing, tree throw and root growth, although the extent to which biota
modulate sediment transport is largely unknown (e.g., Roering et al., 2001; Gabet et al., 2003).
Neutron Scattering:
Several methods have been employed to study the pores and interfacial features of
sedimentary rocks (Avnir et al., 1984; Wong et al., 1986; Krohn, 1988; Pernyeszi and Dekany,
1993; Smucker et al., 2007). The small-angle neutron scattering (SANS) and ultra small-angle
neutron scattering (USANS) techniques, here referred to as neutron scattering (NS), are suitable
for investigation of features ranging from about 3 nm to 10 μm in size. Extensive reviews are
available for the applications of NS techniques in rock studies (e.g., Radlinski, 2006; Agamalian,
2009). Early studies have focused on how surface area, porosity, and pore size distribution in
sedimentary rocks relate to production and transport of natural gases and oil (e.g., Radlinski et al.,

5
1999, 2004). In recent years, NS techniques have become powerful tools in other fields of
geology (e.g., Lucido et al., 1988; Kahle et al., 2004; Anovitz et al., 2009; Cole et al., 2009).
Neutrons easily penetrate bulk materials, probing the interior structure by scattering off
the interfaces and objects, when the phases differ in neutron coherent scattering length density
(SLD). Rocks can commonly be modeled as random two-phase systems comprised of pores and
mineral matrix, which have distinct and different SLDs (e.g., Radlinski, 2006). Furthermore,
hydrogen isotopes have contrasting neutron coherent scattering lengths; mixing different
proportions of H and D can produce water of different SLD, a property that can be effectively
used to probe accessible or connected versus total porosities. Specifically, the amount of
unconnected pores can be measured by matching the SLD of a D2O/H2O mixture to that of the
mineral matrix, so that all filled (connected) pores disappear from the scattering pattern.
In this study, we coupled previously published (Jin et al., 2010) and newly collected
chemical, mineralogical, and physical characterization data with neutron scattering observations
to investigate weathering profiles developed on grey shale. We hypothesized that chemical
reactions dominate in initiating the bedrock alteration and porosity development. We addressed
the following questions: 1) How does porosity evolve as a function of depth in the shale? 2) How
are changes in chemistry and porosity interrelated? 3) What is the mineral-water interfacial area
in the unaltered rock and how does it change with reaction progress? 4) Can the rock-pore
interface be described as a fractal system? 5) What proportions of pores are connected and thus
accessible for water-rock interaction? Since the focus of this study, the Rose Hill Formation, is a
relatively oxidized end-member shale composition and generally low in porosity, diffusion may
be the dominant mode of transport for reactants and products to and from the weathering interface
in the intact rock. Under conditions where diffusion dominates transport, small changes in
porosity will have a major influence on reactive surface areas and thus the chemical reaction
kinetics. In this communication, we report analyses of rock fragment chips in samples derived
from depths ranging from 10 cm (in regolith) to 22 m (in bedrock).
Geological Setting:
Our study site is the Susquehanna/Shale Hills Observatory (SSHO), a Critical Zone
Observatory located in central Pennsylvania (Fig. 1A). The SSHO is underlain by the Rose Hill
Formation of the Clinton Group; olive-pink, grayish-buff shales with a few interbedded
limestones (Folk, 1960; Lynch and Corbett, 1985). The Rose Hill Formation is locally
characterized by fracture cleavage that has produced pencil-like fragments up to 30 cm long
(Flueckinger, 1969). The geologic structure in the region is characterized by tight plunging folds

6
in Silurian-aged strata where strike and dip measured on a bedrock outcrop along the valley floor
in the catchment are N54oE and 76oNW, respectively. However, borehole televiewer studies near
the entrance of the catchment indicate more gentle dips of approximately 25o, consistent with
folding and faulting underlying the small watershed
This V-shaped SSHO catchment has south-facing and north-facing slopes averaging 23 o
and 28o, respectively. The erosion rate averaged over the entire catchment is estimated to be 15
m/million years based on meteoric cosmogenic nuclide 10Be dating of sediments while the
regolith production rates (= weathering advance rates) decrease with increasing soil thickness
from 10 to 40 m/million years based on U-series isotope analysis of soils along the north-facing
slope (Jin et al., 2010; Ma et al., 2010). Chemical weathering at SSHO was investigated by
comparing bulk chemistry and mineralogy in profiles drilled into Rose Hill shale bedrock
(recovered from a 25-m drill core) and augered into soils (Jin et al., 2010).
Here, we describe the progression from relatively unfractured and chemically unaltered
parent rock (“bedrock”) to intact and in-place rock that is somewhat fractured and altered
(“saprock”) to rock which is disaggregated and highly altered (“regolith”). In addition, on sloped
terrain, we use the term “soil” to refer to the layer of regolith that moves downslope.
Operationally in this location using these definitions, bedrock and saprock must be drilled with a
diamond bit or something similar using gasoline or electrical power. In contrast, regolith and soil
can be augered by hand. The deepest boundary of saprock is defined here as the interface where
elemental or mineralogical analysis delineates the occurrence of the first chemical weathering
reaction; the deepest boundary of soil is defined by textural observations that document lateral
grain movement. Regolith thickness varies from 30 cm at the northern ridgetop where a deep core
was drilled, to more than 3 m in some locations at the valley floor (Lin and Zhou, 2007; Jin et al.,
2010).
Variations in Rose Hill shale composition and the structural complexities make it difficult
to distinguish local heterogeneities in shale layers from reaction zones due to weathering.
Nonetheless, two weathering fronts have been hypothesized from observations of the core drilled
at the northern ridge; the deepest inferred reactive interface (or “reaction front”) involves
ankeritic carbonate dissolution at about 22 m below ground surface at the ridge. The next
shallower reaction front is defined by plagioclase feldspar dissolution which begins at about 5 m
below ground surface at the ridge top (Fig. 1B; Jin et al., 2010). At this latter depth, a decrease in
the bulk density of rock chips recovered from drilling was also observed. In the drilled cores
where ankerite is absent, X-ray diffraction (XRD) data and scanning electron microscope (SEM)
images show that shale is comprised of illite (54 wt%), quartz (34 wt%) and “chlorite” (9 wt%),

7
with a few percent feldspar and Fe-oxides (Jin et al., 2010). Here, “chlorite” indicates a
‘vermiculited’ chlorite, with XRD peaks at values of 2� equal to about 14o.
In contrast to carbonate and feldspar dissolution, clay dissolution has only been
documented within regolith (Fig. 1B). The dominant weathering reactions in the regolith were
determined to be the dissolution of “chlorite” and illite accompanied by precipitation of kaolinite
and Fe-oxyhydroxide, with vermiculite and hydroxy-interlayed vermiculite as intermediate
phases. The abundance of the secondary phases kaolinite and Fe-oxyhydroxide generally
increased upward in soils. These mineral transformations in the regolith are consistent with the
observed losses of major cations (Al, Fe, Mg, K, Si) and are accompanied by decreases in bulk
density (Jin et al., 2010).
2. METHODS
Neutron scattering experiments were conducted on shale chips that were recovered from
two ridgetop regolith profiles and from one 25-m core drilled at the northern ridgetop (Fig. 1A;
Table 1). Five samples were taken from the drill core (DC1) of Rose Hill shale (DC40, DC160,
DC540, DC620, and DC1990, where the number refers to depth below land surface in cm). Of
these five, DC40 and DC160 lie above the weathering zone of plagioclase dissolution whereas
DC540, DC620 and DC1990 lie beneath that zone but above the zone of carbonate dissolution.
Seven chips from two regolith profiles (SSRT5, SSRT15, SSRT22, SSRT27; and SPRT5,
SPRT15, SPRT25; numbers refer to depth below land surface in cm) represent shale rock
fragments in the zone where clays are weathering. These two profiles were sampled by hand
augering to refusal at two ridge top positions in the southern side of the Shale Hills catchment,
one at the top of a planar hillslope (SPRT, initials refer to south planar ridge top) and the other at
the top of a hillslope characterized by a swale (SSRT, initials refer to south swale ridge top). At
these ridge top sites, soils are developed in-situ from shale with insignificant addition of new
material from upslope (along the ridge). Furthermore, at these sites water flows mostly vertically;
therefore, shallow soils have experienced longer and more intense chemical weathering than the
deeper soils (Fig. 1B). The two ridge profiles examined in this study were less than 20 m apart
and exhibited similar physical properties and soil thickness (Fig. 1A).
To calculate the SLD of the mineral matrix, chemical composition and grain density were
measured. Grain densities of shale chips from drilled bedrock and from soils were previously
determined by pycnometer (~ 2.62 g/cm3) (Jin et al., 2010). Chemistries of the drill core and
regolith chips, including those used for this study were also previously reported (Jin et al., 2010).

8
Total Fe content of soils was determined by lithium metaborate fusion and inductively coupled
plasma atomic emission spectroscopy (ICP-AES) at the Material Characterization Laboratory of
Pennsylvania State University, and the ferrous Fe was titrated following Goldich (1984). A US
Geological Survey reference material (SCo-1, Cody Shale) was run as a standard. Repetitive
analyses show that ferrous Fe titration on shales is accurate to within ±3%. The carbon content
was estimated from published loss on ignition data, assuming CH2O stoichiometry (Stevenson
and Cole, 1999; Tan, 2003; Jin et al., 2010).
Because H has a significantly different coherent scattering amplitude from other
elements, H content in shale chips was quantified using the NG7 Prompt Gamma Activation
Analysis (PGAA) spectrometer at the National Institute of Standards and Technology (NIST)
Center for Neutron Research (NCNR) (Failey et al., 1979). The formula of an ‘artificial’
compound was then created with the stoichiometry determined from the chemistry of major
elements for all samples. The SLD of the mineral matrix in each sample was then calculated
from the chemical sum formula and grain density using the NIST SLD calculator
(http://www.ncnr.nist.gov/resources/sldcalc.html).
The chips, recovered from drilled or augered cores, were slightly elongated with
dimensions on the order of about 10 cm x 5 cm on the bedding plane, and 5 cm in thickness. To
prepare samples for scattering, the chips were dried at room temperature and cut parallel to the
bedding. Thin sections were commercially prepared and put on quartz slides, because standard
boron-containing glass slides absorb neutrons. The samples were uniformly cut to be 150 μm
thick to prevent multiple scattering (Anovitz et al., 2009). Thus, the data we collected represents
the single-scattering cross section.
The principles of neutron scattering are discussed in the literature (e.g., Guinier and
Forner, 1955) and are only briefly summarized here. A neutron beam propagates into a sample,
where it is elastically scattered. Detectors measure the scattering intensity I(Q) in units of cm-1,
as a function of the scattering angle, which is defined as the deviation from the incident beam.
The scattering vector Q in units of Å-1, is related to scattering angle 2� by Q = (4�/�) sin�, where
� is the wavelength of the neutron beam. Thus, the size range of features accessible with SANS
and USANS is dependent on the neutron wavelength � and the range in scattering angle 2�. 2�
generally ranges from 4´ to 10° for SANS and 6¨ to 5´ for USANS.
In rocks, coherent scattering within a given Q-range is dominantly contributed by objects
whose size or spacing is on the order of 2�/Q (Bragg, 1913). The contribution from hydrocarbons
to the overall scattering is assumed to be minimal, because scattering density is almost zero for
hydrocarbon and the contrast between mineral-hydrocarbon is approximately the same as that of

9
mineral-pore (Hall et al., 1983). Therefore, most scattering in rocks is due to mineral-pore
interfaces, regardless of whether the pores are filled with hydrocarbons or air.
Neutron scattering experiments were carried out at NCNR, and instrumentation details
are given on the NCNR website (http://www.ncnr.nist.gov/instruments/). Apertures of different
sizes in a Cd mask were used to define the illuminated sample area. Measurements were made on
the NG7 30-m SANS beamline with an incident neutron wavelength of 8.09 Å and sample-
detector distances of 1m, 4m and15.3m. By using confocal MgF2 lenses at the long sample-
detector distance and a horizontal detector offset at the short sample-detector distance, these
positions covered a large Q-range from 0.0008 Å-1 to 0.7 Å-1 (Glinka et al., 1998). This range
corresponds to length scales between 10 Å and 0.8 μm. Two-dimensional scattering intensity data
were collected for each sample and corrected for empty beam scattering, background counts
(using a blocked beam and empty quartz slide), and detector uniformity. The scattering intensity
data were reduced to an absolute scale by normalization to the flux of the empty neutron beam.
The two-dimensional SANS data were also circularly averaged to produce one-dimensional
intensity profiles.
The BT5 USANS covers a Q-range from 0.00003 Å-1 to ~ 0.002 Å-1, corresponding to
scattering due to features of length or spacing between 0.06 and 20 μm (Barker et al., 2005). A
fixed Cd mask in front of the sample ensured that the same sample areas were measured on
SANS and USANS. The duration of NS measurement per sample was based on the count rates of
the samples. Scattering data were corrected for empty cell scattering, neutron background, and
normalized to the sample transmission. SANS and USANS raw data were reduced and
normalized (including the deconvolution of the USANS data by desmearing for slit-height
corrections) using NCNR data reduction software (Kline, 2006) and IGOR Pro.
To determine the fraction of pores (or cracks) that are connected, we carried out
SANS/USANS measurements on one set of samples that was measured first dry, and then
subsequently saturated with a D2O-H2O mixture of identical SLD to that of the mineral matrix
(mass ratio of H2O:D2O = 64%:36%). The difference observed in scattering intensities between
the dry and wet samples is caused by the disappearance of NS from connected pores. To
accomplish this, a select number of representative thin sections used for previous porosity
measurements were soaked in acetone for two days, which yielded samples completely detached
from the quartz slides. Each sample was then put on top of a quartz slide, which was encased by
gluing another quartz slide with a rubber gasket (1.66 mm thick) in between. The specially mixed
D2O - H2O solution was then injected into the quartz slide ‘sandwich’ through the gasket with a
syringe and a needle. Samples were soaked in the D2O-H2O solution for one week to ensure

10
complete pore filling of the mixture, and measured on SANS/USANS under the same conditions
as the dry samples.
Scanning electron microscopy (SEM) and transmission electron microscopy (TEM) were
used to image shales that have been weathered to different degrees, to check the interfacial
features at different spatial scales. The samples used for SEM were the same thin sections used
for SANS/USANS experiments. Images were taken for SSRT5 and SSRT27 on an environmental
SEM (FEI Quanta 200) in the Materials Characterization Laboratory at the Pennsylvania State
University. These samples were also analyzed under TEM. To make the TEM sections, a thin
slice was cut from a bulk piece of shale, glued to a 3mm copper ring, then dimpled and argon-ion
milled using a Gatan Precision Ion Polishing system at 5kV and 7° incidence angle, until
perforation. The electron transparent foil was coated with about 2nm of carbon by evaporation,
prior to examination in a Hitachi HF-3300 cold field-emission TEM at the Oak Ridge National
Laboratory, operated at 300kV. The thin carbon film stabilized the foil against charging from the
incident electron beam. Energy dispersive x-ray spectra were acquired on the TEM using a
ThermoNoran EDS system.
3. RESULTS
Scattering curves:
The raw scattering intensities for all samples are reported in Supplement Table 1.
USANS and SANS data overlap for a couple of data points in each sample and are well
connected when plotted as I(Q) versus Q (e.g., DC160 in Fig. 2). Such overlap is indicative of
high quality data for both instruments. In the high-Q region of the SANS data, scattering
intensities level off and remain constant at the incoherent scattering background level.
Overall, the absolute scattering intensities for shale chips from the shallow soils are
greater than those for samples from deeper soils and from bedrock, especially at ultra small-
angles (Fig. 3): scattering intensity increases as weathering progresses. Furthermore, the samples
from relatively shallow depths of the drilled core (DC40, DC160) scattered neutrons more
intensively than the deeper samples (DC540, DC620, DC1990) over the entire Q-range (Fig. 3A).
In the low-Q range, shale chips from shallow soil depths also scattered neutrons more strongly
than those from deeper depths (Figs. 3B and 3C). However, no such trend was observed in the
high-Q range.

11
For all samples, the scattering intensity varies with the scattering vector according to a
power law relationship (straight lines on log-log plots) after correcting the background at high Q
for the incoherent scattering (resulting mostly from hydrogen in the sample) (Fig. 3):
(1)
Here, the slope gives the Porod exponent n, A is a proportionality constant, and B represents the
contribution from incoherent scattering. The normalized scattering curves from the individual
samples were fit to this equation, yielding slopes (n values) provided in Table 1 and plotted in
Figure 4A. The deepest samples from the two soil profiles and from the bedrock have slopes
between 3 and 2. In contrast, the chips from shallow soils have slopes between 4 (indicating a
smooth pore surface) and 3.
Nano-porosity:
Scattering intensities depend on the density of the interfacial features within the thin
sections. We interpret the scattering data quantitatively and calculate nano-porosity (P) by using a
random two-phase approximation (mineral matrix-pore space) (Porod, 1952):
(2)
Here, Z is the scattering invariant, calculated by integrating the term Q2 I(Q) over the measured
Q-range; SLD (the scattering contrast) is the scattering length density of the mineral matrix (= 0
for empty pores). Porosity measured by neutron scattering using equation (2) has been shown to
be in general agreement with that measured by gas adsorption methods (Hall et al., 1983),
especially when measured over a wide Q-range, as in this study. The SLD values and the
corresponding porosities are reported in Table 1.
The shale samples from beneath the bedrock-regolith interface comprise two distinct
groups: a shallow group (< 5 m) with porosity as high as 9.3%, and a deeper group (> 5 m) with
an average porosity ~5-6% (Fig. 4B). Interestingly, this increase in porosity continues in chips
from above the bedrock-regolith interface upwards to the ground surface in the soil profiles:
porosity equals about 8% at 30 cm and 14-16% at 10 cm.
The software program PRINSAS has been developed to analyze scattering data on
sedimentary rock systems (Hinde, 2004; Radlinski, 2006). Scattering data were analyzed in
PRINSAS to derive Porod exponent and porosity values that were compared to our calculations
(Table 1). The Porod exponents from the calculations are in good agreement (± 2%) with our
calculation. However, the porosity values obtained from PRINSAS were systematically lower

12
than our values. This may be due to a larger value of the incoherent scattering background
assumed in PRINSAS than what was used by our calculation.
Surface area:
PRINSAS was used to calculate specific surface area (SSA). SSA varied significantly
with depth (Fig. 4C). The least weathered shale chips (DC540, DC620, DC1990) have low SSA
between 30-60 m2/g, well within the range of surface areas determined by gas absorption methods
for typical shales from depths of 500-3500 m (Radlinski et al., 1999). As weathering progresses,
SSA of the shale chips increases gradually to 100 m2/g (DC40 and DC160) and eventually
reaches 300 m2/g at 30 cm below the land surface (SSRT27, SPRT25). SSA of the chips then
decreases back to 40 m2/g at 10 cm and 20 cm (SSRT5 and SPRT5), although the porosity
continues to increase in these samples. The specific surface area of typical soils, measured on
another SSHO soil core by nitrogen adsorption and the Brunauer-Emmett-Teller (BET) isotherm
(Gregg and Sing, 1967), equals 22-30 m2/g (Jin et al., 2010).
Anisotropy:
Although the thin sections were cut parallel to bedding, the shales exhibited elliptical
scattering spectra in SANS (Fig. 5B). Interestingly, anisotropy is observed in all but the most
weathered shallow samples (SSRT5 and SPRT5; Fig. 5A). This indicates that the pores in the
shale have a preferred orientation. All the chips are elongated in a direction perpendicular to the
short axis in SANS spectra, indicating that the long axes of such pores are aligned with the long
axes of the shale chips.
Connectivity:
Samples soaked in the D2O-H2O mixture had a much higher incoherent scattering
background than the dry samples (because of the increased hydrogen incoherent scattering),
making data at high Q difficult to interpret. Thus, we focused on USANS data and only the low-Q
range of SANS data where the background was low (< 0.01 Å-1). The I(Q) curves of four samples
before and after the contrast-matching experiments are presented in Figure 6. The scattering
curves for the least weathered bedrock sample analyzed with contrast matching (DC620) are
almost identical before and after soaking in the D2O-H2O mixture, indicating that none of the
pores in the measured size range are connected (Fig. 6A). In contrast, the slightly weathered shale
bedrock chip (DC40) and more weathered soil chip (SSRT27) had some connected porosity at all
measured Q values (Figs. 6B, C). Then, in a reverse, for the most intensively weathered shale

13
analyzed with contrast matching (SSRT5), pores were only connected in the smaller Q range,
suggesting most of the smaller pores are closed (Fig. 6D).
The extent of pore connectivity was evaluated quantitatively by comparing calculated
porosities for dry and soaked samples for Q values within the range 0.00003 < Q < 0.01 Å-1
(Table 2, Fig. 6E). Because of the narrower Q range due to high incoherent background in the
contrast matching experiments, the porosity summarized here is lower than that calculated over
the full experimental range (Table 1). Regardless, total porosity increases with more weathering.
Consistent with I(Q) curves, the largest connected porosity is observed in SSRT5 (5.0%),
followed by SSRT27 (4.1%), DC40 (2.5%) and DC620 (0%). The unconnected porosities are
noticeably constant for the relatively unweathered samples (around 2%). Intriguingly, however,
more unconnected pores were observed in the chip derived from the shallowest soil, SSRT5, than
in the deeper drilled samples. Figure 6E emphasizes this point: i.e., unconnected porosity
decreased with weathering only until the very surface chip, while connected porosity increased
with weathering in all chips.
Ferrous and total iron:
The total iron contents of drilled core sediments were around 5.5 wt%, slightly higher
than those observed in the soils (Table 3; Fig. 4D). The ferrous iron, however, showed more
variations with depth: Fe (II) equaled �4 wt% 22 m below ground surface, decreased with
removal of ankerite, and then remained relatively constant at shallower depths (Fig. 4D).
SEM and TEM images:
SEM photomicrographs of the clays in less weathered shale (SSRT27) surround quartz
grains (Fig. 7A). In contrast, pore structures in the most weathered sample, SSRT5, clearly show
that loss of clays (e.g., illite) has produced large pores situated between the clay that remains and
the chemically resistant quartz (Figs. 7A, B). The high porosity observed in the weathered
samples is thus attributed to loss of clays. TEM photomicrographs show similar features but at
much higher magnifications (Figs. 7C, D). For example, the open space in SSRT27 is mostly
observed within the clay grains (Fig. 7C), whereas many pores surround the quartz in the
intensively weathered sample (Fig. D). In SSRT5, the quartz surfaces are smoother than those of
the clays.
4. DISCUSSION

14
Reaction fronts:
Rose Hill shale contains predominantly clay minerals (� 54 wt.% illite and � 9 wt.%
“chlorite”) and quartz (34 wt.%) with some feldspar and Fe-oxide. The shale also contains highly
variable amounts of minor carbonate present as the mineral ankerite. However, our geochemical
and mineralogical analysis of the drill core from Shale Hills showed that ankerite is not present --
most likely lost to leaching – at depths > 22 m below the land surface (Jin et al., 2010). This
hypothesized loss of ankerite was also demarcated by a decrease in ferrous iron content in the DC
sediments (Fig. 4D). The reaction front, or depth interval over which ankerite varies and is
therefore considered to be dissolving, lies between 22 and 24 m depth. While we cannot disprove
the alternate interpretation that the variation in Fe, Mg, and Ca concentrations over this interval
could be caused by local variations in carbonate content in the original shale, this latter
interpretation is deemed less likely given that we have also observed similar chemistry versus
depth at other locations in the watershed, albeit at different depths (unpub. data). Furthermore, if
the chemistry change at 22 m depth were due to stratigraphic change instead of chemical reaction,
we would have expected a change in the total Fe content of the drill core. Instead, total Fe
remained constant but ferrous Fe varied with depth, as expected for a reaction front involving Fe
oxidation during ankerite dissolution (Fig. 4D). Based on these interpretations, samples used for
this study represent Rose Hill shale that was weathered to different degrees, but completely
depleted with respect to carbonates in every case (Fig. 1B).
A second reaction front was also inferred from the rock chemistry and chip density. The
chips from drill core from deeper than ~5-6 m represent shale bedrock that has not yet been
depleted in Na and Ca. At all shallower depths, the bedrock is inferred to have lost plagioclase
feldspar to dissolution, accompanied by a decrease of chip density (Jin et al., 2010; Fig. 1B).
Depletion of plagioclase appears to continue from this depth up into the regolith.
Clay mineral reactions, documented to be occurring only within the regolith, involve both
dissolution of “chlorite” and illite: these phases transform further to vermiculite and hydroxyl-
interlayered vermiculite which break down to form more stable kaolinite and Fe-oxyhydroxide
(Jin et al., 2010). The secondary kaolinite and Fe-oxyhydroxides, present in higher abundance at
shallow depths of the regolith, are also known to be lost as particles greater than 1.3 μm in size
(Jin et al., 2010). Chips from the soil profiles are more weathered than drill core samples, with
those sampled from 10 cm below the ground surface the most intensively altered. SEM and TEM
photomicrographs imaged on chips from 10 cm depth in the soil show the large amounts of void
space left by loss of illite and chlorite (Figs. 7B, D).

15
Fractal dimensions and interfacial features:
The power law correlation between scattering intensity and scattering vector indicates
Porod behavior of the pore-particle interface over certain Q ranges (Fig. 3; Radlinski, 2006). The
slope of the linear portion of the log I vs. log Q plots reveal the scale invariance or fractal
behavior of the distributions of scattering objects (Wong et al., 1986). Porod exponents between 3
and 4 indicate scattering from a surface fractal at the respective length scale. A value of 3 is
consistent with a very rough surface whereas a value of 4 denotes a perfectly smooth surface. In
contrast, exponents between 3 and 2 indicate mass fractality (Mildner and Hall, 1986; Mildner et
al., 1986; Radlinski, 2006). Previous studies have demonstrated that some fresh rocks
(sedimentary rocks: sandstones, shales, carbonates; igneous rocks: basalts and granites) are fractal
over several orders of magnitude in size or spacing of scatterers (e.g., Mildner et al., 1986;
Aharonov and Rothman, 1996; Radlinski et al., 1999; Navarre-Sitchler et al., 2010).
Among the minerals present in SSHO shales, clay minerals have much higher surface
area per gram than quartz and feldspar. Therefore, the surface area of shale is dominated by clays.
Neutrons mainly scatter at clay-pore interfaces, hence, pore features observed by neutron
scattering dominantly reflect these interfaces. Clay minerals are therefore inferred to be the most
likely source of the fractal behavior (Wong et al., 1986). Laboratory measurements and computer
simulations have illustrated that the fractal dimensions at pore-grain interfaces of sedimentary
rocks depend on interfacial features related to dissolution and precipitation (Aharonov and
Rothman, 1996). Specifically, the fractal dimension was shown to increase with an increase in
diagenetic alteration and with higher percentages of cementing materials infilling pore space
(Thompson, 1991).
From our NS experiments, we conclude that fractality is also a common characteristic of
weathered shale samples and that fractal dimensions change as a result of dissolution of clay
minerals in the weathering environment. All the drilled core samples we have analyzed where
only feldspar was dissolving show mass fractal behavior. The shift from mass fractals to surface
fractals is not observed until about 15 cm deep, well above the bottom of the clay-weathering
front (i.e. the depth where significant clay reactions initiate). With more clay dissolution, the
mineral-pore interface becomes smoother (Fig. 4A), presumably due to exposure of smooth
quartz surfaces. This depth also coincides with precipitation of kaolinite and Fe-oxyhydroxides
(Jin et al., 2010). Thus the infiltrating fluids are presumed to be at equilibrium with those phases
at those depths, perhaps consistent with more smooth mineral surfaces (White and Brantley,
2003).

16
Interestingly, although the slopes of the scattering curves change with weathering, there
is no break in slope for any given shale sample. In contrast, our recent observations on weathering
samples of crystalline granitic and basaltic rocks documented breaks in slope in the log I versus
log Q curves (Navarre-Sitchler et al., 2010). In that work, the break in slope delineated two
populations of scatterers: pores and bumps on surfaces. We argued that pores were generally
situated at grain boundaries or triple junctions; therefore, the pore spacing was dictated by the
grain size of the rock. Scattering at low Q occurred from micron-spaced pores, while scattering at
high Q originated from submicron-sized bumps. Extrapolating from that study to this one, the
lack of a break in slope in the shale plots may be because pores and bumps on surfaces are
equivalent in shale since particles in shales are themselves micron- to submicron-sized.
The anisotropy of pores:
It is commonly observed that porosity in shales is anisotropic, with pores compressed in
the direction perpendicular to the bedding, but symmetric within the bedding plane (Hall et al.,
1983; Mildner, 1986; Allen, 1991). Neutron scattering and SEM micrographs of Rose Hill
bedrock show that, even within the bedding, the pores are preferentially oriented (Figs. 5B, 7A).
It is possible that these preferentially oriented and anisotropic pores may be related to the pencil
cleavage that developed in the Rose Hill Formation associated with the formation of the Valley
and Ridge province of Appalachian Mountains (Flueckinger, 1969). We also observed that the
long axes of the pores coincide with the long axes of the rock chips. It is thus possible that the
elongated rock fragments may form because of the prior formation of anisotropic pores which in
turn may be related to the pencil cleavage.
Most of the water flowing through the unaltered bedrock probably follows bedding,
pencil cleavage, or fractures. Along the rock-water interface at depth, first carbonates and then
feldspars dissolve, contributing to growth of pre-existing cylindrical pores or creating new pores.
Throughout the bedrock and regolith, the pores remain relatively anisotropic. The eccentricity of
pores decreases with extent of weathering. Eventually, pores become nearly isotropic in the most
weathered shale chips recovered from the shallowest soil (SSRT5 and SSRT27 at10 cm below
surface). Pore anisotropy is lost only when clay minerals disappear to a significant extent and the
mineralogy becomes dominated by quartz (Fig. 5).
Variation in porosity and surface area as weathering progresses:
The observed shifts from mass to surface fractal and from rough to smooth surface with
increasing intensity of weathering are accompanied by changes in porosity and specific surface
17
area (SSA) (Figs. 4B, C). The porosity that can be measured with NS in the Rose Hill bedrock is
about 5-6 %, and most of this is unconnected and thus inaccessible to water (Fig. 6E). The NS
measurements reported here were all completed on chips collected above the hypothesized
carbonate weathering front in the drilled core (Figs. 1B, 4D; Jin et al., 2010). Thus, if this
carbonate concentration-depth dependence is indeed a weathering reaction front, then the
carbonate that was dissolved out of the bedrock above 22 m was presumably originally present
only in layers or zones between carbonate-free layers or zones. The chips studied with NS
presumably derive from the noncarbonate-containing layers and zones.
The porosity remains unchanged in drill core chips collected 5 m below ground. It then
increases towards surface and reaches ~9% at about 1 m. Of this, 4% is considered secondary and
5% primary porosity. Secondary pores are partly connected (Fig. 6E). The most consistent
interpretation of these data is that a zone with a high density of fractures or pores has formed in
the uppermost 5 m beneath the land surface. This interpretation is consistent with the depth
distribution of shale chip densities that show large variation in the uppermost 5-6 m (Jin et al.,
2010). It is highly likely that the loss of Na and Ca in plagioclase in this zone either caused new
fractures or pores or was caused by the emplacement of fractures and pores that decreased the
chip bulk density (Jin et al., 2010).
If plagioclase dissolution postdated the growth of such porosity, it is possible that the
higher porosity was caused by physical disaggregation associated with annual freeze - thaw
cycles. Such processes could be ongoing today, but could also have been particularly intense
during periglacial climate conditions at approximately 15 ky ago (Gardner et al., 1991). Rock
fractures are known to originate from ice-segregation and frost wedging (Murton et al., 2006;
Matsuoka and Murton, 2008). This process may be especially important in periglacial climates,
where daily air temperatures fluctuate above and below the freezing point. The SSA in chips
derived from 1-4 m depth in this saprock zone is also much higher than that of the underlying
bedrock, reaching up to 120 m2/g (Fig. 4C). Again, it is likely that this higher surface area is
related to new fractures or pores as well as the weathering of feldspar. The importance of
feldspar dissolution as a major reaction associated with the conversion of bedrock to saprock
while creating porosity and surface area has been noted in other weathering systems (Brantley
and White, 2009; Navarre-Sitchler et al., 2010).
The mineral reaction that is most closely associated with the disaggregation of saprock
and formation of regolith is clay dissolution. Significant clay reactions begin centimeters below
the saprock-regolith interface (Jin et al., 2010). These reactions contribute to the growth in
porosity to 16% as observed in shale chips from 10 cm depth. Eventually, with further

18
weathering, the fractal dimension shifts above 3 (Fig. 4A). The two soil profiles are similar in
porosity and fractal dimension, suggesting that our observations may be representative of ridge
sites (Fig. 4).
Of the total porosity in samples from shallow depths, half is contributed by unconnected
pores while the other half is connected. However, more unconnected pores were observed in
chips recovered from 10 cm depth than existed as primary pores in the bedrock. Contrast
matching experiments also suggested that most of the smaller pores are unconnected (Fig. 6).
These unconnected pores cannot be produced by dissolution, since water by definition is not
flowing through unconnected pores. The formation of secondary phases such as kaolinite in chips
in the soils could trap unconnected pores, limiting accessibility to water. Mineralogical studies
have documented greater abundances of kaolinite and Fe-oxyhydroxides in shallower soils (Jin et
al., 2010). Alternatively, freeze-melt cycles could also have formed unconnected stress-induced
fractures or pores given the large seasonal fluctuations of soil temperature at 10 cm.
Shale chips in the shallow soils have lower SSA values than medium depth soil chips:
this SSA is comparable to that of bedrock (Fig. 4C). Two processes could potentially lead to the
loss of surface area, even as porosity increases: 1) smaller pores connect to produce larger pores
by dissolving the mineral walls between them; and 2) bumps on surfaces of pores dissolve away.
Either process smoothes the internal surface of the rock, and explains the increase in fractal
dimension from about 3 to 4 over the same interval that the porosity begins to decrease. Both
processes could be occurring due to dissolution of primary chlorite and illite to leave smoother
quartz grains (Fig. 7).
Conceptual models for pore development and shale weathering:
Allen (1991) categorized the pores within shales into three types based on their size and
fractal behaviors (Fig. 8). Type I consists of interlayer pores that lie between stacked clay layers.
These interlayer pores are characterized by diameters of only Ångstroms, and are thus not
detectable by SANS/USANS. Type II porosity is comprised of intraparticle pores that define a
three-dimensional network within the clay grains and that exhibit mass fractals. The fine clay
structure of type II pores contributes to the larger, interparticle pores of type III, which exhibit
surface fractals. Thus, the scattering features in Rose Hill shale associated with unweathered or
only slightly weathered samples (DC40, DC160, DC540, DC620, DC1990, SSRT27 and
SPRT25) are probably dominated by type II pores. The distribution of their size or separation is
best described as a mass fractal. As weathering intensifies, the shale chips develop pores that are
19
best described by a surface fractal with smoother grain-pore interfaces (Fig. 4B). Such
interparticle pores (type III) are also documented by SEM and TEM imaging (Figs. 7B, D).
In summarizing these observations, we propose the following sequence for generation of
porosity and change in specific surface area above the carbonate reaction front (Fig. 9). Within
the bedrock, pores are intraparticle, unconnected and anisotropic, and they are characterized as
mass fractals (Fig. 9A). It is very possible that these pores are related to the pencil cleavage that
characterizes this rock since many shales do not have anisotropic porosity.
At about ~ 6 m below land surface, feldspar dissolution initiates, leading to creation of
connected anisotropic pores and increased water-accessible mineral surface area. Porosity
increases throughout this zone and within centimeters of the bedrock-regolith interface, the
chemistry of the rock chips document significant clay dissolution reactions. At this point, the
porosity still comprises a mass fractal, albeit with a fractal dimension close to 3. As clay grains
dissolve and intraparticle pores connect to produce interparticle pores, the porosity transforms to
a surface fractal (Figs. 7B, 9B, 9D). The fractal dimension of 3-3.2 is consistent with a mineral-
pore interface that is bumpy. This nm to μm-scale roughness is presumably controlled by surface
features such as the density of etch pits at defects, steps, and grain boundary outcrops on the
dissolving surface. Further loss of clay minerals and exposure of quartz, however, lead to further
increases in porosity, a higher fractal dimension, and a decrease in pore anisotropy. Kaolinite and
Fe-oxyhydroxide also precipitate in the shallower soils (~ 10 cm below ground). Eventually a
lower surface area develops in the top-most samples as small pores are connected to form large
pores, pore surface bumps are dissolved away, or secondary mineral precipitates smooth over
bumps. The latter process is also the likely explanation for how some unconnected pores are
created in the shallowest sample (Fig. 9C).
Chemical processes driving shale weathering and soil formation at Shale Hills
At Shale Hills, physical, biological and chemical reactions could all contribute to the
transformation of bedrock to regolith (Fig. 9D). However, it is also possible that the bedrock
alters to regolith predominantly due to chemical reactions. For example, the changes in chemistry
and porosity between bedrock and weathered saprock were observed at 22 m below land surface,
well below the point where the rock temperature fluctuates significantly on a daily or seasonal
basis. Furthermore, roots are only rarely present at such depths (e.g., Idso and Kimball, 1991).
Thus, the advance of the bedrock-saprock interface is most likely largely due to dissolution of the
reactive carbonate mineral ankerite.

20
Dissolution of trace amounts of calcite has also been shown to be critical in initiating soil
formation on granites (White et al., 2005). Another reaction that is commonly observed to
influence the initiation of rock weathering in other systems is volume expansion during oxidative
weathering of ferrous phyllosilicates in weathering granites (Fletcher et al., 2006; Buss et al.
2008). Likewise, the ankerite dissolution front in the Rose Hill shale is the depth interval where
Fe(II) in the ankerite is oxidized to Fe(III) (Figs. 9D, 4D). Thus, both acids and oxidants are
important reactants at the bedrock-saprock interface in this rock.
However, that dissolution reaction can only proceed if water is flowing through the rock
at depth. Given the limited pore connectivity and geometry of the Rose Hill Formation, we argue
that advective water flow dominates parallel to the ankerite weathering fronts or along the
fratures, but transport of these reactants (and water) into this low-porosity and low-permeability
bedrock, or transport of products out is dominated by diffusion (Fig. 9D; e.g., Jardine et al.,
1999). Therefore, solutes in the bedrock have a long residence time and the rate of advance of the
bedrock/saprock interface is limited by water transport processes (Meunier et al., 2007). Under
these conditions, small changes in porosity will have a major influence on water flowpaths and
thus the weathering advance rate. The neutron scattering techniques are shown to be sensitive to
mineral-pore interface, thus able to detect any new surface area created during chemical
weathering processes. Using NS to document the location of the reaction front where porosity
grows should allow predictive understanding of weathering advance.
5. CONCLUSIONS AND IMPLICATIONS
We investigated shale weathering at the Susquehanna Shale Hills Critical Zone
Observatory using neutron scattering techniques coupled with electron microscopy and detailed
chemical and mineralogical interrogation. We showed that the changes in physical properties
(e.g., porosity, surface area) and mineralogy and chemical composition occur in depth-related
patterns that can be correlated. Ankerite is the first mineral to dissolve at depth and the reaction
front for this mineral is used to define the bedrock-saprock interface. Ankerite, inferred to be
present mostly as cement between carbonate-poor zones or layers, is completely depleted at a
depth of 22 m below ground surface. Dissolution of ankerite is accompanied by oxidation of Fe
(II) to Fe (III).
Starting around 5 m below ground surface, the porosity in the saprock significantly
increases, either due to feldspar dissolution or to ice-wedging during the periglacial period. At
shallower depths but still in the saprock, clay dissolution starts, and is accompanied by an
increase in porosity. Within centimeters of the onset of clay dissolution, the saprock transforms to

21
regolith that can be hand-augered. At about 15 cm below land surface within the regolith, clays
have been weathered to an extent that shale chips experience a transition: pores in the chips that
are described at depth as mass fractals shift to surface fractals because intraparticle pores connect
to produce interparticle pores. Pores in the unweathered shale are anisotropic but become more
symmetric with clay dissolution. The mineral-pore interface becomes smoother, causing the
surface area to decrease in the regolith. This smoothing is largely a result of exposure of quartz
surfaces and precipitation of secondary kaolinite and Fe-oxyhydroxide. These precipitation
reactions as well as temperature fluctuations accompanying freeze-thaw cycles create
unconnected pores at this shallow depth.
The size distribution and physical connectivity of pores within rocks and soils control
chemical dissolution pathways by influencing both exposed surface area and water-accessible
flow pathways. The primary porosity at Rose Hill shale is only 5% and is mostly unconnected,
indicating that diffusion and fluid transport limit chemical dissolution reactions and bedrock-
saprolite conversion rates. To our knowledge this study is one of the first of its kind to use of
small-angle neutron scattering to investigate weathering rocks at field scales (Navarre-Sitchler et
al., 2010).
Acknowledgements:
We acknowledge instrumentation and technical support at NCNR-NIST from Andrew Jacksonand Rick Paul. John Cantolina at Material Characterization Laboratory at the Pennsylvania StateUniversity helped with SEM. This work utilized facilities supported in part by the NationalScience Foundation under Agreement No. DMR-0454672.We acknowledge the support of theNational Institute of Standards and Technology, U.S. Department of Commerce, in providing theneutron research facilities used in this work. GR and DRC are supported from the U.S.Department of Energy, Office of Basic Energy Sciences through ‘Structure and Dynamics ofEarth Materials, Interfaces, and Reactions’ (FWP ERKCC72) under contract DE-AC05-00OR22725 to Oak Ridge National Laboratory, managed and operated by UT-Battelle, LLC. LJand SLB acknowledge funding from NSF CHE-0431328 (PI: S. Brantley) for support for theEnvironmental Molecular Sciences Institute at Penn State (Center for Environmental KineticsAnalysis) and from NSF EAR-0725019 (PI: C. Duffy, Penn State) for the Susquehanna/ShaleHills Critical Zone Observatory. Logistical support was provided by the NSF-supported ShaleHills Susquehanna Critical Zone Observatory.
Figure captions:
Figure 1: A) Sampling locations in the Shale Hills catchment (modified from Lin et al., 2007; Jinet al., 2010). Background color indicates regolith thickness. DC1 is the drill core site, where 25meters of parent shale were drilled and samples as chips and powder. Soil cores SPRT and SSRTwere collected at the ridge top at two locations on the north-facing slope. B) Sample depths

22
shown relative to the weathering fronts for primary minerals as documented by major elementchemistry (Jin et al., 2010).
Figure 2: Absolute neutron scattering intensity plotted as a function of scattering vector forsample DC160. Data shown are combined from small-angle neutron scattering (SANS) and ultrasmall-angle neutron scattering (USANS).
Figure 3: Scattering curves for samples from the drill core (DC1, A), and two soil profiles (SSRT,B; SPRT, C). Notice that the shales that are more intensively weathered scatter neutrons morestrongly.
Figure 4: Variations of power law Porod exponent (A), porosity (B), specific surface area (C),and ferrous and total Fe contents as a function of depth (D), for shales that have been weatheredto different extents. The exponent, n, indicates the type of fractal (2 < n < 3, mass fractal; 3 < n<4, surface fractal).
Figure 5: Raw data from the SANS detector for SSRT5 (A) and SSRT15 (B). The distance fromthe scattering profile center is proportional to the scattering vector Q, and the colors indicate therelative intensity, with warm colors indicating higher intensity. Note that pores in SSRT5 appearto have no preferred direction, whereas those in SSRT15 are anisotropic.
Figure 6: Scattering curves for unweathered (DC260, A), slightly weathered (DC40, B; SSRT27,C) and intensively weathered (SSRT5, D) shales, in dry (solid diamond) and wet (open circle)conditions. The scattering of neutrons in dry samples is from all pores (connected andunconnected), whereas in wet samples it is only from unconnected pores. The difference betweenthe two curves is therefore attributed to connected pores. The total and unconnected porositieswere calculated for these four shales (E).
Figure 7: Images from scanning electron microcopy for slightly weathered (SSRT27, A) andintensively weathered (SSRT5, B) shale chips recovered from regolith. Notice the fibre-liketexture of the shale that controls the anisotropic nature of the pores. The black arrows point to thepores, which could be intraparticle pores within the shale grains or interparticle pores betweenquartz and clay grains. Images from transmission electron microcopy for slightly weathered(SSRT27, C) and intensively weathered chips (SSRT5, D). Circles indicate where EDSmeasurements were completed, where areas A, C, D are consistent with quartz and areas B, E, Fwith clay minerals. Area F is partly a pore as indicated by presence of Cu in the spectrum.
Figure 8: Three types of pores present in the shales (modified from Allen, 1991). See text fordetails.
Figure 9: A schematic diagram summarizing the production and changes in connectivity of thepores as measured by NS, and the processes that are causing changes in porosity at differentdepths. Initially, shales are dominated by unconnected type II pores (A). With weathering, poresbecome more connected by loss of clays and type III pores dominate (B). With progressiveweathering, more space opens up due to clay dissolution, which exposes the quartz (C).Precipitation of kaolinite (K) likely clogs some pores, making them partly inaccessible to water.Processes of physical weathering such as freeze-melt cycling could also create new unconnectedpores. At Shale Hills, chemical, physical and biological processes all can contribute to regolithformation and pore production (D). Depletion of major elements illustrates three weatheringfronts at different depths (ankerite, feldspar, and clays), as seen by the negative �Zr, j values (Jin etal., 2010). Water flows in the saprock and regolith dominated by advection along the

23
bedrock/saprock interface and along fractures, but by diffusion into the grains and into thebedrock. See text for details.
References:
Agamalian M., Carpenter J.M. and Richardson J.W. (2009) Validity of the Darwin and Ewaldreflectivity functions in the range of the far wings: Neutron diffraction study. PhysicsLetter A 373, 292-295.
Aharonov E. and Rothman D.H. (1996) Growth of correlated pore-scale structures in sedimentaryrocks: A dynamical model. Journal of Geophysical Research 101, 2973-2987.
Allen A. J. (1991) Time-resolved phenomena in cements, clays and porous rocks. Journals ofApplied Crystallography 24, 624-634.
Anderson, S.P. (2005) Glaciers show direct linkage between erosion rate and chemicalweathering fluxes. Geomorphology 67, 147-157.
Anderson, S. P., von Blanckenburg, F., and White, A. F. (2007) Physical and chemical controlson the Critical Zone. Elements 3, 315-319.
Avnir D., Farin D., and Pfeipfer P. (1984) Molecular fractal surfaces. Nature 308, 261.Anovitz L.M., Lynn G.W., Cole D.R., Rother G., Allard L.F., Hamilton W.A., Porcar L. and Kim
M. (2009) A new approach to quantification of metamorphism using ultra-small andsmall angle neutron scattering. Geochim. et Cosmochim. Acta, 73, 7303-7324.
Barker J.G., Glinka C.J., Moyer J.J., Kim M.H., Drews A.R. and Agamalian M. (2005) Designand performance of a thermal-neutron double-crystal diffractometer for USANS at NIST.J Appl. Cryst. 38(6), 1004-1011.
Bragg W.L. (1913) The diffraction of short electromagnetic waves by a crystal. Proceedings ofthe Cambridge Philosophical Society 17, 43-57.
Brantley S. L., and White A. F. (2009) Approaches to modeling weathered regolith. Reviews inMineralogy and Geochemistry 70, 435-484.
Brantley S. L., White T. S., White A.F., Sparks D., Richter D., Prgitzer, K., Derry L., ChoroverJ., Chadwick O., April R., Anderson S., Amundson R. (2006). Frontiers in exploration ofthe Critical Zone: Report of a workshop sponsored by the National Science Foundation(NSF), October 24-26, 2005, Newark, DE, 30pp.
Buss H. L, Bruns M. A., Schultz M. J. Moore J, Mathur C. F., Brantley S. L. (2005) The couplingof biological iron cycling and mineral weathering during saprolite formation, LuquilloMountains, Puerto Rico. Geobiology 3, 247-260.
Buss H. L., Sak P. B., Webb S. M., and Brantley, S. L. (2008) Weathering of the Rio Blancoquartz diorite, Luquillo Mountains, Puerto Rico: Coupling oxidation, dissolution, andfracturing. Geochim. et Cosmochim. Acta, 72, 4488-4507.
Cole D.R., Mamontov E. and Rother, G. (2009) Structure and dynamics of fluids in microporousand mesporous Earth and engineered materials. In: Neutron applications in Earth, energy,and environmental sciences, L. Liang, R. Rindaldi and H. Schober, Springer Verlag.
Cox N. J. (1980) On the relationship between bedrock lowering and regolith thickness. EarthSurface Processes 5, 271-274.
Dietrich W.E. and Perron J.T. (2005) The search for a topographic signature of life. Nature 439,411-418.
Failey M. P., Anderson D. L., Zoller W.H., Gordon G.E., and Lindstrom R. M. (1979) Neutron-capture prompt -ray activation analysis for multielement determination in complexsamples. Analytical Chemistry 51, 2209-2221.
Fletcher R. C., Buss H. L. and Brantley S.L. (2006) A spheroidal weathering model couplingpore-water chemistry to soil thicknesses during steady state weathering. Earth andPlanetary Sci. Letters 244, 444-457.
24
Flueckinger L.A. (1969) Geology of a portion of the Allensville Quadrangle, Centre andHuntingdon Counties, Pennsylvania, PA. Topographic and Geological Survey ProgressReport.
Folk R.L. (1960) Peterography and origin of the Tuscarora, Rose Hill, and Keefer Formations,Lower and Middle Silurian of eastern west Virginia. Journal of Sedimentary Petrology30, 1-58.
Gabet E.J., Reichman O.J., Seabloom E.W. (2003) The effects of bioturbation on soil processesand sediment transport. Annual Review of Earth and Planetary Sciences 31, 249-273.
Glinka C.J., Barker J.G., Hammouda B., Krueger, S., Moyer, J.J. and Orts, W.J. (1998) The 30 mSmall-Angle Neutron Scattering Instruments at the National Institute of Standards andTechnology. J Appl. Cryst. 31(3), 430.
Gardner T.W., Ritter J.B., Shuman C.A., Bell J.C., Sasowsky K.C. and Pinter N. (1991) Aperiglacial stratified slope deposit in the valley and ridge province of centralPennsylvania, USA: Sedimentology, stratigraphy, and geomorphic evolution. Permafrostand Periglacial Processes 2, 141-162.
Goldich S.S. (1984) Determination of ferrous iron in silicate rocks. Chemical Geology 42, 343-347.
Graham G.C., Rossi A.M. and Hubbert K.R. (2010) Rock to regolith conversion: productionhospitable substrates for terrestrial ecosystems. GSA today 20 (2), doi:10.1130/GSAT57A.1.
Green, E.G., Dietrich, W.E. and Banfield J.F. (2006) Quantification of chemical weathering ratesacross an actively eroding hillslope. Earth and Planetary Science Letters 242, 155-169.
Guinier A. and Forner G. (1955) Small-angle scattering of X-rays; Wiley: New York, 1955.Hall P.L., Mildner D.F.R. and Borst, R.L. (1983) Pore size distribution of shaly rock by small
angle neutron scattering. Appl. Phys. Lett. 43, 252-254.Heimsath, A. M., Dietrich, W. E., Nishiizumi, K. and Finkel, R. C. (1997) The soil production
function and landscape equilibrium. Nature 388, 358-361.Hinde, A.L. (2004) PRINSAS- a Windows-based computer program for the processing and
interpretation of small-angle scattering data tailored to the analysis of sedimentary rocks.Journal of Applied Crystallography 37, 1020-1024.
Idso S.B. and Kimball B.A. (1991) Effects of two and a half years of atmospheric CO2enrichment on the root density distribution of three-year-old sour orange trees.Agircultural and Forest Meterology 55, 345-349.
Jardine P.M., Sanford W.E., Gwo J.P., Reedy O.C., Hicks D.S., Riggs J.S. and Bailey W. (1999)Quantifying diffusive mass transfer in fractured shale bedrock. Water Resource Research35 (7), 2015-2030.
Jin L., Williams E.L., Szramek K.J., Walter L.M. and Hamilton S.K. (2008) Silicate andcarbonate mineral weathering in soil profiles developed on Pleistocene glacial drift(Michigan, USA): Mass balances based on soil water chemistry. Geochim. Cosmochim.Acta 72, 1027-1042.
Jin L., Ravella R., Ketchum B., Bierman P.R., Heaney P., White T. and Brantley S.L. (2010)Mineral weathering and elemental transport during hill slope evolution at theSusquehanna Shale Hills Critical Zone Observatory. In press for Geochim. Cosmochim.Acta.
Jongmans A.G., van Breemem N., Lundstrom, U., van Hees, P.A.W., Finlay R.D., SrinivasanM., Unestam T., Giesler R., Melkerud P.A. and Olsson M. (1997) Rock-eating fungi.Nature 389, 682-683.
Kahle A., Winkler B., Radulescu A. and Schreuer J. (2004) Small-angle neutron scattering studyof volcanic rocks. Euro. J. Miner. 16, 407-417.
Kline S. R. (2006) Reduction and Analysis of SANS and USANS Data using Igor Pro. J Appl.Cryst. 39(6), 895.

25
Krohn C.E. (1988) Sandstone fractal and Euclidean pore volume distributions. J. Geophy.Research 93, 3286-3296.
Lin H. and Zhou X. (2008) Evidence of subsurface preferential flow using soil hydrologicmonitoring in the Shale Hills catchment. European Journal of Soil Science 59, 34-49.
Lucido G., Tiolo R. and Caponetti E. (1988) Fractal approach in petrology: small-angle neutronscattering experiments with volcanic rocks. Phys. Rev. B 38, 9031-9034.
Lynch J.A. and Corbett E.S. (1985) Source-area variability during peak flow, edited by E.B.Jones and T.J. Ward, J. Irrig. Drain. Div. Am. Soc. Civ. Eng., pp. 300-307., in WatershedManagement in the 1980s, E. Jones and T. Ward, Editors. ASCE: Reston, VA. p. 300-307.
Ma L., Chabaux F., Pelt E., Blaes E., Jin L., and Brantley S.L. (2010) Regolith production ratescalculated with Uranium-series isotopes at Susquehanna Shale Hills Critical ZoneObservatory. In review for Earth and Planetary Science Letters.
Matsuoka N. and Murton J. (2008) Frost weathering: recent advances and future directions.Permafrost and Periglacial Processes 19, 195-210.
McFadden L.D., Eppes M.C., Gillespie A.R. and Hallet B. (2005) Physical weathering in aridlandscape due to diurnal variation in the direction of solar heating. Geological Society ofAmerica Bulletin 117 (1/2), 161-173.
Merino E., Nahon, D. and Wang, Y. (1993) Kinetics and mass transfer of pseudomorphicreplacement: Application to replacement of parent minerals and kaolinite by Al, Fe, andMn oxides during weathering. American Journal of Science 293, 135-155.
Meunier A., Sardini P., Robinet J. C. and Pret D. (2007) The petrography of weatheringprocesses: facts and outlooks. Clay Minerals 42, 415-435.
Mildner D. F. R. and Hall P. L. (1986) Small-angle scattering from porous solids with fractalgeometry. J. Phys. D: Appl. Phys. 19, 1535-1545.
Mildner D. F. R., Rezvani R., Hall P.L. and Borst R.L. (1986) Small-angle scattering of shalyrocks with fractal pore interfaces. Appl. Phys. Lett. 48(19), 1314-1316.
Minasny B. and McBratney A. B. (1999) A rudimentary mechanistic model for soil productionand landscape development. Geoderma 90, 3-21.
Molnar P., Anderson R.S. and Anderson S.P. (2007), Tectonics, fracturing of rock, and erosion, J.Geophys. Res., 112, F03014.
Murton J. B., Peterson R., Ozouf J. C. (2006) Bedrock fracture by ice segregation in cold regions.Science 314, 1127-1139.
Navarre-Sitchler A., Steefel C.I., Yang L. and Tomutsa L. (2009) Evolution of porosity anddiffusivity associated with chemical weathering of a basalt clast. Journal of GeophysicalResearch - Earth Surface, doi:10.1029/2008JF001060.
Navarre-Sitchler A., Jin L., Rother, G., Cole, D.R., Buss, H. and Brantley S.B. (2010) Hownanoporosity and microporosity grow in weathering rocks. In review for Nature-Geosciences.
Oguchi C. T. (2004) A porosity-related diffusion model of weathering-rind development. Catena58, 65-75.
Pernyeszi T. and Dekany I. (2003) Surface fractal and structural properties of layered clayminerals monitored by small-angle X-ray scattering and low-temperature nitrogenadsorption experiments. Colloid Polym. Sci. 281, 73-78.
Porod G (1952) Die Röntgenkleinwinkelstreuung von dichtgepackten kolloiden Systemen. II Teil.Kolloid Z 125:51-57, 108-122.
Radlinski A.P., Ioannidis M.A., Hinde A.L., Hainbuchner M., Baron M., Rauch H. and KlineS.R. (2004) Angstrom-to-millimeter characteriation of sedimentary rock microstrcture. J.of Colloid and Interface Sci. 274, 607-612.
Radlinski A. P. (2006) Small-angle neutron scattering and the microstructure of rocks. In NeutronScattering in the Earth Sciences, v. 31, Vol. 63, pp. 363-397.
26
Radlinski A.P., Radlinska E.Z., Agamalian M., Wignall G.D., Lindner P. and Randl O.G. (1999)Fractal geometry of rocks. Physical Review Letters 82, 3078-3081.
Roering J.J., Almond P., Tonkin P., McKean J. (2002) Soil transport driven by biologicalprocesses over millennial time scales. Geology 30, 1115-1118.
Rossi A.M. and Graham R.C. (2010) Weathering and porosity formation in subsoil granitic clasts,Bishop Creek moraines, California. Soil Science Society of American Journals 74(1),172-185.
Royne A., Jamtveit B., Mathiesen J. and Malthe-Sorenssen A. (2008) Rock weathering rates byreaction-induced hierarchical fracturing. Earth and Planetary Science Letters, 275, 364-369.
Sak P.B., Fisher D.M., Gardner T.W., Murphy K. and Brantley S.L. (2004) Rates of weatheringrind formation on Costa Rican basalt. Geochimica et Cosmochimica Acta 68, 1453-1472.
Schaetzl R.J. and Anderson S. (2005) Soils: Genesis and Geomorphology. New York: CambridgeUniversity Press, 817pp.
Smucker A.J.M., Park, E., Dorner J. and Horn R. (2007) Soil micropore development andcontributions to soluble carbon transport within macroaggregates. Vadoze Zone Journal,6, 282-290.
Stevenson F.J. and Cole M. A. (1999) Cycles of soils: carbon, nitrogen, phosphorus, sulfur,micronutrients. New York, Willey, 2nd Edition.
Tan K.H. (2003) Humic matter in soil and environment: Principles and controversies. MarcelDekker, New York.
Thompson A.H. (1991) Fractals in rock physics. Annual Rev. Earth Planet. Sci. 19, 237-262.van Breemen N., Lundstrom U.S. and Jongmans A.G. (2000) Do plants drive podzolization via
rock-eating mycorrhizal fungi? Geoderma 94, 163-171.White A.F. and Brantley S.L. (2003) The effect of time on the weathering of silicate minerals:
why do weathering rates differ in the laboratory and field? Chemical Geology 202, 479-506.
White A.F., Schulz M.S., Lowenstern J.B., Vivit, D.V. and Bullen T.D. (2005) The ubiquitousnature of accessory calcite in granitoid rocks: Implications for weathering, soluteevolution, and petrogenesis. Geochimica et Cosmocimica Acta 69 (6), 1455-1471.
White A.F., Schulz M.S., Stonestrom D.A., Vivit D.V., Fitzpatrick J., Bullen T.D. Maher K. andBlum A.E. (2009) Chemical weathering of a marine terrace chronosequence, Santa Cruz,California. PartII: Solute profiles, gradients and the comparisons of contemporary andlong-term weathering rates. Geochim. Cosmochim. Acta 73, 2769-2803.
Wong P., Howard J. and Lin J.-S, (1986) Surface roughening and the fractal nature of rocks.Phys. Rev. Lett. 57, 637-640.
Yoo K., Mudd S.M., Sanderman J., Amundson R. and Blum, A.E. (2009) Spatial patterns andcontrols of soil chemical weathering rates along a transient hillslope. Earth and PlanetaryScience Letters 288, 184-193.
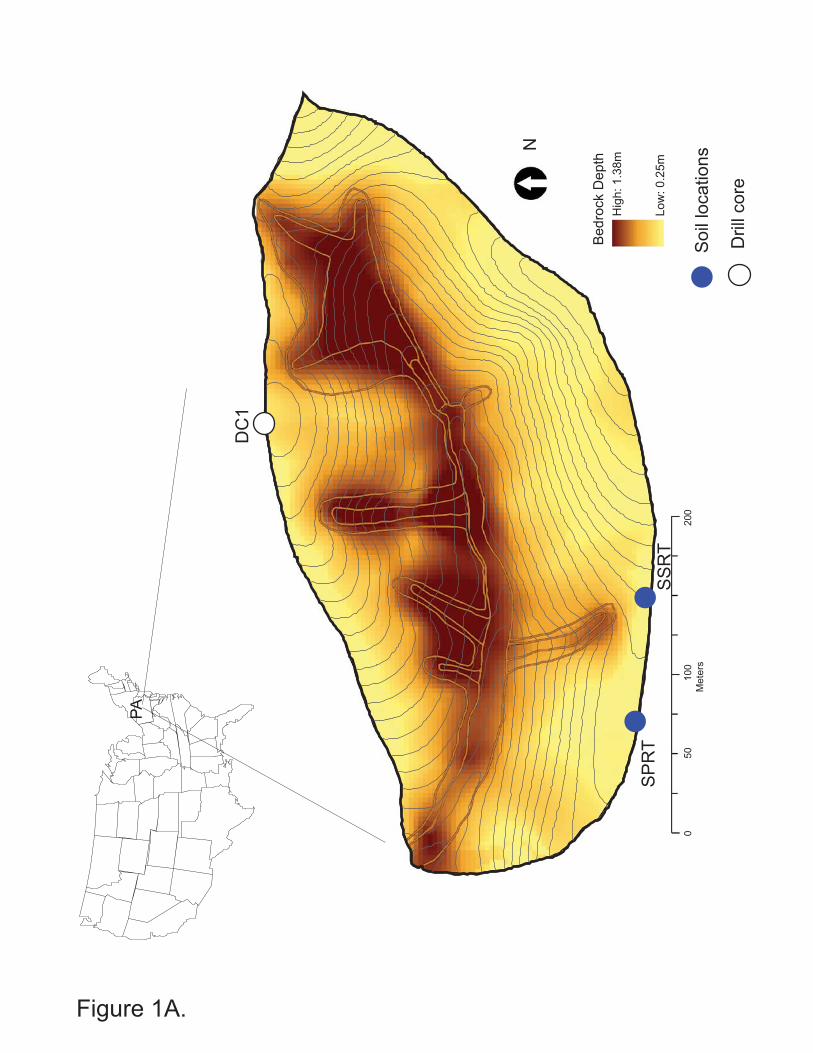
Be
dro
ck D
ep
th
Hig
h: 1.3
8m
Low
: 0.2
5m
0 50 100 200
M
ete
rs
N
Soil
locations
SP
RT
DC
1
SS
RT
PA
Figure 1A.
Drill
core

Figure 1B.
DC1990
DC620
DC540
DC160
DC40
Sample name
SPRT5 SSRT5
SPRT15 SSRT15
SPRT25 SSRT22
SSRT27
Feldsparb
edro
ck
Clay
Carbonate
sap
rock
reg
olit
h
Weathering
fronts0.0
0.2
0.4
1
3
5
20
22
24
Depth (m)

10-1
101
103
105
107
109
10-5 10-4 10-3 10-2 10-1 100
Sc
att
eri
ng
in
ten
sit
y (
I, c
m-1)
Scattering vector (Q, Å-1)
DC160
USANS
SANS
Figure 2.

A. DC1 core
B. Soil: SSRT
SPRT5SPRT15SPRT25
C. Soil: SPRT
101
103
105
107
109S
ca
tte
rin
g i
nte
ns
ity
(I,
cm
-1)
10-5 10-4 10-3 10-2 10-1 100
Scattering vector (Q, Å-1)
1011
101
103
105
107
109
10-1
101
103
105
107
109
DC40DC160DC540DC620
DC1990
SSRT5SSRT15SSRT22SSRT27
Figure 3.

0
Depth (cm)
10
20
30
40
500
1500
2000
1000
Po
rod
ex
po
ne
nt
Po
ros
ity
(%
)S
urf
ac
e a
rea
(m
2/g
)
4.0
3.5
3.0
2.5
510
15
100
200
300
DC
1 c
ore
Soil:
SS
RT
Soil:
SP
RT
A.
B.
C.
Figure 4.
2.0

0
10
20
3040
500
1500
2000
1000
50
2500
1 2 3 4 5 6
Fe (wt%)
D.
Figure 4.
De
pth
(c
m)
Fe(II)
Fe(total)

0
1
2
3
B.SSRT15A. SSRT5
Figure 5.

1011
101
103
105
107
109
10-5 10-4 10-3 10-2
1011
103
105
107
109
10-4 10-3 10-2Sc
att
eri
ng
in
ten
sit
y (
I, c
m-1)
Scattering vector (Q, Å-1)
A. DC620 B. DC40
C. SSRT27 D. SSRT5
Porosity (%)
SSRT27
SSRT5
DC40
DC620 E.
0 2 4 6 8 10 12
Unconnected
total
more weathering
Figure 6.

50 m
100 m
A.
B.
Figure 7.
Qtz.
illite
2 m
2 m
C.
D.
O
P
QE
D
F
C
B
A

Type I: interlayer pores
Type II: intra-particle pores
Type III: inter-particle pores
quartz
quartz
clay
clay
Figure 8.

quartz
clay
quartz
clay
quartz
unconnected pores
Figure 9.
A.
B.
C.
bedrock
regolith
Processes driving porosity development
chemical
carb
on
ate
dis
solu
tio
nfe
ldsp
ar d
isso
luti
on
clay
dis
solu
tio
n
biological
dis
agg
reg
atio
n b
y tr
ee ro
ots
physical
per
igla
cial
pro
cess
es
tem
per
atu
re-i
nd
uce
d f
ract
uri
ng
B
C
D.
Clay dissolution with
creation of connected
pores
unconnected
pores in bedrock
more clay
dissolution
Kaolinite precipitation
creates unconnected pores
K
Fe o
xid
atio
n
kao
linit
e p
reci
pit
atio
n
hydrological
adve
ctio
n
?
diff
usi
on
0.0
0.2
0.4
Mg
-0.8 -0.4 0Zr, j
1
3
5
20
22
24
Na
Ca
Fe(II)
Depth (m)
saprock
A

Table 1: Observations and results from neutron scattering experiments
Sample
number
Depth
(cm)
Porod exponenta
(n)
fractalb
dimension
SLDc (Å-2)
*10-6
Porosity
(%)
Modeled
exponent (n)
Modeled
porosity (%)
SSAd
(m2/g)Drill core samples
DC40 30-50 2.91 2.91 3.70 9.3 2.95 6.8 95DC160 150-170 2.87 2.87 3.72 9.3 2.92 7.6 121DC540 520-540 3.06 2.94b 3.75 4.9 3.06 4.0 32DC620 610-630 2.90 2.90 3.72 5.6 2.94 3.5 53DC1990 1980-2000 2.94 2.94 3.74 5.8 2.91 3.8 66
Soil profile 1: SSRT
SSRT5 0-10 3.27 2.73b 3.70 14.0 3.23 12.2 33SSRT15 10-20 2.82 2.82 3.72 10.9 2.82 9.9 245SSRT22 20-25 2.87 2.87 3.72 8.3 2.86 6.3 136SSRT27 25-29 2.79 2.79 3.70 12.3 2.79 11.0 304
Soil profile 2: SPRT
SPRT5 0-10 3.24 2.76b 3.69 15.9 3.18 12.6 51SPRT15 10-20 3.13 2.87b 3.71 9.9 3.16 9.0 37SPRT25 20-30 2.82 2.82 3.70 7.9 2.87 6.2 135a Uncertainty estimated for the porod exponent is ± 0.04.b samples show surface fractal, and the others exhibit mass fractal. c SLD= scattering length density; d SSA=specific surface area.

Table 2: Total and unconnected porosity observed at 0.00003 < Q < 0.01 Å-1*Sample
number
Total porosity
(%)
Unconnected porosity
(%)
Connected porosity
(%)DC620 2.4 2.4 0.0
DC40 4.6 2.1 2.5
SSRT5 5.6 1.5 4.1
SSRT27 10.0 5.0 5.0
* Smaller range due to higher background at higher Q.

Table 3: Total and ferrous iron in soils and DC rocksSample number total Fe (wt %) ferrous Fe (wt%)
SPRT15 4.00 1.51SPRT25 4.28 1.12DC55 5.36 1.28
DC120 5.44 1.24DC160 5.60 1.33DC340 5.46 1.34DC540 5.26 1.23DC620 5.97 1.10
DC1066 5.67 1.10DC1990 5.36 2.34DC2290 5.20 3.67DC2450 5.85 n.a.
n.a. = not available