
Characterization of Commercial Pectin Preparations by
107
East Tennessee State University Digital Commons @ East Tennessee State University Electronic eses and Dissertations 5-2008 Characterization of Commercial Pectin Preparations by Spectroscopic and Chromatographic Techniques. Daniel Wayne Dixon East Tennessee State University Follow this and additional works at: hp://dc.etsu.edu/etd is esis - Open Access is brought to you for free and open access by Digital Commons @ East Tennessee State University. It has been accepted for inclusion in Electronic eses and Dissertations by an authorized administrator of Digital Commons @ East Tennessee State University. For more information, please contact [email protected]. Recommended Citation Dixon, Daniel Wayne, "Characterization of Commercial Pectin Preparations by Spectroscopic and Chromatographic Techniques." (2008). Electronic eses and Dissertations. Paper 1910. hp://dc.etsu.edu/etd/1910
Transcript of Characterization of Commercial Pectin Preparations by
East Tennessee State UniversityDigital Commons @ East
Tennessee State University
Electronic Theses and Dissertations
5-2008
Characterization of Commercial PectinPreparations by Spectroscopic andChromatographic Techniques.Daniel Wayne DixonEast Tennessee State University
Follow this and additional works at: http://dc.etsu.edu/etd
This Thesis - Open Access is brought to you for free and open access by Digital Commons @ East Tennessee State University. It has been accepted forinclusion in Electronic Theses and Dissertations by an authorized administrator of Digital Commons @ East Tennessee State University. For moreinformation, please contact [email protected].
Recommended CitationDixon, Daniel Wayne, "Characterization of Commercial Pectin Preparations by Spectroscopic and Chromatographic Techniques."(2008). Electronic Theses and Dissertations. Paper 1910. http://dc.etsu.edu/etd/1910
http://dc.etsu.edu/etd?utm_source=dc.etsu.edu%2Fetd%2F1910&utm_medium=PDF&utm_campaign=PDFCoverPages
Characterization of Commercial Pectin Preparations by
Spectroscopic and Chromatographic Techniques
__________
A thesis
presented to
the faculty of the Department of Chemistry
East Tennessee State University
In partial fulfillment
of the requirements for the degree
Master of Science in Chemistry
__________
by
Daniel Wayne Dixon, Jr.
May 2008
__________
Chu-Ngi Ho, Chair
Yu-Lin Jiang
Jeffrey G. Wardeska
Keywords: pectin, spectrophotometric analysis, cationic dyes, gel permeation chromatography
2
ABSTRACT
Characterization of Commercial Pectin Preparations by
Spectroscopic and Chromatographic Techniques
by
Daniel Wayne Dixon, Jr.
Pectin has a long history as a food additive. However, elucidation of its fine structural and
property relationships remains elusive. Recent research has focused on pectin’s ability to
complex with divalent heavy metals to aid in characterizing it. Commercial pectins of unknown
composition were obtained from local grocers. Purified pectin samples from orange peel,
lemon peel, and apple pomace, each of low and high levels of methyl esterification and of
unknown distribution pattern were also purchased. Instead of metal complexation, several
highly absorbing dyes such as Ruthenium Red, Nile Blue, and Acridine Orange were used to
complex with the pectins and their resulting UV-Vis spectral patterns were employed to
determine if one can characterize the different pectins. Chemometric methods are also
included to aid in distinguishing them apart.

3
DEDICATION
The author wishes to dedicate this work to the memory of his grandparents, Glenn Alvin
and Gladys Eleree Dalton. Their unconditional love, humility, and appreciation for the small
things were an example to all.
4
ACKNOWLEDGEMENTS
The author wishes to express sincere appreciation to Professors Ho, Davidson, Jiang,
and Wardeska for their assistance in the research, preparation of this manuscript, and presiding
over the graduate committee. In addition, special thanks to Danessa Dixon whose love and
support was my cornerstone during all phases of this undertaking. Thanks also to all faculty
members of the Department of Chemistry for their valuable input into my education.

5
CONTENTS
Page
ABSTRACT ........................................................................................................................................ 2
DEDICATION .................................................................................................................................... 3
ACKNOWLEDGEMENTS ................................................................................................................... 4
LIST OF TABLES ................................................................................................................................ 8
LIST OF FIGURES .............................................................................................................................. 9
LIST OF ABBREVIATIONS ............................................................................................................... 11
GLOSSARY ...................................................................................................................................... 12
Chapter
1. INTRODUCTION ............................................................................................................ 13
History of Pectin .................................................................................................... 13
Sources of Pectin ................................................................................................... 13
Classes of Pectin .................................................................................................... 14
Chemistry of Pectin ............................................................................................... 14
Industrial Production of Pectins ........................................................................... 23
Important Uses ..................................................................................................... 24
Commercially Important Measurables ................................................................. 25
Absolute, Relative, or Weight Average Molecular Weight ....................... 25
Total % Galacturonic Acid (%GalA) ........................................................... 26
Degree of Esterification (DE, %DE) ........................................................... 26
6
Chapter Page
Degree of Methylation (%DM) .................................................................. 26
Degree of Amidation (%DA) ...................................................................... 27
Neutral Sugars ........................................................................................... 27
Random or Blockwise Carboxyl Distribution ............................................ 27
2. TECHNIQUES FOR STRUCTURAL ANALYSIS OF PECTINS .............................................. 28
Enzymatic Analysis ................................................................................................ 28
Ultraviolet-Visible Spectrophotometry................................................................. 30
Colorimetric Spectrophotometry.......................................................................... 32
Metachromasy .......................................................................................... 34
Complexometric Analysis ...................................................................................... 35
Molecular Weight Determination ......................................................................... 35
3. METHODOLOGY ........................................................................................................... 38
Spectrophotometry ............................................................................................... 38
Gel-Permeation Chromatography ........................................................................ 39
Colorimetry ........................................................................................................... 40
Hydroxylamine .......................................................................................... 41
Carbazole .................................................................................................. 41
Proposed Research ............................................................................................... 42
4. EXPERIMENTAL PROCEDURES, RESULTS, AND DISCUSSIONS ...................................... 44
Reagents ................................................................................................................ 44
7
Chapter Page
Instrumentation .................................................................................................... 48
Preparation of Reagents and Stock Solutions ....................................................... 49
Preparation of Standard Solutions............................................................ 50
Preparation of Commercial Samples ........................................................ 52
Preparation of Samples for Analysis ......................................................... 53
UV-Vis Conditions ................................................................................................. 54
GPC Conditions ..................................................................................................... 54
Data Analysis ......................................................................................................... 55
Verification of Current Ruthenium Red Substitution Pattern Technique ............ 56
Results and Discussions ........................................................................................ 57
Optimization of Spectral Detail, Manipulation, and Analysis ................... 58
Chemometric Techniques ......................................................................... 62
Examples of Single Dye Spectra Used for Calculation .............................. 68
Validation of Chemometric Techniques Employed and Standard ............ 68
Determination of Unknowns Using Single Dye System ............................ 75
Combined Factors as Predictors of Features in Unknowns ...................... 82
Selection of Samples Based Upon Molecular Weight .......................................... 85
5. CONCLUSION ................................................................................................................ 89
BIBLIOGRAPHY .............................................................................................................................. 95
VITA ............................................................................................................................................. 105

8
LIST OF TABLES
Table Page
1. Classes of Pectin ....................................................................................................................... 13
2. Commercial Pectin Specifications ............................................................................................ 53
3. Reagent Volumes for Preparation of Spectrophotometric Experiments ................................ 53
4. Interstandard ED of Each Dye at All Concentrations ............................................................... 72
5. Interstandard R2 Values of Each Dye at All Concentrations .................................................... 73
6. Interstandard Eigenvector IPs of Each Dye at All Concentrations ........................................... 74
7. Tabulated Results of RR Comparison Calculations .................................................................. 77
8. Tabulated Results of NB Comparison Calculations .................................................................. 78
9. Tabulated Results of AO Comparison Calculations .................................................................. 79
10. Summarized Predictions for all Dyes and Data ...................................................................... 81
11. Combined Q Table of ED, R2, and IP Values for All Dyes ....................................................... 83
12. Prediction Matrix Using Scaled Q-table Values ..................................................................... 84
13. Predicted Results from Combined Datasets .......................................................................... 85
14. MW Results of GPC Studies on Diverse Samples ................................................................... 86
15. Chromatographic GPC Results of Samples Used in This Study .............................................. 87
9
LIST OF FIGURES
Figure Page
1. Naturally Occurring Forms of D-Galacturonic Acid Residues Where Arrows Indicate Possible
β-Elimination in the Ester Form ............................................................................................ 15
2. Alternative Representations of D-Galacturonic Acid ............................................................... 15
3. Overview of the Pectin Structure ............................................................................................. 16
4. Interaction Zones for High-Methoxyl Pectin.20. ....................................................................... 19
5. Low-Methoxyl Calcium Pectate Gel. ........................................................................................ 20
6. Calcium Concentration Effects on LM-Pectin Gels. (pH=6, 30% sugar, 1% pectin)25 ............. 21
7. Industrial Production of Pectins ............................................................................................... 24
8. Basic Construction of a Spectrophotometer ........................................................................... 31
9. Chemical Structure of Coriphosphine O .................................................................................. 45
10. Chemical Structure of MOPS .................................................................................................. 45
11. Chemical Structure of Ruthenium Red .................................................................................. 46
12. Chemical Structure of Na-CyDTA ........................................................................................... 46
13. Chemical Structure of Methyl Blue and Water Blue .............................................................. 46
14. Chemical Structure of Toluidine Blue .................................................................................... 46
15. Chemical Structure of Congo Red .......................................................................................... 47
16. Chemical Structure of Alcian Blue .......................................................................................... 47
17. Chemical Structure of Nile Blue ............................................................................................. 48
18. Chemical Structure of Acridine Orange ................................................................................. 48
10
Figure Page
19. Absorbance Difference at 534 nm, Against Blank, of RR with Pectin of Known %DM .......... 57
20. Raw vs. Savitsky-Golay Filtered Data for Citrus at Low Concentration with RR .................... 60
21. Raw vs. Savitsky-Golay Filtered Data for Citrus at High Concentration with RR ................... 60
22. Eigenvalue Matrix of RR Apple Range Scaled Concentration 3 Spectra ................................ 66
23. Eigenvectors of RR Apple Range Scaled Concentration Series 3 Data ................................... 67
24. Baseline Corrected Spectra of RR Complex of Standards (a), Unknowns (b), and (c) Overlay
of All at Concentration Level 4 .............................................................................................. 69
25. Baseline Corrected Spectra of NB Complexation of Standards (a), Unknowns (b), and (c)
Overlay of All at Concentration Level 4 ................................................................................ 70
26. Baseline Corrected Spectra of AO Complex of Standards (a), Unknowns (b), and (c) Overlay
of All at Concentration Level 4 .............................................................................................. 71

11
LIST OF ABBREVIATIONS
Abbreviation or Symbol Term
AO Acridine Orange
AUA Anhydrouronic Acid
DA Degree of Amidation
DE Degree of Esterification
DM Degree of Methylation
ED Euclidean Distance
GalA Galacturonic Acid
GPC Gel Permeation Chromatography
IP Inner Products
MOPS 3-Morpholinopropanesulfonic acid
MW Molecular Weight
NB Nile Blue
PGA Polygalacturonic Acid
R2 Correlation Coefficient (%)
r Correlation
RI Refractive Index
RR Ruthenium Red
UV-Vis Ultraviolet-Visible
12
GLOSSARY
Degree of Amidation. Percentage of the C-6 carboxylate groups that are amide groups.
Degree of Esterification. Amount of esterification along the polymer backbone.
Degree of Methylation. 1. Moles of methanol present per 100 moles of galacturonic acid. 2.
Percentage of the C-6 carboxylate groups that are esterified with methanol.
High Methoxyl Pectin. Pectin containing > 50% (of total ester groups) amount of methyl
esterification (> 50 DM) along its backbone.
Low Methoxyl Pectin. Pectin containing < 50% (of total ester groups) amount of methyl
esterification (< 50 DM) along its backbone.
Protopectin. Water insoluble parent pectic substance, which upon hydrolysis, yields pectinic
acids.
Pectic Substance. Polyuronide composed mostly of anhydrogalacturonic acid residues.
Pectinic Acids. Colloidal polygalacturonic acid with very low methyl ester content.
Pectic Acids. Colloidal polygalacturonic acid devoid of methyl esterification.
Pectates. Mg, Ca, Na, or other Pectic acid salts.
Pectin. 1. A large, naturally occurring polymer contained within the middle lamella of plants.
2. Water soluble pectinic acid of varying methyl esterification- capable of forming gels under
suitable conditions.
Pectinates. Mg, Ca, Na, or other Pectin salts.

13
CHAPTER 1
INTRODUCTION
History of Pectin
Pectin has a very long chemical history. As early as 1750, apple, currant, and quince jelly
recipes were published in the "London Housewife's Family Companion"1. In 1790, Vauquelin
reported2 pectin as a soluble substance in fruit juice. Scientific study in 1825 by Henri
Braconnot3 led to a detailed description of "Pectin-Acid", derived from Greek "pectos" which
means to solidify, congeal, or curdle. The commercial production of liquefied extract of pectin
began in 1908 Germany and was quickly patented in the United States4.
Sources of Pectin
General acceptance states that pectin comprises up to 35%5 of the cell wall of most
terrestrial plants where alginates and carrageenans play a similar role for their marine
counterparts. All green land plants contain pectin to a certain degree. Pectin content in
dicotyledonous (flowering) plants far outweighs that contained in monocotyledonous (seed-
bearing) plants and grasses. See Table 1 for a representation of the content of pectin in
monocots versus dicots.
Table 1. Classes of pectin
Components Monocots (%) Dicots (%) Cellulose 30 30
Pectin 5 35
Arabinoxylan 30 5
Xyloglucan 4 25
β-(1,3),(1,4)-Glucans 30 0
Glycoprotiens 1 5

14
Classes of Pectin
Two main classes and several subclasses of pectin exist6. High Methyl Ester (HM-) pectin
is the first general class of pectin. In this type of pectin, a high portion (>50%) of carboxyl
groups exists as a methyl ester. The remaining carboxyl groups exist as the free acid,
ammonium, sodium, calcium, or other rarer salts. Low Methyl Ester (LM-) pectin is the second
general type. For this type of pectin, less than 50% of the carboxyl groups exist as the methyl
ester variant. These are usually obtained from mild alkali or acidic treatment of HM-Pectin.
Small quantities of acetylated pectin (small amount of acetyl esterification) can be found in all
plant sources. Amidated pectin7 is obtained from HM-Pectin when ammonia is used in the
alkaline deesterification process. During this process, some of the carboxyl groups are
converted to the acid amide. Small quantities of amidated pectin can be found naturally in
sugar beets and certain other sources.
Chemistry of Pectin
Pectins are a family of complex, anionic polysaccharides found in the primary cell wall
and intercellular regions of higher plants8. Pectins, as a compound, are linear polysaccharides
composed primarily of D-galactopyranosyluronic acids joined via α(14) glycosidic linkages.
This regular structure is intradispersed with L-rhamnopyranosyl units, or “hairy regions”, methyl
ester groups and rarely, neutral-sugar side-chains. The galacturonic acid units contained within
pectins can be either partially methyl-esterified, acetylated or both. Figures 1-3 are typical
representations. Pectins, as naturally found, generally have an average molecular weight (MW)
15
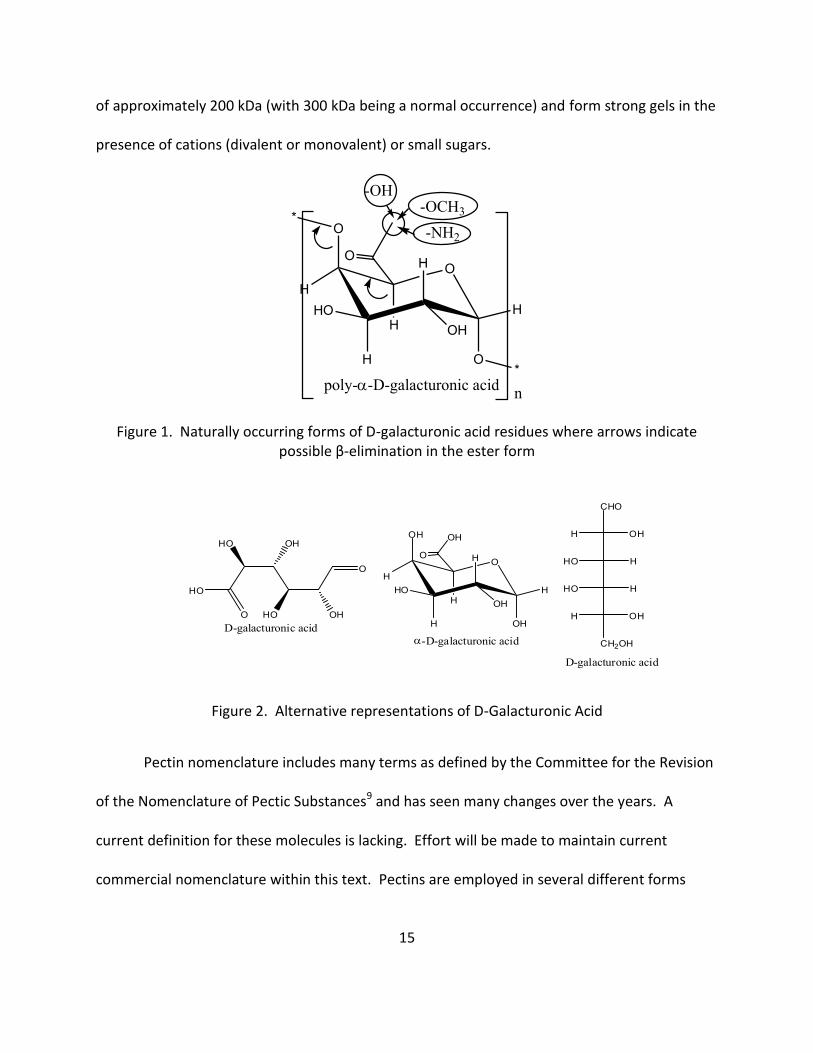
of approximately 200 kDa (with 300 kDa being a normal occurrence) and form strong gels in the
presence of cations (divalent or monovalent) or small sugars.
poly--D-galacturonic acid
O
O
H
H
HO
H
O
OHHH
O
-OH-OCH3
-NH2
*
*
n
Figure 1. Naturally occurring forms of D-galacturonic acid residues where arrows indicate possible β-elimination in the ester form
O
OHHO
OHHO
O
HO
-D-galacturonic acid
O
OH
H
H
HO
H
OH
OHHH
OH
O
CHO
OHH
HHO
HHO
OHH
CH2OH
D-galacturonic acid
D-galacturonic acid
Figure 2. Alternative representations of D-Galacturonic Acid
Pectin nomenclature includes many terms as defined by the Committee for the Revision
of the Nomenclature of Pectic Substances9 and has seen many changes over the years. A
current definition for these molecules is lacking. Effort will be made to maintain current
commercial nomenclature within this text. Pectins are employed in several different forms

16
Figure 3. Overview of the pectin structure. Homogalaturonan with partially methyl-esterified α-(1→4)-linked D-Galacturonic acids comprises the backbone in the smooth region
such as pectinic acids, pectinates, pectic acids, and pectates, where pectin, as an over-arching
term, encompasses all listed forms.
Pectic acids, with various degrees of neutralization, are poly(α-D-
galacturonopyranosyluronic) acids (poly-D-galacturonic acids for short) with no or very small
amounts of methyl esterification. Pectinic acids, on the other hand, contain appreciable levels
of methyl esterification along its backbone. Pectates and pectinates are salts of these
molecules, respectively. Pectins are generally classified based on their degree of esterification
(DE) or degree of methylation (DM) of contained carboxyl groups with methanol. High-
methoxyl, or HM-pectins, have a DE of 50% or greater while low-methoxyl (LM-) pectins have a
DE of less than 50%.
O O
H O O H
C O 2 C H 3
O O
H O O H
C O 2 H
O O
H O O
O H
C O 2 C H 3
S m o o t h R e g i o n
H a i r y R e g i o n s
17
Commercially, about 17000 metric tons of combined HM- and LM-pectin were produced
in 199810. The most common industrial sources of pectins are apple pomace and citrus peel.
However, other sources have been used, including sunflower heads, sugar beet pulp, and
potato pulp, all depending on a given region’s agricultural base. The commercial process for
pectin isolation was first described by May in 19906 and followed in more detail by Voragen et
al. in 199511. The predominant commercial class of pectins includes fast-gelling pectins (DE >
70%) or slow- to medium-set pectins (DE 60-70%). Conversely, LM-pectins do not have a
grading system because of the number of variables that affect gelation. Pectins of all forms are
typically sold as powders. The major usage of pectins is in food applications. Their main
function in this role is as a thickening or gelling agent for jams and jellies, bakery glazing and
fillings, fruit preparations for dairy products, confectionary, or as a stabilizer in milk or fruit
beverages12. An added characteristic of pectins is that they function as water-soluble dietary
fibers. In this utility, pectins are resistant to hydrolysis by human digestive enzymes and only
partially broken down by intestinal bacteria to short-chain fatty acids, methane, carbon dioxide,
and water. In this light, new pectins have been developed as fat-substitutes13, 14.
Generally, pectins are soluble in water thereby making them insoluble in most organic
solvents. Further, pectic acids are only soluble when complexed with monovalent salts.
Divalent salt complexes of pectic acids are of limited solubility while trivalent salts are insoluble.
The typical solubility trend is observed as decreasing with increasing ionic strength and MW and
decreasing DE. If gelling conditions exist, pectins will not dissolve. A gel is simply a system
within which the contained polymer is in a state of flux between being fully dissolved and being
18
precipitated. Flory15 describes gels as polymer molecules cross-linked to form an
interconnected three-dimensional network immersed in a liquid medium. In Pectins, as with
most other food gels, cross-linking occurs as additive, weak, intermolecular interactions with no
to very low kinetic activity, atypical to the covalent-linkages usually seen in synthetic polymer
gels. Therefore, pectin gels suffer from a temperature threshold above which no gelation can
occur. Generally, in polysaccharide gels changing either the temperature or counterionic pH
variations induce cross-linking16. In typical use, pectins form two types of gels: pH and sugar
dependant and cation dependant. In the first case, high DM pectin is required with an acidic pH
(< 3.6) and a high concentration of simple sugar (> 55% w/w)17. This particular gel system is
widely seen in the manufacture of jams and jellies. The other type of gel involves the use of
lower DM pectin and the presence of a divalent cation (e.g. calcium). This system has the
advantage of gelation over a wide pH range without the presence of a sugar.
High-methoxyl pectins, as mentioned above, form gels with the presence of a high
concentration of co-dissolved sugar and at an acidic pH. The presence of the sugar as a co-
solute decreases water activity and effectively dehydrates the pectin (by robbing the pectin of
needed solvent to induce precipitation) while the low pH hinders ionization of the carboxyl
groups thereby decreasing electrostatic, intramolecular repulsion within the pectin chains.
Pectin is inherently a complex, polyprotic, weak carboxylic acid with a pKa of approximately 3.5
to 4.5. By lowering the pH below this pKa, the molecule becomes less hydrophilic and thereby
increasing the tendency to form gels. These effects increase chain-to-chain interaction and lead
to partial precipitation, or gelation. Hydrogen bonding18 and hydrophobic interactions of the
19
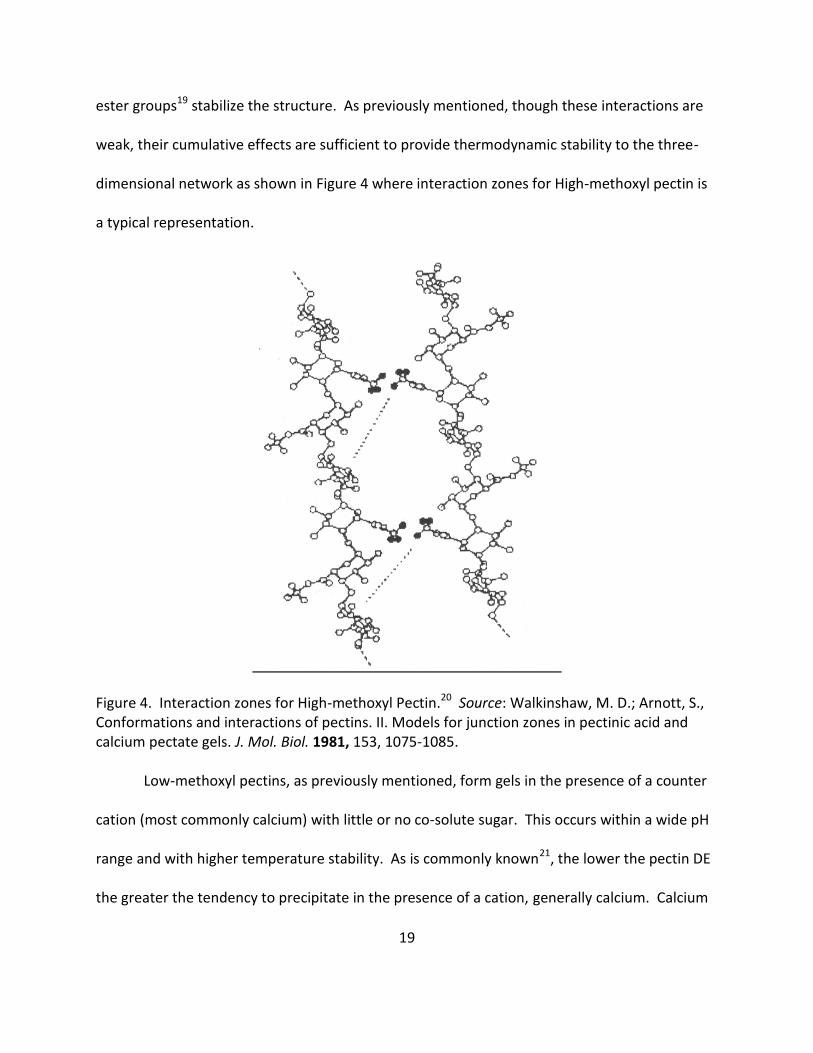
ester groups19 stabilize the structure. As previously mentioned, though these interactions are
weak, their cumulative effects are sufficient to provide thermodynamic stability to the three-
dimensional network as shown in Figure 4 where interaction zones for High-methoxyl pectin is
a typical representation.
Figure 4. Interaction zones for High-methoxyl Pectin.20 Source: Walkinshaw, M. D.; Arnott, S., Conformations and interactions of pectins. II. Models for junction zones in pectinic acid and calcium pectate gels. J. Mol. Biol. 1981, 153, 1075-1085. Low-methoxyl pectins, as previously mentioned, form gels in the presence of a counter
cation (most commonly calcium) with little or no co-solute sugar. This occurs within a wide pH
range and with higher temperature stability. As is commonly known21, the lower the pectin DE
the greater the tendency to precipitate in the presence of a cation, generally calcium. Calcium
20
and d-orbital, divalent, transition metals (e.g. Cu2+, Co2+, Pb2+, etc.), use unfilled orbitals to form
coordination complexes with neutral and acidic carbohydrates. It is suggested that calcium’s
radius (0.1 nm) is large enough to coordinate with the spatial arrangement of oxygen atoms in
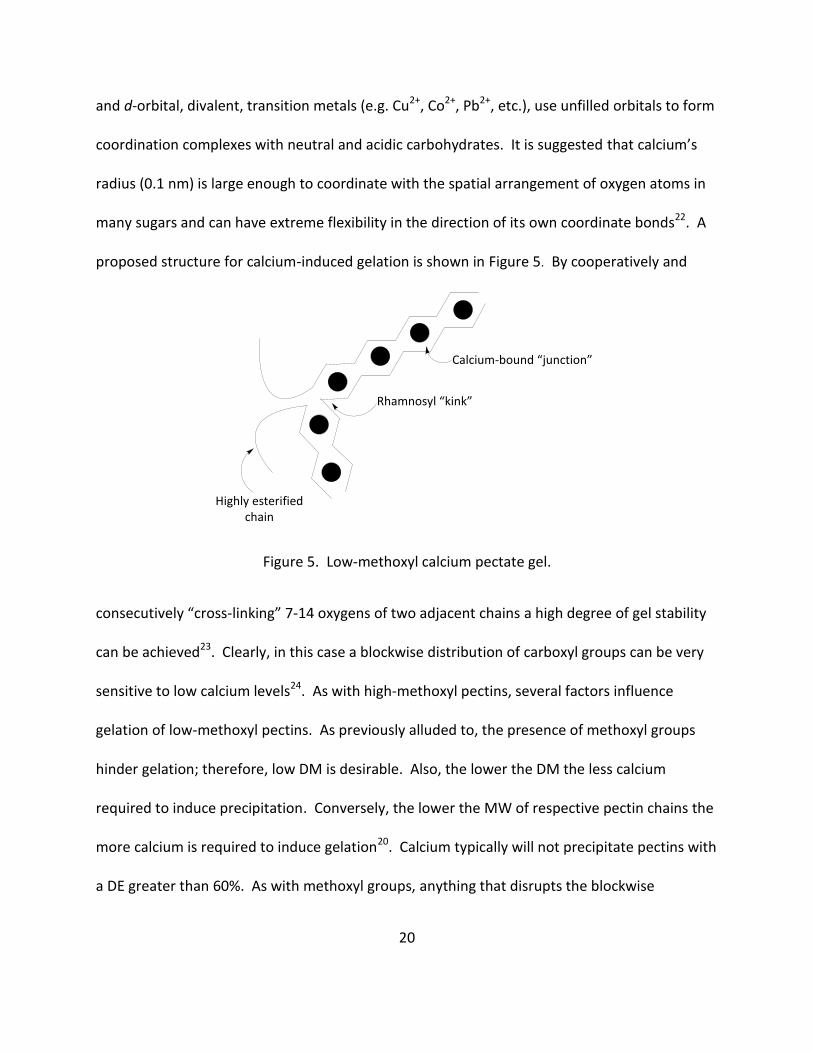
many sugars and can have extreme flexibility in the direction of its own coordinate bonds22. A
proposed structure for calcium-induced gelation is shown in Figure 5. By cooperatively and
Figure 5. Low-methoxyl calcium pectate gel.
consecutively “cross-linking” 7-14 oxygens of two adjacent chains a high degree of gel stability
can be achieved23. Clearly, in this case a blockwise distribution of carboxyl groups can be very
sensitive to low calcium levels24. As with high-methoxyl pectins, several factors influence
gelation of low-methoxyl pectins. As previously alluded to, the presence of methoxyl groups
hinder gelation; therefore, low DM is desirable. Also, the lower the DM the less calcium
required to induce precipitation. Conversely, the lower the MW of respective pectin chains the
more calcium is required to induce gelation20. Calcium typically will not precipitate pectins with
a DE greater than 60%. As with methoxyl groups, anything that disrupts the blockwise
Calcium-bound “junction”
Highly esterified chain
Rhamnosyl “kink”
21
distribution of carboxyl groups will adversely affect gelation (e.g. acetyl groups, rhamnose side
chains, etc.) other than when the disruption promotes chain association as occurs with amide
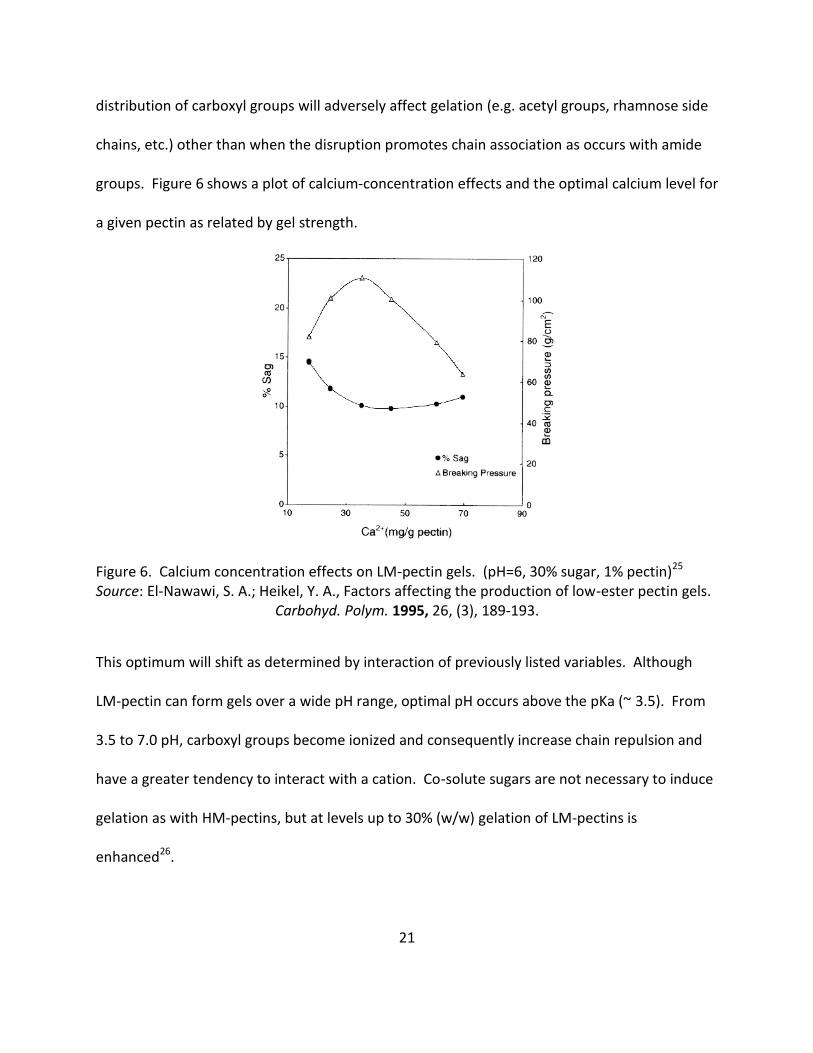
groups. Figure 6 shows a plot of calcium-concentration effects and the optimal calcium level for
a given pectin as related by gel strength.
Figure 6. Calcium concentration effects on LM-pectin gels. (pH=6, 30% sugar, 1% pectin)25 Source: El-Nawawi, S. A.; Heikel, Y. A., Factors affecting the production of low-ester pectin gels.
Carbohyd. Polym. 1995, 26, (3), 189-193.
This optimum will shift as determined by interaction of previously listed variables. Although
LM-pectin can form gels over a wide pH range, optimal pH occurs above the pKa (~ 3.5). From
3.5 to 7.0 pH, carboxyl groups become ionized and consequently increase chain repulsion and
have a greater tendency to interact with a cation. Co-solute sugars are not necessary to induce
gelation as with HM-pectins, but at levels up to 30% (w/w) gelation of LM-pectins is
enhanced26.

22
At a pH higher than neutral (about pH 8) pectins become unstable, being subjected to β-
elimination at the C-4 position when the C-6 carboxylate group is esterified. The arrows shown
in Figure 1 indicate this process. Therefore, HM-pectin is very vulnerable to degradation even
at room temperature and pH 527. Pectins, HM and LM, are subject to limited hydrolysis at
lower pH values. However, this is miniscule when compared to depolymerization though β-
elimination at high pH ranges. Chain stability at low pH remains high. This feature is a very
desirable pectin trait as food preparations are typically done at acidic pH. In addition, pectins
as a solid lose less than 5% of their grading level per year when stored at room temperature
and low humidity, making them stable during long-term storage.
Jams and jellies remain the largest commercial outlet for pectins. Prior to the
commercial availability of pectins, jam (and jelly) manufacturing had to rely on the inherent
pectin content of the given fruit and very high temperatures. Under these harsh conditions,
traditional jams were very limited on fruit selection. In addition, jam color, aroma, and vitamin
content were lacking. Other commercial applications of pectins are listed vide infra. The use of
pectins in food is a rapidly expanding market- not only from a gelling perspective but as a
thickening agent also. Some of these new applications include reduced-sugar jams, heat-
resistant jam for baked goods, heat-reversible glazing, yogurt preparations, fruit jellied candies,
etc. In addition to these food preparations, pectins are becoming widely used for stabilization
of oil-in-water emulsions28, fat-replacement food components29 and limited pharmaceutical
uses (e.g. wound dressings30, gastric ulcer treatment31, acid reflux prevention32, etc.).

23
Pectins are becoming a very important product derived from renewable resources. The
“Green Initiative” in many countries is pushing this type of research to the forefront. Pectins
have a variety of very important uses in more than just the food industry. Unfortunately, as a
class of compounds pectins are very complex polymers, difficult to analyze and ungainly to
functionalize on a manufacturing scale. Thankfully, interest in renewable chemistry is driving
research in this area to new discoveries on a daily basis. As a cheap and versatile raw material,
pectin is poised for many great applications.
Industrial Production of Pectins
As an abundant raw material, apple pomace and citrus peels are the sources from which
most industrial pectins are derived. However, raw materials are highly dependent upon local
crop sources. In some parts of the world, sugar beet pulp, sunflower heads, or potato pulp are
used. May6 and Voragen11 previously described, as summarized in Figure 7, the industrial
process for pectin extraction in detail.
The source materials are refluxed with dilute mineral acid (~ pH 2) at 60-100°C for 1-10
hours. The hot pectin extract is separated from the solid residue and pectinase-free α-amylase
is added to hydrolyze starch if the source is apple or peach pomace. The clarified extract is
concentrated under vacuum to ~ 4% pectin content and precipitated with 2-propanol. The
precipitate is washed, dried, and ground to a powder form. Desired yield and DE determine
extraction temperature and time (de-esterification proceeds faster than de-polymerization at
lower temperatures). Low DE types of pectin are produced via acidic treatments at various
stages during the extraction process. When ammonia is used for this purpose, amidated
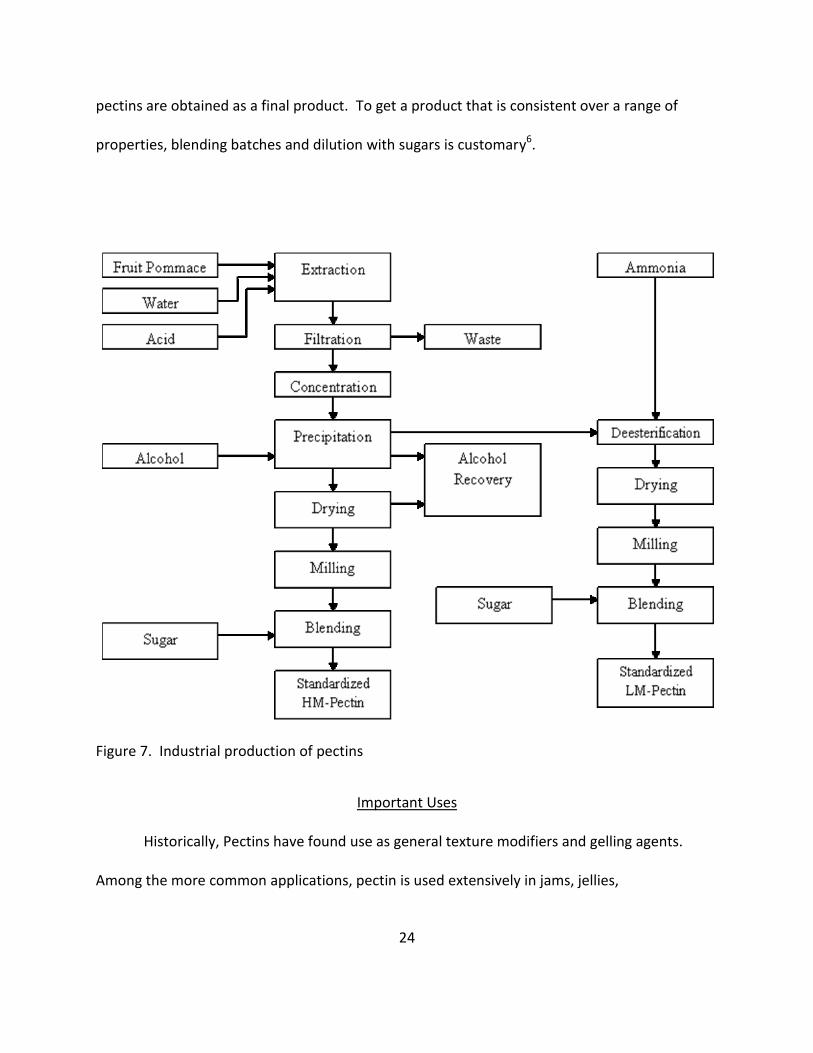
24
pectins are obtained as a final product. To get a product that is consistent over a range of
properties, blending batches and dilution with sugars is customary6.
Figure 7. Industrial production of pectins
Important Uses
Historically, Pectins have found use as general texture modifiers and gelling agents.
Among the more common applications, pectin is used extensively in jams, jellies,
25
confectionaries, deserts, yogurts, and anti-diarrheal agents. Some of the more important
modern uses include: 1) Ca2+ sequestering agent in detergents, 2) fillers in low calorie food
products, 3) edible acidifying agents, 4) rheology modification, 5) biodegradable surfactants and
emulsifiers, 6) edible packaging, 7) dairy stabilizers, and 8) dietary fat replacements (e.g.
Slendid™, GENU™, and Olestra™)33, 34.
Recently, new applications of pectin have become very important. Most prominent is
the treatment of wastewater effluents where pectin has found extensive use in treatment
regimens involving contamination with heavy metals. Pectins of most configurations show
affinity for complexation with metal ions in aqueous solutions. Also, as an excipient, pectin
efficiently encapsulates many pharmaceutical actives that are expatriated in the human large
intestine and colon thereby greatly increasing drug efficacy.
Commercially Important Measurables
Years of pectin research have produced several important commercial analytical
measures. While not all-inclusive, discussions of seven methods are included below.
Absolute, Relative, or Weight Average Molecular Weight
MW is a very important physical property of pectin. It is the most important
characteristic in determining the functional behavior of pectin. Gelling abilities of individual
pectins are tied very closely with MW.

26
Total % Galacturonic Acid (%GalA)
GalA content, as with MW measurement, is important to the gelling capabilities of given
pectin. For this measurement the polymer is degraded to monosaccharide via one of numerous
chemical or enzymatic methods and subsequently analyzed.
Degree of Esterification (DE, %DE)
DE is an important molecular index for pectin classification that describes the extent to
which carboxyl groups in pectin molecules exist as the methyl ester. Depending upon method
of analysis, %DE can be expressed as either the ratio of esterified carboxyl groups to total
carboxyl groups (100% theoretical maximum) or as percentage ester content (~ 16.3%
theoretical maximum). DE is measured through various techniques, but titrimetry is a long-
standing, classical method of DE determination35. For the titrimetric method the free carboxyl
groups are protonated via washing the pectin with acidic alcohol and then drying. Subsequent
dissolution in water and titration with a standard base, DE of the pectin sample is determined.
Acetyl content of the pectin can lead to overestimation of DE content. %DE can be calculated
as shown in Equation 1.
%𝐷𝐸 = 176 ×176 × 𝐶𝐻3𝑂%
31 × 𝐴𝑈𝐴%× 100 Equation 1
where AUA (GalA) is anhydrouronic acid content. In addition, 176 and 31 are MWs of AUA and
MeO respectively.
Degree of Methylation (%DM)
%DM is an important molecular index for pectin classification that describes the extent
to which carboxyl groups in pectin molecules exist as the methyl ester in ratio to all esterified
27
groups. Methoxyl content can be determined through enzymatic or alkaline demethylation.
Analysis of methanol is achieved through various techniques. Most notable of these is a
spectrophotometric technique involving reaction with potassium permanganate or alcohol
oxidase and subsequent condensation with pentane-2,4-dione to yield a colored product. A
common HPLC method36 provides simultaneous measure of methyl and acetyl content.
Degree of Amidation (%DA)
%DA is another important molecular index for pectin classification that describes the
extent to which carboxyl groups in pectin molecules exist as the amidated ester in ratio to all
esterified groups. This measure can be a fingerprint for pectin characterization.
Neutral Sugars
Total acid hydrolysis of a pectin sample is typically used to determine total neutral
monosaccharide content. This modern standard of analysis involves methanolysis with 2M HCl
prior to trifluoroacetic acid hydrolysis. Subsequent monosaccharides are converted to alditol
acetates and analyzed via GLC or HPLC with refractive index detection.
Random or Blockwise Carboxyl Distribution
Distribution pattern of esterification greatly influences gelling power or complexing
ability of a pectin polymer. This is a very important property for the emerging pharmaceutical
applications of pectin. Several methods exist for this determination including measurement via
UV-Vis with Ruthenium Red (RR), carbazole, or hydroxamic acid (hydroxylamine).
28
CHAPTER 2
TECHNIQUES FOR STRUCTURAL ANALYSIS OF PECTINS
Current research includes numerous techniques for structural analysis of pectins. No
one current method is all-inclusive. Therefore, analyses of pectins are a combination of many
techniques. Discussions of only the more common techniques are included in this chapter.
Enzymatic Analysis
Enzymatic analysis is an old technique having been used in the 1880s for starch and
sucrose in carbohydrates37. Availability of spectrophotometers after World War II allowed
widespread enzyme use in the analytical laboratory. Enzymes are highly specialized proteins
that exhibit catalytic activity towards specific substrates. Enzymes produced in higher plants or
microorganisms easily degrade pectic substances. This degradation produces textural changes
in fruits and vegetables during ripening, storage, and processing. Pectic enzymes comprise two
classes: esterases and depolymerases. Pectinesterases include many forms, such as methyl
esterase and acetyl esterase, which split off methoxyl and acetyl groups, respectively. Pectin
depolymerases, such as polygalacturonase and lyase, degrade the polymeric backbone by
cleaving α-D-(1→4) linkages. Another group of enzymes that achieve this same degradation via
β-elimination are characterized as transeleminases38.
Enzymatic degradation precedes several analytical measures for pectin characterization.
The enzymatic route of pectin analysis involves multiple steps and analyses of reactions or
products. This is conducive to real time, online analysis. This route is shown below:

29
pectinpectin esterase
demethylated pectin + CH3OH
demethylated pectinpolygalcturonase
galacturonic acid
galacturonic acidD-glucuronate isomerase
D-tagaturonic acid
D-tagaturonate + NADHtagaturonate reductase
D-altronate + NAD
For pectins, GC and HPLC analysis can be used to analyze the methanol released during the
reaction or the reduction of NADH can be spectrophotometrically measured at 340 nm.
Enzymes offer excellent specificity, high sensitivity, rapid sample preparation for
analysis, low-cost equipment, and ease of automation. Unfortunately, several enzymes used
for pectin analysis can often be quite expensive due to supply and demand. In addition, they
are prone to degradation after prolonged reaction times under conditions necessary for some
pectin analyses. Another disadvantage is factors affecting enzymatic determination must be
carefully controlled. The most important factor is temperature as higher temperatures increase
enzymatic activity but can quickly denature the enzyme. Temperature control is typically within
the range of +/- 0.1 °C37.
Most enzymes have a narrow pH range for optimal activity. Outside their pH range,
enzymes can be denatured and rendered ineffective. Therefore, buffer solutions are necessary
to maintain desirable conditions. Unfortunately, some characteristics of pectins preclude the
use of many common biological buffers. In addition, due to pectin’s high affinity for heavy
metals, it is common for some metal contamination to be present in a pectin preparation. This
cationic impurity can act as an inhibitor to the enzymatic catalysis and, thus, slow the desired
modification of the pectin.

30
Various techniques are used to measure the products of an enzymatic modification. As
hinted previously, spectrophotometric analysis is a common and preferred method. For
products that absorb appreciably in the ultraviolet, visible, or infrared region of the
electromagnetic spectrum, concentrations can be directly measured. Indicators are added to
produce colored complexes when native absorbances of the analytes are low. Pectins can
interact with added indicators through numerous mechanisms and produce desirable or
undesirable results.
Enzyme electrodes have also been commonly used to analyze specific carbohydrates.
The choice enzyme is immobilized upon a membrane or film coated electrode. For this system,
amperometric detection is commonly employed. Electrodes are available for the determination
of glucose, maltose, sucrose, lactose, and most importantly (for pectin analysis) galactose.
However, for the determination of galactose, galactose oxidase electrodes lack specificity.
Stoecker and Yacynyeh immobilized galactose oxidase on a solid resin support to produce a
column that catalyzes the oxidation of galactose to an aldehyde39. Hydrogen peroxide
produced in the reaction could be measured via amperometry or chemiluminescence.
Ultraviolet-Visible Spectrophotometry
Spectrophotometry is the quantitative study of electromagnetic spectra. A
spectrophotometer measures light intensity as a function of the wavelength of light. UV-Vis
spectroscopy optimally deals with the spectrum between 190-750 nm. The Beer-Lambert law
states that the absorbance of a solution is directly proportional to its concentration. Thus, UV-
31
Vis spectroscopy can be used to determine the concentration of a solution. The law is
expressed mathematically in Equation 2:
𝐴 = − log10(𝐼
𝐼0) = ℰ × 𝑐 × 𝐿 Equation 2
where 𝐴 is measured absorbance, 𝐼0 is intensity of incident light at measured wavelength, 𝐼 is
transmitted intensity through the sample, 𝐿 is the pathlength through the sample, 𝑐 the molar
concentration of the absorbing species, and ℰ the molar absorptivity given in 𝑚𝑜𝑙 𝑑𝑚3 . Molar
absorptivity is a constant, fundamental molecular property in a given molecule at a given
temperature and can easily be calculated using a solution of the compound with known
concentration. The Beer-Lambert Law is useful for characterizing many compounds but is not
universal. A second order polynomial relationship between absorption and concentration is
sometimes encountered for very large, complex molecules such as organic dyes (e.g. Acridine
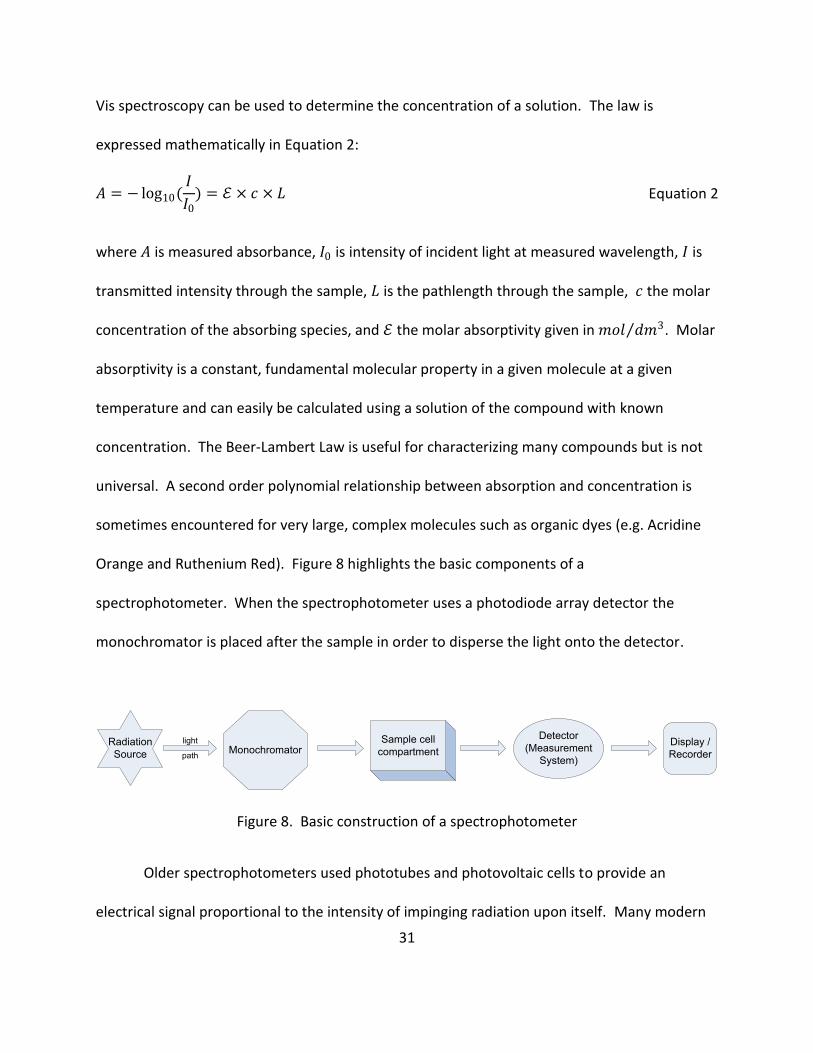
Orange and Ruthenium Red). Figure 8 highlights the basic components of a
spectrophotometer. When the spectrophotometer uses a photodiode array detector the
monochromator is placed after the sample in order to disperse the light onto the detector.
MonochromatorSample cell
compartmentRadiation
Source
light
path
Display /
Recorder
Detector
(Measurement
System)
Figure 8. Basic construction of a spectrophotometer
Older spectrophotometers used phototubes and photovoltaic cells to provide an
electrical signal proportional to the intensity of impinging radiation upon itself. Many modern
32
instruments are constructed as multichannel systems. This capability stems from the usage of a
silicon photodiode array as the detector. The diode arrays are an assembly of several hundred
silicon diodes detectors in a linear pattern on a silicon chip. These chips average 1 to 6 cm in
length with the width of individual diodes being 0.015 to 0.050 mm. The chip contains a switch
and capacitor for each diode element. A shift register closes each switch for a fraction of a
second in order to charge its companion capacitor to -5V. Impinging radiation on a diode
surface causes partial discharge of its matched capacitor, proportional to the incident light flux.
This lost charge is replaced during the next switching cycle. The amount of current needed for
this recharge is digitized into a useable signal. With one or more diode arrays placed along the
focal plane of a grating monochromator, the entire spectral wavelength can be measured
simultaneously within a fraction of a second.
Due to advances in instrument design, numerous accessories are available to
accommodate specialized functions. Some of the more important add-ons are special cell
holders, peristaltic pumps for continuous flow sample analysis, auto samplers, multi-cell
transporters, Peltier temperature controllers for thermostating, and advanced software for
time-series analysis.
Colorimetric Spectrophotometry
Colorimetric analysis (colorimetry) is an old and proven analytical technique. It is
traditionally a subset of visible spectroscopy. Colorimetry has the advantages of rapid analysis,
small sample size, versatility, inexpensive equipment, and good sensitivity. For pectins, total
AUA content is a very important measure40. While several analytical techniques40-43 currently

33
exist for this measure, due to the aforementioned traits (e.g. size of polymer and
heterogeneous nature), colorimetry is the most common44. In addition, industrial pectin
preparations appear to be similar on gross analysis but exhibit differing physical properties that
can be modeled, in part, through UV-Vis analysis. Through colorimetric analysis, the original
pectin polymer can be analyzed with minimal chemical modification45. Several of the more
common colorimetric methods follow.
First described by Bergman46, hydroxylamine has been used for many years as a
colorimetric reagent in the determination of amides. For this reaction, a concentrated aqueous
solution of hydroxylamine hydrochloride converts esters to hydroxamic acids. Red complex
formation of hydroxamic acid is measured at 600 nm. It is important to note PGA gives no
reaction with hydroxylamine.
Dische developed a method for quantitating uronic acids using carbazole in sulfuric
acid47. This method was inadequate in distinguishing between uronic acid monomers;
therefore, Dische further refined the procedure48. This newer method was able to distinguish
between GalA and other polyuronides. Exact timing of the reaction was critical to the
determination. In efforts to simplify the assay, numerous researchers have refined this method
but all suffered from lack of specificity49-53. An extensively modified version54 of this method
involves purification and solubilization of pectin with EDTA, deesterification with sodium
hydroxide and subsequent reaction with a pectinase. Further treatment with carbazole and
measurement at 530 nm determines AUA content. This reaction has limited interference from
organic acid, hydroxyl acids, and common sugars. Unfortunately, it does not discriminate

34
between uronic acids and hexoses. In addition, an amount of cross-reactivity occurs with
aldose sugars.
Orcinol has been extensively used to determine total uronic acid content of
polysaccharides55. For this method, a polyuronide is reacted with a modified Tollens’/Bial
reagent and the extinction coefficient measured at 650 nm. This method is very labor
intensive, lacks accuracy of other methods, and is highly sensitive to interferences such as
pentoses and furfurals.
A common reagent, 3,5-dimethylphenol is used to determine total uronic acid content
in polysaccharides56, 57. When pectin is hydrolyzed and the reagent added, a colored complex
is produced suitable for spectroscopic analysis. Absorbance is measured at 400 and 450 nm.
The calculated difference between these absorbances indicates amount of uronic acid in the
sample.
Developed by Thibault58, m-Hydroxydiphenyl assay has been extensively used to
determine total AUA content in pectin. When uronic acid is heated in concentrated sulfuric
acid/tetraborate and further treated with meta-hydroxydiphenyl, a chromogen develops. This
chromogen greatly reduces interferences of neutral sugars prevalent in other colorimetric
methods. In addition, specificity and increased sensitivity are enhanced versus other listed
colorimetric methods.
Metachromasy
Since the discovery of metachromasy in 1875, aggregation of cationic dyes with acid
polysaccharides in aqueous solutions has been extensively studied59-63. Higher MW

35
polysaccharides have been shown to produce metachromic shifts among popular cationic
dyes62-67. Metachromasy can occur through superposition of neighboring dye molecules caused
by coiling of the polymer chain. Also, Stone63 deduced that dye-dye interactions played a role
in metachromasy. Stoddart68 explained both a spectral shift and hyperchromic effect caused by
interaction of RR and PGA. Stoddart’s study postulated RR would continue to interact with
pectin even after full protonation of the pectin carboxyl groups.
Complexometric Analysis
Recent in vitro studies have shown varying levels of pectin complexation with divalent
and trivalent metal cations69, 70. These studies indicated different classes of pectin show high
selectivity toward metal ions. Thus, differentiation of unknown aqueous pectins can be
achieved by targeted complexation and precipitation by select metal cations. Binding affinity69,
70 is generally in the order of Cu2+≈Pb2+ >> Co2+≈V2+≈Zn2+ > Cd2+≈Ni2+ > Ca2+ with several other
metal cations known to form complexes with pectin. Researchers have shown different classes
of pectin (e.g. citrus, apple, sugar beet, etc.) to be highly selective within each of these
categories.
Molecular Weight Determination
'Molecular weight' (MW) or 'relative molecular mass' is a fundamental parameter in
characterizing a macromolecule. Despite this fundamental nature, polysaccharides have
proven very difficult to analyze. Theory and practice suggest numerous reasons for this but can
be summarized within four basic categories that are true for all polysaccharides. First is
polydispersity where the polymer consists of chains of multiple and different MW species.
36
Next, the polymer can be thermodynamically non-ideal. This results when high thermodynamic
exclusion volumes result from high solvent affinity or asymmetry. A further complication here
is the polymer can exhibit polyelectrolyte behavior. Analytical techniques whose results rely
upon certain assumptions about chain conformation can be seriously affected by the polymer
in solution (e.g. MW). Finally, numerous polysaccharides aggregate in aqueous solutions giving
rise to false MW determinations. This is partly indicative of the large diversity of data reported
in literature.
The performance of pectin as a gelling or thickening agent is diminished by the presence
of low MW components in the MW distribution. As mentioned, measuring MW of pectins and
other naturally occurring polysaccharides is difficult due to their polydisperse nature and the
tendency to form aggregates in aqueous solutions. This lends to the diverse data recorded in
literature for pectins. All MW methods fit into one of three categories: absolute, relative, and a
combination of both. Absolute techniques include light scattering71, 72, membrane
osmometry73, and sedimentation equilibrium74. Being absolute, these methods do not require
comparison to a known standard. Light scattering is the most common technique for pectin
analysis. However, light scattering is very susceptible to error caused by chain aggregation.
Relative techniques include gel permeation chromatography (GPC)75, 76, viscometry76,
and sedimentation velocity77. These methods require standardization against a known MW
compound. For gel permeation, neutral, particulate gel media has been shown to give
separations based upon size of components in a mixture. It is important to note this method is
both nondestructive and occurs under mild conditions. In addition, for most separations,

37
composition of the mobile phase does not play a large role. This gives the advantage of being
able to choose a suitable mobile-phase based upon particular species of interest. However,
because of this phenomenon, gradient elutions are not available for this type of analysis.
As mentioned, particulate gels comprise the stationary phase within which the solute
can penetrate through the entire volume of the compacted particles. Adsorption is an
undesirable trait for this type of analysis. Therefore, conditions are chosen so that elution
volumes depend only on the sizes of solutes. Large solutes elute first due to lack of penetration
into the particulate bed. GPC, like other chromatographic techniques, are governed by the van
Deemter equation.
Recent years have seen the introduction of new methods relying on a combination of
absolute and relative measurements to provide a more complete MW profile of a complex
carbohydrate78.
38
CHAPTER 3
METHODOLOGY
The following sections describe historical techniques and proposed research and
provide a cursory examination of the techniques and methods used to develop this study.
Spectrophotometry
A Hewlet Packard 8452A instrument was used for experimentation. The HP 8452A
Diode-Array Spectrophotometer is a single-beam, microprocessor-controlled
spectrophotometer.
The 8452A spectrophotometer uses a photodiode array consisting of 316 elements each
with a dimension of 18 x 0.5 mm. The dispersion of the grating and the size of the diode
elements are such that a resolution of 2 nm is realized throughout the UV-Visible range of 190
to 820 nm. With this installed photodiode array, few optical components are needed thus
resulting in a radiation throughput much higher than that of traditional spectrophotometers.
This throughput allows a single, low-noise deuterium lamp to be used as the source for not only
the ultraviolet but for the visible region of the spectrum as well. Additionally, sample
photodecomposition is minimal, in comparison to traditional instruments, due to very short
exposure times.
For experimentation, precisely matched, fused quartz, 1 cm path-length, low-volume
cuvettes are used. During analysis, the source polychromatic light is collimated and passes
through the sample onto the monochromator entrance slit. From there, the beam passes onto
a fixed, aluminum-coated holographic grating to disperse onto the photodiode array. Because
39
the system employs no moving parts, wavelength reproducibility from scan to scan is extremely
high (± 0.05 nm) and a single scan only requiring 0.1 s. To improve measurement precision, the
instrument scans the spectra over a 3 s time interval and records the spectral mean and
standard deviation at each wavelength. Extreme stability of the source and electronic system is
such that the signal of the blank only need be analyzed every 5 to 10 minutes.
Gel-Permeation Chromatography
The origins of chromatography dates to 1906 when discovered by Russian botanist,
Mikhail Tswett, while analyzing and separating vegetable pigments79. Tswett named the
process chromatography from the Greek words chroma and graphy translated as “color
writing”. For chromatography, the analyte must be dissolved into a liquid that is then passed
into the chromatographic device containing fixed chromatographic particles. Liquid
Chromatography is a type of chromatography employing a liquid mobile phase and a finely
divided, immobilized stationary phase. Although many classical chromatographic techniques
exist, modern HPLC did not come into existence until 1967 with the development of
technologies allowing its advancement80. The name High Performance Liquid Chromatography
was coined to distinguish these newer techniques from their classical counterparts. Several
types of HPLC are commonly employed. Gel-Permeation Chromatography (GPC) is a modern
variation of High Performance Liquid Chromatography (HPLC) relying on size-exclusion
principles for non-polar species. Because of its wide versatility and applicability, HPLC is one of
the most commonly used separation techniques today.
40
Liquid-chromatographic columns are mostly constructed from stainless steel but heavy-
walled glass tubing is sometimes employed for specific analyses. A typical column length is 10
to 30 cm with an inner diameter of 4 to 10 mm. Column packings are as diverse as the types of
analyses performed but typically have particle sizes of 5 to 10 µm. Sepharose™ is a common
stationary phase used for polysaccharide analysis as it provides good separation for a wide
range of these polymers. Sepharose is a cross-linked, beaded form of agarose providing gel
filtration in a broad fractionation range. Agarose contents are available in 2%, 4%, and 6% and
marketed as 2B, 4B, and 6B respectively.
No highly sensitive, universal detector system exists for GPC. However, refractive index
(RI) is used in this project as it has found considerable use in modern GPC and HPLC analysis in
general. Measurement is based upon changes in the refractive index of the solvent that is
caused by analyte molecules. Refractive index is a general rather than selective method as it
reacts to the presence of all solutes in a solvent. RI detectors are sensitive to temperature
change, pressure, and solvent composition. All solvents used for the mobile phase must be
carefully degassed and the detector thermostated. This detector suffers from limited sensitivity
with a LOD of 100 ng to 1 µg. However, refractive index has an order of magnitude higher
sensitivity than light scattering detection.
Colorimetry
Carboxyl substitution pattern and MW play a vital role in pectin's ability to form
complexes especially with heavy metals69, 70, 81. Ruthenium Red (RR) has been shown as an

41
acceptable indicator for measuring distribution patterns under controlled conditions45 (< 60%
DE); however, numerous interferences occur with the measurement.
Acridine Orange (AO), Nile Blue (NB), and several other cationic dyes have traditionally
been used as biological stains for polyanions in uncontrolled conditions62, 63, 82, 83. It is unknown
if these dyes will interact reproducibly with pectin of up to and beyond 60% DE nor suffer from
the same interferences as RR.
Hydroxylamine
Hydroxylamine has a long history of use in colorimetric analysis46. The predominate
method involves mixing 0.5 mL 2 N hydroxylamine hydrochloride (in 60% ethanol) with 0.5 mL
of 3.5 N sodium hydroxide. This solution is added to 2 mL of a 1% (w/v) solution of pectin and
mixed gently at 25°C for 2 hours. After reaction, add 1 mL of 3.5 N hydrochloric acid with
mixing and follow with 1 mL of 0.74 M ferric chloride in 0.1 N hydrochloric acid. Red complex
formation is measured at 600 nm.
Carbazole
Carbazole colorimetric methods continue to be a popular method for carbohydrate
analysis. The method as pertains to pectins is as follows. Moisten 1.0 g of 70% ethanol-
extracted pectin in a 250 mL beaker with 95% ethanol. To the beaker, add 200 mL of 0.5%
EDTA in order to complex the divalent pectic cations and thereby dissolve. Adjust to pH 11.5
with 1 N sodium hydroxide and hold at 25°C for 30 minutes. Adjust to pH 5.0 with acetic acid
and add 0.1 g of pectinase with stirring. Mix for 1 hour and dilute to 250 mL. Discard initial
small amount of filtrate but retain remainder for carbazole analysis. For AUA analysis, cool 12

42
mL of conc. hydrochloric acid in a test tube to 3°C. To this, add 2 mL aliquot of galacturonide
solution and mix thoroughly at low temperature. Heat for 10 min in boiling water, cool to 20°C,
and add 1.0 mL 0.15% carbazole solution. Let stand at room temperature for 25 min. and
measure AUA at 520 nm using a standard curve.
Proposed Research
The analysis of complex polysaccharides presents a challenge. As previously mentioned,
RR can be used as a colorimetric technique to characterize directly or indirectly several
properties of Pectin. However, in colorimetric analysis of carbohydrates, RR has been shown to
lack specificity and suffer numerous interferences. Researchers are beginning to explore
relationships of complex biopolymers and carbohydrates as they relate to alternative cationic
dyes84. Cationic dye research, as it relates to the field of food science, is still yet relatively
unexplored due to the numerous problems previously discussed. While numerous analytical
methods exist for food polysaccharide analysis11, 27, 35, 78, many are difficult, labor intensive,
time consuming, suffer from interferences, or expensive. Therefore, the primary focus of this
research is to determine if several classes of laboratory grade pectins of known composition
will show reproducible spectrophotometric performance, similar to RR, with a selection of
cationic dyes. Additionally, the analysis should be relatively quick, inexpensive, show good
selectivity, and require little chemical modification of the pectin polymer. The proposed
objectives of this project are described below.
43
1. To investigate if any of the following metachromic, cationic dyes provide qualitative
or quantitative interaction with pectin: Aniline Blue, Toluidine Blue, Congo Red,
Coriphosphine O, Alcian Blue, Nile Blue, and Acridine Orange.
2. To investigate if any of the listed dyes can be used alone or in conjunction with other
dyes to differentiate spectrophotometrically between pectin of known and unknown
composition including DE above ca. 70% (upper practical limit for RR).
3. To investigate if lab grade or consumer grade pectins cause metachromic
aberrations in the cationic dyes such that these provide a "fingerprint" for a
particular pectin type at any concentration
4. To investigate if MW (by GPC) has an effect on the above characterization
techniques
44
CHAPTER 4
EXPERIMENTAL PROCEDURES, RESULTS, AND DISCUSSION
The following sections describe the experimental procedures performed in order to
develop a scientific understanding of pectin/cationic dye relationships.
Reagents
The list of reagents used for this project, their grades, suppliers, information, and
chemical structure (where applicable) is given below.
Deionized, ultrapure, filtered water was obtained from a Millipore Q™ distillation
apparatus provided by Continental Water System (Millipore, Bedford, MA).
Copper II Sulfate, 100% purity was obtained from J.T. Baker (Phillipsburg, NJ).
Lead Acetate, 100% purity was obtained from EMD Chemicals Inc. (Gibbstown, NJ).
Ethanol, 95% purity, and Glacial Acetic acid, 99.5% purity was provided by Eastman
Chemical Company (Kingsport, TN) and diluted to 50% (v/v) with Millipore Q distilled water.
Polygalacturonic acid (from Orange), 95% purity, lot 407261, was obtained from Fluka
Chemical Corporation (Milwaukee, WI).
Consumer canning pectin SureGel #1: “Low Sugar” Lot #: 08 May 2005 D4 10:52,
SureGel #2: “Normal Sugar” Lot #: 25 Nov 2005 D4 02:48Supplier: Kraft Foods Global, Inc.
(Northfield, IL).
Coriphosphine O or 3-amino-6-(dimethylamino)-2-methylacridine monohydrochloride
(Figure 9), 100% purity, was obtained from Trust Chemicals Industry (Port Said, Egypt).

45
Figure 9. Chemical structure of Coriphosphine O
3-Morpholinopropanesulfonic acid (MOPS) (Figure 10), 100% purity, was obtained from
Lancaster Synthesis, Inc. (Pelham, NH).
S
O
O
HO
O
N
Figure 10. Chemical structure of MOPS
The following compounds were obtained from Sigma-Aldrich (St. Louis, MO): 2-
propanol, 99% purity, Pectinesterase enzyme, from orange peel, ammonium sulfate
suspension, 50-350 units/mg protein, Trichloroacetic acid, 99% purity, Apple Pectin, 9.5%
methyl esterification, 88% galacturonic acid content, 75% DE, lot 67H16351, Citrus Pectin, 12%
methyl esterification, 82% galacturonic acid content, 92% DE, lot 116H0569, Ruthenium Red or
ammoniated ruthenium oxychloride ([(NH3)5RuORu(NH3)4ORu(NH3)5]Cl6) (Figure 11), 100%
purity, Sodium Titriplex™ Salt or trans-1,2-Diaminocyclohexane-N,N,N',N'-tetraacetic acid,
monohydrate sodium salt (Na-CyDTA) (Figure 12), 100% purity, Aniline Blue, a mixture of
Methyl Blue and Water Blue (Figure 13), 100% purity, Toluidine Blue or Tolonium Chloride
(Figure 14), 87% purity, Congo Red or benzidinediazo-bis-1-naphtylamine-4-sulfonic acid
NN NH2
Cl
H

46
sodium salt (Figure 15), 0.1 wt% solution, Alcian Blue, a copper phthalocyanine dye (Figure 16),
52% purity, Nile Blue (Figure 17), 75% purity, Acridine Orange (Figure 18), 90% purity.
H3N Ru O Ru O Ru NH3
H3N NH3
H3N NH3
NH3H3N
H3N NH3
H3N NH3
H3N NH3
6Cl-
6+
Figure 11. Chemical structure of Ruthenium Red
N
N
O
+Na-O
O
+Na-O
O
+Na-O
O
O-Na+
H2O
Figure 12. Chemical structure of Na-CyDTA
Figure 13. Chemical structure of Methyl Blue and Water Blue
N
S NH2N+
Cl-
Figure 14. Chemical structure of Toluidine Blue

47
NH2
SO
O O-Na+
N
N N
N
H2N
S O-Na*
OO
Figure 15. Chemical structure of Congo Red
Cu
N
N
N N
2+
S
N
N
H3C
H3C
CH3H3C
Cl-
N N
NN
SN
CH3
H3C
N
H3C CH3
Cl-
S N
N
CH3
CH3
H3C CH3
S
N
N
H3C
CH3
CH3
CH3
Cl-
Cl-
Figure 16. Chemical structure of Alcian Blue
48
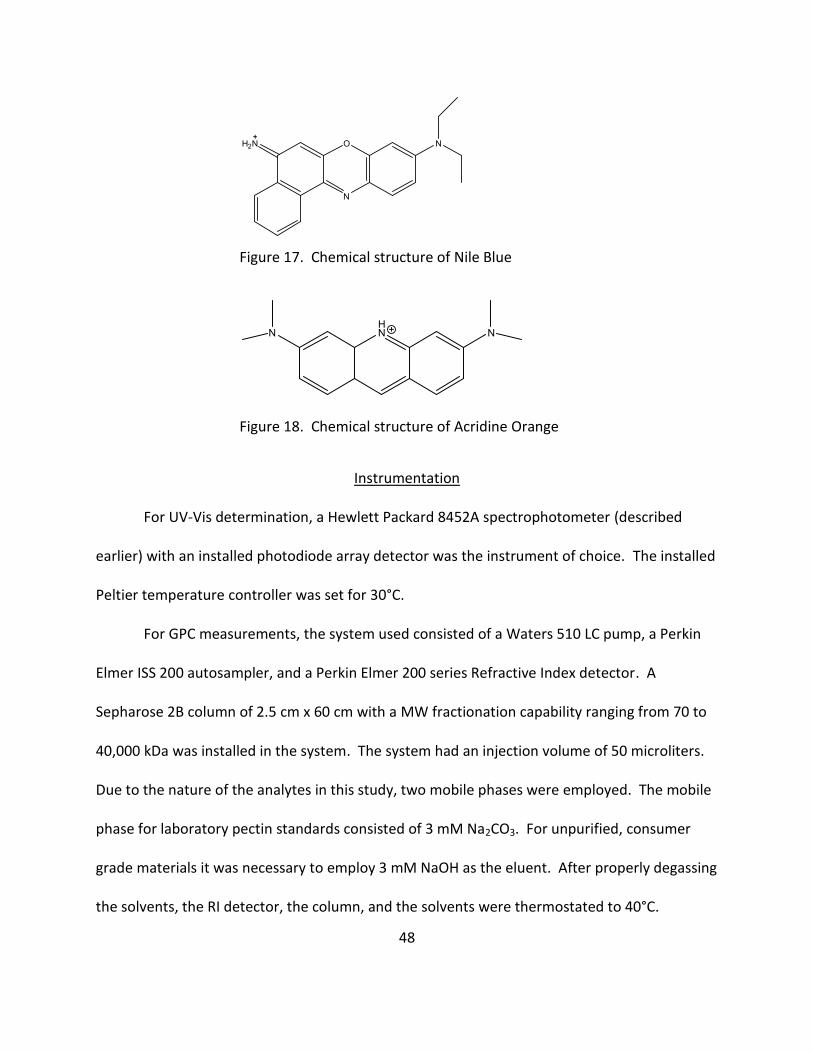
N
OH2N N
Figure 17. Chemical structure of Nile Blue
HNN N
Figure 18. Chemical structure of Acridine Orange
Instrumentation
For UV-Vis determination, a Hewlett Packard 8452A spectrophotometer (described
earlier) with an installed photodiode array detector was the instrument of choice. The installed
Peltier temperature controller was set for 30°C.
For GPC measurements, the system used consisted of a Waters 510 LC pump, a Perkin
Elmer ISS 200 autosampler, and a Perkin Elmer 200 series Refractive Index detector. A
Sepharose 2B column of 2.5 cm x 60 cm with a MW fractionation capability ranging from 70 to
40,000 kDa was installed in the system. The system had an injection volume of 50 microliters.
Due to the nature of the analytes in this study, two mobile phases were employed. The mobile
phase for laboratory pectin standards consisted of 3 mM Na2CO3. For unpurified, consumer
grade materials it was necessary to employ 3 mM NaOH as the eluent. After properly degassing
the solvents, the RI detector, the column, and the solvents were thermostated to 40°C.
49
The following miscellaneous equipment was also employed: Parafilm® (Pechiney Plastic
Packaging, Chicago, IL), High Shear Omni Mixer homogenizer (Omni International, Marietta,
GA), Eppendorf adjustable pipettes with removable tips and an Eppendorf micro-centrifuge
(Westbury, NY), polypropylene, factory sterilized, snap-cap micro-centrifuge tubes (Bio Plas Inc,
San Rafael, CA), and a Vortex-Genie® 2 (Scientific Instruments Inc., Bohemia, NY).
Preparation of Reagents and Stock Solutions
The following reagents were prepared as described below.
1. Sodium Hydroxide (1 M): In 50-mL volumetric flask, dissolved 2 g of solid sodium
hydroxide in Millipore Q water.
2. MOPS Buffer (0.10 M): In 1-L volumetric flask dissolved 20.92 g of 3-
morpholinopropanesulfonic acid in Millipore Q water and adjusted to pH 6.5 with
sodium hydroxide from reagent 1 above.
3. Copper II Sulfate (0.010 M): In 50-mL volumetric flask, dissolved 0.10 g of copper II
sulfate and 0.75 mg of 2-propanol in MOPS buffer from reagent 2 above.
4. Lead Acetate (0.60 M): In 50-mL volumetric flask, dissolved 11.38 g of lead acetate in
MOPS buffer from reagent 2 above and refrigerated. Solution has shelf life of 2
days.
5. CyDTA (0.020 M): In 500-mL volumetric flask, dissolved 45.28 g of sodium titriplex
with MOPS buffer from reagent 2 above.

50
Preparation of Standard Solutions
Stock standard solutions were prepared for polygalacturonic acid (PGA), apple pectin,
citrus pectin, ruthenium red, aniline blue, toluidine blue, congo red, coriphosphine o, alcian
blue, nile blue, and acridine orange.
Dye standards were prepared as described below. When not in use, these solutions
were sealed with Parafilm and stored refrigerated.
1. Ruthenium Red (0.25 mM): In 10-mL volumetric flask, dissolved 2 mg of ruthenium
red in MOPS buffer.
2. Aniline Blue (0.125 mM): In 10-mL volumetric flask, dissolved 1 mg of aniline blue in
MOPS buffer.
3. Toluidine Blue (0.0625 mM): In 10-mL volumetric flask, dissolved 0.57 mg of
toluidine blue in MOPS buffer.
4. Congo Red (0.125 mM): In 10-mL volumetric flask, diluted 1 mL of congo red in
MOPS buffer.
5. Coriphosphine O (0.25 mM): In 10-mL volumetric flask, dissolved 2 mg of
coriphosphine o in MOPS buffer.
6. Alcian Blue (0.25 mM): In 10-mL volumetric flask, dissolved 1.52 mg of alcian blue
dye in MOPS buffer.
7. Nile Blue (0.125 mM): In 10-mL volumetric flask, dissolved 1.25 mg of NB in MOPS
buffer.
51
8. Acridine Orange (0.125 mM): In 10-mL volumetric flask, dissolved 1.1 mg of AO in
MOPS buffer.
Pectin standards sample were prepared as described below. When not in use, these
solutions were sealed with Parafilm and refrigerated.
1. The pectin source was dried in a standard laboratory vacuum oven in vacuo at 45°C
for 24 hours.
2. Dried pectin obtained in Step 1 was used to prepare a 2 wt% solution by slow
addition of pectin powder, 2 g, to 100 mL room temperature Millipore Q water. To
prevent clumping, this addition was accompanied with homogenation.
3. The solution in Step 2 was gently mixed for 1 hour to allow for complete dissolution
of any impurities present in the pectin sample.
4. From the solution in Step 3, pectin was precipitated by adding 7.5 mL of 10 mM
copper II reagent.
5. The precipitate in Step 4 was filtered onto a medium fritted funnel and washed with
four 500 mL volumes of 5% ethanol.
6. The solid in Step 5 was re-dissolved in 100 mL of 20 mM sodium titriplex (Na-CyDTA)
reagent.
7. The solution obtained in Step 6 was acidified to pH 5 with 50% acetic acid reagent.
8. The acidified solution in Step 7 was placed into a 5000 MW-cutoff cellulosic
membrane dialysis tube and dialyzed against a countercurrent flow of distilled water
for 14 hours.

52
9. The purified pectin solution from Step 8 was slowly added to 300 mL of 95% ethanol
to precipitate solid pectin.
10. The precipitate from Step 9 was filtered on a medium fritted funnel and dried in a
standard laboratory vacuum oven at 45°C in vacuo for 24 hours.
11. Dried solid from Step 10 was used to prepare a 0.2 wt% solution by slow addition of
0.02 g powder to 0.1M MOPS buffer reagent, with mixing, to a 10-mL volumetric
flask. This standard solution was sealed with Parafilm and refrigerated when not in
use.
Preparation of Commercial Samples
Consumer grade commercial samples in powder form were purchased from local
retailers. As discussed previously, consumer pectins are sold in two varieties: regular and low
sugar. Manufacturer information does not include pectin source or content of these materials.
Only the moniker of “Low Sugar” infers a pectin of low %DM and high calcium content. The
“normal sugar” pectins are assumed high %DM material with low MW sugar content > 55%
(w/w) based upon accepted prior scientific knowledge. Each sample was prepared as described
below without further purification.
1. The source sample was dried in a standard laboratory vacuum oven in vacuo at 45°C
for 24 hours.
2. Dried solid from Step 1 was used to prepare a 0.2 wt% solution by slow addition of
0.04 g powder (assumed 50% by weight to be low MW sugars) to 0.1 M MOPS buffer
reagent, with mixing, to a 10-mL volumetric flask.
53
3. The solution in Step 2 was sealed with Parafilm and refrigerated when not in use.
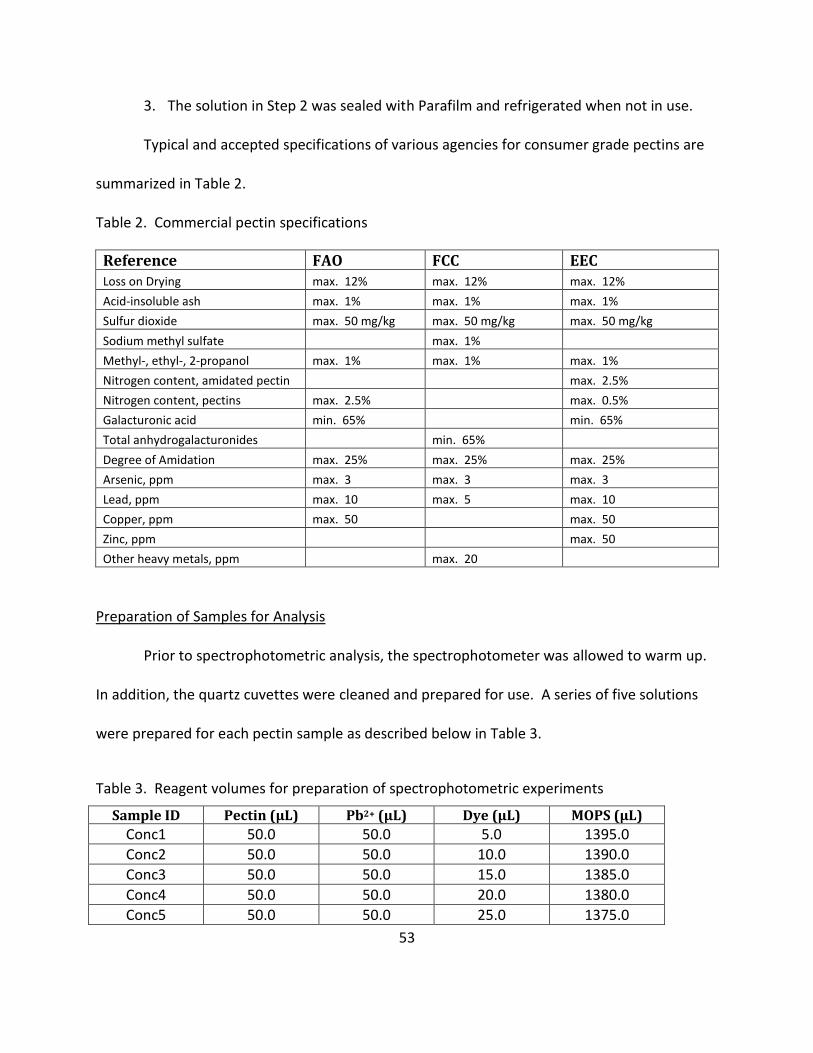
Typical and accepted specifications of various agencies for consumer grade pectins are
summarized in Table 2.
Table 2. Commercial pectin specifications
Reference FAO FCC EEC Loss on Drying max. 12% max. 12% max. 12%
Acid-insoluble ash max. 1% max. 1% max. 1%
Sulfur dioxide max. 50 mg/kg max. 50 mg/kg max. 50 mg/kg
Sodium methyl sulfate max. 1%
Methyl-, ethyl-, 2-propanol max. 1% max. 1% max. 1%
Nitrogen content, amidated pectin max. 2.5%
Nitrogen content, pectins max. 2.5% max. 0.5%
Galacturonic acid min. 65% min. 65%
Total anhydrogalacturonides min. 65%
Degree of Amidation max. 25% max. 25% max. 25%
Arsenic, ppm max. 3 max. 3 max. 3
Lead, ppm max. 10 max. 5 max. 10
Copper, ppm max. 50 max. 50
Zinc, ppm max. 50
Other heavy metals, ppm max. 20
Preparation of Samples for Analysis
Prior to spectrophotometric analysis, the spectrophotometer was allowed to warm up.
In addition, the quartz cuvettes were cleaned and prepared for use. A series of five solutions
were prepared for each pectin sample as described below in Table 3.
Table 3. Reagent volumes for preparation of spectrophotometric experiments
Sample ID Pectin (µL) Pb2+ (µL) Dye (µL) MOPS (µL)
Conc1 50.0 50.0 5.0 1395.0
Conc2 50.0 50.0 10.0 1390.0
Conc3 50.0 50.0 15.0 1385.0
Conc4 50.0 50.0 20.0 1380.0
Conc5 50.0 50.0 25.0 1375.0
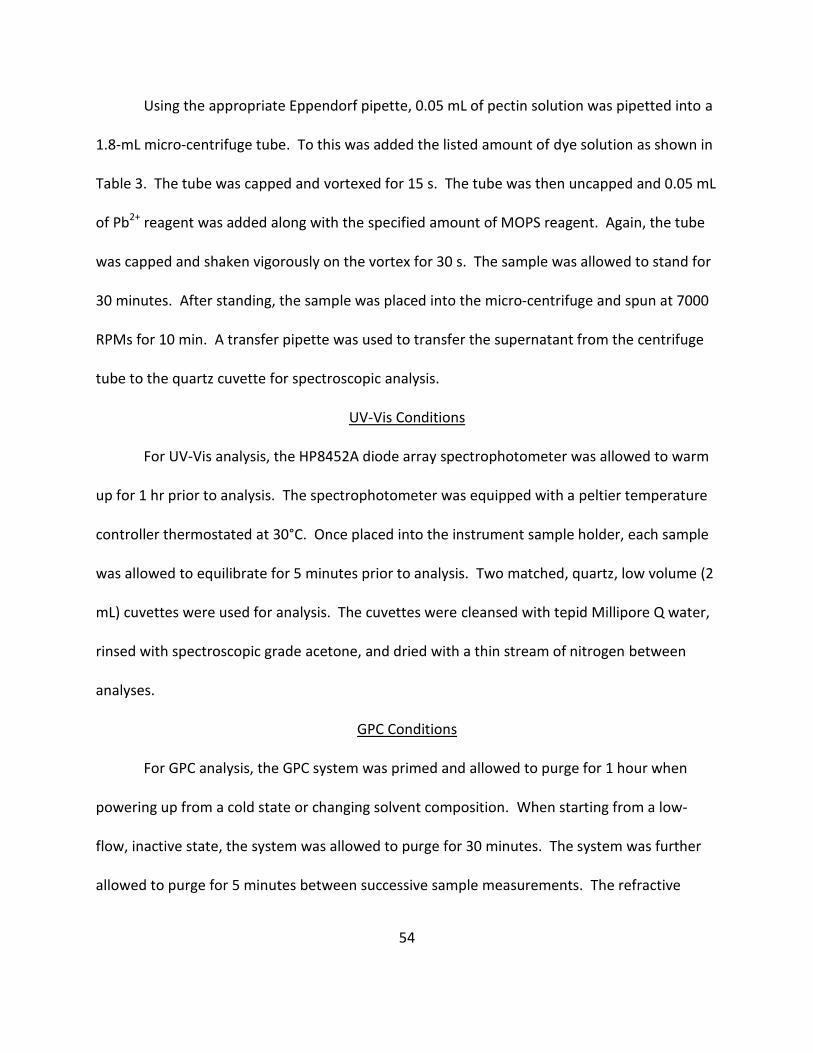
54
Using the appropriate Eppendorf pipette, 0.05 mL of pectin solution was pipetted into a
1.8-mL micro-centrifuge tube. To this was added the listed amount of dye solution as shown in
Table 3. The tube was capped and vortexed for 15 s. The tube was then uncapped and 0.05 mL
of Pb2+ reagent was added along with the specified amount of MOPS reagent. Again, the tube
was capped and shaken vigorously on the vortex for 30 s. The sample was allowed to stand for
30 minutes. After standing, the sample was placed into the micro-centrifuge and spun at 7000
RPMs for 10 min. A transfer pipette was used to transfer the supernatant from the centrifuge
tube to the quartz cuvette for spectroscopic analysis.
UV-Vis Conditions
For UV-Vis analysis, the HP8452A diode array spectrophotometer was allowed to warm
up for 1 hr prior to analysis. The spectrophotometer was equipped with a peltier temperature
controller thermostated at 30°C. Once placed into the instrument sample holder, each sample
was allowed to equilibrate for 5 minutes prior to analysis. Two matched, quartz, low volume (2
mL) cuvettes were used for analysis. The cuvettes were cleansed with tepid Millipore Q water,
rinsed with spectroscopic grade acetone, and dried with a thin stream of nitrogen between
analyses.
GPC Conditions
For GPC analysis, the GPC system was primed and allowed to purge for 1 hour when
powering up from a cold state or changing solvent composition. When starting from a low-
flow, inactive state, the system was allowed to purge for 30 minutes. The system was further
allowed to purge for 5 minutes between successive sample measurements. The refractive
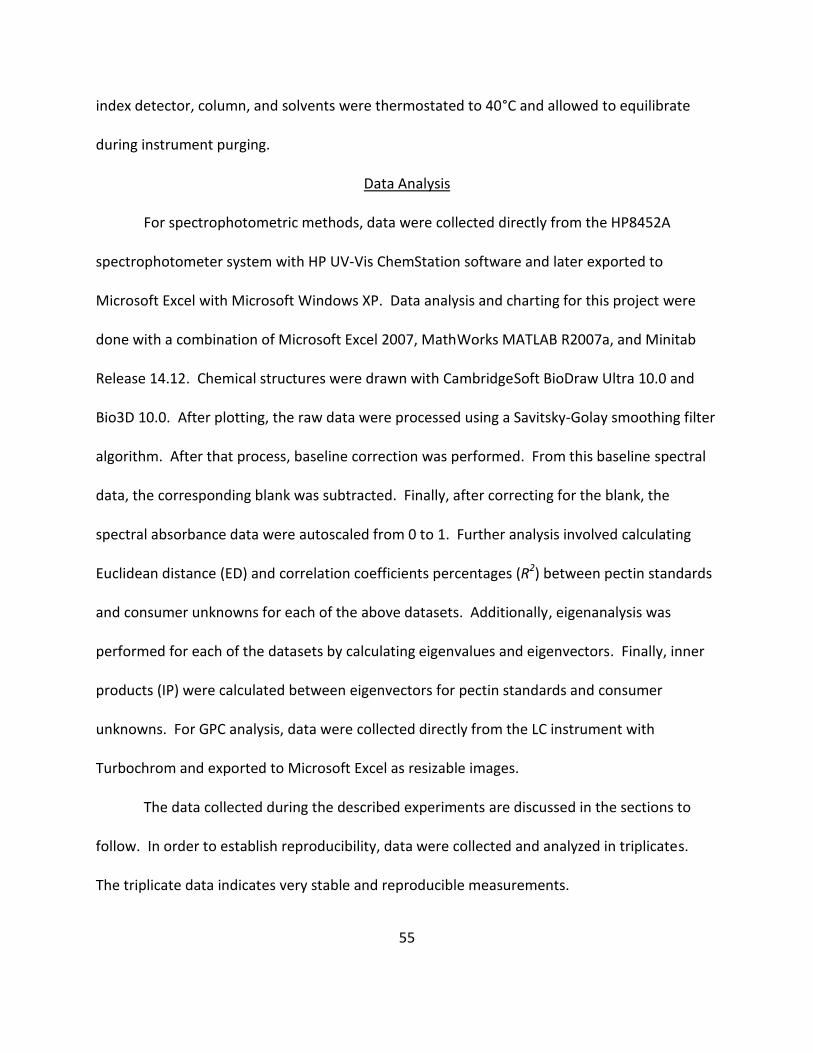
55
index detector, column, and solvents were thermostated to 40°C and allowed to equilibrate
during instrument purging.
Data Analysis
For spectrophotometric methods, data were collected directly from the HP8452A
spectrophotometer system with HP UV-Vis ChemStation software and later exported to
Microsoft Excel with Microsoft Windows XP. Data analysis and charting for this project were
done with a combination of Microsoft Excel 2007, MathWorks MATLAB R2007a, and Minitab
Release 14.12. Chemical structures were drawn with CambridgeSoft BioDraw Ultra 10.0 and
Bio3D 10.0. After plotting, the raw data were processed using a Savitsky-Golay smoothing filter
algorithm. After that process, baseline correction was performed. From this baseline spectral
data, the corresponding blank was subtracted. Finally, after correcting for the blank, the
spectral absorbance data were autoscaled from 0 to 1. Further analysis involved calculating
Euclidean distance (ED) and correlation coefficients percentages (R2) between pectin standards
and consumer unknowns for each of the above datasets. Additionally, eigenanalysis was
performed for each of the datasets by calculating eigenvalues and eigenvectors. Finally, inner
products (IP) were calculated between eigenvectors for pectin standards and consumer
unknowns. For GPC analysis, data were collected directly from the LC instrument with
Turbochrom and exported to Microsoft Excel as resizable images.
The data collected during the described experiments are discussed in the sections to
follow. In order to establish reproducibility, data were collected and analyzed in triplicates.
The triplicate data indicates very stable and reproducible measurements.

56
Verification of Current Ruthenium Red Substitution Pattern Technique
The citrus standard of this study was subjected to a previously devised experiment by
Hou et al.45 in order to verify RR does interact with the pectin. The 92% DE citrus pectin
standard was used to prepare two distinct carboxyl distribution patterns by the following
methods. The method of Thibault and Rinaudo85 was used to produce a random esterification
pattern along the polymer backbone. A 0.5 wt% solution of pectin was prepared in 0.5 M
sodium hydroxide and stirred gently at 5°C. Aliquots were taken and neutralized with 1 N
hydrochloric acid. The pectin was precipitated with three volumes of 2-propanol (isopropyl
alcohol), filtered, washed with acetone, and dried overnight at 40°C in vacuo. The method of
Powell et al.86 was used to prepare a blockwise carboxyl distributed pectin. A solution of 1.5 g
citrus pectin in 0.1 M sodium chloride, at pH 6.8, was mixed with 40 mg/100 mL pectinesterase
and digested at 25°C. Aliquots were taken over the course of the reaction and quenched with
0.1 wt% trichloroacetic acid, precipitated with three volumes of isopropyl alcohol, filtered,
washed with acetone, and dried overnight at 40°C in vacuo.
For spectrophotometric analysis of each of the above samples, solutions of 0.1% (w/v)
pectins were prepared in 100 mM MOPS buffer as previously described. Each sample was
doped with 0.5 mL of 0.02% RR, mixed, and allowed to stand for 5 minutes. Upon standing, 0.5
mL of 0.6 M lead acetate was added to each in order to precipitate pectin. The mixtures were
centrifuged at 1,400 g for 15 minutes. The absorbances were measured at 534 nm and
recorded. A blank was prepared without pectin and subtracted from each of the measured
absorbances with the results shown in Figure 19.
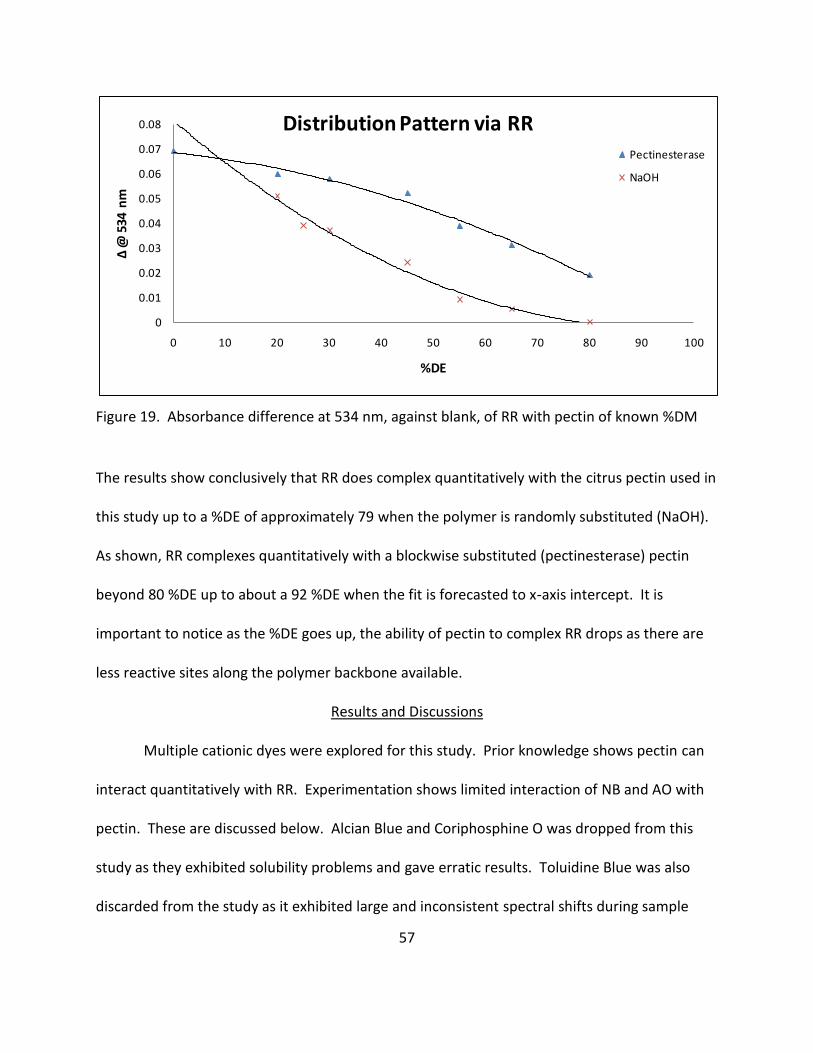
57
Figure 19. Absorbance difference at 534 nm, against blank, of RR with pectin of known %DM
The results show conclusively that RR does complex quantitatively with the citrus pectin used in
this study up to a %DE of approximately 79 when the polymer is randomly substituted (NaOH).
As shown, RR complexes quantitatively with a blockwise substituted (pectinesterase) pectin
beyond 80 %DE up to about a 92 %DE when the fit is forecasted to x-axis intercept. It is
important to notice as the %DE goes up, the ability of pectin to complex RR drops as there are
less reactive sites along the polymer backbone available.
Results and Discussions
Multiple cationic dyes were explored for this study. Prior knowledge shows pectin can
interact quantitatively with RR. Experimentation shows limited interaction of NB and AO with
pectin. These are discussed below. Alcian Blue and Coriphosphine O was dropped from this
study as they exhibited solubility problems and gave erratic results. Toluidine Blue was also
discarded from the study as it exhibited large and inconsistent spectral shifts during sample
0
0.01
0.02
0.03
0.04
0.05
0.06
0.07
0.08
0 10 20 30 40 50 60 70 80 90 100
Δ @
534
nm
%DE
Distribution Pattern via RRPectinesterase
NaOH

58
analysis. Aniline Blue and Congo Red were also dropped from the study as they precipitated
out of solution upon addition of other necessary reagents. Numerous trials with RR, AO, and
NB were attempted until the optimal concentrations for this study were determined.
Optimization of Spectral Detail, Manipulation, and Analysis
The microprocessor evolution has enabled the chemist to collect vast amounts of
information quickly. The bottleneck has rapidly become data interpretation and processing.
With the rise of computerized instrumentation, sequential digitized signals have become
commonplace in analytical chemistry. UV-Vis spectra are a perfect example of data series that
are sequential in frequency. Raw spectral information such as peak shifts, positions, and
integrals is most often dependent upon how the information on the computer is first
processed. Several techniques for handling sequential series spectra are emphasized below.
In digital signal processing, a very important first step involves noise filtering. For low
concentrations, the analyte signal can be difficult to distinguish from background.
Measurement noise is typically broken into two classes87: stationary and correlated noise.
Stationary noise is applicable to spectroscopic analysis and can be further broken down into
homoscedastic and heteroscedastic noise. For homoscedastic noise, the noise mean and
standard deviation typically remain constant across the entire signal. In absence of detailed
knowledge of a system, filters for homoscedastic noise provide good approximations.
Heteroscedastic noise is dependent upon and is often proportional to signal intensity. In
spectroscopy, heteroscedastic noise typically arises when data are transformed prior to
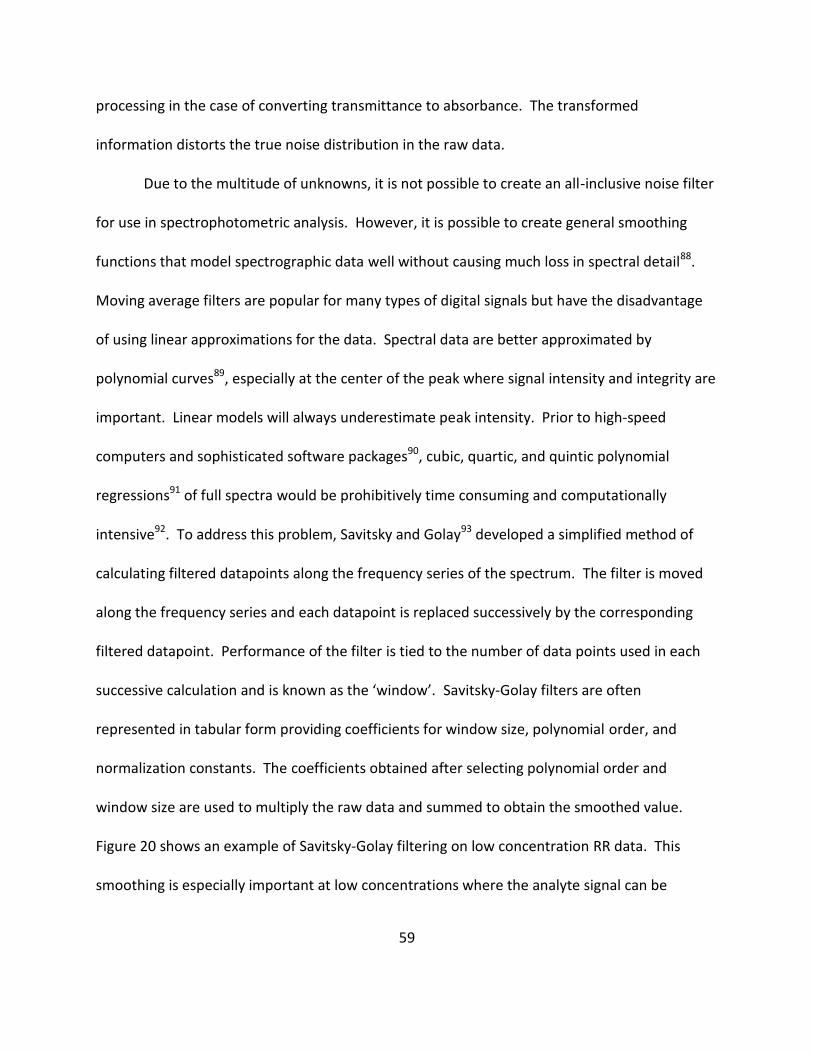
59
processing in the case of converting transmittance to absorbance. The transformed
information distorts the true noise distribution in the raw data.
Due to the multitude of unknowns, it is not possible to create an all-inclusive noise filter
for use in spectrophotometric analysis. However, it is possible to create general smoothing
functions that model spectrographic data well without causing much loss in spectral detail88.
Moving average filters are popular for many types of digital signals but have the disadvantage
of using linear approximations for the data. Spectral data are better approximated by
polynomial curves89, especially at the center of the peak where signal intensity and integrity are
important. Linear models will always underestimate peak intensity. Prior to high-speed
computers and sophisticated software packages90, cubic, quartic, and quintic polynomial
regressions91 of full spectra would be prohibitively time consuming and computationally
intensive92. To address this problem, Savitsky and Golay93 developed a simplified method of
calculating filtered datapoints along the frequency series of the spectrum. The filter is moved
along the frequency series and each datapoint is replaced successively by the corresponding
filtered datapoint. Performance of the filter is tied to the number of data points used in each
successive calculation and is known as the ‘window’. Savitsky-Golay filters are often
represented in tabular form providing coefficients for window size, polynomial order, and
normalization constants. The coefficients obtained after selecting polynomial order and
window size are used to multiply the raw data and summed to obtain the smoothed value.
Figure 20 shows an example of Savitsky-Golay filtering on low concentration RR data. This
smoothing is especially important at low concentrations where the analyte signal can be
60
obscured by noise. At high concentrations, the analyte signal is much greater than background
noise; therefore, little is gained from smoothing. Figure 20 and Figure 21 contrast the raw
signal and smoothed spectra at the two concentration extremes.
Figure 20. Raw vs. Savitsky-Golay filtered data for Citrus at low concentration with RR
Figure 21. Raw vs. Savitsky-Golay filtered data for Citrus at high concentration with RR
525 530 535 540 5450.033
0.034
0.035
0.036
0.037
0.038
0.039
Wavelength, nm
Ab
sorb
an
ce
Zoom of Raw vs Savitsky-Golay Filtered Data
Conc1 Raw
Conc1 Filtered
520 525 530 535 540 545 5500.17
0.18
0.19
0.2
0.21
0.22
0.23
Wavelength, nm
Ab
sorb
an
ce
Zoom of Raw vs Savitsky-Golay Filtered Data
Conc5 Raw
Conc5 Filtered
61
To maintain consistency and data integrity, all data for this study were filtered using the
Savitsky-Golay algorithm provided in MATLAB with 3rd order polynomial and 5-point window
parameters.
Due to measurement error, noise, and a multitude of other possible causes, it is often
necessary to adjust data for baseline shift and zero-level axis translation. For these data
manipulation techniques to be applied successfully, it is necessary to identify a region of the
spectra where no chemical species absorbs. This is known as the zero-component region. By
definition, these regions have a chemical rank of zero and spectral manipulation calculations
are anchored on these points. Any spectral shifts in these regions can be attributed to
instrument and measurement noise that can be subsequently corrected. As previously alluded
to, the zero-component regions can also be used to calculate systematic background and
baseline offsets. For this project, spectral data were first translated such that the minimum
‘zero’ absorbance fell at zero on the y-axis, filtered with a Savitsky-Golay function as previously
discussed, and finally subjected to baseline correction. In axis translation, the absorbance
minimum is simply subtracted from each data point to yield a new, zero-corrected data vector.
Next, data smoothing was performed as previously discussed. Finally, baseline correction
involved identifying two ‘zero’ points at opposite ends of the spectra and calculating the slope
and intercept of a line connecting them. This resulting linear equation was then used point-by-
point to recalculate old spectral data into ‘baseline’ corrected data. While not necessary for
this project, it is possible to calculate baseline corrections for multiple peaks realizing these
multiple data sets must then be treated independently.

62
Chemometric Techniques
When a priori data are not available for a sample, numerous techniques can be
employed to identify the compound. In spectroscopic analysis, it is possible to use
chemometric techniques to aid in identifying these compounds. The first step in any
chemometric analysis is to determine similarities with known compounds. This process is
known collectively as pattern recognition or pattern matching. Many types of pattern
recognition and pattern matching exist in chemometric analysis. For online spectral searches of
known compounds, pattern matching is an important tool for the spectroscopist in identifying
unknowns under standard conditions. Additionally, exploratory data analysis allows the
extraction of useful data from samples. Unfortunately, the 1-dimensional, nonlinear signal in
spectral analysis limits the available techniques. Of the available techniques, the more useful
include Euclidian distance, Mahalanobis distance, simple correlation (r), and eigenanalysis. In
order to use these techniques, further preprocessing of the spectral data is necessary. These
preprocessing techniques include axes translation (previously discussed), vector normalization,
scaling, range scaling, autoscaling, feature weighting, and rotation among others. Good pattern
recognition techniques are typically based upon normalized data set comparisons.
Normalization sets the length of all the data vectors in the data set to equivalent lengths.
Normalization removes the variance in the data set due to differences in the magnitude of
measurements. However, this effect on the data can be undesirable if variance in the data set
is meaningful. For this project, minute variance is important to data analysis. Fortunately,
range scaling can be used as a preprocessing technique as it does not obscure variance in the
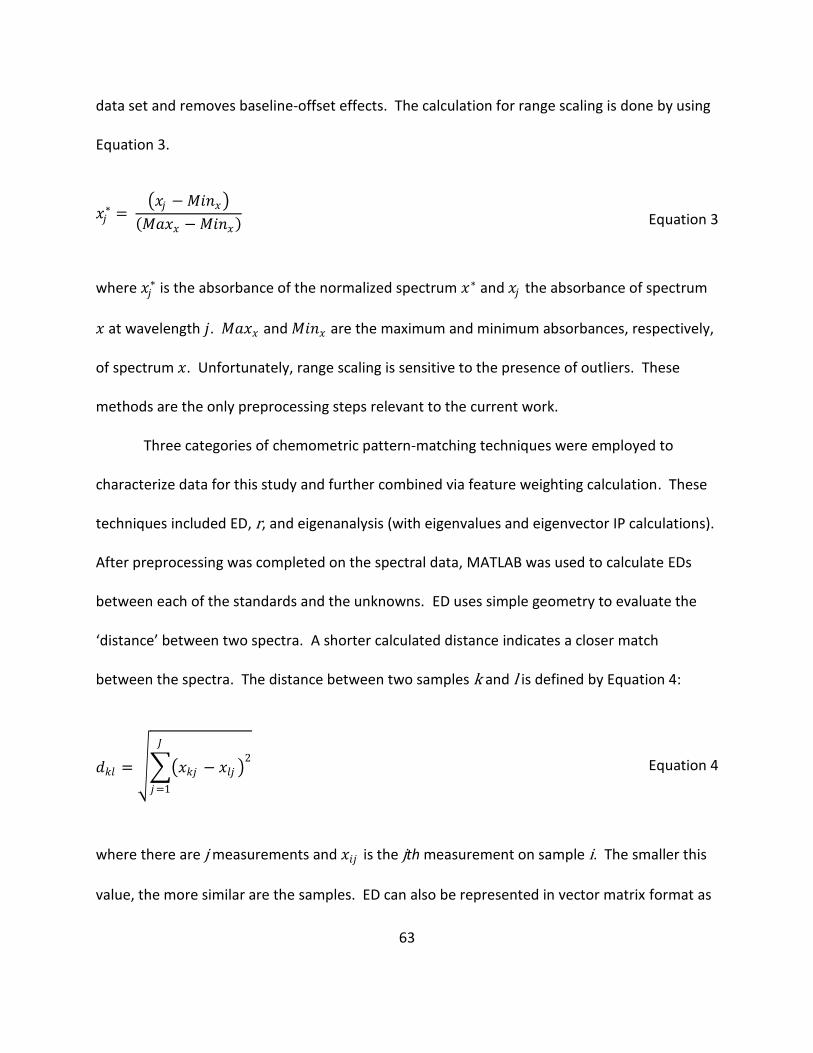
63
data set and removes baseline-offset effects. The calculation for range scaling is done by using
Equation 3.
𝑥𝑗∗ =
𝑥𝑗 − 𝑀𝑖𝑛𝑥
𝑀𝑎𝑥𝑥 − 𝑀𝑖𝑛𝑥 Equation 3
where 𝑥𝑗∗ is the absorbance of the normalized spectrum 𝑥∗ and 𝑥𝑗 the absorbance of spectrum
𝑥 at wavelength 𝑗. 𝑀𝑎𝑥𝑥 and 𝑀𝑖𝑛𝑥 are the maximum and minimum absorbances, respectively,
of spectrum 𝑥. Unfortunately, range scaling is sensitive to the presence of outliers. These
methods are the only preprocessing steps relevant to the current work.
Three categories of chemometric pattern-matching techniques were employed to
characterize data for this study and further combined via feature weighting calculation. These
techniques included ED, r, and eigenanalysis (with eigenvalues and eigenvector IP calculations).
After preprocessing was completed on the spectral data, MATLAB was used to calculate EDs
between each of the standards and the unknowns. ED uses simple geometry to evaluate the
‘distance’ between two spectra. A shorter calculated distance indicates a closer match
between the spectra. The distance between two samples k and l is defined by Equation 4:
𝑑𝑘𝑙 = 𝑥𝑘𝑗 − 𝑥𝑙𝑗 2
𝐽
𝑗=1
Equation 4
where there are j measurements and 𝑥𝑖𝑗 is the jth measurement on sample i. The smaller this
value, the more similar are the samples. ED can also be represented in vector matrix format as
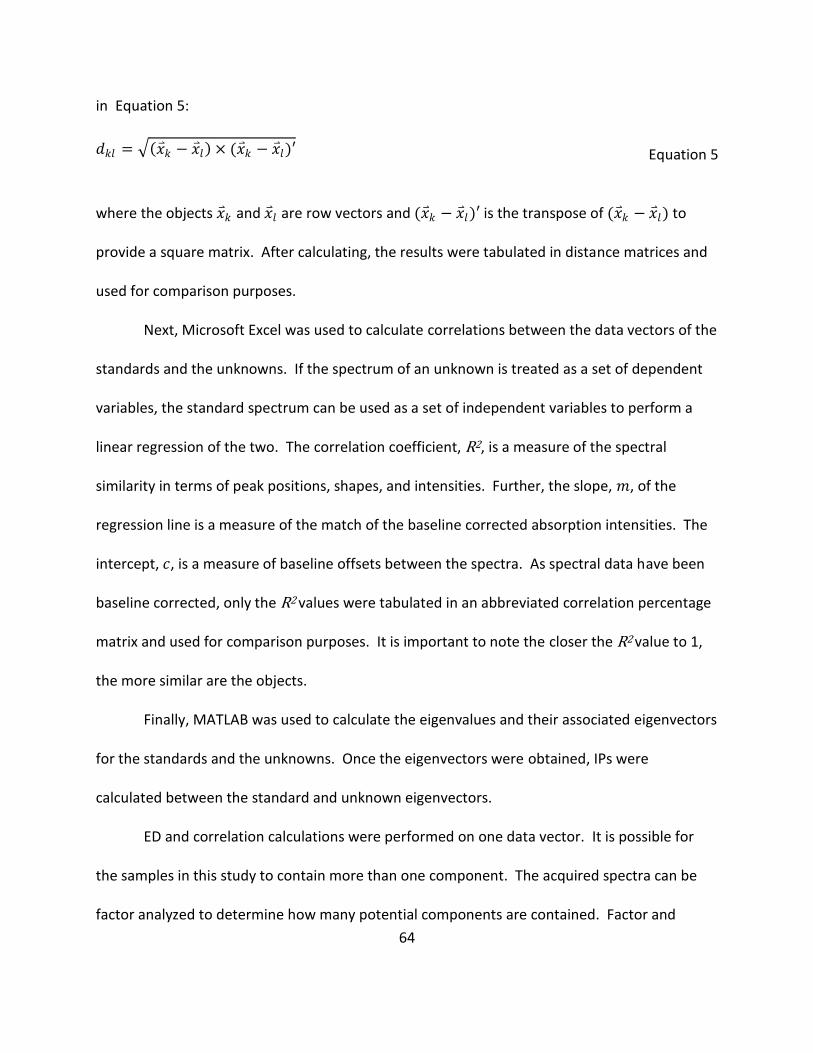
64
in Equation 5:
𝑑𝑘𝑙 = 𝑥 𝑘 − 𝑥 𝑙 × (𝑥 𝑘 − 𝑥 𝑙)′ Equation 5
where the objects 𝑥 𝑘 and 𝑥 𝑙 are row vectors and (𝑥 𝑘 − 𝑥 𝑙)′ is the transpose of (𝑥 𝑘 − 𝑥 𝑙) to
provide a square matrix. After calculating, the results were tabulated in distance matrices and
used for comparison purposes.
Next, Microsoft Excel was used to calculate correlations between the data vectors of the
standards and the unknowns. If the spectrum of an unknown is treated as a set of dependent
variables, the standard spectrum can be used as a set of independent variables to perform a
linear regression of the two. The correlation coefficient, R2, is a measure of the spectral
similarity in terms of peak positions, shapes, and intensities. Further, the slope, 𝑚, of the
regression line is a measure of the match of the baseline corrected absorption intensities. The
intercept, 𝑐, is a measure of baseline offsets between the spectra. As spectral data have been
baseline corrected, only the R2 values were tabulated in an abbreviated correlation percentage
matrix and used for comparison purposes. It is important to note the closer the R2 value to 1,
the more similar are the objects.
Finally, MATLAB was used to calculate the eigenvalues and their associated eigenvectors
for the standards and the unknowns. Once the eigenvectors were obtained, IPs were
calculated between the standard and unknown eigenvectors.
ED and correlation calculations were performed on one data vector. It is possible for
the samples in this study to contain more than one component. The acquired spectra can be
factor analyzed to determine how many potential components are contained. Factor and
65
principal component analyses are powerful multivariate techniques. The goal of factor analysis
is to provide a spatial dimensional representation of the data vectors. It expresses the original
data matrix in terms of linear combinations of orthogonal vectors and contains the same
information as the original data. Reducing the measurement dimensionality to the smallest
possible intrinsic dimensionality allows for efficient manipulation of the data and better
understanding of the data under study. This can be achieved by observing correlation between
pairs of vectors. Normally, the correlation between two unit-length vectors is the cosine of the
angle between them. For this study, it is more useful to determine vector correlation through
calculation of IPs of two eigenvectors. If an m × n data matrix is normalized (or range scaled in
this case) and factor analyzed, n orthogonal vectors are obtained. These are referred to as
eigenvectors. Eigenvectors are a set of vectors associated with a matrix equation that are also
known as characteristic vectors94. Associated with each eigenvector is a descriptor of its
importance referred to as the eigenvalue. Eigenvalues are a set of scalars associated with a
matrix equation that are sometimes known as characteristics roots95. If the eigenvalue is
multiplied with its associated eigenvector, the original data magnitude is obtained. The
determination of the eigenvalues and eigenvectors of a system is known as matrix
diagonalization. Matrix diagonalization is the process of taking a square matrix and converting
it into a diagonal matrix. The diagonal matrix will share the same fundamental properties of
the underlying matrix and is equivalent to transforming the underlying system into a set of
coordinate axes in which the matrix takes a canonical form. The entries of the diagonalized
matrix represent the eigenvalues of the original matrix. Similarly, the new set of axes

66
corresponding to the diagonal matrix is the eigenvectors of the original matrix. This eigen
decomposition of a square matrix 𝐴 is shown in Equation 6:
𝐴 = 𝑃𝐷𝑃−1 Equation 6 where 𝑃 is a matrix composed of the eigenvectors of 𝐴, 𝐷 is the diagonal matrix constructed
from the corresponding eigenvalues, and 𝑃−1 is the matrix inverse of 𝑃. The eigenvectors that
account for the largest variance in the dataset are represented by large eigenvalues. Because
of experimental noise, the largest eigenvectors usually do not account for 100% of the data
variance. Therefore, smaller values are normally found. An example of a spectral eigenvalue
matrix is shown in Figure 22 and its associated eigenvectors are shown in Figure 23. It can be
seen that the first eigenvalue is much larger than the rest indicating the presence of only one
spectral pattern in the data.
28.14 0 0 0 0 0
0 5.08𝑥10−15 0 0 0 00 0 1.01𝑥10−15 0 0 00 0 0 9.85𝑥10−16 0 00 0 0 0 −1.09𝑥10−15 00 0 0 0 0 −6.32𝑥10−15
Figure 22. Eigenvalue matrix of RR Apple range scaled concentration 3 spectra
This matrix and graph indicates only 1 component accounts for the total variance in the data
set. The other eigenvectors have no discernable spectral characteristics and are mostly noise.
Factor and multicomponent analyses of the unknowns used in this study indicate the presence
of more than 1 compound contained in each sample.

67
Figure 23. Eigenvectors of RR apple range scaled concentration series 3 data
The command in Equation 7 is used to calculate eigenvalues and eigenvectors within
MATLAB.
𝑉, 𝐷 = 𝑒𝑖𝑔𝑠 𝐴 ∗ 𝐴−1 Equation 7 Equation 7 determines the six largest eigenvalues and eigenvectors of matrix A and assigns the
resulting eigenvalue matrix to D and eigenvector matrix to V. For this calculation, matrix A
must be a square matrix (multiplying by the matrix transpose provides a square matrix). The IPs
of the eigenvectors were calculated in Excel using Equation 8.
= 𝑀𝑀𝑈𝐿𝑇(𝑀𝐼𝑁𝑉𝐸𝑅𝑆𝐸 𝑀𝑀𝑈𝐿𝑇 𝑇𝑅𝐴𝑁𝑆𝑃𝑂𝑆𝐸 𝑒𝑉𝑒𝑐𝑡1 , 𝑒𝑉𝑒𝑐𝑡1 ,
𝑀𝑀𝑈𝐿𝑇 𝑇𝑅𝐴𝑁𝑆𝑃𝑂𝑆𝐸 𝑒𝑉𝑒𝑐𝑡1 , 𝑒𝑉𝑒𝑐𝑡2 ) Equation 8
where MMULT returns the matrix products of two arrays, MINVERSE returns the inverse
matrix of the array, TRANSPOSE shifts the vertical and horizontal orientation of the array,
eVect1 is eigenvector 1, and eVect2 is eigenvector 2. An IP value closer to 1 indicates a better
match.
350 400 450 500 550 600 650-0.4
-0.3
-0.2
-0.1
0
0.1
0.2
0.3
0.4
0.5
Wavelength, nm
Un
its
Eigenvectors of Ruthenium Red and AppleRange Scaled Concentration Series 3
eigenvector 1
eigenvector 2
eigenvector 3
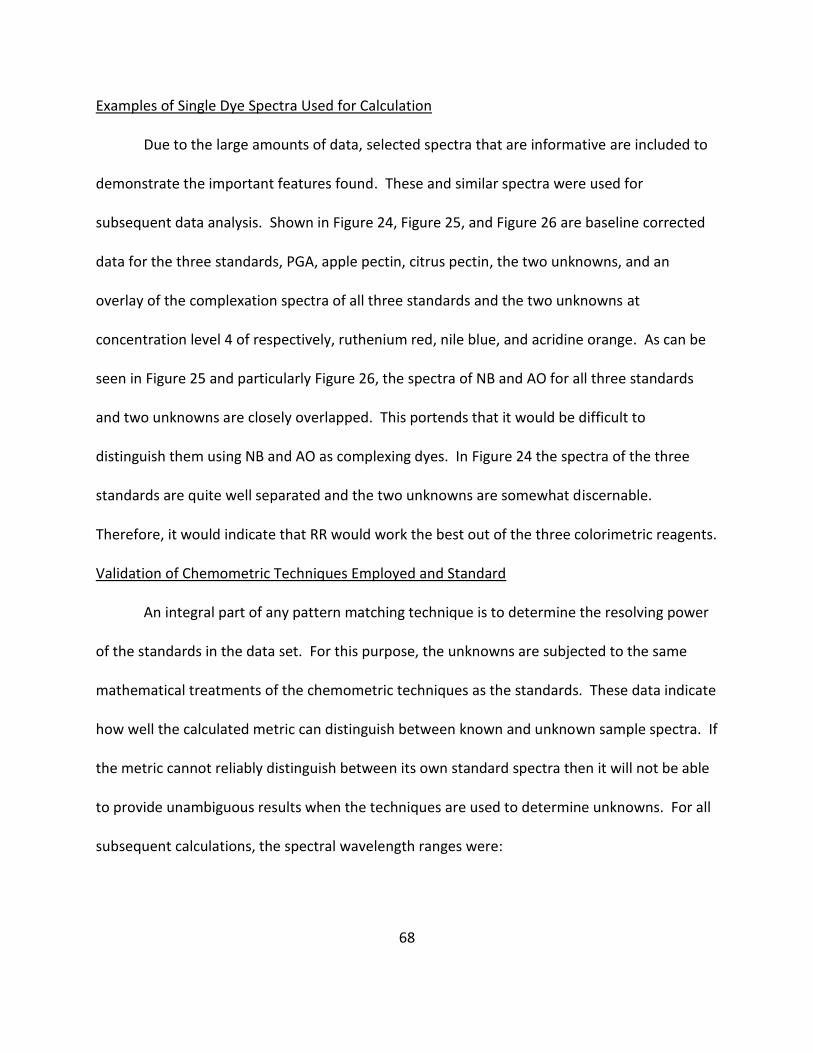
68
Examples of Single Dye Spectra Used for Calculation
Due to the large amounts of data, selected spectra that are informative are included to
demonstrate the important features found. These and similar spectra were used for
subsequent data analysis. Shown in Figure 24, Figure 25, and Figure 26 are baseline corrected
data for the three standards, PGA, apple pectin, citrus pectin, the two unknowns, and an
overlay of the complexation spectra of all three standards and the two unknowns at
concentration level 4 of respectively, ruthenium red, nile blue, and acridine orange. As can be
seen in Figure 25 and particularly Figure 26, the spectra of NB and AO for all three standards
and two unknowns are closely overlapped. This portends that it would be difficult to
distinguish them using NB and AO as complexing dyes. In Figure 24 the spectra of the three
standards are quite well separated and the two unknowns are somewhat discernable.
Therefore, it would indicate that RR would work the best out of the three colorimetric reagents.
Validation of Chemometric Techniques Employed and Standard
An integral part of any pattern matching technique is to determine the resolving power
of the standards in the data set. For this purpose, the unknowns are subjected to the same
mathematical treatments of the chemometric techniques as the standards. These data indicate
how well the calculated metric can distinguish between known and unknown sample spectra. If
the metric cannot reliably distinguish between its own standard spectra then it will not be able
to provide unambiguous results when the techniques are used to determine unknowns. For all
subsequent calculations, the spectral wavelength ranges were:
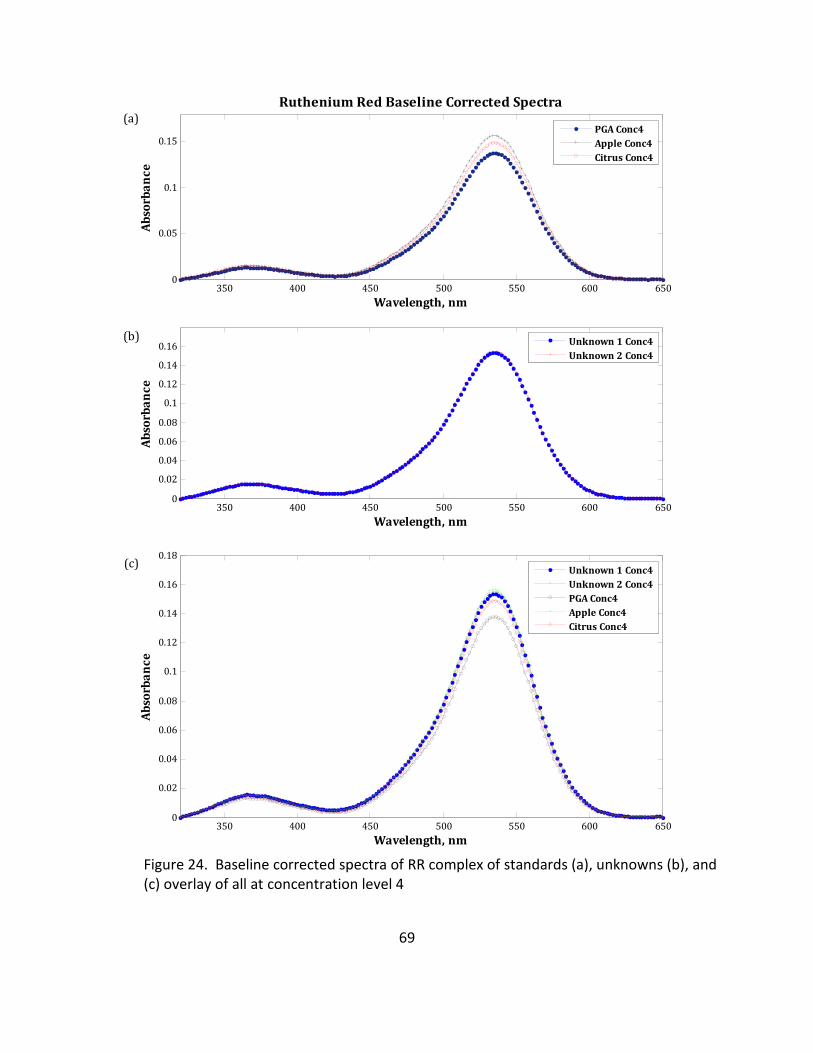
69
Figure 24. Baseline corrected spectra of RR complex of standards (a), unknowns (b), and (c) overlay of all at concentration level 4
350 400 450 500 550 600 6500
0.05
0.1
0.15
Wavelength, nm
Ab
sorb
an
ce
Ruthenium Red Baseline Corrected Spectra
PGA Conc4
Apple Conc4
Citrus Conc4
(a)
350 400 450 500 550 600 6500
0.02
0.04
0.06
0.08
0.1
0.12
0.14
0.16
Wavelength, nm
Ab
sorb
an
ce
Unknown 1 Conc4
Unknown 2 Conc4
(b)
350 400 450 500 550 600 6500
0.02
0.04
0.06
0.08
0.1
0.12
0.14
0.16
0.18
Wavelength, nm
Ab
sorb
an
ce
Unknown 1 Conc4
Unknown 2 Conc4
PGA Conc4
Apple Conc4
Citrus Conc4
(c)
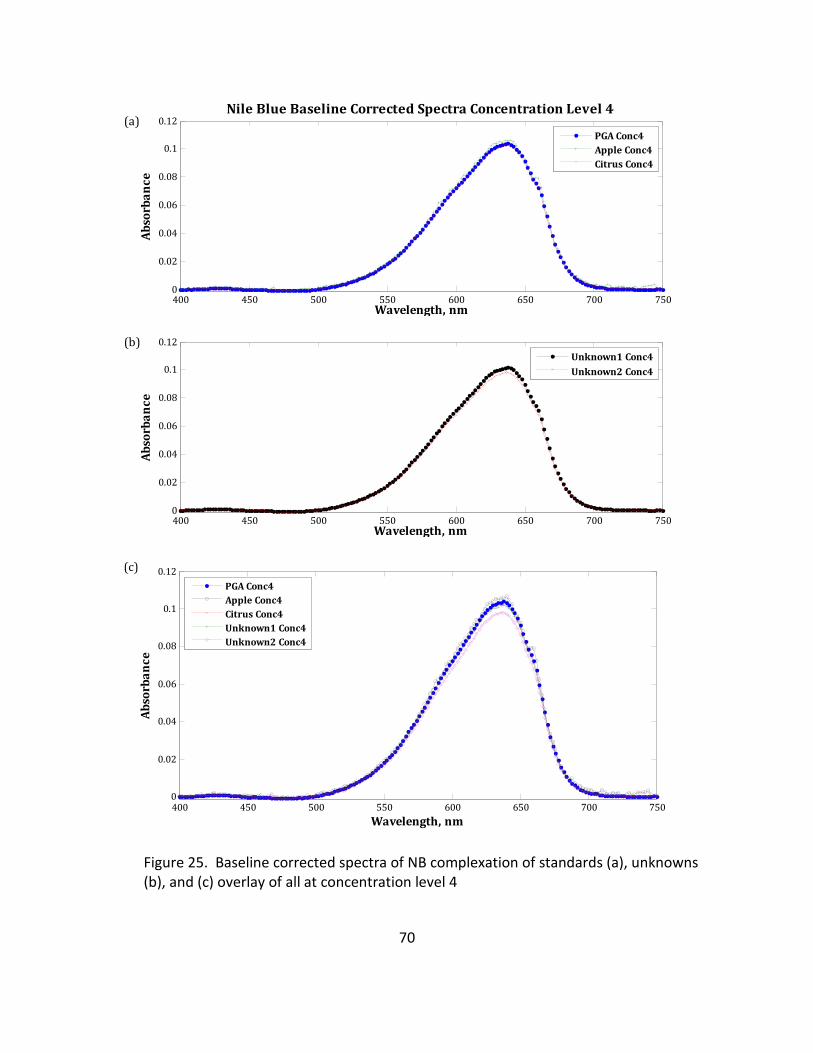
70
Figure 25. Baseline corrected spectra of NB complexation of standards (a), unknowns (b), and (c) overlay of all at concentration level 4
400 450 500 550 600 650 700 7500
0.02
0.04
0.06
0.08
0.1
0.12
Wavelength, nm
Ab
sorb
an
ce
Nile Blue Baseline Corrected Spectra Concentration Level 4
PGA Conc4
Apple Conc4
Citrus Conc4
(a)
400 450 500 550 600 650 700 7500
0.02
0.04
0.06
0.08
0.1
0.12
Wavelength, nm
Ab
sorb
an
ce
Unknown1 Conc4
Unknown2 Conc4
(b)
400 450 500 550 600 650 700 7500
0.02
0.04
0.06
0.08
0.1
0.12
Wavelength, nm
Ab
sorb
an
ce
PGA Conc4
Apple Conc4
Citrus Conc4
Unknown1 Conc4
Unknown2 Conc4
(c)
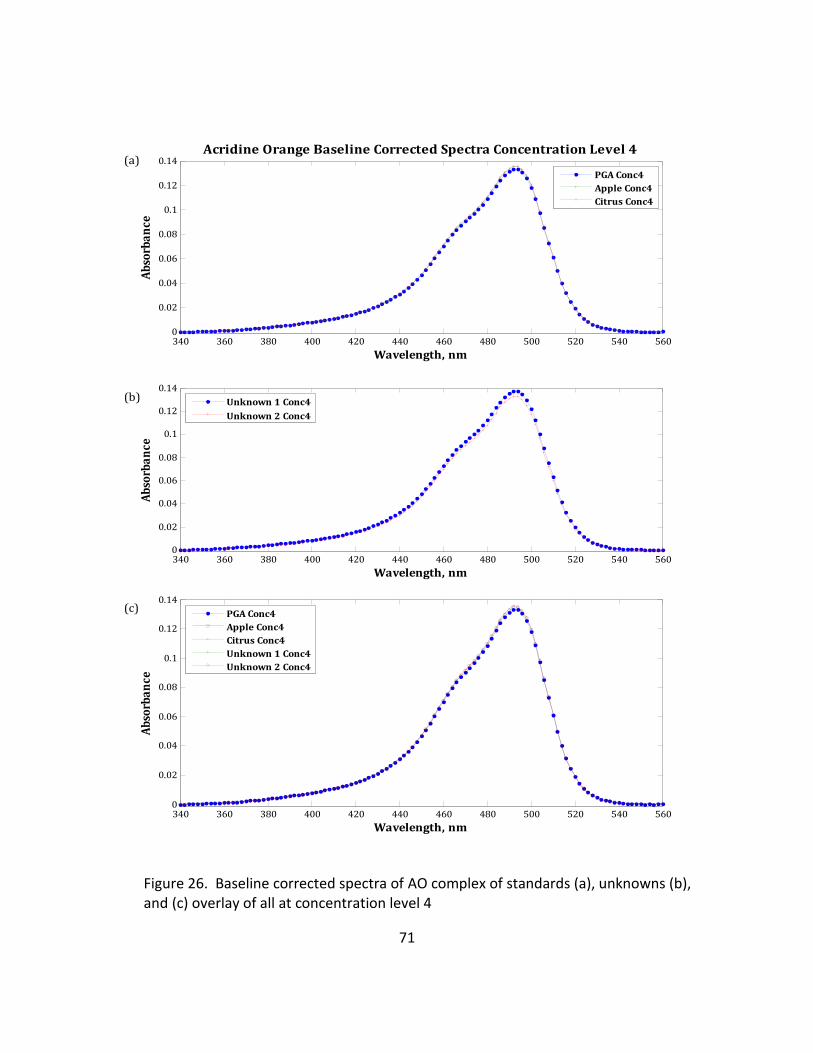
71
Figure 26. Baseline corrected spectra of AO complex of standards (a), unknowns (b), and (c) overlay of all at concentration level 4
340 360 380 400 420 440 460 480 500 520 540 5600
0.02
0.04
0.06
0.08
0.1
0.12
0.14
Wavelength, nm
Ab
sorb
an
ceAcridine Orange Baseline Corrected Spectra Concentration Level 4
PGA Conc4
Apple Conc4
Citrus Conc4
(a)
340 360 380 400 420 440 460 480 500 520 540 5600
0.02
0.04
0.06
0.08
0.1
0.12
0.14
Wavelength, nm
Ab
sorb
an
ce
Unknown 1 Conc4
Unknown 2 Conc4
(b)
340 360 380 400 420 440 460 480 500 520 540 5600
0.02
0.04
0.06
0.08
0.1
0.12
0.14
Wavelength, nm
Ab
sorb
an
ce
PGA Conc4
Apple Conc4
Citrus Conc4
Unknown 1 Conc4
Unknown 2 Conc4
(c)
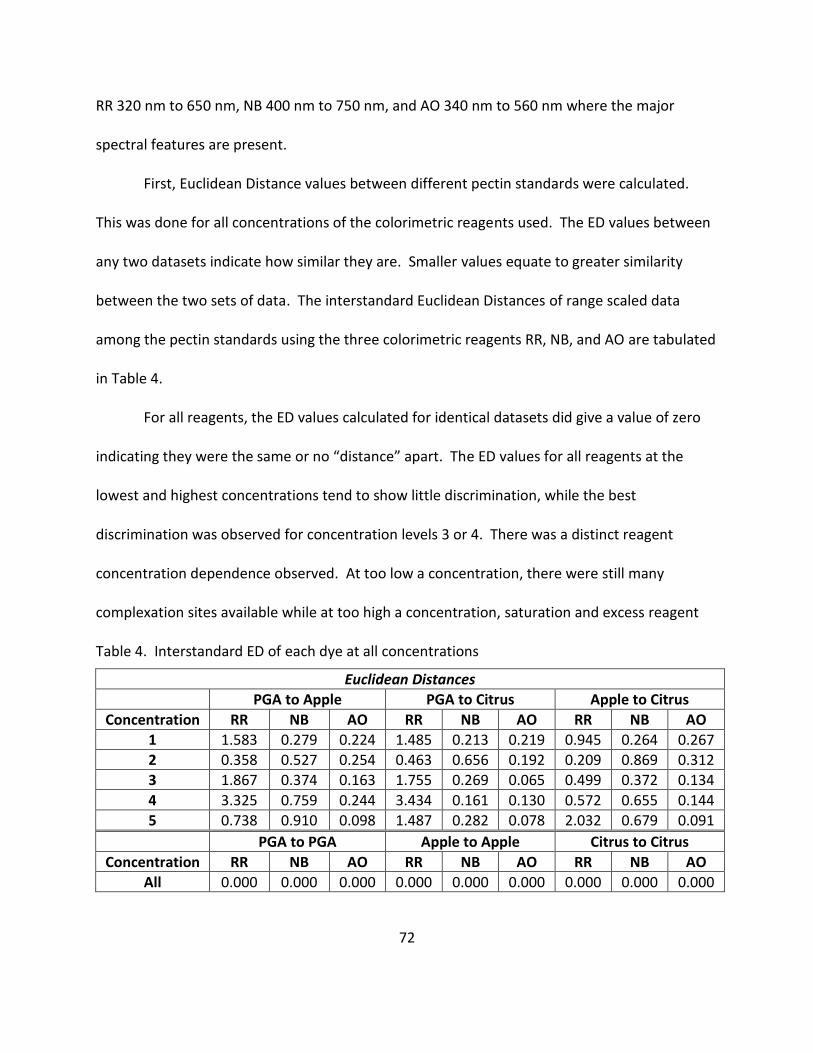
72
RR 320 nm to 650 nm, NB 400 nm to 750 nm, and AO 340 nm to 560 nm where the major
spectral features are present.
First, Euclidean Distance values between different pectin standards were calculated.
This was done for all concentrations of the colorimetric reagents used. The ED values between
any two datasets indicate how similar they are. Smaller values equate to greater similarity
between the two sets of data. The interstandard Euclidean Distances of range scaled data
among the pectin standards using the three colorimetric reagents RR, NB, and AO are tabulated
in Table 4.
For all reagents, the ED values calculated for identical datasets did give a value of zero
indicating they were the same or no “distance” apart. The ED values for all reagents at the
lowest and highest concentrations tend to show little discrimination, while the best
discrimination was observed for concentration levels 3 or 4. There was a distinct reagent
concentration dependence observed. At too low a concentration, there were still many
complexation sites available while at too high a concentration, saturation and excess reagent
Table 4. Interstandard ED of each dye at all concentrations
Euclidean Distances
PGA to Apple PGA to Citrus Apple to Citrus
Concentration RR NB AO RR NB AO RR NB AO
1 1.583 0.279 0.224 1.485 0.213 0.219 0.945 0.264 0.267
2 0.358 0.527 0.254 0.463 0.656 0.192 0.209 0.869 0.312
3 1.867 0.374 0.163 1.755 0.269 0.065 0.499 0.372 0.134
4 3.325 0.759 0.244 3.434 0.161 0.130 0.572 0.655 0.144
5 0.738 0.910 0.098 1.487 0.282 0.078 2.032 0.679 0.091
PGA to PGA Apple to Apple Citrus to Citrus
Concentration RR NB AO RR NB AO RR NB AO
All 0.000 0.000 0.000 0.000 0.000 0.000 0.000 0.000 0.000

73
“smear” the spectral features and obscure whatever small differences that might be present.
For RR, one observes that the ED values were large between PGA and apple (3.325) and
between PGA and citrus (3.434) at concentration level 4 and reasonably large at concentration
level 3. These indicate that RR seems to be able, at least from our knowledge of the pectins
structures, to tell apart pectin structures that are distinctly different. However, the NB and the
AO spectral data gave ED values that are not as useful. For instance, both dyes do not give ED
values that clearly discriminate PGA pectin from the two other pectins as RR ED values can.
Thus, it seems that NB and AO are not going to be reliable in the analysis of the unknown
pectins. The difference between apple and citrus pectin standards, however, are not as large as
one would hope. This may present difficulty in further analysis. These results indicate the
standards library should be adequate for discrimination of unknowns based upon ED.
The interstandard R2 values of range scaled data among the pectin standards using the
three colorimetric reagents RR, NB, and AO are tabulated in Table 5.
Table 5. Interstandard R2 values of each dye at all concentrations
R2
PGA to Apple PGA to Citrus Apple to Citrus
Concentration RR NB AO RR NB AO RR NB AO
1 0.913 0.998 0.998 0.928 0.999 0.998 0.973 0.998 0.998
2 0.996 0.994 0.997 0.993 0.995 0.999 0.999 0.983 0.995
3 0.872 0.997 0.999 0.898 0.999 1.000 0.996 0.998 1.000
4 0.530 0.993 0.999 0.441 1.000 1.000 0.993 0.994 1.000
5 0.980 0.988 1.000 0.927 0.999 1.000 1.000 1.000 1.000
PGA to PGA Apple to Apple Citrus to Citrus
Concentration RR NB AO RR NB AO RR NB AO
All 1.000 1.000 1.000 1.000 1.000 1.000 1.000 1.000 1.000
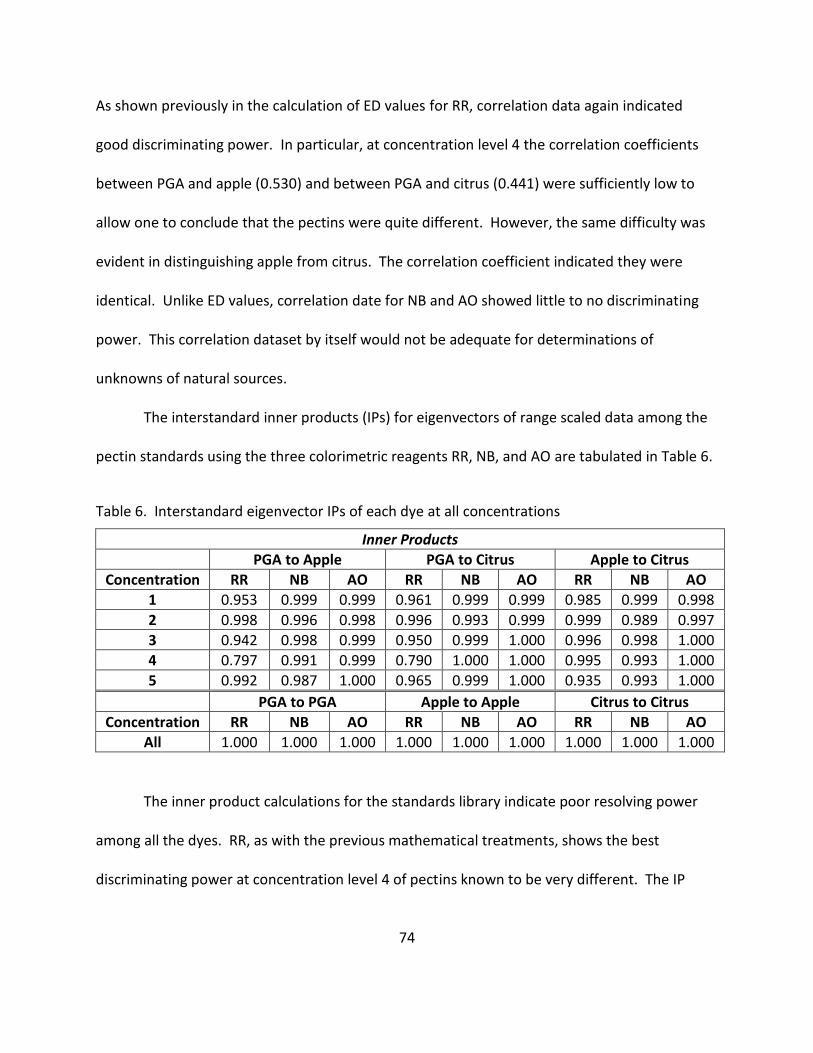
74
As shown previously in the calculation of ED values for RR, correlation data again indicated
good discriminating power. In particular, at concentration level 4 the correlation coefficients
between PGA and apple (0.530) and between PGA and citrus (0.441) were sufficiently low to
allow one to conclude that the pectins were quite different. However, the same difficulty was
evident in distinguishing apple from citrus. The correlation coefficient indicated they were
identical. Unlike ED values, correlation date for NB and AO showed little to no discriminating
power. This correlation dataset by itself would not be adequate for determinations of
unknowns of natural sources.
The interstandard inner products (IPs) for eigenvectors of range scaled data among the
pectin standards using the three colorimetric reagents RR, NB, and AO are tabulated in Table 6.
Table 6. Interstandard eigenvector IPs of each dye at all concentrations
Inner Products
PGA to Apple PGA to Citrus Apple to Citrus
Concentration RR NB AO RR NB AO RR NB AO
1 0.953 0.999 0.999 0.961 0.999 0.999 0.985 0.999 0.998
2 0.998 0.996 0.998 0.996 0.993 0.999 0.999 0.989 0.997
3 0.942 0.998 0.999 0.950 0.999 1.000 0.996 0.998 1.000
4 0.797 0.991 0.999 0.790 1.000 1.000 0.995 0.993 1.000
5 0.992 0.987 1.000 0.965 0.999 1.000 0.935 0.993 1.000
PGA to PGA Apple to Apple Citrus to Citrus
Concentration RR NB AO RR NB AO RR NB AO
All 1.000 1.000 1.000 1.000 1.000 1.000 1.000 1.000 1.000
The inner product calculations for the standards library indicate poor resolving power
among all the dyes. RR, as with the previous mathematical treatments, shows the best
discriminating power at concentration level 4 of pectins known to be very different. The IP
75
values using RR spectral data are between PGA and apple (0.797) and between PGA and citrus
(0.790), distinctly smaller than those between the other pectins. While spectral data of NB and
AO do not, again, show such discrimination as RR even for well-known, distinctly different
pectins.
Overall, the IP values are similar to R2 values in their poor discriminating power between
the different pectins that are not very different. These values do not offer any discrimination
for all concentrations of NB and AO spectral date. Therefore, the IPs of NB and AO show these
dyes are not suitable for unknowns. The PGA is partially distinguished from the apple and citrus
as the IP values with them are 0.797 and 0.790 respectively. However, it is still difficult to
distinguish between the apple and citrus pectin.
Determination of Unknowns Using Single Dye System
The ED, R2, and IP data obtained from the use of RR, NB, and AO as “complexing” agents
with pectin and unknowns 1 and 2 are tabulated in Table 7, Table 8, and Table 9 respectively.
Pectin unknown prediction results based on the three factors listed in these tables are
tabulated in Table 10.
From the data in Table 7, it can be again observed that at concentration levels of 1, 2,
and 5, the results were ambiguous, inconsistent, and unsatisfactory. The reasons being given
previously that the degree of complexation of the dyes with the available sites on the pectin
were either incomplete or saturated. Thus, the discussion will focus on the results from dye
concentration levels 3 and 4.

76
For unknowns 1 and 2, at level 3, the R2 and IP values were distinctly the smallest with
PGA, thus quite correctly hinting the absence of PGA structure in them for RR spectral data.
However, this was not the case for dyes NB and AO spectral data. The R2 and IP values were all
close to one with PGA, apple, or citrus. Even at concentration level 4, the R2 and IP values using
these two dyes were all close to one. Thus, no discrimination was possible using NB or AO. In
the case of RR, the results were more distinct at concentration level 4. The R2 and IP values
were clearly low for PGA, 0.493 and 0.799, and 0.504 and 0.796, respectively in unknown 1 and
unknown 2, indicating the absence of PGA in both unknowns. However, R2 and IP values were
not able to allow one to discriminate the presence of apple or citrus features in both unknowns
as their values were all very close to unity.

77
Table 7. Tabulated results of RR comparison calculations
Comparison Metric for RR
Concentration Comparison w/ PGA w/ Apple w/ Citrus
Un
kno
wn
1
1
ED 7.386 6.965 6.557
R2 0.301 0.041 0.052
IP 0.584 0.651 0.703
2
ED 0.414 0.265 0.190
R2 0.996 0.999 0.999
IP 0.997 0.999 0.999
3
ED 1.762 0.329 0.608
R2 0.886 0.996 0.995
IP 0.949 0.998 0.994
4
ED 3.352 0.383 0.414
R2 0.493 0.997 0.994
IP 0.799 0.998 0.997
5
ED 2.991 2.489 3.887
R2 0.624 0.753 0.362
IP 0.862 0.906 0.755
Un
kno
wn
2
1
ED 2.010 1.489 0.723
R2 0.877 0.940 0.987
IP 0.932 0.965 0.992
2
ED 0.476 0.201 0.289
R2 0.993 0.999 0.998
IP 0.996 0.999 1.000
3
ED 2.485 1.299 1.752
R2 0.790 0.970 0.949
IP 0.909 0.980 0.960
4
ED 3.349 0.312 0.494
R2 0.504 0.997 0.993
IP 0.796 0.998 0.996
5
ED 0.942 0.680 1.927
R2 0.967 0.984 0.871
IP 0.986 0.993 0.940

78
Table 8. Tabulated results of NB comparison calculations
Comparison Metric for NB
Concentration Comparison w/ PGA w/ Apple w/ Citrus
Un
kno
wn
1
1
ED 0.174 0.302 0.228
R2 0.999 0.998 0.999
IP 0.999 0.998 0.999
2
ED 1.040 1.128 0.666
R2 0.986 0.974 0.989
IP 0.982 0.979 0.993
3
ED 0.249 0.414 0.130
R2 0.999 0.997 1.000
IP 0.999 0.997 1.000
4
ED 0.148 0.742 0.158
R2 1.000 0.992 1.000
IP 1.000 0.991 1.000
5
ED 0.196 0.904 0.283
R2 0.999 0.986 0.998
IP 0.999 0.987 0.999
Un
kno
wn
2
1
ED 0.217 0.295 0.271
R2 0.999 0.999 0.999
IP 0.999 0.999 0.999
2
ED 0.491 0.703 0.392
R2 0.997 0.990 0.996
IP 0.996 0.993 0.997
3
ED 0.279 0.407 0.124
R2 0.999 0.998 1.000
IP 0.999 0.997 1.000
4
ED 0.169 0.714 0.144
R2 0.999 0.993 1.000
IP 1.000 0.992 1.000
5
ED 0.146 0.845 0.248
R2 1.000 0.989 0.999
IP 1.000 0.988 0.999
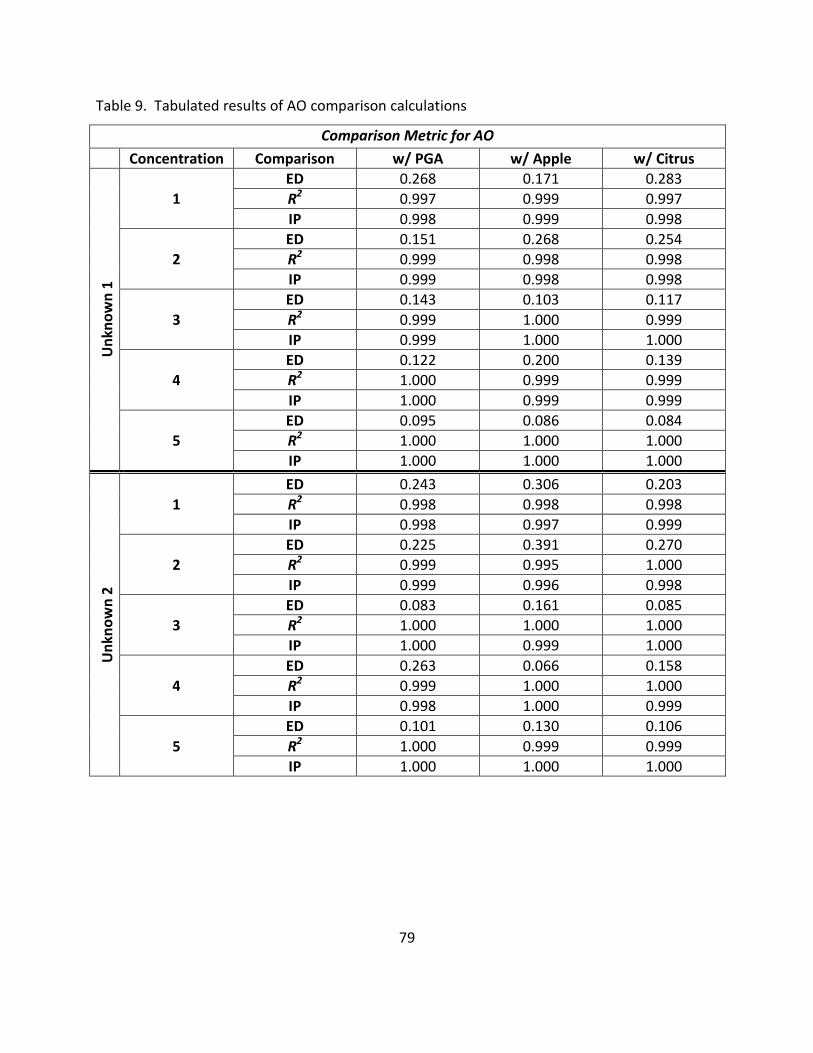
79
Table 9. Tabulated results of AO comparison calculations
Comparison Metric for AO
Concentration Comparison w/ PGA w/ Apple w/ Citrus
Un
kno
wn
1
1
ED 0.268 0.171 0.283
R2 0.997 0.999 0.997
IP 0.998 0.999 0.998
2
ED 0.151 0.268 0.254
R2 0.999 0.998 0.998
IP 0.999 0.998 0.998
3
ED 0.143 0.103 0.117
R2 0.999 1.000 0.999
IP 0.999 1.000 1.000
4
ED 0.122 0.200 0.139
R2 1.000 0.999 0.999
IP 1.000 0.999 0.999
5
ED 0.095 0.086 0.084
R2 1.000 1.000 1.000
IP 1.000 1.000 1.000
Un
kno
wn
2
1
ED 0.243 0.306 0.203
R2 0.998 0.998 0.998
IP 0.998 0.997 0.999
2
ED 0.225 0.391 0.270
R2 0.999 0.995 1.000
IP 0.999 0.996 0.998
3
ED 0.083 0.161 0.085
R2 1.000 1.000 1.000
IP 1.000 0.999 1.000
4
ED 0.263 0.066 0.158
R2 0.999 1.000 1.000
IP 0.998 1.000 0.999
5
ED 0.101 0.130 0.106
R2 1.000 0.999 0.999
IP 1.000 1.000 1.000
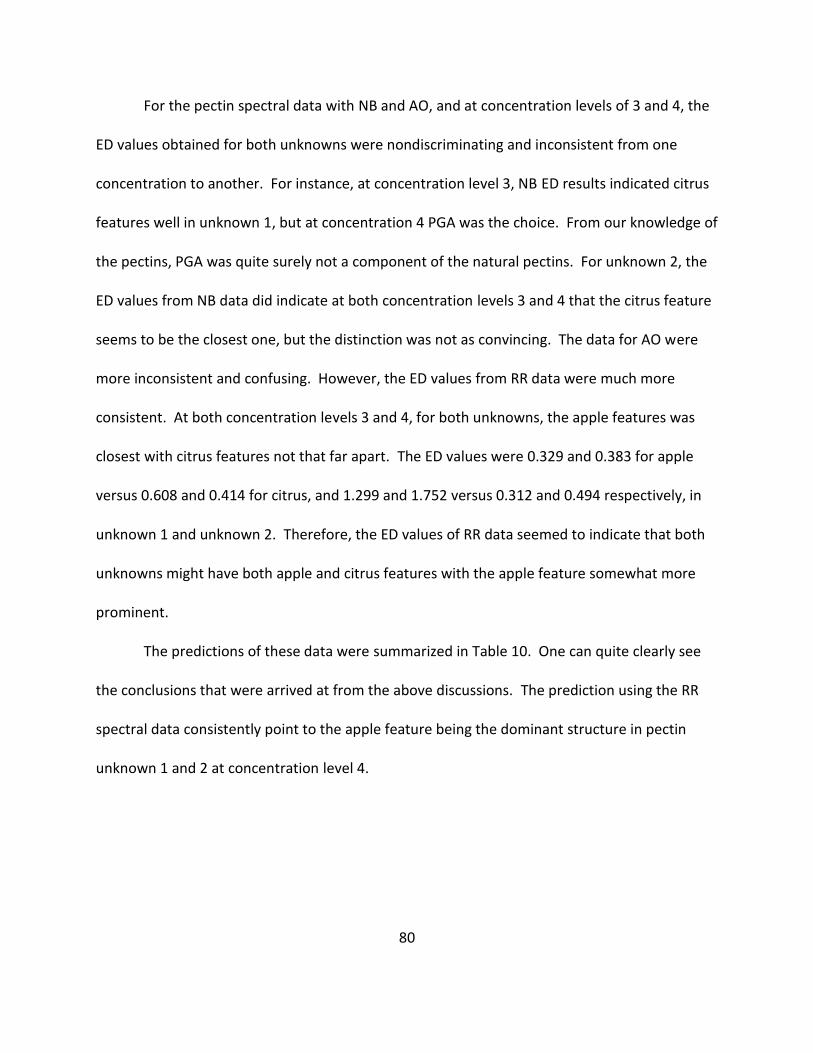
80
For the pectin spectral data with NB and AO, and at concentration levels of 3 and 4, the
ED values obtained for both unknowns were nondiscriminating and inconsistent from one
concentration to another. For instance, at concentration level 3, NB ED results indicated citrus
features well in unknown 1, but at concentration 4 PGA was the choice. From our knowledge of
the pectins, PGA was quite surely not a component of the natural pectins. For unknown 2, the
ED values from NB data did indicate at both concentration levels 3 and 4 that the citrus feature
seems to be the closest one, but the distinction was not as convincing. The data for AO were
more inconsistent and confusing. However, the ED values from RR data were much more
consistent. At both concentration levels 3 and 4, for both unknowns, the apple features was
closest with citrus features not that far apart. The ED values were 0.329 and 0.383 for apple
versus 0.608 and 0.414 for citrus, and 1.299 and 1.752 versus 0.312 and 0.494 respectively, in
unknown 1 and unknown 2. Therefore, the ED values of RR data seemed to indicate that both
unknowns might have both apple and citrus features with the apple feature somewhat more
prominent.
The predictions of these data were summarized in Table 10. One can quite clearly see
the conclusions that were arrived at from the above discussions. The prediction using the RR
spectral data consistently point to the apple feature being the dominant structure in pectin
unknown 1 and 2 at concentration level 4.
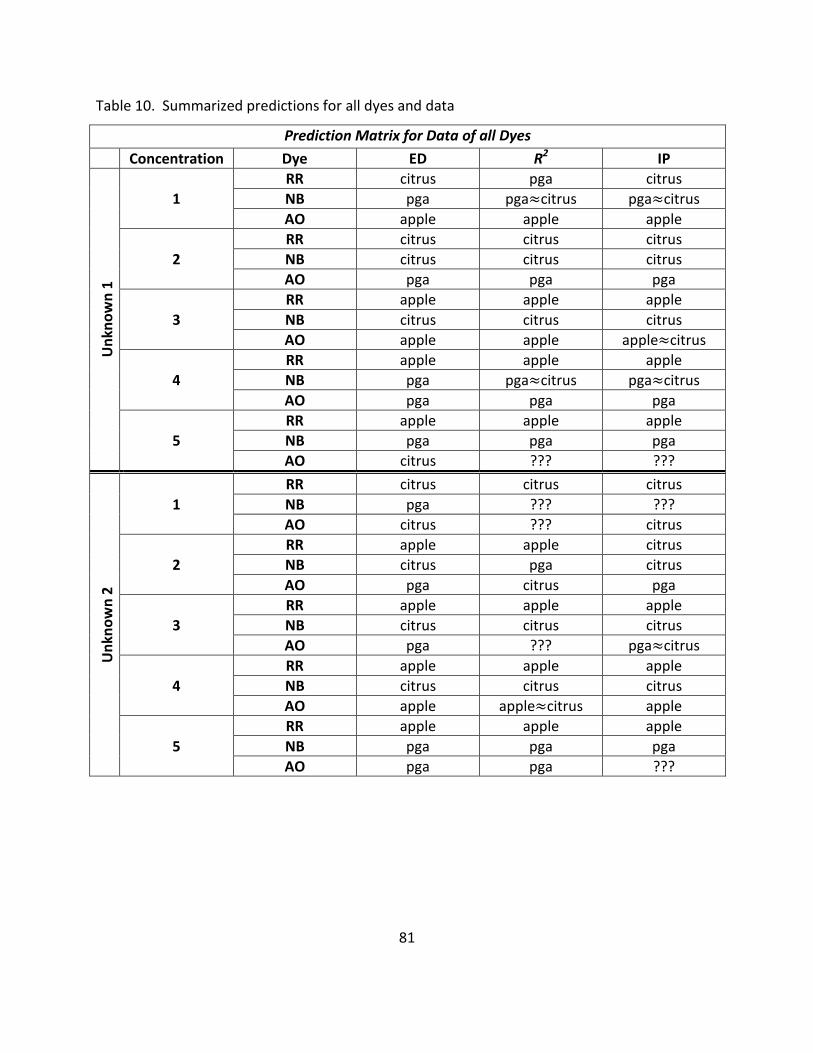
81
Table 10. Summarized predictions for all dyes and data
Prediction Matrix for Data of all Dyes
Concentration Dye ED R2 IP
Un
kno
wn
1
1
RR citrus pga citrus
NB pga pga≈citrus pga≈citrus
AO apple apple apple
2
RR citrus citrus citrus
NB citrus citrus citrus
AO pga pga pga
3
RR apple apple apple
NB citrus citrus citrus
AO apple apple apple≈citrus
4
RR apple apple apple
NB pga pga≈citrus pga≈citrus
AO pga pga pga
5
RR apple apple apple
NB pga pga pga
AO citrus ??? ???
Un
kno
wn
2
1
RR citrus citrus citrus
NB pga ??? ???
AO citrus ??? citrus
2
RR apple apple citrus
NB citrus pga citrus
AO pga citrus pga
3
RR apple apple apple
NB citrus citrus citrus
AO pga ??? pga≈citrus
4
RR apple apple apple
NB citrus citrus citrus
AO apple apple≈citrus apple
5
RR apple apple apple
NB pga pga pga
AO pga pga ???
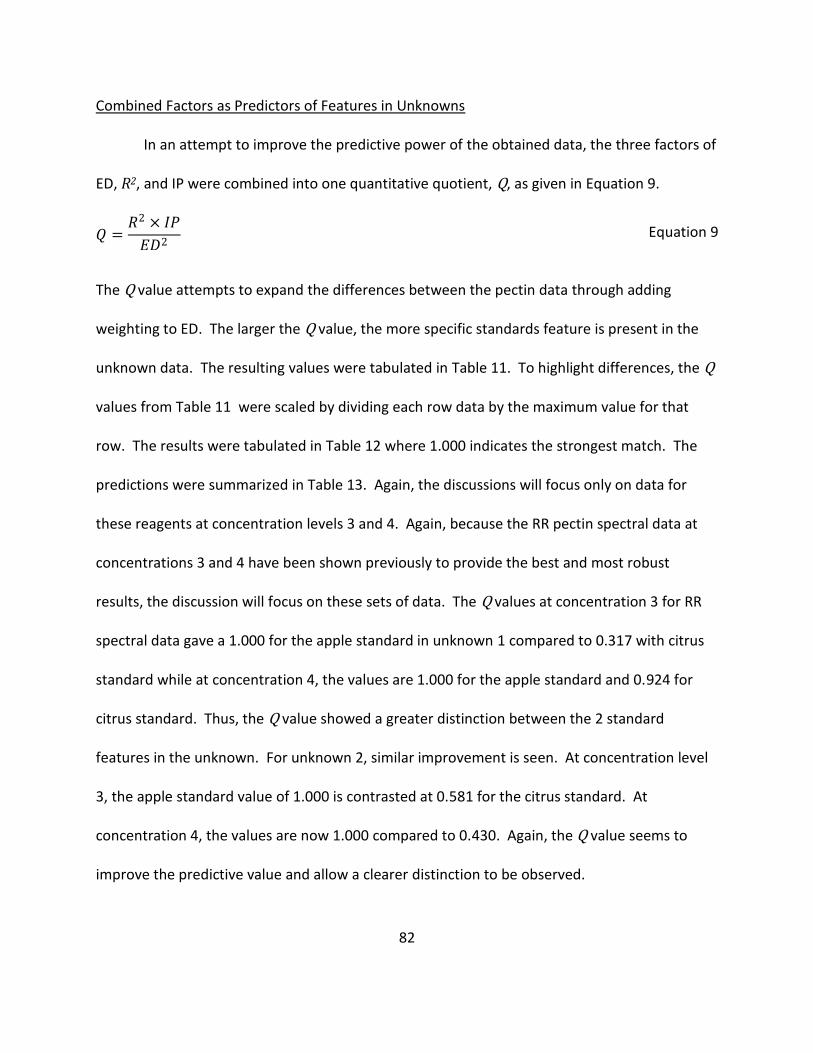
82
Combined Factors as Predictors of Features in Unknowns
In an attempt to improve the predictive power of the obtained data, the three factors of
ED, R2, and IP were combined into one quantitative quotient, Q, as given in Equation 9.
𝑄 =𝑅2 × 𝐼𝑃
𝐸𝐷2 Equation 9
The Q value attempts to expand the differences between the pectin data through adding
weighting to ED. The larger the Q value, the more specific standards feature is present in the
unknown data. The resulting values were tabulated in Table 11. To highlight differences, the Q
values from Table 11 were scaled by dividing each row data by the maximum value for that
row. The results were tabulated in Table 12 where 1.000 indicates the strongest match. The
predictions were summarized in Table 13. Again, the discussions will focus only on data for
these reagents at concentration levels 3 and 4. Again, because the RR pectin spectral data at
concentrations 3 and 4 have been shown previously to provide the best and most robust
results, the discussion will focus on these sets of data. The Q values at concentration 3 for RR
spectral data gave a 1.000 for the apple standard in unknown 1 compared to 0.317 with citrus
standard while at concentration 4, the values are 1.000 for the apple standard and 0.924 for
citrus standard. Thus, the Q value showed a greater distinction between the 2 standard
features in the unknown. For unknown 2, similar improvement is seen. At concentration level
3, the apple standard value of 1.000 is contrasted at 0.581 for the citrus standard. At
concentration 4, the values are now 1.000 compared to 0.430. Again, the Q value seems to
improve the predictive value and allow a clearer distinction to be observed.

83
Table 11. Combined Q table of ED, R2, and IP values for all dyes
Combined Comparison Matrix
Concentration Comparison w/ PGA w/ Apple w/ Citrus
Un
kno
wn
1
1
RR 0.003 0.001 0.001
NB 32.897 10.929 19.220
AO 13.815 34.103 12.455
2
RR 3.389 9.253 19.397
NB 0.911 0.764 2.227
AO 43.863 13.894 15.398
3
RR 0.167 5.978 1.893
NB 16.112 5.799 58.956
AO 48.478 93.866 72.278
4
RR 0.026 4.413 4.076
NB 45.622 1.798 39.944
AO 66.614 24.975 51.344
5
RR 0.041 0.079 0.017
NB 25.984 1.205 12.493
AO 109.647 134.890 142.685
Un
kno
wn
2
1
RR 0.127 0.276 1.328
NB 21.183 11.466 13.568
AO 16.821 10.653 24.289
2
RR 2.559 16.148 8.387
NB 4.133 1.998 6.468
AO 19.620 6.522 13.652
3
RR 0.075 0.374 0.217
NB 12.810 6.002 64.650
AO 145.826 38.758 139.516
4
RR 0.026 6.647 2.859
NB 35.152 1.944 48.288
AO 14.415 230.723 39.815
5
RR 0.636 1.385 0.165
NB 46.984 1.383 16.258
AO 98.173 59.077 88.068
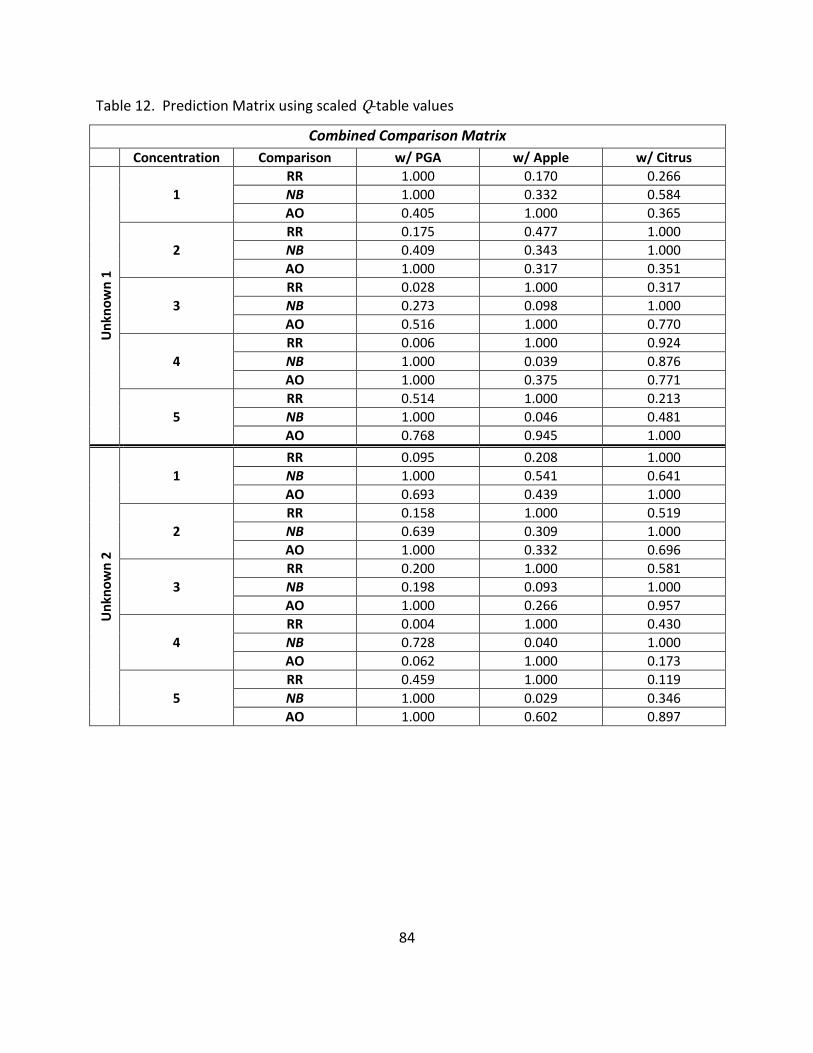
84
Table 12. Prediction Matrix using scaled Q-table values
Combined Comparison Matrix
Concentration Comparison w/ PGA w/ Apple w/ Citrus
Un
kno
wn
1
1
RR 1.000 0.170 0.266
NB 1.000 0.332 0.584
AO 0.405 1.000 0.365
2
RR 0.175 0.477 1.000
NB 0.409 0.343 1.000
AO 1.000 0.317 0.351
3
RR 0.028 1.000 0.317
NB 0.273 0.098 1.000
AO 0.516 1.000 0.770
4
RR 0.006 1.000 0.924
NB 1.000 0.039 0.876
AO 1.000 0.375 0.771
5
RR 0.514 1.000 0.213
NB 1.000 0.046 0.481
AO 0.768 0.945 1.000
Un
kno
wn
2
1
RR 0.095 0.208 1.000
NB 1.000 0.541 0.641
AO 0.693 0.439 1.000
2
RR 0.158 1.000 0.519
NB 0.639 0.309 1.000
AO 1.000 0.332 0.696
3
RR 0.200 1.000 0.581
NB 0.198 0.093 1.000
AO 1.000 0.266 0.957
4
RR 0.004 1.000 0.430
NB 0.728 0.040 1.000
AO 0.062 1.000 0.173
5
RR 0.459 1.000 0.119
NB 1.000 0.029 0.346
AO 1.000 0.602 0.897
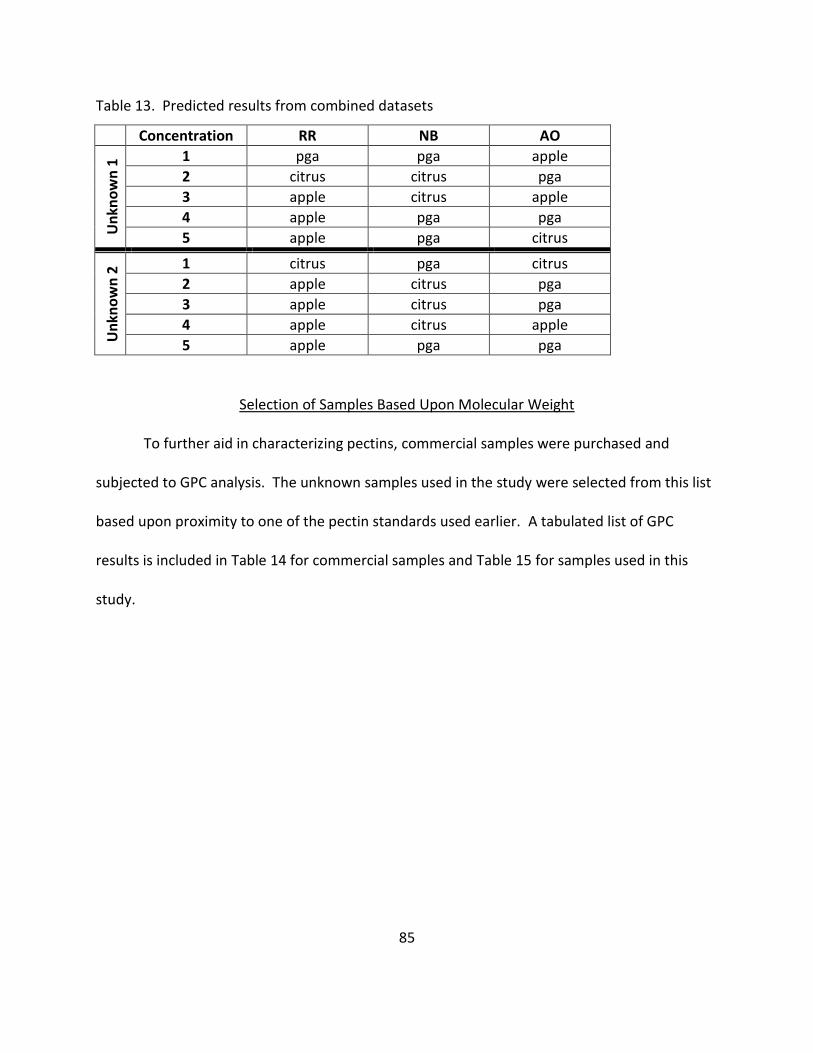
85
Table 13. Predicted results from combined datasets
Concentration RR NB AO
Un
kno
wn
1 1 pga pga apple
2 citrus citrus pga
3 apple citrus apple
4 apple pga pga
5 apple pga citrus
Un
kno
wn
2 1 citrus pga citrus
2 apple citrus pga
3 apple citrus pga
4 apple citrus apple
5 apple pga pga
Selection of Samples Based Upon Molecular Weight
To further aid in characterizing pectins, commercial samples were purchased and
subjected to GPC analysis. The unknown samples used in the study were selected from this list
based upon proximity to one of the pectin standards used earlier. A tabulated list of GPC
results is included in Table 14 for commercial samples and Table 15 for samples used in this
study.

86
Table 14. MW results of GPC studies on diverse samples
Manufacturer Mw Mn 𝒙 𝑴𝒘 As Branded
SureGel 931803 40124 N/A Low Sugar
SureGel 1A 902542 49521 884607
Low Sugar
SureGel 1B 866672 57450 Low Sugar
SureGel 1269073 43785 N/A High Sugar
SureGel 915064 19616 N/A High Sugar
SureGel 829814 35822 N/A High Sugar
SureGel 2A 785962 32957
742409
High Sugar
SureGel 2B 677902 33174 High Sugar
SureGel 2C 763364 45010 High Sugar
Mrs. Wages 400355 2539 395984
Low Sugar
Mrs. Wages 391614 2707 Low Sugar
Ball 1A 1092706 121837 1057638
High Sugar
Ball 1B 1022570 102155 High Sugar
Ball 970401 66216 N/A High Sugar
Ball 2A 2023990 783468 1990572
Low Sugar
Ball 2B 1957155 699325 Low Sugar
Ball 1740333 760892 N/A Low Sugar
Kroger 1A 881469 28269
877470
High Sugar
Kroger 1B 880487 27529 High Sugar
Kroger 1C 870455 55952 High Sugar
Aldrich 1578538 906765 N/A HM-Citrus
Aldrich 305651 82102 N/A Citrus
Aldrich 146601 59834 N/A 95% PGA
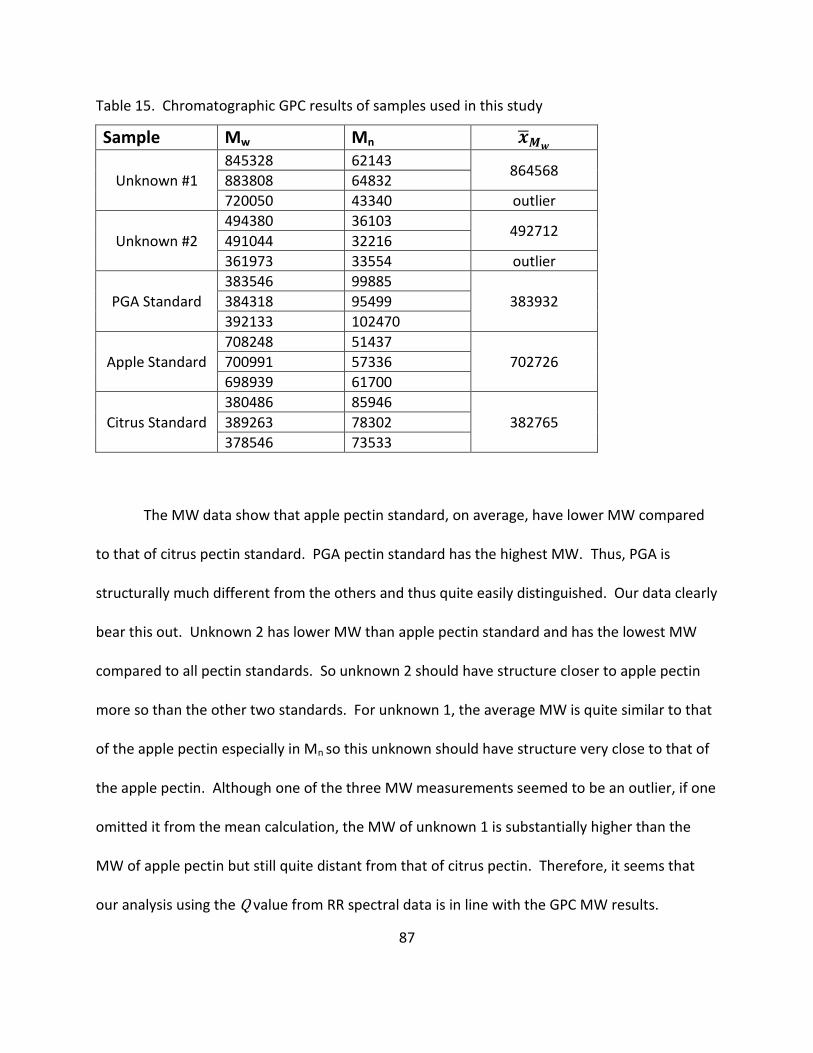
87
Table 15. Chromatographic GPC results of samples used in this study
Sample Mw Mn 𝒙 𝑴𝒘
Unknown #1
845328 62143 864568
883808 64832
720050 43340 outlier
Unknown #2
494380 36103 492712
491044 32216
361973 33554 outlier
PGA Standard
383546 99885
383932 384318 95499
392133 102470
Apple Standard
708248 51437
702726 700991 57336
698939 61700
Citrus Standard
380486 85946
382765 389263 78302
378546 73533
The MW data show that apple pectin standard, on average, have lower MW compared
to that of citrus pectin standard. PGA pectin standard has the highest MW. Thus, PGA is
structurally much different from the others and thus quite easily distinguished. Our data clearly
bear this out. Unknown 2 has lower MW than apple pectin standard and has the lowest MW
compared to all pectin standards. So unknown 2 should have structure closer to apple pectin
more so than the other two standards. For unknown 1, the average MW is quite similar to that
of the apple pectin especially in Mn so this unknown should have structure very close to that of
the apple pectin. Although one of the three MW measurements seemed to be an outlier, if one
omitted it from the mean calculation, the MW of unknown 1 is substantially higher than the
MW of apple pectin but still quite distant from that of citrus pectin. Therefore, it seems that
our analysis using the Q value from RR spectral data is in line with the GPC MW results.

88
As mentioned previously, euclidean distance, correlation coefficients, and eigenanalysis
data failed to predict consistently with NB and AO. When looking at MW data, it is readily
apparent polymer size greatly influences spectral results as with %DE values. MW of citrus and
PGA standards are relatively small when compared to apple. Pectin Unknown 2 was closer to
PGA and citrus standards in MW. Pectin Unknown 1 MW was closer to that of apple. Further,
%DE of the pectins
89
CHAPTER 5
CONCLUSION
Pectins are a family of abundant, naturally occurring, complex, anionic polysaccharides
comprising up to 35% of the cell wall of most terrestrial plants. Pectin has had a long and
varied history in the food and more recently the pharmaceutical industry. Incredibly, with this
history, not much was known of pectin’s structural and chemical properties until recent years.
Two main classes of pectin exist, low methoxyl and high methoxyl pectin. These play very
important roles in pectin’s chemical and physical properties and provide for a diversity of uses.
The two main classes can be further subdivided into slow, medium, and rapid set gelation
types. The speed of gelation is directly proportional to the %DE of the molecule. Pectin
contains a very high percentage of galactouronides but can contain substantial amounts of
other uronide impurities that further differentiate its properties.
Numerous techniques exist for the analysis of pectin. However, due to the complexity
and heterogeneous nature of the pectin polymer, distinctive analyses are very difficult.
Additionally, pectins are insoluble in most organic solvents and only soluble in water when
complexed with a monovalent salt. This adds to the complexity of analysis. Two techniques
often used for characterization of pectin are molecular weight determination through gel
permeation chromatography and UV-Vis analysis with reactions producing colored complexes.
Molecular weight (MW) has the second largest influence on pectin chemical and physical
properties with %DE being the most important. The MW of the polymer is a direct indication of
the number of reactive sites available for complexation. Larger sizes also increase polymer self-

90
aggregation where the pectin will fold and crosslink inter- and intra-molecularly. The size can
also influence solution dynamics and viscosity (e.g. gelation). For this reason, GPC analysis can
be greatly influenced by how the sample matrix is prepared. Only meticulous preparation and
measurement conditions will provide accurate MW results.
Spectrophotometric measurement techniques generally suffer from a lack of specificity
in complex carbohydrate research. Because pectin is not homogeneous, the reagents used to
produce color in reactions with decomposed pectin suffer numerous interferences. Even
reagents targeted specifically to the galactouronides will show limited reactivity to other
uronides in the system. Due to these deficiencies, researchers have recently intensified
research on complexation reactions rather than chemical modification to analyze pectins. In
complexation reactions, pectin has a very high affinity for divalent and trivalent ionic
compounds. Divalent salts of pectin have limited solubility while trivalent salts are insoluble.
Pectin complexation with colored metal complexes or other ionic compounds that produce
color in the UV-Vis region of the electromagnetic spectrum allow for low cost, rapid analysis
through UV-Vis measurements. Ruthenium Red is a metachromic, ionic dye that has shown
quantitative interaction with pectin at lower %DE values. Lower %DE pectin polymers provide
numerous sites for complexing with RR. MW and polymer solution dynamics will greatly
influence pectin’s ability to form complexes. Therefore, the best complexation will occur at
moderate MW and in specifically controlled conditions.
The first goal of this work was to define the best complexing conditions for the pectin
under study. Experimentation was conducted on pectins with a moderate range of molecular
91
weights in a slightly acidic biological buffer. Most organic and inorganic buffers show varying
levels of complexation with pectin and cause precipitation and experimental error. Thus, it was
necessary to choose the buffer carefully for this work. The versatile biological buffer, 3-
morpholinopropanesulfonic acid, was chosen as it provides the needed pH buffering capacity
and aids in the ionization of the pectin without complexation. Low pH hinders ionization of
carboxyl groups to decrease electrostatic intramolecular repulsion within the chains thus
allowing gelation. We want to keep pH higher to keep chains available for reactions and to
minimize chain-chain interactions.
As previously discussed, RR complexes quantitatively with pectin up to roughly 80 %DE.
The intent of this research is to devise a method whereby pectins of any range %DE can be
characterized with RR or other metachromic dyes. Additionally, the method should also
characterize off-the-shelf pectin with minimal purification. The standards used in this study fall
within a high range of %DE. PGA (pectin with very low %DE) was also employed as a standard
to cover the full range of %DE. Prior knowledge shows calcium is a good precipitating agent for
lower %DE values but poor for higher levels of %DE. Based upon a priori knowledge, Pb2+ was
chosen as the best candidate for precipitating pectin under a variety of conditions and physical
properties. To develop the method, reagent grade pectins of known composition were
acquired for study. The standards were purified to remove as much interference as possible.
Experimentation was done to determine optimal concentrations of buffer, dye, Pb2+
precipitating agent, and pectin to use for the study. RR complexation with the standards was
verified by replicating previous experimentation by other researchers. The pectin was dissolved

92
in a dilute aqueous buffer solution, the dye of known concentration was added, allowed time to
interact, the pectin-dye complex precipitated out of solution and the supernatant with residual
dye analyze via UV-Vis. Because of the minute concentrations used, the deltas in the
absorbances were very small. Differences in the spectra could be seen visually but in order to
fully explain the results and validate the data, it was necessary to employ chemometric
techniques. As expected, RR did show quantifiable interactions (using euclidean distance,
correlation coefficients, and eigenvector inner products) with the various pectin standards.
Numerous other cationic dyes were tested but most showed no discernable results. Nile Blue
and Acridine Orange did, however, show some promise. Although showing some interaction,
when compared singularly with RR, these dyes failed to provide data of high confidence. To
increase predictive resolution, the chemometric factors were combined into a single quotient,
Q, given by 𝑄 = (𝑅2 × 𝐼𝑃)/(𝐸𝐷)2.
The range of concentrations used for this study was important. The spectral features
did show at too low of dye concentration, signal noise and lack of pectin complex interaction
with the dyes gave results of poor precision. Conversely, high dye concentrations saturated the
pectin sites and excess amount in the solution led to the loss of resolution. Mid-range dye
concentration showed the most reproducible results.
Commercial samples of both “low sugar” (low %DE) and “normal” (high %DE) were
obtained from local grocers and classified as unknown 1 and unknown 2, respectively. These
samples were not further purified and analyzed under the same conditions as the standards.
Using the same chemometric techniques, the unknowns were compared to the standards and
93
these data were used to predict which standard the unknown was closest to at the chosen
concentration range.
The results obtained showed that the pectins treated with NB and AO did not give the
analysts any useful information or predictive value at all concentrations and employing any of
the three chemometric factors chosen. Even at the optimal concentration level 3 or 4, these
dye data did not afford any robust consistent predictive values.
Ruthenium red seemed to be able to provide discrimination when used as the
colorimetric reagent for the different pectins. Among the concentration range attempted,
concentrations level 3 and 4, particularly the later, gave good results. With the three
chemometric treatments, the Euclidean Distance (ED) values were the greatest predictive
factor. The correlation coefficients (R2) and the inner product (IP) were useful in ruling out the
feature, i.e. the feature not present, in the unknown rather than distinguishing among the
features that might be present or similar to one another. Thus, the quotient, Q, was conceived
to include all these factors while amplifying the most predictively useful factor. So, 𝑄 = (𝑅2 ×
𝐼𝑃)/(𝐸𝐷)2 was used and it indeed was able to separate the features apart consistently.
Furthermore, the predictions of the Q values were corroborated by the gel permeation MW
results.
Thus, from all the results obtained and the discussions therein, the objectives of this
research have been mostly achieved. We have shown that, among several, the pectin spectral
data of a colorimetric reagent, ruthenium red, coupled with the three chosen chemometric

94
factors, ED, R2, and IP, allowed one to distinguish the features in the unknown pectins. These
results were also further corroborated by GPC MW data.
For further investigations, the predictive value of the dyes may be enhanced by
combining 2 or 3 of them simultaneously in a single pectin. Because of the structural features
of the pectins and that of the colorimetric reagents, there will be a competition among the dyes
for the sites in a given pectin. Some dyes may be more competitive for a certain feature. This
competition can be used to enhance the distinction among the pectins studied.

95
BIBLIOGRAPHY
1. International Pectin Producers Association, Pectin: Discovery & History. In Internation
Pectin Producers Association: 2001.
2. Vauquelin, M. L.-N., Analyse due Tamarin. In Ann. Chim., Paris, 1790; pp 92-106.
3. Braconnot, H., Recherches sur un novel acide univerellement rependu dans tous les
vegetaux. In Ann. Chim. Phys. Ser, Paris, 1825; pp 173-178.
4. Douglas, R. Pectin Food Product. U.S. Patent 1082682, 1913.
5. Tombs, M. P.; Harding, S. E., An Introduction to Polysaccharide Biotechnology. Taylor &
Francis: Pennsylvania, 1998.
6. May, C. D., Industrial pectins: Sources, production and applications Carbohydrate
Polymers 1990, 12, (1), 79-99.
7. Pilnik, W.; Reitsma, J. C. E., Analysis of mixtures of pectins and amidated pectins.
Carbohydrate Polymers 1989, 10, (2), 315-319.
8. Visser, J.; Voragen, A. G. J., Pectins and Pectinases. Elsevier Science: Amsterdam, 1996.
9. Kertesz, Z. I.; Baker, G. I.; Joseph, G. H.; Mottern, H. H.; Olsen, A. G., Chem. Eng. News
1944, 22, 105.
10. Korner, R.; Limberg, G.; Christensen, T. M. I. E.; Mikkelsen, J. D.; Roepstorff, P.,
Sequencing of Partially Methyl-Esterified Oligogalacturonates by Tandem Mass
Spectrometry and Its Use To Determine Pectinase Specificities. Anal. Chem. 1999, 71,
(7), 1421-1427.
96
11. Voragen, A. G. J.; Pilnik, W.; Thibault, J. F.; Axelos, M. A. V.; Renard, C. M. G. C., Food
Polysaccharides and Their Applications. Marcel Dekker, Inc.: New York, 1995; p 287-389.
12. Rolin, C.; Nielsen, B. U.; Glahn, P.-E., Polysaccharides: Structural Diversity and Functional
Versatility. Marcel Dekker, Inc.: New York, 1998; p 377-431.
13. Bishay, I. E.; Clark, D. R. Carbohydrate protein cream substitutes. U.S. Patent 5536514,
1996.
14. Speirs, C.; White, K. E. Gelling system. U.S. Patent 5356654, 1994.
15. Flory, P. J., Priciples of Polymer Chemistry. Cornell University Press: Ithaca, New York,
1953.
16. Lapasin, R.; Pricl, S., Rheology of Industrial Polysaccharides: Theory and Applications.
Blackie Academic & Professional: London, 1995.
17. Wang, Q.; Pagan, J.; Shi, J., Pectin From Fruits. In Functional Foods: Biochemical and
Processing Aspects, Shi, J.; Mazza, G.; Le Maguer, M., Eds. CRC Press LLC: Washington,
2002; Vol. 2.
18. Jenchs, W. P., Catalysis in Chemistry and Enzymology. McGraw-Hill: New York, 1969.
19. Chen, T. S.; Joslyn, M. A., The effect of sugars on viscosity of pectin solutions. II.
Comparison of dextrose, maltose, and dextrins. J. Colloid Interface Sci. 1967, 25, 246-
352.
20. Walkinshaw, M. D.; Arnott, S., Conformations and interactions of pectins. II. Models for
junction zones in pectinic acid and calcium pectate gels. J. Mol. Biol. 1981, 153, 1075-
1085.

97
21. Anyas-Weisz, L.; Deuel, H., Über das Verhalten löslicher Polyelektrolyte gegenüber
Ionenaustauschern. Helv. Chem. Acta 1950, 33, 559-562.
22. Van Buren, J. P., Function of pectin in plant tissue structure and firmness. In The
Chemistry and Technology of Pectin, Walter, R. H., Ed. Academic Press, Inc.: New York,
1991; pp 1-22.
23. Kohn, R.; Luknar, O., Intermolecular calcium ion binding on polyuronates –
polygalacturonate and polyguluronate. Coll. Czech. Commun. 1977, 42, 731-744.
24. Thibault, J. F.; Rinaudo, M., Chain association of pectic molecules during calcium-
induced gelation. Biopolymers 1986, 25, (3), 455-468.
25. El-Nawawi, S. A.; Heikel, Y. A., Factors affecting the production of low-ester pectin gels.
Carbohyd. Polym. 1995, 26, (3), 189-193.
26. Grosso, C. R. F.; Rao, M. A., Dynamic rheology of structure development in low-methoxyl
pectin+Ca2++sugar gels. Food Hydrocolloids 1998, 12, (3), 357-363.
27. Rolin, C., Commercial Pectin Preparations. In Pectins and their Manipulation, Seymour,
G. B.; Knox, J. P., Eds. CRC Press, LLC: Boca Raton, Florida, 2000.
28. Dea, I. C. M.; Madden, J. K., Food Hydrocolloids 1986, 1, 71.
29. Glahn, P.-E. Pectin Process and Composition. U.S. Patent 6207194, 2001.
30. Hetland, G.; Samuelsen, A. B., Protective Effect of Plantago major L. Pectin
Polysaccharide against Systemic Streptococcus pneumoniae Infection in Mice. Scand. J.
Immunol. 2000, 52, (4), 348-255.
98
31. Sun, X.-B., Matsumoto, T.; Yamada, H., Anti-ulcer activity and mode of action of the
polysaccharide fraction from the leaves of Panax ginseng. Planta Med. 1992, 58, 432-
435.
32. Waterhouse, E. T., Washington, C., Washington, N., An investigation into the efficacy of
the pectin based anti-reflux formulation-Aflurax. Int. J. Pharm. 2000, 209, 79-85.
33. Thayer, A. M., Food Additives. Chem. Eng. News 1992, 70, pp 26-44.
34. Rhodes, K. H. Process for making whey-derived fat substitute product and products
thereof. U.S. Patent 5413804, 1992.
35. National Research Council, Pectins. In Food Chemical Codex, 2 ed.; National Academy of
Sciences: Washington, D.C., 1972; pp 577-581.
36. Voragen, A. G. J.; Schols, H. A.; Pilnik, W., Determination of the degree of methylation
and acetylation of pectins by HPLC. Food Hydrocolloids 1986, 1, (1), 65-70.
37. Kearsley, M. W.; Verwaerde, F., Enzymatic determination of carbohydrates. In Advances
in Carbohydrate Analysis, White, C., Ed. Elsevier Science & Technology: London, 1991;
Vol. 1.
38. Albersheim, P.; Neukom, H.; Deuel, H., Über die Bildung von Ungesättigen
Abbauprodukten durch ein Pektinabbauendes Enzym. Helv. Chim. Acta 1960, 43, 1422-
1426.
39. Stoecker, P. W.; Yacynyeh, A. M., Chemically modified electrodes as biosensors. Sel.
Elec. Rev. 1990, (12), 137-160.

99
40. Moraru, C.; Logendra, L.; Lee, T.-C.; Janes, H., Characteristics of 10 processing tomato
cultivars grown hydroponically for the NASA Advanced Life Support (ALS) Program.
Journal of Food Composition and Analysis 2004, 17, (2), 141-154.
41. McCready, R. M.; McComb, E. A., Pectic constituents in ripe and unripe fruit. Journal of
Food Science 1954, 19, (1-6), 530-535.
42. Smith, J. E.; Stainsby, G., Studies on pectins I. Light-scattering and weight average
molecular weights. British Polymer Journal 2006, 9, (4), 284-289.
43. Hobson, G. E., Pectinesterase in normal and abnormal tomato fruit. Biochem. J. 1963,
86, 358-365.
44. Robertson, G. L., The determination of pectic substances in citrus juice and grapes by
two spectrophotometric methods. Journal of Food Biochemistry 1981, 5, (2), 139-143.
45. Hou, W.-C.; Chang, W.-H.; Jiang, C.-M., Qualitative distinction of carboxyl group
distributions in pectins with ruthenium red. Bot. Bull. Acad.Sin. 1999, 40, 115-119.
46. Bergman, F., Colorimetric determination of amides as hydroxamic acids. Anal. Chem.
1952, 24, 1367-1369.
47. Dische, Z., A new specific color reaction of hexuronic acids. J. Biol. Chem. 1946, 167,
189-198.
48. Dische, Z., A modification of the carbazole reaction of hexuronic acids for the study of
polyuronides. J. Biol. Chem. 1950, 183, 489-494.
49. Taylor, K. A.; Buchanan-Smith, J. G., A colorimetric method for the quantitation of uronic
acids and a specific assay for galacturonic acid. Anal. Biochem. 1992, 201, 190-196.

100
50. Dekker, R. F. H.; Richards, G. N., Determination of pectic substances in plant material. J.
Sci. Food Agric. 1972, 23, 475-483.
51. McComb, E. A.; McCready, R. M., Extraction and determination of total pectic materials
in fruits. Anal. Chem. 1952, 24, 1630-1632.
52. Bitter, T.; Muir, H. M., A modified uronic acid carbazole reaction. Anal. Biochem. 1962,
4, 330-334.
53. Rouse, A. H.; Atkins, C. D., Pectinesterase and pectin in commercial citrus juices as
determined by methods used at the citrus experiment station. Fla. Agric. Exp. Stn. Bull.
1955, 570.
54. McCready, R. M., In Methods in Food Analysis, Joslyn, M. A., Ed. Academic Press: New
York, 1970; pp 565-599.
55. Brown, A. H., Determinations of pentose in the presence of large quantities of glucose.
Arch. Biochem. 1946, 11, 269.
56. Blumenkrantz, N.; Asboe-Hansen, G., New method for quantitative determination of
uronic acids. Anal. Biochem. 1973, 42, (2), 484-489.
57. Scott, R. W., Colorimetric determination of hexuronic acids in plant materials. Anal.
Chem. 1979, 51, 936-941.
58. Thibault, J. F., Automatisation du dosage des substances pectiques. par la méthode au
méta-hydroxydiphényl. Lebensm. Wiss. u.-Technol. 1979, 12, 247.
59. Mitra, A.; Nath, R. K.; Chakraborty, A. K., Interaction of bacterial acidic polysaccharides
with cationic dyes. Colloid & Polymer Science 1993, 271, (11), 1042-1048.
101
60. Mandal, N. C.; Biswas, B. B.; Pal, M. K., Metachromasia induced by inositol-hexa-
phosphate with toluidene blue. Histochemistry and Cell Biology 1969, 18, (3), 202-209.
61. Stone, A. L., Anomalous rotary dispersion of metachromatic mucopolysaccharide-dye
complexes. I. Heparin. Biopolymers 2004, 2, (4), 315-325.
62. Stone, A. L.; Bradley, D. F., Aggregation of cationic dyes on acid polysaccharides: I.
Spectrophotometric titration with acridine orange and other metachromic dyes.
Biochim. Biophys. Acta 1967, 148, 172-192.
63. Stone, A. L., Aggregation of cationic dyes on acid polysaccharides. II. Quantitative
parameters of metachromacy. Biochim. Biophys. Acta 1967, 148, 193-206.
64. Seely, G. R.; Knotts, R. R., Binding of methylene blue to alginate: Effect of acid treatment
on metachromasy. Carbohydrate Polymers 1983, 3, (2), 109-127.
65. Chakrabarti, A.; Nath, R. K.; Chakraborty, A. K., Induction of metachromasy in cationic
dye by bacterial cell surface polysaccharide from Klebsiella K10. Spectrochimica Acta
Part A: Molecular Spectroscopy 1989, 45, (9), 981.
66. Jana-Sur, P.; Chakraborty, A. K., Studies on the interaction of bacterial capsular
polysaccharide-Klebsiella K16 with cationic dyes. Journal of Photochemistry and
Photobiology A: Chemistry 2005, 173, (1), 64-69.
67. Dasgupta, S.; Nath, R. K.; Biswas, S.; Hossain, J.; Mitra, A.; Panda, A. K., Spectral studies
on the interaction of cationic dye/surfactants with Klebsiella K28 capsular
polysaccharide. Colloids and Surfaces A: Physicochemical and Engineering Aspects 2007,
302, (1-3), 17-23.
102
68. Stoddart, R. W.; Spires, I. P. C.; Tipton, K. F., Solution properties of polygalacturonic acid.
Biochem. J. 1969, 114, 863-870.
69. Kartel, M. T.; Kupchik, L. A.; Veisov, B. K., Evaluation of pectin binding of heavy metal
ions in aqueous solutions. Chemosphere 1999, 38, (11), 2591-2596.
70. Lakatos, B.; Meisel, J.; Rockenbauer, A.; Simon, P., EPR and Mössbauer spectroscopic
studies on metal complexes of pectic acids and their derivatives. Inorgan. Chim. Acta
1983, 79, 269-270.
71. Dzizenko, A. K.; Sorochan, V. D.; Prudnikova, T. I.; Ovodov, Y. S., Determination of the
molecular weight of polysaccharides by the light-scattering method. Russian Chemical
Bulletin 1969, 18, (12), 2642-2643.
72. Turquois, T.; Gloria, H., Determination of the absolute molecular weight averages and
molecular weight distributions of alginates used as ice cream stabilizers by using
multiangle laser light scattering measurements. J. Agric. Food Chem. 2000, 48, (11),
5455-5458.
73. Selin, M. M.; Donetskii, I. A.; Volodin, A. A.; Kochergin, P. M., Determination of the
molecular weight of dextrans using an anisotropic semipermeable membrane.
Pharmaceutical Chemistry Journal 1977, 12, (3), 412-414.
74. Hexner, P. E.; Radford, L. E.; Beams, J. W., Achievement of Sedimentation Equilibrium.
Proceedings of the National Academy of Sciences of the United States of America 1961,
47, (11), 1848-1852.

103
75. Yau, W. W.; Kirkland, J. J.; Bly, D. D., Modern Size-Exclusion Liquid Chromatography:
Practice of Gel Permeation and Gel Filtration Chromatography. 1 ed.; Wiley-Interscience:
New York, 1979.
76. Spatorico, A. L.; Coulter, B., Molecular weight determinations by gel-permeation
chromatography and viscometry. Journal of Polymer Science: Polymer Physics Edition
1973, 11, (6), 1139-1150.
77. Hubbard, A. T., Encyclopedia of Surface and Colloid Science. CRC Press: New York, 2002.
78. Cho, S.; Prosky, L.; Dreher, M. L., Complex Carbohydrates in Foods. CRC Press: New York,
1999; p 700.
79. Tswett, M., On a new category of adsorption phenomena and their application to
biochemical analysis. Ber. Deut. Botan. Ges. 1906, 24, 316, 384.
80. Ettre, L. S.; Zlatkis, A., 75 Years of Chromatography - A Historical Dialogue. Elsevier: New
York, 1979.
81. Dronnet, V. M.; Renard, C. M. G. C.; Axelos, M. A. V.; Thibault, J.-F., Binding of divalent
metal cations by sugar-beet pulp. Carbohyd. Polym. 1997, 34, 73-82.
82. Wood, P. J., Factors affecting precipitation and spectral changes associated with
complex-formation between dyes and D-glucans. Carbohyd. Res. 1982, 102, 283-293.
83. Wood, P. J., Specificity in the interaction of direct dyes with polysaccharides. Carbohyd.
Res. 1980, 85, 271-287.
84. Zacharias, D., New Color Reactions for Determination of Sugars in Polysaccharides. In
Methods of Biochemical Analysis, David, G., Ed. 2006; pp 313-358.

104
85. Thibault, J. F.; Renaudo, M., Interactions of Mono- and divalent counterions with alkali-
and enzyme-deesterified pectins in salt-free solutions. Biopolymers 1985, 24, 2131-
2138.
86. Powell, D. A.; Morris, E. R.; Gidley, M. J.; Rees, D. A., Conformations and interactions of
pectins. II. Influence of residue sequence on chain association in calcium pectate gels. J.
Mol. Biol. 1982, 155, 517-525.
87. Brereton, R. G., Data Analysis for the Laboratory and Chemical Plant. John Wiley & Sons
Ltd: West Sussex, UK, 2003.
88. Rowell, R. L., Signal Averagers. J. Chem. Ed. 1974, 51, A71.
89. Wallace, R. M., Analysis of absorption spectra of multicomponent systems. J. Phys.
Chem. 1960, 64, 899.
90. LaFara, R. L., Computer Methods for Science and Engineering. Hayden: Rochelle Park,
NJ, 1978.
91. Enke, C. G.; Nieman, T. A., Signal-to-Noise Ratio Enhancement by Least-Squares
Polynomial Smoothing. Anal. Chem. 1976, 48, 705A.
92. Malinowski, E. R., Factory Analysis in Chemistry. 2 ed.; Wiley: New York, 1991.
93. Savitsky, A.; Golay, M. J. E., Smoothing and Differentiation of Data by Simplified Least
Squares Procedures. Anal. Chem. 1964, 36, 1627-1639.
94. Marcus, M.; Minc, H., Introduction to Linear Algebra. Dover: New York, 1988.
95. Hoffman, K.; Kunze, R., Characteristic Values. Prentice-Hall: Englewood Cliffs, NJ, 1971.
105
VITA
DANIEL WAYNE DIXON, JR.
Personal Data: Date of Birth: March 3, 1970
Place of Birth: Kingsport, Tennessee
Marital Status: Married
Education: Public Schools, Church Hill, Tennessee
Certificate of Pharmacy Technology, U.S. Army Medical Corps, Ft.
Sam Houston, Texas 1995
Paramedic Certification, U.S. Army Medical Corps, Ft. Sam
Houston, Texas 1995
A.A.S. Chemical Technology, Northeast Tennessee State Technical
College, Blountville, Tennessee 1996
B.S. Chemistry, East Tennessee State University, Johnson City,
Tennessee 2001
M.S. Chemistry, East Tennessee State University, Johnson City,
Tennessee 2008
Professional Experience: Medical Lab Intern, Ft. Sam Houston Medical Center, Ft. Sam
Houston, Texas, 1995

106
Chemical Technician, Eastman Chemical Company, Kingsport,
Tennessee, 1998 - 2000
Research Chemist, Eastman Chemical Company, Kingsport,
Tennessee, 2000 – 2005
Development and Automation Chemist, Eastman Chemical
Company, Kingsport, Tennessee, 2005 - present
Publications: Dixon, Daniel W., et.al. (2002). “Synthesis and characterization of
water-soluble hydroxybutenyl cyclomaltooligosaccharides
(cyclodextrins).” Carbohydrate Research, Volume 337, Issue
6, pp.493-507.
Dixon, Daniel W., et.al. (2002). “Cyclodextrin Ethers.” U.S. Patent
6,479,467.
Dixon, Daniel W., et.al. (2004). “Low molecular weight cellulose
mixed esters and their use as low viscosity binders and
modifiers in coatings compositions.” Patent US2004181009.
Honors and Awards: Who’s Who in American High Schools.
Outstanding Honors Diploma.
Who’s Who in American Colleges.
Magna Cum Laude, Northeast Tennessee State Technical College.