Characterization of Carbon Dioxide Washout Measurement ...
12
46th International Conference on Environmental Systems ICES-2016-[insert submission number] 10-14 July 2016, Vienna, Austria Characterization of Carbon Dioxide Washout Measurement Techniques in the Mark-III Space Suit Ian M. Meginnis 1 NASA Johnson Space Center, Houston, Texas, 77058 Jason Norcross 2 and Omar Bekdash 3 and Robert Ploutz-Snyder 4 Wyle Science, Technology and Engineering, Houston, Texas, 77058 A space suit must provide adequate carbon dioxide (CO2) washout inside the helmet to prevent symptoms of hypercapnia. In the past, an oronasal mask has been used to measure the inspired air of suited subjects to determine a space suit’s CO2 washout capability. While sufficient for super-ambient pressure testing of space suits, the oronasal mask fails to meet several human factors and operational criterion needed for future sub-ambient pressure testing (e.g. compatibility with a Valsalva device). This paper describes the evaluation of a nasal cannula as a device for measuring inspired air within a space suit. Eight test subjects were tasked with walking on a treadmill or operating an arm ergometer to achieve target metabolic rates of 1000, 2000, and 3000 British thermal units per hour (BTU/hr), at flow rates of 2, 4, and 6 actual cubic feet per minute (ACFM). Each test configuration was conducted twice, with subjects instructed to breathe either through their nose only, or however they felt comfortable. Test data shows that the nasal cannula provides more statistically consistent data across test subjects than the oronasal mask used in previous tests. The data also shows that inhaling/exhaling through only the nose provides a lower sample variance than a normal breathing style. Nose-only breathing reports better CO2 washout due to several possible reasons, including a decreased respiratory rate, an increased tidal volume, and because nose- only breathing directs all of the exhaled CO2 down and away from the oronasal region. The test subjects in this study provided feedback that the nasal cannula is comfortable and can be used with the Valsalva device. Nomenclature ACFM = actual cubic feet per minute BTU = British thermal unit C = Celsius CO 2 = carbon dioxide EMU = extra-vehicular mobility unit EVA = extra-vehicle activity Hr = hour Hz = hertz kcal = kilocalorie LCG = liquid cooling garment 2 = liter of oxygen mmHg = millimeters of mercury NASA = National Aeronautics and Space Administration ppCO 2 = partial pressure of carbon dioxide psia = pounds per square inch absolute psig = pounds per square inch gauge ̇ = metabolic rate RER = respiratory exchange ratio 1 Space Suit Engineer, Crew and Thermal Systems Division, 2101 NASA Pkwy/EC5, Houston, TX 77058. 2 EVA Discipline Scientist, Wyle Science, Technology and Engineering Group, 1290 Hercules, Houston, TX 77058 3 Research Engineer, Wyle Science, Technology and Engineering Group, 1290 Hercules, Houston, TX 77058 4 Biostatistician, Universities Space Research Association, 3600 Bay Area Blvd, Houston, TX 7705
Transcript of Characterization of Carbon Dioxide Washout Measurement ...

46th International Conference on Environmental Systems ICES-2016-[insert submission number] 10-14 July 2016, Vienna, Austria
Characterization of Carbon Dioxide Washout Measurement
Techniques in the Mark-III Space Suit Ian M. Meginnis1
NASA Johnson Space Center, Houston, Texas, 77058
Jason Norcross2 and Omar Bekdash3 and Robert Ploutz-Snyder4
Wyle Science, Technology and Engineering, Houston, Texas, 77058
A space suit must provide adequate carbon dioxide (CO2) washout inside the helmet to
prevent symptoms of hypercapnia. In the past, an oronasal mask has been used to measure
the inspired air of suited subjects to determine a space suit’s CO2 washout capability. While
sufficient for super-ambient pressure testing of space suits, the oronasal mask fails to meet
several human factors and operational criterion needed for future sub-ambient pressure
testing (e.g. compatibility with a Valsalva device). This paper describes the evaluation of a
nasal cannula as a device for measuring inspired air within a space suit. Eight test subjects
were tasked with walking on a treadmill or operating an arm ergometer to achieve target
metabolic rates of 1000, 2000, and 3000 British thermal units per hour (BTU/hr), at flow rates
of 2, 4, and 6 actual cubic feet per minute (ACFM). Each test configuration was conducted
twice, with subjects instructed to breathe either through their nose only, or however they felt
comfortable. Test data shows that the nasal cannula provides more statistically consistent data
across test subjects than the oronasal mask used in previous tests. The data also shows that
inhaling/exhaling through only the nose provides a lower sample variance than a normal
breathing style. Nose-only breathing reports better CO2 washout due to several possible
reasons, including a decreased respiratory rate, an increased tidal volume, and because nose-
only breathing directs all of the exhaled CO2 down and away from the oronasal region. The
test subjects in this study provided feedback that the nasal cannula is comfortable and can be
used with the Valsalva device.
Nomenclature
ACFM = actual cubic feet per minute
BTU = British thermal unit
C = Celsius
CO2 = carbon dioxide
EMU = extra-vehicular mobility unit
EVA = extra-vehicle activity
Hr = hour
Hz = hertz
kcal = kilocalorie
LCG = liquid cooling garment
𝑙𝑂2 = liter of oxygen
mmHg = millimeters of mercury
NASA = National Aeronautics and Space Administration
ppCO2 = partial pressure of carbon dioxide
psia = pounds per square inch absolute
psig = pounds per square inch gauge
�̇�𝑚𝑒𝑡 = metabolic rate
RER = respiratory exchange ratio
1 Space Suit Engineer, Crew and Thermal Systems Division, 2101 NASA Pkwy/EC5, Houston, TX 77058. 2 EVA Discipline Scientist, Wyle Science, Technology and Engineering Group, 1290 Hercules, Houston, TX 77058 3 Research Engineer, Wyle Science, Technology and Engineering Group, 1290 Hercules, Houston, TX 77058 4 Biostatistician, Universities Space Research Association, 3600 Bay Area Blvd, Houston, TX 7705

International Conference on Environmental Systems
2
RR = respiratory rate
SCFM = standard cubic feet per minute
�̇�𝑔𝑎𝑠 = standard volumetric flow rate
I. Introduction
t is essential to provide adequate carbon dioxide (CO2) washout in a space suit to reduce the risks associated with
manned operations in space suits. CO2 toxicity symptoms can include reduced cognitive performance, dyspnea,
fatigue, dizziness, faintness, visual disturbances, and headache5. To maintain the health and safety of test subjects and
astronauts NASA imposes limits on inspired CO2 levels for space suits when they are used in space and for ground
testing.
Testing and/or analysis must be performed to verify that a space suit provides adequate CO2 washout. Previous
testing of developmental space suits1,2 has used an oronasal mask that funnels all exhaled and inhaled air from the
nose and mouth through a single opening, where samples are collected at the left and right sides (Figure 2, b). However,
there are several concerns with this approach. The oronasal mask cannot be used with a Valsalva device, which is
required for sub-ambient pressure testing with space suits. Additionally, the mask may alter the nominal air flow path
inside the helmet because the mask protrudes from the subject’s face. This could divert air to the sides of the test
subject’s face. The oronasal mask also has dead space volume at the front of the mask, which could alter the washout
characteristics of the helmet and appears to compress the respiratory waveform leading to elevated local minimums
and diminished peak values. To mitigate these concerns, a nasal cannula was investigated as a method for measuring
inspired CO2 based on the hypotheses that the low profile design will not interfere with the nominal helmet air flow
path, the placement directly in the nasal cavity will reduce any dead space effects, and the construction with
compressible material will make it compatible with a Valsalva device.
Specific objectives of this test were to: (1) compare data collected from the nasal cannula to data collected from
past oronasal mask evaluations; (2) determine if a particular breathing style (nose only vs. unrestricted) affects the
measurement characteristics of the nasal cannula; and (3) determine if the nasal cannula meets the needs of human
factors criteria, such as comfort and being able to use the Valsalva device.
II. Test Methodology
Eight test subjects were used in this study. The test subjects used a treadmill or an arm ergometer to achieve the
metabolic rates listed in Table 1. The flow rate was set at 2, 4, or 6 ACFM. Suit pressure was maintained at 4.3 psig
for all test points. Subjects were instructed to breathe either exclusively through their nose, or however they felt
comfortable (referred to as “Normal” in Table 1). Samples were collected over two minute intervals where possible.
In some cases, however, typically at lower suit flow rates, CO2 partial pressure safety limits were reached and the test
point was terminated early.
Table 1. Test matrix.
Flow Rate (ACFM)
Metabolic Rate
(BTU/hr) Breathing Technique 6 4 2
500 (Resting) Nose-Only x x
1000 Unrestriced (Mouth + Nose) x x x
Nose-Only x x x
2000 Unrestriced (Mouth + Nose) x x x
Nose-Only x x x
3000 Unrestriced (Mouth + Nose) x x
A. Quantitative Data
The metabolic rate was measured to ensure that each test subject experienced the same work rate and produced
equivalent CO2 at each test point. Metabolic rate was calculated based on CO2 measurements at the suit exhaust. The
supply air for the suit was maintained at a very low (<0.05%) CO2 concentration. Therefore, the only significant source
of CO2 inside the space suit was the subject. This method of metabolic rate measurement assumes that the suit
ventilation design ensures proper mixing of gas throughout the suit, and that gas sampled at the exhaust is
representative of gas in the overall suit. This method has been used in previous CO2 washout tests1, 2. In addition to
CO2 concentration at the outlet, the flow rate of breathing air was also measured and a constant respiratory exchange
I
International Conference on Environmental Systems
3
ratio (RER) of 0.85 was assumed. Equation 1 shows how metabolic rate was calculated, where q̇met is the metabolic
rate, V̇gas is the standard volumetric flow rate of gas, %CO2 is the percentage of CO2 as measured in the CO2 exhaust,
and RER is the respiratory exchange ratio. RER is the ratio between the amount of CO2 produced and oxygen
consumed, This RER value has been used in previous space suit CO2 washout tests1,2.
�̇�𝑚𝑒𝑡 = 4.8𝑘𝑐𝑎𝑙
𝑙𝑂2∗ �̇�𝑔𝑎𝑠 ∗
%𝐶𝑂2𝑜𝑢𝑡
𝑅𝐸𝑅 (1)
The metabolic rate data acquisition system consisted of a CO2 analyzer (AEI Technologies CD-3A CO2 sensor) at
the suit exhaust and a flow meter (Kurz 500-series) at the suit inlet. The Kurz flow meter output is flow rate in SCFM
based on a standard temperature of 25°C and a pressure of 14.7 psia. Small variations in suit pressure were not
recorded; the pressure was assumed to be constant at 4.3 psig.
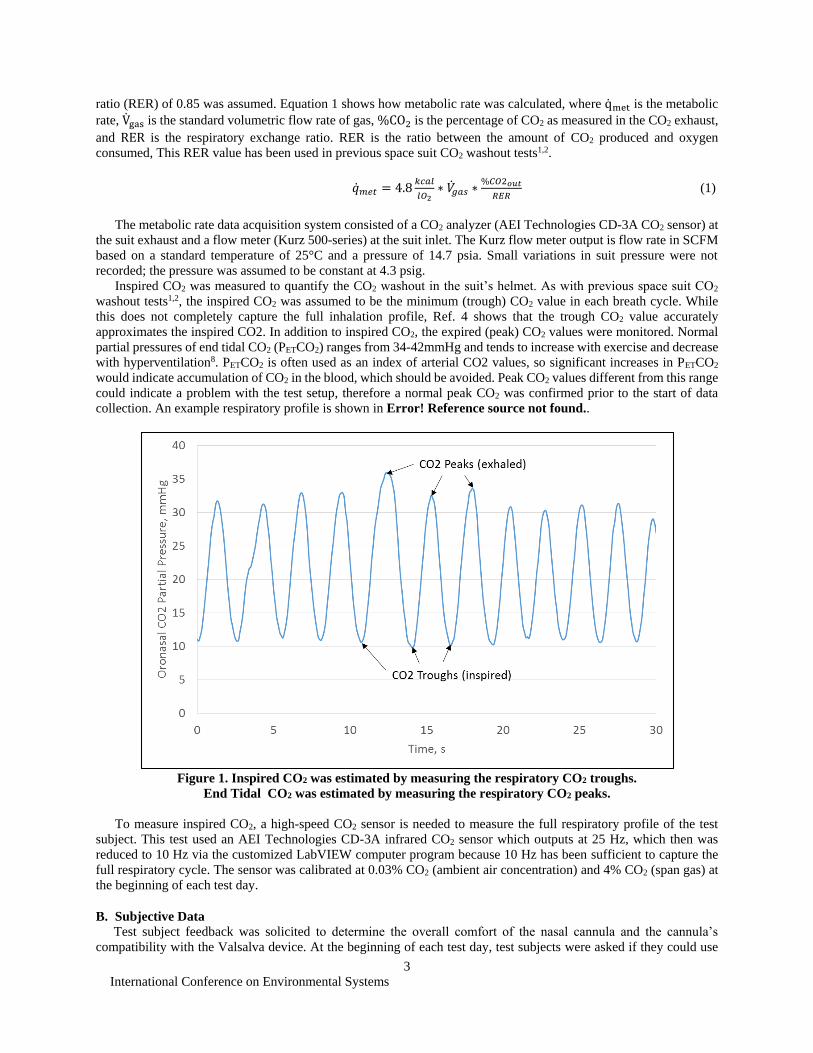
Inspired CO2 was measured to quantify the CO2 washout in the suit’s helmet. As with previous space suit CO2
washout tests1,2, the inspired CO2 was assumed to be the minimum (trough) CO2 value in each breath cycle. While
this does not completely capture the full inhalation profile, Ref. 4 shows that the trough CO2 value accurately
approximates the inspired CO2. In addition to inspired CO2, the expired (peak) CO2 values were monitored. Normal
partial pressures of end tidal CO2 (PETCO2) ranges from 34-42mmHg and tends to increase with exercise and decrease
with hyperventilation8. PETCO2 is often used as an index of arterial CO2 values, so significant increases in PETCO2
would indicate accumulation of CO2 in the blood, which should be avoided. Peak CO2 values different from this range
could indicate a problem with the test setup, therefore a normal peak CO2 was confirmed prior to the start of data
collection. An example respiratory profile is shown in Error! Reference source not found..
Figure 1. Inspired CO2 was estimated by measuring the respiratory CO2 troughs.
End Tidal CO2 was estimated by measuring the respiratory CO2 peaks.
To measure inspired CO2, a high-speed CO2 sensor is needed to measure the full respiratory profile of the test
subject. This test used an AEI Technologies CD-3A infrared CO2 sensor which outputs at 25 Hz, which then was
reduced to 10 Hz via the customized LabVIEW computer program because 10 Hz has been sufficient to capture the
full respiratory cycle. The sensor was calibrated at 0.03% CO2 (ambient air concentration) and 4% CO2 (span gas) at
the beginning of each test day.
B. Subjective Data
Test subject feedback was solicited to determine the overall comfort of the nasal cannula and the cannula’s
compatibility with the Valsalva device. At the beginning of each test day, test subjects were asked if they could use
International Conference on Environmental Systems
4
the Valsalva device to clear their ears when the nasal cannula was installed. A “yes” or “no” response was recorded,
along with any relevant comments. After each set of metabolic rate test points, test subjects were asked to rate the
comfort and security (ability to stay in place) of the nasal cannula. These questions and ratings are summarized in
Table 2.
Table 2. Test subject questions.
Question Rating
Able to Use Valsalva Device? Yes No
Comfort of Nasal Cannula? Unacceptable Acceptable but Needs Improvement Acceptable
Security of Nasal Cannula? Unacceptable Acceptable but Needs Improvement Acceptable
III. Test Hardware
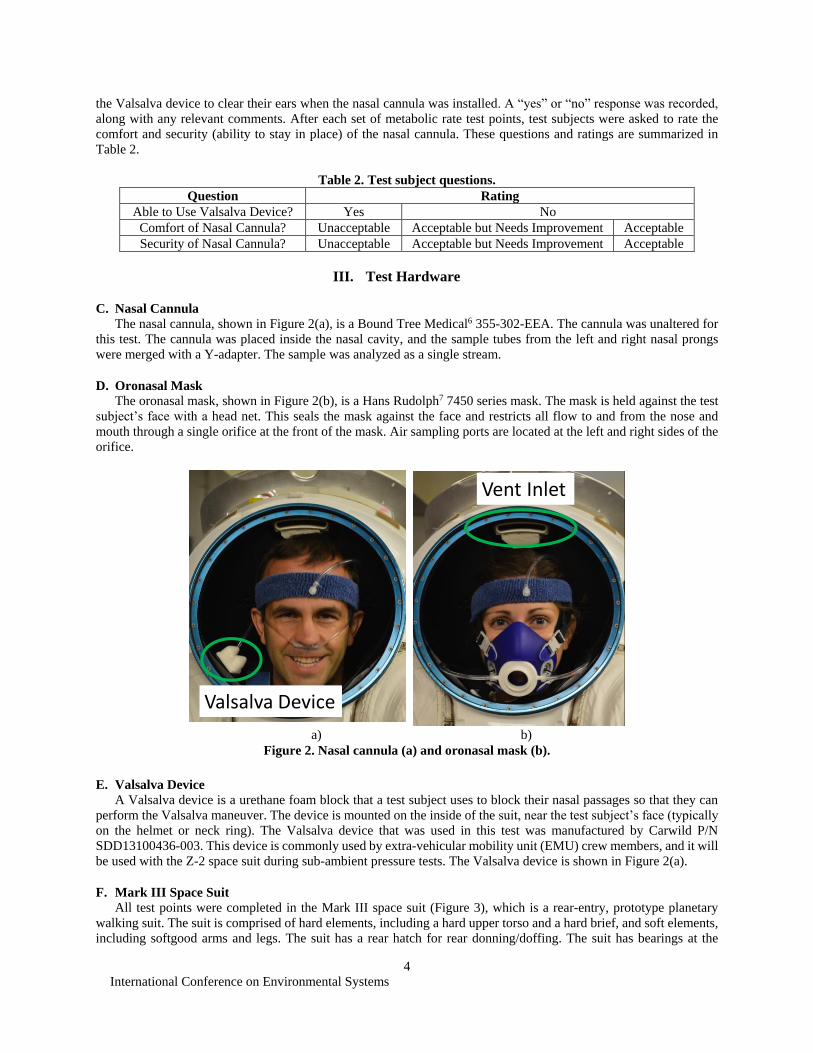
C. Nasal Cannula
The nasal cannula, shown in Figure 2(a), is a Bound Tree Medical6 355-302-EEA. The cannula was unaltered for
this test. The cannula was placed inside the nasal cavity, and the sample tubes from the left and right nasal prongs
were merged with a Y-adapter. The sample was analyzed as a single stream.
D. Oronasal Mask
The oronasal mask, shown in Figure 2(b), is a Hans Rudolph7 7450 series mask. The mask is held against the test
subject’s face with a head net. This seals the mask against the face and restricts all flow to and from the nose and
mouth through a single orifice at the front of the mask. Air sampling ports are located at the left and right sides of the
orifice.
E. Valsalva Device
A Valsalva device is a urethane foam block that a test subject uses to block their nasal passages so that they can
perform the Valsalva maneuver. The device is mounted on the inside of the suit, near the test subject’s face (typically
on the helmet or neck ring). The Valsalva device that was used in this test was manufactured by Carwild P/N
SDD13100436-003. This device is commonly used by extra-vehicular mobility unit (EMU) crew members, and it will
be used with the Z-2 space suit during sub-ambient pressure tests. The Valsalva device is shown in Figure 2(a).
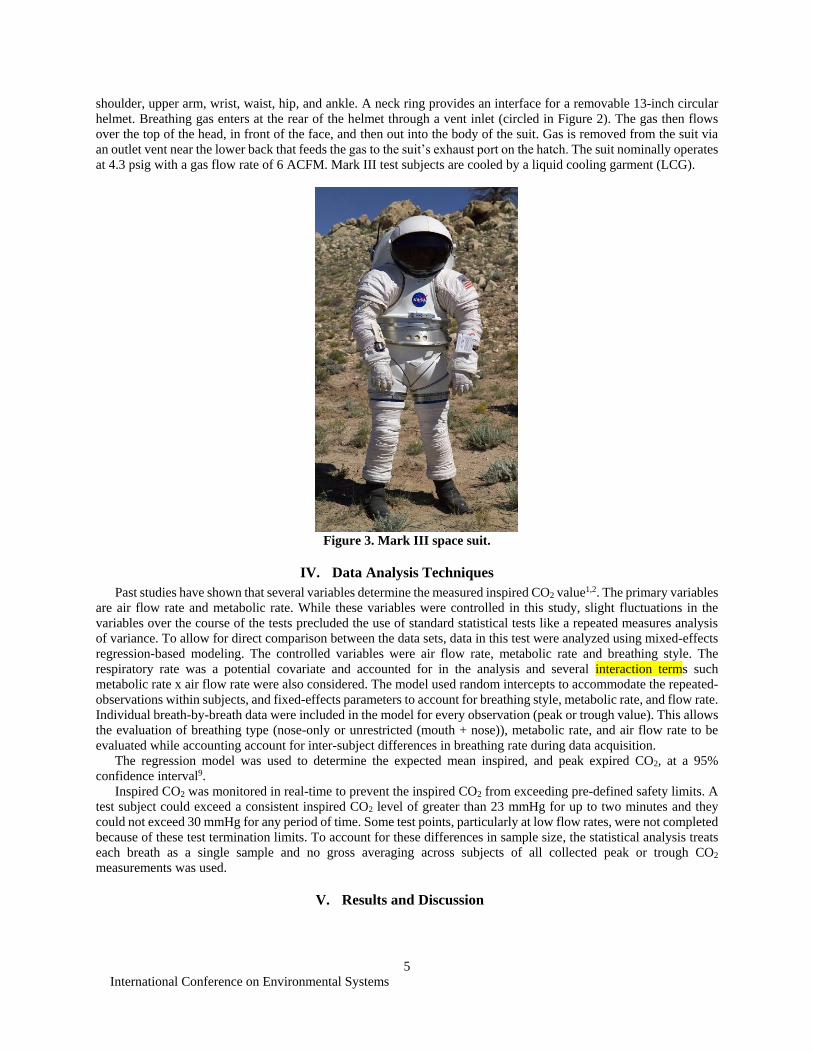
F. Mark III Space Suit
All test points were completed in the Mark III space suit (Figure 3), which is a rear-entry, prototype planetary
walking suit. The suit is comprised of hard elements, including a hard upper torso and a hard brief, and soft elements,
including softgood arms and legs. The suit has a rear hatch for rear donning/doffing. The suit has bearings at the
a) b)
Figure 2. Nasal cannula (a) and oronasal mask (b).
Valsalva Device
Vent Inlet
International Conference on Environmental Systems
5
shoulder, upper arm, wrist, waist, hip, and ankle. A neck ring provides an interface for a removable 13-inch circular
helmet. Breathing gas enters at the rear of the helmet through a vent inlet (circled in Figure 2). The gas then flows
over the top of the head, in front of the face, and then out into the body of the suit. Gas is removed from the suit via
an outlet vent near the lower back that feeds the gas to the suit’s exhaust port on the hatch. The suit nominally operates
at 4.3 psig with a gas flow rate of 6 ACFM. Mark III test subjects are cooled by a liquid cooling garment (LCG).
Figure 3. Mark III space suit.
IV. Data Analysis Techniques
Past studies have shown that several variables determine the measured inspired CO2 value1,2. The primary variables
are air flow rate and metabolic rate. While these variables were controlled in this study, slight fluctuations in the
variables over the course of the tests precluded the use of standard statistical tests like a repeated measures analysis
of variance. To allow for direct comparison between the data sets, data in this test were analyzed using mixed-effects
regression-based modeling. The controlled variables were air flow rate, metabolic rate and breathing style. The
respiratory rate was a potential covariate and accounted for in the analysis and several interaction terms such
metabolic rate x air flow rate were also considered. The model used random intercepts to accommodate the repeated-
observations within subjects, and fixed-effects parameters to account for breathing style, metabolic rate, and flow rate.
Individual breath-by-breath data were included in the model for every observation (peak or trough value). This allows
the evaluation of breathing type (nose-only or unrestricted (mouth + nose)), metabolic rate, and air flow rate to be
evaluated while accounting account for inter-subject differences in breathing rate during data acquisition.
The regression model was used to determine the expected mean inspired, and peak expired CO2, at a 95%
confidence interval9.
Inspired CO2 was monitored in real-time to prevent the inspired CO2 from exceeding pre-defined safety limits. A
test subject could exceed a consistent inspired CO2 level of greater than 23 mmHg for up to two minutes and they
could not exceed 30 mmHg for any period of time. Some test points, particularly at low flow rates, were not completed
because of these test termination limits. To account for these differences in sample size, the statistical analysis treats
each breath as a single sample and no gross averaging across subjects of all collected peak or trough CO2
measurements was used.
V. Results and Discussion

International Conference on Environmental Systems
6
G. Breathing Style Analysis
To determine the consistency of the CO2 measurements across test subjects, the 95% confidence intervals were
calculated for the modeled means of inspired and expired CO2 values. The confidence intervals for unrestricted
breathing and nose-only breathing are shown in Table 3. The intervals were relatively constant across all flow rates
and metabolic rates, so only a single value is provided for each breathing style. Data shows that nose-only breathing
provides lower breath-to-breath variability than normal breathing for both the inspired CO2 and expired CO2.
Table 3. 95% confidence intervals for different breathing styles with nasal cannula.
Inspired CO2
Unrestricted 2.7 mmHg
Nose-Only 1.0 mmHg
Expired CO2
Unrestricted 7.7 mmHg
Nose-Only 5.2 mmHg
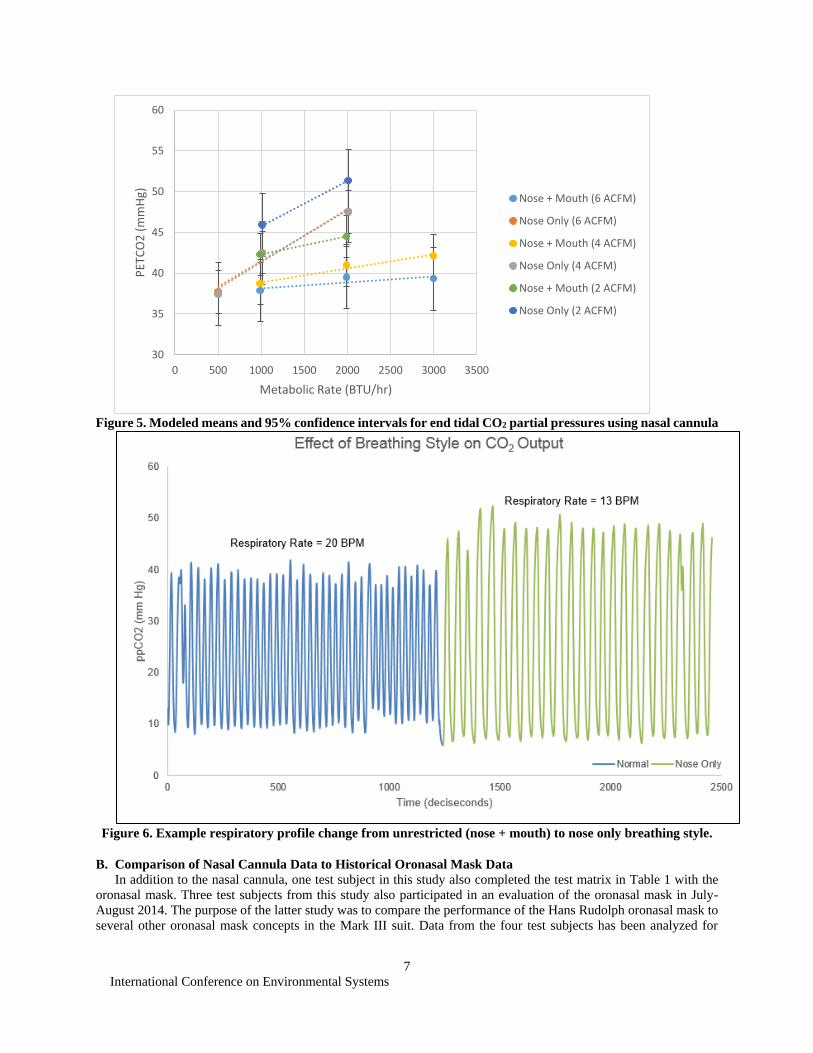
In addition to smaller confidence intervals for nose-only breathing, this breathing style also resulted in lower
troughs and higher peaks for all flow rates and metabolic rates. This is shown in Figure 4 and Figure 5. The troughs
could be lower because nose-only breathing directs the exhaled CO2 down the helmet, whereas unrestriced breathing
generally directs expired breath towards the front of the helmet. The troughs could also be lower because when test
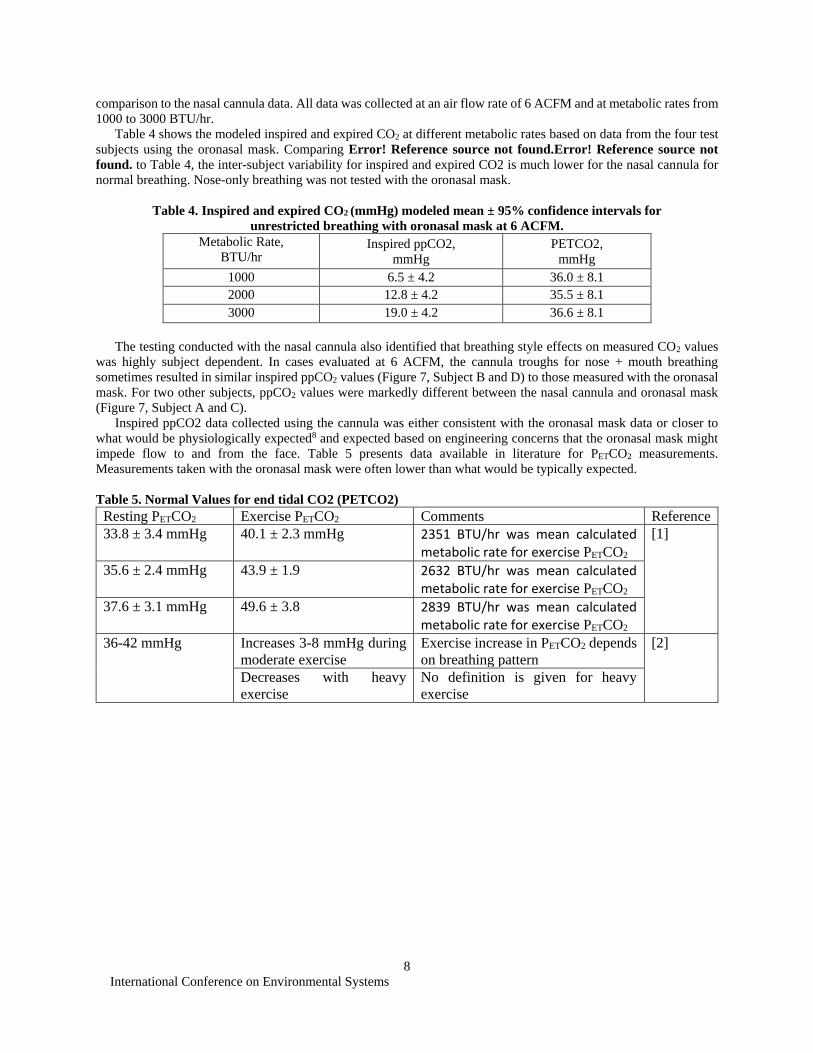
subjects switched to nose-only breathing, their respiratory rates (RR) noticeably decreased. Figure 6 shows a
respiratory trace taken from a single subject as an example of these RR changes. Because metabolic rate did not change
during the breathing style transition, it can be assumed that the subjects decreased their RR because they increased
their tidal volume: the test subjects took longer, deeper breaths when they breathed only through their nose. After
switching to nose-only breathing, the RR decreases, inspired CO2 decreases, and expired CO2 increases. An increase
in tidal volume would lead towards more productive gas exchange by decreasing the impact of dead space ventilation
and delivering gas deeper into the lungs where they are most perfused. This leads to higher expired CO2 values. Also,
by having longer expired breaths and more time between breaths, it would allow the expired CO2 to be more effectively
washed away from the oronasal area. This leads to lower CO2 troughs.
When all of these factors are considered, nose-only breathing provides more consistent CO2 washout data, but it
may not necessarily be representative of how a test subject would breathe in the suit, especially at high metabolic
rates.
Figure 4. Modeled means and 95% confidence intervals for trough CO2 partial pressures using nasal cannula
0
5
10
15
20
25
0 500 1000 1500 2000 2500 3000 3500
Insp
ried
pp
CO
2 (
mm
Hg)
Metabolic Rate (BTU/hr)
Nose + Mouth (6 ACFM)
Nose Only (6 ACFM)
Nose + Mouth (4 ACFM)
Nose Only (4 ACFM)
Nose + Mouth (2 ACFM)
Nose Only (2 ACFM)
International Conference on Environmental Systems
7
Figure 5. Modeled means and 95% confidence intervals for end tidal CO2 partial pressures using nasal cannula
Figure 6. Example respiratory profile change from unrestricted (nose + mouth) to nose only breathing style.
B. Comparison of Nasal Cannula Data to Historical Oronasal Mask Data
In addition to the nasal cannula, one test subject in this study also completed the test matrix in Table 1 with the
oronasal mask. Three test subjects from this study also participated in an evaluation of the oronasal mask in July-
August 2014. The purpose of the latter study was to compare the performance of the Hans Rudolph oronasal mask to
several other oronasal mask concepts in the Mark III suit. Data from the four test subjects has been analyzed for
30
35
40
45
50
55
60
0 500 1000 1500 2000 2500 3000 3500
PET
CO
2 (
mm
Hg)
Metabolic Rate (BTU/hr)
Nose + Mouth (6 ACFM)
Nose Only (6 ACFM)
Nose + Mouth (4 ACFM)
Nose Only (4 ACFM)
Nose + Mouth (2 ACFM)
Nose Only (2 ACFM)
International Conference on Environmental Systems
8
comparison to the nasal cannula data. All data was collected at an air flow rate of 6 ACFM and at metabolic rates from
1000 to 3000 BTU/hr.
Table 4 shows the modeled inspired and expired CO2 at different metabolic rates based on data from the four test
subjects using the oronasal mask. Comparing Error! Reference source not found.Error! Reference source not
found. to Table 4, the inter-subject variability for inspired and expired CO2 is much lower for the nasal cannula for
normal breathing. Nose-only breathing was not tested with the oronasal mask.
Table 4. Inspired and expired CO2 (mmHg) modeled mean ± 95% confidence intervals for
unrestricted breathing with oronasal mask at 6 ACFM.
Metabolic Rate,
BTU/hr Inspired ppCO2,
mmHg
PETCO2,
mmHg
1000 6.5 ± 4.2 36.0 ± 8.1
2000 12.8 ± 4.2 35.5 ± 8.1
3000 19.0 ± 4.2 36.6 ± 8.1
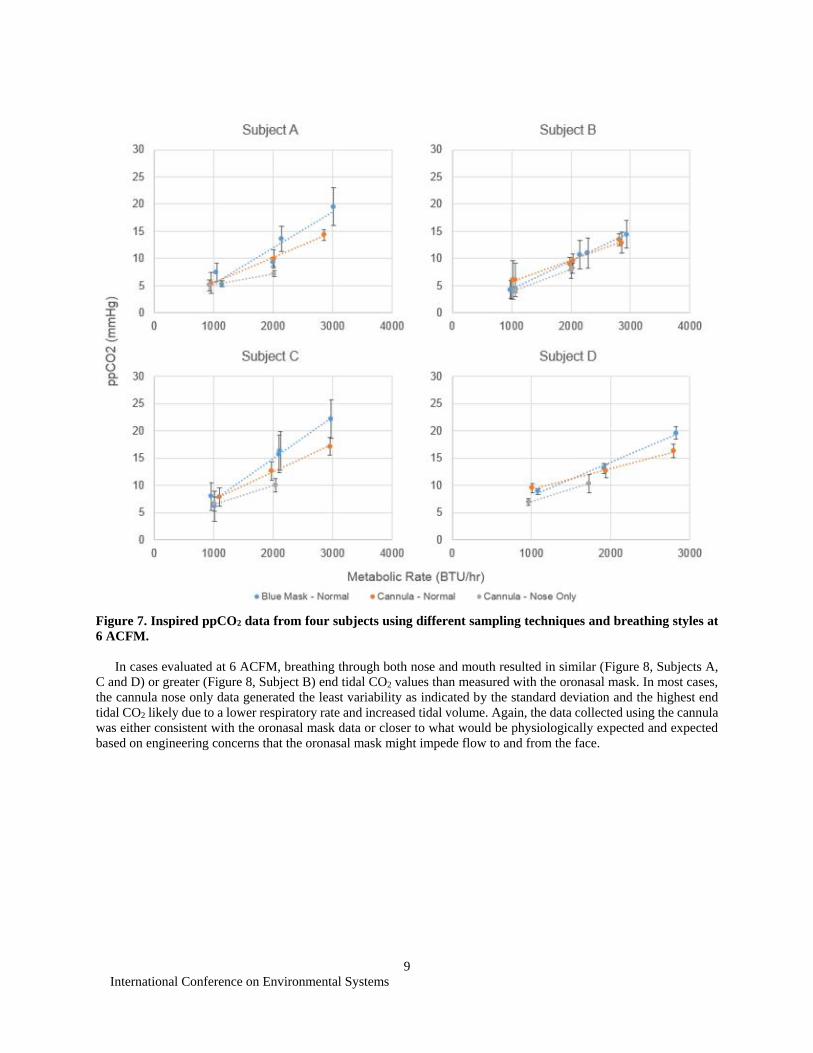
The testing conducted with the nasal cannula also identified that breathing style effects on measured CO2 values
was highly subject dependent. In cases evaluated at 6 ACFM, the cannula troughs for nose + mouth breathing
sometimes resulted in similar inspired ppCO2 values (Figure 7, Subject B and D) to those measured with the oronasal
mask. For two other subjects, ppCO2 values were markedly different between the nasal cannula and oronasal mask
(Figure 7, Subject A and C).
Inspired ppCO2 data collected using the cannula was either consistent with the oronasal mask data or closer to
what would be physiologically expected8 and expected based on engineering concerns that the oronasal mask might
impede flow to and from the face. Table 5 presents data available in literature for PETCO2 measurements.
Measurements taken with the oronasal mask were often lower than what would be typically expected.
Table 5. Normal Values for end tidal CO2 (PETCO2)
Resting PETCO2 Exercise PETCO2 Comments Reference
33.8 ± 3.4 mmHg 40.1 ± 2.3 mmHg 2351 BTU/hr was mean calculated metabolic rate for exercise PETCO2
[1]
35.6 ± 2.4 mmHg 43.9 ± 1.9 2632 BTU/hr was mean calculated metabolic rate for exercise PETCO2
37.6 ± 3.1 mmHg 49.6 ± 3.8 2839 BTU/hr was mean calculated metabolic rate for exercise PETCO2
36-42 mmHg Increases 3-8 mmHg during
moderate exercise
Exercise increase in PETCO2 depends
on breathing pattern
[2]
Decreases with heavy
exercise
No definition is given for heavy
exercise
International Conference on Environmental Systems
9
Figure 7. Inspired ppCO2 data from four subjects using different sampling techniques and breathing styles at
6 ACFM.
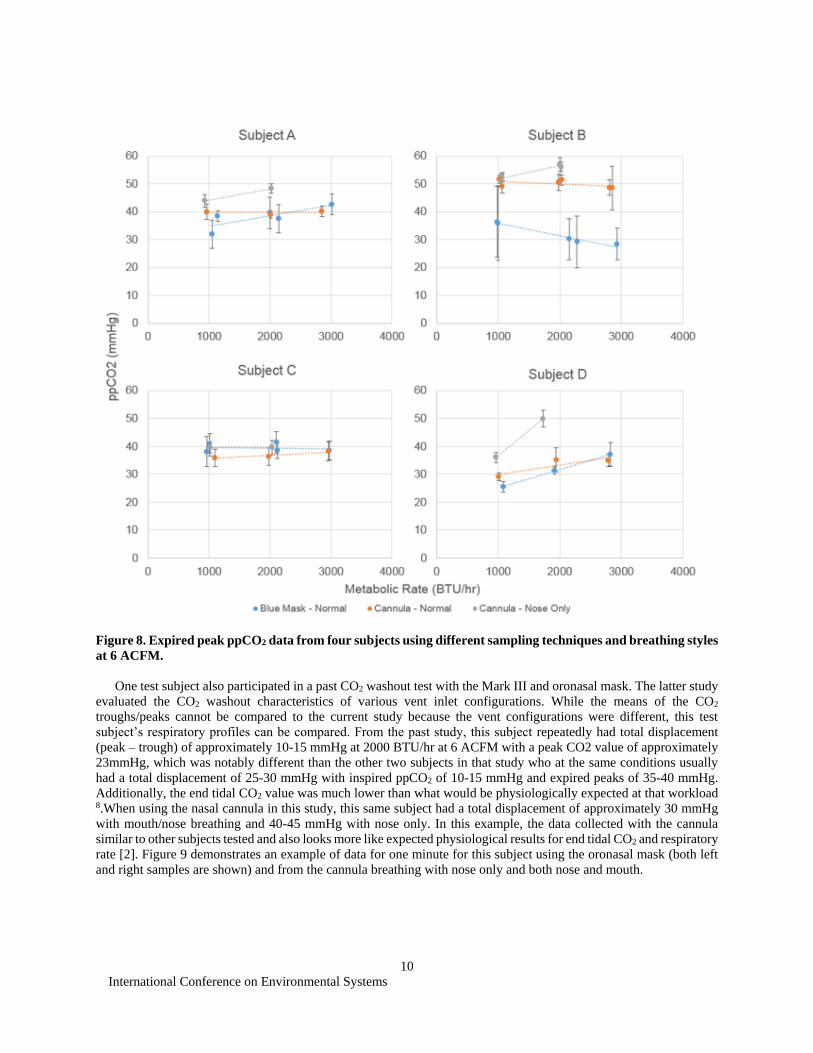
In cases evaluated at 6 ACFM, breathing through both nose and mouth resulted in similar (Figure 8, Subjects A,
C and D) or greater (Figure 8, Subject B) end tidal CO2 values than measured with the oronasal mask. In most cases,
the cannula nose only data generated the least variability as indicated by the standard deviation and the highest end
tidal CO2 likely due to a lower respiratory rate and increased tidal volume. Again, the data collected using the cannula
was either consistent with the oronasal mask data or closer to what would be physiologically expected and expected
based on engineering concerns that the oronasal mask might impede flow to and from the face.
International Conference on Environmental Systems
10
Figure 8. Expired peak ppCO2 data from four subjects using different sampling techniques and breathing styles
at 6 ACFM.
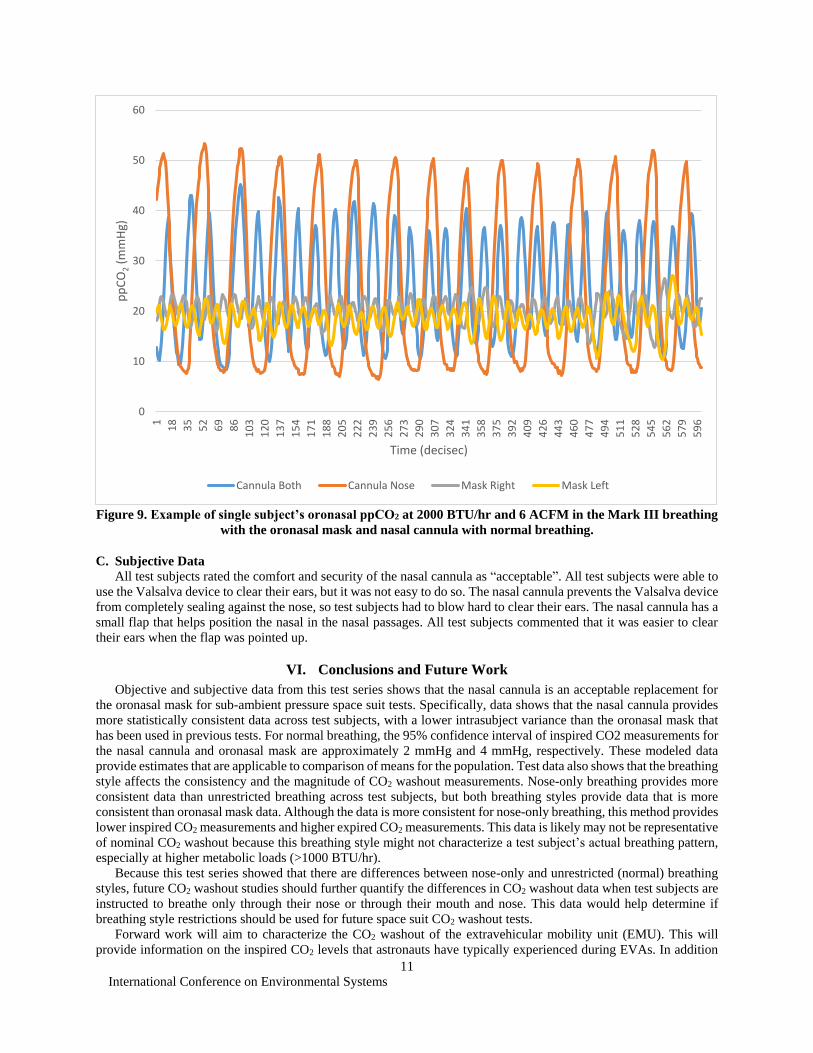
One test subject also participated in a past CO2 washout test with the Mark III and oronasal mask. The latter study
evaluated the CO2 washout characteristics of various vent inlet configurations. While the means of the CO2
troughs/peaks cannot be compared to the current study because the vent configurations were different, this test
subject’s respiratory profiles can be compared. From the past study, this subject repeatedly had total displacement
(peak – trough) of approximately 10-15 mmHg at 2000 BTU/hr at 6 ACFM with a peak CO2 value of approximately
23mmHg, which was notably different than the other two subjects in that study who at the same conditions usually
had a total displacement of 25-30 mmHg with inspired ppCO2 of 10-15 mmHg and expired peaks of 35-40 mmHg.
Additionally, the end tidal CO2 value was much lower than what would be physiologically expected at that workload 8.When using the nasal cannula in this study, this same subject had a total displacement of approximately 30 mmHg
with mouth/nose breathing and 40-45 mmHg with nose only. In this example, the data collected with the cannula
similar to other subjects tested and also looks more like expected physiological results for end tidal CO2 and respiratory
rate [2]. Figure 9 demonstrates an example of data for one minute for this subject using the oronasal mask (both left
and right samples are shown) and from the cannula breathing with nose only and both nose and mouth.
International Conference on Environmental Systems
11
Figure 9. Example of single subject’s oronasal ppCO2 at 2000 BTU/hr and 6 ACFM in the Mark III breathing
with the oronasal mask and nasal cannula with normal breathing.
C. Subjective Data
All test subjects rated the comfort and security of the nasal cannula as “acceptable”. All test subjects were able to
use the Valsalva device to clear their ears, but it was not easy to do so. The nasal cannula prevents the Valsalva device
from completely sealing against the nose, so test subjects had to blow hard to clear their ears. The nasal cannula has a
small flap that helps position the nasal in the nasal passages. All test subjects commented that it was easier to clear
their ears when the flap was pointed up.
VI. Conclusions and Future Work
Objective and subjective data from this test series shows that the nasal cannula is an acceptable replacement for
the oronasal mask for sub-ambient pressure space suit tests. Specifically, data shows that the nasal cannula provides
more statistically consistent data across test subjects, with a lower intrasubject variance than the oronasal mask that
has been used in previous tests. For normal breathing, the 95% confidence interval of inspired CO2 measurements for
the nasal cannula and oronasal mask are approximately 2 mmHg and 4 mmHg, respectively. These modeled data
provide estimates that are applicable to comparison of means for the population. Test data also shows that the breathing
style affects the consistency and the magnitude of CO2 washout measurements. Nose-only breathing provides more
consistent data than unrestricted breathing across test subjects, but both breathing styles provide data that is more
consistent than oronasal mask data. Although the data is more consistent for nose-only breathing, this method provides
lower inspired CO2 measurements and higher expired CO2 measurements. This data is likely may not be representative
of nominal CO2 washout because this breathing style might not characterize a test subject’s actual breathing pattern,
especially at higher metabolic loads (>1000 BTU/hr).
Because this test series showed that there are differences between nose-only and unrestricted (normal) breathing
styles, future CO2 washout studies should further quantify the differences in CO2 washout data when test subjects are
instructed to breathe only through their nose or through their mouth and nose. This data would help determine if
breathing style restrictions should be used for future space suit CO2 washout tests.
Forward work will aim to characterize the CO2 washout of the extravehicular mobility unit (EMU). This will
provide information on the inspired CO2 levels that astronauts have typically experienced during EVAs. In addition
0
10
20
30
40
50
60
1
18
35
52
69
86
10
3
12
0
13
7
15
4
17
1
18
8
20
5
22
2
23
9
25
6
27
3
29
0
30
7
32
4
34
1
35
8
37
5
39
2
40
9
42
6
44
3
46
0
47
7
49
4
51
1
52
8
54
5
56
2
57
9
59
6
pp
CO
2(m
mH
g)
Time (decisec)
Cannula Both Cannula Nose Mask Right Mask Left

International Conference on Environmental Systems
12
to knowing what astronauts have experienced during EVAs, it is also important to determine the functional
consequences of CO2 exposure during EVA. Severe CO2 symptoms resulting from high partial pressures during acute
exposures should clearly be avoided, but cognitive symptoms and performance decline can also be experienced with
exposure to slightly elevated CO2 4-5, 8,10. None of these exposures mirrors the actual CO2 exposure during EVA, and
it remains unknown what impact elevated CO2 has on nominal EVA performance. This forward work will help develop
CO2 washout requirements for future space suits.
References 1Korona, A, Norcross, J., Conger, B., Navarro, M., “Carbon Dioxide Washout Testing Using Various Inlet Vent Configurations
in the Mark-III Space Suit,” 44th Conference on Environmental Systems, AIAA Paper Number 2014-ICES-55, 2014. 2Mitchell, K. and Norcross, J., “CO2 Washout Testing of the REI and EM-ACES Space Suits,” 42nd International Conference
on Environmental Systems, AIAA Paper Number 2012-3549, 2012. 3Weir, J.D.V., “New methods for calculating metabolic rate with special reference to protein metabolism,” The Journal of
Physiology, Vol 109, 1948, pp. 1-9. 4Michel, E. L., Sharma, H. S., Heyer, R. E., “Carbon Dioxide Build-Up Characteristics in Spacesuits,” Aerospace Medicine,
40(8), 1969, pp. 827-829. 5Law, J., Watkins, S., and Alexander, D., “In-flight carbon dioxide exposures and related symptoms: association, susceptibility,
and operational implications,” NASA/TP-2010-216126, 2010. 6Bound Tree Medical, LLC, 5000 Tuttle Crossing Blvd., Dublin, Ohio 43016. 7Hans Rudolph, Inc., 8325 Cole Parkway, Shawnee, Kansas 66227. 8Bussotti, M., et al., “End-tidal pressure of CO2 and exercise performance in healthy subjects,” European Journal of Applied
Physiology, 2008. 103(6): p. 727-32. 9Zar, J.H. Biostatistical Analysis. Prentice Hall International, New Jersey. 1984, pp 43–45. 10Satish, U., et al., “Is CO2 an Indoor Pollutant? Direct Effects of Low-to-Moderate CO2 Concentrations on Human Decision-
Making Performance,” Environmental Health Perspectives, Vol. 120, No. 12, 2012.