Characterization of Bacteria by Particle Beam Mass ...aem.asm.org/content/49/6/1366.full.pdf ·...
8
APPLIED AND ENVIRONMENTAL MICROBIOLOGY, June 1985, p. 1366-1373 Vol. 49, No. 6 0099-2240/85/061366-08$02.00/0 Copyright ©) 1985, American Society for Microbiology Characterization of Bacteria by Particle Beam Mass Spectrometry MAHADEVA P. SINHA,1'* ROBERT M. PLATZ,2t SHELDON K. FRIEDLANDER,2 AND VINCENT L. VILKER2 Jet Propulsion Laboratory, California Institute of Technology, Pasadena, California 91009,1 and Department of Chemical Engineering, University of California, Los Angeles, Los Angeles, California 900242 Received 30 July 1984/Accepted 15 October 1984 A technique is described for detecting and characterizing bacteria on a single-particle basis by mass spectrometry. The method involves generation of a particle beam of single whole cells which are rapidly volatilized and ionized in vacuum in the ion source of a quadrupole mass spectrometer. The particle beam can be generated, with minimal sample handling, from a naturally occurring aerosol or from a solution of bacteria that can be dispersed as an aerosol. The mass spectrum is generated by successively measuring the average intensities of different mass peaks. The average intensity is obtained by measuring the ion intensity distribution at the particular mass (mle) for ion pulses from more than 1,000 bacteria particles. Bacillus cereus, Bacillus subtilis, and Pseudomonas putida samples were analyzed to test the capability of the instrument for differentiating among species of bacteria. Significant ion-intensity information was produced over the mle range of 50 to 300, an improvement over previous pyrolysis-mass spectrometry results. The complex mass spectra contained a few unique peaks which could be used for the differentiation of the bacteria. A statistical analysis of the variations in peak intensities among the three bacteria provided a quantitative measure of the reproducibility of the instrument and its ability to differentiate among bacteria. The technique could lead to a new rapid method for the analysis of microorganisms and could be used for the detection of airborne pathogens on a continuous, real-time basis. This application of particle beam mass spectrometry to characterization of bacteria is an extension of a technique we are developing for real-time analysis of the composition of aerosol particles (9, 19). The method has been used successfully for the analysis of micrometer-sized particles made up of inorganic salts or small organic molecules including amino acids (19). The earliest studies for identification of bacteria by mass spectrometry involved separate steps of pyrolysis of bulk quantities (milligram) of bacterial samples, collection or separation of the volatile pyrolysis products, followed by their introduction into a mass spectrometer (MS) (17, 18). Mass fragments were recorded for nearly all integer masses between 14 and 140 atomic mass units (amu). The complex mass spectra permitted determination of up to 100 compo- nents but did not give structural information useful for bacterial differentiation. A more recent design of a pyrolysis MS for characteriza- tion of complex biological material is that of Meuzelaar and co-workers (14, 16, 21). In this instrument, bulk samples of material (>10 Kg) are pyrolyzed in a glass reaction tube by the technique of Curie-point pyrolysis. The volatilized prod- ucts leak through an orifice into the MS where low-voltage electron-impact ionization and mass analysis are performed. The mass spectrum obtained with this instrument is limited to the mle range of 30 to 140. The instrument has been demonstrated to successfully differentiate among several distantly related bacteria based on the relative intensities of various masses (14). It has also been used to study the effects of growth media on the composition of the cell wall of Bacillus subtilis (2). Wieten et al. (21) incorporated multi- variant factor analysis into the comparison of the spectra from this instrument. This permitted differentiation among a * Corresponding author. t Present address: Stanford Research Institute, Menlo Park, CA 94025. variety of closely related species from the genus Mycobac- terium. In our system, the sample is introduced to the site of volatilization (pyrolysis) and ionization as a beam of parti- cles consisting mostly of single bacteria. The rapid volatili- zation of the particles by a heated rhenium filament and the proximity of the ionizing electrons extend the range of the mass spectrum above mle 140. These larger fragments contain important structural information that greatly en- hances the capability for particle differentiation. The particle beam can be generated, with minimal sample handling, from a naturally occurring aerosol or from a solution containing a nonvolatile solute that can be dispersed as an aerosol. This provides a method for volatilization and ionization of single bacteria on a continuous real-time basis, leading to a more characteristic mass spectra for microor- ganism differentiation. When applied to aerosol sampling, the technique would be directly useful for detecting airborne pathogens such as those associated with transmission of disease in hospitals (3), cotton mills (4), mushroom harvest- ing (15), wastewater treatment (5, 6, 12, 13), and Legion- naires Disease (10). MATERIALS AND METHODS Bacteria and media. B. suibtilis 168 and Bacillus cereus 203A, obtained from the University of California at Los Angeles Biology Department, and Pseudomonas putida ATCC 29607 were grown in nonspecific cell-culture media containing 10 g of Bacto-Tryptone and 1 g of yeast extract (Difco Laboratories, Detroit, Mich.), 4 g of glucose (J. T. Baker Chemical Co., Phillipsburg, N.J.) and 8 g of sodium chloride per liter. The medium pH was initially adjusted to 7.8. The Bacilllus samples were grown for 48 h at 34°C; the culture was then placed in a 70°C water bath for 30 min to complete sporulation. P. putida was grown at room temper- ature for 40 h. The bacteria were washed three times with distilled water and refrigerated in a distilled water suspen- sion. Immediately before use, water was replaced by ethanol 1366 on July 16, 2018 by guest http://aem.asm.org/ Downloaded from
Transcript of Characterization of Bacteria by Particle Beam Mass ...aem.asm.org/content/49/6/1366.full.pdf ·...

APPLIED AND ENVIRONMENTAL MICROBIOLOGY, June 1985, p. 1366-1373 Vol. 49, No. 60099-2240/85/061366-08$02.00/0Copyright ©) 1985, American Society for Microbiology
Characterization of Bacteria by Particle Beam Mass SpectrometryMAHADEVA P. SINHA,1'* ROBERT M. PLATZ,2t SHELDON K. FRIEDLANDER,2 AND VINCENT L. VILKER2
Jet Propulsion Laboratory, California Institute of Technology, Pasadena, California 91009,1 and Department of ChemicalEngineering, University of California, Los Angeles, Los Angeles, California 900242
Received 30 July 1984/Accepted 15 October 1984
A technique is described for detecting and characterizing bacteria on a single-particle basis by massspectrometry. The method involves generation of a particle beam of single whole cells which are rapidlyvolatilized and ionized in vacuum in the ion source of a quadrupole mass spectrometer. The particle beam canbe generated, with minimal sample handling, from a naturally occurring aerosol or from a solution of bacteriathat can be dispersed as an aerosol. The mass spectrum is generated by successively measuring the averageintensities of different mass peaks. The average intensity is obtained by measuring the ion intensity distributionat the particular mass (mle) for ion pulses from more than 1,000 bacteria particles. Bacillus cereus, Bacillussubtilis, and Pseudomonas putida samples were analyzed to test the capability of the instrument fordifferentiating among species of bacteria. Significant ion-intensity information was produced over the mle rangeof 50 to 300, an improvement over previous pyrolysis-mass spectrometry results. The complex mass spectracontained a few unique peaks which could be used for the differentiation of the bacteria. A statistical analysisof the variations in peak intensities among the three bacteria provided a quantitative measure of thereproducibility of the instrument and its ability to differentiate among bacteria. The technique could lead to anew rapid method for the analysis of microorganisms and could be used for the detection of airborne pathogenson a continuous, real-time basis.
This application of particle beam mass spectrometry tocharacterization of bacteria is an extension of a techniquewe are developing for real-time analysis of the compositionof aerosol particles (9, 19). The method has been usedsuccessfully for the analysis of micrometer-sized particlesmade up of inorganic salts or small organic moleculesincluding amino acids (19).The earliest studies for identification of bacteria by mass
spectrometry involved separate steps of pyrolysis of bulkquantities (milligram) of bacterial samples, collection orseparation of the volatile pyrolysis products, followed bytheir introduction into a mass spectrometer (MS) (17, 18).Mass fragments were recorded for nearly all integer massesbetween 14 and 140 atomic mass units (amu). The complexmass spectra permitted determination of up to 100 compo-nents but did not give structural information useful forbacterial differentiation.A more recent design of a pyrolysis MS for characteriza-
tion of complex biological material is that of Meuzelaar andco-workers (14, 16, 21). In this instrument, bulk samples ofmaterial (>10 Kg) are pyrolyzed in a glass reaction tube bythe technique of Curie-point pyrolysis. The volatilized prod-ucts leak through an orifice into the MS where low-voltageelectron-impact ionization and mass analysis are performed.The mass spectrum obtained with this instrument is limitedto the mle range of 30 to 140. The instrument has beendemonstrated to successfully differentiate among severaldistantly related bacteria based on the relative intensities ofvarious masses (14). It has also been used to study theeffects of growth media on the composition of the cell wall ofBacillus subtilis (2). Wieten et al. (21) incorporated multi-variant factor analysis into the comparison of the spectrafrom this instrument. This permitted differentiation among a
* Corresponding author.t Present address: Stanford Research Institute, Menlo Park, CA
94025.
variety of closely related species from the genus Mycobac-terium.
In our system, the sample is introduced to the site ofvolatilization (pyrolysis) and ionization as a beam of parti-cles consisting mostly of single bacteria. The rapid volatili-zation of the particles by a heated rhenium filament and theproximity of the ionizing electrons extend the range of themass spectrum above mle 140. These larger fragmentscontain important structural information that greatly en-hances the capability for particle differentiation.The particle beam can be generated, with minimal sample
handling, from a naturally occurring aerosol or from asolution containing a nonvolatile solute that can be dispersedas an aerosol. This provides a method for volatilization andionization of single bacteria on a continuous real-time basis,leading to a more characteristic mass spectra for microor-ganism differentiation. When applied to aerosol sampling,the technique would be directly useful for detecting airbornepathogens such as those associated with transmission ofdisease in hospitals (3), cotton mills (4), mushroom harvest-ing (15), wastewater treatment (5, 6, 12, 13), and Legion-naires Disease (10).
MATERIALS AND METHODS
Bacteria and media. B. suibtilis 168 and Bacillus cereus203A, obtained from the University of California at LosAngeles Biology Department, and Pseudomonas putidaATCC 29607 were grown in nonspecific cell-culture mediacontaining 10 g of Bacto-Tryptone and 1 g of yeast extract(Difco Laboratories, Detroit, Mich.), 4 g of glucose (J. T.Baker Chemical Co., Phillipsburg, N.J.) and 8 g of sodiumchloride per liter. The medium pH was initially adjusted to7.8. The Bacilllus samples were grown for 48 h at 34°C; theculture was then placed in a 70°C water bath for 30 min tocomplete sporulation. P. putida was grown at room temper-ature for 40 h. The bacteria were washed three times withdistilled water and refrigerated in a distilled water suspen-sion. Immediately before use, water was replaced by ethanol
1366
on July 16, 2018 by guesthttp://aem
.asm.org/
Dow
nloaded from

CHARACTERIZATION OF BACTERIA BY MASS SPECTROMETRY
U He-NeLASER
IONIZER
FIG. 1. Schematic diagram of particle beam MS apparatus.
as the suspending liquid to improve the performance of theparticle beam generator. This was done by washing thebacteria in a series of ethanol-water solutions of successivelyincreasing ethanol concentration. Aggregates of cells formedduring the washing and centrifugation steps were removedby filtration through a 20-p.m-mesh screen. The turbidity ofthe final suspensions in 100% ethanol indicated approxi-mately 109 bacteria per ml'
Particle beam generation. The generation of the bacteriaparticle beam involved the sequence of operations shown inthe upper part of Fig. 1. A similar experimental setup forgenerating nonbiological particle beams has been previouslyreported (9, 19). The first step was aerosolization of thebacteria from the ethanol suspensions with a micronebulizer(model 9993; Bird Space Technology) with a nitrogen gasflow of 20 liters min-'. The static charge on the aerosoldroplets was neutralized by passing them through an 85Krcharge neutralizer (model 3470; TSI Inc., St. Paul, Minn.).The solvent was evaporated by passing the aerosol throughthe annular region of a diffusion drier. This drier was acylindrical tube, 0.75 m in length, containing silica gel held inan outer coaxial shell by a fine mesh screen. The driedaerosol was introduced to a sampling chamber from which asmall portion was drawn off through a sampling probe forintroduction to the particle beam tube; another portion wasdrawn off for measurement of particle concentration with anoptical particle counter (model 208; Climet Instrument Co.,Redland, Calif.). The remaining aerosol from the samplechamber was filtered and exhausted. The particle concentra-tion in the sample chamber was maintained in the range of 75to 100 particles per ml by regulation of the N2 dilution-gasflow to the nebulizer.The particle beam was formed by passing the aerosol
through a capillary nozzle and two skimmers into the vac-uum chamber. The aerosol traveled down the beam tube
(350 by 10.7 mm, inner diameter) and the gas expandedthrough the capillary nozzle (5 by 0.1 mm) into the firstvacuum region. As the gas expanded through the capillary,most of it was pumped off upstream of the skimmers whilethe particles, having much higher inertia, tended to continuein a focused beam through the two skimmer apertures. Inour earlier work with nonbiological particles (9), we foundthat the efficiency of particle transmission through the cap-illary nozzle-skimmer system depends upon nozzle-skimmerseparation distance, as well as particle size (0.22 to 4.28 ,um)and density. Based in part on these results, this apparatusfor use with bacteria particles was designed with the firstskimmer (0.350-mm aperture) positioned 3 mm below thecapillary and the second skimmer (0.500-mm aperture) posi-tioned 12.5 mm below the first. The particle beam crosssection at the filament position was determined to be 2.0 to2.5 mm for potassium biphthalate beams of controlled par-ticle size (1 to 4 ,um). Alignment of the beam tube compo-nents with the volatilization filament target was accom-plished with an He-Ne laser beam. Mechanical vacuumpumps were used to reduce the pressure to about 10' torrand 10-2 torr (13 and 1.3 Pa) in the beam exhaust chambersand the region between the two skimmers, respectively. Inthe MS chamber after the second skimmer, an oil diffusionpump was used to maintain a vacuum of approximately 106torr. Liquid nitrogen-cooled traps were installed on allpumps to reduce contamination of the system by the pumpoil.MS. Bacteria particles from the beam generator were
volatilized to molecular fragments upon impact on the V-shaped rhenium filament located between the two grids ofthe ion source of the quadrupole MS (model 100C; UtheTechnology, Inc.). The filament cross section perpendicularto the particle beam measured 1 by 7 mm. The neutralfragments were ionized by electron bombardment in situ.
VOL. 49, 1985 1367
on July 16, 2018 by guesthttp://aem
.asm.org/
Dow
nloaded from
APPL. ENVIRON. MICROBIOL.
MASSSPECTROMETER
*
Mass Spectrometer 1 |1 10Asec\output trace100 - 300,us
Amplifier trace 100/.secComparator trace
Onset of pulse integration
Shaped pulse trace
5/,s
Particle intensity distribution --
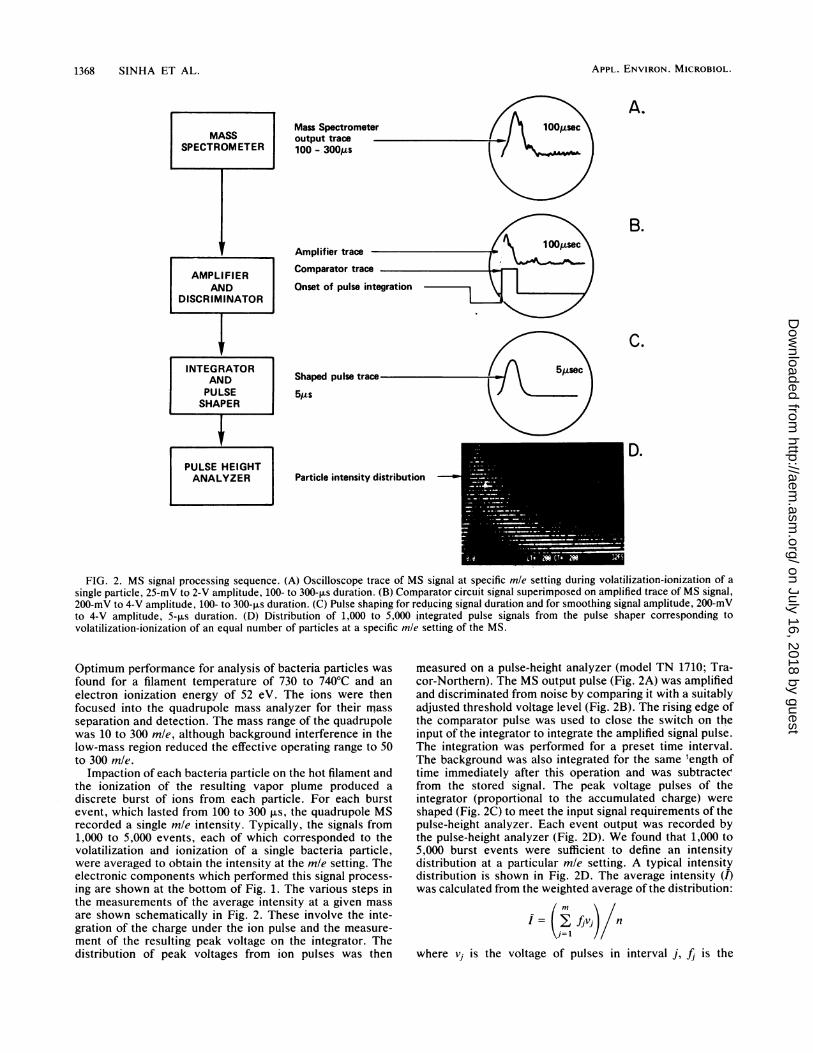
FIG. 2. MS signal processing sequence. (A) Oscilloscope trace of MS signal at specific mle setting during volatilization-ionization of a
single particle, 25-mV to 2-V amplitude, 100- to 300-p.s duration. (B) Comparator circuit signal superimposed on amplified trace of MS signal,200-mV to 4-V amplitude, 100- to 300-,us duration. (C) Pulse shaping for reducing signal duration and for smoothing signal amplitude, 200-mVto 4-V amplitude, 5-p.s duration. (D) Distribution of 1,000 to 5,000 integrated pulse signals from the pulse shaper corresponding tovolatilization-ionization of an equal number of particles at a specific mle setting of the MS.
Optimum performance for analysis of bacteria particles was
found for a filament temperature of 730 to 740°C and an
electron ionization energy of 52 eV. The ions were thenfocused into the quadrupole mass analyzer for their mass
separation and detection. The mass range of the quadrupolewas 10 to 300 mle, although background interference in thelow-mass region reduced the effective operating range to 50to 300 mle.
Impaction of each bacteria particle on the hot filament andthe ionization of the resulting vapor plume produced adiscrete burst of ions from each particle. For each burstevent, which lasted from 100 to 300 p.s, the quadrupole MSrecorded a single mle intensity. Typically, the signals from1,000 to 5,000 events, each of which corresponded to thevolatilization and ionization of a single bacteria particle,were averaged to obtain the intensity at the mle setting. Theelectronic components which performed this signal process-ing are shown at the bottom of Fig. 1. The various steps inthe measurements of the average intensity at a given massare shown schematically in Fig. 2. These involve the inte-gration of the charge under the ion pulse and the measure-ment of the resulting peak voltage on the integrator. Thedistribution of peak voltages from ion pulses was then
measured on a pulse-height analyzer (model TN 1710; Tra-cor-Northern). The MS output pulse (Fig. 2A) was amplifiedand discriminated from noise by comparing it with a suitablyadjusted threshold voltage level (Fig. 2B). The rising edge ofthe comparator pulse was used to close the switch on theinput of the integrator to integrate the amplified signal pulse.The integration was performed for a preset time interval.The background was also integrated for the same length oftime immediately after this operation and was subtractecfrom the stored signal. The peak voltage pulses of theintegrator (proportional to the accumulated charge) were
shaped (Fig. 2C) to meet the input signal requirements of thepulse-height analyzer. Each event output was recorded bythe pulse-height analyzer (Fig. 2D). We found that 1,000 to5,000 burst events were sufficient to define an intensitydistribution at a particular mie setting. A typical intensitydistribution is shown in Fig. 2D. The average intensity (I)was calculated from the weighted average of the distribution:
(Eifjvjf n
where vj is the voltage of pulses in interval j, fj is the
AMPLI Fl ERAND
DISCRIMINATOR
A.
B.
C.INTEGRATOR
ANDPULSESHAPER
PULSE HEIGHTANALYZER
I ~~5piec
D.
Ir..
1368 SINHA ET AL.
on July 16, 2018 by guesthttp://aem
.asm.org/
Dow
nloaded from

CHARACTERIZATION OF BACTERIA BY MASS SPECTROMETRY
corresponding number of pulses in j, m is the number ofintervals, and n is the total number of pulses (1,000 to 5,000).A common set of 30 mass peaks, covering the mass range
of 50 to 300 mle, was selected, and their intensities weremeasured by the above procedure for the three bacterialsamples. The MS was manually tuned to these peaks. Thecompilation of the intensities of these peaks represents themass spectrum of a single average bacterium in the particlebeam. It should be mentioned that this does not representthe complete mass spectrum of the bacteria particle since itdoes not include all the mass peaks. However, the set of 30masses provides a good data base for comparing the massspectra from different bacterial samples.Sample preparation for microscopy. B. subtilis spores were
collected at three positions in the process for observation inthe scanning electron microscope. Samples of the cell sus-pensions were prepared by the conventional scanning elec-tron microscope techniques of alcohol substitution and crit-ical point drying. Aerosolized bacteria were collected afterthe diffusion drier on 0.2-pum-pore-size Nuclepore filters.Bacteria that had passed through the particle beam werecollected on Apeizon grease-coated glass slides in the MSchamber. Each sample was coated in a sputter coater with alayer of gold-palladium approximately 20 nm thick.
RESULTSParticle beam characterization. The objectives of this part
of the study were to determine the efficiency of particletransmission through the particle beam generation systemand to characterize the morphology of the bacteria particlesat several points in the system.
Particle transmission efficiency is the ratio of the numberof particles which reach the filament target position to thenumber of particles that enter the beam tube during the sametime. This efficiency was determined to be greater than 80%for nonbiological bacterium-sized particles in our earlierstudies with an apparatus identical to that described here,except for the absence of the second skimmer (9). In thepresent work, the second skimmer was added 12.5 mmbelow the first to improve the vacuum at the MS, therebydecreasing the background interference during bacteria par-ticle analysis (20). The transmission efficiency for bacteriaparticle beams was unaffected by the second skimmer.However, due to the smaller rhenium filament cross section(7 mm2) relative to the particle beam cross section (16 tTIm2),the MS analyzed only about half of the particles arriving atthe filament target position for an overall filament collectionefficiency of 35 to 40%.
Scanning electron micrographs of B. subtilis spores weretaken from samples collected on Nuclepore filters from thesuspension before aerosolization (Fig. 3A), from the aerosolstream after the diffusion drier (Fig. 3B), and in the particlebeam on Apeizon grease-coated glass slides at the filamenttarget position (Fig. 3C). These micrographs verify that thebacteria samples were predominantly single spores, 20%occurring as doublets, and were free from particulate debris.Grease-coated slides had to be used for collection of parti-cles at the filament target position in the MS chamberbecause the particles moved at nearly sonic velocity in thebeam and bounced off nonsticky surfaces. The details arenot well resolved in these micrographs from the grease-coated slides; however, the shape and size of the particleswere still discernible, and they were estimated to average 0.5by 1.5 ,um. These features suggest that the spores remainintact during beam generation and the collection process.MS of bacteria. The MS signal from the bacteria in the
FIG. 3. Scanning electron micrographs of B. subtilis sporescollected on a Nuclepore filter from suspension before aerosoliza-tion (A), a Nuclepore filter from the aerosol after the diffusion drier(B), and an Apeizon grease-coated glass slide from the particle beamat the filament target position (C).
VOL. 49, 1985 1369
on July 16, 2018 by guesthttp://aem
.asm.org/
Dow
nloaded from

APPL. ENVIRON. MICROBIOL.
100 - oa) Pseudomonos putida69
56
O
I U.
b) Bacillus cereus
567
67 83114
96 134
83
96 114
,11 111 1146
150
164
169
282l III I
49
l50
169
164
0 J I__III_* I
199 224 2762821 27III
c) Bacillus subtilis
149
71
67
L 1143
96 4
iO
169
164
I 1I282
276 1
80 160 240M/E
FIG. 4. Mass spectra of bacteria particles. (a) P. putida; (b) B. cereus; (c) B. subtilis.
beam was observed throughout the mass range of 10 to 300amu. Several clusters of mass peaks were present below 170amu, similar to results previously found in the pyrolysismass spectra of bacteria samples (2, 14, 16-18, 21). Intensi-ties of all the mass peaks were not measured in our experi-ments due to their large number and to their low intensitiesat some of these masses. A set of ==30 intense mass peakswas selected, and their intensities were measured for all thebacteria samples. This included two clusters of mass peaksaround 70 and 150 amu. The intensities of signals below mle50 could not be measured quantitatively due to the interfer-ence from ethanol and other background contaminants.Strong signals from ethanol, which was used as the disper-sion medium of bacteria, were present. The mass spectra ofP. putida, B. cereus, and B. subtilis are shown in Fig. 4.Peak intensities are given as a fraction of the most intensepeak, which occurred in the cluster of peaks around mle 150in each of the samples. The intensities of peaks around mle280 are about 5% of the most intense peak and were theweakest signals recorded. No correction for the decrease oftransmission of higher masses through the quadrupole ana-
lyzer was made.In general, there was significant similarity in the spectra of
the three bacteria. Also, a considerable amount of new
information was gained over previous pyrolysis MS by thepresence of peaks at mle values greater than 140. Only fourpeaks differed among the samples. The mle 134 peak ob-served in both bacillus spectra was not present for P. putida.
B. cereus was the only sample with peaks at mle 199, 210,and 224.There were also a few readily observed differences in the
peak intensity patterns among the samples. The bacillusspectra, relative to the P. putida spectrum, had enhancedsignals at mle 67, 114, 169, and 282, as well as mle 56 peakintensity greater than the intensity of peaks clustered aroundmle 70.
Statistical analysis of the mass spectra. To examine systemreproducibility for samples of like species of bacteria andsystem capability to differentiate between samples of unlikespecies, we used a statistical method for comparing thevisually similar mass spectra. This method, the degree ofcorrespondence, was adapted from the method of Kist-emaker et al. (14) who used it to differentiate among spectraof distantly related bacteria. More advanced statistical pro-grams could not be used for the analysis of mass spectraldata due to the limited amount of data from our experiments.In the degree of correspondence method, one spectrum isarbitrarily designated as the reference spectrum with peakintensities, designated Ri, at the several i values of mle. Thepeak intensities comprising each sample spectrum to becompared with the reference are designated Si. The peakintensities of the sample are first normalized to those of thereference spectrum by multiplying the sample by a scalingfactor a which minimizes the error E in the squares of thedifference of comparable peaks in the two spectra, eachconsisting of n total peaks:
zZ' 50-z
. 10--10-
z
Z 50~
1001
t-z
z
m I I- fI _
1370 SINHA ET AL.
on July 16, 2018 by guesthttp://aem
.asm.org/
Dow
nloaded from

CHARACTERIZATION OF BACTERIA BY MASS SPECTROMETRY
Bacillus cereus (a) (1.00)
BacilIlIus cereus (b) l( .77 )
BacilIlus cereus (c) (.70)
Bacillus subtilis (.70)
Pseudomonas putida (.64)
0 0.50 1.00Degree of Correspondence
FIG. 5. Histogram of the degree of correspondence for the fivebacterial samples. Each sample is a separate culture, and B. cereus(a) was selected as the reference sample.
n
E= ((Rj-aS)2i=l1
Setting dElda = 0 gives the value of the scaling factor as:n /n
a= ,RSs / 2Sj2i=l i=l
When two spectra from like species are compared, perfectreproducibility means that the intensities for each pair ofpeaks are equal and a is unity. In practice, differences inculture growth, particle beam characteristics, volatilization-ionization conditions, and spectrometer signal processinglead to nonunity values of a. When two spectra from unlikespecies are compared, differences in the masses of individualbacteria particles are also taken into account in the acalculation.The degree of correspondence between the normalized
sample spectrum and the reference spectrum is the averageof the ratios of the minor peak intensities to the correspond-ing major peak intensities:
C= ( A1lBi) n
where Ai is the minor peak intensity in spectrum Ri or aSiand Bi is the respective major peak intensity in spectrum aS,or Ri. In case of perfect matching, the degree of correspond-ence is one. A correspondence of zero indicates that thespectra have no peaks in common. The value of C fromcomparing spectra of like species is a measure of reproduc-ibility and is a characteristic of the system as a whole. Thesystem is capable of differentiating between species if thecomparison of spectra from unlike species results in a valueof C which is significantly different from the characteristicvalue.Two more cultures of B. cereus in addition to the spec-
trum shown in Fig. 4b were analyzed in our system. Thespectrum of one of these three was chosen as the reference,and the degree of correspondence between this referenceand each of the other sample spectra was determined. All ofthe mass peaks were used in the calculation for C withoutdiscriminating for their sensitivity to the intensity variationsin different runs. The results of the comparison are shown asthe histogram in Fig. 5. The results for the B. cereus samplesindicate that the characteristic degree of correspondence forour system is in the range of 0.70 to 0.77. Since B. subtilis
has a C value of 0.70, it cannot be differentiated from B.cereus in our system. However, for P. putida, C = 0.64,indicating that this species can be differentiated from thebacillus samples.
DISCUSSIONThe use of particle beams and the fast volatilization-ioni-
zation method for pyrolysis are the principal features whichmake this system different from previous applications of MSto microorganism characterization. Of the several tech-niques available for generating particle beams (8), we se-lected the capillary-skimmer design for its capability to formdirected, tightly focused streams of single noninteractingparticles. We are not aware of previous uses of this design togenerate beams of biological materials. Our previous devel-opment work (9) involved beams of nonbiological materialswhich formed particles whose size and density were compa-rable to those of bacteria, but whose spherical shapesdiffered from the rodlike bacteria. In the previous studies,about 80% or more of the spherical polystyrene latex parti-cles (less than 3 ,um in diameter) were focused to a beamdiameter of 5 mm or less at the filament target position. Thetransmission efficiency for these particles was 80% or greater.Beams of the nonspherical bacteria particles used in thepresent work appeared to have comparable characteristics.An important difference between polystyrene latex andbacteria arose in aerosol generation and drying before par-ticle beam formation. Whereas monodisperse aerosols ofsingle polystyrene latex particles could be easily generatedfrom aqueous suspension, similar generation techniques forbacteria from aqueous solutions resulted in a marked de-crease of particle beam transmission efficiency. We sus-pected that the cause for this problem was due to inadequatedrying of the bacteria during aerosolization. The substitutionof ethanol for water as the suspending liquid corrected thisdifficulty, but ethanol is likely not to be a suitable choice inapplication to other microorganisms. A modified diffusiondrier will be used in future work to eliminate the need forethanol.
All previous applications of MS to microorganism identi-fication have involved some form of bulk sample pyrolysis.The most developed of these is one which uses Curie-pointpyrolysis of =10-,ug-bulk bacterial samples (14, 16, 21). Inthis technique, the sample is placed on a ferromagnetic wirepositioned in a low-vacuum chamber. The wire is heated byhigh-frequency induction to the Curie temperature within100 ms. Volatile pyrolysis products diffuse to the high-vac-uum region of the quadrupole MS where they are ionized bylow-energy (15-eV) electron impaction. A spectrum is accu-mulated over approximately 10 s, the time the samplepyrolyzates remain available. Boon et al. (2) used thistechnique in a study of the effects of growth media on thecomposition of the cell wall of B. subtilis. A reconstructionof the mass spectra for comparing the two techniquesapplied to the same bacterium (different strains) is shown inFig. 6. Although the two spectra have a number of intensitypeaks or clusters of peaks in common (e.g., mle 56, 71, 83,96), they differ significantly in the observed mass range andrelative intensities. Mass fragments above 140 mle observedin particle analysis were not detected in Curie-point pyroly-sis. The ability of the particle beam technique to obtaininformation in the higher mass range is likely to be due tomore rapid heating of the sample (11), =30 ,us versus 100 ms.Also, the placement of the filament within the ionizationsource eliminates the losses of pyrolysis products incurredby molecular diffusion to the ionization region (14). The
VOL. 49, 1985 1371
on July 16, 2018 by guesthttp://aem
.asm.org/
Dow
nloaded from

APPL. ENVIRON. MICROBIOL.
(A) B. subtilis, Boon et al.
109
20 80 160 240M/E
150
56
71
67j
Ti114
a 1 11111~~~~~~~~~~~134
149
j80
(B) B. subtilis, this work
169
164
160
282276,1
240M/E
FIG. 6. B. subtilis mass spectra from Curie-point pyrolysis of bulk bacterial sample (A) (spectrum reconstructed, with permission, fromFig. la of reference 2) and pyrolysis (volatilization) of single bacteria from particle beam (B) (spectrum reconstructed from Fig. 4c of thiswork).
vaporization of single particles in the ion source itself,maintained at a background pressure of 10-6 torr, mini-mizes the secondary fragmentation by collision of the pyrol-yzates in the vapor phase. A final distinction between thetwo techniques is that in Curie-point pyrolysis, ion intensi-ties at each mle are accumulated over the whole samplepyrolysis event; in the particle beam technique, these ionintensities represent averages for a distribution over morethan 1,000 separate events.
Usually, compounds are differentiated in MS by examin-ing the spectra for the presence or absence of unique ionizedfragments. For example, in our results of Fig. 4, the mle 134peak may be useful for distinguishing P. putida from bacilli.This distinction between the two spectra could be related todifferences in the composition of the bacterial cell walls;bacilli are gram-positive bacteria and P. putida is gramnegative (7).
It is more likely, however, that differentiation of bacteriafrom complex mass spectra requires analysis of peak inten-sity variations in addition to the usual criteria of presence orabsence of unique mass fragments. Both the particle beamvolatilization method and the Curie-point pyrolysis methodyield insufficient molecular fragments that are unique to a
specific bacterium. Kistemaker et al. (14), using the Curie-point pyrolysis method, were able to differentiate among 12Streptococcus strains by analyzing the degree of correspon-dence of peak intensities. The characteristic degree of cor-respondence was 0.80 or more for most replicate cultures,and strain differentiation was readily achieved when thedegree of correspondence between different strains was inthe range of 0.55 to 0.70. In our work, the comparableanalysis is made for a much smaller data set-triplicatecultures of B. cereus and one culture each of B. subtilis andB. putida. The degree of correspondence between the spec-trum of P. putida and one of the B. cereus reference spectra(0.64) was different enough from the characteristic value(0.70 to 0.77 from pair comparisons of B. cereus spectra) tosuggest that P. putida would be differentiated when com-
pared with a larger file of reference spectra.We conclude that particle beam MS presents a new
opportunity for developing a rapid automated method ofmicroorganism identification. Its most significant advantageis the ability to generate spectra in a mass range thatencompasses the molecular size of the basic biologicalmonomers (e.g., amino acid residues). The replacement ofthe quadrupole MS by a highly sensitive focal plane mass
100 -
I-a 50-zwI-z
0-
100 -
s 50-zw
z
0-20
I
1372 SINHA ET AL.
.1
on July 16, 2018 by guesthttp://aem
.asm.org/
Dow
nloaded from

CHARACTERIZATION OF BACTERIA BY MASS SPECTROMETRY
spectrograph (1) in this system will further increase theaccessible mass range to 28 to 500 amu. Such a system isbeing developed in our laboratory. This addition, plus moreadvanced statistical techniques for comparing spectrum in-tensity differences (21), should lead to a powerful newmethod of microorganism identification.
ACKNOWLEDGMENTS
This work was supported by grant CPE 80-08686 from the Na-tional Science Foundation, and by grant 18137-C from the U.S.Army Research Office.
LITERATURE CITED
1. Boettger, H., C. E. Giffin, and D. D. Norris. 1979. Electro-opti-cal ion detectors in mass spectrometry-simultaneous monitoringof all ions over wide mass ranges. ACS Symp. Ser. 102:291-318.
2. Boon, J. J., W. R. DeBoer, F. J. Kruyssen, and J. T. M.Wouters. 1981. Pyrolysis mass spectrometry of whole cells, cellwalls and isolated cell wall polymers of Bacillus subtilis var.niger WM. J. Gen. Microbiol. 122:119-127.
3. Charnley, J. 1972. Postoperative infection after total hip replace-ment with special reference to contamination in the operatingroom. Clin. Orthop. Relat. Res. 87:167-187.
4. Cinkotai, F. F., M. G. Lockwood, and R. Rylander. 1977.Airborne microorganisms and prevalence of byssinotic symp-toms in cotton mills. Am. Ind. Hyg. Assoc. J. 38:554-559.
5. Clark, C. S., E. J. Cleary, G. M. Schiff, C. C. Linneman, Jr.,J. P. Phair, and T. M. Briggs. 1976. Disease risks of occupa-tional exposure to sewage. Environ. Eng. Div. Am. Soc. Civ.Eng. 102:375-388.
6. Cronholm, L. S. 1980. Potential health hazards from microbialaerosols in densely populated urban regions. Appl. Environ.Microbiol. 39:6-12.
7. Cumins, C. S., and H. J. Harris. 1956. The chemical composi-tion of the cell wall in some gram-positive bacteria and itspossible value as a taxonomic character. J. Gen. Microbiol.14:583-600.
8. Dahneke, B. E. 1978. Aerosol beams, p. 187-223. In D. T. Shaw(ed.), Recent developments in aerosol science. John Wiley &Sons, Inc., New York.
9. Estes, T. J., V. L. Vilker, and S. K. Friedlander. 1983. Charac-teristics of a capillary-generated particle beam. J. Colloid Inter-face Sci. 93:84-94.
10. Fraser, D. W., T. F. Tsai, W. Orenstein, W. E. Parkin, H. J.
Beecham, R. G. Sharrar, J. Harris, G. F. Mallison, S. M. Mar-tin, J. E. McDade, C. C. Shepard, P. S. Brachman, and FieldInvestigation Team. 1977. Legionnaires' disease, description ofan epidemic pneumonia. N. Engl. J. Med. 297:1189-1197.
11. Irvin, W. J. 1979. Analytical pyrolysis-an overview. J. Anal.Appl. Pyrolysis 1:3-25.
12. Johnson, D. E., D. E. Camann, C. A. Sorber, B. P. Sagik, andJ. P. Glennon. 1978. Aerosol monitoring for microbial organ-isms near a spray irrigation site, p. 240-271. In B. P. Sagik andC. A. Sorber (ed.), Proceedings: risk assessment and healtheffects of land application of municipal wastewater and sludges.Center for Applied Research and Technology, San Antonio,Tex.
13. Katzenelson, E., I. Buium, and H. I. Shuval. 1976. Risk ofcommunicable disease infection associated with wastewaterirrigation in agricultural settlements. Science 194:944-946.
14. Kistemaker, P. G., H. L. C. Meuzelaar, and M. A. Posthumus.1975. Rapid and automated identification of microorganisms byCurie-point pyrolysis techniques, p. 179-191. In C.-G. Hedenand T. Illeni (ed.), New approaches to the identification ofmicroorganisms. John Wiley & Sons, Inc., New York.
15. Kleyn, J. G., W. M. Johnson, and T. F. Wetzler. 1981. Microbialaerosols and actinomycetes in etiological considerations ofmushroom workers' lungs. Appl. Environ. Microbiol.41:1454-1460.
16. Meuzelaar, H. L. C., and P. G. Kistemaker. 1973. A techniquefor fast and reproducible fingerprinting of bacteria by pyrolysismass spectrometry. Anal. Chem. 45:587-590.
17. Schulten, H. R., H. D. Beckey, H. L. C. Meuzelaar, and A. J. H.Boerboom. 1973. High resolution field ionization mass spectrom-etry of bacterial pyrolysis products. Anal. Chem. 45:191-195.
18. Simmonds, P. G. 1970. Whole microorganisms studied by py-rolysis-gas chromatography-mass spectrometry: significance forextraterrestrial life detection experiments. Appl. Microbiol.20:567-572.
19. Sinha, M. P., C. E. Giffin, D. D. Norris, T. J. Estes, V. L. Vilker,and S. K. Friedlander. 1982. Particle analysis by mass spectrom-etry. J. Colloid Interface Sci. 87:140-153.
20. Sinha, M. P., R. M. Platz, V. L. Vilker, and S. K. Friedlander.1984. Analysis of individual biological particles by mass spec-trometry. Int. J. Mass Spectrometry Ion Processes 57:125-133.
21. Wieten, G., J. Haverkamp, H. L. C. Meuzelaar, H. W. Bon-dwijn, and L. G. Berwald. 1981. Pyrolysis mass spectrometry: anew method to differentiate between the Mycobacteria of the"tuberculosis complex" and other Mycobacteria. J. Gen. Mi-crobiol. 122:109-118.
VOL. 49, 1985 1373
on July 16, 2018 by guesthttp://aem
.asm.org/
Dow
nloaded from