Characterization of aluminum, aluminum oxide and … of aluminum, aluminum oxideand titanium dioxide...
13
HAL Id: anses-01787430 https://hal-anses.archives-ouvertes.fr/anses-01787430 Submitted on 7 May 2018 HAL is a multi-disciplinary open access archive for the deposit and dissemination of sci- entific research documents, whether they are pub- lished or not. The documents may come from teaching and research institutions in France or abroad, or from public or private research centers. L’archive ouverte pluridisciplinaire HAL, est destinée au dépôt et à la diffusion de documents scientifiques de niveau recherche, publiés ou non, émanant des établissements d’enseignement et de recherche français ou étrangers, des laboratoires publics ou privés. Distributed under a Creative Commons Attribution - NonCommercial| 4.0 International License Characterization of aluminum, aluminum oxide and titanium dioxide nanomaterials using a combination of methods for particle surface and size analysis B. Krause, T. Meyer, H. Sieg, C. Kästner, P. Reichardt, J. Tentschert, H. Jungnickel, I. Estrela-Lopis, A. Burel, S. Chevance, et al. To cite this version: B. Krause, T. Meyer, H. Sieg, C. Kästner, P. Reichardt, et al.. Characterization of aluminum, alu- minum oxide and titanium dioxide nanomaterials using a combination of methods for particle sur- face and size analysis. RSC Advances, Royal Society of Chemistry, 2018, 8 (26), pp.14377 - 14388. http://pubs.rsc.org/en/Content/ArticleLanding/2018/RA/C8RA00205C !divAbstract. 10.1039/c8ra00205c. anses-01787430
Transcript of Characterization of aluminum, aluminum oxide and … of aluminum, aluminum oxideand titanium dioxide...

HAL Id: anses-01787430https://hal-anses.archives-ouvertes.fr/anses-01787430
Submitted on 7 May 2018
HAL is a multi-disciplinary open accessarchive for the deposit and dissemination of sci-entific research documents, whether they are pub-lished or not. The documents may come fromteaching and research institutions in France orabroad, or from public or private research centers.
L’archive ouverte pluridisciplinaire HAL, estdestinée au dépôt et à la diffusion de documentsscientifiques de niveau recherche, publiés ou non,émanant des établissements d’enseignement et derecherche français ou étrangers, des laboratoirespublics ou privés.
Distributed under a Creative Commons Attribution - NonCommercial| 4.0 InternationalLicense
Characterization of aluminum, aluminum oxide andtitanium dioxide nanomaterials using a combination of
methods for particle surface and size analysisB. Krause, T. Meyer, H. Sieg, C. Kästner, P. Reichardt, J. Tentschert, H.
Jungnickel, I. Estrela-Lopis, A. Burel, S. Chevance, et al.
To cite this version:B. Krause, T. Meyer, H. Sieg, C. Kästner, P. Reichardt, et al.. Characterization of aluminum, alu-minum oxide and titanium dioxide nanomaterials using a combination of methods for particle sur-face and size analysis. RSC Advances, Royal Society of Chemistry, 2018, 8 (26), pp.14377 - 14388.�http://pubs.rsc.org/en/Content/ArticleLanding/2018/RA/C8RA00205C!divAbstract�. �10.1039/c8ra00205c�. �anses-01787430�

RSC Advances
PAPER
Ope
n A
cces
s A
rtic
le. P
ublis
hed
on 1
7 A
pril
2018
. Dow
nloa
ded
on 0
7/05
/201
8 13
:52:
49.
Thi
s ar
ticle
is li
cens
ed u
nder
a C
reat
ive
Com
mon
s A
ttrib
utio
n-N
onC
omm
erci
al 3
.0 U
npor
ted
Lic
ence
.
View Article OnlineView Journal | View Issue
Characterization
aGerman Federal Institute for Risk Assessme
Product Safety, Max-Dohrn-Straße 8-10
[email protected] of Medical Physics and Biophysics,
18, 04275 Leipzig, GermanycGerman Federal Institute for Risk Assessm
Max-Dohrn-Straße 8-10, 10589 Berlin, GermdFederal Institute for Materials Research an
12205 Berlin, GermanyeMRIC TEM BIOSIT, Universite de Rennes 1fUniv Rennes, CNRS, ISCR UMR6226, F-350gANSES, French Agency for Food, Environ
Safety, Fougeres Laboratory, 10B rue Clau
France
Cite this: RSC Adv., 2018, 8, 14377
Received 8th January 2018Accepted 22nd March 2018
DOI: 10.1039/c8ra00205c
rsc.li/rsc-advances
This journal is © The Royal Society of C
of aluminum, aluminum oxide andtitanium dioxide nanomaterials usinga combination of methods for particle surface andsize analysis†
B. Krause, *a T. Meyer,b H. Sieg,c C. Kastner, d P. Reichardt,a J. Tentschert,a
H. Jungnickel,a I. Estrela-Lopis,b A. Burel,e S. Chevance, f F. Gauffre, f P. Jalili,g
J. Meijer,h L. Bohmert,c A. Braeuning,c A. F. Thunemann, d F. Emmerling, i
V. Fessard,g P. Laux, a A. Lampenc and A. Luch a
The application of appropriate analytical techniques is essential for nanomaterial (NM) characterization. In
this study, we compared different analytical techniques for NM analysis. Regarding possible adverse health
effects, ionic and particulate NM effects have to be taken into account. As NMs behave quite differently in
physiological media, special attention was paid to techniques which are able to determine the biosolubility
and complexation behavior of NMs. Representative NMs of similar size were selected: aluminum (Al0) and
aluminum oxide (Al2O3), to compare the behavior of metal and metal oxides. In addition, titanium dioxide
(TiO2) was investigated. Characterization techniques such as dynamic light scattering (DLS) and
nanoparticle tracking analysis (NTA) were evaluated with respect to their suitability for fast
characterization of nanoparticle dispersions regarding a particle's hydrodynamic diameter and size
distribution. By application of inductively coupled plasma mass spectrometry in the single particle mode
(SP-ICP-MS), individual nanoparticles were quantified and characterized regarding their size. SP-ICP-MS
measurements were correlated with the information gained using other characterization techniques, i.e.
transmission electron microscopy (TEM) and small angle X-ray scattering (SAXS). The particle surface as
an important descriptor of NMs was analyzed by X-ray diffraction (XRD). NM impurities and their co-
localization with biomolecules were determined by ion beam microscopy (IBM) and confocal Raman
microscopy (CRM). We conclude advantages and disadvantages of the different techniques applied and
suggest options for their complementation. Thus, this paper may serve as a practical guide to particle
characterization techniques.
Introduction
The specic properties of NMs depend on their physicochemicalcharacteristics. Optical properties build upon the size, the shapeand the surface structure,1,2 while higher reactivity, for example,
nt (BfR), Department of Chemical and
, 10589 Berlin, Germany. E-mail:
University of Leipzig, H€artelstrasse 16-
ent (BfR), Department of Food Safety,
any
d Testing (BAM), Unter den Eichen 87,
, 2 av pro Leon Bernard, France
00 Rennes, France
mental and Occupational Health and
de Bourgelat, 35306, Fougeres Cedex,
hemistry 2018
may result from a high surface area,3,4 specic surface coatings5
or a surface charge.6–8 An important factor for increasing theiractivity is the self-assembly of NMs. Here, NMs associate via non-covalent interactions resulting in organized structures of higher-order. Different applications based on advanced functions were
hFelix Bloch Institute for Solid State Physics, Faculty of Physics and Geosciences,
Division of Nuclear Solid State Physics, University of Leipzig, Linnestraße 5,
04103 Leipzig, GermanyiFederal Institute for Materials Research and Testing (BAM), Richard-Willstatter-
Straße 11, 12489 Berlin, Germany
† Electronic supplementary information (ESI) available: NTA size distributionsfor Al0, Al2O3, NM103, NM104, DLS number-based distribution for Al0, Al2O3,NM103, NM104, TEM measurement of TiO2 NMs in DMEM, SAXS data for Al0,Al2O3 and AlCl3 in BSA and DMEM aer 24 and 48 h, impurities of used NMsdetermined by IBM, aluminium aqua complexes at different pH values, CRMsurface investigations, colocalization pattern by IBM for Al2O3, CRM spectradisplaying protein modications, ToF-SIMS measurements of Al and Al2O3
NMs in DMEM, ToF-SIMS measurements of TiO2 NMs in DMEM. See DOI:10.1039/c8ra00205c
RSC Adv., 2018, 8, 14377–14388 | 14377
RSC Advances Paper
Ope
n A
cces
s A
rtic
le. P
ublis
hed
on 1
7 A
pril
2018
. Dow
nloa
ded
on 0
7/05
/201
8 13
:52:
49.
Thi
s ar
ticle
is li
cens
ed u
nder
a C
reat
ive
Com
mon
s A
ttrib
utio
n-N
onC
omm
erci
al 3
.0 U
npor
ted
Lic
ence
.View Article Online
reported, for example formation of mesoporous TiO2 mediatedby ionic liquids for solar cell conversion, catalysis or electronicdevices.9–11 Another application is the self-assembly of biomole-cules, like lipids and proteins, mediating inner-particle meso-porosity in a macroporous TiO2 structure.12
TiO2 NMs are classied as granular biodurable particles(GBPs) of low toxicity.13 They occur in the form of anatase orrutile as well as in mixtures thereof. While signicant accu-mulation was shown in the liver of rats in the case of orallyadministered TiO2 NMs,14 this was different in studies with Al0
NMs in mice, in which predominant accumulation in the brain,thymus and lung was revealed.15 Characterization is importantfor both in vitro and in vivo studies. Currently, the human healthrisk assessment of NMs is mainly based on in vivo experimentsin rodents.16,17 However, due to the high number of new NMs,18
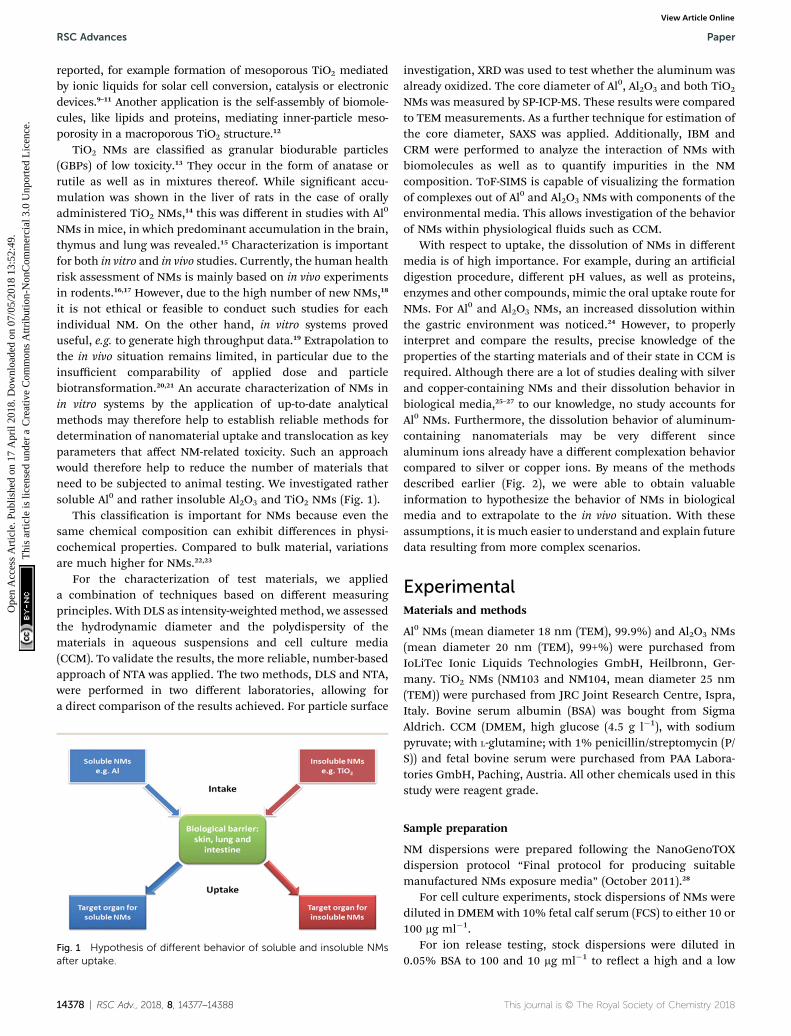
it is not ethical or feasible to conduct such studies for eachindividual NM. On the other hand, in vitro systems proveduseful, e.g. to generate high throughput data.19 Extrapolation tothe in vivo situation remains limited, in particular due to theinsufficient comparability of applied dose and particlebiotransformation.20,21 An accurate characterization of NMs inin vitro systems by the application of up-to-date analyticalmethods may therefore help to establish reliable methods fordetermination of nanomaterial uptake and translocation as keyparameters that affect NM-related toxicity. Such an approachwould therefore help to reduce the number of materials thatneed to be subjected to animal testing. We investigated rathersoluble Al0 and rather insoluble Al2O3 and TiO2 NMs (Fig. 1).
This classication is important for NMs because even thesame chemical composition can exhibit differences in physi-cochemical properties. Compared to bulk material, variationsare much higher for NMs.22,23
For the characterization of test materials, we applieda combination of techniques based on different measuringprinciples. With DLS as intensity-weighted method, we assessedthe hydrodynamic diameter and the polydispersity of thematerials in aqueous suspensions and cell culture media(CCM). To validate the results, the more reliable, number-basedapproach of NTA was applied. The two methods, DLS and NTA,were performed in two different laboratories, allowing fora direct comparison of the results achieved. For particle surface
Fig. 1 Hypothesis of different behavior of soluble and insoluble NMsafter uptake.
14378 | RSC Adv., 2018, 8, 14377–14388
investigation, XRD was used to test whether the aluminum wasalready oxidized. The core diameter of Al0, Al2O3 and both TiO2
NMs was measured by SP-ICP-MS. These results were comparedto TEM measurements. As a further technique for estimation ofthe core diameter, SAXS was applied. Additionally, IBM andCRM were performed to analyze the interaction of NMs withbiomolecules as well as to quantify impurities in the NMcomposition. ToF-SIMS is capable of visualizing the formationof complexes out of Al0 and Al2O3 NMs with components of theenvironmental media. This allows investigation of the behaviorof NMs within physiological uids such as CCM.
With respect to uptake, the dissolution of NMs in differentmedia is of high importance. For example, during an articialdigestion procedure, different pH values, as well as proteins,enzymes and other compounds, mimic the oral uptake route forNMs. For Al0 and Al2O3 NMs, an increased dissolution withinthe gastric environment was noticed.24 However, to properlyinterpret and compare the results, precise knowledge of theproperties of the starting materials and of their state in CCM isrequired. Although there are a lot of studies dealing with silverand copper-containing NMs and their dissolution behavior inbiological media,25–27 to our knowledge, no study accounts forAl0 NMs. Furthermore, the dissolution behavior of aluminum-containing nanomaterials may be very different sincealuminum ions already have a different complexation behaviorcompared to silver or copper ions. By means of the methodsdescribed earlier (Fig. 2), we were able to obtain valuableinformation to hypothesize the behavior of NMs in biologicalmedia and to extrapolate to the in vivo situation. With theseassumptions, it is much easier to understand and explain futuredata resulting from more complex scenarios.
ExperimentalMaterials and methods
Al0 NMs (mean diameter 18 nm (TEM), 99.9%) and Al2O3 NMs(mean diameter 20 nm (TEM), 99+%) were purchased fromIoLiTec Ionic Liquids Technologies GmbH, Heilbronn, Ger-many. TiO2 NMs (NM103 and NM104, mean diameter 25 nm(TEM)) were purchased from JRC Joint Research Centre, Ispra,Italy. Bovine serum albumin (BSA) was bought from SigmaAldrich. CCM (DMEM, high glucose (4.5 g l�1), with sodiumpyruvate; with L-glutamine; with 1% penicillin/streptomycin (P/S)) and fetal bovine serum were purchased from PAA Labora-tories GmbH, Paching, Austria. All other chemicals used in thisstudy were reagent grade.
Sample preparation
NM dispersions were prepared following the NanoGenoTOXdispersion protocol “Final protocol for producing suitablemanufactured NMs exposure media” (October 2011).28
For cell culture experiments, stock dispersions of NMs werediluted in DMEM with 10% fetal calf serum (FCS) to either 10 or100 mg ml�1.
For ion release testing, stock dispersions were diluted in0.05% BSA to 100 and 10 mg ml�1 to reect a high and a low
This journal is © The Royal Society of Chemistry 2018
Paper RSC Advances
Ope
n A
cces
s A
rtic
le. P
ublis
hed
on 1
7 A
pril
2018
. Dow
nloa
ded
on 0
7/05
/201
8 13
:52:
49.
Thi
s ar
ticle
is li
cens
ed u
nder
a C
reat
ive
Com
mon
s A
ttrib
utio
n-N
onC
omm
erci
al 3
.0 U
npor
ted
Lic
ence
.View Article Online
concentration used in cell culture experiments. 1 ml was takenand centrifuged at 16000 � g for 1 h (Hettich Zentrifuge Mikro220R). 500 ml of the supernatant were taken, 750 ml of HNO3
(69%) were added and Millipore water was used to ll up to15 ml.
For IBM and CRM, NMs were centrifuged at 8000 � g for10min, supernatant was taken away, mpH2O was added and thesample was vortexed. The procedure was repeated 3 times.Finally, a small drop of the sample was given on polypropylenefoil for IBM and on quartz glass for CRM. The dry samples weremeasured.
Dynamic light scattering measurements
The distributions of the hydrodynamic diameters of the NMswere determined using a Malvern Nano ZS (Malvern Inc., UK) ora Brookhaven ZetaPALS (Brookhaven Instruments Corporation,
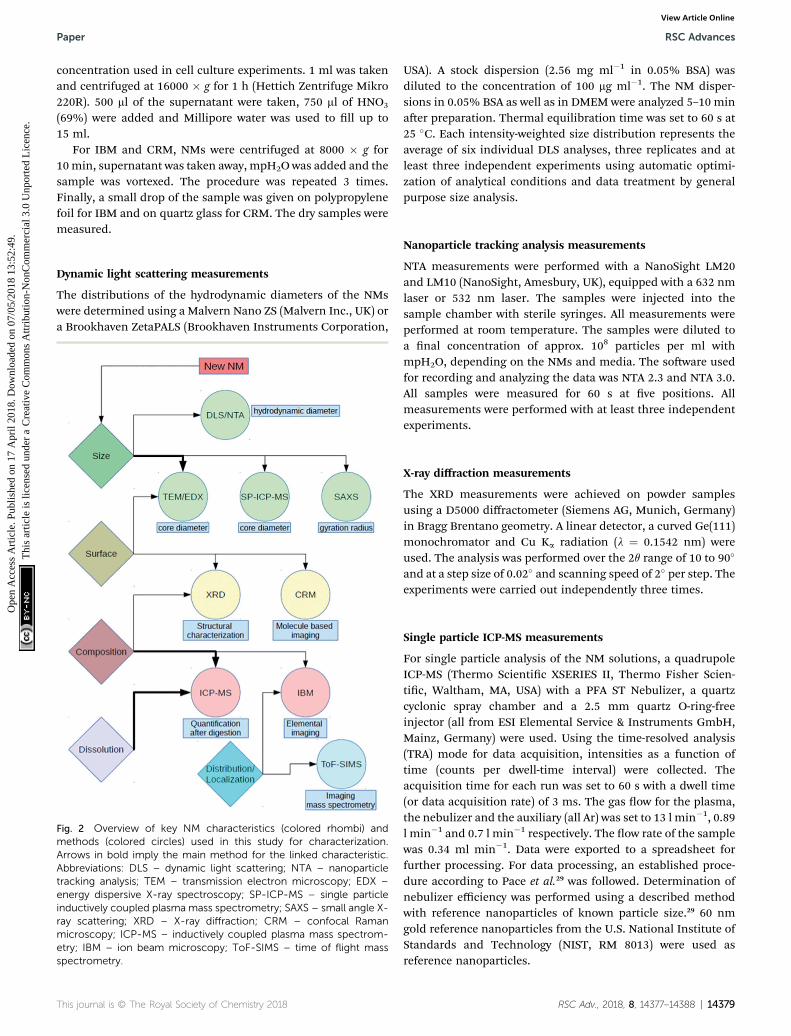
Fig. 2 Overview of key NM characteristics (colored rhombi) andmethods (colored circles) used in this study for characterization.Arrows in bold imply the main method for the linked characteristic.Abbreviations: DLS – dynamic light scattering; NTA – nanoparticletracking analysis; TEM – transmission electron microscopy; EDX –energy dispersive X-ray spectroscopy; SP-ICP-MS – single particleinductively coupled plasma mass spectrometry; SAXS – small angle X-ray scattering; XRD – X-ray diffraction; CRM – confocal Ramanmicroscopy; ICP-MS – inductively coupled plasma mass spectrom-etry; IBM – ion beam microscopy; ToF-SIMS – time of flight massspectrometry.
This journal is © The Royal Society of Chemistry 2018
USA). A stock dispersion (2.56 mg ml�1 in 0.05% BSA) wasdiluted to the concentration of 100 mg ml�1. The NM disper-sions in 0.05% BSA as well as in DMEM were analyzed 5–10 minaer preparation. Thermal equilibration time was set to 60 s at25 �C. Each intensity-weighted size distribution represents theaverage of six individual DLS analyses, three replicates and atleast three independent experiments using automatic optimi-zation of analytical conditions and data treatment by generalpurpose size analysis.
Nanoparticle tracking analysis measurements
NTA measurements were performed with a NanoSight LM20and LM10 (NanoSight, Amesbury, UK), equipped with a 632 nmlaser or 532 nm laser. The samples were injected into thesample chamber with sterile syringes. All measurements wereperformed at room temperature. The samples were diluted toa nal concentration of approx. 108 particles per ml withmpH2O, depending on the NMs and media. The soware usedfor recording and analyzing the data was NTA 2.3 and NTA 3.0.All samples were measured for 60 s at ve positions. Allmeasurements were performed with at least three independentexperiments.
X-ray diffraction measurements
The XRD measurements were achieved on powder samplesusing a D5000 diffractometer (Siemens AG, Munich, Germany)in Bragg Brentano geometry. A linear detector, a curved Ge(111)monochromator and Cu Ka radiation (l ¼ 0.1542 nm) wereused. The analysis was performed over the 2q range of 10 to 90�
and at a step size of 0.02� and scanning speed of 2� per step. Theexperiments were carried out independently three times.
Single particle ICP-MS measurements
For single particle analysis of the NM solutions, a quadrupoleICP-MS (Thermo Scientic XSERIES II, Thermo Fisher Scien-tic, Waltham, MA, USA) with a PFA ST Nebulizer, a quartzcyclonic spray chamber and a 2.5 mm quartz O-ring-freeinjector (all from ESI Elemental Service & Instruments GmbH,Mainz, Germany) were used. Using the time-resolved analysis(TRA) mode for data acquisition, intensities as a function oftime (counts per dwell-time interval) were collected. Theacquisition time for each run was set to 60 s with a dwell time(or data acquisition rate) of 3 ms. The gas ow for the plasma,the nebulizer and the auxiliary (all Ar) was set to 13 l min�1, 0.89l min�1 and 0.7 l min�1 respectively. The ow rate of the samplewas 0.34 ml min�1. Data were exported to a spreadsheet forfurther processing. For data processing, an established proce-dure according to Pace et al.29 was followed. Determination ofnebulizer efficiency was performed using a described methodwith reference nanoparticles of known particle size.29 60 nmgold reference nanoparticles from the U.S. National Institute ofStandards and Technology (NIST, RM 8013) were used asreference nanoparticles.
RSC Adv., 2018, 8, 14377–14388 | 14379

Table 1 Z-averages with standard deviation (SD) and polydispersityindex (PDI) of Al0, Al2O3, NM103 and NM104 NMs in different mediadetermined by dynamic light scattering (DLS). All results represent theaverage of six repeats. BSA: bovine serum albumin; DMEM: Dulbecco'smodified eagle medium; FCS: fetal calf serum
DLS measurements and comparison
Lab 1 (Malvern) Lab 2 (Brookhaven)
Z-average [nm] PDI Z-average [nm] PDI
Stock solution (0.05% BSA in H2O)Al0 NM 250 � 10 0.17 � 0.01 270 � 40 0.18 � 0.02Al2O3 NM 170 � 10 0.24 � 0.02 210 � 40 0.21 � 0.06NM103 270 � 10 0.28 � 0.05 610 � 190 0.21 � 0.30NM104 220 � 10 0.26 � 0.03 370 � 90 0.15 � 0.03
DMEM (with 10% FCS)Al0 NM 200 � 10 0.18 � 0.01 220 � 10 0.21 � 0.02Al2O3 NM 70 � 10 0.52 � 0.03 230 � 60 0.18 � 0.07NM103 240 � 20 0.24 � 0.01 270 � 10 0.25 � 0.01NM104 190 � 10 0.28 � 0.02 230 � 10 0.18 � 0.02
RSC Advances Paper
Ope
n A
cces
s A
rtic
le. P
ublis
hed
on 1
7 A
pril
2018
. Dow
nloa
ded
on 0
7/05
/201
8 13
:52:
49.
Thi
s ar
ticle
is li
cens
ed u
nder
a C
reat
ive
Com
mon
s A
ttrib
utio
n-N
onC
omm
erci
al 3
.0 U
npor
ted
Lic
ence
.View Article Online
Small angle X-ray scattering measurements
The measurements were conducted in a ow-through capillarywith a Kratky-type instrument (SAXSess, Anton Paar, Austria) at21 � 1 �C. The SAXSess has a low sample-detector distance of0.309 m. Deconvolution of the SAXS curves was carried out withthe SAXS-Quant soware. Curve tting was performed with theMcSAS soware (Monte Carlo method, version 1.0.1). Theexperiments were performed with 120 measurement cycles(each averaged over 10 s). NMs and controls were dispersedaccording to NanoGenoTOX protocol and diluted into DMEM ina sample concentration of 100 mg ml�1. Samples were incubatedfor a time of 24 and 48 h at 37 �C and 5% CO2 in a cell incubatoruntil sample injection. Stock dispersions were injected directlyaer ultrasonication.
Ion beam microscopy
Label-free IBM measurements were performed with the LIP-SION Nanoprobe. A 2.25 MeV proton beam was applied bya Singletron™ particle accelerator. A vacuum with a pressure of5 � 10�5 to 10�7 torr was applied and the beam was focused toa spot size of around 1 mm. For spatial resolved element anal-ysis, micro proton induced X-ray emission (mPIXE) and microRutherford backscattering spectroscopy (mRBS) were recordedsimultaneously. The mPIXE detector (Canberra, Meriden, CT,USA) consists of a high-purity Ge crystal covered with a 60 mmpolyethylene layer, which covers the detector for backscatteredprotons. mRBS spectra were detected by a Canberra PIPSdetector.
Confocal Raman microscopy
Spectroscopic analysis of NMs was performed by CRM. A Witecalpha300 confocal Raman spectrometer (Witec GmbH, Ger-many) with a 532 nm laser with 30 mW power was used.Control4.1 (Witec GmbH, Germany) soware was used to recordand analyze the spectra. The spectra were recorded at an inte-gration time of 0.15 s per point and with a step size of 250 nm.
Transmission electron microscopy
The samples were deposited on a 400-mesh copper grid. Thegrids were prepared by sample adsorption and le free-standingon top of a 0.8 mgml�1 solution of NMs for 20 s. Excess solutionwas removed by placing the grid on a lter paper and thesample was dried for 24 h. For samples in DMEM, the grid waswashed by dipping the grid in a droplet of water before.Examination was performed with a JEOL 1400 transmissionelectron microscope, equipped with a tungsten lament andsupplied with GATAN Orius 1000 camera. TEM operated at 80kV (DMEM) or at 120 kV with magnication of 200 000�.
Time-of-ight mass spectrometry
Ion images and spectra were acquired using a ToF-SIMS Vinstrument (ION-TOF GmbH, Munster, Germany) with a 30 keVnano-bismuth primary ion beam source ([Bi]x(y+)-cluster ionsource with a BiMn emitter). The ion currents were 0.5 pA at 5kHz using a Faraday cup. A pulse of 0.7 ns from the bunching
14380 | RSC Adv., 2018, 8, 14377–14388
system resulted in a mass resolution that usually exceeded 6000(full width at half-maximum) at m/z < 500 in positive ion mode.The primary ion dose was controlled below 1012 ions cm�2 toensure static SIMS conditions. Charge compensation on thesample was obtained by a pulsed electron ood gun with 20 eVelectrons.
The primary ion gun scanned a eld of view of 500 mm� 500mm applying a 512 � 512 pixel measurement raster. Once theprimary ion gun was aligned, a ToF-SIMS mass spectrum wasgenerated by summing the detected secondary ion intensitiesand plotting them against the mass channels. The data wereevaluated using the Surface Lab soware (ION-TOF GmbH,Munster, Germany).
Results and discussion
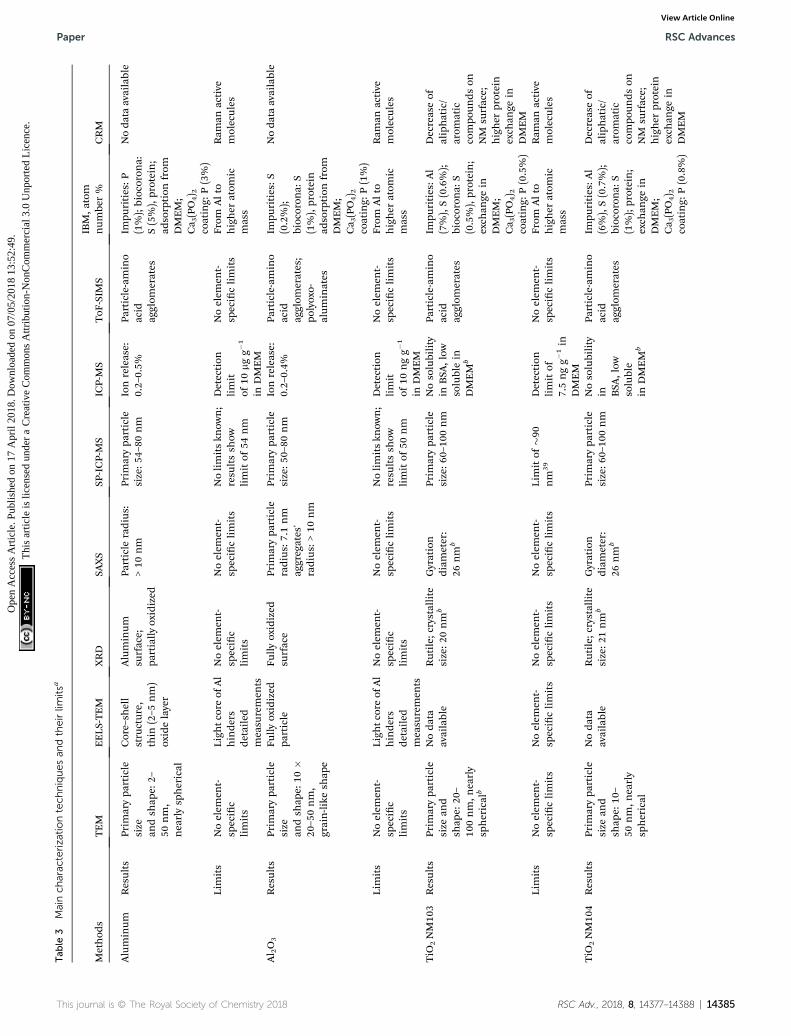
We point to the advantages and disadvantages of the methodsused and explain whether or not methods can providecomplementary results to other techniques. We also analyzedpossible dissolution characteristics of different matrix media(BSA and DMEM) for pristine Al0 and oxide (Al2O3 and TiO2)NMs. Characterization data already published on TiO2 wereretrieved according to JRC report.30 In conclusion, we willpresent data where the dissolution of NMs in complex mediahas an impact on particle media interactions. These resultswere obtained by ToF-SIMS and show the efficiency of thatmethod for obtaining insights into elemental compositionswith TEM, IBM, CRM and ToF-SIMS. An overview about themain characterization techniques and their limits is given inTable 3.
A very common and frequently used method for determiningthe size distribution and polydispersity of NMs in solution isDLS. Fast and easy sample preparation as well as quickmeasurement give rapid initial indications of the sample. NTAis more appropriate for evaluating polydisperse samples with
This journal is © The Royal Society of Chemistry 2018
Paper RSC Advances
Ope
n A
cces
s A
rtic
le. P
ublis
hed
on 1
7 A
pril
2018
. Dow
nloa
ded
on 0
7/05
/201
8 13
:52:
49.
Thi
s ar
ticle
is li
cens
ed u
nder
a C
reat
ive
Com
mon
s A
ttrib
utio
n-N
onC
omm
erci
al 3
.0 U
npor
ted
Lic
ence
.View Article Online
various aggregate populations, since it is based on singleparticle tracking as both techniques determine the hydrody-namic diameter. Due to the xed working ranges of DLS andNTA, the used concentration of media various. Since NTA isa counting method, also proteins would be counted and wouldsignicantly lower the hydrodynamic diameter of the NMdispersion. Therefore, the particles, as well as the medium werediluted directly before measurement with mpH2O to avoidagglomeration effects.
For all particles with a primary size of approximately 20 nm,a hydrodynamic diameter between 200 and 270 nm wasmeasured by DLS in DMEM (Table 1). In contrast, differentaggregate fractions of NMs in DMEM with a mean value ofabout 150 nm were found by means of NTA (Fig. S1†). Thisdifference can be explained by the fact that NTA is a particlecounting system, sensitive to large as well as small fractions inthe sample, and DLS is an intensity-weighted system, highlyresponsive to the large fractions. In all cases, the NTA sizedistribution is asymmetrical with a steep slope on the le side(small particles) and a gentle slope on the right side, repre-senting the fraction of agglomerates. Additionally, a calculationof number-based size distribution out of intensity-weightedDLS data was done (Table S1†).
In the case of NM103 and NM104 dispersed in 0.05% BSAwater solution, a very high mean value and a large error wasmeasured by the Brookhaven device, while NTA exhibits broaddistributions with some fractions and a mean value of around180 nm. This can be explained by unstable particle agglomer-ates, which are observed by the DLS.
Comparing the two DLS devices, one can observe that theMalvern DLS detects 15% smaller particles than the Brookhavenmachine in 0.05% BSA water solution as well as in DMEM. Thissystematic deviation could be related to different detectionangles of scattered intensity, 90� for Brookhaven and 173� forMalvern, since larger particles mostly scatter light at forwardangles. Backscattering at 173� will not overestimate largerparticles as much as measurements at 90�.
In the case of NM103 and 104 in BSA and Al2O3 in DMEM,the results were not consistent for the two devices. Z-averageddiffusion coefficients were calculated by applying the cumulantmethod, which is applicable to polydisperse and non-multimodal systems. In contrast, NTA results show the pres-ence of different particle populations. The applied cumulantalgorithms are not suitable in certain cases for getting reliableDLS results. Furthermore, it should be kept in mind that theinversion of the DLS autocorrelation function is part of a poorlyformulated mathematical problem. It works quite well in thecase of monodisperse or low polydisperse particles. Applica-tions of multiangle DLS and sophisticated algorithms are thusnecessary to obtain trustworthy results of NM size distributionsby means of DLS.31,32
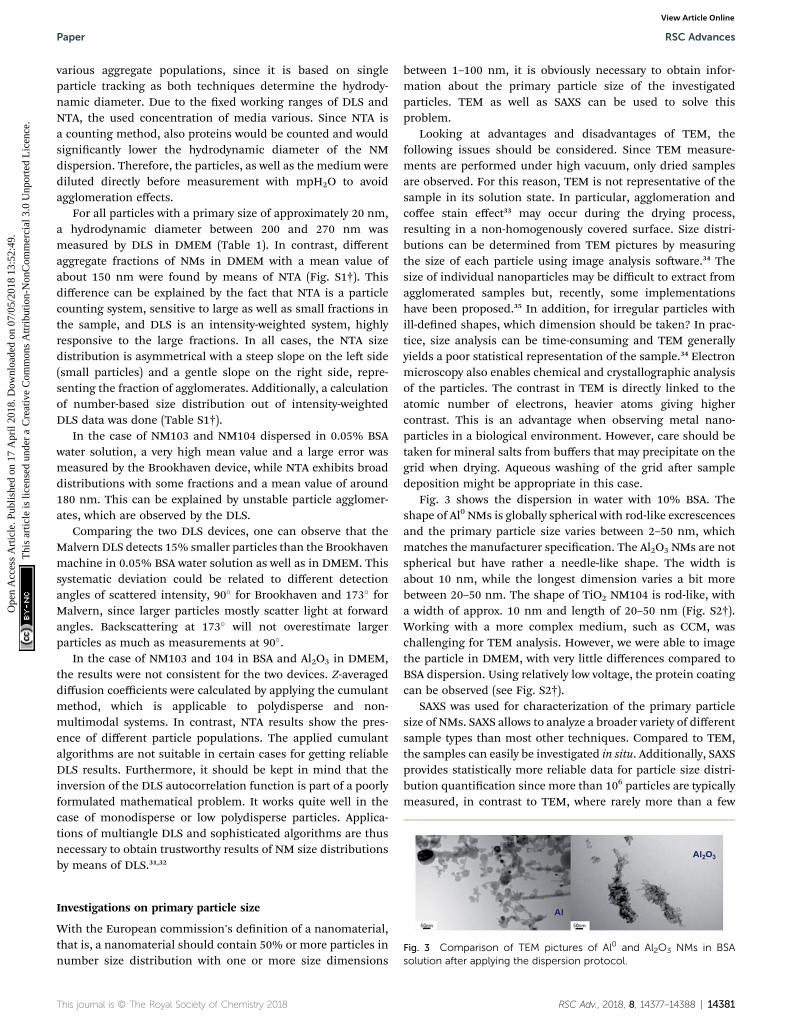
Fig. 3 Comparison of TEM pictures of Al0 and Al2O3 NMs in BSAsolution after applying the dispersion protocol.
Investigations on primary particle size
With the European commission's denition of a nanomaterial,that is, a nanomaterial should contain 50% or more particles innumber size distribution with one or more size dimensions
This journal is © The Royal Society of Chemistry 2018
between 1–100 nm, it is obviously necessary to obtain infor-mation about the primary particle size of the investigatedparticles. TEM as well as SAXS can be used to solve thisproblem.
Looking at advantages and disadvantages of TEM, thefollowing issues should be considered. Since TEM measure-ments are performed under high vacuum, only dried samplesare observed. For this reason, TEM is not representative of thesample in its solution state. In particular, agglomeration andcoffee stain effect33 may occur during the drying process,resulting in a non-homogenously covered surface. Size distri-butions can be determined from TEM pictures by measuringthe size of each particle using image analysis soware.34 Thesize of individual nanoparticles may be difficult to extract fromagglomerated samples but, recently, some implementationshave been proposed.35 In addition, for irregular particles withill-dened shapes, which dimension should be taken? In prac-tice, size analysis can be time-consuming and TEM generallyyields a poor statistical representation of the sample.34 Electronmicroscopy also enables chemical and crystallographic analysisof the particles. The contrast in TEM is directly linked to theatomic number of electrons, heavier atoms giving highercontrast. This is an advantage when observing metal nano-particles in a biological environment. However, care should betaken for mineral salts from buffers that may precipitate on thegrid when drying. Aqueous washing of the grid aer sampledeposition might be appropriate in this case.
Fig. 3 shows the dispersion in water with 10% BSA. Theshape of Al0 NMs is globally spherical with rod-like excrescencesand the primary particle size varies between 2–50 nm, whichmatches the manufacturer specication. The Al2O3 NMs are notspherical but have rather a needle-like shape. The width isabout 10 nm, while the longest dimension varies a bit morebetween 20–50 nm. The shape of TiO2 NM104 is rod-like, witha width of approx. 10 nm and length of 20–50 nm (Fig. S2†).Working with a more complex medium, such as CCM, waschallenging for TEM analysis. However, we were able to imagethe particle in DMEM, with very little differences compared toBSA dispersion. Using relatively low voltage, the protein coatingcan be observed (see Fig. S2†).
SAXS was used for characterization of the primary particlesize of NMs. SAXS allows to analyze a broader variety of differentsample types than most other techniques. Compared to TEM,the samples can easily be investigated in situ. Additionally, SAXSprovides statistically more reliable data for particle size distri-bution quantication since more than 106 particles are typicallymeasured, in contrast to TEM, where rarely more than a few
RSC Adv., 2018, 8, 14377–14388 | 14381

RSC Advances Paper
Ope
n A
cces
s A
rtic
le. P
ublis
hed
on 1
7 A
pril
2018
. Dow
nloa
ded
on 0
7/05
/201
8 13
:52:
49.
Thi
s ar
ticle
is li
cens
ed u
nder
a C
reat
ive
Com
mon
s A
ttrib
utio
n-N
onC
omm
erci
al 3
.0 U
npor
ted
Lic
ence
.View Article Online
hundred particles are counted. Size distribution of NMs can bequantied in the range of 1 to 100 nm if the shape is knownfrom a complementary technique like TEM. The classical radiusof gyration (Guinier radius) is accessible in any case.
In this study, we observed the size parameters of the particlesin BSA as a stock solution and aer addition in DMEM atdifferent times of t ¼ 0 h, 24 h and 48 h (Fig. 4). Since theparticle cores scatter much stronger than the surroundingparticle shell, the shell becomes practically invisible. Therefore,SAXS determines the size distribution of the core radii. Theresulting distributions of the particles' stock solutions areshown in Fig. 4. Their corresponding SAXS curves are displayedin the ESI (Fig. S3–S5†). The accessible size range of the radii isgiven by the range of the scattering vector q: Rmin ¼ p/qmax andRmax ¼ p/qmin. In the present case of the q-range of 0.1 nm�1 < q< 6 nm�1 corresponds to radii of 30 nm > R > 0.5 nm.
The Al0 NMs showed a broad size distribution includingprimary particles with radii > 10 nm. Since the detection limit is30 nm (radius) in this case, bigger aggregates cannot be detec-ted directly. However, from the steep slope of the SAXS curve(Fig. S3†) at low q values, it can be assumed that bigger aggre-gates are present. The dened characterization of these particleaggregates has to be performed using a complementary methodlike TEM. The inset in Fig. 4a shows that the radii distributionof the Al0 NMs did not change signicantly either aer additionin DMEM or 24 h and 48 h thereaer. In contrast to the Al0 NMs,the Al2O3 NM in BSA displays a distribution which consists ofsmall primary particles and aggregates. The sample shows anamount of 75% primary particles with a mean radius of 7.1 �0.5 nm. The detected aggregates display radii of > 10 nm. Uponthe addition in DMEM, the radii distribution shis slightly tohigher radii of 8.4 � 0.2 nm. These characteristics did notchange signicantly over the time of 48 h in DMEM.
Fig. 4 Volume-weighted radii distributions of Al0 NMs (a) and Al2O3
NMs (b) derived from SAXS measurements. The displayed radii distri-bution (right panel, black bars) and cumulative fraction presentation(blue line) correspond to the NMs in stock solution (BSA). Left panelshows particle distribution in cumulative fraction presentation atdifferent stages: in stock solution (blue line) and in DMEM after 0 h (redline), 24 h (green line) and 48 h (orange line).
14382 | RSC Adv., 2018, 8, 14377–14388
No particles were detected in the ionic control substanceAlCl3. In contrast, immediately aer addition in DMEM, nano-scaled particles with sizes of 1–30 nm were observed. Since allcurves are background-corrected with the respective solventcontrol, solvent effects can be excluded and the particles derivedirectly from the aluminum species. In conclusion, SAXS yieldsthe size distribution of nanoparticles and its changes in DMEM.
SP-ICP-MS is another technique to determine primaryparticle sizes. The fundamental assumption behind this tech-nique is that, at a sufficiently short dwell time and low particlenumber concentration, a pulse will represent a single particleevent.
There is a direct correlation between the number of pulsesand the number concentration of particles (particle number pervolume). With the intensity of the pulse (i.e. height) andassumptions about the particle geometry, the particle sizethrough particle mass can be determined.
Aside from single pulses, there is always a background,which originates from the ionic part of the analyzed sample. Inaddition to primary particle size, information about the disso-lution rate of a NM sample can be achieved. While quantica-tion is more difficult, a qualitative assessment of ions releasedcan be inferred. For Al0, a broad distribution (Fig. 5, le) up to200 nm is observed compared to Al2O3 (Fig. 5, right). This tsvery well with the data obtained from TEM analysis. Comparedto the Au NIST reference material, which shows almost nodissolution, a higher background for Al0 NMs was detected,indicating potential ion release.
Particle surface – impact on dissolution in complex media
Al0 NMs usually become quickly passivated at the surface by theformation of an oxide layer. This event is likely to change thedissolution behavior and the overall physicochemical
Fig. 5 Top: primary particle size distribution of Al0 in 0.05% BSAdetermined by SP-ICP-MS; bottom: Primary particle size distributionof Al2O3 in 0.05% BSA determined by SP-ICP-MS.
This journal is © The Royal Society of Chemistry 2018

Paper RSC Advances
Ope
n A
cces
s A
rtic
le. P
ublis
hed
on 1
7 A
pril
2018
. Dow
nloa
ded
on 0
7/05
/201
8 13
:52:
49.
Thi
s ar
ticle
is li
cens
ed u
nder
a C
reat
ive
Com
mon
s A
ttrib
utio
n-N
onC
omm
erci
al 3
.0 U
npor
ted
Lic
ence
.View Article Online
characteristics of Al0 NMs. For comparison, we also investigatedAl2O3 particles of similar size. To prevent the surface oxidationof Al0 NMs, its processing and handling in an inert gas atmo-sphere was evaluated.
Investigation by XRD revealed a thin aluminum oxide layer atthe surface of the Al0 NMs (Fig. 6, le). This was conrmed byTEM measurements and has also already been shown in theliterature for another Al0 NM by TEM measurements (2.5 nmoxide layer).36 The occurrence of an oxide layer can be explainedby partial passivation of the material due to manufacturer'sprocessing.
In comparison with Al0 NMs, the diffractogram of Al2O3
particles showed clear differences (Fig. 6, right). The diffracto-gram of Al0 NMs showed a higher intensity for the aluminumpeaks, e.g. at 38�, 45�, 66� and 78� (Fig. 6, le) as compared toAl2O3 peaks, e.g. at 37�, 46� and 67� (Fig. 6, right). Thisdemonstrates that even though there is an Al oxide layer at thesurface of the Al NMs they are not completely oxidized.
To conrm these results, we used electron energy lossspectroscopy (EELS). Here the sample becomes exposed to anelectron beam with dened kinetic energy. Some electronsundergoing inelastic scattering are collected in a detector. Theloss of energy reects the chemical composition of the sample.
Fig. 7 (a): TEM picture of Al0 NMs, 200 k magnification; (b) oxygenmapping of left TEM picture; (c) Aluminum mapping of left TEMpicture. (d) TEM picture of Al2O3 NMs, 200 k magnification; (e)aluminummapping of left TEM picture; (f) oxygen mapping of left TEMpicture.
Fig. 6 Top: XR-diffractogram of Al0 NMs red: database entry for Al;blue; (green: database entry for Al2O3), space group: Fm3m, latticeconstants: a ¼ 4.0494 A; bottom: diffractogram of Al2O3 NMs (red:database entry for Al2O3), space group: Fd3m, lattice constants: a ¼7.906 A.
This journal is © The Royal Society of Chemistry 2018
Analysis of Al0 NMs in 0.05% BSA (Fig. 7a) revealed a core–shell structure. By means of EELS, it was proven that the shell isrich in oxygen (Fig. 7b), while the core consists of elementalaluminum (Fig. 7c). The TEM results indicate an oxide layer ofabout 2 to 5 nm.
Elemental mapping of Al2O3 NMs showed a quite differentpicture compared to pure Al0 NMs (Fig. 7d). The distribution ofaluminum and oxygen was homogenous over all NMs (Fig. 7eand f). These results show that Al2O3 NMs are fully oxidizedwhile elemental Al0 NMs were passivated by an oxide layer. It is
Table 2 Ion release of Al0 and Al2O3 NMs compared to recovery ofAlCl3 in 0.05% BSA and DMEM
Ion releasein BSA [%]
Ion release inDMEM [%]
Al0 NMs 10 mg ml�1 0.4 � 0.1 0.5 � 0.1100 mg ml�1 0.3 � 0.1 0.4 � 0.1
Al2O3 NMs 10 mg ml�1 0.4 � 0.1 1.4 � 0.1100 mg ml�1 0.2 � 0.1 0.4 � 0.1
AlCl3 10 mg ml�1 140 � 9 112 � 4100 mg ml�1 94 � 4 66 � 3
RSC Adv., 2018, 8, 14377–14388 | 14383

Fig. 8 IBM element analysis of NM103, NM104, Al and Al2O3 NMs. NMsas purchased and diluted in water (pure), NMs with albumin corona inH2O (BSA) and NMs under cell exposure conditions (DMEM). The graphdemonstrates the ratio of atoms of several elements compared to 100atoms of titanium or aluminum.
RSC Advances Paper
Ope
n A
cces
s A
rtic
le. P
ublis
hed
on 1
7 A
pril
2018
. Dow
nloa
ded
on 0
7/05
/201
8 13
:52:
49.
Thi
s ar
ticle
is li
cens
ed u
nder
a C
reat
ive
Com
mon
s A
ttrib
utio
n-N
onC
omm
erci
al 3
.0 U
npor
ted
Lic
ence
.View Article Online
also visible because Al0 NMs are dark grey to black, while Al2O3
NMs are white.The results from surface investigations via XRD and EELS
suggest a different solubility of Al0 compared to Al2O3. Indeed,the thin oxide layer on Al0 allows the release of ions while thefully oxidized Al2O3 particle should be much more inert.Nevertheless, due to the highly specic surface, a higher solu-bility compared to Al2O3 bulk material could be expected asmore potentially ion releasing Al atoms are present on thesurface.
Inuence of particle composition and impurity patterns
Compared to particle size and surface, the particle compositionhas a much higher impact on the solubility and dissolutionbehavior of NMs. One of the most widely used methods due toits high sensitivity, broad range for nearly all elements anddetection limits down to the sub-ppb level is the ICP-MS.Unknown samples can be not only detected but also quanti-ed. For more complex samples, microwave-assisted digestionprior to ICP-MS analysis could be performed. In this study, weconrmed the already known composition of the NMs by XRDand EELS measurements as well as ICP-MS analysis. For theassessment of particle toxicity, it is also important to takeimpurities into account which might alter ion release behavior.Due to element-specic mRBS and mPIXE, IBM became themethod of choice for these investigations. The main impuritiesof aluminum-containing NMs were phosphorus, sulfur andchlorine, which could lead to a different ion release comparedto pure materials (see Fig. S6†).
Fig. 9 ToF-SIMS reconstructed ion overlay image (500 mm � 500 mm)of Al NM (top) and Al2O3 (bottom) agglomerates of different chemicalentities from a DMEM solution; yellow: Al NM, purple: Al2O3 NM,green: aluminum(III)–serine; orange: phenylalanine aluminate; red:leucine aluminate; blue: polyoxo-aluminum complex.
Solubility investigations on Al0 and Al2O3 NMs
To verify our hypothesis that Al0 NMs are more soluble thanAl2O3, we performed ion release experiments in stock
14384 | RSC Adv., 2018, 8, 14377–14388
dispersions and DMEM. Adjusting the pH value was notnecessary due to almost neutral pH values of 7.3 in stockdispersion compared to 7.2 in DMEM. Keeping in mind thataluminum is an amphoteric material due to the aluminum aquacomplexes, one can assume that dissolution of Al0 NMs incomplex media is highly pH-dependent. Compared to an acid,the aluminum aqua complex reacts as a base and vice versa. Ata neutral pH value, reactivity is very low, thus only low ionrelease should occur. The possible aluminum aqua complexesat the different pH values are shown in Fig. S7.†
The ion release for both Al0 and Al2O3 NMs aer one hourwas very low, about 0.2–0.4% in BSA and 0.3–0.5% in DMEM(with 10% FCS) (Table 2). As already described above, this wasexpected at a neutral pH value. For in vitro experiments, this will
This journal is © The Royal Society of Chemistry 2018
Tab
le3
Mainch
arac
teriza
tiontech
niquesan
dtheirlim
itsa
Method
sTEM
EELS
-TEM
XRD
SAXS
SP-ICP-MS
ICP-MS
ToF
-SIM
SIBM,a
tom
num
ber%
CRM
Aluminum
Results
Prim
arypa
rticle
size
andsh
ape:
2–50
nm,
nearlysp
herical
Core–sh
ell
structure,
thin
(2–5
nm)
oxidelayer
Aluminum
surface;
partially
oxidized
Particle
radius
:>10
nm
Prim
arypa
rticle
size:5
4–80
nm
Ionrelease:
0.2–0.5%
Particle-amino
acid
agglom
erates
Impu
rities:P
(1%);biocoron
a:S(5%),protein;
adsorption
from
DMEM;
Ca 3(PO4) 2
coating:
P(3%)
Noda
taavailable
Limits
Noelem
ent-
specic
limits
Ligh
tcoreof
Al
hinde
rsde
tailed
measu
remen
ts
Noelem
ent-
specic
limits
Noelem
ent-
speciclimits
Nolimitskn
own;
resu
ltssh
owlimitof
54nm
Detection
limit
of10
mgg�
1
inDMEM
Noelem
ent-
speciclimits
From
Alto
higher
atom
icmass
Ram
anactive
molecules
Al 2O3
Results
Prim
arypa
rticle
size
andsh
ape:
10�
20–5
0nm,
grain-like
shap
e
Fully
oxidized
particle
Fully
oxidized
surface
Prim
arypa
rticle
radius
:7.1
nm
aggregates'
radius
:>10
nm
Prim
arypa
rticle
size:5
0–80
nm
Ionrelease:
0.2–0.4%
Particle-amino
acid
agglom
erates;
polyoxo-
alum
inates
Impu
rities:S
(0.2%);
biocoron
a:S
(1%),protein
adsorption
from
DMEM;
Ca 3(PO4) 2
coating:
P(1%)
Noda
taavailable
Limits
Noelem
ent-
specic
limits
Ligh
tcoreof
Al
hinde
rsde
tailed
measu
remen
ts
Noelem
ent-
specic
limits
Noelem
ent-
speciclimits
Nolimitskn
own;
resu
ltssh
owlimitof
50nm
Detection
limit
of10
ngg�
1
inDMEM
Noelem
ent-
speciclimits
From
Alto
higher
atom
icmass
Ram
anactive
molecules
TiO
2NM10
3Results
Prim
arypa
rticle
size
and
shap
e:20
–10
0nm,n
early
spherical
b
Nodata
available
Rutile;
crystallite
size:2
0nm
bGyration
diam
eter:
26nm
b
Prim
arypa
rticle
size:6
0–10
0nm
Nosolubility
inBSA
,low
solublein
DMEM
b
Particle-amino
acid
agglom
erates
Impu
rities:A
l(7%),S(0.6%);
biocoron
a:S
(0.5%),protein;
exch
ange
inDMEM;
Ca 3(PO4) 2
coating:
P(0.5%)
Decreaseof
aliphatic/
arom
atic
compo
unds
onNM
surface;
higher
protein
exch
ange
inDMEM
Limits
Noelem
ent-
speciclimits
Noelem
ent-
speciclimits
Noelem
ent-
speciclimits
Noelem
ent-
speciclimits
Limitof
�90
nm
39
Detection
limitof
7.5ngg�
1in
DMEM
Noelem
ent-
speciclimits
From
Alto
higher
atom
icmass
Ram
anactive
molecules
TiO
2NM10
4Results
Prim
arypa
rticle
size
and
shap
e:10
–50
nm,n
early
spherical
Noda
taavailable
Rutile;
crystallite
size:2
1nm
bGyration
diam
eter:
26nm
b
Prim
arypa
rticle
size:6
0–10
0nm
Nosolubility
in BSA
,low
soluble
inDMEM
b
Particle-amino
acid
agglom
erates
Impu
rities:A
l(6%),S(0.7%);
biocoron
a:S
(1%);protein;
exch
ange
inDMEM;
Ca 3(PO4) 2
coating:
P(0.8%)
Decreaseof
aliphatic/
arom
atic
compo
unds
onNM
surface;
higher
protein
exch
ange
inDMEM
This journal is © The Royal Society of Chemistry 2018 RSC Adv., 2018, 8, 14377–14388 | 14385
Paper RSC Advances
Ope
n A
cces
s A
rtic
le. P
ublis
hed
on 1
7 A
pril
2018
. Dow
nloa
ded
on 0
7/05
/201
8 13
:52:
49.
Thi
s ar
ticle
is li
cens
ed u
nder
a C
reat
ive
Com
mon
s A
ttrib
utio
n-N
onC
omm
erci
al 3
.0 U
npor
ted
Lic
ence
.View Article Online

Tab
le3
(Contd.)
Method
sTEM
EELS
-TEM
XRD
SAXS
SP-ICP-MS
ICP-MS
ToF
-SIM
SIBM,a
tom
num
ber%
CRM
Limits
Noelem
ent-
speciclimits
Noelem
ent-
speciclimits
Noelem
ent-
speciclimits
Noelem
ent-
speciclimits
Limitof
�90
nm
39
Detection
limitof
7.5ngg�
1
inDMEM
Noelem
ent-
speciclimits
From
Alto
higher
atom
icmass
Ram
anactive
molecules
Gen
eral
limits
1nm
to2mm;
only
dried
samples
Organ
icmatrix
contaminates
sample
Onlypo
wde
ran
dcrystallite
samples
r¼
0.5–30
nm
(dep
endingon
theavailableq-
range)
Only
highly
dilutedsamples,
limits:Au10
nm,
Ag20
nm
Subngg�
1
levelfor
most
elem
ents
Nosingle
particlesvisible,
only
agglom
erates
Onlydrysamples
unde
rvacu
umcondition
,de
tectionlimit:
fewpp
m
Only
raman
active
molecules
observab
le
aAbb
reviations:
TEM
–tran
smission
electron
microscop
y;EELS
–electron
energy
loss
spectroscopy
;XRD
–X-ray
diffraction;S
AXS–sm
allan
gleX-ray
scattering;
SP-ICP-MS–single
particleindu
ctivelycoup
ledplasmamasssp
ectrom
etry;ICP-MS–indu
ctivelycoup
ledplasmamasssp
ectrom
etry;T
oF-SIM
S–timeof
ightm
asssp
ectrom
etry;IBM
–Ionbe
ammicroscop
y;CRM
–confocalRam
anmicroscop
y;BSA
–bo
vineserum
albu
min;D
MEM
–Dulbe
cco'smod
ied
eaglemed
ium;p
pm–pa
rtspe
rmillion
.bDatatake
nfrom
(ref.3
0).
14386 | RSC Adv., 2018, 8, 14377–14388
RSC Advances Paper
Ope
n A
cces
s A
rtic
le. P
ublis
hed
on 1
7 A
pril
2018
. Dow
nloa
ded
on 0
7/05
/201
8 13
:52:
49.
Thi
s ar
ticle
is li
cens
ed u
nder
a C
reat
ive
Com
mon
s A
ttrib
utio
n-N
onC
omm
erci
al 3
.0 U
npor
ted
Lic
ence
.View Article Online
mean that the effects will originate mainly from particles andnot from Al ions. The application of an articial digestionprocedure for mimicking in vivo situation showed, that theparticle dissolution and complexation behavior was quitedifferent in all three studied gastrointestinal compartments.24
Aer no signicant changes in the saliva, the gastric environ-ment leads to a signicant increase of the dissolution rate aswell as very strong agglomeration of NMs. The addition ofintestinal uid results in a nearly neutral pH value which leadsto a decrease in the dissolution rate, a deagglomeration ofparticles and even de novo particle formation in ionic aluminumcontrol.
Particle-CCM interactions
It is of major interest to evaluate the elemental and molecularchanges on the particle surface during sample preparation forcell experiments (Fig. S8 and S9†). Additionally, two steps werechosen to investigate the surface modication of particlesduring the sample preparation process. Firstly, the NMs weredispersed. In this step, NMs were covered with albumin coronaand are referred to as “BSA” in the text below. The second stepwas to investigate the NMs under cell culture conditions,diluted in DMEM. Aer each step, the particles were washedthree times in Millipore water. The results of the elementanalysis, performed by IBM, are shown in Fig. 8.
The variation of the element content represents changes onthe surface of NMs, e.g. attachment of amino acids, fatty acids,proteins and/or ions to the surface of the NMs. An increase inthe Ca and P amount was observed for all studied NMs exposedto DMEM. The highest content of these elements was found inthe case of Al NMs. It is suggested that calcium and phosphateions interact strongly with the albumin corona of NMs andbuild a calcium phosphate layer on the particle surface. It isknown that calcium phosphate has a high affinity to proteinsand can increase the efficiency of uptake.37,38
The amount of sulfur on the NMs was analyzed underdifferent conditions. Sulfur was found in association withproteins forming a corona around the NMs. Al and Al2O3 NMsacquire more proteins on their surface when exposed to DMEMas compared to dispersion in 0.05% BSA (Fig. S11†). In the caseof Al and Al2O3, the proteins from the culture mediumcontribute to additional adsorption compared to the existingalbumin corona of the particles alone. DMEM shows morephysiologic relevant conditions. The salts might induceshielding effects on the protein, so the amount of proteins islikely to be increased. Due to the larger variety of availableproteins, a more complex corona will self-assemble on thesurface of the particles. In contrast, a decreased amount ofproteins was found in the case of NM103 and 104 NMs exposedto DMEM. Substitution of the relatively dense BSA on theparticle surface with less dense proteins from the culture mediais suggested. This exchange of proteins has a stabilizing effecton TiO2 NMs in DMEM and results in a strong decrease ofaggregate size in DMEM media (Table 1). This nding is alsosupported by CRM investigations (Fig. S10†).
This journal is © The Royal Society of Chemistry 2018
Paper RSC Advances
Ope
n A
cces
s A
rtic
le. P
ublis
hed
on 1
7 A
pril
2018
. Dow
nloa
ded
on 0
7/05
/201
8 13
:52:
49.
Thi
s ar
ticle
is li
cens
ed u
nder
a C
reat
ive
Com
mon
s A
ttrib
utio
n-N
onC
omm
erci
al 3
.0 U
npor
ted
Lic
ence
.View Article Online
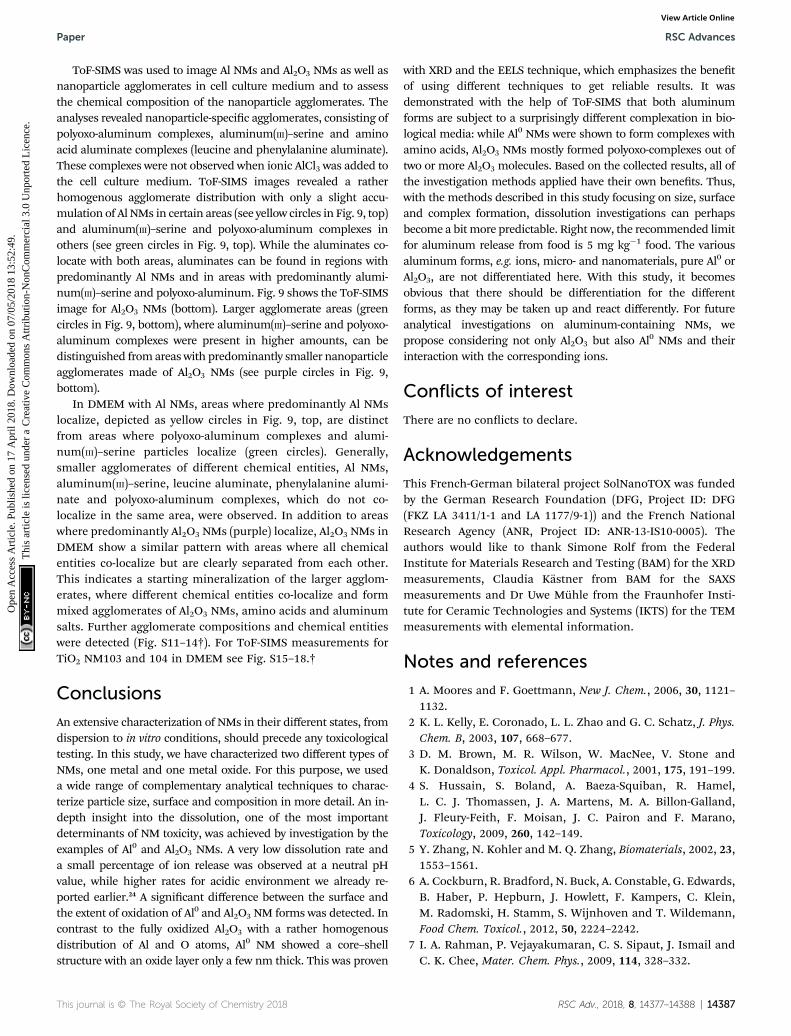
ToF-SIMS was used to image Al NMs and Al2O3 NMs as well asnanoparticle agglomerates in cell culture medium and to assessthe chemical composition of the nanoparticle agglomerates. Theanalyses revealed nanoparticle-specic agglomerates, consisting ofpolyoxo-aluminum complexes, aluminum(III)–serine and aminoacid aluminate complexes (leucine and phenylalanine aluminate).These complexes were not observed when ionic AlCl3 was added tothe cell culture medium. ToF-SIMS images revealed a ratherhomogenous agglomerate distribution with only a slight accu-mulation of Al NMs in certain areas (see yellow circles in Fig. 9, top)and aluminum(III)–serine and polyoxo-aluminum complexes inothers (see green circles in Fig. 9, top). While the aluminates co-locate with both areas, aluminates can be found in regions withpredominantly Al NMs and in areas with predominantly alumi-num(III)–serine and polyoxo-aluminum. Fig. 9 shows the ToF-SIMSimage for Al2O3 NMs (bottom). Larger agglomerate areas (greencircles in Fig. 9, bottom), where aluminum(III)–serine and polyoxo-aluminum complexes were present in higher amounts, can bedistinguished from areas with predominantly smaller nanoparticleagglomerates made of Al2O3 NMs (see purple circles in Fig. 9,bottom).
In DMEM with Al NMs, areas where predominantly Al NMslocalize, depicted as yellow circles in Fig. 9, top, are distinctfrom areas where polyoxo-aluminum complexes and alumi-num(III)–serine particles localize (green circles). Generally,smaller agglomerates of different chemical entities, Al NMs,aluminum(III)–serine, leucine aluminate, phenylalanine alumi-nate and polyoxo-aluminum complexes, which do not co-localize in the same area, were observed. In addition to areaswhere predominantly Al2O3 NMs (purple) localize, Al2O3 NMs inDMEM show a similar pattern with areas where all chemicalentities co-localize but are clearly separated from each other.This indicates a starting mineralization of the larger agglom-erates, where different chemical entities co-localize and formmixed agglomerates of Al2O3 NMs, amino acids and aluminumsalts. Further agglomerate compositions and chemical entitieswere detected (Fig. S11–14†). For ToF-SIMS measurements forTiO2 NM103 and 104 in DMEM see Fig. S15–18.†
Conclusions
An extensive characterization of NMs in their different states, fromdispersion to in vitro conditions, should precede any toxicologicaltesting. In this study, we have characterized two different types ofNMs, one metal and one metal oxide. For this purpose, we useda wide range of complementary analytical techniques to charac-terize particle size, surface and composition in more detail. An in-depth insight into the dissolution, one of the most importantdeterminants of NM toxicity, was achieved by investigation by theexamples of Al0 and Al2O3 NMs. A very low dissolution rate anda small percentage of ion release was observed at a neutral pHvalue, while higher rates for acidic environment we already re-ported earlier.24 A signicant difference between the surface andthe extent of oxidation of Al0 and Al2O3 NM forms was detected. Incontrast to the fully oxidized Al2O3 with a rather homogenousdistribution of Al and O atoms, Al0 NM showed a core–shellstructure with an oxide layer only a few nm thick. This was proven
This journal is © The Royal Society of Chemistry 2018
with XRD and the EELS technique, which emphasizes the benetof using different techniques to get reliable results. It wasdemonstrated with the help of ToF-SIMS that both aluminumforms are subject to a surprisingly different complexation in bio-logical media: while Al0 NMs were shown to form complexes withamino acids, Al2O3 NMs mostly formed polyoxo-complexes out oftwo or more Al2O3 molecules. Based on the collected results, all ofthe investigation methods applied have their own benets. Thus,with the methods described in this study focusing on size, surfaceand complex formation, dissolution investigations can perhapsbecome a bit more predictable. Right now, the recommended limitfor aluminum release from food is 5 mg kg�1 food. The variousaluminum forms, e.g. ions, micro- and nanomaterials, pure Al0 orAl2O3, are not differentiated here. With this study, it becomesobvious that there should be differentiation for the differentforms, as they may be taken up and react differently. For futureanalytical investigations on aluminum-containing NMs, wepropose considering not only Al2O3 but also Al0 NMs and theirinteraction with the corresponding ions.
Conflicts of interest
There are no conicts to declare.
Acknowledgements
This French-German bilateral project SolNanoTOX was fundedby the German Research Foundation (DFG, Project ID: DFG(FKZ LA 3411/1-1 and LA 1177/9-1)) and the French NationalResearch Agency (ANR, Project ID: ANR-13-IS10-0005). Theauthors would like to thank Simone Rolf from the FederalInstitute for Materials Research and Testing (BAM) for the XRDmeasurements, Claudia Kastner from BAM for the SAXSmeasurements and Dr Uwe Muhle from the Fraunhofer Insti-tute for Ceramic Technologies and Systems (IKTS) for the TEMmeasurements with elemental information.
Notes and references
1 A. Moores and F. Goettmann, New J. Chem., 2006, 30, 1121–1132.
2 K. L. Kelly, E. Coronado, L. L. Zhao and G. C. Schatz, J. Phys.Chem. B, 2003, 107, 668–677.
3 D. M. Brown, M. R. Wilson, W. MacNee, V. Stone andK. Donaldson, Toxicol. Appl. Pharmacol., 2001, 175, 191–199.
4 S. Hussain, S. Boland, A. Baeza-Squiban, R. Hamel,L. C. J. Thomassen, J. A. Martens, M. A. Billon-Galland,J. Fleury-Feith, F. Moisan, J. C. Pairon and F. Marano,Toxicology, 2009, 260, 142–149.
5 Y. Zhang, N. Kohler and M. Q. Zhang, Biomaterials, 2002, 23,1553–1561.
6 A. Cockburn, R. Bradford, N. Buck, A. Constable, G. Edwards,B. Haber, P. Hepburn, J. Howlett, F. Kampers, C. Klein,M. Radomski, H. Stamm, S. Wijnhoven and T. Wildemann,Food Chem. Toxicol., 2012, 50, 2224–2242.
7 I. A. Rahman, P. Vejayakumaran, C. S. Sipaut, J. Ismail andC. K. Chee, Mater. Chem. Phys., 2009, 114, 328–332.
RSC Adv., 2018, 8, 14377–14388 | 14387

RSC Advances Paper
Ope
n A
cces
s A
rtic
le. P
ublis
hed
on 1
7 A
pril
2018
. Dow
nloa
ded
on 0
7/05
/201
8 13
:52:
49.
Thi
s ar
ticle
is li
cens
ed u
nder
a C
reat
ive
Com
mon
s A
ttrib
utio
n-N
onC
omm
erci
al 3
.0 U
npor
ted
Lic
ence
.View Article Online
8 S. E. A. Gratton, P. A. Ropp, P. D. Pohlhaus, J. C. Lu,V. J. Madden, M. E. Napier and J. M. DeSimone, Proc. Natl.Acad. Sci. U. S. A., 2008, 105, 11613–11618.
9 Y. Zhou and M. Antonietti, J. Am. Chem. Soc., 2003, 125,14960–14961.
10 S. K. Das, M. K. Bhunia and A. Bhaumik, Dalton Trans., 2010,39, 4382–4390.
11 Z. Q. Sun, T. Liao, L. Y. Sheng, L. Z. Kou, J. H. Kim andS. X. Dou, Chem.–Eur. J., 2016, 22, 11357–11364.
12 X. N. Ren, L. Wu, J. Jin, J. Liu, Z. Y. Hu, Y. Li, T. Hasan,X. Y. Yang, G. Van Tendeloo and B. L. Su, RSC Adv., 2016,6, 26856–26862.
13 M. Moreno-Horn and T. Gebel, Crit. Rev. Toxicol., 2014, 44,849–875.
14 J. X. Wang, G. Q. Zhou, C. Y. Chen, H. W. Yu, T. C. Wang,Y. M. Ma, G. Jia, Y. X. Gao, B. Li, J. Sun, Y. F. Li, F. Jiao,Y. L. Zhao and Z. F. Chai, Toxicol. Lett., 2007, 168, 176–185.
15 E. J. Park, H. Kim, Y. Kim and K. Choi, Toxicol. Environ.Chem., 2011, 93, 120–133.
16 Y. R. Kim, S. Y. Lee, E. J. Lee, S. H. Park, N. W. Seong,H. S. Seo, S. S. Shin, S. J. Kim, E. H. Meang, M. K. Park,M. S. Kim, C. S. Kim, S. K. Kim, S. W. Son, Y. R. Seo,B. H. Kang, B. S. Han, S. S. Aan, B. J. Lee and M. K. Kim,Int. J. Nanomed., 2014, 9, 67–78.
17 K. Loeschner, N. Hadrup, K. Qvortrup, A. Larsen, X. Y. Gao,U. Vogel, A. Mortensen, H. R. Lam and E. H. Larsen, Part.Fibre Toxicol., 2011, 8, 18.
18 J. H. E. Arts, M. Hadi, A. M. Keene, R. Kreiling, D. Lyon,M. Maier, K. Michel, T. Petry, U. G. Sauer, D. Warheit,K. Wiench and R. Landsiedel, Regul. Toxicol. Pharmacol.,2014, 70, 492–506.
19 A. R. Collins, B. Annangi, L. Rubio, R. Marcos, M. Dorn,C. Merker, I. Estrela-Lopis, M. R. Cimpan, M. Ibrahim,E. Cimpan, M. Ostermann, A. Sauter, N. E. Yamani,S. Shaposhnikov, S. Chevillard, V. Paget, R. Grall, J. Delic,F. G. de-Cerio, B. Suarez-Merino, V. Fessard,K. N. Hogeveen, L. M. Fjellsbo, E. R. Pran, T. Brzicova,J. Topinka, M. J. Silva, P. E. Leite, A. R. Ribeiro,J. M. Granjeiro, R. Grafstrom, A. Prina-Mello andM. Dusinska, Wiley Interdiscip. Rev.: Nanomed.Nanobiotechnol., 2017, 9, e1413.
20 P. Laux, C. Riebeling, A. M. Booth, J. D. Brain, J. Brunner,C. Cerrillo, O. Creutzenberg, I. Estrela-Lopis, T. Gebel,G. Johanson, H. Jungnickel, H. Kock, J. Tentschert, A. Tlili,A. Schaffer, A. J. A. M. Sips, R. A. Yokel and A. Luch,NanoImpact, 2017, 6, 69–80.
21 J. M. Cohen, J. G. Teeguarden and P. Demokritou, Part. FibreToxicol., 2014, 11, 20.
22 S. Dekkers, A. G. Oomen, E. A. J. Bleeker, R. J. Vandebriel,C. Micheletti, J. Cabellos, G. Janer, N. Fuentes, S. Vazquez-Campos, T. Borges, M. J. Silva, A. Prina-Mello, D. Movia,F. Nesslany, A. R. Ribeiro, P. E. Leite, M. Groenewold,F. R. Cassee, A. J. A. M. Sips, A. Dijkzeul, T. vanTeunenbroek and S. W. P. Wijnhoven, Regul. Toxicol.Pharmacol., 2016, 80, 46–59.
23 A. D. Maynard, R. J. Aitken, T. Butz, V. Colvin, K. Donaldson,G. Oberdorster, M. A. Philbert, J. Ryan, A. Seaton, V. Stone,
14388 | RSC Adv., 2018, 8, 14377–14388
S. S. Tinkle, L. Tran, N. J. Walker and D. B. Warheit,Nature, 2006, 444, 267–269.
24 H. Sieg, C. Kastner, B. Krause, T. Meyer, A. Burel, L. Bohmert,D. Lichtenstein, H. Jungnickel, J. Tentschert, P. Laux,A. Braeuning, I. Estrela-Lopis, F. Gauffre, V. Fessard,J. Meijer, A. Luch, A. F. Thunemann and A. Lampen,Langmuir, 2017, 33, 10726–10735.
25 J. M. Zook, S. E. Long, D. Cleveland, C. L. A. Geronimo andR. I. MacCuspie, Anal. Bioanal. Chem., 2011, 401, 1993–2002.
26 K. Loza, J. Diendorf, C. Sengstock, L. Ruiz-Gonzalez,J. M. Gonzalez-Calbet, M. Vallet-Regi, M. Koller andM. Epple, J. Mater. Chem. B, 2014, 2, 1634–1643.
27 Z. Y. Wang, A. von dem Bussche, P. K. Kabadi, A. B. Kane andR. H. Hurt, ACS Nano, 2013, 7, 8715–8727.
28 A. M. Tavares, H. Louro, S. Antunes, S. Quarre, S. Simar,P. J. De Temmerman, E. Verleysen, J. Mast, K. A. Jensen,H. Norppa, F. Nesslany and M. J. Silva, Toxicol. in Vitro,2014, 28, 60–69.
29 H. E. Pace, N. J. Rogers, C. Jarolimek, V. A. Coleman,C. P. Higgins and J. F. Ranville, Anal. Chem., 2011, 83,9361–9369.
30 K. Rasmussen, J. Mast, P. J. de Temmerman, E. Verleysen,N. Wegeneers, F. van Steen, J. C. Pizzolon, L. deTemmerman, E. van Doren, K. A. Jensen, R. Birkedal,M. Levin, S. H. Nielsen, I. K. Koponen, P. A. Clausen,V. Kofored-Sørensen, Y. Kembouche, N. Thieriet, O. Spalla,C. Giuot, D. Rousset, O. Witschger, S. Bau, B. Bianchi,C. Motzkus, B. Shivachev, L. Dimowa, R. Nikolova,D. Nihtianova, M. Tarassov, O. Petrov, S. Bakardjieva,D. Gilliland, F. Pianella, G. Ceccone, V. Spampinato,G. Cotogno, P. Gibson, C. Gaillard and A. Mech, JRCScience and Policy Reports, 2014, http://publications.jrc.ec.europa.eu/repository/handle/JRC86291.
31 M. Naiim, A. Boualem, C. Ferre, M. Jabloun, A. Jalocha andP. Ravier, So Matter, 2015, 11, 28–32.
32 P. A. Hassan and S. K. Kulshreshtha, J. Colloid Interface Sci.,2006, 300, 744–748.
33 R. D. Deegan, O. Bakajin, T. F. Dupont, G. Huber, S. R. Nageland T. A. Witten, Nature, 1997, 389, 827–829.
34 P. J. De Temmerman, E. Van Doren, E. Verleysen, Y. Van derStede, M. A. D. Francisco and J. Mast, J. Nanobiotechnol.,2012, 10, 24.
35 P. Muneesawang and C. Sirisathitkul, J. Nanomater., 2015,2015, 8.
36 R. J. Griffitt, A. Feswick, R. Weil, K. Hyndman, P. Carpinone,K. Powers, N. D. Denslow and D. S. Barber, Environ. Toxicol.,2011, 26, 541–551.
37 T. T. Morgan, H. S. Muddana, E. I. Altinoglu, S. M. Rouse,A. Tabakovic, T. Tabouillot, T. J. Russin,S. S. Shanmugavelandy, P. J. Butler, P. C. Eklund,J. K. Yun, M. Kester and J. H. Adair, Nano Lett., 2008, 8,4108–4115.
38 G. Dordelmann, D. Kozlova, S. Karczewski, R. Lizio,S. Knauer and M. Epple, J. Mater. Chem. B, 2014, 2, 7250–7259.
39 S. Lee, X. Y. Bi, R. B. Reed, J. F. Ranville, P. Herckes andP. Westerhoff, Environ. Sci. Technol., 2014, 48, 10291–10300.
This journal is © The Royal Society of Chemistry 2018