Characterization of a resistance locus to coffee leaf rust ... · Figure I. 14 Quadratic diagram...
228
UNIVERSITE MONTPELLIER II SCIENCES ET TECHINIQUES DU LANGUEDOC THESE Présentée pour l‘obtention du titre de Docteur en Sciences de l’Université Montpellier II Formation Doctorale : Biologie Intégrative des Plantes Ecole Doctorale : SIBAGHE – Systèmes Intégrés en Biologie, Agronomie, Géosciences, Hydro sciences et Environnement par Alessandra Ferreira RIBAS Characterization of a resistance locus to coffee leaf rust (Hemileia vastratrix) in coffee trees: genomic organization, diversity and development of tools for functional gene validation Soutenue publiquement devant le jury composé de, Mme Françoise ADAN-BLONDON (INRA), Rapporteur Mme Valérie GEFFROY (INRA), Examinatrice M. Emmanuel DOUZERY (UM2), Examinateur M. Gilles PILATE (INRA), Rapporteur M. Hervé ETIENNE (CIRAD), Co-Directeur de thèse M. Philippe LASHERMES (IRD), Co-Directeur de thèse
Transcript of Characterization of a resistance locus to coffee leaf rust ... · Figure I. 14 Quadratic diagram...

UNIVERSITE MONTPELLIER II
SCIENCES ET TECHINIQUES DU LANGUEDOC
THESE
Présentée pour l‘obtention du titre de
Docteur en Sciences de l’Université Montpellier II
Formation Doctorale : Biologie Intégrative des Plantes
Ecole Doctorale : SIBAGHE – Systèmes Intégrés en Biologie, Agronomie,
Géosciences, Hydro sciences et Environnement
par
Alessandra Ferreira RIBAS
Characterization of a resistance locus to coffee leaf rust (Hemileia
vastratrix) in coffee trees: genomic organization, diversity and
development of tools for functional gene validation
Soutenue publiquement devant le jury composé de,
Mme Françoise ADAN-BLONDON (INRA), Rapporteur
Mme Valérie GEFFROY (INRA), Examinatrice
M. Emmanuel DOUZERY (UM2), Examinateur
M. Gilles PILATE (INRA), Rapporteur
M. Hervé ETIENNE (CIRAD), Co-Directeur de thèse
M. Philippe LASHERMES (IRD), Co-Directeur de thèse

ABREVIATIONS
BAC Bacterial Artificial Chromosome
6-BA: 6-benzylaminopurine
CaMV: cauliflower mosaic virus
CC Coiled-Coil
CGA candidate gene approach
CG candidate gene
CLR Coffee Leaf Rust
CP medium: callus proliferation medium
DNA Deoxyribonucleic acid
2,4-D: 2,4-dichlorophenoxyacetic acid
ECP medium: embryogenic callus production medium
ETI Effector-Triggered Immunity
ETS Effector-Triggered Susceptibility
GFP Green Fluorescent Protein
HR Hypersensitive Response
HPTII hygromycin phosphotransferase II
i.e. id est
Ka non-synonymous substitutions
Ks synonymous substitutions
LRR Leucine-Rich Repeats
LTR Long Terminal Repeat
M medium: maturation medium
MAMP Microbe-Associated Molecular Pattern
MAS market assisted selection
NBS Nucleotide-Binding site
NPTII Neomycin Phosphotransferase III
OD: optical density
PAMP Pathogen-Associated Molecular Pattern
PCR Polymerase Chain Reaction
PEMs: proembryogenic masses
PTI PAMP-Triggered Immunity
QTL Quantitative-Trait Locus
R: regeneration medium
RLK Receptor-Like Kinase
RLP Receptor-Like Protein
SD: standard deviation
SNP single nucleotide polymorphism
TAIR: the Arabidopsis information resources
TIR Toll and Interleukin-1 Receptor

SUMMARY
LIST OF FIGURES .................................................................................................................... 7
LIST OF TABLES .................................................................................................................... 11
General Introduction ................................................................................................................ 13
CHAPTER I ............................................................................................................................... 14
LITERATURE REVIEW ......................................................................................................... 14
PART I ....................................................................................................................................... 15
1. Generalities about Coffee ................................................................................................. 15
1.1 Coffee consumption, cultivation and economical trade .................................................... 15
1.2 Coffee taxonomy ............................................................................................................... 16
1.3 Characteristics of cultivated coffee species ....................................................................... 19
1.4 Cytological aspects of Coffea ............................................................................................ 22
1.5 Speciation and genome features of C. arabica .................................................................. 22
1.6 Coffee arabica genetic diversity and breeding .................................................................. 23
1.7 Interspecific hybridization and coffee introgression ......................................................... 26
2. Coffee leaf rust: the main coffee disease ............................................................................. 28
2.1 The genus Hemileia ........................................................................................................... 28
2.2 Coffee leaf rust (CLR) symptoms ..................................................................................... 29
2.3 CLR epidemic ................................................................................................................... 31
2.4 Disease Management......................................................................................................... 32
2.4.1 Chemical control ........................................................................................................ 33
2.4.2 Biological control ....................................................................................................... 33
2.5.1 CLR resistance genes ................................................................................................. 35
2.5.2 Physiological races of Hemileia vastatrix .................................................................. 36
3. Identification of molecular markers associated to CLR .................................................... 39
3.1 Partial resistance to CLR ................................................................................................... 41
PART II ...................................................................................................................................... 42

1. Mechanisms of disease resistance in plants ..................................................................... 42
1.1 Non host resistance............................................................................................................ 42
1.1.1 PAMP/MAMP-triggered immunity (PTI/MTI) ......................................................... 44
1.2 Host resistance (Effector-Triggered Immunity (ETI)) ...................................................... 45
2. Modes of plant-pathogen interaction ............................................................................... 49
2.1 Direct Interaction .............................................................................................................. 49
2.2 The Guard Model (indirect R-Avr) interactions ................................................................ 50
2.3 Decoy model ..................................................................................................................... 51
3. Avirulence genes (effectors) .............................................................................................. 53
4. Resistance Genes (R genes) ............................................................................................... 54
4.1 Classes of Resistance Gene ............................................................................................... 58
4.1.1 RLP and RLK class of R genes .................................................................................. 58
4.2.1 The function of main domains in NB-LRR proteins .................................................. 61
5. How NBS-LRR proteins recognize pathogens and activate defense responses? ......... 66
6. Expression of R proteins ................................................................................................... 67
7. Plant-pathogen co evolution ............................................................................................. 68
7.1 Evolution of R genes at plant population level ................................................................. 68
7.2 Evolutionary patterns R genes clusters ............................................................................. 71
8. Wide genome analysis of NBS-LRR encoding genes ...................................................... 72
8.1 Organization of NBS-LRR genes into plant genomes ...................................................... 75
9. Mechanisms of R-genes diversification ........................................................................... 77
9.1 Duplication ........................................................................................................................ 79
9.1.1 Duplication by polyploidization ................................................................................. 79
9.2 Sequence recombination ................................................................................................... 81
9.3 Selection ............................................................................................................................ 82
9.4 Other mechanisms that contributed to generate R gene diversification ............................ 84
10. Patterns of R gene function .......................................................................................... 86
11. Comparative analysis of R genes ................................................................................. 88
PART III .................................................................................................................................... 91

1. Identification of candidate genes...................................................................................... 91
1.1 Identification of CG genes based on genomic synteny ..................................................... 91
1.2 Identification of CG using positional cloning strategy ..................................................... 93
2. Functional validation of CG ............................................................................................. 95
2.1 RNA interference .............................................................................................................. 95
2.2 Chemical mutagenesis ....................................................................................................... 96
2.3 Transformation by Agrobacterium .................................................................................... 97
3. Genetic transformation of woody plants ......................................................................... 97
3.1 Genetic transformation of coffee plants .......................................................................... 100
Objectives ................................................................................................................................. 103
CHAPTER II ........................................................................................................................... 105
Genetic and physical mapping of the SH3 region that confers resistance to leaf rust in
coffee tree (Coffea arabica L.) ................................................................................................ 106
ABSTRACT .......................................................................................................................... 106
INTRODUCTION ................................................................................................................. 106
MATERIALS AND METHODS .......................................................................................... 108
RESULTS ............................................................................................................................. 110
DISCUSSION ....................................................................................................................... 117
CHAPTER III .......................................................................................................................... 120
Organization and molecular evolution of a disease-resistance gene cluster in coffee trees
................................................................................................................................................... 121
ABSTRACT .......................................................................................................................... 121
BACKGROUND ................................................................................................................... 122
RESULTS ............................................................................................................................. 124
DISCUSSION ....................................................................................................................... 135
CONCLUSIONS ................................................................................................................... 138
MATERIALS AND METHODS .......................................................................................... 138
CHAPTER IV .......................................................................................................................... 144
Agrobacterium-mediated transformation of Coffea arabica (L.) is highly enhanced by using
long-term maintained embryogenic callus ............................................................................ 145

ABSTRACT .......................................................................................................................... 145
BACKGROUND ................................................................................................................... 146
RESULTS ............................................................................................................................. 148
DISCUSSION ....................................................................................................................... 160
CONCLUSIONS ................................................................................................................... 163
METHODS ........................................................................................................................... 163
CHAPTER V ........................................................................................................................... 168
Identification and functional validation of candidate genes to CLR .................................. 169
PART I. .................................................................................................................................... 170
Estimate of SH3-CNL gene members in the resistant cultivar ............................................ 170
PART II .................................................................................................................................... 175
Cloning SH3-CNL candidate genes to CLR resistance ......................................................... 175
PART III .................................................................................................................................. 178
Construction of expression vectors and functional gene validation ................................... 178
CHAPTER VI .......................................................................................................................... 187
General Discussion and Perspectives ..................................................................................... 188
References ................................................................................................................................ 198

LIST OF FIGURES
CHAPTER I
Figure I. 1 Major countries producers of coffee. Top ten coffee producers are shown in yellow ............. 16
Figure I. 2 Position of genus Coffea on the angiosperms phylogeny. Modified from:
(http://www.mobot.org/mobot/research/APweb) ............................................................................... 17
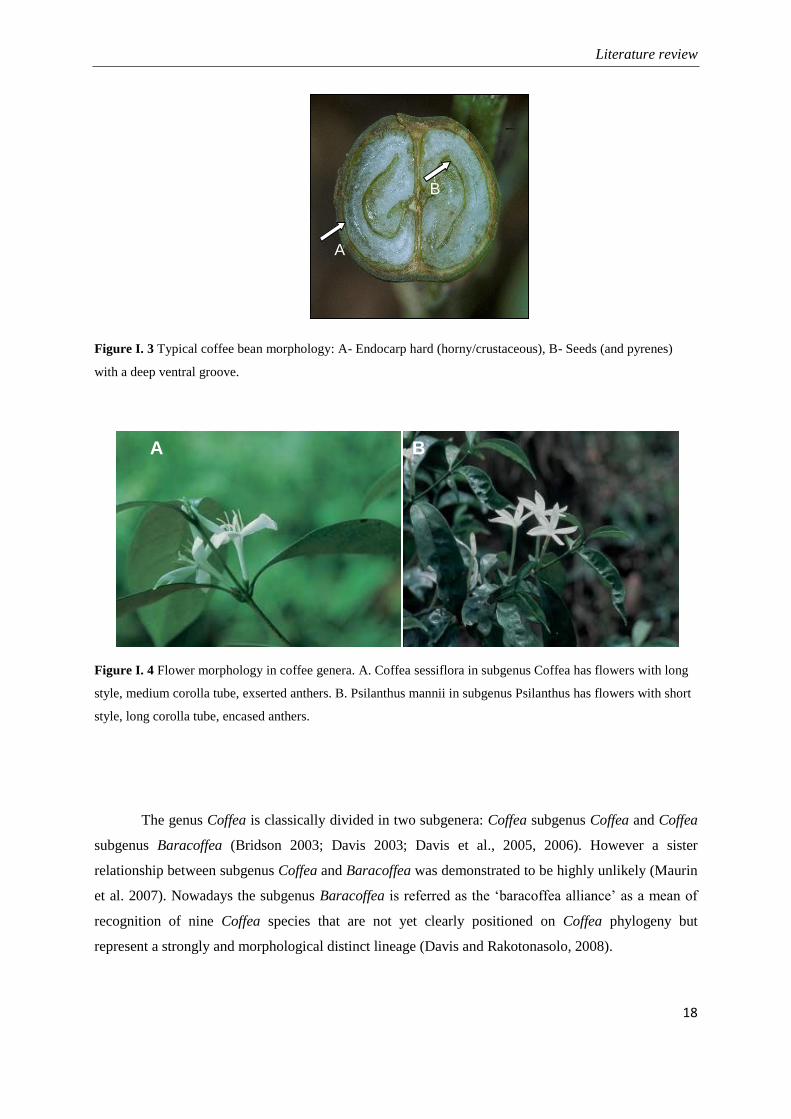
Figure I. 3 Typical coffee bean morphology: A- Endocarp hard (horny/crustaceous), B- Seeds (and
pyrenes) with a deep ventral groove. ................................................................................................. 18
Figure I. 4 Flower morphology in coffee genera. A. Coffea sessiflora in subgenus Coffea has flowers
with long style, medium corolla tube, exserted anthers. B. Psilanthus mannii in subgenus Psilanthus
has flowers with short style, long corolla tube, encased anthers........................................................ 18
Figure I. 5 Coffea arabica tree with cherry beans. From: Leo Junior, Incaper ES .................................... 20
Figure I. 6 Genetic origin of allotetraploid C. arabica. Natural hybridization between C. eugenioides as
female parent and C. canephora as male parent originated the C. arabica species (Lashermes et al.,
1999). ................................................................................................................................................. 24
Figure I. 7 Triploid and tetraploid strategies of gene introgression from diploid coffee species into C.
arabica genome (Lashermes et al., 2000). ......................................................................................... 28
Figure I. 8 Urediniospores of Hemileia vastatrix. Photo from: Liberato JR & Silva MC (2006). Available
online: http://www.padil.gov.au ........................................................................................................ 29
Figure I. 9 Life cycle of Hemileia vastatrix. Drawing from: (www.apsnet.org/online/feature/edcenter). 30
Figure I. 10 Symptoms of coffee leaf rust. A - coffee plants highly infected showing drop of leaves. B
Detail of coffee leaf with yellow-orange powder urediniospores. Photo A from:
(www.apsnet.org/online/feature/edcenter) and photo B (www2.iict.pt/index). ................................. 31
Figure I. 11 World distribution of coffee rust. (Schieber & Zentmyer, 1984)........................................... 32
Figure I. 12 Linkage map based on analysis of the chromosome segments in coupling surrounding the
SH3 gene on the F2 population (Matari x S.288)(Mahé et al., 2008). ................................................ 40
Figure I. 13 Different types of plant-pathogen intecation. From: Hammond-Kosack & Kanyuka (2007).
........................................................................................................................................................... 43
Figure I. 14 Quadratic diagram illustrating the gene-for-gene interaction between host resistance (R)
genes and rust avirulence (Avr) genes using coffee-rust as model. ................................................... 45
Figure I. 15 The‗zigzag‘ model proposed to represent four phases of the plant immune system (Jones and
Dangl 2006). ...................................................................................................................................... 47
Figure I. 16 Simplified schematic representation of the plant immune system. From: Pieterse et al., 2009.
........................................................................................................................................................... 48
Figure I. 17 The three Modes of Pathogen Recognition (Caplan et al., 2008) .......................................... 50
Figure I. 18 Opposing selection forces on guarded effector targets in a plant population polymorphic for
R genes (van der Horn et al., 2008) ................................................................................................... 52
Figure I. 19 Comparisons of the Guard and Decoy Models (van der Horn et al., 2008) ........................... 53

Figure I. 20 Classes of R protein and their cellular location. Adptated from: Hammond-Kosack & Kostya
Kanyuka, 2007. .................................................................................................................................. 57
Figure I. 21 Schematic representation of a typical NB–LRR protein. (Lukasik and Takken 2009). ......... 60
Figure I. 22 Leucine-rich repeat (LRR) structure of the PvPGIP2 (Bent and Mackey, 2007). ................. 64
Figure I. 23 Bait and switch model of NB-LRR protein function (Collier and Moffett 2009). ................. 67
Figure I. 24 A general model for plant–pathogen coevolution with a multilayered plant defense system.
(Xiao et al., 2008). ............................................................................................................................. 69
Figure I. 25 Evolutionary pattern of R genes (Fredman and Baker, 2007). .............................................. 72
Figure I. 26 Neighbor-joining tree showing the family-specific amplification of NBS sequences. (a)
TNLs. (b) CNLs. (McHale et al., 2006). ............................................................................................ 75
Figure I. 27 Physical locations of Arabidopsis sequences that encode NBS proteins similar to Plant R
Genes. (Meyers et al., 2003). ............................................................................................................. 77
Figure I. 28 The mechanisms that contribute to diversity of R genes and their loci. Adapted from: Leister
et al. 2004. ......................................................................................................................................... 78
Figure I. 29 Three potential fates of duplicate gene pairs with multiple regulatory regions (Force et al.,
1999. .................................................................................................................................................. 80
Figure I. 30 Route towards the application of candidate genes (Salentijn et al 2007). .............................. 92
Figure I. 31 Steps of positional cloning (Bouchez et al., 2006) ................................................................ 94
CHAPTER II
Figure II. 1 Southern hybridisation of HindIII-digested DNA from BAC clones of the SH3 region by a
BAC-end marker probe (143-8C-r). Based on the polymorphism revealed, the positive clones were
classified in two groups that putatively correspond to the two Arabica subgenomes. ..................... 112
Figure II. 2 BAC clone contig around the SH3 gene locus, and the SH3 region on the physical map...... 114
CHAPTER III
Figure III. 1 BAC clone contigs spanning the SH3 locus. BAC clones spanning the SH3 locus as
previously contigued [46]. Sequenced BACs from the three genomes are indicated by gray boxes.
......................................................................................................................................................... 125
Figure III. 2 Organization of SH3-CNL members in three coffee genomes: ........................................... 126
Figure III. 3 Southern blot hybridization of genomic DNA of C. arabica: ............................................ 127
Figure III. 4 Southern blot hybridization of genomic DNA from diploid coffee species: ...................... 127
Figure III. 5 Evolution of the SH3 locus in coffee species: ..................................................................... 129
Figure III. 6 Alignment of the predicted amino acid sequences from SH3-CNL members. .................... 132
Figure III. 7 Nucleotide diversity among SH3-CNL members from C. canephora ................................. 134

Figure III. 8 Ka/Ks ratio in the solvent-exposed residue of SH3-CNL members:. .................................. 142
Figure III. 9 Ka/Ks ratio in the solvent-exposed residue of SH3-CNL_A2. ............................................ 143
CHAPTER IV
Figure IV. 1 GFP fluorescence in embryogenic callus cultures transformed with A. tumefaciens and in
derived somatic embryos. ................................................................................................................ 149
Figure IV. 2 Effect of 6-BA and 2,4-D concentrations in the proliferation medium on growth intensity
and transformation efficiency of coffee embryogenic callus cultures. ............................................ 151
Figure IV. 3 Morphological and histological aspect of the different callus phenotypes observed in
maintained embryogenic cultures assayed for coffee genetic transformation.................................. 153
Figure IV. 4 Transformation efficiency depending on the phenotype of maintained embryogenic callus
cultures. Transformation efficiency was assessed by observing GFP epifluorescence 6 weeks after
the end of co-cultivation. ................................................................................................................. 154
Figure IV. 5 Effect of the embryogenic callus culture age on A. tumefaciens-mediated transformation
efficiency in C. arabica. Transformation efficiency was assayed 6 weeks after the end of co-
cultivation by GFP epifluorescence. ................................................................................................ 155
Figure IV. 6. Histological aspect of coffee embryogenic callus cultures depending on the age of the
culture.. ............................................................................................................................................ 156
Figure IV. 7 Regeneration of transformed coffee plants from maintained embryogenic cultures. .......... 158
Figure IV. 8 PCR detection of the hygromycin gene in transgenic coffee plants. The plants were
produced from 7-month-old embryogenic callus cultures co-cultivated with A. tumefaciens strain
LBA1119 carrying out the pMDC32 binary vector.. ....................................................................... 159
Figure IV. 9 Southern blot analyses of transgenic coffee plants. ............................................................ 159
CHAPTER V
Figure V. 1 Southern blot patterns of C. arabica cultivars hybridized with SH3-CNL specific probe. ... 172
Figure V. 2 Schematic representation of hybridization pattern obtained with EcoRI in non-introgressed
and introgressed acession of C. arabica. ......................................................................................... 173
Figure V. 3 Construction of binary vectors used for plant transformation carrying out candidate R genes
against CLR. .................................................................................................................................... 179
Figure V. 4 Expression cassettes used to clone candidates genes............................................................ 180
Figure V. 5 Schema representing the coffee transformation experiment for CG functional validation. .. 182
Figure V. 6 Overview of the transformation method used to produce transgenic coffee plants. ............. 184
Figure V. 7 Transgenic coffee plants carrying out the candidate genes A2 not conferred resistance to
CLR.. ............................................................................................................................................... 185
Figure V. 8 Strategy used for constructing a pooled BAC library of S.795 resistant cultivar to coffee leaf
rust (http://cnrgv.toulouse.inra.fr/fr/services/non_gridded_bac_library). ........................................ 186

CHAPTER VI
Figure VI. 1 Identification of BAC clones containing the SH3 locus in the S.795 resistant cultivar of C.
arabica. A. BAC clones containing the SH3 locus; B. Pulse field of BACs digested with Not I
enzyme; C. BACs fingerprint digested by Eco RI enzymes. ........................................................... 190
Figure VI. 2 Compared time durations for producing transgenic coffee plants using leaf explants versus
cryopreserved calluses......................................................................................................................197

LIST OF TABLES
CHAPTER I
Table I. 1 Top ten countries consumption of coffee ordered by annual per capita in 2007 ...................... 15
Table I. 2 Comparison of some botanical aspects between C. arabica and C. canephora species ........... 21
Table I. 3 Examples of desirable agronomical characters identified in diploid species of coffee or in C.
arabica wild type. ....................................................................................................................................... 25
Table I. 4 Coffee differentials to coffee leaf rust, genotypes for rust resistance, designation and coffee
physiological groups (Bettencourt & Rodriguez 1988; Bettencourt, 1992) ............................................... 37
Table I. 5 Genotypes for virulence in races of H. vastatrix pathogenic to C. arabica and some tetraploid
segregants of C. arabica x Coffee spp (Beleonnur selections, Icatu and HDT derivates) characterized by
CIFC (Varzea et al., 2002). ........................................................................................................................ 38
Table I. 6 Resistance segregation analysis in response to inoculation of three different races of Hemileia
vastatrix An F2 population of 101 individuals derived from a cross between the susceptible line Matari
and the line S.288 carrying the SH3 and SH5 rust resistance factor were evaluated (Prakash et al., 2004). 39
Table I. 7 Summary of the different forms and mechanisms of plant disease resistance (Kiraly et al.,
2007)........................................................................................................................................................... 46
Table I. 8 Non exhaustive list of identified disease resistance genes in plants (from Liu et al, 2007) ...... 55
Table I. 9 Sub-families of LRR proteins (Adapted from: Kobe and Kajava, 2001) .................................. 62
Table I. 10 The total number of predicted NBS-encoding genes identified in the sequenced angiosperm
genomes. ..................................................................................................................................................... 73
Table I. 11 Summary of Coffee sp transformation studies (Adaptated from: Ribas et al., 2006) ............ 102
CHAPTER II
Table II. 1 Reference and size of BAC clones selected for contig construction around the SH3 locus. .. 109
Table II. 2 Comparison for 4 BAC-end regions of sequences derived from the two BAC-contigs C
a and
Ea with sequences amplified from an accession of C. canephora (DH200-94, genome C). ..................... 111
CHAPTER III
Table III. 1 Exon, intron size (bp) and protein size (aa) of the SH3-CNL members identified in the three
analyzed genomes. .................................................................................................................................... 130
Table III. 2 Gene conversions detected among SH3-CNL members........................................................ 133

CHAPTER IV
Table IV. 1 Effect of different co-cultivation factors on transformation efficiency ................................ 149
Table IV. 2 Effect of different salts concentrations in the embryogenic callus culture proliferation
medium on callus growth and transformation efficiency. ........................................................................ 150
CHAPTER V
Table V. 1 In silico restriction analysis on the BAC sequences containing the SH3-CNL members ....... 171
Table V. 2 Primers sequence designed to amplify candidate genes against to coffee leaf rust. ............... 175
Table V. 3 Internal primers used for complete sequencing of SH3_CNL members ................................. 176

General Introduction
Agriculture is extremely vulnerable to climate change. Higher temperatures can reduce crop
yield and quality while increasing weed and pest proliferation. Crop protection against pathogens that
cause epidemic diseases is a major asset for global food security and sustainable crop production.
Using resistant cultivars remains the most ecological, economic and environmentally friendly method
to grow a crop with limited pesticide applications and low production costs.
The genetic management of diseases requires the characterization of plant-pathogen
interaction and as well as the mechanisms of co-evolution. Much progress has been made in
understanding the organization and evolution of resistance genes in annual plants or short-lived
perennial crops. On the other hand, little is known about the evolutionary history of these genes in
woody perennial plants.
Coffee is the most popular beverage worldwide and an economic mainstay for many countries
and about 25 million people. Brazil is the most important coffee-producing country being responsible
for about a third of all world coffee production (International Coffee Organization, www.ico.org).
Coffee leaf rust caused by Hemileia vastatrix is the main disease affecting coffee plants and
leads to significant reduction in productivity. Conventional coffee breeding is a very long process. At
least 25 years are necessary to restore the genetic background of the recipient cultivar and thereby
ensuring good quality of the improved variety. The source of disease resistance for coffee breeding
comes from wild diploid coffee species and from the Timor hybrid, a spontaneous interspecific hybrid
between C. arabica and C. canephora. However, during the last few years, improved varieties
derivated from Timor hybrid are gradually losing their resistance to coffee rust due to the emergence
of new virulent races.
The exploitation of genetic diversity using genomic approaches can significantly contribute
for crop breeding by facilitating the localization and the access to important agronomical traits in the
gene pool of wild coffee species. The detailed characterization of the resistance genes to pests and
diseases, as well as technologies allowing the precise manipulation and exploitation of resistance
genes could be useful in elaborating strategies directed to the development of cultivars exhibiting
durable resistance to rust.
The present study relates the characterization of a multigenic locus conferring resistance to coffee leaf
rust resistance. It was conjointly financed by IRD, CIRAD and the Brazilian government through
CAPES foundation from the Ministry of Education of Brazil.

CHAPTER I
LITERATURE REVIEW

Literature review
15
PART I
1. Generalities about Coffee
1.1 Coffee consumption, cultivation and economical trade
Coffee is the most popular beverage. It‘s consumed either hot or cold by about one-third of the
people in the world. Its popularity can be attributed to its stimulant effect, which is produced by
caffeine, an alkaloid present in green coffee in amounts between 0.8 - 1.4% for the Arabica varieties
and 1.7 - 4.0% for Robusta (www.ico.org).
According to International Coffee Organization (www.ico.org) about 1.4 billion cups of coffee
is consumed every day worldwide. The biggest consumers of coffee are the Nordic countries (Table I.
1). The leader in consumption is Finland with 12 kg per capita in 2007.
Coffee is cultivated between the Tropics of Cancer and Capricorn forming a ―bean belt‖
(Figure I.1). Growing regions typically offer moderate sunshine and rain, steady temperatures around
20 ºC (70 ºF), and rich, porous soil. The coffee beans are an economic mainstay for many countries
and about 25 million people. It is the second natural commodities; having a monetary value surpassed
only by oil.
The total production for crop year 2009/10 totaled 120.6 million bags (www.ico.org). Brazil is
responsible for about a third of all coffee production (39.4 million bags of 60 kg), making it by far the
most important coffee-producing country, followed by Vietnam, Indonesia, Colombia with 18, 10.6
and 9 million bags of 60 kg, respectively in the crop year 2009/10.
Table I. 1 Top ten countries consumption of coffee ordered by annual per capita in 2007
Rank Country Coffee Consumption (kg per capita per year)
1 Finland 12
2 Norway 9.9
3 Iceland 9.0 (2006)*
4 Denmark 8.7
5 Netherlands 8.4
6 Sweden 8.2
7 Switzerland 7.9
8 Belgium/Luxembourg 6.8
9 Aruba 6.8 (2006)*
10 Canada 6.5
*Where 2007 data is not available, 2006 data is provided. Available online at:
http://www.ico.org/historical.asp.

Literature review
16
Figure I. 1 Major countries producers of coffee. Top ten coffee producers are shown in yellow
1.2 Coffee taxonomy
Coffee belongs to Rubiaceae family, one of the five largest flowering plants families, with
aproximatly 13000 species classified in 620 genera, more than 40 tribes, and three subfamilies
(Goevarts et al. 2006). Rubiaceae occurs on all continents but most taxa are in tropical or subtropical
areas (Goevarts et al., 2006). Most of them are woody trees and shrubs. Plants of economical
importance in this family include: Quinine (Cinchona) which possess medicinal properties, Ixora and
Gardenia) cultivated as ornamentals plants, madder (Rubia sp) used as dyes and Coffea by far the
most agronomical important species of Rubiaceae family.
The Rubiaceae family is divided into three subfamilies: Cinchonoideae, Ixoroideae and
Rubioideae (Bremer & Eriksson, 2009). Ixoroideae subfamily that comprises about one-fifth of all
Rubiaceae genera has 15 recognized tribes (Bremer & Eriksson, 2009), among them the tribu Coffeeae
DC which comprises 11 genera including the genus Coffea and Psilanthus (Davis et al., 2007). The
position of genus Coffea in angiosperms phylogeny is shown in Figure I.2.
The coffee species share the typical coffee bean morphology, i.e. a groove on the flat side of the
seed. The ‗husk‘ or ‗parchment‘ (horny/ crustaceous endocarp) of the pyrene also has a deep ventral
groove, which follows the invagination of the outer layer of the seed (exotesta) (Davis et al., 2006)
(Figure I.3). They have been classified in two genera, Coffea L. and Psilanthus Hook. f. which differ
in their flower morphology (Leroy 1980; Bridson 1987; Davis et al., 2005). The flowers in Coffea
genus have long style, medium corolla tube, exserted anthers while in Psilanthus genus the flowers
have short style, long corolla tube and encased anthers (Figure I.4).

Literature review
17
Figure I. 2 Position of genus Coffea on the angiosperms phylogeny. Modified from:
(http://www.mobot.org/mobot/research/APweb)
Cinchonoideae Ixoroideae: Coffeaea…(Coffea…) Rubioideae
Literature review
18
Figure I. 3 Typical coffee bean morphology: A- Endocarp hard (horny/crustaceous), B- Seeds (and pyrenes)
with a deep ventral groove.
Figure I. 4 Flower morphology in coffee genera. A. Coffea sessiflora in subgenus Coffea has flowers with long
style, medium corolla tube, exserted anthers. B. Psilanthus mannii in subgenus Psilanthus has flowers with short
style, long corolla tube, encased anthers.
The genus Coffea is classically divided in two subgenera: Coffea subgenus Coffea and Coffea
subgenus Baracoffea (Bridson 2003; Davis 2003; Davis et al., 2005, 2006). However a sister
relationship between subgenus Coffea and Baracoffea was demonstrated to be highly unlikely (Maurin
et al. 2007). Nowadays the subgenus Baracoffea is referred as the ‗baracoffea alliance‘ as a mean of
recognition of nine Coffea species that are not yet clearly positioned on Coffea phylogeny but
represent a strongly and morphological distinct lineage (Davis and Rakotonasolo, 2008).
A B
A
B

Literature review
19
The genus Psilanthus has also been divided in two subgenus: Psilanthus subgenus Psilanthus
(two species) and Psilanthus subgenus Afrocoffea (Moens) (20 species) (Bridson 1988; Davis et al.,
2005, 2006; Davis and Rakotonasolo 2008). Although coffee species has been described in two genera
Coffea and Psilanthus the relationship between them is not completely understood yet. There are some
evidences for accepting them as a single genus, such as morphological traits (Robbrecht and Puff,
1986; Davis et al., 2005), molecular characteristics (Davis et al., 2007; Maurin et al., 2007), low
sequence diversity and indications of paraphyly (Lashermes et al., 1997; Cros et al., 1998). However,
further molecular data are needed to fully resolve the relationship between Coffea and Psilanthus
(Maurin et al., 2007).
The genus Coffea subgenus Coffea contains 95 species occurring throughout the natural range
of the genus in tropical Africa, Madagascar, the Comoros and the Mascarenes (Reunion and
Mauritius) and plus 9 species grouped in the ―baracoffea alliance‖ that is suggested as a dry-adapted
radiation of Coffea in Madagascar (Davis and Rakotonasolo, 2008). New taxa of Coffee are still being
discovered (Stoffelen et al., 2009). A recent phylogeographic analysis of Coffea subgenus Coffea
species using data on plastid sequences suggested that Lower Guinea could be the centre of origin of
Coffea subgenus Coffea (Anthony et al., 2009).
Species included into the genera Coffea are self-incompatible with exception of the
allotetraploid species C. arabica (Carvalho et al., 1991) and the diploid species C. heterocalyx Stoff
(Coulibaly et al., 2002) and C. anthonyi (formerly C. sp ‗Moloundou‘) found out in Cameroon and in
Republic of Congo (Stoffelen et al., 2009), respectively. Only two species are of economical interest:
C. canephora and C. arabica. The superior quality beverage is produced from C. arabica which is the
most important traded species.
1.3 Characteristics of cultivated coffee species
The coffee plant is a woody shrub, and it grows in the wild as high as 12 meters, but cultivated
trees are pruned to 2 meters. It has a main vertical trunk (orthotropic) and primary, secondary, and
tertiary horizontal branches (plagiotropic). Small, white flowers give rise to a red or yellow fleshy
fruit, the "coffee cherry" (Figure I.5) which contains a pair of beans (http://www.ico.org).

Literature review
20
Figure I. 5 Coffea arabica tree with cherry beans. From: Leo Junior, Incaper ES
Coffea arabica
Coffea arabica is allotetraploid species. There are two distinct botanical varieties of arabica
coffee: typica and bourbon. Historically, typica was cultivated in Latin America and Asia, whereas
bourbon arrived in South America and, later, East Africa via the French colony of Bourbon (Reunion).
Because C. arabica is mainly self-pollinating, these varieties tend to remain genetically stable.
However, spontaneous mutants showing desirable characteristics have been cultivated in their own
right, as well as being exploited for cross-breeding purposes. Some of these mutants and cultivars are
described below: (summarized from Clifford and Willson, 1985).
Mutants: Caturra - a compact form of bourbon; Maragogipe - a mutant typica with large beans; San
Ramon - a dwarf typica; and Purpurascens - purple leaved forms
Cultivars have been developed to give the maximum economic return under specific regional
conditions such as climate, soil, methods of cultivation and the prevalence of pests and diseases. Some
of the better known cultivars are: Blue Mountain - grown in Jamaica and Kenya; Mundo Novo - a
cross between typica and bourbon, originally grown in Brazil; Kent - originally developed in India,
showing some disease resistance; Catuaí - developed as a hybrid of Mundo Novo and Caturra,
characterized by either yellow or red cherries: Catuai-amarelo and Catuai-vermelho respectively.

Literature review
21
Arabica F1 hybrids
Arabica F1 hybrids deriving from crosses between wild Sudan-Ethiopian and American
varieties and propagated in somatic embryo form have been created in Central America to increase the
genetic diversity of coffee in the region (Bertrand et al., 2010). The yield of all hybrids is superior to
the mean yield of American varieties and displayed better earliness. Also, the hybrids displayed better
stability over environments than did the American varieties.
Coffea canephora
C. canephora is diploid and self-sterile, producing many different forms and varieties in the wild.
The identification of cultivars is confused, but two main forms are recognized: Robusta - upright
forms; Nganda- spreading forms (ICO). Two Canephora seed varieties have been selected for use as
root-stock for Arabica with resistance to nematodes: Apoatã in Brazil and Nemaya in Central
America. A brief comparison of botanical aspects between C. arabica and C. canephora is presented
in Table I.2.
Table I. 2 Comparison of some botanical aspects between C. arabica and C. canephora species
Botanical aspect C. arabica C. canephora
Date species described 1753 1895
Chromosomes (2n) 44 22
Time from flower to ripe cherry 9 months 10-11 months
Flowering after rain after rain
Ripe cherries fall stay
Yield (kg beans/ha) 1500-3000 2300-4000
Root system deep shallow
Optimum temperature (yearly average) 15-24° C 24-30° C
Optimal rainfall 1500-2000 mm 2000-3000 mm
Optimum altitude 1000-2000 m 0-700 m
Hemileia vastatrix susceptible resistant
Koleroga susceptible tolerant
Nematodes susceptible resistant
Tracheomycosis resistant susceptible
Coffee berry disease susceptible resistant
Caffeine content of beans 0.8-1.4% 1.7-4.0%
Shape of bean flat oval
Typical brew characteristics acidity bitterness, full
Body average 1.2% average 2.0%
Available in: http://www.ico.org/botanical.asp accessed in 23 July 2010 00:06

Literature review
22
1.4 Cytological aspects of Coffea
Cytological studies in coffee and other plants of Rubiaceae family made by Homeyer (1933 in
Krug, 1934), demonstrated that C. arabica possess 2n=44 chromosomes while diploid species possess
2n=22 chromosomes. They also determined n=11 as a basic number of chromosomes for the genus
Coffea. These results were confirmed later by Fagerlind (1937).
DNA content in plants and others eucariots are usually expressed in picograms (pg) or in
Megabase pairs of nucleotides (Mb) where, 1 Mb = 106 nucleotide base pairs and 1 pg = 965Mb
(Bennett and Leitch 1995).
The Chromosomal DNA 2C content (i.e a nucleus in G1 phase of the cell cycle, with two copies of
unreplicated genome) of Coffea species have been measured by flow cytometry (FCM) and slight
variation has been reported by different authors depending on the methodology, standards, buffers or
fluorochromes used. The mean of chromosomal DNA 2C content estimate for different cultivars of C.
arabica ranged from 2.38 to 2.84 pg (Cros et al., 1995; Clarindo and Carvalho 2009) and from 1.32 to
1.76 pg for C. canephora cultivars (Cros et al., 1995; Noirot et al., 2003; Clarindo and Carvalho,
2009). The variations in DNA content among coffee species, besides of ploidy level (e.g. C. arabica),
are probably due almost entirely to variation in the copy number of repeated DNA sequences.
Differences may correspond to genomic evolution correlated with an ecological adaptation process
(Lashermes and Anthony, 2005).
1.5 Speciation and genome features of C. arabica
The genome constitution and mode of speciation of C. arabica have been subjected to several
investigations. Based on cytological observations and fertility of interspecific hybrids, C. canephora
and C. congensis were suggested to have a common ancestor with C. arabica (Carvalho 1952; Cramer
1957). Furthermore, C. congensis can be considered as an ecotype of C. canephora in the light of the
fertility of interspecific hybrids (Louarn, 1993) and the genetic diversity detected by molecular
markers (Prakash et al., 2005). These phylogenetic assumptions were consolidated by a high
homology found in the ITS2 region sequences of C. arabica, C. canephora and C. congensis
(Lashermes et al., 1997). Regarding cpDNA that exhibited a maternal inheritance in coffee
(Lashermes et al. 1996), C. arabica appeared to be similar to two species, C. eugenioides Moore and
Coffea sp. ―Moloundou‖ (Cros et al., 1998).

Literature review
23
Restriction fragment length polymorphism (RFLP) markers in combination with genomic in situ
hybridization (GISH) were used to investigate the origin of C. arabica. By comparing the RFLP
patterns of potential diploid progenitor species with those of C. arabica, the source of the two sets of
chromosomes, or genomes, combined in C. arabica was specified. The genome organization of C.
arabica was confirmed by GISH using simultaneously labeled total genomic DNA from the two
putative genome donor species as probes (Lashermes et al., 1999). These results clearly suggested that
C. arabica is an amphidiploid (i.e. Ca
Ea genomes) resulting from the hybridization between C.
eugenioides (E genome) and C. canephora (C genome) or ecotypes related to those diploid species
(Figure I.6) Results also indicated low divergence between the two constitutive genomes of C. arabica
and those of its progenitor species, suggesting that the speciation of C. arabica took place very
recently. Precise localization in Central Africa of the speciation process of C. arabica based on the
present distribution of the coffee species appeared difficult since the constitution and extent of tropical
forest varied considerably during the late quaternary period.
Furthermore, in spite of the close relationship among the two constitutive genomes, bivalents are
observed in meiosis and C. arabica is considered to display a diploid-like meiotic behavior (Krug and
Mendes 1940). Investigations suggest that homeologous chromosomes do not pair in C. arabica, not
as a consequence of structural differentiation, but because of the functioning of pairing regulating
factors (Lashermes et al. 2000a).
1.6 Coffee arabica genetic diversity and breeding
Genetic diversity in C. arabica appeared extremely reduced in comparison to the diversity
observed in C. canephora. These results were demonstrated using different techniques to detected
polymorphism in coffee species such as: cleaved amplified polymorphisms (Lashermes et al., 1996;
Orozco-Castilho et al., 1996), RAPD (Orozco-Castilho et al., 1994; Lashermes et al., 1996; Anthony
et al., 2001; Aga et al., 2003; Silvestrini et al., 2008), RFLP (Paillard et al., 1996; Lashermes et al.,
1999; Dussert et al., 2003), AFLP (Lashermes et al., 2000a; Anthony et al., 2002), and SNPs or
microsatellites (Mettulio et al., 1999; Combes et al., 2000; Anthony et al., 2002).
Comparing wild and cultivated Arabica coffee, genetic differentiation appeared demonstrated
to be low between cultivated species (Typica and Bourbon groups) and to some extent high between
wild and cultivated coffee (Lashermes and Anthony, 2005). This low genetic diversity has been
attributed to the allotetraploid origin, reproductive biology, and evolution process of C. arabica
(Lashermes et al., 2000). Hence wild coffee population could be used to enlarge the genetic base of
cultivars (Lashermes and Anthony, 2005).

Literature review
24
As a self-pollinating plant the most used method for Arabica is line selection in segregating
natural or artificially created population, whereas Canephora breeding has mainly involved the
selection of clones and of hybrids between clones (Eskes and Leroy, 2009).
Figure I. 6 Genetic origin of allotetraploid C. arabica. Natural hybridization between C. eugenioides as female
parent and C. canephora as male parent originated the C. arabica species (Lashermes et al., 1999).

Literature review
25
The main strategy for Arabica breeding is to transfer genes desirable agronomical characters
from diploid species into Arabica gene pool. Interspecific hybrids are produced by crossing and
undesirable genes from the donor parent are gradually eliminated by selection. Many interesting
agronomical traits have been identified in either spontaneous accession collected in the primary centre
of diversity or diploid wild relative Coffea species (Table I.3).
Conventional coffee breeding face some difficulties such as: long generation time of coffee tree;
high cost of field trial and lack of accuracy of current strategy. A minimum of 25 years after
hybridization is required to restore the genetic background of the recipient cultivar and to ensure
quality of improved variety (Lashermes et al., 2000).
Table I. 3 Examples of desirable agronomical characters identified in diploid species of coffee or in C. arabica
wild type.
Desirable agronomical characters Diversity source Reference
Pest and disease resistance
Perileucoptera coffeela C. racemosa Carvalho et al. 1988; Guerreiro et
al.1999
Hemileia vastatrix C. canephora Berthaud & Lourd, 1982
C. liberica, C.
pseudozanguebarie
Kushalappa & Eskes, 1989
C. liberica Srinivasan and Narasimhaswamy,
1975
C. eugenioides Montagnon & Leroy, 1993
Colletotrichum kahawae C. canephora Rodrigues Jr. et al. 1975
Meloidogyne exigua C. eugenioides, C. racemosa Rodrigues Jr. et al. 1990
Meloidogyne paranaensis C. arabica wild type,
C. canephora
Van der Vossen, 1997
Meloidogyne incognita C. arabica wild type,
C. canephora
Bertrand et al. 1999; Anthony et al.
2002b
Meloidogyne arabicida C. arabica wild type,
C. canephora
Anthony et al. 2002b
Male sterility C. arabica wild type Dufour et al. 1997
Beans maturation C. congensis, C. canephora No reference
Biochemical seeds composition C. pseudozanguebarie Mazzafera & Carvalho, 1992
Adaptation to hydromorphic soils C. congensis Charrier & Vigreux, 1972
Drought tolerance C. racemosa Guerreiro-filho, 1972
Cold tolerance C. congensis Ahmad & Vishveshwara, 1980
Rusticity C. canephora Capot, 1977
Productivity C. canephora, C. arabica, C.
liberica
Capot, 1977; Carvalho et al. 1978
Beans mesh C. canephora, C. arabica Le Pierrès, 1995

Literature review
26
1.6.1 Coffee breeding objectives
The mains objectives of coffee breeding are the creation and development of new varieties
with the following characteristics (Eskes and Leroy, 2009):
High-yielding varieties;
Adaptation to different cultivations systems: dwarf coffee varieties and high density
planting;
Physiological disorders: drought resistance
Increase resistance to pest and diseases such as: CLR (Hemileia vastatrix), CBD
(Colletotrichum kahawae), Fusarium, Cercospora coffeicola, nematodes
(Meloidogyne, Pratylenchus spp); insects: coffee leaf miner (Leucoptera spp), coffee
berry borer (Hypotenemus hampei);
Improve beverage quality: selection for low caffeine content, flavor features
1.7 Interspecific hybridization and coffee introgression
Introgressive hybridization was first defined as the infiltration of germplasm of one species into
another through repeated backcrossing of hybrids to parental species (Anderson and Hubricht, 1938).
Occurrence of spontaneous hybrids between tetraploid arabica and other diploid species is
common especially when these species are cultivated together (Prakash et al., 2002). Most of the
disease resistance genes used in coffee breeding have been transferred into C. arabica genome via
natural or artificial hybridization involving C. canephora or C. liberica (Berthaud 1978; Bettecourt
and Rodrigues 1988; Dublin et al., 1991; Wrigley 1995).
The most important natural hybrid is the Timor Hybrid (HDT) discovered on the Timor Island
(ancient Portuguese colony) (Bettencourt 1973). HDT is originated from a spontaneous cross between
C. arabica and C. canephora (Bettencourt 1973; Gonçalves and Rodrigues 1976; Lashermes et al.,
1993; Orozco-Castilho et al., 1994). Later, it was suggested that the C. canephora progenitor at the
origin of the Timor Hybrid came from the Congo basin (Lashermes et al., 2002). Several coffee-
producing countries such as: Brazil, Colombia and Kenya have used HDT in their Coffee breeding
programs as the major font of resistance to pests and diseases.
The level of introgression from C. canephora into lines derived from the HDT was estimated
to represent from 8 to 27% of the C. canephora genome. In addition, introgression appeared not
restricted to chromosome recombination (Lashermes et al., 2000).

Literature review
27
Other spontaneous hybrids between C. arabica and C. canephora have been identified in New
Caledonia (HNC). Fourteen hybrids HNC have been recently investigated and some of them have
exhibited a low number of introgressed markers reflecting a low proportion of C. canephora genome
(i.e. 4%)(Mahé et al., 2007). Rust inoculation test demonstrated that all HNCs except one appeared
resistant to the rust Race II. Individuals showing a low level of introgression could be directly used in
breeding programmers‘ and significantly contribute to the development of improved Arabica cultivars
exhibiting a valuable resistance to rust (Mahé et al., 2007).
Natural coffee hybrid discovered in India and named S.26 has been used in coffee breeding
programs in India as main source for rust resistance (Vishveshwara, 1974a; Sreenivasan et al., 1994).
These early Indian selections carry SH3 resistance factor for coffee rust, only known to be present in
Coffea liberica (Wagner & Bettencourt, 1965). So it was supposed that C. liberica was likely involved
in the origin of this natural hybrid. To investigate this hypothesis AFLP markers were used to evaluate
the introgression of C. liberica into S.288 population (derived from S.26) and 17 introgression lines
derivate from a cross between S.288 x Kent variety (pure Arabica) (Prakash et al., 2002). The AFLP
profiles were compared to 5 accessions of C. liberica and C. arabica. They found that introgression
bands were associated with C. liberica var liberica (Guinean origin) and that introgression on C.
arabica from C. liberica was restricted to few chromosomes segments. They assumed that S.26 might
have originated either from a natural tetraploid F1 progenitor (union of unreduced gametes) or triploid
F1 progenitor (union of reduced gametes) (Prakash et al., 2002).
The production of artificial interspecific triploid (2n=33) or tetraploid (2n=44) hybrids can be
also a strategy to introduce genes from diploid coffee into C. arabica (Figure I.7). Triploid hybrids are
derived from a direct cross between the diploid progenitor and C. arabica while tetraploid hybrids are
obtained by crossing both species after chromosome duplication of the diploid coffee (Lashermes et
al., 2000). A tetraploid hybrid C. arabica x C. canephora was created in Brazil in 1950. This hybrid
was then back-crossed with Arabica cultivars resulting in the Icatu breeding population. Other hybrids
called ‗Arabusta‘ (C. arabica and C. canephora) or Congusta hybrids (C. canephora and C.
congensis) were created in Ivory Coast, Cameroon and Ghana in order to develop varieties with better
beverage quality of coffee and adapted to tropical lowlands (Eskes and Leroy, 2009).
In Colombia, triploid hybrids between C. arabica and C. canephora have also been created
and used for further selection since the 1970s. Back-cross generations from hybrids between C.
arabica and C. racemosa are being selected for resistance to coffee leaf miner in Brazil (Eskes and
Leroy, 2009).

Literature review
28
2. Coffee leaf rust: the main coffee disease
2.1 The genus Hemileia
Coffee leaf rust is caused by a biotrophic fungus Hemileia vastatrix (Berk & Br.) that belongs
to the class Basidiomycetes, the order Uredinales, and the family Pucciniaceae (Figure I.8). The coffee
leaf rust is generally conceded to be endemic in the mountains of Ethiopia, the primary center of C.
arabica diversity. Rust also occurred in wild coffee in the lowlands around the Lake Victoria, in
Uganda and Kenya where it was first reported in 1861. The fungus was described associated with the
disease on some dried coffee leaves by Berkeley in 1869 (Schieber and Zentmyer, 1984). The name
Hemileia given to the genus refers to one half of the spores‘ cell wall which has a smooth aspect; the
word vastatrix refers probably foreseeing its quick and through dissemination in the regions it would
infest.
H. vastatrix is an obligatory parasite (i. e depends on live cell host for completion of their life
cycle) specific of coffee plants (Coffea sp.) and some Psilanthus. Coffee leaf rust is one of the most
X Diploid
progenitor (2n=22)
C. arabica
(2n=44)
Diploid progenitor (2n=22)
Chromosome
duplication Tetraploid Coffee (2n=44)
Tetraploid
Progenitor
(2n=44)
C. arabica
(2n=44) X
Tetraploid hybrids (2n=44)
Triploid hybrids
(2n=33)
Figure I. 7. Triploid and tetraploid strategies of gene introgression from diploid coffee species into C. arabica
genome. From: Lashermes et al., 2000.

Literature review
29
destructive diseases of crop Coffea arabica. The fungus is widely distributed in most part regions of
the world where coffee is grown and can represent serious limitation to economically sustainable
coffee production (Bettencourt and Rodrigues, 1988). The fungus has not been still detected in Hawaii
and Australia (Van der Vossen et al., 2005).
Figure I. 8 Urediniospores of Hemileia vastatrix. They are reniform-like, 26–40 × 18-28 µm, 1–2 µm thick,
strongly warted on the convex side, smooth on the straight or concave side, warts frequently longer (3–7 µm) on
spore edges. Photo from: Liberato JR & Silva MC (2006). Available online: http://www.padil.gov.au.
2.2 Coffee leaf rust (CLR) symptoms
H. vastatrix is macrocyclic rust with no alternate host so far identified. As other biotrophic
fungus, the infection process of H. vastatrix on coffee leaves involves specific events including
appressorium formation over stomata, penetration into the leaf and colonization of living host cells by
intracellular specialized fungal structures (haustoria) that penetrate the plant cell wall and allow
nutrient uptake. The life cycle of H. vastatrix is shown in Figure I.9.

Literature review
30
Figure I. 9 Life cycle of Hemileia vastatrix. Drawing from: (www.apsnet.org/online/feature/edcenter).
The first symptoms of the disease consist of the appearance of small light yellow spots of 1-3
mm diameter and with a slightly oily aspect on the leaf underside, when observed by transparence.
These spots develop within a few days, become yellow orange and powdery and reach a diameter of 2-
3 mm. When they coalesce, they can cover a great extent of the limb. The yellow-orange powder
consists of the pathogen spores and is the only extreme sign of the disease. The attacked leaves
generally drop prematurely, prejudicing the plant development and affecting the producing trees
(D‘Oliveira, 1954-1957; Chaves et al., 1970; Galli, 1970) (Figure I. 10). Little molecular information
is available about H. vastatrix. Genetic diversity assessed by RAPD in isolates of H. vastatrix was
considered moderately low and showed that rust isolates classified in the same physiological race by
means of conventional methods (e.g., isolates from races XXIII and XXXVII) seemed to differ
substantially at the molecular level. This variability could indicate the occurrence of genetic changes
independent of pathogenicity (Gouveia et al., 2005).
A collaborative project involving INRA, IRD and the Genoscope to identify the virulence
factors in Hemileia vastatrix are now in progress (http://www.genoscope.cns.fr/spip/Identification-of-
virulence). The aim of this project is to use the 454-pyrosequencing technique to identify transcripts
coding for rust virulence. Comparison of expressed sequence tags with genome sequences and
catalogs of predicted genes available for plant and fungal species in international genomic databases

Literature review
31
will allow deriving specific sequences belonging to the plant host or the pathogen. A particular
attention will be given to transcripts encoding small secreted fungal proteins that likely contain
putative effectors. This project is a very important step in improve knowledge about the mechanisms
that control rust disease development in coffee plants.
Figure I. 10 Symptoms of coffee leaf rust. A - coffee plants highly infected showing drop of leaves. B Detail of
coffee leaf with yellow-orange powder urediniospores. Photo A from: (www.apsnet.org/online/feature/edcenter)
and photo B (www2.iict.pt/index).
2.3 CLR epidemic
The CLR epidemic began in Ceylon (now known as Sri Lanka) in 1867 and quickly spread to
other countries. Many factors led up to the epidemic, one of the most important was the destruction of
native jungles in Ceylon and the establishment of an agricultural monoculture of coffee. The
destruction of the agricultural base also led to economic problems and some affected countries
switched to tea production as a source of income. Coffee rust was restricted to the Eastern Hemisphere

Literature review
32
until 1970 when it first appeared in Brazil. Since that time it has spread to other coffee producing areas
in South and Central America as well as Mexico (Schieber & Zentmyer, 1984).
When rust arrived in Brazil in the 1970, all cultivars in the Americas were susceptible. The
cultivar Kent was the first useful resistant cultivar; it was developed on the Kent estate in Mysore,
India. The Timor Hybrid, the diploid species C. canephora and C. liberica and the cv. Typica of
Arabica were later incorporated in the breeding programs (Schieber & Zentmyer, 1984). (Figure I.11).
Figure I. 11 World distribution of coffee rust. http://www.apsnet.org/education/Lessonsplantpath/Coffeerust
(Adapted from Schieber & Zentmyer, 1984)
2.4 Disease Management
Orange rust is the most harmful disease of the coffee-tree and it is responsible for heavy losses
which correspond to millions of dollars for coffee culture in the world. The production losses due to
rust are estimated at 30 - 70% in Brazil and India, respectively if no treatment is employed. Coffee rust
causes premature defoliation, which reduces photosynthetic capacity and weakness the tree
(Kushalappa and Eskes, 1989). Several factors may strongly influence coffee rust epidemics such as:
shade status, coffee tree density, fertilization and pruning since they produce effects on microclimate
and plant physiology which, in turn, influence the life cycle of the fungus. These factors should be
considered in crop management depending if coffee is cultivated in intensive or extensive plantation
(Avelino et al., 2004).

Literature review
33
2.4.1 Chemical control
Copper-containing fungicides are very effective in controlling coffee rust. In Coffea arabica,
the recommended number of fungicide applications in Brazil to control coffee leaf rust is four to five
with copper fungicides or one to three applications of systemic fungicides from triazol group or triazo
formulated with estrobilurins. In C. canephora, the number of foliar applications is usually half of
number of applications done in C. arabica (Zambolin et al., 2005).
Some disadvantages in use of copper-containing fungicides include accumulation in the soil,
particularly in the organic matter that can reach levels toxic to plants and to other organisms in the
environment. Besides that, they must be present on the leaves before infection occurs. To minimize
cost and to preserve environmental conditions chemical treatment should be applied only when the
disease reach out a level of economic damage. For orange rust the application of fungicides is
recommended when the disease incidence reach 5% (5% of infected leaves) (Almeida et al., 1986,
Rivillas Osorio et al., 1999).
2.4.2 Biological control
Some researchers are focus on found out biologic agents to control coffee leaf rust, mainly for
organic crop systems. A significant reduction in leaf rust severity by the presence of Verticillium
psalliotae, especially when was applied 24 hours before the inoculation of H. vastatrix, demonstrated
an evidence parasitism in vivo (Mahfud et al., 2006). It has been showed that the hyperparasitic fungus
Verticillium hemileia is able to colonize the coffee rust lesions and reduces the viability of the
urediniospores, but it has very little impact on overall rust development (Eskes et al., 1991).
Pseudomonas and mainly Bacillus spp. were efficient in reducing the intensity of leaf rust
under field conditions as effectively as copper hydroxide but many studies, including toxicological
ones, are still required to prove the effectiveness and the safety to use these agents in biological
control of CLR (Haddad et al., 2009).

Literature review
34
2.5 Resistance to CLR
The use of resistant cultivars is the most efficient, economic and ecologically correct control
for coffee leaf rust disease. Coffee-rust interactions can be expressed as immunity (total absence of
symptoms) or susceptibility (formation of large pustules with abundant sporulation) (Bettencourt,
1981). The most common expression of resistance is the chlorotic dots or spots without spores.
Chlorotic spots with little sporulation and small to medium-sized pustules correspond to intermediate
expression of resistance may also occur (Varzea & Marques, 2005). For a number of coffee (Coffea
spp.) genotypes, the resistance is post-haustorial (in that the fungus ceases its growth at different
stages of the infection, but more frequently after the formation of the first haustorium) and is
expressed by the rapid hypersensitive cell death (HR). Cell death began to be observed around 2 days
post-inoculation, in the guard cells only, or in both the guard and subsidiary cells at the infection sites
in which the fungus reached the stage of appressorium or penetration hypha (Silva et al., 2000, 2002).
Coffee-rust interations seem to follow the model proposed by Flor (1942, 1971) who was
working with rust (Melampsora lini) of flax (Linum usitatissimum). He showed that the inheritance of
both resistances in the host and parasite is controlled by pairs of matching genes. In this model, there
is one gene in the plant called R gene and other in the parasite called Avr gene. Plants producing a
specific R gene product are resistant towards a pathogen that produces the corresponding Avr gene
product.
Recently, histological observations in compatible and incompatible coffee-rust interactions
identified a biphasic haustorial differentiation of the H. vastatrix race II in both compatible and
incompatible interactions (Ramiro et al., 2009). In the first phase, pioneer haustoria were formed in
the subsidiary and adjacent cells of stomata from a first described infection structure named the
pioneer hypha. In the second phase, secondary haustoria were produced in the mesophyll after
differentiation of the anchor-shaped substomatal vesicle. In addition, specific resistance genes were
expressed after differentiation of the H. vastatrix secondary haustoria, showing no evidence of specific
recognition of coffee rust at the pioneer haustoria stage, suggesting that haustoria components are not
recognized by, or not secreted into, the subsidiary and adjacent cells of the stomata (Ramiro et al.,
2009). Brief, the authors also suggested that Avr proteins from Hemileia vastatrix race II are not
specifically recognized by, or not secreted into, the epidermal cells of the stomatal region from pioneer
haustoria.

Literature review
35
2.5.1 CLR resistance genes
Resistance to coffee leaf rust in C. arabica appears so far conditioned primarily by 9 dominant
major named SH genes (identified so far) single or in association (SH1-SH9) while in H. vastatrix 9
genes for virulence named v1-to-v9 are in correspondence. The term SH means ―Susceptibility to
Hemileia‖ in other word they are dominant genes that condition total susceptibility to compatible races
and specific resistance to incompatible races (Rodrigues et al., 1975). In this way, for example coffee
plants carrying the SH3 resistance factor are expected to manifest susceptibility when infected by
races of H. vastratrix carrying the corresponding v3 virulence factor (Prakash et al., 2004).
Four dominant genes were characterized: SH1, SH2, SH4 and SH5 in C. arabica. The resistance
factor SH3 was identified in the Indian selections derived from tetraploid coffee S.26 and S.31 (C.
arabica x C. liberica (Noronha-Wagner & Bettencourt, 1967; Bettencourt & Noronha-Wagner, 1971)
while the resistance factors (SH5 – SH9) were characterized in HDT derivatives and its supposed
coming from C. canephora (Bettencourt, 1980; Bettencourt et al., 1992). Besides these SH genes
identified at CIFC, it is likely that other major genes on HDT derivatives condition the Coffea-rust
interactions (Bettencourt & Rodrigues, 1988, Eskes et al., 1990).
Screening for resistance and rust races has suggested that the factors SH1, SH2 SH3 SH4 and SH6
appears to be dominant and monogenic (Rodiguez et al., 1975). The SH4 gene may however be
partially dominant or even quite recessive. No inheritance studies have been published yet on SH5.
The inheritance of SH7 to SH9 appears quite complex when using races showing incomplete virulence,
which results in intermediate resistance level in the progenies derived from crosses inoculated with
such races (Eskes, 1989; Eskes et al.,1990).
Coffee genotypes may react as R (resistant), MR (moderately resistant), MS (moderately
susceptible), or S (susceptible) to different rust races, which suggests that more than two levels of
virulence may be present in relation to known resistance factors. The differential for SH3, for
example, reacts like R, MS, or S to different races (Rodrigues et al., 1975).
Intermediate virulence has also been demonstrated in relation to two resistant genes from C.
canephora and also in Icatu (hybrids between C. arabica x C. canephora) (Eskes et al., 1990).
Intermediate virulence in dikariotic rust fungi might be explained by incomplete dominance of
avirulence alleles, by multiplies alleles for virulence, or by interallelic interactions. The occurrence of
intermediate virulence indicates that the level of residual resistance of major genes, after they have
been matched by virulent races, may depend on the rust genotype. The presence of such incomplete
virulence would suggest that incomplete monogenic resistance might not be durable, as the fungus
may overcome the resistance factor by stepwise increases in virulence (Eskes, 2005).

Literature review
36
In Brazil, isolates with some virulence to SH3 have been obtained from field plants with SH3,
which were classified as completely avirulent to SH3 at CIFC. Thus four levels of virulence may exist,
a hypothesis that indicates that either the virulence to SH3 is more complex than expected from a gene-
for-gene relationship or that the SH3 factor is more complex than imagined (Eskes, 2005).
2.5.2 Physiological races of Hemileia vastatrix
The characterization of physiological races of H. vastatrix in relation to resistance to leaf rust
has been made by CIFC (Rodrigues Jr., 1975; Bettencourt & Rodrigues, 1988; Varzea et al., 2002). It
is based on phenotypic expression of different interactions between differential coffee varieties and the
physiological races of rust. These groups are distinguished from each other essentially by reactions of
complete resistance and susceptibility to several races of the pathogen and are named arbitrary by
letters and numbers (Bettencourt, 1981) (Table I.4).
Up to now 38 physiologic groups and 45 physiological races have been characterized (Varzea
et al., 2002) (Table I.5). For example, the Group A is characterized by resistance to all the known
races and has been found in diploid species such as: C. canephora, C. liberica, C. dewevrei, C.
eugenioides, C. congensis and C. zamguebarie (d‘Oliveira & Rodrigues, 1961; Bettencourt et al.,
1965) and in Hybrids between C. arabica x C. canephora (HDT, Icatu). No pure Arabica (typical and
Bourbon cultivars) is present in this group. In the other hand, Group F represents susceptibility to all
the known rust races. This group includes most accessions of C. racemosa. Between these extremities
of ―A‖ and ―F‖ groups, there are 38 groups, ranging from susceptibility to 43 races to only 3 races
(group W) (Bettencourt, 1981; Bettencourt & Rodrigues, 1985). Works at CIFC has demonstrated that
the population classified as group A is not uniform; more than 5 new physiological groups became
susceptible to 5 different rust isolates from India (Varzea & Marques, 2005).

Literature review
37
Table I. 4 Coffee differentials to coffee leaf rust, genotypes for rust resistance, designation and coffee
physiological groups (Bettencourt & Rodriguez 1988; Bettencourt, 1992)
Genotype for resistance Coffee selection or cultivar CICF n° Coffee physiological group
SH? Matari (849/1) β
SH1 Dilla & Alghe (128/2) α
SH1,4 134/4 – S12 Kaffa I
SH1,5 87/1 - Geisha C
SH1,6 H 468/23 5
SH1,2,5 1006/10-KP532(pI31) L
SH1,3,5 H 153/2 Z
SH1,4,5 635/3- S 12 Kaffa W
SH1,4,6 H 539/8 8
SH1,5,6 H 538/29 7
SH 1,2,3,5 H 150/8 V
SH1,2,4,5 HW 17/12 O
SH1,3,4,5 H 148/5 U
SH 1,2,3,4,5 HW 18/21 S
SH 2,5 DK &/6 D
SH 2,3,5 34/13-S 353 4/5 H
SH 2,4,5 H 152/3 Y
SH 2,5,6 H 537/18 6
SH 2,3,4,5 H 147/1 T
SH 2,3,5,6 H 535/10 9
SH 3,5 S288-23 G
SH 3,4,5 H 151/1 X
SH 3,5,6 H 581/17 10
SH 4 S 12 Kaffa γ
SH 4,5 110/5-S4 Agaro J
SH 4,5,6 H 583/5 11
SH5 Bourbon (63/1) E
SH5,6 H 440/7 4
SH5,7 or SH5,7,9a 7960/15 Without designation
SH5,6,9 H 419/20 3
SH5,8 H 420/2 2
SH5,6,7,9 H 420/10 1
SH5,6,7,8,9,? HDT 832/1 A
SH ? Hybrid Kawisari M
No SH C. racemosa F
SH6, Catimor
R aThis genotype needs confirmation

Literature review
38
Table I. 5 Genotypes for virulence in races of H. vastatrix pathogenic to C. arabica and some tetraploid
segregants of C. arabica x Coffee spp (Beleonnur selections, Icatu and HDT derivates) characterized by CIFC
(Varzea et al., 2002).
Physiological races Genotypes for virulence
I v2, 5
II v5
III v1, 5
IV v?*
VI v?*
VII v3,5
VIII v2,3,5
X v1,4,5
XI v?*
XII v1,2,3,5
XIII v5 ?*
XIV v2,3,4,5
XV v4,5
XVI v1,2,3,4,5
XVII v1,2,5
XVIII v?*
XIX v1, 4, ?*
XX v?*
XXI v?*
XXII v5, (6)
XXIII V1, 2, 4, 5
XXIV V2, 4, 5
XXV V2, 5, (6),?
XXVI V4, 5, (6)
XXVII V1, 4, (6)
XXVIII V2, 4, (5, 6)
XXIX V5, (6, 7, 8, 9)
XXX V5, (8)
XXXI V2, 5, (6, 9)
XXXII V(6), ?
XXXIII V5, (7) or v5, (7, 9)
XXXIV V2, 5, (7) or v2, 5, (7,9)
XXXV V2, 4, 5, (7, 9)
XXXVI V2, 4, 5, (8)
XXXVII V2, 5, (6, 7, 9)
XXXVIII V1, 2, 4, 5, (8)
XXXIX V2, 4, 5, (6, 7, 8, 9)
XL V1, 2, 5, (6)
XLI V2, 5, (8)
XLII V2, 5, (7, 8) or v2, 5, (7, 8, 9)
*Unknown genotype for virulence, ( ) genes of virulence to HDT derivatives

Literature review
39
3. Identification of molecular markers associated to CLR
The identification of molecular markers linked to R gene can be used in molecular marker-
assisted selection (MAS) to accelerate incorporation and accumulation of such genes by pyramiding
them into elite cultivars. Besides that, they are useful information for map-based gene cloning
strategy.
AFLP markers have been used to detected rust resistance gene introgressed into C. arabica
from C. liberica (Prakash et al., 2004). A population of F2 plants derived from a cross between two
Coffea arabica inbred lines: Matari (high susceptibility to rust), and the C. liberica introgressed line
S.288 (carrying SH3 and SH5 gene) was evaluated for resistance against three different races of H.
vastatrix. The results revealed that the progeny segregated for the SH3 gene in a 3:1 ratio, as expected
for a single dominant gene (Prakash et al., 2004) (Table I.6).
The polymorphism analysis in this population using 80 different primer combinations revealed
that at least half of the total polymorphism observed is associated with introgression of C. liberica
chromosome fragments. Three genetically independent C. liberica-alien fragments in the genome of
the introgressed line S.288 were identified, corresponding to a total length of 52.8 cM. The
introgressed were estimated to represent a half-chromosome equivalent of C. liberica distributed over
at least 3 chromosomes in the S.288 line (Prakash et al., 2004). This work was the first step towards
exploitation of MAS and map-based gene cloning strategies in coffee using SH3 genes.
In a subsequent study the same population used above was essayed to develop a genetic
linkage map and for conversion of the identified AFLP markers into sequence characterized amplified
region (SCAR) markers suitable for MAS (Mahé et al., 2008).
Table I. 6 Resistance segregation analysis in response to inoculation of three different races of
Hemileia vastatrix An F2 population of 101 individuals derived from a cross between the susceptible
line Matari and the line S.288 carrying the SH3 and SH5 rust resistance factor were evaluated (Prakash
et al., 2004).
Plant resistance pattern Response to different races
(Resistance vs Susceptibility)
Frequency of F2 individuals
Group Resistance Genes II (v5) VIII
(v2,3,5)
XIX (v1,4) (%)
A SH 3, SH 5 or SH 3 R S R 78
B SH 5 S S R 19
C - S S S 3

Literature review
40
A total of ten sequence-characterized genetic markers closely associated with the SH3 leaf rust
resistance gene were generated. From these, three markers were linked in repulsion (i.e. linked in
coupling with the susceptible allele from Matari), with the SH3 gene and seven markers were clustered
in coupling around the SH3 gene. Two markers appeared to co-segregate perfectly with the SH3 gene in
the two plant populations analyzed and should be particularly appropriate for coffee MAS (Mahé et
al., 2008).
The SCAR markers that appeared closed to SH3 gene were used to screen a C. arabica BAC
library previously developed by Noir et al (2004). Marker resources from a genetic linkage map of C.
canephora involving microsatellite (i.e. simple sequence repeats, SSR) markers (Lashermes et al.
2001) as well as new markers derived from the positive BACs, were used to develop a genetic
mapping of the SH3 locus (Figure I. 12).
Figure I. 12 Linkage map based on analysis of the chromosome segments in coupling surrounding the SH3 gene
on the F2 population (Matari x S.288). Molecular marker names are on the right, while the estimated map
distances in cM are shown on the left. SCAR markers showing codominant polymorphism are in bold (Mahé et
al., 2008).
In situ hybridization techniques such as GISH and FISH have also been employed to detect the
presence of alien fragments in the introgressed line S.288. Using total gDNA from C. liberica as probe
in GISH, 8 hybridization signals corresponding to 4 introgressed fragments were detected in different
chromosomes of S.288. Using AFLP only three introgressed fragments were detected (Prakash et al.,
2004) while using GISH 4 introgressed fragments could be visualized. However, it is likely that AFLP
marker screening failed to detect one relatively small introgressed fragment present in the S.288
genome (Herrera et al., 2007). GISH/BAC-FISH analysis was also used to confirm the presence of C.

Literature review
41
liberica-introgression mediating disease resistance to leaf rust into distal position on chromosome 1
(Herrera et al., 2007).
In other study, the inheritance of coffee resistance genes to race II of H. vastatrix has also
been analyzed by AFLP (Brito et al., 2010). The authors used a F2 and BC (back crossing) population
derived from a cross between the resistant genotype Timor Hibrid UFV 427-15 and the susceptible
cultivar Catuai Amarelo UFV 2143-236. The segregation analysis showed that the resistance of this
Timor Hibrid-derived genotype to race II of the H. vastatrix is conferred by a single dominant gene.
Three molecular markers linked to resistance gene were identified and the genetic mapping
indicated that at least one molecular marker were linked to the resistance gene at 8.69 cM. The authors
supposed that the identified resistance gene could be related to one of the genes SH7, SH8 or SH9 or
another unknown gene because the Timor Hybrid UFV-427-15 is also resistant to the race XXV which
has, in addition to v2 and v5, the virulence allele v6.
The resistance inheritance to H. vastatrix races II and XXV in different accessions of Timor
Hybrid has demonstrated to be governed by one to three genes depending on accession (Pereira,
1995). Those different patterns of inheritance are most likely reflecting the heterogeneity of the
accessions derived from the original Timor Hybrid and distributed worldwide by CIFC in the 50‘s. In
fact, the distribution was done by seed and genetic segregation obviously occurred (Bettencourt,
1973).
3.1 Partial resistance to CLR
To indentify polymorphic molecular markers associated with partial resistance to coffee leaf
rust a segregating F2 population derived from a cross between the susceptible Coffea arabica cv.
Caturra and a C. canephora-introgressed Arabica line (derived from HdT) exhibiting high partial
resistance was analyzed (Herrera et al., 2009; 2010). Low level of alien introgression has been
detected that could facilitate the rapid identification of putative resistant genes displayed by this
genotype. Molecular analysis enabled identification of seven polymorphic markers (5 AFLP and 2
SSR) exhibiting significant association with partial resistance (Herrera et al., 2009). Segregation
analysis in this population showed that although either two different markers confer its own rust
resistance, added expression of resistance was also observed when resistance alleles co-existed at the
two loci suggesting that these two loci could be involved in rust resistance and that their additive
effect is essential for this resistance (Herrera et al., 2009).

Literature review
42
PART II
1. Mechanisms of disease resistance in plants
Plants are naturally resistant to most pathogens because they have an innate ability to recognize
potential invading pathogens and to activate successful defenses (Staskawicz, 2001). Plants differ from
humans and animals because they do not have immune competent cells and circulation systems; plant
cells protect themselves locally against infection (Kiraly et al., 2007).
Classically, the failure of most pathogenic microbes to infect plants is referred to as an
‗‗incompatible‘‘ interaction, and is based on two immune phenomena: nonhost and host-specific
resistance (Hammond-kosack et al., 2003) (Figure I.13).
Non-host resistance is the first layer of plant innate immune system and is defined as strong
and broad resistance to all members of a given pathogen species. In natural plant communities non-
host resistance occurs when a plant is defeat by pathogens that have not co-evolved with the respective
plant species (Schweizer, 2007). Non-host resistance is the most common and durable form of
resistance and is known as basal resistance (Gimenez-Ibanez and Rathjen, 2010). On the other hand,
host-specific resistance is the second layer of plant defense and dependent upon the presence of a
particular pathogen race, a particular host plant cultivar, or both. The situation in which adapted
pathogens can productively colonize certain host plants the (i.e. the ‗‗compatible‘‘interaction) is the
exceptional case. During successful infections, the pathogen actively suppresses plant immunity
(Gimenez-Ibanez and Rathjen, 2010).
1.1 Non host resistance
Non-host resistance against bacteria, fungi and oomycetes are classified into two types: type I
and type II. The type I does not produce any visible symptoms (necrosis) and the type II is always
associated with rapid localized necrosis (HR). During type I, the pathogen will not be able to get past
the first or the second obstacle, and the multiplication and penetration into the plant cell will be
completely arrested. The type II is the most commonly phenomenon of nonhost resistance is that
produces a nonhost HR. This type of resistance is a more sophisticated plant defense mechanism than
type I. Some pathogens can conquer early obstacles by producing detoxifying enzymes to overcome
the toxic effect of preformed antimicrobial plant secondary metabolites (Mysore and Riu, 2004).

Literature review
43
Figure I. 13. Different types of plant-pathogen intecation (Hammond-Kosack & Kanyuka 2007).
Components of non-host resistance include: Pre-formed defense ex: plant actin
microfilaments (cytoskeleton), secondary metabolites which can act as antimicrobial compounds such
as: Saponins, steroid, or steroidal alkaloid molecules. Inducible plant defense mechanisms such as
Phytoalexins that are synthesized in response to pathogens attack; Plant defense signaling like:
hormone ethylene, salicylic acid, wound-induced protein kinase (WIPK) and salicylic acid-induced
protein kinase (SIPK), Heat-skock proteins (Hsps), SGT1 (Skp1-cullin-F-box protein) ubiquitin ligase
complex and broad-spectrum disease resistance genes: like NHO1, EDS1, PEN1, PEN2, ROR2
(reviewed by Mysore and Riu, 2004).
Once the pathogens are able to overcome the pre-formed barriers, they also could be detected
by the extracellular receptors of plant cell that are able to recognize some conserved structural
components of potential pathogens (such as fungal chitin or bacterial flagellin) (Nurenberger et al.
2004). These conserved structural components are named pathogen/microbe–associated molecular
patterns (PAMPs or MAMPs) and they are recognize through pattern recognition receptors (PRR) at
the plant‘s cell surface leading to the induction of defense responses in plant (Jones and Dangl 2006;
Interaction
types
NON-HOST
HOST
INCOMPATIBLE
COMPATIBLE
Plant
Immune Resistant Susceptible
Pathogen MAMPs detection -
avirulence
Avr effector
recognized-avirulent
Effectors/toxins
interact with specific
host target – virulent
Plant
defense
Preformed
structural or
biochemical
activation of innate
immunity
Basal defense and R
protein mediated
activation of plant
defense with cross-
talk
Basal defenses only
Outcome No disease-species
incompatibility
No/highly reduced
disease level
Gene-for-gene
mediated resistance
Disease – prolific
pathogen replication
and dissemination

Literature review
44
Boller and He, 2009). The plant responses to PAMP/MAMPs have been called PAMP/MAMP-
triggered immunity (MTI or PTI) (Jones and Dangl 2006; Boller and He, 2009).
1.1.1 PAMP/MAMP-triggered immunity (PTI/MTI)
MAMPs are elicitors with highly conserved molecular structures among whole classes of
pathogens. They are indispensable for the microbial lifestyle and cannot be easily modified to evade
recognition (Gimenez-Ibanez and Rathjen, 2010). Plants can recognize a wide number of bacterial
P/MAMPs including flagellin, elongation factor Tu (EF-Tu), cold shock protein, peptidoglycan
(PGN), lipopolysaccharides (LPS) and superoxide dismutase (Boler and Felix, 2009). The plant
receptors that recognize P/MAMP are called Pattern Recognition Receptors (PRR) and are typically
localized in the plasma membrane (Zipfel & Felix, 2005). The plant PRR so far known are: receptor
kinases (RKs), receptor likeproteins (RLPs) (Shiu and Bleecker, 2001; Fritz-Laylin, et al., 2005) and
carbohydrates (Zipfel, 2009).
Plant and animal cells can also recognize molecules from damaged host cells that are normally not
available for recognition. These damage-associated molecular patterns (DAMPs) are released and
recognized upon microbial attack (Lotze et al., 2007). Polysaccharides released from the plant cell
wall (e.g. oligogalacturonides, or OGs), and some endogenous peptides are examples of DAMPs
(Huckelhoven, 2007). The DAMPs seams to active the MAPK cascades similarly to the PTI ones, and
they are also recognized by PRR, suggesting that MAMP and DAMPs have the same recognition
pattern (Boller & Felix, 2009).
Pathogens that have the ability to cause infection on particular host plants have evolved means
of suppressing of recognition of MAMP elicitors, through the use of effectors proteins that are
delivered into host cells to manipulate these signaling processes. These effectors proteins are able of
interfering with the host defense system function resulting in breakdown of host basal resistance
establishing a basic compatibility between the pathogen and host (Dodds and Thrall, 2009). On the
other hand, the selection pressure imposed by the successful pathogen lead the host plants to evolve
novel defense mechanism to survive. This second mechanism of defense is called as host resistance or
effector-triggered immunity (ETI), more commonly known as resistance (R) proteins that specifically
recognize pathogen effectors and then trigger strong host defenses (Chisholm et al. 2006; Ellis et al.
2007; Bollar and He, 2009).

Literature review
45
1.2 Host resistance (Effector-Triggered Immunity (ETI))
Effector-triggered immunity (ETI) also known as gene-by-gene theory was first proposed by
Flor in 1947 when he studied the interaction between rust (Melampsora lini) of flax (Linum
usitatissimum). He suggested that obligate parasites, such as the rust fungi, co-evolved with their hosts
developing complementary genic systems. In this way, plants contain single dominant resistance (R)
genes specifically recognize pathogens containing complementary avirulence genes. Specific
recognition results in the induction of defense gene expression and the inhibition of pathogen growth.
Nevertheless, if either R genes are absent in the plant host or R genes failed in recognize Avr genes,
the pathogen is able to colonize it and cause disease on that plant. A diagram illustrating the gene-for-
gene interaction using coffee-rust interaction as model is showed in Figure I.14.
Most R proteins control only pathogen races, which express the corresponding effector
protein(s) and are therefore called race-specific R proteins. Occasionally, effective resistance is
conferred against multiple races and even different pathogen species. These R proteins are called race-
non-specific (Hammond-Kosak and Kanuya, 2007).
Figure I. 14 Quadratic diagram illustrating the gene-for-gene interaction between host resistance (R) genes and
rust avirulence (Avr) genes using coffee-rust as model.

Literature review
46
When there is an interaction between R gene and its corresponding Avr gene a type of
programmed cell death termed the hypersensitive response (HR) occurs in the infected cells and
immediate surrounding areas (Hammond- Kosack and Jones, 1996; Heath et al. 2000; Shirasu and
Schulze-Lefert, 2000). R gene-mediated recognition of pathogen effectors activates a series of defense
signaling cascades that involves protein phosphorylation, ion fluxes, generation of reactive oxygen
species (ROS) and other signals (Hammond-Kosack and Jones, 1996; Yang et al., 1997; Somssich and
Hahlbrock, 1998; Durrant and Dong, 2004). These signals subsequently trigger transcription of plant
defense genes encoding proteins such as glutathione S-transferases, peroxidases, cell wall proteins,
proteinase inhibitors, hydrolytic enzymes (e.g. chitinases and 1,3 glucanases), pathogenesis-related
(PR) proteins and enzymes involved in secondary metabolism (Zhu et al., 1996). Although each
branch of the plant immune system is controlled by distinct receptor classes, most of the downstream
defense events associated with PTI and ETI are shared and it typical immune events activated upon
microbial perception (Table I.7).
Table I. 7 Summary of the different forms and mechanisms of plant disease resistance (Kiraly et al., 2007)
Resistance phenomenon Mechanism
Innate resistance
Non-specific, gerenal resistence
Non-host resitance HR, ROS, BAX inhibitor-1, PEN genes
Basal resistance against bacteria Flagellin/FLS2 interaction,
ROS, antimicrobial compounds
Race non-specific mlo resistance and
quantitative resistance to fungi
Cell wall thickening
Antimicrobial compounds
ROS
Resistance to necrosis-inducing stresses High antioxidant capacity
Specific resistance (cultivar/pathogenic race specificity)
Extreme resistance – symptomless gene-for-gene resistance
Rx-resistance against viruses without HR
Symptomless reaction to rust pathogens, no visible HR
Unknown
Gene-for-gene resistance
R-gene « Avr-gene interaction associated with the hypersensitive
response (HR)
ROS
Phytoalexins
Phenol oxidation
Stress proteins
Resistance to pathogen toxins Enzymatic detoxification
Lack of toxin receptors
Gene silencing Recognition and decomposition of
foreign RNAs with ribonucleases
Acquired resistance
After a primary infection an acquired resistance
develops against a second infection ‗Stress memory‘
Accumulation of SA
Stimulated antioxidants
Gene silencing
Rhizobacterial induction

Literature review
47
Both PTI and ETI contribute to plant immunity and largely support nonhost and host-specific
resistance, respectively, although the relationship is not exclusive. ETI is generally considered as an
accelerated and amplified PTI response, resulting in disease resistance and, often, a hypersensitive cell
death response (HR) at the infection site (Gimenez-Ibanez and Rathjen, 2010). The‗zigzag‘ model was
proposed by Jones and Dangl (2006) to represent four phases of the plant immune system (Figure
I.15). In phase 1, PAMPs (or MAMPs) are recognized by PRRs, resulting in PAMP-triggered
immunity (PTI) that can halt further colonization. In phase 2, successful pathogens deploy effectors
that contribute to pathogen virulence. Effectors can interfere with PTI. This results in effector-
triggered susceptibility (ETS). In phase 3, a given effector is ‗specifically recognized‘ by one of the R
proteins, resulting in effector-triggered immunity (ETI). Recognition is either indirect, or through
direct R recognition of an effector. In phase 4, natural selection drives pathogens to avoid ETI either
by shedding or diversifying the recognized effector gene, or by acquiring additional effectors that
suppress ETI. Natural selection results in new R specificities so that ETI can be triggered again.
Figure I. 15 The‗zigzag‘ model proposed to represent four phases of the plant immune system (Jones and Dangl
2006).

Literature review
48
Brief, a simplified overview of the plant immune system for the post-invasive line of defense
can be summarized as follow: First, the primary immune response recognizes common features of
microbial pathogens, such as flagellin, chitin, glycoproteins and lipopolysaccharides. These microbial
determinants are referred to as pathogen-associated molecular patterns (PAMPs). PAMPs activate
pattern-recognition receptors (PRRs), which in turn initiate diverse downstream signaling events that
ultimately result in the activation of a basal resistance that is called PAMP-triggered immunity (PTI;
Figure I.16a). During the co-evolutionary arms race between pathogens and their host plants,
pathogens acquired effector molecules that are transported into the host cell to suppress PTI and
promote virulence of the pathogen, resulting in effector-triggered susceptibility (ETS; Figure I.16 b).
In turn, plants acquired resistance (R) proteins that recognize these attacker-specific effectors,
resulting in a secondary immune response called effector-triggered immunity (ETI; Figure I.16 c).
Ultimately, the final outcome of the battle depends on the balance between the ability of the pathogen
to suppress the plant‘s immune system and the capacity of the plant to recognize the pathogen and to
activate effective defenses (reviewed by Pieterse et al., 2009).
Figure I. 16 Simplified schematic representation of the plant immune system (Pieterse et al., 2009).

Literature review
49
2. Modes of plant-pathogen interaction
2.1 Direct Interaction
The pathogen invading the plant cell can be recognized by R-Avr interactions that can occur
direct or indirectly (Figure I.17). Direct interaction is the simplest form of recognition and occurs via
direct physical association of the pathogen effector with the R immune receptor, similar to a ligand
binding to its receptor (Caplan et al., 2008). In direct interaction an R protein detects an Avr protein
and triggers host resistance, in this case selection pressure should be imposed on the pathogen carrying
Avr gene to evade recognition that could occur by mutations in the Avr protein (Xiao et al., 2008).
Direct interaction has been demonstrated in the tomato Pto protein kinase, which is tied to the
plasma membrane and interacts directly with its cognate bacterial effector AvrPto within the
serine/threonine kinase activation domain at residue threonine 204. Tomato Pto also interacts directly
with a second bacterial effector AvrPtoB, which has intrinsic E3 ubiquitin ligase activity. For three R
proteins direct interaction with effectors has also been demonstrated. The Arabidopsis RRS1-R protein
interacts with bacterial type III effector Pop2, rice Pi-ta interacts with AVR-Pita (a predicted secreted
metalloprotease) from the Ascomycete rice blast fungus Magnaporthe grisea (reviewed by Hammond-
Kosak and Kanuya, 2007).
The interaction between L locus from flax and cognate AvrL567 in Melaspsora lini was
studied by Ellis et al. (1999). The L locus encodes at least 11 R alleles (including L5, L6, L7) capable
of recognizing distinct Avr genes belonging to different loci, including AvrL567 in the pathogen.
Using the yeast two-hybrid system it was demonstrated that the R proteins L5, L6 and L7 physically
direct interact with the corresponding Avr proteins. However, failure to detect direct R-Avr
interactions in plants or in vitro in many R-Avr interactions prompted the researches to suggest
existence of alternative recognition targets and even multiprotein recognition complexes such as
Guard or Decoy model.

Literature review
50
Figure I. 17 The three Modes of Pathogen Recognition. Direct interaction (A), Indirect interaction associated
with the immune receptor (B) or with the pathogen effector (C) and then is subsequently recognized by the
immune receptor. The third type of recognition occurs when a pathogen effector mimics a transcription factor
and directly induces the expression of a non-NB-LRR resistance protein (D) (Caplan et al., 2008).
2.2 The Guard Model (indirect R-Avr) interactions
The guard model or ‗guard hypothesis‘ suggests that host proteins targeted during
pathogenesis are monitored, or guarded, by R proteins become cofactors in recognition (Van der
Biezen, and Jones, 1998; Dangl and Jones, 2001). The Guard Model was originally proposed to
explain the interaction between Pseudomonas syringae and AvrPto perception by the tomato proteins
Pto and Prf (Van der Biezen and Jones, 1998). An example of guard model was characterized in
Arabidopsis RIN4 protein where a host target for type III bacterial effectors is recognized by at least
two CNL R proteins (RPM1 and RPS2). CNL protein RPM1 detects the phosphorylation of RPM1-
Interacting Protein 4 (RIN4) by the pathogen effectors AvrB and AvrRpm1 from Pseudomonas
syringae pv. glycinea and pv. maculicola, respectively, and elicits the resistance response (Mackey et
al., 2002). In these instances RIN4 is a 211-amino acid acetylated protein, which is plasma membrane
associated. AvrRpt2 is a cysteine protease and is a third effector that cleaves RIN4 at two sites
recognized inside the plant cell (Axtell et al., 2003; Kim et al., 2005). Cleavage of RIN4 is detected,

Literature review
51
however, by a second CNL the NB-LRR R protein, RPS2 that in turn elicits the defense response
(Axtell & Staskawicz 2003; Mackey et al., 2003). Such indirect detection of pathogens allows a
limited number of NBS-LRR R proteins to detect the activity of multiple pathogen effectors that target
points of vulnerability in the plant (McHale et al., 2006). For example, tomato Mi-1, a CNL R protein,
confers resistance to three species of root feeding nematodes as well as an aphid and a whitefly pest.
Possibly, recognition of a common signal type or the guarding of a common host susceptibility target
is involved in defense activation. Other R loci show dual specificity because of tightly linked genes
with nearly identical sequences. An example is the neighboring genes in the potato genome, Gpa2 and
Rx1 both of which encode CNL proteins and confer resistance to a nematode and a virus, respectively.
Gpa2/Rx1 protein domain swapping experiments have recently demonstrated that the recognition
specificity is conferred by the C-terminal half of the LRR domain (reviewed by Hammond-Kosak and
Kanuya, 2007). However, recent data on indirectly recognized effectors have emerged that are
inconsistent with the original description of the Guard Model. Many pathogen effectors have multiple
targets in the host and that classical guarded proteins are often dispensable for the virulence activities
of effectors in plants lacking the R protein. New data on additional targets of AvrPto and AvrBs3
prompted proposals of the concept that some host targets of effectors act as decoys to detect pathogen
effectors via R proteins (Zhou and Chai, 2008; Zipfel and Rathjen, 2008).
2.3 Decoy model
The decoy model is based on the supposition that selection pressures have favored recognition
cofactors that continue to interact with Avr proteins but are not under pressure to avoid targeting by
pathogen-derived proteins (Collier and Moffett 2009). The decoy mimics effector targets to trap the
pathogen into a recognition event. Decoys might evolve from effectors targets by gene duplication
followed by subsequent evolution or evolve independently by mimicking effectors targets (target
mimicry). In any case, the Decoy Model implies that the effectors target monitored by the R protein is
a decoy that mimics the operative effectors target but only functions in perception of pathogen
effectors without contributing pathogen fitness in the absence of its cognate R protein (van der Hoorn
and Kamoun 2008).
From an evolutionary point of view, the guarded effector target is in an unstable situation since
it is subjected to two opposing natural selection forces in plant populations where R genes
are
polymorphic. In this case, R gene polymorphism means the presence/absence of functional R genes in
different individuals in a plant population (Figure I.18).

Literature review
52
Figure I. 18 Opposing selection forces on guarded effector targets in a plant population polymorphic for R
genes. In the absence of the R protein (green arrows), targets will be under selective pressure to reduce the
interaction and evade manipulation (left). In the presence of the R protein (red arrows), the guarded effector
target will be under selective pressure to improve the interaction with the effector and enhance pathogen
perception (right). From: van der Horn et al., 2008
An example for the decoy model can be given with the tomato (Solanum lycopersicum)
Ser/Thr kinase Pto, which interacts with the NB-LRR protein Prf and mediates recognition of the
AvrPto and AvrPtoB proteins of Pseudomonas syringae. The actual virulence targets of AvrPto and
AvrPtoB, however, appear to include the kinase domains of the receptor-like kinases CERK1, BAK1,
EFR1 and FLS2, rather than the kinase domain of Pto (Shan et al., 2008; Gimenez-Ibanez et al. 2009).
This could be interpreted as an indication that Pto is being used as a type of bait by Prf to interact with
effectors proteins that normally target other kinases. In this context, Collier and Moffett (2009)
proposed that the use of such recognition cofactors as bait is a common mechanism employed by NB-
LRR proteins to sense Avr proteins and activate a molecular switch that results in the induction of
resistance responses. In Figure I.19 the guard model classical, multiple and decoy model are
contrasted.

Literature review
53
Figure I. 19 Comparisons of the Guard and Decoy Models. The classical Guard Model (A) is contrasted with a
modified Guard Model in which the effector targets multiple plant proteins (B) and the Decoy Model (C).
Effectors are depicted in gray, operative effector targets in purple, guardee in green, decoy in blue, and the R
protein in orange (van der Horn et al., 2008).
3. Avirulence genes (effectors)
Avirulence gene is a gene encoding a protein which is specifically ‗recognized‘ by genotypes
of the host plant harbouring the matching resistance gene, regardless of its function or role in
pathogenicity (Rouxel et al., 2010). Avirulence genes have positive roles in establishing infection,
which the plant has evolved to recognize as an indicator of invasion (Catanzariti et al., 2007). This

Literature review
54
concept was first developed in bacteria since they have both elicitor (avirulence) and virulence
activities (van den Burg et al., 2003; Rooney et al., 2005) and after generalized to all plant pathogens
(Rouxel et al., 2010).
Successful pathogens including viruses, bacteria, protozoans, fungi, oomycetes and nematodes
use effectors to alter the plant‘s in morphology, physiology, biochemistry state to benefit colonization
or to suppress the activation of host plant defenses (Bent and Mackey 2007; Torto-Alalibo et al. 2009).
Effector delivery occurs via diverse mechanisms. Physical injection via analogous systems is
one mechanism by which diverse plant pathogens deliver effectors to their hosts. Plant parasitic
nematodes possess a syringelike stylet for both effector delivery and nutrient uptake. The haustoria of
certain biotrophic oomycetes and fungi are analogous structures formed when a hypha penetrates a
host cell wall, causing host plasma membrane invagination.
There is no general common structure between avirulence gene products, except that most are
secreted proteins. Because there would be no evolutionary advantage to a pathogen keeping a protein
that only serves to have it recognized by the plant, it is believed that the products of Avr genes play an
important role in virulence in genetically susceptible hosts. In fungi there is no proof that Avr proteins
contribute directly to infection success. Although nothing is known about the function of these fungi
Avr genes, all of them are subjected to diversifying selection, which implies that they are maintained
in populations because they play a role in pathogenicity. Some of the Avr genes identified in rust fungi
are upregulated within the haustoria, suggesting a role in the establishment of biotrophy (Catanzariti et
al., 2007).
Of the vast number of bacterial effector proteins that have been cloned, only a few have been
biochemically characterized. Characterized effectors possess enzyme activity and modify host proteins
to promote bacterial virulence. Effectors may have evolved to target key components of PAMP-
triggered defense, or they may target a variety of different host proteins to promote pathogenicity
(Chisholm et al., 2006). Most cloned fungal effectors are small proteins of unknown function
containing a signal for secretion into the apoplast (Chisholm et al., 2006). Most of these Avr genes
show no sequence homology among each other.
4. Resistance Genes (R genes)
The resistance proteins provides plant two capabilities; firstly recognition of specific
pathogen(s) and secondly activation of defense responses. Over 70 plant R genes controlling resistance
against pathogens ranging from viruses, bacteria, fungi to nematodes have been isolated from different
plant species (Liu et al., 2007; Xiao et al 2008;). (Table I.8). Among them several different classes of

Literature review
55
R genes has been characterized. Comparative analysis of the cloned R- genes from different plants and
providing resistance to different pathogens have revealed certain conserved amino acid domains that
include nucleotide-binding sites (NBS), leucine-rich repeat (LRR), transmembrane domains (TM) and
serine/threonine protein kinases (PK‘s) arranged in different combinations (Hammond-kosack and
Jones 1997). Based on the arrangements of different domains found in R proteins they can be
classified into few classes (Figure I.20). A few dominantly inherited R proteins do not fit these five
major classes. These include maize Hm1, Arabidopsis RPW8, sugar beet Hs1pro1, tomato Ve proteins,
barley Rpg1, Arabidopsis RFO1, rice Xa21 and rice Pi-d2 (Hammond-Kosak and Kanuya, 2007).
The NBS-LRR genes represent the largest class of R genes (Martin et al, 2003) and encode
proteins with a variable N-terminal domain of approximately 200 amino acids, connected by predicted
NBS domain of approximately 300 aa and a more variable tandem array of approximately 10 to 40
short LRR motifs (Jones and Jones, 1997).
So far, among the cloned resistance genes, which confer resistance to fungal and bacterial
pathogens only four, are recessive: barley mlo, Arabidopsis edr1, Arabidopsis rrs1-r and rice xa5.
Whilst the functions of dominantly inherited R gene products are beginning to emerge, the molecular
mechanisms involved in recessive resistance are less well understood (Hammond-Kosak and Kanuya,
2007).
Table I. 8 Non exhaustive list of identified disease resistance genes in plants (Liu et al, 2007)
Gene Host Pathogen Protein type Reference
RPS2 Arabidopsis Pseudomonas syringae CC-NBS-LRR Science, 1994, 265: 1856-1860
RPS5 Arabidopsis Pseudomonas syringae LZ-NBS-LRR Plant Cell, 1998, 10: 1439-1452
RPM1 Arabidopsis Pseudomonas syringae CC-NBS-LRR PNAS, 1998, 95: 15849-15854
RPP8/HRT Arabidopsis Peronospora parasiticia CC-NBS-LRR Plant Cell, 1998, 10: 1861-1874
RPP13 Arabidopsis Peronospora parasiticia CC-NBS-LRR Plant J, 2000, 21: 177-188
RCY1 Arabidopsis Cucumber mosaic virus CC-NBS-LRR Plant J, 2002, 32: 655-667
RPP/HRT Arabidopsis Turnip crinkle virus CC-NBS-LRR Plant Cell, 2000, 12: 663-676
RPM1 Tomato Pseudomonas syringae CC-NBS-LRR Science, 1995, 269: 843-846
Prf Tomato Pseudomonas syringae CC-NBS-LRR Cell, 1996, 86: 123-133
I2 Tomato Fusarium oxysporum CC-NBS-LRR Plant Cell, 1997, 9: 521-532
Mi-1 Tomato Meloidogyne javanica CC-NBS-LRR Plant Cell, 1998, 10: 1307-1319
Mi-9 Tomato Meloidogyne javanica CC-NBS-LRR Plant Physiol, 2007, 143: 1044-1054
Sw-5/Mi Tomato Tospovirus CC-NBS-LRR Mol Plant-Microbe Interact, 2000, 13: 1130-1138
Rx2 Potato PVX (Potato X virus) CC-NBS-LRR Plant Cell, 1999, 11: 781-792
Gpa2/Rx1 Potato Globodera pallida/PVX CC-NBS-LRR Plant J, 2000, 23: 567-576
R1 Potato Phutophthora infestans CC-NBS-LRR Plant J, 2002, 30: 361-371
Mla1 Barely Blumeria graminis CC-NBS-LRR Plant Cell, 2001, 13: 337-350
Mla6 Barely Blumeria graminis CC-NBS-LRR Plant J, 2001, 25: 335-348
Mla12 Barely Blumeria graminis CC-NBS-LRR Plant Cell, 2003, 15: 732-744

Literature review
56
Mla13 Barely Blumeria graminis CC-NBS-LRR Plant J, 2004, 38: 215-226
Pib Rice Magnaporthe grisea CC-NBS-LRR Plant J, 1999, 19: 55-64
Pi-ta Rice Magnaporthe grisea CC-NBS-LRR Plant Cell, 2000,12: 2033-2046
Pi36 Rice Magnaporthe grisea CC-NBS-LRR Genetics, 2007: doi:10.1534
Xa1 Rice Xanthomona oryzae CC-NBS-LRR PNAS, 1998, 95: 1663-1668
Rp1 Maize Puccinia sorghi CC-NBS-LRR Plant Cell, 1999,11: 1365-1376
Dm3 Lettuce Bremia lactucae CC-NBS-LRR Plant Cell, 1998,10: 1818-1832
Bs2 Pepper Xanthomonas campestris CC-NBS-LRR PNAS, 1999, 96: 14153-14158
Pm3b Wheat Blumeria graminis f. sp.Tritici
CC-NBS-LRR Plant J, 2004, 37: 528-538
Lr10 Wheat Puccinia triticina CC-NBS-LRR PNAS, 2003, 10: 15253-15258
Pl8 Sunflower Plasmopara halstedii CC-NBS-LRR J Experi Botany, 2005, 56: 567-575
RPS4 Arabidopsis Pseudomonas syringae TIR-NBS-LRR Plant J, 1999, 20: 265-277
RPP1 Arabidopsis Peronospora parasiticia TIR-NBS-LRR Plant Cell, 1998, 10: 1847-1860
Rpp10 Arabidopsis Peronospora parasiticia TIR-NBS-LRR Plant Cell, 1998, 10: 1847-1860
Rpp14 Arabidopsis Peronospora parasiticia TIR-NBS-LRR Plant Cell, 1998, 10: 1847-1860
RPP4 Arabidopsis Peronospora parasiticia TIR-NBS-LRR Plant J, 2002, 29: 439-451
RPP5 Arabidopsis Peronospora parasiticia TIR-NBS-LRR Plant Cell, 1997, 9: 879-894
SSI4 Arabidopsis P. syringae pv. maculicola
TIR-NBS-LRR Plant Cell, 2002, 14: 3149-3162
L6 Flax Melampsora lini TIR-NBS-LRR Plant Cell, 1995, 7: 1195-1206
L, L1-L11, LH Flax Melampsora lin TIR-NBS-LRR Plant Cell, 1999, 11: 495-506
M Flax Melampsora lini TIR-NBS-LRR Plant Cell, 1997, 9: 641-951
P Flax Melampsora lini TIR-NBS-LRR Plant Cell, 2000, 13: 163-178
P2 Flax Melampsora lini TIR-NBS-LRR Plant Cell, 2002, 13: 163-178
Bs4 Tomato Xanthomonas campestris TIR-NBS-LRR Plant J, 2004, 37: 46-60
N Tobacco Tobacco mosaic virus TIR-NBS-LRR Cell, 1994, 78: 1011-1015
RRS1-R Arabidopsis Ralstonia solanscearum WRKY-TIR- NBS-
LRR
PNAS, 2002, 99: 2404-2409
Pi9 Rice Magnaporthe grisea NBS-LRR Genetics, 2006, 172: 1901-1914
Pi2 Rice Magnaporthe grisea NBS-LRR Mol Plant-Microbe Interact, 2006, 11: 1216-
1228
Piz-t Rice Magnaporthe grisea NBS-LRR Mol Plant-Microbe Interact, 2006, 11: 1216-1228
Cre3 Wheat Heterodera avenuae NBS-LRR Genome, 1997, 40: 659-665
Cre1 Wheat Heterodera avenuae NBS-LRR Mol Plant-Microbe Interact, 2003, 16: 1129-
1134 I2C Tomato Fusarium oxysporum NBS-LRR Plant Cell, 1997,9:521-532
Hero Tomato Globodera rostochiensis NBS-LRR Plant J, 2002,31:127-136
Rpg1 Barley Puccinia graminis Protein kinase PNAS, 2002, 99: 9328-9333
RPP27 Arabidopsis Peronospora parasiticia Receptor like protein Plant Physiol, 2004, 135: 1100-1112
Pto Tomato Pseudomonas syringae Ser/Thr protein
kinase
Science, 1993,262: 1432-1436
Xa21 Rice Xanthomona oryzae LRR-Ser/Thr protein kinase
Science, 1995, 270: 1804-1806
Xa21D Rice Xanthomona oryza LRR receptor- like
protein
Plant Cell, 1998, 10: 765-780
Xa26 Rice Xanthomona oryzae LRR receptor- like
kinase
Plant J, 2004, 37: 517-527
RFO1 Arabidopsis Fusarium oxysporum Receptor-like kinase Genetics, 2005, 171:305-321
Pi-d2 Rice Magnaporthe grisea B-lectin PK Plant J, 2006, 46: 794-804
Cf-9 Tomato Cladosporium fulvun LRR-TM Science, 1994, 266: 789-793

Literature review
57
Cf-2 Tomato Cladosporium fulvun LRR-TM Cell, 1996, 84: 451-459
Cf-4 Tomato Cladosporium fulvun LRR-TM Plant Cell, 1997, 9: 2209-2224
Hcr9-4E Tomato Cladosporium fulvum LRR-TM Mol Microbiol, 2004, 54: 533-545
Cf-2/5 Tomato Cladosporium fulvun LRR-TM Plant Cell, 1998, 10: 1915-1925
Ve Tomato Verticillium dahliae LRR-TM PNAS, 2001, 98: 6511-6515
Hslpro-l Beet Heterodera schachtii LRR-TM Science, 1997, 275: 832-834
Rpw8 Arabidopsis Erysiphe cruciferarum TM-CC Science, 2001, 291:118-120
Mlo Barely Erysiphe graminis TM Cell, 1997, 88: 695-705
Xa5 Rice Xanthomona oryzae TFⅡA Trans-
cription factor
Mol Genet Genomics, 2006, 275: 354- 366
Xa27 Rice Xanthomona oryzae No homolog Nature, 2005, 435:1122-1125
Xa13 Rice Xanthomona oryzae Homolog of nodulin
MtN3
Genes Dev, 2006, 20: 1250-1255
Figure I. 20 Classes of R protein and their cellular location. CC, coiled-coil domain; TIR, Toll and Interleukin 1
receptor-like motif; NB, nucleotide binding site; LRD, leucine-rich domain; LRR, leucine-rich repeat; NLS,
nuclear localization signal; ECS, endocytosis signal; PEST, Pro-Glu-Ser-Ther-like sequence; STK serine
threonine kinase, WRKY, 1, 2, 3, 4 novel domains that lack significant homology to known proteins; 5, domain
with homology to a B-lectin; 6, structure with a weak similarity to a PAN domain; 7, structure with homology to
epidermal growth factor (EGF)-like domain. Adptated from: Hammond-Kosack & Kostya Kanyuka, 2007.

Literature review
58
4.1 Classes of Resistance Gene
4.1.1 RLP and RLK class of R genes
R proteins including class that comprises cell surface receptor-like transmembrane proteins
(RLP) and receptor-like kinases (RLK). The common feature of these proteins is that they possess an
extracellular LRR (eLRR) domain. Representatives of RLP R proteins are tomato Cf proteins
conferring resistance to the tomato fungal pathogen Cladosporium fulvum (Jones et al. 1994;
Hammond- Kosack and Jones 1997) and Arabidopsis RPP27 conferring resistance to the oomycete
Hyaloperonospora parasitica (Tor et al. 2004). RLK R proteins are represented by rice Xa21 and
Xa26, both of which confer resistance to multiple strains of Xanthomonas oryzae pv. oryzae (Song et
al. 1995; Sun et al. 2004).
The remaining R genes encode proteins that either resembles the overall structure or a domain
of the above two classes with some degree of structural variation, or have a novel protein structure that
does not show significant homology to any other R proteins. Therefore, they are atypical R genes in
comparison with the LRR-encoding R genes. For example, tomato Pto and Arabidopsis PBS1 encode
members of a conserved protein kinase family (Martin et al. 1993; Swiderski and Innes 2001) that
resemble the cytoplasmic protein kinase domain of RLK R proteins.
4.2 The NBS-LRR class
Nucleotide Binding Site-Leucine Rich Repeats (NBS-LRR) proteins are some of the largest
proteins known in plants, ranging from about 860 to about 1,900 amino acids (McHale et al., 2006).
They have at least four distinct domains joined by linker regions: a variable amino-terminal domain,
the NBS domain, the LRR region, and variable carboxy-terminal domain (Hammond-Kosack and
Jones 1997; Dangl and Jones 2001, McHale et al., 2006). The NBS of intracellular plant R proteins
and animal Nod1/Nod2 proteins, which function in inflammatory and immune responses (Inohara et
al., 2005), is part of a larger domain called NB-ARC, because it is shared between R proteins of both
human apoptotic protease-activating factor 1 (APAF-1) and its Caenorhabditis elegans homolog
CED-4 (Van der Biezen and Jones 1998).
The ARC domain can be further subdivided into two structurally and functionally distinct
units; ARC1 and ARC2, where the ARC1 motif is required for the binding between the CC-NB and
the LRR of the R protein, and the ARC2 motif is required for switching on/off the R molecule through
its interaction with the LRR domain (Rairdan and Moffett 2006). Together, the NB and ARC domains

Literature review
59
comprise a functional nucleotide binding pocket. These R proteins confer resistance to various
pathogens and can be further subdivided into two groups, based on their N-terminal features. The first
group contains N-terminal domains that resemble the cytoplasmic signaling domain of the Drosophila
toll and human interleukin-1 receptors (TIR) and are called TNL (TIR-NBS-LRR) (Whitham et al.
1994; Lawrence et al. 1995). The second group contains (in most cases) a coiled coil (CC) domain and
is often referred to as CNL (CC-NBS-LRRs) (Bent et al. 1994; Grant et al. 1995).
Proteins carrying an NB–ARC domain belong to the STAND (Signal Transduction ATPases
with Numerous Domains) family of NTPases (Leipe et al., 2004) and can be differentiated by many
conserved the NB–ARC domain, such as a central domain nucleotide-binding site, kinase-1a or P-
loop, kinase 2, and kinase 3a, and it may affect R protein function through nucleotide binding,
hydrolysis, and the control of cell death (Martin et al. 2003; Lukasik and Takken, 2009). The
schematic representation of a typical NB–LRR protein is shown in Figure I.21.
The NB domains of TNLs and CNLs sub class are distinguished by the sequences of three
motifs: RNBS-A, RNBS-C, and RNBS-D present in NB domain (Meyers et al., 2003). TNL group
could also have a WRKY domain attached to the LRR at the C-terminus as is the case of Arabidopsis
RRS1-R protein for example (Deslandes et al. 2002).
The CC domain is sometimes joined and/ or replaced by a Solanaceae domain (SD) or a
predicted BED DNA binding domain. Alternatively, a number of predicted NB-LRR proteins of both
the TNLs and CNLs (as defined by the configuration of their NB-ARC domains) seem to possess no
N-terminal sequence in their NB domain (Absent). The N-termini of CNL proteins show little
sequence or structural similarity. Even within the loosely defined CC domains the only apparently
widely conserved feature is a small ‗‗EDVID‘‘ motif, which defines the largest subclass of CC domain
(Collier and Moffet, 2009).
Both TNLs and CNLs include members that experience alternative splicing. The induction of
splice variants upon pathogen recognition has been observed for plant NB-LRR proteins, suggesting
that alternative splicing may have a regulatory role in the plant defense response (Jordan et al., 2002).

Literature review
60
Figure I. 21 Schematic representation of a typical NB–LRR protein. The (sub) domains are depicted as coloured
boxes: CC/TIR domain (orange), NB (red), ARC1 (purple), ARC2 (blue) subdomains and LRR domain (green)
whereas conserved motifs are marked as lines. Consensus of sequences is written next to name of the motif.
Insert, predicted 3D structure of the NB–ARC domain of I-2 modelled on the ADP-bound Apaf1 (1z6t) template
Conserved motifs and N- and C-termini are marked. ADP and Mg atoms are depicted as balls and sticks
(Lukasik and Takken 2009).

Literature review
61
4.2.1 The function of main domains in NB-LRR proteins
4.2.1.1 Nucleotide binding site (NBS)
The NBS domain works binding ATP, ADP which initiates conformational changes in plant
NBS-LRR proteins, resulting in its activation (Leipe et al., 2004; Young & Innes, 2006).
The crystal structures of the NBS domains of mammalian apoptotic protease activating factor
1 (Apaf-1) and the Caenorhabditis elegans cell death protein CED-4 has provided informative insights
into the spacial arrangement and function of the conserved motives in NBS plant domains. The NBS
domain of Apaf-1 is composed of four subdomains: a three-layered α-β domain (which contains the
Ploop), a helical domain, an extended winged-helix domain (containing the MHD motif) and a second
helical domain (also called ARC1, ARC2 and ARC3). The structure of CED-4 is similar to that of
Apaf-1, but it lacks ARC3. Sequence analysis suggests that plant NBS-LRR proteins have a domain
structure similar to that of Apaf-1 and CED-4, but like CED-4 they lack ARC3. The crystal structures
of both CED-4 and Apaf-1 indicate that an ATP or ADP is bound in a pocket that is mostly confined
in the NBS domain (Young & Innes, 2006).
The NBS domain is highly conserved among R proteins (McHale et al., 2006). The presence
of conserved motifs such as a central domain nucleotide-binding site, kinase-1a or P-loop, kinase 2,
and kinase 3a may affect R protein function through nucleotide binding, hydrolysis, and the control of
cell death (Martin et al., 2003).
The conserved motif within the NB domain has been used extensively to identify resistance
genes homologs in model and crop species (Kanazin et al., 1996; Aarts et al., 1998; Penuela et al.,
2002; Zhu et al., 2002; Ferrier-Cana et al., 2003; Yaish et al., 2004; Noir et al., 2004; Palomino et al.,
2006).
4.2.1.2 LRR (Leucine-rich repeats)
The LRR domain, firstly recognized in the leucine-rich 2-glycoprotein, correspond to
tandemly repeats arrayed in the N-terminus of R-genes and is involved in primarily specific
recognition of pathogen effectors (Jones and Jones, 1997; Hammond-Kosack and Jones 1997; Ellis et
al. 2000; Van der Hoorn et al. 2001). All LRRs motifs are divided into a highly conserved part and a
variable part. The highly conserved part consists of an 11-residue stretch, LxxLxLxxNxL, or a 12-
residue stretch, LxxLxLxxCxxL, in which ―L‖ is any aliphatic amino acid (more frequently Val, Leu,
or Ile), but also phenylalanine, methionine and alanine, ―N‖ is Asn occasionally replaced by a cysteine

Literature review
62
or threonine, and some repeats contain a glutamine receptor or a serine at this position and x is other
residues distributed in a non-random fashion among the hydrophobic amino acid (Kobe and
Deisenhofer, 1994; Buchanan and Gay 1996). These aminoacid distribution forms a β-sheet
(Buchanan and Gay1996; Jones and Jones, 1997; Kajava, 1998; McHale et al. 2006). Usually, the
LRR motif contains 20-30 residues (Kobe and Kajava, 2001; Bella et al., 2008) but up to 47 duplicated
LRRs have been found (Kuang et al., 2004).
The 3D structural arrangement of LRRs was first achieved in the crystal structure of
ribonuclease inhibitor (RI). The structure of porcine RI showed that LRRs corresponded to structural
units, each consisting of a β-strand and α-helix connected by loops (Kobe and Deisenhofer, 1993) that
form the concave face shaped like a horseshoe or banana.
LRR proteins can be subdivided into at least seven subfamilies, characterized by different
lengths and consensus sequences of the variable parts of the repeats (Ohyangi &Matsushima, 1997;
Kajava 1998). In this classification repeats from different subfamilies never occur together in the same
protein and probably evolved independently (Kobe and Kajava, 2001; Bella et al., 2008) (Table I.9).
R-proteins from plants share LRRs of the extracellular or extracytoplasmic type, characterized
by the consensus sequence LxxLxxLxLxxNxLT/SGxIPxxLGx (Kajava, 1998).
The crystal structure of the isoform 2 of polygalacturonase-inhibiting proteins (PGIPs) from
Phaseolus vulgaris (PvPGIP2) is the only available structure of plant LRR proteins (Di Matteo et al.,
2003). Many plants produce extracellular PGIPs that specifically recognize and inhibit fungal and
insect endo-polygalacturonase (PG) enzymes that are responsible for degrade the polysaccharides of
the cell wall. Thus, LRRs of the extracellular type homologous to PGIP are found in pattern-
recognition receptors involved in non-host specific defense.
Table I. 9 Sub-families of LRR proteins (Adapted from: Kobe and Kajava, 2001)
LRR subfamily typical LRR length
(range)
Organism origin Cellular
location
Structures available
RI-like 28–29 (28–29) Animals Intracellular RI, rna1p
SDS22-like,
22 (21–23) Animals, fungi Intracellular U2A', TAP,
RabGGT,
LC1, InlB
Cysteine- containing 26 (25–27) Animals, plants, fungi Intracellular Skp2
Bacterial 20 (20–22) Bacteria Gram-negative Extracellular YopM
Typical 24 (20–27) Animals, fungi Extracellular No
Plant-specific 24 (23–25) Plants, primary
eukaryotes
Extracellular PvPGIP2
TpLRR 23 (23–25) Bacteria Extracellular No

Literature review
63
The PvPGIP2 fold consists of a central LRR domain flanked by the N- and C-terminal
cysteine-rich regions (Figure I.22 b) (Di Mateo et al., 2006; Bent and Mackey, 2007). The LRR
domain is characterized by the tandem repetition of 10 coils matching the consensus sequence
xxLxLxxNxLt/sGxIPxxLxxLxxL (Figure I.22 a). An extended parallel β-sheet occupies the concave
inner side of the protein solenoid (Concave face) (Figure I.22 c). It is in the β-sheet where the residues
determining the affinity and the specificity of PGIP2 reside. Nine 310-helices are located on the
convex side of the protein (Fig I.22 c). Specific positions of the LRR repeat (red circles in figure c) are
occupied by hydrophobic amino acids, mostly leucines that point into the interior of the protein
scaffold and stabilize the overall fold topology thorough van der Waals interactions. Position 8 (Figure
I.22 c) is usually occupied by asparagine residues that are oriented towards the core of the protein and
form hydrogen bonds with the carbonyls main chain or amide groups originating the typical
‗‗asparagine ladder‘‘. The convex face of the LRR region of PGIP2 is mostly occupied by
unstructured segments that are stabilized through water molecules; these are organized in spines along
the structure and form H-bond interactions with the protein backbone. While contributing to stabilize
the protein scaffold, the water network provides a structural flexibility to the molecule and might
facilitate the adaptation of the PGIP scaffold to the surface of its interacting partners. The N-terminal
region contains two disulphide bridges and consists of a 15 residue long α-helix and a short β-strand
that forms H-bonds with residues in convex face. The C-terminal region contains two disulphide
bonds and consists of the last two α-helices. The LRR-flanking regions play a structural role in
capping the hydrophobic core of the protein. The β-strand/β-turn region is primary candidate for
determining pathogen specificity (Figure I.22 d).
Within the tomato Cf gene family, the comparative analysis of Cf-4 and Cf-9, which confer
resistance to C. fulvum through recognition of different avirulence determinants, has shown that 33 out
of the 57 amino acids which distinguish the two proteins are located within the interstitial amino acid
residues of the β-sheet/β-turn region (Thomas et al., 1997).
In many NB-LRR genes, analyses of corresponding proteins have found elevated ratios of
nonsynonymous to synonymous substitutions in the leucine-rich (LRR) domain, mainly in the putative
solvent exposed residues (i.e. the x residues), indicating that the LRR domain is subject to positive
selection for amino acid diversification and consequently for pathogen specificity (Parniske et al.
1997; Meyers et al., 1998; Botella et al., 1998; Michelmore and Meyers 1998; McDowell et al. 1998;
Ellis et al., 1999; 2000; Dodds et al. 2001; Shen et al., 2003; Yahiaoui et al., 2006; Geffroy et al.,
2009). Moreover single substitutions in the xxLxLxx motif can disturbed the function of R genes
(Dixon et al., 1998). A glutamate to lysine substitution in the xxLxLxx of the third LRR in the
Arabidopsis RPS5 gene product generates a protein which partially compromises the function of
several R genes (Warren et al., 1998). Single amino acid changes in RPS2 and RPM1 resistance genes
of Arabidopsis abolished the ability to confer resistance to P. syrangae (Bent et al., 1994; Mindrinos
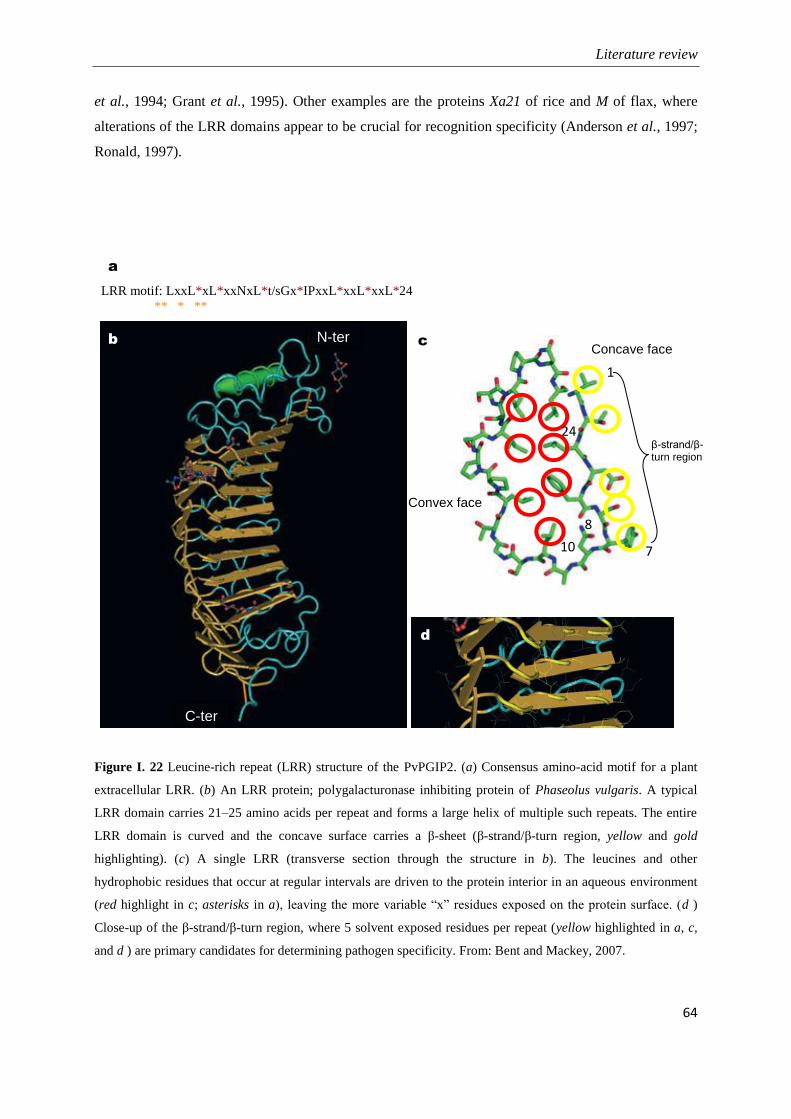
Literature review
64
et al., 1994; Grant et al., 1995). Other examples are the proteins Xa21 of rice and M of flax, where
alterations of the LRR domains appear to be crucial for recognition specificity (Anderson et al., 1997;
Ronald, 1997).
LRR motif: LxxL*xL*xxNxL*t/sGx*IPxxL*xxL*xxL*24
** * **
Figure I. 22 Leucine-rich repeat (LRR) structure of the PvPGIP2. (a) Consensus amino-acid motif for a plant
extracellular LRR. (b) An LRR protein; polygalacturonase inhibiting protein of Phaseolus vulgaris. A typical
LRR domain carries 21–25 amino acids per repeat and forms a large helix of multiple such repeats. The entire
LRR domain is curved and the concave surface carries a β-sheet (β-strand/β-turn region, yellow and gold
highlighting). (c) A single LRR (transverse section through the structure in b). The leucines and other
hydrophobic residues that occur at regular intervals are driven to the protein interior in an aqueous environment
(red highlight in c; asterisks in a), leaving the more variable ―x‖ residues exposed on the protein surface. (d )
Close-up of the β-strand/β-turn region, where 5 solvent exposed residues per repeat (yellow highlighted in a, c,
and d ) are primary candidates for determining pathogen specificity. From: Bent and Mackey, 2007.
a
b c
d
10
24
7
1
Convex face
Concave face
β-strand/β- turn region
8
N-ter
C-ter
Literature review
65
4.1.2.3 TIR domain
The TIR domain was originally characterized due to homology with the intracellular regions
of the mammalian IL-1 receptor (IL-1R) and the Drosophilla protein Toll, which contains 3 ―boxes‖
of conserved residues, set in a central sequence ranging from 135 to 160 aa and two interfaces
mediating TIR domain interactions. TIR domain interactions between receptors and adaptors play a
critical role in activating conserved cellular signal transduction pathways in response to bacterial
lipopolysaccharide (LPS), microbial and viral pathogens, cytokines and growth factors (Xu et al.,
2000).
Although most studies have demonstrated that R gene specificity resides largely in the LRR
region, there are indications for the L class of flax rust resistance genes, that polymorphism in the TIR
domain of the flax TNL protein L6 also affects the specificity of pathogen recognition (Ellis et al.,
1999; Luck et al., 2000). Other example comes from tobacco TNL protein N that confers resistance to
Tobacco Mosaic Virus (TMV). In this case the TIR domain was necessary and sufficient for
association with the p50 Avr elicitor from TMV suggesting that the TIR domain acts as an adaptor
between the pathogen Avr protein and the signaling function of the R protein (Burch-Smith et al.,
2007).
4.1.2.4 Coiled Coil (CC) domain
The CC (also called LZ –leucine zipper) serves as oligomerization domain that means it
mediates the subunit assembly of a large number of proteins (including structural proteins, motor
proteins and transcription factors) by increasing structure stabilization and combined functions of
different domains (Engel & Kammerer, 2000). The CC structure is conserved from viruses to plants
and mammals and it has been predicted that approximately 5% of proteins encoded in sequenced
genomes contain CCs. (Nooren et al. 1999).
Coiled coils usually contain a repeated pattern, hpphppp, of hydrophobic (h) and polar (p)
amino-acid residues, referred to as a heptad repeat. The positions in the heptad repeat are usually
labeled abcdefg, where a and d are the hydrophobic positions, often being occupied by isoleucine,
leucine or valine (Lupas, 1996). Folding a sequence with this repeating pattern into an alpha-helical
secondary structure causes the hydrophobic residues to be presented as a 'stripe' that coils gently
around the helix in left-handed fashion, forming an amphipathic structure (Nooren et al. 1999).

Literature review
66
A CC motif is common but not always present in the 175 amino acids amino-terminal of
CNLs (Meyers et al., 2003). Some CNLs have large amino-terminal domains; tomato Prf, for example,
has 1,117 amino acids amino-terminal of the NBS, much of which is unique to this protein (McHale et
al., 2006).
5. How NBS-LRR proteins recognize pathogens and activate
defense responses?
The bait and switch model elaborated by Collier and Moffett (2009) was proposed to explain
how NB-LRR proteins translate pathogen recognition into defense activation. This model proposes a
two-step recognition process involving interactions with both cellular cofactors (bait) and the LRR
domain, which in turn activates the molecular switch leading to disease resistance (Figure I.23).
The bait and switch model states that ―bait‖ cofactors play an integral role in preparing NB-
LRR proteins to be functional while retaining the molecular switch in an inactive conformation until a
structural change triggers release of auto-inhibition. This structural change might take multiple forms,
such as modification, removal, or conformational change of the bait protein or simply complex
formation with the bait protein. At the same time, at least some bait proteins, such as NRIP1 and
WRKY proteins, seem to interact with their cognate NB-LRR proteins only in the presence of the Avr
protein. In these cases, the preparing of NB-LRR proteins might occur independently of bait proteins,
or via interaction with bait protein might occur concomitantly with alterations that cause activation.
Alterations of bait proteins could be perceived and relayed to the molecular switch via the N-terminal
domain. Likewise, through the proximity induced by interdomain interactions, some recognition
cofactors might bring multiple Avr proteins directly into contact with the autoinhibitory surfaces of the
LRR/ARC2 interface. This might reinforce relatively weak, but specific, interactions between Avr and
LRR domains which would in turn disrupt the autoinhibitory effect of specific LRR/ARC2
combinations.
The model can be summarized as follow: (a) The NB-LRR protein is ―prepared‖ but in
autoinhibited state – the ‗‗switch‘‘ is in the ‗‗off‘‘ position. This state requires a functional nucleotide
binding pocket (presumably bound to ATP or ADP) and multiple intramolecular interactions including
a fine-tuned balance between the LRR and ARC2. The recognition of cofactor bait might also be a
critical component of the primed state. (b) The pathogen Avr protein is brought into the NB-LRR
system via the bait protein, either through direct binding or through alteration to the bait. (c) The
switch is changed to ―on‖ position. The presence of the Avr protein causes perturbation and

Literature review
67
subsequent conformational changes to the LRR/ARC2 interface, ultimately resulting in signal
initiation. Conformational changes within the nucleotide binding pocket allow signaling motif(s)
within the NB domain (green star) to associate with downstream signaling components. (d) Concurrent
with or subsequent to signaling, intramolecular interactions within the NB-LRR protein are probably
dissociate and reset, possibly allowing the protein to undergo repeated rounds of recognition, signaling
and resetting given the continued presence of the Avr protein (Figure I.23).
Figure I. 23 Bait and switch model of NB-LRR protein function. From: Collier and Moffett (2009).
6. Expression of R proteins
Recently, multiple analytical approaches such as expressed sequenced tag (EST), massively
parallel signature sequencing (MPSS), microarray analysis and rapid amplification of cDNA ends
(RACE) PCR have been used for analyzing the level, tissue specificity and possible inducibility of
expression for approximately 170 NB-LRR-encoding and related genes in Arabidopsis thaliana (Tan
et al., 2007). These analysis revealed that transcripts of most NBS-LRR-encoding and related genes
are present at low levels in unchallenged plants and many showed tissue specific expression patterns.
The transcript levels of the majority of NB-LRR-encoding and related genes are not altered during the
plant defense response or by treatments with plant defense signaling molecules such as (salicylic acid)

Literature review
68
SA or (jasmonate) JA. However, for some genes the expression was altered by SA and may be
indicative of altered levels of surveillance by the plant (Tan et al., 2007). These results are in
agreement with previous small-scale experiments (Navarro et al., 2004; Zipfel et al., 2004).
7. Plant-pathogen co evolution
In the plant-pathogen battle, if an R protein detects an Avr protein and triggers host resistance
selection pressure should be imposed on the pathogen carrying the Avr gene to evade recognition. This
could be achieved by structural changes in the Avr protein through mutations without necessarily
affecting its virulence function. Once the host resistance is overcome, the selection pressure would be
on the plant to generate a new R gene to recognize the mutated Avr gene (Xiao et al., 2008).
Pathogens reproduce much faster than plants, thus plant must somehow compensate the long
generation. This compensation could be represented by the elevate number of R genes maintained in
the plant genomes and by structural features of R proteins. Whereas Avr proteins are structurally
diverse, presumably performing very different virulence functions in the host, most R proteins possess
a highly conserved NB domain along with hyper-variable LRR. This means a new Avr allele that
evades R recognition may only evolve from the existing alleles through mutations or allelic
recombination while R genes in a cluster of highly homolog could evolve through diverse mechanism
including: point mutations, intra-and inter-genic recombinations, gene conversions and unequal
crossing over (Xiao et al., 2008). A model for plant pathogen co evolution is shown in Figure I.24
7.1 Evolution of R genes at plant population level
Two models have been proposed to explain R genes evolution. The birth-and-death model or
―arm race‖, assumes that R genes emerge in a plant population (birth) by sequence recombination,
point mutation and are lost when the resistance in that plant population is broken (death), thus new R
genes should be continuously generated to ensure adequate plant protection (Michelmore & Meyers
1998). Support for these evolutionary dynamics centers on the common observation that amino acids
evolve at a faster rate in functionally important regions of R-gene proteins than the corresponding rate
of synonymous changes (Parniske et al., 1997; Botella et al., 1998; McDowell et al., 1998; Meyers et
al., 1998, Ellis et al., 1999; Rose et al., 2004).

Literature review
69
Figure I. 24 A general model for plant–pathogen coevolution with a multilayered plant defense system. Non-
host resistance (Phase I); Pathogen effector proteins ―a‖ and ―b‖ can eventually overcame non-host resistance
(Phase II); Evolution of specific R proteins ―1‖ and ―2‖ in plants to recognize the effector protein inducing a
stronger defense response (Phase III). The pathogen accumulated mutations that change the structure of effector
―a‖ to escape recognition by R protein ―1‖, resulting in suppression of R-resistance. In the other scenario,
effector gene ―b‖ might have been deleted in the pathogen population if this incurred little fitness penalty in
virulence, or ―b‖ became rare in the pathogen population as a consequence of R-resistance, which in turn relaxed
the selection for R gene ―2‖, resulting in a low frequency of R gene ―2‖ in the plant population as a result of
balancing selection for the benefit and cost of R gene expression (Phase IV). Next, the plant faced pressure to
evolve a new R gene ―1*” to recognize ―a*” to activate defense; or as the frequency of the effector gene ―b‖
increased, the frequency of R gene ―2‖ also increased due to its selective advantage in the presence of ―b‖ (Phase
V). From: Xiao et al. (2008).

Literature review
70
However, according to the population genetics theory of selective sweeps, the rapid turnover
of new R-gene specificity should cause a reduction in the age and number of alleles at a locus which is
contradictory to the presence of ancient and many segregating alleles observed in R-gene plant
population. This suggested that a microevolutionary mechanism for promoting the maintenance of
stable polymorphism exist (Stahl et al., 1999). This observation led to the proposition of the second
model of R gene evolution: the trench warfare model where R genes are maintained in the population
by balancing selection over long periods (Stahl et al., 1999). Thus, frequencies of R genes in natural
plant populations are balanced by frequency-dependent selection. An R gene becomes prevalent as a
result of its selective advantage, whereas the frequency of such R gene is reduced when the
corresponding pathogen causes less disease pressure (Van der Hoorn et al., 2002). Balancing selection
results in a balanced polymorphism of R genes and can maintain Avr–R gene pairs over an indefinite
period of time (Van der Hoorn et al., 2002).
The RPM1 (Stahl et al., 1999) and RPS2 (Mauricio et al., 2003) loci of Arabidopsis in which
variation is low with no evidence of diversifying selection between functional and nonfunctional
forms represents this model. Different from positive selection, balancing selection increases levels of
polymorphism at linked sites by several mechanisms including over-dominance, frequency-dependent
selection, and temporally or spatially variable selection (Tiffin and Moeller, 2006).
Although balancing selection can explain a number of ancient alleles in plant population, this
model only cannot explain the generation of new R genes specificities. Therefore, R gene dynamics in
a natural plant population probably reflect a combination of balancing selection and birth and death
models, the latter perhaps being relatively slow (Van der Hoorn et al., 2002).
Convergent selection (i.e. the acquisition of the same biological trait in unrelated lineages)
rather than balancing selection was proposed to explain how R genes from different plant species can
recognize the same pathogen. This is the case of the Rpg1-b from Glycine max (soybean) and RPM1
from Arabidopsis thaliana (Asfield et al., 2004). Both genes belong to CNL class and confer
resistance to races of the same type III effector protein from Pseudomonas syringae, AvrB. However,
the genes share only 34% identity across the nucleotide-binding domain and are even more divergent
in the LRR domain. Phylogenetic analysis demonstrated that these genes belong to paralogous
lineages that arose from gene duplications that occurred before the monocot–dicot split. Considering
the degree of sequence divergence and evolutionary distance between Rpg1-b and RPM1, it is unlikely
that their recognition specificities are shared by descent. In this case, recognition specificities of these
two genes appear to have evolved independently as a result of the selection pressure imposed by P.
syringae (Asfield et al., 2004; McDowell, 2004).

Literature review
71
7.2 Evolutionary patterns R genes clusters
Two types of NBS-LRR gene evolution were distinguished from analysis of the sequence
diversification rate at two complex R clusters, RGC2 in lettuce and R1 in S. demissum, (Kuang et al.
2004, 2005). Type I comprises fast-evolving genes, characterized by chimeric structures resulting
from frequent sequence exchanges among group members and consequently lacking a clear
allelic/orthologous relationship between different genotypes. The Type II comprises slow-evolving
genes, exhibiting infrequent sequence exchanges between paralogous sequences and obvious
allelic/orthologous relationships among different genotypes (Kuang et al. 2004, 2005). (Figure
I.25).This heterogeneous rate of evolution is consistent with a birth-and-death model (Michelmore &
Meyers, 1998; Kuang et al., 2004). Individual paralogs of type II of R genes (i.e. alleles or orthologs)
are highly conserved among accessions. Some NBS–LRR-encoding genes in A. thaliana seem to have
evolved in a pattern similar to that for type II R genes; these genes are not chimeras of different
paralogs and are highly conserved (usually exhibiting >99% nucleotide identity) in different genotypes
(Bakker et al., 2006).
Type I genes can be stochastically converted into Type II genes by structural rearrangements
that inhibit mispairing and thereby reduce sequence exchange. At least a subset of Type II genes is
conserved because they have evolved important resistance specificities (Kuang et al., 2005). By
contrast, some Type I genes might be works-in-progress. Consistent with this idea, RGC2 Type I
genes appear to be subjected to strong diversifying selection while Type II genes are under purifying
selection (Kuang et al., 2004). However evolutionary analyses of NBS–LRR genes sometimes can be
complicated by extensive gene duplication, variable rates of sequence exchanges between paralogs,
and indistinguishable orthologous relationships (Cadwell and Michelmore, 2009). However
evolutionary analyses of NBS–LRR genes sometimes can be complicated by extensive gene
duplication, variable rates of sequence exchanges between paralogs, and indistinguishable orthologous
relationships (Cadwell and Michelmore, 2009).

Literature review
72
Figure I. 25 Evolutionary pattern of R genes. ‗Fast evolving‘ type I resistance genes are characterized by
frequent sequence exchanges between paralogs that obscure orthologous relationships, whereas ‗slow evolving‘
type II resistance genes rarely experience sequence exchanges between paralogs and maintain orthologous
relationships. Black arrows represent changes accrued over evolutionary time. Point mutations are shown as
vertical white lines. From: Fredman and Baker, 2007.
8. Wide genome analysis of NBS-LRR encoding genes
The complete or partial plant genome sequencing revealed that genes encoding NB-LRR
proteins represent one of the largest gene families in plants. The predicted number of NBS-encoding R
identified in the genome of different plants is shown in Table I.10. As aforementioned, the deduced
NB-LRR proteins can be divided into two subfamilies, TIR-NBS-LRR (TNL) and non-TNL based on
their N-terminal features. Non-TNL proteins often have a putative N-terminal coil-coil (CC) and are
thus designated CNLs (Dangl and Jones 2001).
NBS-LRR-encoding genes are found in non vascular plants and gymnosperms as well as in
angiosperms (Akita & Valkonen, 2002; Zhou et al., 2004). In genome of dicot plants both subfamilies
of NBS-LRR-encoding genes were found (Rickly et al., 2002; Meyers et al. 2003; Yang et al., 2008;
Ameline-Torregrosa et al., 2008; Ming et al., 2008) while in monocot only non-TNL genes were
identified (Bai et al. 2002; Meyers et al., 2002; Zhou et al., 2004, Monosi et al., 2004; Paterson et al.,
2009). A few TN genes (TNL but lacking an LRR domain) have been identified in rice (Oryza sativa)
but greatly differ from typical TNL genes (Bai et al., 2002; Zhou et al., 2004). It suggests that TNL
genes might have evolved before separation of the dicot and monocot genomes and they were lost
during monocot evolution (Meyers et al., 2002).

Literature review
73
Table I. 10 The total number of predicted NBS-encoding genes identified in the sequenced angiosperm
genomes.
Specie Type of NBS-LRR Total NBS-
enconding gene
Genome size
Mb
% NBS-
LRR in
genome
Reference
TNL NON-TIR
(CC or X)
other
A. thaliana Col 1 94 55 149 125 0.53 Meyeres et al., 2003
Oryza sativa
Var. Nipponbare
- 480 3-TIR-NBS
Lack of
LRR
535 1 Zhou et al., 2004
Oryza sativa
Var. japonica
- 272 50 508 390 1.35 Li et al., 2010
Oryza sativa 489 581 1 Monosi et al., 2004
Vitis vinifera 97 203 159 459 487 1.51 Yang et al.,2008
Populus trichocarpa 78 252 330 485 0.72 Yang et al., 2008
Brassica rapaa 42 17 33 92 ~100a (529) Mun et al., 2009
Sorghum bicolor - 184 61 245 730 0.68 Li et al., 2010
Sorghum bicolor 209 2 211 ~ 730 Paterson et al., 2009
Carica papaya 6 4 44 54 372 0.2 Porter et al., 2009
Lotus japonicaa 174 55 229 (60% genome) ~315ª (472) Sato et al., 2008
Medicago trunculataa 156 177 30 333 (58% genome) ~186a (500) Ameline-Torregrosa et
al., 2008
Zea mays - 95 34 129 2300 0.4 Li et al., 2010
Brachypodium
distachyon
- 212 239 350 0.74 Li et al., 2010
ª The NB-encoding genes of Br, Mt, Lj were identified based on partial genome sequences. Overall genome sizes
are indicated in parentheses
Phylogenetic analyses indicated that separation of the TNL and CNL subfamilies represents an
ancient division that may date back to the common ancestor of angiosperms and gymnosperms around
300 million years ago (Meyers et al., 1999; Young et al., 2000) and that members of the TIR
subfamily are relatively more conserved, whereas members of the non-TIR subfamily are more
divergent (Cannon et al. 2002; Meyers et al. 2003). The TNL genes were also be found in the moss
Physcomitrella patens genome suggesting that the origin of NB-LRR sequences is before divergence
between Bryophytes and Ptéridophytes (~400 Mya) (Palmer et al., 2004; Rensing et al., 2008;
Cuming, 2009).
Evolutionary studies using 1600 NBS sequences from 23 plant families suggest that CNLs are
likely to be the more ancient subclass of R genes (Figure I.26). First of all, because CNLs from
monocots and dicots cluster together, indicating that angiosperm ancestors had a common origin
(McHale et al., 2006). Secondly, the conserved intron positions of the TNLs and the shorter

Literature review
74
phylogenetic branch lengths within the TNL phylogeny suggest a shorter evolutionary history (Cannon
et al., 2002; Meyers et al., 2003).
Comparative analysis of NBS genes in four plant genomes (Arabidopsis, rice, grape, and
poplar) revealed extensive species-specific expansion in TNLs genes (Yang et al. 2008). In contrast,
non-TNLs did not segregate by species but mostly clustered in interspecific phylogenetic clades.
These data suggested different evolutionary rates and patterns between TNLs and non-TNLs (Yang et
al. 2008). Besides that, phylogenetic trees using the NBS domain confirmed the recent duplications of
NBS genes in poplar and grapevine since short branches from the terminal nodes were more frequent
in these two perennial species than those in Arabidopsis and rice (Yang et al., 2008).
In gramineous species a comparative analysis identified: 129, 245, 239 and 508 NBSs genes in
maize, sorghum, brachypodium and rice, respectively, suggesting considerable variations of these
genes. All gramineous NBS genes are supposed to have originated from common ancestors (Li et al.,
2010). Although NBS–LRR genes derive from a common ancestor, the numbers of NBS genes are
quite different among the four grass species (maize, sorghum, brachypodium and rice). The maize
genome (2,300 Mb; Schnable et al. 2009) is much larger than sorghum (730 Mb; Paterson et al. 2009),
brachypodium (350 Mb; Huo et al. 2008) and rice 390 Mb (International Rice Genome Sequence
Project 2005), indicating that the total number of NBS–LRR genes is not associated with genome
expansion in the grass species. In this scenario, the variation in the number of NBS-LRR genes among
gramineous species must be caused by gene loss or expansion within a species (Li et al., 2010).
The NBS-LRR genes range from 0.2 to 1.51 % of all predicted genes in papaya and grapevine,
respectively (see Table I.10). The small number of NB-LRR genes in papaya genome could be
attributed to lack of recent genome duplication in this species (Ming et al. 2008). For example in
papaya the number of predicted genes is 24,746 and only 0.2% encodes NBS domains while in A.
thaliana from 25,500 predicted genes 0.53% represents NBS-encoding gene (Meyeres et al., 2003).
Thus, a significant proportion of the plant genome appears dedicated to NBS-LRR-based pathogen
surveillance, and NBS-LRR gene duplication has had a tremendous impact on the evolution of plant
immunity (McDowell and Simon et al., 2006).

Literature review
75
Figure I. 26 Neighbor-joining tree showing the family-specific amplification of NBS sequences. (a) TNLs. (b)
CNLs. The complete tree was based on 1,600 sequences Clades that contained sequences from individual plant
families were collapsed into single branches and the number of sequences in each branch is indicated. Different
taxa are assigned different colors; clades with representatives from several families are shown in black. The scale
bar represents five nucleotide substitutions. From: (McHale et al., 2006).
8.1 Organization of NBS-LRR genes into plant genomes
The NBS-LRR genes are organized in single-gene loci, clusters, and superclusters (Meyers et
al. 1999; Pan et al., 2000; Wendel and Fluhr 2000; Rickly et al 2002; Zhou et al. 2004; Ameline-
Torregrosa et al. 2008; Yang et al., 2008).

Literature review
76
A gene cluster was defined by Holub (2001) as a region in which two neighboring
homologous genes are <200 kb apart. R clusters range in size from two tandem paralogs to large
complexes spanning several megabases (Fredman & Bakers, 2007). The largest R clusters
characterized to date include the maize Rp1 cluster up to 52 homologs per haplotype (Smith et al.,
2004). The clusters can be simple (homologous R-gene sequences arising from a single gene family)
or complex (derived from two or more unrelated families) and may also contain unrelated single genes
interspersed between the homologs (Fredman & Bakers 2007). Usually, only a single gene in the
cluster determines resistance as shown by mutant or transgenic complementation analysis. The genetic
and hybridization data indicate that resistance genotypes should be considered as haplotypes rather
than individual genes (Michelmore & Meyers, 1998).
The 149 Arabidopsis NBS-LRR genes are distributed in 40 clusters ranging in size from two
to eight genes, while 40 genes exist as singletons (Richly et al., 2002; Meyers et al., 2003) (Figure
I.27). More than a than half of these single-copy genes are predicted to be either duplicated in or
absent from the genomes of other accessions of A. thaliana (Bakker et al., 2006). The pattern of R
gene organization in A. thaliana, suggested that after an ancient event which generated CC- and TIR-
type classes, a few ancestral genes underwent local amplification, leading to tandem gene pair, which
could have been broken up by chromosomal translocation or by other types of gene selection (Rickly
et al, 2002).
The rice genome contains an approximately equivalent proportion of clustered genes and non
clustered genes (Bai et al., 2002; Monosi et al., 2004; Zhou et al., 2004). In the M. truculata genome
79.8% of NBS domains occur in clusters of at least two genes and 49.5% in clusters of at least five
genes. The same pattern of distribution has been observed in the grapevine (83.2%) and the poplar
(67.5%) genomes (Yang et al., 2008).
The physical clustering suggests that tandem duplication is an important source of new R
genes, and this hypothesis is supported by two trends. First, genes within a cluster tend to occupy the
same phylogenetic lineage. Second, gene copy number can vary widely among haplotypes within a
species (McDowell & Simon, 2006). An example is the maize Rp1 rust resistance locus, in which the
number of Rp1 paralogues in different haplotypes varied from a single gene to >50 genes (Smith et al.,
2004). Such variation in gene copy number has probably arisen due to mispairing and unequal
crossing over between clustered NB-LRR genes, or between repetitive sequences such as
retrotransposons that are frequently present in intergenic regions of R gene clusters (Hammond-Kosak
& Kanuya, 2007).

Literature review
77
Figure I. 27 Physical locations of Arabidopsis sequences that encode NBS proteins similar to Plant R Genes.
Boxes above and below each Arabidopsis chromosome (chrm; gray bars) designate the approximate locations of
each gene. Chromosome lengths are shown in megabase pairs on the scale at top (Meyers et al., 2003).
9. Mechanisms of R-genes diversification
Several mechanisms are involved in diversification of NBS-LRR genes. According to Leister,
(2004) they can be grouped into three main classes: One involves Duplication such as tandem,
segmental and ectopic duplication. Other is result of Recombination such as unequal, equal crossing
over or yet inter, intragenic (gene conversion) and concerted evolution. And another derived from
positive, negative or diversifying Selection (Figure I.28). Each of these mechanisms will be detailed
below.
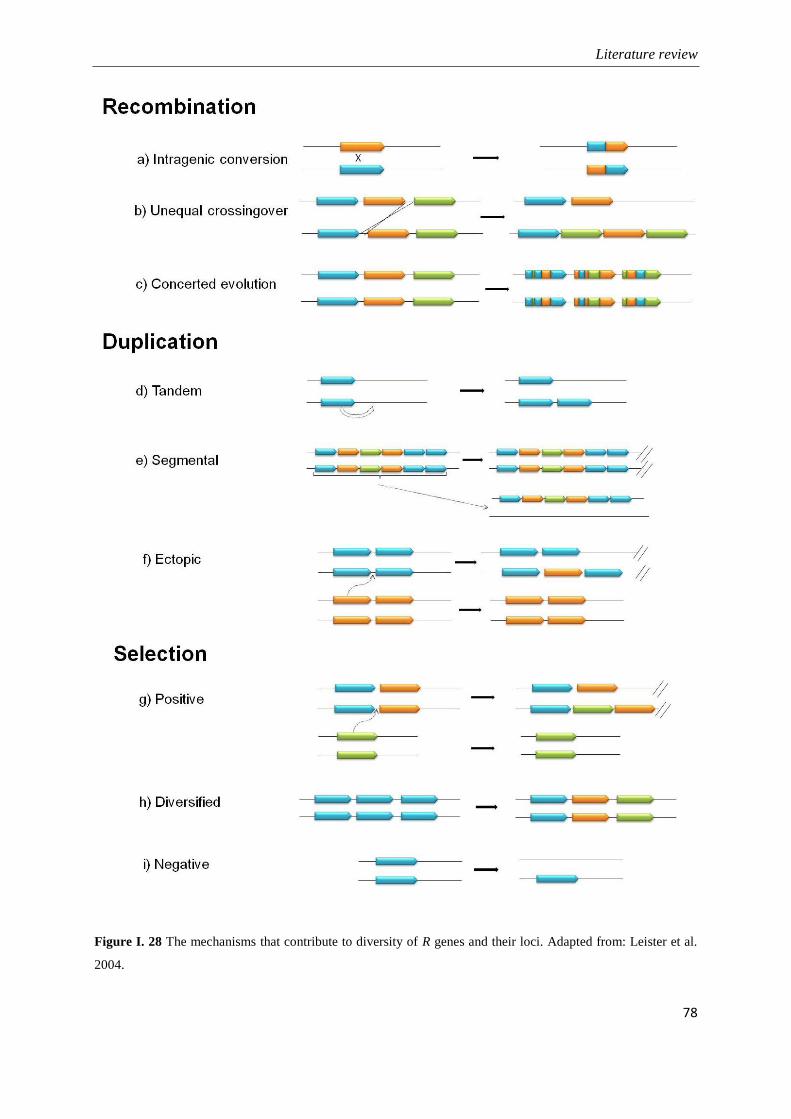
Literature review
78
Figure I. 28 The mechanisms that contribute to diversity of R genes and their loci. Adapted from: Leister et al.
2004.

Literature review
79
9.1 Duplication
Duplication is considered as the birth of an R gene (Huang et al., 2009). It can create new loci,
alter gene family number through recombination, or generate repeated sequences within a gene
(Richter & Ronald, 2000). Duplication of R genes can occur by tandem duplication where the
duplicated segment is transferred to a site contiguous to the original one, by ectopic duplication that in
contrary to tandem duplication, the individual or small groups of genes are moved to an unlinked
locus, or by segmental duplication where large stretches of DNA containing many genes are
duplicated to an unlinked locus but in a large-scale when compared to ectopic duplication (Leister,
2004).
Recent local expansion by tandem duplication within a local chromosomal region has
demonstrated to play a major role in NBS gene expansion in Arabidopsis (Rickly et al., 2002;
Baumgarten et al., 2003), M. trunculata (Ameline-Torregrosa et al, 2008), B. rapa (Mun et al., 2009),
grapevine and poplar (Yang et al., 2008). Around 80% of duplications events in A. thaliana occur
within relatively restricted chromosomal regions while the remaining 20% involve duplication to new
chromosomal locations (Baumgarten et al., 2003).
Although local tandem duplication explains the origin of a large fraction of NBS-LRRs,
genome surveys have revealed ‗mixed clusters‘ comprising evolutionarily distant NBS-LRR genes.
For example, at least ten clusters in Arabidopsis contain interspersed CNLs and TNLs (Richly et al.,
2002; Meyers et al., 2003). Two models have been proposed to explain NBS-LRR distribution patterns
that are inconsistent with simple tandem duplication. The ‗rapid rearrangement‘ model emphasizes the
importance of ectopic duplications, in which single genes or small groups are transposed to distal
locations by an undefined mechanism (McDowell and Smith, 2006). Candidate mechanisms for
ectopic duplication are recombination events between homologous sequences at unlinked sites, or the
effects of the action of transposable elements (Leister, 2004). This model is supported by an apparent
lack of large-scale synteny in sequences flanking related NB-LRR genes in cereals and Arabidopsis
(Leister, 2004). A different but non-exclusive, ‗conserved synteny‘ model emphasizes the importance
of large-scale segmental duplication with subsequent local rearrangement (Leister, 2004).
9.1.1 Duplication by polyploidization
Polyploidy is the first mechanisms by which genes are duplicated. Several studies have
revealed that multiple rounds of polyploidy have occurred during angiosperm evolution (Adams &
Wendel, 2005). The polyploidization phenomena involve a whole spectrum of molecular and

Literature review
80
physiological adjustments. Extensive genomic rearrangements, including exchanges between genomes
and gene loss, often arise with the onset of polyploidization (Levy & Feldman, 2004). Recombination
between homoelogous chromosomes might create lineages that are reciprocally distinguished not just
for single genes but for whole chromosome arms or chromosomes segments (Osbom et al., 2003).
Genes that are duplicated by polyploidy could be expressed at equal levels, or there could be unequal
expression or silencing of one copy (Adams & Wendel, 2005). A duplicated gene may be lost,
inactivated, or develop a new function (Kellis et al. 2004) (Figure I. 29).
Figure I. 29 Three potential fates of duplicate gene pairs with multiple regulatory regions. In the first two steps,
one of the copies acquires null mutations in each of two regulatory regions. On the left, the next fixed mutation
results in a nonfunctional pseudogene, the remaining regulatory regions associated with this copy eventually
accumulate degenerative mutations. On the right, the lower copy acquires a null mutation in a regulatory region
that is intact in the upper copy. Because both copies are now essential for complete gene expression, this third
mutational event permanently preserves both members of the gene pair from future nonfunctionalization. The
fourth regulatory region, however, may still eventually acquire a null mutation in one copy or the other. In the
center, a regulatory region acquires a new function that preserves that copy. If the beneficial mutation occurs at
the expense of an otherwise essential function, then the duplicate copy is preserved because it retains the original
function. From: Force et al., 1999.

Literature review
81
9.2 Sequence recombination
There are two types of unequal crossing over: Intergenic recombination between distinct
genes and intragenic recombination (or gene conversion) that occurs among different sites within the
same gene locus. Intergenic unequal crossover (has the potential to alter gene expression, whereas
intragenic mispairing generates chimeric genes that may encode novel functions (Fredman & Bakers
2007). Both types of unequal recombination will also result in altered gene copy number within the
cluster according to the number of genes present in the region between the mispaired recombination
sites (Fredman & Bakers 2007). Unequal crossing-over following meiotic mispairing and, to a lesser
extent, gene conversion are the major mechanisms involved in generating novel resistance specificities
(Richter et al. 1995; Hammond-Kosack and Jones 1997; Hulbert 1997; Parniske et al. 1997).
The frequency of intergenic sequence exchanges detected between NBS-LRR in A. thaliana is
much higher when they were located in the same 2-Mb chromosomal region than when located in
different chromosomal regions. Sequence exchanges were also evident among similar NBS-LRR
genes located in different genomic regions, but they were less frequent (Baumgarten et al. 2003). The
frequency of gene conversions between two homologs is usually negatively correlated with distance
and positively correlated with sequence similarity (Shen and Huang, 1986; Semple and Wolfe, 1999;
Mondragon-Palomino and Gaut, 2005).
Sequence exchanges have been documented in several R-clusters (Parniske & Jones, 1999;
Kuang et al., 2004; Mondragon-Palomino & Gaut, 2005) and are associated with genic diversity,
characterized by sequence shuffling and chimeric genes, and haplotypic diversity, characterized by a
variable number of R-homologs within the cluster and a general loss of syntenic/orthologous
relationships between haplotypes (Cadwell and Michelmore, 2009).
In gene conversion, one gene is the donor and gives part or all of its information to another
gene, the acceptor. The process is done through strand breaks and sequence exchanges on the
biological level and typically occurs between highly similar genes, for instance, genes that belong to
the same gene family (Lawson et al., 2009). Naturally, this leads to an alteration in the acceptor gene
(the donor remains unchanged). If only a part of the acceptor sequence is replaced it could lead to a
change in functionality in the acceptor gene and it represents an important method to achieve genetic
diversity (Lawson et al., 2009). In this case pseudogenes could also act as donor contributing to
diversity. In many cases, only a specific region within the gene (for instance the second exon) is
involved in the conversion (Lawson et al., 2009). Due to the repeated structure of the LRR domain,
this region of the gene is either the most susceptible or the most permissive region for unequal
crossing over (Meyers et al., 2003).
Literature review
82
However, frequently gene conversion followed by recombination can lead sequence
homogenization, and thus lead to concerted evolution of R genes paralogs within clusters
(Michelmore and Meyers 1998; Parniske and Jones 1999; Young, 2000). Concerted evolution can be
defined as the process by which a series of nucleotide sequences or different members of a gene
family remain similar or identical through time (Leister, 2004). In that case paralogs copies (i.e gene
duplicated within a genome) are more similar to one another than to their orthologs (i.e genes in
different species that evolved from a common ancestral gene by speciation) in other subspecies (Wang
et al., 2007). Extensive concerted evolution has been found in two indica and japonica subspecies of
rice as a result of both conversion and crossing over, among genes duplicated by segmental/genome
wide events, and proximally duplicated genes (Wang et al., 2007).
Frequent sequence exchanges among homologs have homogenized intron sequences of some
R-gene families, resulting in a higher level of conservation in introns than their flanking exons (Kuang
et al., 2004, 2005). However, diversifying selection has been predicted to maintain the variation
introduced through sequence exchange, which may explain the lack of concerted evolution (Kuang et
al., 2004). It has been suggested that gene conversion be a possible mechanism to explain sequence
and functional conservation among paleologs (ancient, duplicated genes at homeologous locations) in
the Arabidopsis and rice genomes after large-scale duplication events (Chapman et al., 2006).
Interestingly, gene conversion between NBS-encoding paralogs in perennial species
(grapevine and poplar) appeared to be more frequent than in annual plants (Arabidopsis and rice)
(Yang et al., 2008). The whole comparison of NBS-encoding in those species revealed that 3–10-fold
more gene conversion events was detected in perennial than in annual plants suggesting that divergent
evolutionary patterns between the annual and perennial plants can exist (Yang et al., 2008). Compared
with annual plants, the long-generation time of woody species prevents a comparable rate of
evolutionary change relative to microbial or insect pests. However, the authors suggested that the
higher homologous recombination rate together with a significant excess of recent duplications found
in grapevine and poplar could compensate for life history traits and generate novel resistance profiles
(Yang et al., 2008).
9.3 Selection
The ‗neutral theory‘ states that the observed genetic variation within species, as well as
divergence between species, is caused by the random fixation of neutral mutations (King and Jukes,
1969; Kimura, 1983). Detecting adaptive evolution involves comparing amino acid substitution rates
(Ka) to synonymous substitution rates (Ks) in the same gene. Under the assumption that synonymous
changes approximate the neutral rate of molecular evolution, neutral mutation is assigned when Ka

Literature review
83
equals to Ks, negative selection (or purifying) when Ka is less than Ks, and positive selection (or
diversifying) when Ka exceeds Ks. Therefore, statistics of the two variables in genes from different
evolutionary lineages provides a powerful tool for quantifying molecular evolution (Bergelson et al.,
2001; Zhang et al., 2006).
Because of the coevolutionary arms race between hosts and their pathogens, genes involved in
their interaction are expected to evolve under positive selection. Strong positive selection (the process
by which new advantageous genetic variants sweep a population) and frequent recombination were
found to be the major forces for a rapid evolution and diversification of R-genes (Chen et al. 2010).
Strong positive selection has been detected for at least two low copy genes, RPP13 in
Arabidopsis thaliana and L in flax, in which sequence exchange between paralogs has been rare (Ellis
et al. 1999; Rose et al., 2004; Dodds et al., 2006). Furthermore, several single-copy NBS–LRR
encoding loci have presence–absence polymorphisms that correlate with resistance/susceptibility
phenotypes, limited diversity within each allelic class, and ancient polymorphisms (Stahl et al., 1999;
Tian et al., 2002; Shen et al., 2006). Frequency-dependent selection is thought to generate and
maintain the diversity at R-gene loci exhibiting both patterns of variation (Michelmore and Meyers
1998; Stahl et al. 1999).
A strong preference for nonsynonymous compared to synonymous codon substitutions has
been detected in many plant R gene families (Ellis et al. 2000; Jones and Dangl 2006; Bent and
Mackey 2007). Functional analysis of R genes has proved that nonsynonymous replacements in the
xxLxLxx motif are sufficient to disrupt or alterate gene function. The functional importance of LRRs
as the domains of specificity is further supported by results from domain swaps and mutational
analyses of R genes (Warren et al., 1998; Ellis et al., 1999; Hwang et al., 2000; Luck et al., 2000;
Dodds et al. 2001; Dodds et al., 2006; Geffroy et al., 2009). As previously explained, R gene
specificity appears to reside in the solvent-exposed residues in the xxLxLxx motif that is located
within the LRR region. Additionally, evidence of positive selection is found in pathogen molecules
involved in host pathogen co evolution (Allen et al. 2004; Rose et al., 2004; Dodds et al., 2006).
A wide analysis of Arabidopsis genomes demonstrates that at least 17.4% out of the total 149
R genes are under positive selection (Meyers et al. 2003) while in rice only 11.2% of R genes analyzed
between two rice cultivars are likely under positive selection (Yang et al., 2008). This indicates a
lower proportion of R genes in rice under positive selection compared to Arabidopsis (Yang et al.,
2008).
The Ka/Ks ratio was significantly higher in the non-TIR NBS than the TIR NBS families, in
grapevine and poplar suggesting stronger diversifying selection in the non-TIR-NBS subfamily (Yang
et al., 2008).

Literature review
84
9.4 Other mechanisms that contributed to generate R gene
diversification
a) Illegitimate recombination
Illegitimate recombination (IR) is a process characterized by the recombination between non-
homologous or short homologous sequences (van Rijk & Hans Bloemendal, 2003). IR can occur
between dispersed homologous sequences of only a few (usually 1–10) base pairs (Devos et al., 2002;
Daley et al., 2005). This asymmetric pairing followed by sequence exchange can result in either
duplications or deletions (van Rijk & Hans Bloemendal, 2003). IR has been proposed as a new major
evolutionary mechanism at the basis of variability of LRR domains (Wicker et al., 2007). The complex
repeat arrays in four RGA lineages (Cf-2, RGH2, Pm3 and Xa1) were demonstrated to be a result of
initial simple duplications caused by IR (Wicker et al., 2007). IR can also generates InDels and point
mutations in R genes as was indicated by the analysis of conserved small repeats flanking the InDels
in Pm3 alleles from wheat that confers resistance to powdery mildew caused by Blumeria graminis sp.
tritici) (Bhullar et al., 2009).
b) Insertion/deletion
LRR domains are amenable to expansion and contraction by insertion or deletion of complete
LRR units. Deletion or insertion of complete LRRs may occur by intragenic crossing over. This was
revealed in a mutant allele of RPP5 that has an in-frame intragenic duplication of four LRRs without
loss of function (Parker et al., 1997).
In other example the locus RPP1 from Arabidopsis that has three alleles and the only
difference among the alleles is a deletion of a complete LRR in one RPP1 member. This member
demonstrated to be resistant to only one of the three races of Peronospora parasitica. The deletion of a
unit of LRR domain potentially gives rise to novel recognition surfaces (Botella et al., 1998).
Deflection or insertion in LRR domain are associated with altered specificity in the L and M
loci in flax (Anderson et al. 1997; Ellis et al. 1999; Luck et al. 2000), in the Cf-5 locus in tomato
(Dixon et al. 1998), and in the RPP5 locus in Arabidopsis (Noël et al. 1999). A clear example could
be demonstrated with Cf genes from tomato that confer resistance to strains of the fungal pathogen
Cladosporium fulvum. Cf-4 and Cf-9 recognize specific races carrying AVR4 and AVR9 respectively.
Experiments of insertion and deletion in LRR domain revealed that variation in LRR number is
directly involved in gene specificity (Van der Hoorn et al., 2001; Wulff et al., 2001). A Cf-9 mutant
Literature review
85
that had two unit of LRR deleted (11th
and 12th) lost the capability to recognize AVR9, but acquired
the capability of recognize AVR4 (Van der Hoorn et al., 2001).
c) Transposons
Transposable elements of several types are major components of most plant genomes and are
also present in clusters of resistance genes. Such elements could play several roles in the evolution of
resistance genes. Insertion of the same element into two positions flanking a R gene could provide the
primary duplicated sequences allowing unequal crossing-over and the initial duplication of the R gene
sequence (Wessler et al., 1995). Insertions will tend to increase misalignment and therefore increase
the chances of unequal crossing-over when hemizygous. However, when homozygous, insertions will
tend to decrease the chances of misalignment and therefore contribute to the divergence of intergenic
regions (Michelmore and Meyers, 1998).
Insertion of mobile elements also contributed to generate repeats that offer new possibilities of
mispairing during recombination, giving rise to unequal crossovers and interlocus gene conversions
(Richter & Ronald, 2000; Meyeres et al., 2003; McDowell & Simon, 2006). Extensive retropositions
and chimerical genes were identified in rice genome, supporting that retroposition may be an
important force in driving evolution of genes in grass species (Wang et al., 2006). In addition, 85.3,
31.6, 5.5 and 7.1% of transposable elements were detected in the 1-kb flanking regions of pseudo-R-
genes in maize, rice, brachypodium and sorghum genomes, respectively (Li et al., 2010). Expansion of
a TNL cluster by tandem duplications and insertions of retrotransposons has also been described for
the RPP4/RPP5 family (Noel et al., 1999).
Transposon-mediated transcriptional activation may play an important role in the
refunctionalization of additional ‗sleeping‘ R genes in the plant genome (Hayashi and Yoshida, 2009).
The comparison of non-functional and a functional allele of Pit gene from rice that confers race-
specific resistance against the fungal pathogen Magnaporthe grisea revealed that functional allele
contains only four amino acid substitution and has the LTR retrotransposon Renovator inserted
upstream. Functional analysis using chimeric constructs from both alleles demonstrated that the up
regulated promoter activity conferred by the Renovator sequence is essential for Pit function (Hayashi
and Yoshida, 2009).
d) Pseudogenes
Pseudogenes tend to evolve much faster than functional genes (Ota and Nei 1994) and
therefore represent the possibility of more rapid evolution of new specificities (Michelmore and
Meyers, 1998). Pseudogenes represent 10 and 3.5% of all predicated NBS-encoding genes in A.

Literature review
86
thaliana (Meyers et al., 2003) and rice (Zhou et al., 2004), respectively, and they also provide a
reservoir of genetic diversity that could be accessed by recombination or gene conversion (Meyers et
al., 2003).
The recombination of two non-functional peseudogenes can create a new functional gene. This
has been demonstrated by Huang et al. (2009) when they studied the origin of the wheat leaf-rust
resistance gene Lr21. The Lr21 is a single locus dominant gene that was introgressed from Aegilops
tauschii into modern wheat by breeding. Analyzing sequences of Lr21 and lr21 alleles from 24 wheat
cultivars and 25 accessions of A. tauschii three basic nonfunctional lr21 haplotypes, H1, H2, and H3,
were identified. They were able to reconstitute a functional Lr21 allele by crossing plants carrying the
H2 and H1 alleles. A single resistant plant was found and proved to carry an intragenic recombination
between H1 and H2. From this finding the authors proposed a model called ‗‗death–recycle‘‘ where
plants can reuse non functional alleles to create new resistance specificity for gene that are present at
simple loci.
10. Patterns of R gene function
a) Single gene with multiple and functionally distinct alleles
Some R loci consist of only a single gene and can have multiple and functionally distinct alleles
that recognize different races of a pathogen, for examples L, P and M locus from flax that recognize
13, 6 and 7 specificities from Melampsora lini, respectively (Ellis et al., 1997; 1999; 2007). Other
example is the Rpp13 locus of Arabidopsis that has 47 alleles for recognizing ATR13 effectors from
Hyaloperonospora arabidopsidis (Hall et al., 2009).
b) Single copy genes conferring resistance/susceptibility by presence/absence
The RPM1 (Grant et al., 1995; Stahl et al., 1999) and RPS5 (Warren et al., 1995; Tian et al.,
2002), RPS2, (Caicedo et al., 1999) genes from Arabidopsis controlling resistance to different strains
of Pseudomonas syringae are examples of this pattern. In this case, there is no allelic variation in the
loci; resistant genotypes contain a functional copy whilst in susceptible genotypes the gene is deleted.
It has been proposed that these single copy R loci have evolved a very long time ago and now are
subject to purifying selection, and therefore a reduction in gene diversity.

Literature review
87
c) R genes from distant related species confer same specificity
R genes with the same specificity can be found in distant related species of plant as result of
convergent evolution. For example: Rpg1-b from Glycine max (soybean) and RPM1 Arabidopsis
thaliana (Asfield et al., 2004), both genes are from CNL class and confer resistance to races of the
same type III effector protein from Pseudomonas syringae, AvrB.
d) R genes within a cluster can determine resistance to very different pathogens
R gene in a cluster that confer resistance to different pathogens are called complex locus.The
locus Rpg1 from soybean has several genes mapped in a 3cM interval that confer resistance against a
diverse selection of pathogens including Rpg1-b and Rpg1-r effective against Pseudomonas syringae,
Rps3 effective against the oomycete Phytophtora soja, Rsv1 effective against soybean mosaic virus
and the Rpv1 effective against peanut mottle virus (see Asfield et al., 2004). Other examples are
available: two highly similar genes located a 115 kb apart on the potato chromosome 12 confer
resistance to two unrelated pathogens, potato cyst nematode and potato virus X (van der Vossen et al.,
2000). RPP8 and HRT from Arabidopsis are paralogous genes that encode resistance to Peronospora
parasitica and turnip crinkle virus, respectively (Cooleya et al., 2000). Similarly, the Mi gene from
tomato encodes resistance to a nematode and an aphid species (Rossi et al., 1998; Vos, et al., 1998).
e) A cluster of R genes may contains sequences related in function but not in sequence
An example of this type of cluster is the Pto-Prf complex locus. The gene Prf, an NB–LRR gene,
is within a cluster of five Pto homologs that encode protein kinases and both genes are required for
resistance to Pseudomonas syringae pv. tomato. Pto and Prf act closely to regulate not only
recognition of pathogen elicitor molecules, but also subsequent defense signaling, and their
coordination function depends on their interaction in the plant cell (Salmeron et al., 1996; Pedley and
Martin, 2003).
f) Two genes in a cluster can both encode the same specificity
For example, the Cf2 gene from tomato has two functional sequences that encode the same
specificity against the fungal pathogen Cladosporium fulvum (Dixon et al. 1996). The rice genes Xa21
and Xa21D, which occur in the same complex locus provide resistance (partial in the case of Xa21D)
to the same strains of the bacterial blight pathogen (Wang et al., 1998).

Literature review
88
11. Comparative analysis of R genes
For single copy R genes the evolution rates can be determined from orthologous comparisons
between species while in clustered R-genes it can be made by comparison among R-gene paralogs.
Paralogs are created by a horizontal event (duplication) whereas orthologs reflect a vertical event
(speciation) (Fitch, 1970).
a) Comparison of single copy genes
The estimates of the evolution rate have been obtained for three single-loci genes, Rpm1,
Rps2, and Rps5, by comparing Arabidopsis thaliana and its congener, A. lyrata. For each of these R-
loci, amino acid replacement changes have accumulated considerably more slowly than synonymous
changes. Lower Ka:Ks ratios found in Rpm1, Rps2, and Rps5 are compatible with adaptive evolution,
however at a slower rate than that seen for complex loci (Chen et al., 2010).
To explore diversity at RPS2 locus from A. thaliana that governs resistance to strains of,
Pseudomonas syringae pv. tomato expressing the avrRpt2 gene, 17 accessions of A. thaliana were
sequenced (Caicedo et al., 1999). Mutations occur throughout RPS2 but are more frequent in the
second half of the gene, in the region encoding the LRR. The RPS2 gene exhibits one of the high
levels of intraspecific sequence polymorphism where 1.26% of nucleotides are polymorphic within
RPS2. Moreover, nearly half of the observed polymorphisms result in a change in amino acid
composition and, of these, 70% are non-conservative changes. The resistant alleles are separated by
only two to four nucleotide changes, and most of these changes result in amino acid substitution. The
lack of resistance in all three susceptible classes of accessions can be explained by a defective RPS2
allele (Caicedo et al., 1999).
The comparison of 13 alleles of L locus from flax revealed that some alleles have undergone
large duplication or deletions in LRR region and that the alleles have a mosaic nature, probably due to
variation present in ancestral alleles by recombination (Ellis et al., 1999).
b) Comparative analysis of R gene clusters across haploids or species
Important questions in genome evolution, particularly about the evolution of gene families and
genome structure, can be addressed most effectively by analysis of large contiguous blocks of DNA

Literature review
89
sequence from multiple species (Moreno et al., 2008). Comparative analyses of R-gene clusters across
different haplotypes or species have demonstrated to be a worth approach to study gene family
evolution. Several mechanisms of evolution were evidenced by such comparisons. Some examples are
listed above:
The locus carrying out the RPP5 gene was compared in different Arabidopsis ecotypes
showing dynamic pattern of evolution including extensive recombination, retroelements insertion,
point mutation, gene conversion and unequal recombination (Noël et al., 1999). The R1 cluster was
compared in three genomes of allohexaploid wild potato and demonstrated a fast evolve pattern by
sequence exchange and retrotransposon insertion (Kuang et al., 2005). The comparison of three Cf
genes clusters in different tomato species point to inter and intra locus recombination between Cf
members (Parniske and Jones 1999; Kruijt et al., 2004).
To investigate whether RPW8 locus has originated recently a comparison among the syntenic
locus in Arabidopsis thaliana, A. lyrata, Brassica rapa and B. oleracea was performed (Xiao et al.
2004). The analysis showed that RPW8 evolved by duplication and diversified selection in
Arabidopsis after its separation from Brassica (Xiao et al., 2004).
The Pm3 complex loci was compared from orthologous loci in the A genome of wheat at three
different ploidy levels and in rice (Wicker et al. 2007). It was found an extremely dynamic evolution,
resulting in minimal sequence conservation in Pm3 loci from wheat and that it has evolved more
rapidly than its homolog in rice.
The RPP8 cluster was investigated in A. thaliana, A. lyrata and A. arenosa (Kuang et al.,
2008). Both rapidly and slowly evolving RPP8 homologs were identified. The sequence exchanges
between fast evolving genes homologs within a locus was more frequent than sequence exchanges
between homologs from two different loci, indicating the influence of chromosomal position on the
evolution of these R genes. Moreover this study showed that differentiation between rapidly and
slowly RPP8 homologs occurred before the speciation of A. thaliana, A. lyrata and A. arenosa (Kuang
et al., 2008).
The Mi-1 cluster has been compared in nematode-susceptible tomato and in the S. peruvianum
introgression in resistant tomato lines (Seah et al., 2007). Comparison of homologues suggests that
extensive sequence exchange has occurred. Regions of diversifying selection were present in the
ARC2 domain of the NBS region and dispersed throughout the LRR region, suggesting that these
regions are possible locations of specificity determinants. Analysis of sequences flanking the Mi-1-
homologues reveals blocks of homology, but complex differences were found in arrangement of these
blocks when susceptible and resistant genotypes were compared indicating that the region has
undergone considerable rearrangement during evolution, perhaps contributing to evolution of
specificity (Seah et al., 2007).

Literature review
90
The comparison of Rpg-1 locus from soybean and homologous region into three legumes (G.
tomentella, M. trunculata, P. vulgaris) demonstrated that cluster expansion in soybean occurred by
retroelement insertion (Innes et al., 2008).
The organization and evolution of Pi2/9 locus (~100 kb) have been described in 4 wild species
of rice representing three genomes AA, BB and CC: (O. nivara AA, O. punctata BB, O. officinalis
CC, O. minuta BBCC) and the comparison with a cultivated species (Oryza sativa which genome is
AA) (Dai et al., 2010). The phylogenetic analysis of Pi2/9 gene family members from different Oryza species,
demonstrated that genes within different species (i.e orthologs) are more similar to each other than to
their homologues within the same species (parologs), suggesting that unequal recombination has not
much impact on the evolution of the Pi2/9 locus and that other mechanisms such as sequence
mutation, gene translocation, inversion, and insertion of transposable elements has greatly contributed
to the variation of genes in Pi2/9 locus (Dai et al., 2010).
The B4 locus of common bean (Phaseolus vulgaris) was compared gene by gene with the
sequenced portions of the three sequenced legume genomes, Medicago trunculata (Mt), Lotus
japonicas (Lj) and Glycine max (Gm) (David et al., 2009). This comparison has revealed conserved
microsynteny (conservation of local gene repertoire, order, and orientation) except for the CNL
sequences, which appear to be completely absent in the corresponding regions of Mt and Lj and only a
truncated CNL is present in syntenic regions of Gm (David et al., 2009). The authors suggested that
CNL were inserted in the ancestor of the B4 locus after Mt, Lj, and Pv diverged but before the
divergence of Pv and Gm through an ectopic recombination event between nonhomologous
chromosomes. Phylogenetic analysis including those legume CNL sequences and all known B4-CNL
sequences supported this hypothesis (David et al., 2009). Moreover, they presented additional
evidence for the existence of ectopic recombination between nonhomologous chromosomes in
common bean by means of the identification of a new 528-bp satellite DNA referred to as khipu,
which is mostly associated with bean chromosome ends, in subtelomeric regions.
Genome wide analysis between all NB-LRR genes from two of closely related species, A.
thaliana and A. lyrata has distinguished two evolutionary patterns: driven by positive or stabilizing
selection (Chen et al., 2010). Most R-genes (50%) were evolving under strong positive selection
characterized by high Ka/Ks ratios, frequent recombination, copy number variation, and extremely
high sequence divergence between the two species. The stably selected R-genes (30%) had exactly the
opposite four characters as the positively selected genes. The remaining R-genes (about 20%) were
present in only one genome and absent from the other. A higher proportion of such genes were found
to be part of TNL class (23.5%) compared to the non-TNL class (5.6%), suggesting different
evolutionary patterns between these two groups. The diverse evolutionary patterns in R-genes should
be the result of adaptation, which allows plants to cope with different types of pathogens.

Literature review
91
PART III
1. Identification of candidate genes
Recent advance in plant genomics and the sequencing of both reference genomes and crop
species have generate a lot of information that permits the rapid identification of candidate genes
through bioinformatics analysis.
The strategies used for cloning genes of interest have been called ‗Candidate gene approach‘
(CGA) (Byrne and McMullen 1996; Pflieger et al., 2001). The pre-requisite for a CGA is a repertoire
of well characterized candidate genes (CGs) for a trait. The primary way to select functionally
characterized CGs is to examine phenotypic, biochemical and physiological information on genes
acting in the pathway of interest if this information is available (genomic sequence databases,
literature, expression profiles, cellular localization of the corresponding protein, protein interactions,
metabolic changes, mutant phenotypes and information from genetically modified organisms)(Bro and
Nielsen 2004; Meyers et al., 2004).
Identification of CGs can be achieved using two different strategies: One approach use all
information available from whole genome sequences in ‗model‘ dicot and monocot species, to search
genes of interest based on genomic synteny and on putative function of the genes present in that area.
In this case the sequenced ‗model‘ genome can be aligned with comparable marker sequences in a
‗target‘ genome to deduce the putative CGs present in that genomic region (Salentijin et al., 2007).
The other approach involves the identification of CGs underlying a genomic region linked to a
trait and required fine mapping studies as well as and genetic complementation studies (Salentijin et
al., 2007). A schematically description of CGA is shown in Figure I.30.
1.1 Identification of CG genes based on genomic synteny
The first step in this approach is to identify the CGs in a ‗model‘ and subsequently to identify
the CGs in the ‗target‘ crop by orthology. Within plant families the different genomes are often
collinear which might offer the possibility to identify orthologous CGs on basis of syntenic genomic
regions (Krutovsky et al., 2004). The essential genomic regions are predicted to be more conserved
than the non-essential ones. The alignment of whole genomes therefore should reveal the more
conserved regions that potentially will prove to be of functional importance (Chervitz et al., 1998).

Literature review
92
Figure I. 30 Route towards the application of candidate genes. From: Salentijn et al 2007.
However, extensive rearrangements and duplications taken place during evolution of some
species can disturb the colinearity of the genomes and allow the loss of genes, consequently
hampering the comparative mapping of CGs (Salentijin et al., 2007).
For example the gene I2 from tomato which confers resistance to Fusarium oxisporum was
compared with its syntenic region in potato, the locus R3. This comparison resulted in the R3a gene
that confers resistance to Phytophtora infestans (Huang et al. 2005) but no to a Fusarium. That means,
after the divergence of tomato and potato these loci may have evolved further resulting in a
diversification of resistance genes based on co-evolution with the respective pathogens of tomato and

Literature review
93
potato. This example of R-gene shows that comparative mapping of functionally validated R-genes
may give a lead towards new candidate R-genes. But, even in case the complete genome sequence is
available and QTLs for resistance are located, the identification of the specific R-gene copy within a
cluster of RGAs may require laborious fine mapping and synteny studies (Salentijin et al., 2007).
RGAs are often located in clusters near to major QTL for resistance and can also be
considered as CG (Pflieger et al., 2001; Kanazin et al., 1996; Mago et al., 1999; Pan et al., 2000;
Ramalingam et al., 2003; van der Linden et al., 2004).
However, for crop species where no complete sequence is available, gene discovery relies on
unassembled genome sequence data and expressed sequence tags (EST), SNP and simple sequence
repeats (SSR) and molecular markers. Genetic mapping of these markers is required to determine their
genomic location (Edwards and Batley 2010). Consequently, the actual involvement of the CG in most
cases remains to be confirmed by genetic and physical mapping, positional cloning, expression
analysis and genetic transformation experiments.
The coffee genome has not yet been completely sequence yet. The sequencing is now in
progress (Argout et al., 2010). So in the present work the efforts were focus on the identification of
candidate genes for resistance to coffee leaf rust using a positional cloning strategy.
1.2 Identification of CG using positional cloning strategy
The elaboration of genetic mapping is the first step toward the positional cloning. Genetic
mapping places molecular genetic markers in linkage groups based on their co-segregation in a
population. The genetic map predicts the linear arrangement of markers on a chromosome and maps
are prepared by analyzing populations derived from crosses of genetically diverse parents, and
estimating the recombination frequency between genetic loci (Edwards and Batley 2010). Different
types of markers can be used for map construction such as SNPs, BACends, SSR etc.
In silico methods of SNP and SSR discovery are now being adopted, providing cheap and
efficient methods for marker identification (Barker et al., 2003; Batley et al., 2003; Robinson et al.,
2004; Jewell et al., 2006; Duran et al., 2009; Ganal et al., 2010). SNP involves finding differences
between two sequences. Traditionally this has been performed through PCR amplification of
genes⁄genomic regions of interest from multiple individuals selected to represent diversity in the
species or population of interest, followed by either direct sequencing of these amplicons, or the more
expensive method of cloning and sequencing. Sequences are then aligned and any polymorphisms
identified (Edwards and Batley 2010).

Literature review
94
The development of a physical map is the second step in positional cloning approach. Physical
maps use all available techniques or informations to determinate the absolute physic position of a gene
on a chromosome. Physical mapping is produced by ordering DNA clones from large-insert (typically
BAC) libraries on the basis of a clone fingerprint pattern (Luo et al., 2003). Physical mapping can be
used for positional cloning of genes/QTLs, studies on gene families, isolation of candidate genes and
facilitate the analysis of genome structure, comparative genomics, and assembly of the entire genome
sequence (Gu et al., 2010; Luo et al., 2010).
Strategies based on BAC fingerprints detect overlaps among BAC clones for the development
of physical maps. Briefly, BAC clones are digested with restriction enzymes and the fragments are
separated by electrophoresis, producing a pattern of bands. The overlap between adjacent clones is
identified by pairwise comparison of band profiles and calculation of the proportion of shared bands
(Meyers et al., 2004). The fingerprint profile generated by digestion, together with the BACend
sequences and linkage map are used to organize the BAC clones forming contigs. The success of
physical mapping depends on the fine genetic mapping of the locus of interest. Once the BAC clones
covering the interval between the markers are found, the target gene can be identified by sequencing
and by predicted gene mapping in relation to recombination events. The polymorphism analysis is
conducted to evaluate the relation between polymorphism and variation at the character studied.
After candidate genes identification their function remains to be proved. The combination of
all available functional information for a trait from physiological studies, microarray expression
analysis and studies of gene function via transgenic functional validation or mutants are powerful
approaches to determine gene function (Bro and Nielsen 2004). A summary of steps for positional
cloning and gene validation is shown in Figure I.31.
Figure I. 31 Steps of positional cloning. 1) Localization of region of interest by linkage analysis (molecular
markers co-segregating with phenotype), 2) Assembly of genomic DNA clones (BACs) by BAC-end sequencing
(contig formation), 3) sequencing of interest region and genes repertoire, 4) polymorphism studies and selection
of candidate genes, 5) cloning of candidate genes at vectors for transformation, 6) plant transformation and
phenotype analysis. From: Bouchez et al., 2006

Literature review
95
2. Functional validation of CG
Recent advances in efficiency and accuracy of sequencing technologies have allowed the
identification of several potential CG. The aim now is to determine the function of the predicted CG.
Two main approaches are utilized to link genotype to phenotype are known as forward and reverse
genetics. Both of these processes aim to determine the function of gene/genes through screening the
phenotype or genotype of individual mutants to ultimately determine how it is controlled (Barkley and
Wang, 2008).
The forward genetics (from phenotype to genotype) aims to identify the sequence change that
underlies a specific mutant phenotype. The starting point is an already available or a specifically
searched for and predicted phenotypic mutant of interest (Peters et al., 2003). On the other hand, in
reverse genetics (from genotype to phenotype), the gene sequence is known and mutants are screened
to identify individuals with structural alterations in the gene of interest (Alonso & Ecker, 2006). This
approach is generally less time demanding than forward genetics and has been successfully used for
functional genomics in many animal and plant species (Barkley and Wang, 2008).
Reverse genetic approach include Agrobacterium-mediated transformation, transposon
tagging, RNAi (RNA interference) and point mutation using chemical mutagenesis (TILLING), each
with its own strengths and weaknesses (Gilchrist, 2010).
The advantage and disadvantage of each reverse genetic approach has been recently reviewed
by Barkley and Wang (2008) and are summarized below:
2.1 RNA interference
RNA interference (RNAi) has been widely employed to study gene function in plant and animal
systems. RNAi is a post transcriptional gene silencing mechanism, which occurs through the
recognition and degradation of double stranded RNA (dsRNA) into approximately 21-nucleotide RNAs
known as ‗small interfering RNAs‘ (siRNAs), by the Dicer enzyme present into cell. These siRNAs then
provide specificity to the endonuclease-containing, RNA-induced silencing complex (RISC), which targets
homologous RNAs for degradation preventing protein production. The dsRNAs are efficiently
produced by intron-spliced hairpin transgenes (sense and antisense copies of the target gene separated
by an intron). The dsRNAs can be delivered to plants in several ways including microprojectile
bombardment with RNA (ihpRNA)-expressing vectors; infiltration of plant tissue with an Agrobacterium
strain carrying a T-DNA expressing an ihpRNA transgene, virus induced gene silencing (VIGS), in which

Literature review
96
the target sequence is integrated into viral sequences which are used to infect the plant, or are expressed
from Agrobacterium-introduced transgenes, and by stable transformation with ihpRNA expressing
transgenes (Matthew, 2004). The advantages in certain organisms include that the silencing is heritable
and systemic (i.e. transmitted to the whole plant/organism). Disadvantages of this method include low
throughput and efficiency of gene silencing and moreover this method can vary and be unpredictable.
In loss-of-function approaches like RNAi or transposon tagging, tag sequences can be used to identify
the genes disrupted by these elements. When the gene of interest has functionally redundant
paralogous genes in the genome, no phenotype is expected in the loss-of-function lines (Curtis &
Grossniklaus, 2003).
2.2 Chemical mutagenesis
TILLING, a high throughput mutation detection method, takes advantage of chemical
mutagenesis to generate induced mutations in a population. Chemical mutagenesis has been used for a
long time as a tool to obtain mutants for reverse genetic approach. Some of the chemical agents used
to create mutants include ethylmethane sulfonate (EMS), N-ethyl-N-nitrosourea (ENU), N-nitroso-N-
methylurea (NMU), and ionizing radiations. The advantages of chemical mutagens are that they tend
to produce a relatively high density of random mutations throughout the genome including gene
knockouts. Furthermore, induced point mutations generate a range of alleles for genetic analysis.
Many plant species are well suited for this strategy because they can be self-fertilized and seeds can be
stored for long periods of time and the use of chemical mutagens in diploid and polyploid plants
produce a range of various mutations and a high density of mutations throughout the genome.
Additionally, the creation of transgenic material is not required and the mutations are heritable in the
successive generations. Lastly, unlike other reverse genetic approaches, chemical mutagenesis is
applicable in most taxa.
The disadvantages of this approach include: i) when variation (polymorphism) in the trait of
interest is high, efficiency of the technique decreased; the technique can generate false negative and
false positive mutants; ii) it is an expensive technique; iii) the creation of a mutant population can be a
challenge and sufficient time needs to be allocated for the development of a high quality population;
iv) creating mutant populations for plants that are propagated vegetatively or have long generation
times could also slow down progress of generating a mutant population; v) there is no clearly defined
start or stop to your region of interest; vi) the interpretation is a challenge because the output gives
only chromosome and position numbers necessitating the need to map a genome sequence in a
separate step.

Literature review
97
2.3 Transformation by Agrobacterium
Agrobacterium, a soil plant pathogenic bacterium, has become the most used method for the
introduction of foreign genes into plant cells and the subsequent regeneration of transgenic plants. A.
tumefaciens naturally infects the wound sites in dicotyledonous plant causing the formation of the
crown gall tumors. A. tumefaciens has the exceptional ability to transfer a particular DNA segment (T-
DNA) of the tumor-inducing (Ti) plasmid into the nucleus of infected cells where it is then stably
integrated into the host genome and transcribed, causing the crown gall disease. Virulent strains of A.
tumefaciens and A. rhizogenes, when interacting with susceptible dicotyledonous plant cells, induce
diseases known as crow gall and hairy roots, respectively (Gelvin, 2003). The A. tumefaciens strain
used for plant transformation carryies a modified Ti plasmid that was 'disarmed' by deletion of the
tumor inducing genes. The genes to be introduced into the plant are cloned into a plant transformation
vector that contains the essential parts of the T-DNA region of the disarmed plasmid, together with a
selectable marker.
Transgenic plants can be engineered by Agrobacterium transformation to express the product of
candidate genes. These approaches include phenotypic studies that can be made by generating gain-of-
function or loss-of-function mutants. Advantages of this approach include generation of large mutation
populations that can be created and stored before being exploited for variable aspects, as is currently
available for the Arabidopsis model.
The advantages of gain-of-function approaches comparing to loss-of-function approaches for the
characterization of gene functions include the abilities to (a) analyze individual gene family members,
(b) characterize the function of genes from non model plants using a heterologous expression system,
and (c) identify genes that confer stress tolerance to plants that result from the introduction of
transgenes (Kondou et al., 2010).
A limitation of this method is sometimes an inefficient transgene expression. Another potential
disadvantage is that in some plant species, transformation procedure has not been established or the
efficiency is not enough to support functional gene analysis. Moreover for some species the
transformation success can be genotype-dependent and hence the functional gene validation is
restricted to few genotypes (Barkley and Wang, 2008).
3. Genetic transformation of woody plants
With the recent advances of massive sequencing technologies, an increasing number of groups
around the world that are now interested in validating the gene function in different species including

Literature review
98
woody plants. The first step for this consists in developing a good plant regeneration system for each
species. However, many woody plants are still considered as recalcitrant to in vitro culture. A plant
species or a developmental phase will be called recalcitrant if commonly used tissue-culture
procedures fail to result in somatic embryogenesis (SE) or organogenesis. In other words, recalcitrance
occurs if extensive manipulation of culture media by traditional means (high–low salt, organic and
inorganic nitrogen levels and plant growth regulator levels among others) or by application of more
recently discovered growth regulators (oligosaccharides, jasmonates and brassinosteroids) fail to
produce the desired response (Bonga et al., 2010).
Woody plants are also harder to transform and require a long evaluation process after
transformation. Consequently, most of reports so far published focused in developing or optimizing
transformation protocols using marker genes (GUS or GFP) for example in grapevine (Dhekney et al.,
2008), Eucalyptus tereticornis (Prakash & Gurumurthi, 2009) apricot (Petri et al., 2008) Pinus (Tereso
et al., 2006), poplar (Cseke et al., 2007), rubber tree (Leclercq et al., 2010), Leucaena leucocephala
(Jube & Borthakur, 2009), citrus (Dutt & Grosser, 2010).
Some traits of agronomical interest have also been genetically modified such as shortening of
the juvenile phase in apple (Flachowsky et al., 2007; Trankner et al., 2010) and citrus (Peña et al.,
2001), resistance to insect in Pinus (Grace et al., 2005), poplar (Rao et al., 2001) and coffee (Leroy et
al., 2000); herbicide tolerance in Pinus (Bishop-Hurley et al., 2001; Parasharami et al., 2006) and
coffee (Ribas et al., 2006), virus resistance in Prunus (Polak et al., 2008) and apple (Gambino et al.,
2009), lignin biosynthesis in poplar (Halpin et al., 2007; Horvath et al., 2010), tolerance to abiotic
stress in poplar (Strohm et al., 1999), Pinus (Tang et al. 2005, 2006) and grapevine (Zok et al., 2010),
production of fruit seedless in citrus (Tan et al., 2009).
Improved resistance to diseases is one the most desirable character and has also been tested in
woody plants. In apple, the expression of genes form Vf locus have been functionally analyzed
(Malnoy et al., 2008). The Vf locus from Malus floribunda contains 4 genes (Vfa1, Vfa2, Vfa3, and
Vfa4) and confers resistance to five races of the fungal Venturia inaequalis the causal agent of apple
scab disease. To assess functionality, 3 of these genes were introduced into 2 susceptible cultivars of
apple via Agrobacterium-mediated transformation. The Vfa3 is a pseudogene and was not used.
Transformed lines expressing Vfa4 were found to be susceptible to apple scab, whereas those
expressing either Vfa1 or Vfa2 exhibited partial resistance to apple scab. The transformation efficiency
was 8-18% for Galaxy and 6-10% for McIntosh cultivars, respectively.
The Attacin E (antimicrobial proteins produced by Hyalophora cecropia moth in response to
bacterial infection) has been used to produce apple trees resistant to fire blast caused by E. amylovora
(Borjska-Wysocka et al., 2010). Stable expression of Attacin E has been observed during 12-year
period increasing the resistance to fire blast and had no effect on tree and fruit morphology and
quality.

Literature review
99
The expression of Attacin A (isolated from Tricloplusia ni) has also been used in sweet orange
to reduce severity of infection by Xanthomonas citri but no complete resistance was observed
(Boscariol et al., 2006). Sarcotoxin from Sarcophaga peregrina also reduced severity of infection by
Xanthomonas citri in C. sinensis cv. Pera (Bespalhok Filho et al., 2001).
The expression of PR-5 protein from tomato and bacterio-opsin from Halobacterium halobium
has been used to reduce infection caused by Phytophthora spp in citrus (Fagoaga et al., 2001; Azevedo
et al., 2006). In both cases, an initial evaluation detected transgenic plants showing a significant
reduction in lesion development as compared to the control non transformed plants.
The expression the hrpN gene that encodes a hairpin protein, which elicits the hypersensitive
response and systemic acquired resistance in plants, was used to produce transgenic citrus (Citrus
sinensis) hrpN lines. These lines showed reduction in susceptibility to citrus canker as compared with
non-transgenic plants. One hrpN transgenic line exhibited normal vegetative development and
displayed very high resistance to the pathogen, estimated up to 79% reduction in disease severity
(Barbosa-Mendes et al., 2009). The hrpN has also been used to generate resistance to fire blight
(Erwinia amylovora) in pear. Seventeen transgenic clones of the very susceptible cultivar ―Passe
Crassane‖ were evaluated. Most transgenic clones displayed significant reduction of susceptibility to
fire blight in vitro when inoculated with E. amylovora, which was positively correlated to their degree
of expression of the transgene hrpN (Malnoy et al., 2005).
The over-expression of endogenous TcChi1 gene was studied in Theobroma cacao L. plants
(Maximova et al., 2006). Chitinases are members of the pathogenesis-related protein family (PR-
proteins), some of which have been shown to play a role in plant defense by degrading the chitin of
fungal cell walls. The gene was under the control of a modified CaMV-35S promoter and was inserted
into cacao genome by Agrobacterium-mediated transformation of somatic embryo cotyledons. Eight
independent lines were generated. The transgene was expressed at varying levels in the different
transgenic lines with up to a six fold increase of endochitinase activity compared to non-transgenic
and transgenic control plants. The in vivo antifungal activity of the transgene against the foliar
pathogen Colletotrichum gloeosporioides demonstrated that the TcChi1 transgenic cacao leaves
significantly inhibited the growth of the fungus and the development of leaf necrosis compared to
controls when leaves were wound inoculated with 5,000 spores. The results demonstrated the potential
utility of the cacao chitinase gene for increasing fungal pathogen resistance in cacao.
Although many other examples could be cited, the production of transgenic plants is generally
limited to few transformation events reflecting the low efficiency transformation for most woody
plants.

Literature review
100
3.1 Genetic transformation of coffee plants
Since the first explants of coffee were transformed (Barton et al., 1991; Spiral and Pétiard
1991), several studies have been conducted to improve the transformation efficiency in the two
cultivate species C. canephora and Coffee arabica species. Different methods of transformation
making use of reporter genes (GUS and GFP) and selective genes such as: antibiotics (hygromycin,
kanamycin) or herbicides (chlorsulfuron, ammonium glufosinate) have been used to recover
transformed coffee plants. However the transformation efficiency is still low. The results of these
experiments are summarized in Table (I.11). This multiple protocols reflect how hard is to transform
coffee and that none highly efficient method so far exist for C. arabica or C. canephora.
In spite all these efforts toward improving transformation efficiency for coffee the process still
reminds tedious and not efficient. For this reason, only two examples of coffee transformation using
genes of interest, both using Agrobacterium-mediated transformation exist. The first used the gain-of-
function strategy to over express the cry1Ac gene from Bacillus thuringiensis that confer resistance to
the leaf miner (Perileucoptera coffeella) in coffee plants (Leroy et al. 2000). Somatic embryos from C.
canephora and C. arabica species were wounded and co-cultivated with A. tumefaciens carrying out a
binary vector containing the cry1Ac gene. Transgenic coffee plants were proved to be resistant to leaf
miner under greenhouse conditions and were also tested under field conditions in French Guyana
during 4 years for field resistance (Perthuis et al., 2005) Among 54 different transformation events
tested in this experiment, approximately 70% were proved to be resistant to leaf miner. The authors
also observed that the transformed plants presented similar growth and development compared to non
transformed control plants. It was the first time that an important agronomic trait was introduced into a
coffee plant and field tested. However the transformation efficiency of coffee plants in this work was
less than 1%.
The second example of transformation with an agronomically interesting gene used a loss-of
function strategy to obtain transgenic coffee plants with suppressed caffeine synthesis (Ogita et al.,
2003, 2004). The authors used RNA interference (RNAi) technology to inhibit the expression of the
theobromine synthase gene (CaMXMT1). Two constructs containing either a short RNA fragment with
139 and 161 nucleotides or a long RNA fragment with two identical sequences of 332 nucleotides
were prepared both containing a spacer fragment derived from GUS gene. The RNAi fragments were
under the control of the CaMV35S promoter and nopaline synthase (NOS) terminator. Embryogenic
tissues of C. arabica and somatic embryos of C. arabica and C. canephora were co-cultivated with A.
tumefaciens carrying out RNAi vectors. Four stable transformed lines were obtained from C. arabica.
Embryogenic tissues from 2 lines were used to analyze the efficiency of RNAi by estimating the levels
of CaMXMT1 transcripts and the endogenous levels of theobromine and caffeine were determined

Literature review
101
using HPLC. The theobromine contained in the two transgenic lines exhibited reduction rates of 85%
and 65% while the caffeine content was reduced by 100% and 80% when compared to non transgenic
coffee embryogenic tissues. Coffea canephora transgenic plantlets were produced from five
independent lines using short RNAi (RNAi-S), five using long RNAi (RNAi-L) constructions and two
using GFP (used as control for measures). Leaves of plants from two representative lines were selected
and the transcript levels of the three methyltransferase genes were examined by RT-PCR. The results
were similar to that observed for Arabica embryogenic tissue. The reduction in caffeine ranged from
40-70% depending on the transgenic line analyzed. This work demonstrated that the RNAi method
was also effective in planta, although the suppression was not as complete as observed in embryogenic
tissues of C. arabica.
The two examples cited above clearly demonstrated that transformation of coffee plants can be
useful to validate the gene function. However the recovery of transgenic lines or plants in both
examples was very low. For high-throughput gene validation purposes an optimized protocol for
coffee transformation is required.

102
Table I. 11 Summary of Coffee sp transformation studies (Adaptated from: Ribas et al., 2006)
Coffea species Explant used Transformation method Main results Reference
C. arabica
Protoplast A. tumefaciens Transient GUS expression Spiral and Pétiard (1991) Somatic embryos, cotyledons A. tumefaciens Kanamycin integration, no regeneration Feng et al. (1992)
Protoplasts Eletroporation Kanamycin integration, no regeneration Barton et al. (1991)
Somatic embryos - arabica and arabusta A. rhizogenes
GUS integration, plant regeneration Spiral and Pétiard (1993)
Somatic embryos A.rhizogenes,
A. tumefaciens
Putative transformed callus, T-DNA amplification Freire et al. (1994)
Somatic embryos, leaves Biolistic, plasmidial DNA Transient GUS expression Van Boxtel et al. (1995)
Cotyledons, leaves A. rhizogenes Hairy-root plant regeneration Sugiyama et al. (1995)
Somatic embryos A. tumefaciens Cry1Ac, csr1-1 integration, plant regeneration Leroy et al. (2000) Leaves, embryogenic tissue Biolistic delivery GUS expression Rosillo et al. (2003)
Embryogenic tissue, somatic embryo Electroporation GUS expression, secondary embryo formation Da Silva & Yuffá, (2003) Embryogenic tissue, somatic embryos A. tumefaciens GFP expression, CaMxMT1 integration, transformed
embryogenic tissue plant
Ogita et al. (2004)
Embryogenic tissue Biolistic delivery GUS and BAR gene integration, plant regeneration Cunha et al., (2004) Embryogenic tissue A. tumefaciens Antisense ACC and BAR gene integration, plant regeneration Ribas et al. (2005c)
Embryogenic tissue Biolistic delivery Kanamycin integration and GUS expression in F1 plants Albuquerque et al. (2009)
Hypocotyls from germinated zygotic
embryos
A. rhizogenes Production of transgenic roots and GUS expression Alpizar et al. (2006)
C. canephora
Somatic embryos A. rhizogenes GUS integration, plant regeneration Spiral et al. (1993) Somatic embryos A. rhizogenes GUS integration, plant regeneration Spiral and Pétiard (1993)
Somatic embryos A. tumefaciens Bt. integration, plant regeneration Leroy et al. (1997)
Embryogenic tissue A. tumefaciens GUS and HPT integration, plant regeneration Hatanaka et al. (1999) Somatic embryos A. tumefaciens Cry1Ac, csr1-1 integration, plant regeneration, field tests Leroy et al. (2000), Perthuis et
al. (2005)
Embryogenic tissue, somatic embryos A. tumefaciens GFP expression, CaMxMT1 integration, plant regeneration
Ogita et al. (2004)
Embryogenic tissue A. tumefaciens GUS and BAR gene integration Cruz et al., 2004
Hypocotyl A. tumefaciens GUS and HPT integration, plant regeneration Mishra and Sreenath (2004) Embryogenic tissue Biolistic delivery GUS and BAR gene integration, plant regeneration Ribas et al., (2001, 2005a)
Embryogenic tissue A. tumefaciens GUS and BAR gene integration, plant regeneration Ribas et al., (2003, 2005c)
Leaf explants, embryogenic tissue A. tumefaciens assisted by
vaccum infiltration
DsRFP (red fluorescent protein) and NPTII gene integration,
plant regeneration
Canche-Moo et al., (2006)
Secondary embryos A. rhizogenes Hygromicin (hptII) plant regeneration Kumar et al., 2006
Embryogenic cultures from hypocotyls and cotyledons
A. tumefaciens GFP and hygromycin integration, plant regeneration Kumar et al., 2010

Objectives
103
Objectives
Coffee leaf rust (CLR) caused by the fungus Hemileia vastatrix is the main disease of coffee
trees and cause important economical damage to coffee production. Currently, 9 major resistance
factors (SH1 to SH9) single or in association appears conditioning resistance to coffee leaf rust in
allotretraploid C. arabica species. The SH3 resistance factor was identified in the Indian selections
derived from tetraploid coffee S.26 and S.31 (C. arabica x C. liberica (Noronha-Wagner &
Bettencourt, 1967; Bettencourt & Noronha-Wagner, 1971). Coffee plants harboring the SH3 resistant
factors have demonstrated agronomical acceptable durable resistance in field conditions (Prakash et al.
2005; Sera et al., 2007). Segregation analysis demonstrated that SH3 is a single dominant gene
(Prakash et al. 2004). The resistant genes (R genes) found in this locus belong to a multi genic family
(Cenci et al., 2010). Until now none resistance gene against to CLR has been isolate. The
characterization of resistance genes from SH3 locus should contribute for conservation and valorization
of the biodiversity in coffee trees.
In the last few years knowledge about organization and evolution of resistance genes in plants
has greatly been improved. However less is now about these genes in perennial plants such as coffee.
Divergent evolutionary pattern have been suggested between annual and perennial plants (Yang et al.,
2008) but if this pattern could be generalized to all perennial plants is still unknown.
The function of predicted R genes must be validated. The selection of the approach should be
based in the characteristic of the gene to be validated and the species. The most reliable way to
determine the function of individual members of a gene family is engineering transgenic plants to
express the product of candidate genes. Coffee leaf rust is a disease specific of coffee plants and in this
case functional validations of candidate genes to CLR cannot be conducted in heterologous system
such as Arabidopsis or tobacco for which genetic transformation is well established procedure. This
phenomenon is known as restricted taxonomic functionality (Tai et al., 1999) where the failure of an R
gene to confer resistance in a heterologous background may be due to the absence of other receptors,
regulatory elements, or signaling or defensive genes required for the R-gene-mediated defense
response. However, the regeneration and transformation of perennial plants such as coffee are not a
well establish procedure. Although several studies have been achieved in coffee transformation (see
table I.11) but transformation efficiency remainds low and. Moreover, none study was conducted to
determine the target cell for coffee transformation.
The main objective of this thesis was to characterize the SH3 locus that confers resistance to
coffee leaf rust and to develop tools for functional gene validation in coffee trees.
Objectives
104
The development of physical and genetic mapping of SH3 locus is the start point toward the
position cloning and is the subject of chapter II. To gain insight into genomic organization and
evolution of the SH3 locus, three coffee genomes were compared (Ca and E
a subgenomes of C. arabica
and the Cc genome of C. canephora). R genes sequences present at this locus were analysed in order to
point out forces driving evolution of R gene into SH3 locus in chapter III.
A study focus on finding the target cells for coffee transformation and others parameters that
influence coffee transformation efficiency is described in chapter IV.
In order to clone candidate genes to coffee leaf rust different approaches were essayed and are
discussed in chapter V.
Finally, the the general discussion and the perspectives of this work is presented in chapter
VI.

105
CHAPTER II
GENETIC AND PHYSICAL MAPPING OF THE SH3 REGION THAT
CONFERS RESISTANCE TO LEAF RUST IN COFFEE TREE (Coffea
arabica)
This chapter was published in TREE GENOMICS AND GENETICS (2010) 6:973–980
DOI 10.1007/s11295-010-0306-x

Genetic and physical mapping of the SH3
106
Genetic and physical mapping of the SH3 region that confers
resistance to leaf rust in coffee tree (Coffea arabica L.)
Philippe Lashermes, Marie-Christine Combes, Alessandra Ribas, Alberto Cenci, Laétitia Mahé, Hervé
Etienne
ABSTRACT
Resistance to coffee leaf rust is conferred by SH3, a major dominant gene that has been introgressed
from a wild coffee species Coffea liberica (genome L) into the allotetraploid cultivated species, C.
arabica (genome CaE
a). As the first step toward the map-based cloning of the SH3 gene, using a
bacterial artificial chromosome (BAC) library, we describe the construction of a physical map in C.
arabica spanning the resistance locus. This physical map consists in two homeologous BAC-contigs
of 1170 and 1208 kb corresponding to the subgenomes Ca and E
a, respectively. Genetic analysis was
performed using a single nucleotide polymorphism (SNP) detection assay based on Sanger sequencing
of amplicons. The C. liberica-derived chromosome segment that carries the SH3 resistance gene
appeared to be introgressed on the sub-genome Ca. The position of the SH3 locus was delimited within
an interval of 550 kb on the physical map. In addition, our results indicated a 6-fold reduction in
recombination frequency in the introgressed SH3 region compared to the orthologous region in C.
canephora.
INTRODUCTION
Coffee is the world‘s most important agricultural commodity and is the main livelihood for more
than 125 million people worldwide. Commercial coffee production relies mainly on two related
species: Coffea arabica L. and C. canephora Pierre, which account for 65% and 35% of coffee
production respectively (International Coffee Organization, http://www.ico.org). C. arabica L. (2n =
4x = 44), the only polyploid species in the Coffea genus, is an allotetraploid containing two diploid
subgenomes, Ca and E
a, which originated from two different diploid species (2n = 2x = 22), C.
canephora and C. eugenioides, respectively (Lashermes et al., 1999). Among the diseases affecting
Genetic and physical mapping of the SH3
107
cultivated coffee, coffee leaf rust (CLR) caused by the fungus Hemileia vastatrix, is one of the most
serious. CLR is found in almost all coffee growing countries around the world and causes annual
economic damage estimated at more than US$ 1 billion (van der Vossen 2005).
Efforts to obtain durable resistance to coffee leaf rust have a long history of initial successes
followed by disappointments because of the appearance of new virulent races of the rust fungus
(Kushalappa and Eskes, 1989; Prakash et al., 2005; Várzea and Marques, 2005). While the resistance
genes identified in C. arabica, used either singly or in combination, have not provided durable
resistance to most races of the rust fungus, the transfer into C. arabica of resistance genes from related
diploid Coffea species can provide long-lived protection under field conditions (Srinivasan and
Narasimhaswamy, 1975; Eskes et al., 1989). In particular, one resistance trait (i.e. SH3 resistance
factor) from C. liberica has been successfully introgressed into susceptible commercial C. arabica
cultivars (Ramachandran and Srinivasan, 1979; Prakash et al. 2002). Classical genetic studies
determined that the introgressed CLR from C. liberica is controlled by a single, dominant gene (SH3),
and amplified fragment length polymorphism (AFLP) markers have been identified that are linked to
the resistance locus (Prakash et al., 2004). More recently, sequence-characterized molecular markers
suitable for CLR marker-assisted selection and distributed within a distance of roughly 6 cM on the C.
liberica-introgressed fragment have been reported (Mahé et al., 2008). While three markers were
linked in repulsion with the SH3 gene, seven markers were clustered in coupling around the SH3 gene.
These markers were used to screen a C. arabica BAC (Bacterial artificial chromosome) library and
positive BAC clones were identified and roughly ordered without taking into account the allotetraploid
structure of C. arabica (Mahé et al., 2007). Furthermore, using fluorescence in situ hybridization
(FISH), the liberica-introgressed chromosome segment carrying the SH3 resistance gene was located in
C. arabica in a distal position on a chromosome belonging to the homeologous group 1 (Herrera et al.,
2007).
Advances in molecular techniques and tools have facilitated the cloning of numerous plant disease
resistance genes (R genes) in the past two decades (Martin et al., 2003). A method that has been
shown to be successful for the isolation of genes of which only the phenotype and the map position are
known is map-based cloning (Peters et al., 2003). However, map-based cloning is not always
straightforward. A critical step is to construct a high resolution genetic map and to use this mapping
information to isolate one or few genomic clones containing the gene of interest. For instance,
difficulties can arise due to the high ratio of physical to genetic distance resulting from low levels of
recombination or to the complex genome organization associated with plant polyploidy.
As the first step towards the map-based cloning of the SH3 gene, we report here i) the generation in
C. arabica of a physical map spanning the resistance locus ii) an evaluation of the recombination rate
on the introgressed fragment carrying the SH3 gene by comparison with C. canephora, and iii) the
identification of a physical interval of 550 kb that contains the SH3 locus.

Genetic and physical mapping of the SH3
108
MATERIALS AND METHODS
Plant material
The plant material analyzed in the present study consisted in individuals of both species C.
canephora and C. arabica. Genetic mapping of C. canephora was performed in a mapping population
consisting of 92 doubled haploids derived from the hybrid clone IF 200 (Lashermes et al. 2001). For
C. arabica, the CLR susceptible line Matari and the CLR resistant line S.288 (SH3-introgressed) were
included in the analysis. In order to delimit the SH3 region on the physical map, we used five C.
arabica plants that were heterozygous for the liberica-introgressed chromosome segment carrying the
SH3 resistance gene and showed recombination between flanking markers of the SH3 region. These five
recombinant plants were selected based on previous molecular marker analysis (Mahé et al., 2008) in
either a F2 (Matari x S.288) population or a BC2 population [(Matari x S.288) x Matari] x Matari.
Their resistance reactions to CLR have been described in previous reports (Prakash et al., 2004; Mahé
et al., 2008).
BAC fingerprinting and Southern hybridisation
Clones from a genomic DNA BAC library of the arabica cultivar IAPAR 59 (Noir et al. 2004) that
have been previously end-sequenced and identified (Mahé et al., 2007) as positive in filter
hybridization experiments with genetic marker probes surrounding the SH3 gene were selected for the
construction of BAC contigs (Table II.1). BAC DNA was extracted using an alkaline lysis procedure
(Sambrook et al., 1989). To estimate the size of the BAC inserts, we applied NotI-digested DNAs on
pulse field gel-electrophoresis (PFGE) as described in Noir et al. (2004).
Agarose gel-based BAC DNA fingerprinting was performed as described by Marra et al. (1997)
with some modifications. DNAs of the selected BAC clones were digested with either the restriction
enzyme HindIII or EcoRI. DNA fragments were separated into a 1% agarose gel by electrophoresis at
80 V in circulating 1x TAE buffer at 4°C for 16 h. A mixture of marker size DNA (Raoul,
MPbiomedicals) was loaded into every fifth lane. The gel was stained in 1 l of a 1: 20000 dilution of
Vistra Green (Molecular Probe, USA) in 1x TAE for 30 min. Gel images were captured using a
scanner (Typhoon 9400, Amersham Biosciences) and exported as tagged image files. Fingerprints
were edited using the Image 3.10 module of the FingerPrinted Contig (FPC) package (Sanger centre,
USA). BAC contigs were assembled using FPC (version 7.2). Sulston scores of 1 x 10⁻¹⁰
and 1 x 10-13
were tested using the stringent conditions of tolerance 5.

Genetic and physical mapping of the SH3
109
Following agarose gel electrophoresis, the digested BAC DNAs were also transferred to Hybond-
N+ nylon membranes for Southern hybridization as described in Noir et al. (2004). Probes were
labelled with [32
P]-dCTP according to the manufacturer‘s recommendations (Megaprime DNA
Labelling Systems kit, Amersham) and hybridisation was carried out as described by Sambrook et al.
(1989).
Table II. 1 Reference and size of BAC clones selected for contig construction around the SH3 locus.
BAC clone Size (kb) Probe a
144-13G 145 BEs2
60-3C 115 BEs2
82-6F 210 BEs2
140-17D 175 BEs2
131-11D 111 BEs2
55-21G 205 BEsnh3
55-13B 210 BEsnh3, BEs3
34-20L 240 BEsnh3, BEs3
64-1L 200 BEs3
41-23C 110 BEs6
56-20G 148 BEs6
121-12I 180 BEs6
124-12K 177 BEs6
68-6F 96 BEs6
82-8K 200 BEs6
136-1N 219 BEs6
131-1P 145 BEsnh4
140-24N 150 BEsnh4
52-11O 218 BEsnh4, BEs19
70-19D 202 BEs19
38-13H 200 BEs19, BEs12
45-4E 275 BEs19, BEs12
34-11L 135 BEs19, BEs12
80-9A 187 BEs19, BEs12
143-8C 200 BEs19, BEs12
48-21O 194 BEs12
a Probe from the SH3 region showing positive hybridisation in BAC filter screening
experiments (Mahé et al., 2007)

Genetic and physical mapping of the SH3
110
Genetic mapping
For each plant of the mapping population and the parental accessions, genomic DNA was
extracted from 50-100 mg of lyophilized leaves by the method of Diniz et al. (2005). Amplification
conditions using specific primer pairs (either SSR or SCAR), radioactive labeling and polyacrylamide
gel electrophoresis were as reported elsewhere (Mahé et al., 2008). The markers were revealed on an
Amersham Phosphor Screen and screened after 24 hr with a Typhoon 9700 (Amersham Biosciences)
to obtain digital images. Linkage analysis and map construction were performed using the computer
program MAPMAKER version 3.0b (Lander et al., 1987). The canephora doubled haploid population
was treated as a backcross population with an expected segregation of 1:1 for the two alternative
alleles present in clone IF 200. Recombination frequencies were converted into map distances or
centimorgans (cM) using the Kosambi function.
Sequence comparison and SNP detection assay
Specific primer pairs targeting BAC-end sequences were used to amplify DNA from BACs, the
two Arabica parental lines, Matari and S.288, selected recombinant plants and one doubled haploid
(i.e. accession DH200-94) derived from the Canephora IF 200 clone. These PCR products were
directly sequenced from both sides using the gold standard ABI 3730xl DNA Analyzer platform
(Cogenics, France) based on the dideoxy chain termination DNA sequencing method (Sanger et al.
1977). The termination peak profiles from the different samples were aligned and the single nucleotide
polymorphisms (SNP) detected using the Staden Package (Staden et al., 2000).
RESULTS
Construction of BAC contigs in the SH3 region
A total of 26 C. arabica BAC clones containing genetic markers surrounding the SH3 locus were
selected for contig construction (Table II.1). The insert sizes of the isolated BAC clones were
estimated to be from 50 to 275 (average of 173.5) kb by PFGE of NotI-digested fragments. The 26
BAC clones were fingerprinted using restriction enzymes. On average, 30 restriction fragments per

Genetic and physical mapping of the SH3
111
clone and per enzyme, ranging from 1 kb to 50 kb nucleotides, were obtained and included in the FPC
analysis. While a unique contig of 26 clones was obtained at a Sulston score of 1 x 10⁻¹⁰
, increasing
the Sulston scores to the more stringent condition of 1 x 10-13
resulted in a total of six contigs
comprising two to six BAC clones.
Table II. 2 Comparison for 4 BAC-end regions of sequences derived from the two BAC-contigs Ca and E
a with
sequences amplified from an accession of C. canephora (DH200-94, genome C).
BAC-ends
references
GenBank
acc.
numbers
Primer sequences
(5‘>3‘)
% substitutions
(number of aligned nucleotides)
Ca vs C E
a vs C
34-20L-f ED989446 For: tccatccatgctcactttga
Rev: ttgcaagaaagcagcatctc
0.00 (551) 2.37 (548)
124-12K-r ED989455 For: acagttgaaaaacggatgc
Rev: ccttgctgctttcttgaacc
0.00 (291) 2.06 (291)
41-23C-r ED989447 For: ttggccttcactccagtctt
Rev: cggttgaggatttggtccta
0.00 (363) 0.83 (363)
136-1N-f ED989457 For: tcaatgagcagtccatcagc
Rev: ttccatcttgtttgggaagc
0.66 (304) 2.63 (304)
BAC-end (BE) marker probes from the different BAC contigs were generated using specific PCR
primer combinations and used to perform Southern hybridisation on the blots of either HindIII or
EcoRI-digested BAC DNAs. The orientation and overlapping of these clones were identified. In
addition, simple and clear polymorphism was observed between BAC clones in six BE probes (64-1L-
f, 136-1N-r, 45-4E-r, 143-8C-r, 45-4E-f, 124-12K-r) enabling, for each BE, the classification of
positive BAC clones in two groups that correspond putatively to the two Arabica subgenomes (Ca and
Ea)(Figure II.1).

Genetic and physical mapping of the SH3
112
Figure II. 1 Southern hybridisation of HindIII-digested DNA from BAC clones of the SH3 region by a BAC-end
marker probe (143-8C-r). Based on the polymorphism revealed, the positive clones were classified in two groups
that putatively correspond to the two Arabica subgenomes.
By combining the results of the restriction fragment analysis and Southern hybridisation, BAC
clones were assembled into two contigs that represent the homeologous chromosome segments around
the SH3 locus (Figure II. 2). BAC clone position and overlapping were consistent using the different
approaches. The putative Ca contig contained 12 BAC clones and was estimated to span over 1170 kb.
Regarding the putative chromosome segments Ea, 14 BAC clones were assembled and the overall
physical map was estimated to span over 1208 kb.
To ascertain the assignment of the BAC-contigs to the Ca
or the Ea sub-genomes, regions
corresponding to 4 BAC-ends were sequenced in BACs belonging to the two contigs and in accession
DH200-94 of C. canephora, and compared (Table II.2). For all four regions, the sequences (ranging
from 291 to 551 bp) derived from the BACs belonging to one contig (named Ca) appeared notably
more similar to the sequences obtained in C. canephora (C genome) than the sequences derived from
the second BAC contig (named Ea). On average, the level of substitution between the contig C
a and the
C genome was 0.17% while 1.97% of substitution was observed between the contig Ea and the C
genome.
Ca
genome
Ea
genome
70-1
9D
38-1
3H
52-1
1O
143-8
C
80-9
A
45-4
E
34-1
1L
140-2
4N
136-1
N
131-1
P
82-8
K
68-6
F
Genetic and physical mapping of the SH3
113
Comparative genetic mapping of the SH3 region in C. arabica versus C. canephora
A total of 13 sequence-characterized genetic markers associated with the SH3 region, as
previously determined (Mahé et al., 2008) based on the liberica-introgressed Arabica F2 (Matari x
S.288) population analysis, were selected for genetic linkage analysis in C. canephora. The ability of
these sequence-specific primers to reveal polymorphism in the C. canephora doubled haploid (DH)
mapping population was tested. The eight markers showing polymorphism were genotyped in the 92
doubled haploids and the C. canephora linkage map was updated. All analyzed markers mapped to the
linkage group 1 of the C. canephora map. The genetic maps of the SH3 region as determined in the
liberica-introgressed F2 Arabica population were then compared with the corresponding region
(linkage group 1) in C. canephora (Figure II.3). In the liberica-introgressed Arabica F2 population, two
linkage groups related to the SH3 region were identified, one being the introgressed fragment carrying
the SH3 gene (i.e. markers in coupling) while the other represented the corresponding fragment
inherited from the non-introgressed line (i.e. markers in repulsion). A total of seven markers were
common to the Arabica and Canephora maps. While these markers mapped within an interval of 39.3
cM in C. canephora, they resulted in two small linkage groups in the liberica-introgressed F2 Arabica
population of 5.9 (introgressed segment) and 5.6 cM, respectively. This represents a roughly 6-fold
difference in recombination frequency in the same genetic interval between these two populations.
Furthermore, differences in genetic distances between shared markers were observed along the whole
segment.

Genetic and physical mapping of SH3
114
82 - 6F - f 55 - 13B - f M8 Sat244 124 - 12K - f 143 - 8C - r 52 - 11O - r 45 - 4E - r 45 - 4E - f 48 - 21O - f
Sp - M18 - SH3 Sp - M16 - SH3 Sp - M5 - SH3
F2 - 536 - 12/26 [R]
F2 - 536 - 17/23 [R]
F2 - 536 - 17/36 [R]
BC2 - 875 - 8 [R]
BC2 - 875 - 21 [S]
Sp - M16 - SH3
SH3 region (ca. 550 kb)
E a genome
C a genome
A
B
C
D
100 kb
Linkage map 1 cM
131 - 11D
41 - 23C
82 - 6F
144 - 13G 140 - 17D
55 - 21G 55 - 13B
124 - 12K
82 - 8K 68 - 6F
136 - 1N 140 - 24N
38 - 13H
70 - 19D
143 - 8C 52 - 11O
64 - 1L 56 - 20G 121 - 12I
131 - 1P
45 - 4E 34 - 11L
80 - 9A 48 - 21O
34 - 20L
60 - 3C
Figure II. 2 BAC clone contig around the SH3 gene locus, and the SH3 region on the physical map. A The linkage
map of the introgressed chromosome segment carrying the SH3 gene based on the F2 (Matari x S.288) population
analysis. B Overlapping C. arabica BAC clones forming the contig in the SH3 related region. Boxes of BAC
clones belonging to the Ea and C
a sub-genomes are in grey and white, respectively. C The BAC-derived markers
and the graphical genotypes of three F2 and two BC2 recombinant plants. The grey bars represent chromosome
segments derived from S.288 (introgressed rust-resistant line) while the hachured bars indicate the marker-
intervals enclosing the recombination breakpoints. Rust resistance reaction is presented in brackets following the
plant code: R resistant, S susceptible. D The present maximum limits of the region containing the SH3 locus on the
physical map.

Genetic and physical mapping of SH3
115
Figure II.3. Comparison of genetic maps of the SH3 region determined in C. arabica based on results of analysis
of the liberica-introgressed F2 (Matari x S.288) population (Mahé et al. 2008) with the corresponding region
(linkage group 1) in C. canephora (Lashermes et al. 2001). Shared markers are linked by lines. The estimated
map distances are indicated in cM (Kosambi function).
0.6
1,1
1,1
1,1
1,1
1,2
Sp-M18-SH3 1.2
Sp-M5-SH3
2.3 Sp-M16-SH3
0.9 BA-82-6F-f 0.9
Sp-M8-SH3 BA-34-20L-f BA-48-21O-f
BA-69-17J-f
BA-121-10E-f 1,2
Sp-M18-SH3 2,4
BA-138-2A-f
3,6
BA-42-21B-r
3,2
Sat281
1,6 Sp-M5-SH3
6,6
Sat160
20,7
Sp-M8-SH3
1,2 BA-34-20L-f
BA-42-21B-r
Sat281
Sat160
Sp-M16-SH3
Sp-M8-SH3
BA-48-21O-f
39.3 cM
LG1 of C. canephora
Linkage maps either in coupling
(right) or repulsion (left) of the
chromosome segment carrying the
SH3 gene

Genetic and physical mapping of SH3
116
Identification of a physical interval containing the SH3 resistance locus
Heterozygous plants exhibiting recombination events in the liberica-introgressed chromosome
segment carrying the SH3 resistance gene were rescreened with BAC-end-derived genetic markers
obtained as a result of physical mapping. In total, five recombinant plants were analyzed, three plants
from the F2 (Matari x S.288) population and two plants from the BC2 population [(Matari x S.288) x
Matari] x Matari. PCR products obtained from the selected recombinant plants and control samples
were directly sequenced using the dideoxy chain termination DNA sequencing method (Sanger
method). The termination peak profiles from different samples were aligned and the patterns compared
to detect SNPs (Figure II.4). On the 16 BAC-end-derived amplicons, eight gave unreadable sequences
(multiple fragments) and were discarded. The remaining eight exhibited at least one map-informative
SNP (i.e. SNP between introgressed and non-introgressed parents). Assignments of single SNP or
patterns of SNPs to either the subgenomes Ca and E
a or to the liberica-introgressed segment (L) were
inferred by comparing the BAC-end-derived sequences and the sequences amplified in the parental
liberica-introgressed line S.288 and in the C. canephora accession 200-94. For the eight loci, the
sequences of the subgenome Ca were not present in line S.288 while the sequences attributed to the
liberica-introgressed segment (L) were identified. The genotype at each locus was then determined in
recombinant plants by analyzing the relative ratio between the different haplotypes observed in a given
plant (Figure II.4). The recombination breakpoint in the five recombinant plants was localized in
intervals between markers (Figure II.2). The markers were named according to the BAC-end clones
from which they were derived. Taking into account the CLR evaluation of recombinant plants, the SH3
resistance locus was located between markers 55-13B-f and 45-4E-r, in an interval predicted to be less
than 550 kb.

Genetic and physical mapping of SH3
117
Figure II.4. Example of SNP detection assay based on Sanger direct sequencing of amplicons (BAC-
end-derived marker 45-4E-f) from plants of the F2 (Matari x S.288) population. The termination peak
profiles and the deduced sequence combinations are presented for three contrasted plant samples (two
parental homozygous and one heterozygous). The detected SNPs, indicated by boxes, were assigned to
the C. arabica sub-genomes (Ca or E
a) or the liberica-introgressed chromosome segment (L). The C
a
sequence was determined on a C. canephora genotype, the Ea sequence was deduced by subtraction on
the sequence of the non-introgressed arabica parent and the C. liberica sequence (L) was deduced
from the sequence of the introgressed parent. Identified haplotypes with their dosage are given in
parenthesis.
DISCUSSION
Development of a physical map of the SH3 region
In an effort to clone a CLR gene using a map-based cloning approach, we constructed a
physical map of the SH3 region in C. arabica. In line with the allotetraploid structure of C. arabica, this
physical map consists in two homeologous contigs of 1170 and 1208 kb corresponding to the
gctttgtgCtGtaccAaag
gctttgtgAtGtaccCaag
gctttgtgCtGtaccAaag
gctttgtgCtTtaccCaag
(Ea, 2X)
(L, 2X)
(Ca, 2X)
(Ea, 2X)
gctttgtgCtGtaccAaag
gctttgtgAtGtaccCaag
gctttgtgCtTtaccCaag
(Ea, 2X)
(Ca, 1X)
(L, 1X)
gctttgtgCtGtaccAaag
gctttgtgAtGtaccCaag
gctttgtgCtGtaccAaag
gctttgtgAtGtaccCaag
gctttgtgCtGtaccAaag
gctttgtgCtTtaccCaag
(Ea, 2X)
(L, 2X)
gctttgtgCtGtaccAaag
gctttgtgCtTtaccCaag
(Ea, 2X)
(L, 2X)
(Ca, 2X)
(Ea, 2X)
gctttgtgCtGtaccAaag
gctttgtgAtGtaccCaag
gctttgtgCtTtaccCaag
(Ea, 2X)
(Ca, 1X)
(L, 1X)
gctttgtgCtGtaccAaag
gctttgtgAtGtaccCaag
gctttgtgCtTtaccCaag
gctttgtgCtGtaccAaag
gctttgtgAtGtaccCaag
gctttgtgCtTtaccCaag
(Ea, 2X)
(Ca, 1X)
(L, 1X)

Genetic and physical mapping of SH3
118
subgenomes Ca and Ea, respectively. As a consequence of the high sequence similarity between the
two subgenomes, analysis of restriction fragment-based BAC fingerprints was not straightforward. So,
when BACs shared restriction fragments, it was not always possible to determine if these common
restriction fragments resulted from overlapping or homeology. In contrast, Southern blot
hybridizations of the digested BAC DNAs allowed clear classification of positive BAC clones
according to the subgenome. Combining restriction fragment analysis with Southern blot hybridization
data to construct a physical map thus appeared to be very efficient in a polyploid species such as C.
arabica.
Efficient SNP detection method based on dideoxy-terminated sequencing
Marker development in polyploids can be time-consuming and often represents a major
challenge in breeding programs and genetic research. Single-nucleotide polymorphism (SNP) markers
have become the technology of choice for almost all organisms because of their wide distribution in
genomes and their suitability for high multiplex detection systems (Rafalski et al. 2002). However, in
the case of polyploids, difficulties arise due the presence of homeologous sequences that may confuse
SNP detection, and when a SNP is detected, the genome in which it is located cannot be readily
deduced. The SNP detection assay based on Sanger sequencing of amplicons that was applied in the
present study appears to be very efficient and appropriate for polyploids. The SNPs are detected
directly based on the analysis of the termination peak profiles and there is no need to develop and
validate genome-specific primers or probes. This approach is highly suitable for map saturation of
specific regions because virtually all the SNP in not repeated regions can be detected. The high
success rate in the detection of informative SNP is probably due to the divergence between the regions
involved (i.e. nucleotide polymorphism) between Ca and Ea sub-genomes and an introgressed segment
from the C. liberica genome). In an intraspecific context, the success of this approach will depend on
the genetic divergence of the parental lines.
The introgression from C. liberica into C. arabica is associated with repressed recombination
Analyses of the S.228 line that carries the CLR SH3 resistance gene that has been transferred
from C. liberica revealed an introgression of the sub-genome Ca. In addition, our results indicated a 6-
fold reduction in recombination frequency over the entire SH3 region in the Arabica F2 (Matari x
S.288) population compared to the orthologous region in C. canephora. This reduction is most likely

Genetic and physical mapping of SH3
119
the consequence of the introgressed origin (from C. liberica) of this region in the S.288 line. Reduced
recombination frequencies have been frequently observed around disease resistance genes in plants
including barley, grape, poplar, wheat and tomato, when resistance has been introduced via an
introgressed region from a related species (Ganal et al. 1996; Wei et al. 1999; Stirling et al. 2001; Neu
et al. 2002; Barker et al. 2005). In contrast, the recombination rate estimated for a canephora-
introgressed chromosome segment of C. arabica was recently reported to be very similar to the
recombination frequency reported in C. canephora (Lashermes et al. 2010). This contrasted
observation likely reflects differences in genetic divergence between chromosomes belonging to the Ca
and L genomes and the close relatedness between the C (i.e. C. canephora) and the Ca sub-genome.
An average physical/genetic relationship of 570 kb/cM was reported for C. canephora
(Lashermes et al 2001). Assuming a similar average ratio in C. arabica, a 1000-kb contig would
represent approximately 1.8 cM of genetic distance. It was therefore interesting to note that plants
exhibiting recombination events in the SH3 liberica-introgressed chromosome segment were identified
without difficulty although a reduction in recombination frequency was observed. These data strongly
suggest that recombination in the SH3 region is much higher than the average rate for the C. canephora
genome. The frequency of recombination varies substantially throughout the genome (Nachman
2002). For instance, while the heterochromatic regions near centromeres and telomeres of individual
chromosomes are known to show considerable recombination suppression, the subtelomeric regions,
by contrast, have functions that greatly enhance recombination (Drouaud et al 2006). The SH3 locus is
in the subtelomeric region of canephora chromosome 1 (Herrera et al. 2007). Thus, the suggested
enhanced recombination is consistent with the subtelomeric location of SH3.
Towards cloning of SH3
The results described here provide a basis to investigate the structure of the SH3 resistance
locus. The establishment in C. arabica of a physical interval of 550 kb that contains the SH3 locus
represents a significant step. This interval could be easily narrowed down by analysing additional
BAC-derived genetic markers on the same set of recombinant plants. However, from now on, BAC
clones representing a minimal tiling path could be selected and complete DNA sequencing generated
using the latest generation of sequencing technologies that make reading DNA fast, cheap and widely
accessible (Hert et al 2008). Once the resistance locus is deciphered, a further step required to identify
the SH3 gene(s), would be to work with a CLR resistant genotype to isolate homologous sequence(s)
and validate the identified candidate sequence(s) by complementation tests using Agrobacterium
tumefaciens mediated genetic transformation (Etienne et al. 2008).

[Escrever texto]
120
CHAPTER III
ORGANIZATION AND MOLECULAR EVOLUTION OF A DISEASE
RESISTANCE GENE CLUSTER IN COFFEE TREES
This chapter was written as an article and submitted to BMC Genomics
Organization and molecular evolution of SH3 locus
121
Organization and molecular evolution of a disease-resistance
gene cluster in coffee trees
Alessandra F. Ribas, Alberto Cenci, Marie-Christine Combes, Hervé Etienne and Philippe Lashermes
ABSTRACT
Background: Most disease-resistance (R) genes in plants encode NBS-LRR proteins and belong to
one of the largest and most variable gene families among plant genomes. However, the specific
evolutionary routes of NBS-LRR encoding genes remain elusive. Recently in coffee tree (Coffea
arabica), a region spanning the SH3 locus that confers resistance to coffee leaf rust, one of the most
serious coffee diseases, was identified and characterized. Using comparative sequence analysis, the
purpose of the present study was to gain insight into the genomic organization and evolution of the
SH3 locus.
Results: Sequence analysis of the SH3 region in three coffee genomes, Ea and C
a subgenomes from the
allotetraploid C. arabica and Cc genome from the diploid C. canephora, revealed the presence of 5, 3
and 4 R genes in Ea, C
a, and C
c genomes, respectively. All these R-gene sequences appeared to be
members of a CC-NBS-LRR (CNL) gene family that was only found at the SH3 locus in C. arabica.
Furthermore, while homologs were found in several dicots, comparative genomic analysis failed to
find any CNL R-gene in the orthologous regions of other eudicot species. The orthology relationship
among the -CNL copies in the three analyzed genomes was determined and the duplication/deletion
events that shaped the SH3 locus were traced back. Gene conversion events were detected between
paralogs in all three genomes and also between the two sub-genomes of C. arabica. Significant
positive selection was detected in the solvent-exposed residue of the SH3-CNL copies.
Conclusion: The ancestral SH3-CNL copy was inserted in the SH3 locus after the divergence between
Solanales and Rubiales lineages. Moreover, the origin of most of the SH3-CNL copies predates the
divergence between Coffea species. The SH3-CNL family appeared to evolve following the birth-and-
death model, since duplications and deletions were inferred in the evolution of the SH3 locus. Gene
conversion between paralog members, inter-subgenome sequence exchanges and positive selection
appear to be the major forces acting on the evolution of SH3-CNL in coffee trees.

Organization and molecular evolution of SH3 locus
122
BACKGROUND
In their natural environment, plants encounter a vast array of pathogenic microorganisms such
as viruses, bacteria, oomycetes, fungi and nematodes. To defend themselves against infection by these
pathogens, plants employ a network of intertwined mechanisms. One such line of defense is based on
dominant disease resistance (R) genes that mediate resistance to pathogens possessing corresponding
avirulence (Avr) genes (Jones and Dangl, 2006). The largest class of known R genes includes those
that encode the nucleotide binding site (NBS) and the leucine-rich repeat (LRR) domains. The
deduced NBS-LRR proteins can be subdivided in classes based on their amino-terminal features
(Dangl and Jones, 2001; Meyers et al., 1999). The most frequent classes possess a TIR domain with
similarity to either the intracellular signaling domains of Drosophila Toll and the mammalian
Interleukin-1 Receptor or a CC domain (coiled-coil) in the N-terminal and are named TNL (TIR-NBS-
LRR) and CNL (CC-NBS-LRR), respectively (Dangl and Jones, 2001; Jones and Dangl, 2006; Martin
et al., 2003). Each domain of NBS-LRR protein is predicted to have a specific function. The NBS
domain is suggested to have NTP-hydrolyzing activity (ATPase or GTPase, etc), regulating signal
transduction through conformational changes (Leipe et al., 2004; Martin et al., 2003). The LRR
domain contains tandemly arrayed repeats in the carboxy-terminal region of R-genes and its predicted
biochemical function is to mediate protein-protein interaction. It was hypothesized and experimentally
confirmed that the LRR domain is involved in the specific recognition of pathogen effectors (Ellis et
al., 2000b; Hammond-Kosack and Jones, 1997; Jones and Jones, 1997; Van der Hoorn et al., 2001).
Both TIR and CC domains are assumed to be involved in protein-protein interactions and signal
transduction (Jebanathirajah et al., 2002; McDowell and Woffenden, 2003).
Genes encoding NBS-LRR protein represent one of the largest and most variable gene
families found in plants, with most plant genomes containing several hundred family members. NBS-
LRR genes are unevenly distributed in plant genomes and are mainly organized in multi-gene clusters
(Ameline-Torregrosa et al., 2008; Hulbert et al., 2001; Meyers et al., 1999; Richly et al., 2002; Yang
et al., 2008a; Zhou et al., 2004). Furthermore, results of nucleotide polymorphism analyses
demonstrated extremely high levels of inter and intraspecific variation of NBS-LRR genes, which
presumably evolved rapidly in response to changes in pathogen populations (Meyers et al., 2005;
Yang et al., 2008a; Yang et al., 2008b). The clustered distribution of R-genes is assumed to provide a
reservoir of genetic variation from which new pathogen specificity can evolve via gene duplication,
unequal crossing-over, ectopic recombination or diversifying selection (Michelmore and Meyers,
1998). However, the specific evolutionary routes of NBS-LRR encoding genes remain elusive. Several
comparative sequence analyses of R-gene clusters have been performed across haplotypes or related
genomes in different plant species including Arabidopsis (Meyers et al., 2003b; Noel, 1999), wild

Organization and molecular evolution of SH3 locus
123
potato (Kuang et al., 2005a), tomato (Kruijt, 2004; Parniske and Jones, 1999; Seah et al., 2007a),
Brassicaceae (Xiao et al., 2004), wheat (Wicker et al., 2007), rice (Dai et al., 2010) soybean (Innes et
al., 2008) and common bean (David et al., 2009a). Available data suggest that different R genes can
follow strikingly different evolutionary trajectories. Kuang et al. (Kuang et al., 2004; Kuang et al.,
2005b) divided NBS-LRR-genes into two evolutionary categories: Type I includes genes whose
evolution is accelerated by frequent sequence exchange among paralogs. Consequently, their
sequences have chimeric structure and a clear allelic/orthologous relationship between different
genotypes cannot be easily established. Type II includes slowly evolving genes whose sequence
mainly evolves through the accumulation of amino acid substitution. Orthology relationships are
highly conserved among accessions (Kuang et al., 2008).
The evolutionary rate of each domain of individual NBS-LRR-encoding genes has been
shown to be heterogeneous (Kuang et al., 2004). The NBS domain appears to be subject to purifying
selection, whereas the LRR region tends to be highly variable (McHale et al., 2006). Nucleotide
polymorphisms found in the LRR region of R genes have been shown to be responsible for pathogen
specificity (Ellis et al., 2000b). In particular, codons encoding putative solvent-exposed residues in the
LRR domain are hypervariable among different R proteins and show significantly elevated ratios of
non-synonymous to synonymous substitutions, suggesting that the LRR domain is subject to positive
selection for amino acid diversification (Ellis et al., 1999b; McDowell et al., 1998; Michelmore and
Meyers, 1998; Parniske, 1997; Shen et al., 2002; Yahiaoui et al., 2006).
Coffee is one of the world‘s most important agricultural commodities and is the main
livelihood of more than 80 million people worldwide. Although the Coffea subgenus Coffea includes
more than 95 species (Davis et al., 2006), commercial coffee production relies mainly on two related
species: Coffea arabica L. and C. canephora Pierre, which account for 65% and 35% of world coffee
production, respectively (International Coffee Organization, http://www.ico.org). C. arabica L. (2n =
4x = 44), the only polyploid species in the Coffea genus, is an allotetraploid containing two diploid
subgenomes, Ca and E
a, which originated from two different diploid species (2n = 2x = 22), C.
canephora and C. eugenioides, respectively (Lashermes et al., 1999). While diversification in the
Coffea subgenus Coffea probably occurred in the second half of the Middle Pleistocene (450,000–
100,000 years BP), it is most likely that the allopolyploid speciation of C. arabica took place in
relatively recent times i.e. from historical times to 50,000 years ago (Anthony et al., 2010; Lashermes
et al., 1999).
Among the diseases affecting cultivated coffee, coffee leaf rust, caused by the obligate
parasitic fungus Hemileia vastatrix Berk. & Br. (Uredinales), is one of the most serious diseases and
greatly limits Arabica coffee production in almost all coffee growing countries around the world.
Therefore, the development of coffee varieties resistant to coffee leaf rust has been a breeding

Organization and molecular evolution of SH3 locus
124
objective of the highest priority in many countries (van der Vossen, 2005). A number of resistance
genes to coffee leaf rust have been identified in the cultivated or wild Coffea gene pool. In particular,
one resistance gene (i.e. SH3 resistance factor) has been successfully introgressed from C. liberica into
agronomically important Arabica cultivars. In the last few years, the genetic and physical maps of the
SH3 locus were completed (Lashermes et al., 2010; Mahe et al., 2007; Prakash et al., 2004).
Furthermore, using fluorescence in situ hybridization in C. arabica, the SH3 locus was located in a
distal position on a chromosome belonging to the homeologous group 1 (Herrera et al., 2007).
Recently, a region of 800 kb spanning the SH3 locus was sequenced and annotated (Cenci et al., 2010).
Tandem arrays of CNL R genes were identified suggesting that the SH3 locus corresponds to a
complex multi-gene cluster.
The purpose of the present study was to gain insight into the genomic organization and
evolution of the SH3 R gene cluster in coffee. The agronomic importance of this locus as well as the
recent origin and the perennial characteristic of coffee species make these objectives especially
appealing. Sequences of the SH3 region in three different genomes, the Ca and E
a subgenomes of C.
arabica and the Cc genome of C. canephora were analyzed to investigate the genomic organization
and evolution of the SH3 locus. In addition, we performed comparative analyses of the identified NBS-
LRR encoding sequences to identify the forces that drive evolution in the SH3 R gene cluster. Our
results highlight the importance of intra and inter subgenomic gene conversion as an important
evolutionary mechanism for the evolution of disease resistance genes.
RESULTS
Organization of the SH3 R gene cluster
The sequences of a total of 13 BAC clones spanning the SH3 locus (Figure III.1) in three
coffee genomes (i.e. Ea and C
a sub-genome from C. arabica and C
c from C. canephora), were
examined for the presence of R-genes using the previously determined annotation (Cenci et al., 2010).
Depending on the genome concerned (Ea, C
a, C
c), a total of 5, 3 and 4 R-genes were identified,
respectively. These sequences shared more than 95% of identity. According to Chen et al. (Chen et al.,
2010), a R gene family is defined when 60% identity is shared by members. The R-gene sequences
detected in SH3 were therefore further considered as members of a unique R-gene coffee family.
BLAST analysis of the non-redundant database (All non-redundant GenBank CDS translations +
RefSeq Proteins + PDB + SwissProt + PIR + PRF) revealed high similarity with several R-genes
belonging to the CNL class. While the highest identity was observed with the hypothetical CNL R

Organization and molecular evolution of SH3 locus
125
protein in Vitis vinifera (36% identity) in Ricinus communis and Glycine max (35%), the most similar
functionally characterized protein was the RPP8 gene from Arabidopsis thaliana that confers
resistance to Peronospora parasitica (McDowell et al., 1998) and shares 32% of identity and more
than 50% of similarity.
Figure III. 1 BAC clone contigs spanning the SH3 locus. BAC clones spanning the SH3 locus as previously
contigued (Cenci et al., 2010). Sequenced BACs from the three genomes are indicated by gray boxes.
The CNL-like sequences identified in the SH3 R-gene cluster were distributed in two regions
separated by more than 160 kb (Figure III. 2). In the first region (hereafter called region A) two or
three copies were found in the same orientation. The other region (B) contained 1 or 2 copies repeated
in tandem. Region A and B had opposing coding orientations. Orthology relationship among R-genes
was established by comparing flanking sequences and each member was identified by the group letter
followed by a number. A homeologous non-reciprocal transposition event (HNRT) occurred between
the two genomes of C. arabica and involved a region of around 50 kb that includes the A1 and A2
members (unpublished data).

Organization and molecular evolution of SH3 locus
126
Figure III. 2 Organization of SH3-CNL members in three coffee genomes: Ea and C
a represent the sub-genomes
from C. arabica, and Cc the genome from C. canephora. The red bar represents a 50 kb region where a
homeologous non-reciprocal transposition event (HNRT) occurred between the two genomes of C. arabica
(unpublished data).
To test for the presence of a possible additional copy of the SH3-CNL in the Arabica coffee
genome, Southern blot analysis was performed using a specific probe corresponding to a conserved
part of the NBS region (Figure III. 3). Whatever the restriction enzyme used, only a limited number of
hybridization bands was detected. Based on the restriction profiles predicted from sequence analysis of
C. arabica cv. IAPAR-59 BAC, it was possible to assign all the bands to one of the eight members
(five in the Ea genome and three in the C
a genome) present at the SH3 locus. No additional band was
detected, suggesting that this family is only present at the SH3 locus in C. arabica cv. IAPAR-59.
The presence and number of members of this gene family in a panel of diploid coffee species
were investigated by Southern blot analysis (Figure III. 4). While the SH3-CNL family was always
present, the number of members ranged from three to eight depending on the species. Intra-specific
variability was also observed for different accessions of C. canephora and C. eugenioides.
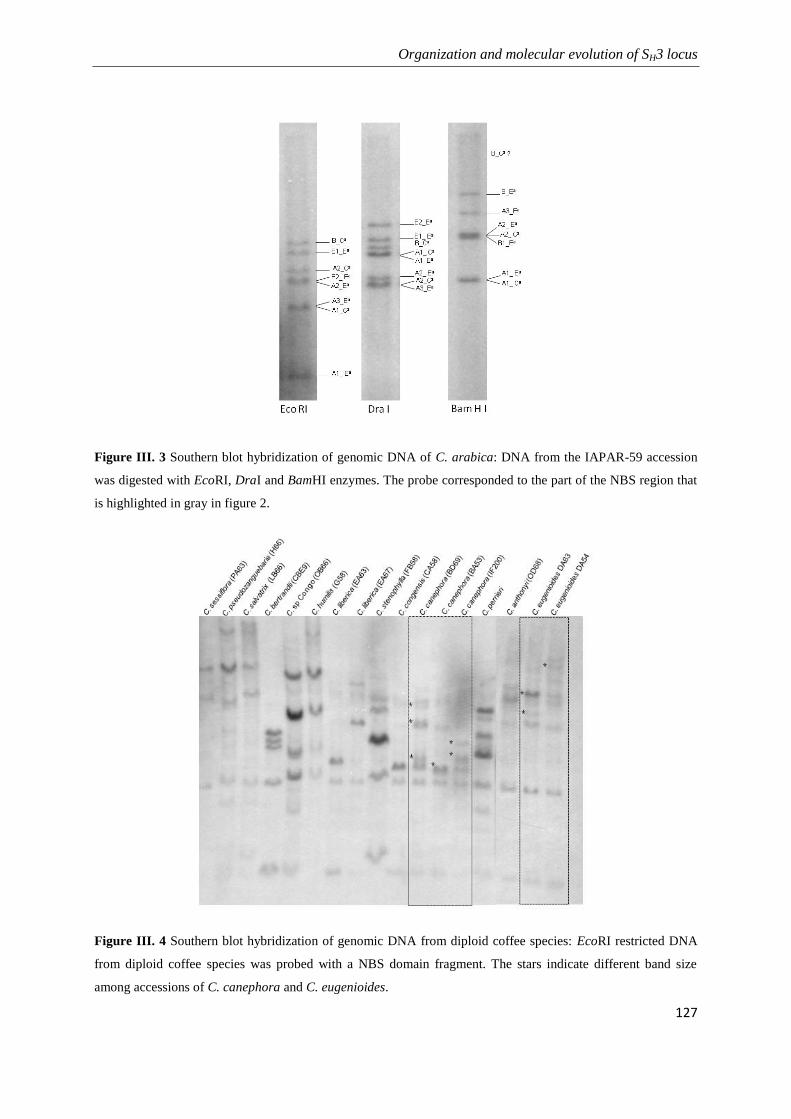
Organization and molecular evolution of SH3 locus
127
Figure III. 3 Southern blot hybridization of genomic DNA of C. arabica: DNA from the IAPAR-59 accession
was digested with EcoRI, DraI and BamHI enzymes. The probe corresponded to the part of the NBS region that
is highlighted in gray in figure 2.
Figure III. 4 Southern blot hybridization of genomic DNA from diploid coffee species: EcoRI restricted DNA
from diploid coffee species was probed with a NBS domain fragment. The stars indicate different band size
among accessions of C. canephora and C. eugenioides.

Organization and molecular evolution of SH3 locus
128
Origin and evolution of the SH3 R gene cluster
To investigate the origin of the SH3-CNL genes present at locus SH3 we performed
comparative analysis of the available sequences of three Coffea genomes and among the SH3-CNL
copies including their flanking regions. Since members of the SH3-CNL family were found to be
collinear in the comparisons of the three Coffea genomes (Figure III. 5A), we concluded that the
observed organization of this locus predates the divergence between C. eugenioides and C. canephora
lineages. The most parsimonious scenario for the evolution of this locus is illustrated in Figure III.5 B.
Two tandem duplications and several deletions shaped region A, whereas a distant
duplication/insertion event gave birth to the SH3-CNL member(s) in region B.
Locus SH3 was compared with the putative orthologous region in the tomato genome
(Solanum lycopersicum) which is, to date, the closest species to Coffea for which whole genome
sequence is available (http://solgenomics.net). Micro-synteny was found between the coffee SH3 locus
and two tomato genomic regions which shared 53.2 and 23.4% of the Coffea genes, respectively (data
not shown), but no CNL genes were found in these regions of the tomato genome.

Organization and molecular evolution of SH3 locus
129
Figure III. 5 Evolution of the SH3 locus in coffee species: A. Current organization of the SH3 locus in Coffea
canephora (Cc) and C. arabica (sub-genome E
a and sub-genome C
a). B - A model of the evolution of locus SH3
in coffee plants involving genome expansion and retraction by gene duplication and deletions. Gray arrows
indicate members of the SH3 family. Open arrows indicate other non-R genes flanking R genes in the locus as
numbered in [48]. Short arrows indicate truncated versions of corresponding genes

Organization and molecular evolution of SH3 locus
130
Sequence characterization of the SH3-CNL family
The coding sequence of all SH3-CNL members is composed of two exons separated by an
intron ranging from 157 to 272 nucleotides in length. The first exon spanned 1042 nt while the second
exon extended from 1703 to 2003 nt (Table III.1). The protein sequence extended from 915 to 1015 aa
(Table III. 1). The protein sequence alignment of the identified 12 SH3-CNL members (eight from C.
arabica and four from C. canephora) is shown in Figure III.6. SH3-CNL_A2_Ca was chosen as query
to annotate protein domains. BLASTp analysis against the Pfam database predicted a NBS domain
between positions 173 and 465 aa, while analysis of the Conserved Domain Database predicted the
beginning of the LRR region at position 625 aa of the query protein. COILS analysis revealed a
coiled-coil region located between position 17 and 56 aa, confirming that this family belongs to the
CC sub-family of NBS-LRR genes (or non-TIR sub-family). The LRR region of all genes consists of
12 repeats ranging from 23 to 31 aa, except B2_Ea, which has only 10 LRR. All members of SH3-CNL
family except A2_Ea have an open read frame.
Table III. 1 Exon, intron size (bp) and protein size (aa) of the SH3-CNL members identified in the three
analyzed genomes.
Copy genome Exon 1 Intron Exon 2 Protein (aa)
A1 Ea 1042 272 1787 943
A1 Ca 1042 255 1787 943
A1 Cc 1042 270 1898 980
A2 Ea 1042 270 1908 955
A2 Ca 1042 270 1820 954
A2 Cc 1042 269 1823 954
A3 Ea 1042 268 2003 1015
A3 Cc 1042 256 1865 969
B1 Ea 1042 258 1865 969
B2 Ea 1042 157 1703 915
B Ca 1042 260 1895 970
B Cc 1042 260 1874 972

Organization and molecular evolution of SH3 locus
131
100
Coiled-coil (CC) EDVID motif |
SH3-CNL_A2_Ca MASEAVTLALGTVTDLLAEEARFLFGVADQVKELEVELIGMQRLLKDADKKQLNDSTVRNYVRKIRRLAYRTEDVLEEFAVEIESRRRGHGFRKAFRRFA
SH3-CNL_A2_Ea ....................................................................................................
SH3-CNL_A2_Cc ......S.................S............................................C..............................
SH3-CNL_A3_Ea ......S......K..........S........V.......R.................D.................KY.....................
SH3-CNL_A1_Ca ......S......K..........S........V.......R.................D.................KY.....................
SH3-CNL_A3_Cc ......S....M.K...V......S........V.A..KR..CF...................E.............K......................
SH3-CNL_A1_Ea .G....S....M.K...V..G...S........V.A..KR..CF.............I.....E.............K......................
SH3-CNL_B1_Ea .G....SF.....K..........S........V.....R..CF...................E.............K......................
SH3-CNL_B_Ca .G....S......K..........S........V.....R..CF............R......E.............K..I...................
SH3-CNL_B_Cc .G....S......K..........S........V.....R..CF............R......E.............K......................
SH3-CNL_B2_Ea .G....S......K..........S........V..Y..R..CF......R............E.............K.....................S
SH3-CNL_A1_Cc .G....S......K..........S........V..Y..R..CF......R............E.............KY.....................
NBS domain 200
|
SH3-CNL_A2_Ca GLVSEGTALHRVGSEIASIIAGINSITKNLQTYGVIALSSTEDGQSSNARLDQNQQRLRQTYPHQVEEYFVGMEDDIRQLVSLITDERIRSHRVISVYGM
SH3-CNL_A2_Ea ....................................................................................................
SH3-CNL_A2_Cc ...................K.....L.............................................................G............
SH3-CNL_A3_Ea ....................................................................................................
SH3-CNL_A1_Ca ...C...............K.E...L....................................H........................G.........H..
SH3-CNL_A3_Cc C.I....S...........K.....L.T..E.............P......E...................................GL...........
SH3-CNL_A1_Ea C.I...IS...........KT..H.L.T..E..........................................K.............G.........H..
SH3-CNL_B1_Ea C.I...IS...........KS....L.T..E.................................H......................GL........H..
SH3-CNL_B_Ca C.I...IS...........K.....L....E....L.............................A.......K...........E.EN...........
SH3-CNL_B_Cc C.I...IS...........K.....L....E....................E...........D.....................Q.EN...........
SH3-CNL_B2_Ea C.I...MS...........K.....L.TD.EN.........................................K.............G.........H..
SH3-CNL_A1_Cc C.I...IS...........K.E.STL.T...................................D.....................Q.EN...........
300
P-loop/kinase-1 RNBS-A kinase-2 |
SH3-CNL_A2_Ca GGLGKTTLARKIYKHIEVERAFKQFAWVSVTQQCNTMTVFRDLLKQLVPDERKESVEKMDERELVGELYKVQKETKSLVVLDDLWEIEDWKRLSVAFPFA
SH3-CNL_A2_Ea ....................................................................................................
SH3-CNL_A2_Cc .....................................................A..............................................
SH3-CNL_A3_Ea ....................................................................................................
SH3-CNL_A1_Ca ..........................................I.......Q..D..G....................F.......K....EC.K......
SH3-CNL_A3_Cc ..........................................I.......Q..................R.........F...........C......L.
SH3-CNL_A1_Ea ..........................................I.......Q..D..G.....K..............F.......K....EC.K......
SH3-CNL_B1_Ea ..........................................I.....LEQ..........G.......R..............................
SH3-CNL_B_Ca ................D................Y........I.......Q.................................................
SH3-CNL_B_Cc ................D................Y..T.....I......EQ......E.......R...R.......F......................
SH3-CNL_B2_Ea ..........................................I.......Q..D..G....................F.......K....EC.K......
SH3-CNL_A1_Cc ................D................Y..T.....I......EQ..................R.......F......................
400
RNBS-B RNBS-C hydrophobic domain |
SH3-CNL_A2_Ca EADSKILITTRNQKLAEVEFPYPLNLLNEDEGWELLQKRAFAKRNGADCESGPRLEAVGRAIVRKCGNLPLAISAIGGVLSQKTSLEEWETVKNDVDSYI
SH3-CNL_A2_Ea ....................................................................................................
SH3-CNL_A2_Cc ...................................................D................................................
SH3-CNL_A3_Ea ................................................S..D.Q...E.....G.........................K..........
SH3-CNL_A1_Ca ...............V.D..L.S..................T......S..D.Q...E.....G.........................K..........
SH3-CNL_A3_Cc ................................................SK.D.Q.........G....................................
SH3-CNL_A1_Ea ...............V.D..L..............................D.L..........E...............TP..................
SH3-CNL_B1_Ea ...................................................D....T......L....................................
SH3-CNL_B_Ca ...............V.G..L....F......................N..D.Q..........E........................K......G...
SH3-CNL_B_Cc ......................R..F......................N..D.Q.........G.........................K..........
SH3-CNL_B2_Ea ...............V.D..L..................P.T......S..D.Q.........G....................................
SH3-CNL_A1_Cc ......................R..F.........................D................................................
500
RNBS-D |
SH3-CNL_A2_Ca RMSEGGKEEGYGAVLQVLALSYDELPYHLKPCFLYLGQYREDEDIDAEMLYRMWTAEGMVSSDHRRKGETLTDVAERYLYEMASRSMLQVKFYEFSTSRK
SH3-CNL_A2_Ea ....................................................................................................
SH3-CNL_A2_Cc ...........................................................I............A...........................
SH3-CNL_A3_Ea ...G....-..EP.........................F......E....H..........A...G..........................D.......
SH3-CNL_A1_Ca ...G....-..EP.........................F......E....H..........A...G..........................D.......
SH3-CNL_A3_Cc ............T.........................F........Q............................................D.C.....
SH3-CNL_A1_Ea ........Q.............................F.......T..................G..........................D......N
SH3-CNL_B1_Ea ........-.................N...........F..........................G.........................L....PA..
SH3-CNL_B_Ca ..R.......H...........................F..........................G..........................D.......
SH3-CNL_B_Cc ...G..................................F..........................G.........................L....PA..
SH3-CNL_B2_Ea ......................................F......................A..GG....................I.....D....A..
SH3-CNL_A1_Cc ....................................................................................................
600
MDL motif Spacer region |
SH3-CNL_A2_Ca VESCYLHDLMRDFCLA-GKEVEFLKLLDFRGGNDPLSDYSTERDDCTPRCSIHMEDGKKHCLGD-----VDSMISMALEASGQLRSLTLSGGTERRTASI
SH3-CNL_A2_Ea ................-...............................................-----...............................
SH3-CNL_A2_Cc ................R...............................................-----...............................
SH3-CNL_A3_Ea .K.........E....-.....................C...H.NS.......V.G....GP..-----......R................CG------
SH3-CNL_A1_Ca .K.........E....-.....................C...H.NS.......V.G....GP..-----......R................CG------
SH3-CNL_A3_Cc ................R.........F........S....RKH..S.......TG.DE..G...-----......R............V..SSGFHYVGV
SH3-CNL_A1_Ea ................-............................S..............G...-----......R......H.........SGYPEVR.
SH3-CNL_B1_Ea .R..............-............................S.......T..DE..G...-----.................F.....CG------
SH3-CNL_B_Ca ................-..................S.........S.......T......G...-----......R......H..........GF.RV..
SH3-CNL_B_Cc .R..............R.........F........S....RKH..S...R...TG.DE..G...-----...RT.R....G.H.........SGYPR.K.
SH3-CNL_B2_Ea .K.........E....-............................S.......T..DE..DDMEDDKSH......R................SGYPEV..
SH3-CNL_A1_Cc ................R...............................................-----...............................

Organization and molecular evolution of SH3 locus
132
700
LRR1 LRR2 LRR3 |
SH3-CNL_A2_Ca SFPEVICDSTKFKYVKVLKFEGYRLMGKGLPEGIKKLVNLRFLSLKGSALETLPSSIGQLQYLETLDIRVFPTITVPDVLCKLKGLKHLYFSPRTEVEG-
SH3-CNL_A2_Ea ........................F..........................................................................-
SH3-CNL_A2_Cc ........................F......K......S.....V.D.D..................................................-
SH3-CNL_A3_Ea -..R..F..N.C..L........DFT.....K............V.D.M.DD...............M..GNQ.W................FGLKK.GD-
SH3-CNL_A1_Ca -..R..F..N.C..L........DFT.....K............V.D.M.DD...............M..GNQ.W................FGLKK.GD-
SH3-CNL_A3_Cc ...R.....N.C...........DFT.....K............V.D.E.RE.................ARGS.K.................VVVRR---
SH3-CNL_A1_Ea ...Q.....N..............F......K..............N.D.....................YDP.K.................VVVRR---
SH3-CNL_B1_Ea -..R..F..N.C..L........DFT.....K............V.D.V..................M..SV.MR.............V...GVLRRTE-
SH3-CNL_B_Ca ..R...................SFR..DW.K............V.D.D....................AHLWMR......R.........AYD.Q...-
SH3-CNL_B_Cc ...Q...................DF......K............V.D.D.RE..................CN..K................A-D.N..D-
SH3-CNL_B2_Ea ...R.....N.............DF......K......S.....V.D.I.FE..................CN...................TGVYRRTED
SH3-CNL_A1_Cc ........................F......K......S.....V.D.D............F........SYQ.K....FRE....R.....VH.....-
800
LRR4 LRR5 LRR6 |
SH3-CNL_A2_Ca GQLSFLGLSKLETLVGFDDDVGDLKHLSGLNNLRFLGAIVNI-RKEKNDLPQMLKYLNSNRHNLREAQLEIYASG--EVVLPFLDLLSCHCLHQLSLWWG
SH3-CNL_A2_Ea .*........................................-................................--..L....................
SH3-CNL_A2_Cc ..........................................-..........................A...D-DNN......................
SH3-CNL_A3_Ea ..............I..N................L.H.T.H.G-..........N.......K..K...A.FV..-E..................TIIG.
SH3-CNL_A1_Ca ..............I..N................L.H.T.H.G-..........N.......K..K...A.FV..-E..................TIIG.
SH3-CNL_A3_Cc --...............NVNF...............R..M..-S..........N.......K......V...DVQNK.....R...........R.T..
SH3-CNL_A1_Ea --.............D.GN.................R..M..S-..........N.......K........R.Y.EE......R...........TIIS.
SH3-CNL_B1_Ea --V.................................H..M..S-..........N.....L.K......V.....K-..................DIIG.
SH3-CNL_B_Ca .L...............N.N..................T...S-E.........I.....Q.K......V.....K--...............E.KIFR.
SH3-CNL_B_Cc .L.................NF.........S.....R...I.-...........N....KQ.K...P....R.D.EE.....V............IMRL.
SH3-CNL_B2_Ea .L.......E.........S..........S.....H.T...S-..........N.......K........I.D.QN..................IMRL.
SH3-CNL_A1_Cc .................NGNF.................T.H.-SE.........N.......K....H.N.H.D.EE...............RKSAIFK.
900
LRR7 LRR8 LRR9 LRR10 |
SH3-CNL_A2_Ca RCEFQKVEPPLSPSNLSELSLLQCSIEGDPMSVLGDLPNLRRLLFLLVDLVDRNVMIIDANAFPKLASLEIIGIKNLEKWVVAEGCMPNLSHLTIDRCEA
SH3-CNL_A2_Ea .....................................................K..............................................
SH3-CNL_A2_Cc ...................................................................................Q................
SH3-CNL_A3_Ea .Y.....K.........K.L.W.........NF..Y.S...S.TLAY...GE.......E......V..A..RVG..........S.....R.R......
SH3-CNL_A1_Ca .Y.....K.........K.L.W.........NF..Y.S...S.TLAY...GE..............V..A..RVG..........S.....R.R......
SH3-CNL_A3_Cc .......RA..........H.FW............N.........VF....E.KM...........V..G...............S.....D.A.RS...
SH3-CNL_A1_Ea .......K...........L..G............N.......SLMS....E.S.....E......V....FR..........Q.S.....D.A.SG..E
SH3-CNL_B1_Ea .Y.................L.QG............N.......TLAF....E..............VA.R...............S.......A.AY..E
SH3-CNL_B_Ca .......RA........K.L.WE......................YK....E.....S........VT.G..D.R..........S.....D.R.EG..E
SH3-CNL_B_Cc .W.....RA........Q.L.FG..................S...YK....E.....S........V..G..D.R..........S.....D.R.EG..E
SH3-CNL_B2_Ea .W.....RA..........R.FG..................S...CD.E..E..............V....TA............S.......E.AY.HE
SH3-CNL_A1_Cc .......RA..........L.WD............................E.....S..............D............S.........EE.DE
1000
LRR11 LRR12 |
SH3-CNL_A2_Ca LEMIPDGLRFITTLRKLEIKMPEEFIVQRIHGIDGRGGPDRDKICHVPVIAIQSVLPPKNSWD*
SH3-CNL_A2_Ea ........................................H...........E.X
SH3-CNL_A2_Cc ...............................................................*
SH3-CNL_A3_Ea ..............................Y.............SR....N.E.
SH3-CNL_A1_Ca ..............................Y.............SR....N.E.YGSML*
SH3-CNL_A3_Cc ...................R........................SR....K.E.YASK.KKLLIQPTDDISSEEASSSVD*
SH3-CNL_A1_Ea ...................R........................SR....K.E.
SH3-CNL_B1_Ea ...................R........................R.....K.EKSX
SH3-CNL_B_Ca ...........R...E...E.H........R...................K...YGCK.SAPYFLPTDGICGEESSSSVD*
SH3-CNL_B_Cc ...........R...E...E.H........R...................K...YGCK.SAPYVLPTDGICGEESSSSVD*
SH3-CNL_B2_Ea ...T..--EX.........R....................H...SR....K.G.
SH3-CNL_A1_Cc ...............R...Y..........N.....E.......R.....K.E.YGSILKNKHLIQPTDDIWSEESSSSVDCKSSHH*
Figure III. 6 Alignment of the predicted amino acid sequences from SH3-CNL members The coiled-coil domain
is in rectangle. The motifs in NBS domain are underlined: P-loop/kinase 1, RNBS-A, kinase II, RNBS-B,
RNBS-C, hydrophobic domain. The first sequence is shown in full, while other proteins only those amino acids
that differ from the first one are indicated. The xxLxLxx motif in the LRR domain is boxed, where L is any
aliphatic amino acid and x is any aminoacid. Gaps introduced at alignment are indicated by dashes, while
asterisks indicate the presence of stop codons. NBS probe used in southern hybridization is highlighted in gray.
The tryptophan residue (W), specific to the non-TIR–NBS–LRR class of plant disease R gene, located at the end
of the kinase 2 motif (Meyers et al., 2004) is presented in bold face in a square.

Organization and molecular evolution of SH3 locus
133
Cloning of SH3-CNL_A2 members from diploid species of coffee
To study interspecific diversity, the SH3-CNL_A2 member was cloned from six coffee species
(C. anthonyi, C sp. Congo, C. canephora, C. eugenioides, C. liberica, C. pseudozanguebarie). The
cloned fragments were around 4 kb in size. Their sequences were determined and compared with those
from Ca, E
a and C
c genomes.
Sequence diversity analysis of the SH3-CNL family
Using the GENECONV program (Sawyer, 1989), significant traces of gene conversion were
detected among the member of the SH3-CNL family, both in C. arabica and C. canephora (Table III.
2). Among the eight different gene conversions detected, six occurred between the first exon and the
intronic region. Moreover, two of the detected gene conversion events involved inter subgenomic
exchanges. The DNA sp program (v.5) was used to estimate polymorphism among the four SH3-CNL
members in the genome of C. canephora species (Cc). The highest level of DNA polymorphism was
detected in the LRR domain (π=0.17, 0.20 and 0.15) while the most conserved regions were in the
NBS domain, especially in the P-loop, Kinase 2 and hydrophobic domains (Figure III.7).
Table III. 2 Gene conversions detected among SH3-CNL members.
Sub-genome
analyzed
SH3-CNL members BC KA pValue Begin End Length (Nc)
Cc
A1_Cc x A2_C
c 0.00000 1269 2263 994
Cc
A1_Cc x B_C
c 0.00057 392 1217 825
Ca
A1_ Ca x A2_ C
a 0.00246 2974 3075 101
Ca
A1_Ea x A2_ E
a 0.00000 238 1176 938
Ea A3_E
a x B2_E
a 0.00127 396 1317 921
Ea
A1_Ea x B1_E
a 0.00398 2041 2223 182
Ca + E
a A1_C
a x B2_E
a 0.00042 550 1300 750
Ca + E
a A3_E
a x B2_E
a 0.00049 396 1317 921
Ca + E
a A3_E
a x A1_C
a 0.00103 550 1300 750
BC KA P (Bonferroni-corrected Karlin–Altschul (p values)) Begin, first nucleotide of the potential converted
region; End, last nucleotide of the potential converted region; Length, length of the converted region (Nc).

Organization and molecular evolution of SH3 locus
134
Figure III. 7 Nucleotide diversity among SH3-CNL members from C. canephora: Nucleotide diversity (Pi) is the
average number of nucleotide differences per site between two sequences calculated by DnaSP v.5. Nucleotide
diversity was calculated using the sliding window method where a window (segment of DNA) is moved along
the sequences step by step. The parameter is calculated in each window, and the value is assigned to the
nucleotide at the midpoint of the window. Both the default values were used: window length of 100 sites, and
step size of 25 sites (midpoint). The alignment gaps were not counted in the window length (or slide).
To check the type of selection that acted on genes in the SH3-CNL family, the ratio between
non-synonymous (Ka) and synonymous substitutions (Ks) was estimated using DNAsp v.5. The
Ka/Ks substitution rate was calculated for each pair between ortholog and/or paralog members in C.
arabica and C. canephora species. We also calculated the Ka/Ks between each pair of A2 members
cloned from diploid coffee species together with A2 members from sequenced genomes (C. arabica
and C. canephora). The analysis was performed on the complete coding sequence as well as on
different domains (CC, NBS, LRR). Analysis also focused on codons encoding the solvent-exposed
amino acids of the β-strand/β-turn motifs (x residues in xxLxLxx motifs) in the LRR domains.
Strong evidence for positive selection (Ka/Ks>1) was observed only for residues in xxLxLxx
motifs. Among the 66 pair combinations between 12 BAC derived R-genes, 20 involving B members
were under positive selection (Figure III.8). When the same region was analyzed among orthologous
A2 members, no significant Ka/Ks>1 was found (Figure III.9) but 3 Ka/Ks < 1 were observed.

Organization and molecular evolution of SH3 locus
135
DISCUSSION
Organization and evolution of the SH3-CNL family
Comparative analyses of R-gene clusters across different haplotypes or species demonstrated
that the evolution of resistant genes is a dynamic process mostly involving duplication, deletion,
sequence exchange, point mutation, diversified selection, recombination, gene conversion and
retroelement insertion (Dai et al., 2010; David et al., 2009b; Innes et al., 2008; Kruijt, 2004; Kuang et
al., 2008; Kuang et al., 2005b; Noel, 1999; Parniske and Jones, 1999; Seah et al., 2007b; Xiao, 2004).
The cluster arrangement of R-genes represents an important reservoir of diversity and a source of
genetic variation allowing the generation of novel resistance specificities via gene conversion, gene
duplication, unequal crossing-over, ectopic recombination or diversifying selection (Hulbert et al.,
2001; Michelmore and Meyers, 1998). To explore the organization and to characterize the
mechanisms involved in the evolution of the SH3 locus, where a putative R-gene cluster was identified
(Cenci et al., 2010) a ~550 kb sequence was analyzed in three coffee genomes, Ea and C
a from C.
arabica and Cc from C. canephora. Sequence analysis revealed the presence of a variable number of
NBS-LRR genes belonging to the CC subclass at the SH3 locus. All these genes belong to the same
family (hereafter called SH3-CNL family). Sequence analysis of regions flanking the SH3-CNL genes
helped determine the orthology relationship among the copies in different genomes. At the same time,
several traces of ancient duplications made it possible to trace back the duplication/deletion events
which, consistently with the birth and death evolution model, shaped the SH3 locus from the most
recent common ancestor of all SH3-CNL copies. Since the structure of the SH3 locus was well
conserved in all three Coffea genomes analyzed, one can conclude that the origin of most of the SH3-
CNL copies predates the divergence between Coffea species.
Homologs of SH3-CNL genes were found in several dicot species, but comparative genomics
failed to find a CNL R-gene in the orthologous regions of three Rosid species (Cenci et al., 2010) and
Solanum lycopersicum (order Solanales) which belongs as the Coffea species (order Rubiales) to the
Asterid clade. Consequently, it can be concluded that the ancestral SH3-CNL copy was inserted in the
SH3 locus after the divergence between Solanales and Rubiales lineages.
In a similar study by David et al. (David et al., 2009b) the authors compared the B4 locus of
Phaseolus vulgaris (that has 26 CNL genes) with three sequenced legume genomes, Medicago
trunculata (Mt), Lotus japonicas (Lj) and Glycine max (Gm). Their analysis revealed that conserved
microsynteny existed among legumes species, except for the CNL sequences, which appeared to be
completely absent in the corresponding regions of Mt and Lj and only a truncated CNL was found in

Organization and molecular evolution of SH3 locus
136
syntenic regions of Gm (David et al., 2009b). They suggested that CNL were inserted in the ancestor
of the B4 locus after Mt, Lj, and Pv diverged but before the divergence of Pv and Gm through an
ectopic recombination event between non-homologous chromosomes. Phylogenetic analysis including
those legume CNL sequences and all known Pv B4-CNL sequences supported this hypothesis (David
et al., 2009b).
Structural instability induced by repetitive mobile elements is one of the mechanisms that
could lead to diversification into R gene families. The presence of very similar sequences increases the
possibilities of mispairing during recombination, giving rise to unequal crossovers and interlocus gene
conversions (Mcdowell and Simon, 2006; Meyers et al., 2003a; Michelmore and Meyers, 1998;
Richter and Ronald, 2000). However, the edges of the duplications involved in the birth of new SH3-
CNL copies were not related to mobile elements and mobile elements identified in the region did not
appear to play a role in the structural evolution of the SH3 locus of Coffea species.
Gene conversion (i.e. the substitution of a portion of a gene sequence by the homologous
sequence of another related gene) is more frequent among members of highly similar, tightly clustered
families (Mondragon-Palomino and Gaut, 2005). Gene conversion is a common phenomenon and it
has been detected between paralogs in many R-gene clusters (Caicedo, 1999; Cooley et al., 2000;
Dodds et al., 2001; Ellis et al., 1999b; McDowell et al., 1998; Meyers, 1998; Noel, 1999; Parniske,
1997; Sun et al., 2001; Van der Hoorn et al., 2001). Sequence exchanges between different sub-
genomes have previously been detected in a R1 resistance-gene cluster of one CNL subfamily in
allohexaploid, Solanum demissum (Kuang et al., 2005a). In that study, seven of the 17 sequence
exchanges among R1 homologs occurred between different genomes. Two explanations were
proposed: first, sequence exchanges among different haplotypes could be generated through gene
conversions or alternatively, they might have occurred through recombination before speciation and
have been conserved in S. demissum (Kuang et al., 2005a). At the SH3 locus, gene conversion events
were detected between paralogs in all three coffee genomes analyzed and also between members of
the two sub-genomes of C. arabica.
Conversion events were detected between SH3-CNL members independently of their
orientation (i.e. between members in region A and B).The inverted orientation of the loci might allow
rare interlocus gene conversion or unequal exchange while minimizing the risk of gross chromosomal
rearrangement (Parniske and Jones, 1999). The gene orientation in a cluster of NBS-LRR has also
been studied in rice (Hulbert et al., 2001) and A. thaliana (Mondragon-Palomino and Gaut, 2005).
These studies demonstrated that conversion can occur between genes in the same or in opposite
orientation, however conversion is more frequent in gene families arranged as direct repeats because
they have higher similarity than those found in opposite orientation.

Organization and molecular evolution of SH3 locus
137
In addition, gene conversion appears to be more frequent in perennial than in annual plants.
Yang et al. (2008), compared the gene conversion events among NBS-encoding genes in two perennial
and two annual plants. A total of 823 and 468 gene conversion events involving 299 and 187 NBS-
encoding genes were detected in grapevine and poplar, respectively, while only 143 and 81 gene
conversion events were detected in Arabidopsis and rice, respectively (Yang et al., 2008b). Since the
long-generation time of woody species slows down the accumulation of evolutionary change, the
authors suggested that an excess of recent duplications and a higher conversion rate in grapevine and
poplar could generate novel resistance profiles to compensate for life history traits. According to
Kuang et al. (Kuang et al., 2004; Kuang et al., 2005b) SH3-CNL members should be classified as
evolutionary type I (fast evolving genes) since several conversion events were detected between
members.
Effect of selection on molecular evolution of the SH3-CNL family
Natural selection influences the molecular evolution of sequences by increasing or reducing
the fixation probability of a given mutation which, respectively, increases or reduces the fitness of the
individuals carrying it. The effect of natural selection on a gene sequence can be investigated by
analyzing nucleotide substitutions that occurred between two variants of this gene. Since synonymous
substitutions (i.e. nucleotide substitutions that do not change the amino acid sequence) are supposed to
not modify the phenotype, their accumulation is considered not to be influenced by natural selection.
Conversely, non-synonymous substitutions (nucleotide substitutions that modify coded amino acids)
could increase, reduce, or not influence the fitness of the individuals carrying it; consequently, their
accumulation could be influenced by natural selection. The ratio of non-synonymous (Ka) to
synonymous (Ks) substitution rates could be used to infer the effect of natural selection of a given
gene or a part of it. When Ka and Ks have similar values (Ka/Ks ≈ 1), one could infer a neutral effect
of selection; when Ka is significantly lower than Ks (0 < Ka/Ks < 1), it could be deduced that the
selection purges the gene sequence of most non-synonymous substitutions (purifying selection);
finally, when Ka is significantly higher than Ks (Ka/Ks > 1), the selection is assumed to favor fixation
of new variants (positive or diversifying selection) (Bergelson, 2001; Hurst, 2002).
In many NBS-LRR genes, analysis of corresponding proteins revealed high non-
synonymous:synonymous substitution ratios in the leucine-rich (LRR) domain, mainly concentrated
on the putative solvent-exposed residues, indicating that the LRR domain is subject to positive
selection for amino acid diversification, (Botella, 1998; Dodds et al., 2001; Ellis et al., 2000a; Ellis et
al., 1999a; Geffroy et al., 2009; McDowell et al., 1998; Meyers, 1998; Michelmore and Meyers, 1998;
Parniske, 1997; Shen et al., 2002; Yahiaoui et al., 2006). These results are consistent with the

Organization and molecular evolution of SH3 locus
138
observation that nucleotide polymorphisms found in the leucine-rich (LRR) region of R genes are
often responsible for pathogen specificity (Ellis et al., 2000a).
In the SH3-CNL family, significant positive selection was only detected when the Ka/Ks
analysis was focused on solvent-exposed residues (i.e. the x residues in xxLxLxx motif from LRR
domain) most frequently among paralog members. Conversely, when larger regions were considered,
the effect of natural selection was diluted and not detectable.
In the co-evolutionary arms race between hosts and their pathogens, genes involved in their
interaction are expected to evolve under positive selection. The positive selection detected in the
solvent-exposed residue of the SH3-CNL members could indicate involvement in recognition of
pathogen attack.
CONCLUSIONS
The SH3-CNL family appears to have evolved following the birth-and-death model, since
duplications and deletions were inferred in the evolution of the SH3 locus. Gene conversion between
paralog members from the same or different sub-genomes and positive selection appear to be the
major forces influencing the evolution of SH3-CNL in coffee trees.
MATERIALS AND METHODS
Plant material and DNA extraction
The cv. IAPAR 59 of Coffea arabica and six Coffea species were analyzed in this study: C.
canephora (IF200), C. anthonyi (OD68), C sp. Congo (OB66), C. eugenioides (DA54), C. liberica
(EA67), C. pseudozanguebarie (H66). Genomic DNA was isolated from leaves of greenhouse grown
plants located at IRD (Institut de Recherche pour le Développement) Montpellier, France. Leaves were
frozen in liquid nitrogen and DNA was extracted using a CTAB procedure (Doyle and Doyle, 1987)
with modified extraction buffer (3% CTAB, 1.4 mM NACl, 100 mM Tris HCl, 20 mM EDTA, pH
0.8).

Organization and molecular evolution of SH3 locus
139
BAC sequences
Several Bacterial Artificial Chromosome (BAC) clones spanning the SH3 locus were isolated
from a C. arabica (IAPAR59) (Noir et al., 2004) and a C. canephora (HD-200-94) (unpublished data)
libraries. Based on fingerprint data and overlapping sequence analysis, BAC sequences were
assembled in contigs specific to the C. arabica and C. canephora genomes (hereafter called Cc for C.
canephora genome; Ea and C
a for ―eugenioides‖ and ―canephora‖ sub-genomes of C. arabica)
(Lashermes et al. 2010). Gene annotation of the BAC was already available (Cenci et al., 2010).
Primer design and cloning procedure
Orthologous specific primers to amplify A2 members of the SH3-CNL family from wild
Coffea species were designed based on sequence alignments of A2 members in C. canephora and C.
arabica: A2_Left: 5‘-CCTTGATAAGAAACATGAATGAAATACACGA-3‘ and A2_right 5‘-
AAGGATAAATGAGAAGAACTACTGAGCCTG-3‘. DNA amplification was performed with
ExpandTM
20Kbplus
PCR System (Roche Applied Science, Mannheim Germany). PCR were performed
as follows: one cycle of 1 min at 95 °C, 10 cycles of 10 sec at 94 °C, 45 sec at 50 °C, 5 min at 68 °C
followed by 20 cycles of 10 sec at 94 °C, 45 sec at 50 °C, 7 min at 68 °C plus 10 sec per cycle, and
final extension of 7 min at 68 °C. A10 µl aliquot from each PCR amplification was analyzed by
electrophoresis in a 1.2% agarose gel. The amplicons were gel-stained using Crystal violet and the
DNA bands were purified using a S.N.A. P™ purification column (Invitrogen Carlsbad, CA). The
PCR products were cloned into the pCR®-XL-TOPO
® kit from Invitrogen and chemically competent
cells (Invitrogen Carlsbad, CA) according to the manufacturer‘s protocol. Eight colonies were
randomly selected for screening. Colony PCR of eight random samples was used to select clones
containing the complete amplicon. For this purpose, two new primers were designed to amplify the
extremities of the genes in combination with the primers used to amplify the whole gene: 5‘-
CGACAGTGGGAACGAAACCC-3‘combined with A2_Left and 5‘-
TGGAGGACCGGATCATGAACA-3‘ combined with de A2_RIGHT. The colony PCR was
performed as follows: 10 min at 94 °C, followed by 30 cycles of 30 sec at 94 °C, 30 sec at 55 °C, 4
min at 72 °C and final extension of 10 min at 72 °C. The colonies shown to contain the complete insert
were transferred to 5 ml LB broth with 50 µg/ml kanamycin and incubated at 37 °C overnight.
Plasmid DNA was isolated using Promega Wizard® Plus Minipreps DNA purification System
(Promega Corporation, Madison, WI, USA) according to manufacturer‘s instructions. Two
independent PCR and sequencing were carried out to ensure quality.
Organization and molecular evolution of SH3 locus
140
Sequencing and analysis of cloned SH3-CNL members
Plasmid DNA was sequenced at Genome Express (Grenoble, France) using M13-universal-
forward and reverse primers and five other internal primers were designed using the Primer3 program
(Whitehead Institute, USA) to allow whole gene sequencing. INT1-L: 5-
TCCATCGTCCAAGATACAGC-3, INT2-L: 5-TTTGTTGGGATGGAAGATGA-3, INT3-L: 5-
GCTGGGAGTTGCTTCAAAAG-3, INT4-L: 5-TCGAATGTGGACAGCAGAAG-3, INT5-L: 5-
GCCTTGGAGACACTTCCATC-3. The cloned sequence contigs were assembled using the Staden
package (Staden, 1996). The complete sequences of each clone were aligned using Bioedit v.7.0 (Hall,
1999).
Southern blot analysis
Southern blot analysis was performed as follows: 20 µg of genomic DNA was extracted as
described above and digested with a restriction enzyme (only EcoRI for the panel of diploid species
EcoRI, DraI and BamHI for the Coffea arabica cv. IAPAR-59) and separated by agarose gel
electrophoresis. The digested DNA was transferred to Hybond-N+ nylon membranes for Southern
hybridization as described in Noir et al. (Noir et al., 2004). SH3-CNL family specific probe was
obtained by PCR amplification using primers designed on the NBS domain (left primer: 5‘-
CGGTCTCGGTAAGACCACTC-3‘and right primer 5‘-CCTCTGCAAATGGAAATGCT-3‘). The
amplified 516 bp fragment was labeled with [32P]-dATP according to the manufacturer‘s
recommendations (Megaprime DNA Labelling Systems kit, Amersham) and used as probe in the
hybridization experiment as described in Sambrook et al. (Sambrook et al., 1989).
Motif predictions
SMART protein motif analyses (http://smart.embl-heidelberg.de) and Pfam database
(http://pfam.sanger.ac.uk/search/sequence) were used to detect motifs in the SH3-CNL genes. A COIL
with a threshold of 0.9 was used to specifically detect CC domains (Lupas et al., 1991).
Gene Conversion
In order to check the possibility of conversion events among the SH3-CNL members,
alignments of sequences from C. arabica and C. canephora species were analyzed with the GeneConv

Organization and molecular evolution of SH3 locus
141
program (Sawyer, 1989) using the default settings (in particular, mismatches within fragments were
not allowed). The program tests for gene conversion by finding identical fragments between pairs of
sequences in a nucleotide alignment. Pairwise P values are assigned based on the comparison of each
fragment with the maximum fragment length that is expected from the sequence pair by chance
(Sawyer, 1989). Pairwise P values were obtained by the method of Karlin and Altschul (Karlin and
Altschul, 1993).
Sequence evolution
Protein sequences were manually aligned with the BioEdit program. The amino acid sequence
alignments were used to guide the alignments of nucleotides using MEGA version 4.1 (Tamura et al.,
2007). Nucleotide diversity (π) was calculated by DnaSP v.5 (Librado and Rozas, 2009) where each
paralog was considered as an independent allele of population.
The Ka/Ks ratio was estimated by DnaSP based on Nei and Gojobori‘s equation (Nei, 1987) for full-
length CDS for specific domains: (CC, NBS, LRR), for the xxLxLxx motifs in the LRR domain, and
for the solvent-exposed residues (i.e. only the x residues in the xxLxLxx motif). P values were
calculated and the significance level was compared at 0.05 and 0.01%.
Microsynteny Analysis
The search for putative gene orthologs of the genes at the SH3 locus was performed by
TBLASTN analysis on the tomato genome sequence (Solanum lycopersicum) available in Solanaceae
Genome Network (www.sgn.cornell.edu).

142
P
Ka/ka A1_Ea A1_C
a A1_C
c A2_E
a A2_C
a A2_C
c A3_E
a A3_C
c B1_E
a B_C
a B_C
c B2_E
a
A1_Ea
0.0577 0.0982 0.0838 0.0838 0.0405 0.0577 0.0606 0.0696 0.0097 0.0275 0.0383
A1_Ca 3.09
0.0448 0.2066 0.2066 0.1503 N/A 0.1033 0.0139 0.0157 0.0080 0.0362
A1_Cc 1.09 3.02*
0.2430 0.2430 0.1963 0.0448 0.0517 0.1212 0.1800 0.0987 0.0613
A2_Ea 2.65 1.89 1.86
N/A 0.6055 0.2066 0.2294 0.0988 0.0950 0.2670 0.0503
A2_Ca 2.65* 1.89 1.86 N/A
0.6055 0.2066 0.2294 0.0988 0.0950 0.2670 0.0503
A2_Cc 3.52* 2.16 2.03 0.53 0.53
0.1503 0.1392 0.0563 0.0530 0.1487 0.0214
A3_Ea 3.09 N/A 3.02* 1.89 1.89 2.16
0.1033 0.0139 0.0157 0.0080 0.0362
A3_Cc 1.30 2.46 0.73 1.95 1.95 2.46 2.46
0.3088 0.0610 0.1039 0.1541
B1_Ea 3.82 6.95* 2.25 2.49 2.49 3.14 6.95* 1.80
0.0203 0.0156 0.0475
B_Ca 5.75** 5.28* 1.38 2.57 2.57 3.30 5.28* 3.19 4.55*
N/A 0.0076
B_Cc 4.38* 7.16** 2.45 1.82 1.82 2.31 7.16** 2.75 5.66* N/A
0.0652
B2_Ea 4.03* 3.65* 0.78 3.45 3.45* 5.26* 3.65* 2.38 4.09* 7.49** 4.55
Figure III. 8 Ka/Ks ratio in the solvent-exposed residue of SH3-CNL members: The Ka/Ks ratio was calculated in the solvent-exposed residue of the LRR domain by
pairwise comparison of SH3-CNL members. Values below the diagonal are the Ka/Ks ratio and values above are the probability, significance level for Ka>Ks indicated
by * P<0.05, ** P<0.01. N/A=not applicable.
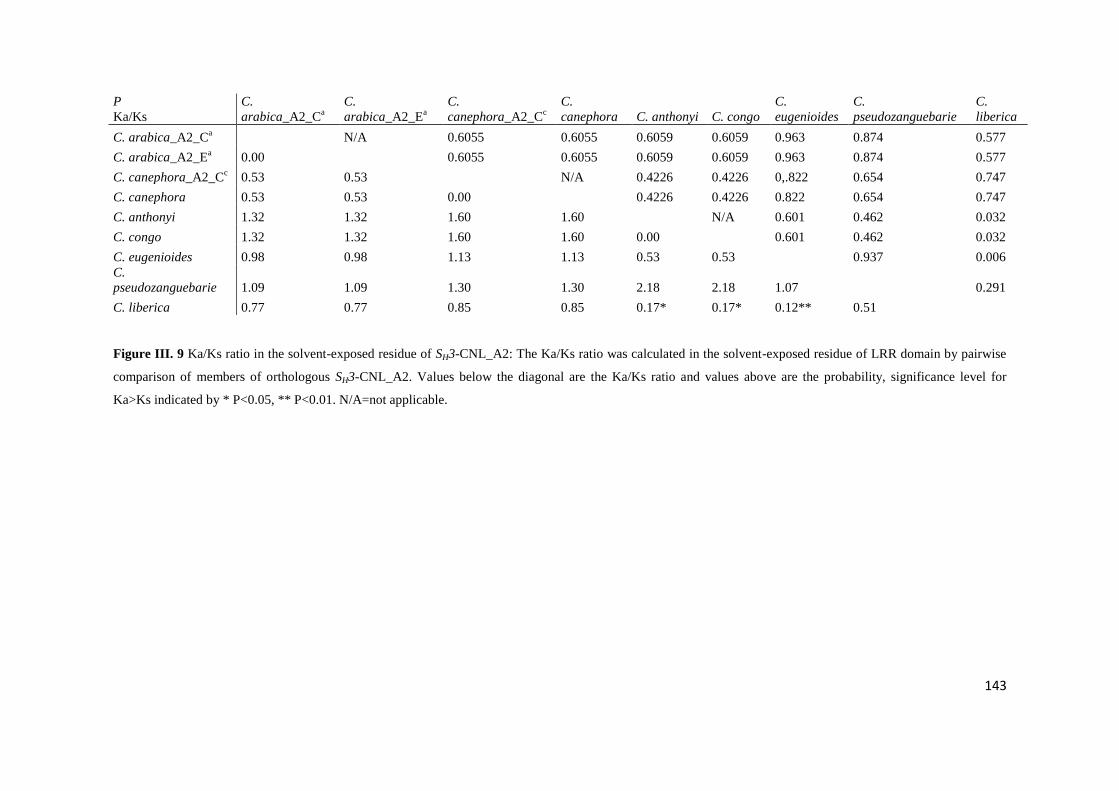
143
P
Ka/Ks
C.
arabica_A2_Ca
C.
arabica_A2_Ea
C.
canephora_A2_Cc
C.
canephora C. anthonyi C. congo
C.
eugenioides
C.
pseudozanguebarie
C.
liberica
C. arabica_A2_Ca
N/A 0.6055 0.6055 0.6059 0.6059 0.963 0.874 0.577
C. arabica_A2_Ea 0.00
0.6055 0.6055 0.6059 0.6059 0.963 0.874 0.577
C. canephora_A2_Cc 0.53 0.53
N/A 0.4226 0.4226 0,.822 0.654 0.747
C. canephora 0.53 0.53 0.00
0.4226 0.4226 0.822 0.654 0.747
C. anthonyi 1.32 1.32 1.60 1.60
N/A 0.601 0.462 0.032
C. congo 1.32 1.32 1.60 1.60 0.00
0.601 0.462 0.032
C. eugenioides 0.98 0.98 1.13 1.13 0.53 0.53
0.937 0.006
C.
pseudozanguebarie 1.09 1.09 1.30 1.30 2.18 2.18 1.07
0.291
C. liberica 0.77 0.77 0.85 0.85 0.17* 0.17* 0.12** 0.51
Figure III. 9 Ka/Ks ratio in the solvent-exposed residue of SH3-CNL_A2: The Ka/Ks ratio was calculated in the solvent-exposed residue of LRR domain by pairwise
comparison of members of orthologous SH3-CNL_A2. Values below the diagonal are the Ka/Ks ratio and values above are the probability, significance level for
Ka>Ks indicated by * P<0.05, ** P<0.01. N/A=not applicable.

144
CHAPTER IV
Agrobacterium-MEDIATED GENETIC TRANSFORMATION OF Coffea
arabica (L.) IS HIGHLY ENHANCED BY USING LONG-TERM
MAINTAINED EMBRYOGENIC CALLUS
This chapter was written as an article and submitted to BMC Plant Biology
Agrobacterium-mediated transformation of C. arabica
145
Agrobacterium-mediated transformation of Coffea arabica
(L.) is highly enhanced by using long-term maintained
embryogenic callus
Alessandra F. Ribas, Eveline Dechamp, Anthony Champion, Benoît Bertrand, Marie-Christine
Combes, Jean Luc Verdeil, Fabienne Lapeyre, Philippe Lashermes, Hervé Etienne
ABSTRACT
Background: One of the challenges following the genome sequencing of several important crop
plants is to determine the function of all the predicted genes. The main difficulty when applying gene
validation approaches to woody species is the low recovery of transgenic plants from elite or
commercial cultivars. Embryogenic calli have been frequently used as the target tissue for
transformation, but the difficulty in producing or maintaining embryogenic tissues is one of the major
problems encountered in genetic transformation of many woody plants, including Coffea arabica.
Results: We established the conditions for long-term proliferation of embryogenic cultures in C.
arabica and a highly efficient and reliable Agrobacterium tumefaciens-mediated transformation
method based on their utilization. The transformation protocol using LBA1119 harbouring
pBin35SGFP was established by evaluating the effect of different parameters on transformation
efficiency through GFP detection. Using embryogenic callus cultures, co-cultivation with LBA1119
OD600 = 0.6 for 5 days at 20°C enabled reproducible transformation. However, the maintenance
conditions for the embryogenic callus cultures - particularly a high auxin:cytokinin ratio and the
culture age (opt. for 7-10 month proliferation) - and use of the yellow callus phenotype were revealed
to be the most important factors for achieving highly efficient transformation (> 90%). Transformation
success was related to the abundance of proembryogenic masses (PEMs). All the regenerated plants
were proved to be transformed by PCR and Southern blot hybridization.
Conclusion: Most of the progress achieved in increasing transformation efficiency was brought about
by optimizing the production conditions of the explant much more significantly than with
conventional optimization of co-cultivation conditions. The establishment of maintained embryogenic
cultures and the optimization of their physiological status could be a valuable way of establishing
reliable transformation conditions in other recalcitrant woody species.

Agrobacterium-mediated transformation of C. arabica
146
BACKGROUND
Recent advances in plant genomics have greatly increased knowledge of gene structure,
organization, evolution and biological functioning. The genome sequencing of several important crop
plants such as wheat, sugarcane, tomato, potato, banana, eucalyptus and coffee, has already been
completed or is in progress (NBCI Entrez Genome Project data base;
http://www.ncbi.nlm.nih.gov/genomeprj). So far, the information generated will offer some
tremendous new challenges in plant biology, including determining the function of predicted genes.
For example, with the 120Mb genome of the model plant Arabidopsis thaliana, only 60% of the
33,518 unique genes initially predicted could have an experimentally assigned function (TAIR data
base; http://www.arabidopsis.org/portals/genAnnotation/genome_snapshot.jsp). The most reliable way
to assess gene function is engineering transgenic plants to generate gain-of-function or loss-of-
function mutants (Curtis and Grossniklaus, 2003). Gene function analysis using plant transformation is
well established in model plants. However, for many important crop plants, including most woody
species, genetic transformation still remains a laborious and low-efficiency process.
The main difficulty when applying gene validation approaches to woody species is the low
recovery of transgenic plants from elite or commercial cultivars (Gomez-Lim and Litz, 2004; Pérez-
Clemente et al., 2004; Petri and Burgos, 2005). Apart from poplar - a model plant for woody plant
transformation with overall transformation efficiencies between 15 and 36% (Cseke et al., 2007;
Yevtushenko and Misra, 2010) - a low transformation efficiency has been reported in many woody
species ranging from 1.5% to 4.7% in apple (Yao et al., 1995; Bolar et al., 1999; Seong and Song,
2007), 3.8 to 8.6% in apricot (Lopez-Noguera et al., 2009), around 3.5% in peach (Pérez-Clemente et
al., 2004), 2% in leucaena (Jube and Borthakur, 2009) and less than 1% in cacao (Maximova et al.,
2003) and coffee (Etienne et al., 2008).
It has frequently been reported that the choice of explants capable of transformation and
regeneration is a crucial factor (Giri et al., 2004). Somatic embryogenesis is definitely an
advantageous support for genetic transformation, because it potentially provides strong capacity for
the regeneration of transgenic material and appears to be the most promising approach for introducing
new genes into woody trees species. Embryogenic calli have been used as the target tissue for
transformation in many woody plants, such as pine (Leeve et al., 1999; Tereso et al., 2006; Trontin et
al., 2007), grapevine (Dhekney et al., 2008), rubber tree (Montoro et al., 2000), mango (Krishna and
Singh, 2007), avocado (Cruz-Hernandez et al., 1998), American chestnut (Andrade et al., 2009) and
coffee (Hatanaka et al., 1999; Leroy et al., 2000; Ribas et al., 2006a Albuquerque et al., 2009).
Nevertheless, the production of embryogenic tissues remains a difficult step in woody species as it is a
low-efficiency process, time consuming, with low reproducibility often greatly genotype-dependent.

Agrobacterium-mediated transformation of C. arabica
147
Moreover, the conditions for long-term proliferation of embryogenic tissues that enable their
maintenance and amplification have only been reported for very few species.
The decline or loss of embryogenic potential in plant tissue cultures is one of the major
problems encountered in genetic manipulation, making the production of fresh callus for each
transformation round time-consuming (Zhang et al., 2000; Sharma et al., 2005; Pniewski et al., 2006).
Maintaining embryogenic tissues over a long period can avoid the need for frequent in vitro
introductions that require a new, laborious and risky process for the selection of embryogenic tissues.
Thus, by determining the best conditions for maintaining the regenerative potential of embryogenic
tissues is extremely important with a view to using them in genetic transformation experiments. The
establishment and maintenance of embryogenic cultures depend on the subculture interval, medium
composition and tree species (Jain, 2006). The conditions for long-term proliferation of embryogenic
callus have been achieved in some species such as the rubber tree (Montoro et al., 1994), Eucalyptus
(Muralidharan and Mascarenhas, 1995), grape (Motoike et al., 2001), garlic (Hasegawa, 2002) and
turfgrass (Liu et al., 2009). In rubber trees, long-term embryogenic cultures have made it possible to
establish optimized genetic transformation conditions to study the function of genes involved in latex
production (Blanc et al., 2006; Montoro et al., 2008).
In coffee, genetic transformation has been achieved using several explants (leaves,
embryogenic callus, somatic embryos, protoplast, cell suspensions) and different approaches including
A. tumefaciens-mediated transformation (Hatanaka et al., 1999; Leroy et al., 2000; Ogita et al., 2004;
Ribas et al., 2006a), A. rhizogenes-mediated transformation (Alpizar et al., 2006; Kumar et al., 2006b),
biolistic gene delivery (Boxtel et al., 1995; Ribas et al., 2005) and electroporation-mediated gene
delivery (Fernandez and Medendez, 2003). The recovery of transgenic plants appears easier for the
Coffea canephora species than for C. arabica (reviewed by (Kumar et al., 2006a; Ribas et al., 2006b;
Etienne et al., 2008). The induction of embryogenic tissues in C. arabica is also longer and more
difficult than in C. canephora, for which only protocols for their maintenance have been established.
Transgenic plants of C. arabica were successfully produced using embryogenic calli (Ogita et
al., 2004; Ribas et al., 2006a; Albuquerque et al., 2009;) and nowadays this explant tends to be the one
most used. However the protocols available so far, mainly using A. tumefaciens, are not reproducible
and have revealed weak transformation efficiency, which greatly limits their potential use for routine
gene function validation. The first example of the introduction of genes of agronomic interest in
Arabica coffee was conducted by (Leroy et al., 2000). They regenerated transgenic coffee plants
carrying the CRY1-AC gene from Bacillus thuringiensis which is effective against coffee leaf miner.
The only work on functional validation by loss of function in Arabica coffee was developed by Ogita
et al. (2004) who obtained transgenic coffee plants with suppressed caffeine synthesis using RNA
interference (RNAi) technology through inhibition of a theobromine synthase gene (CaMXMT1).
Agrobacterium-mediated transformation of C. arabica
148
The objective of our work was to demonstrate that reliable genetic transformation for
functional genomics is achievable in a recalcitrant tree species such as C. arabica by establishing and
monitoring long-term embryogenic cultures. An efficient Agrobacterium-mediated transformation
protocol was set up by establishing co-cultivation conditions, the hormonal and salt balance of the
embryogenic callus proliferation medium, and by determining the optimum morphological and
histological characteristics and age of embryogenic calli used in transformation experiments. Finally,
the presence and integration of transgenes was verified by PCR and southern blot analysis in the
transgenic plants derived from transformed embryogenic cultures.
RESULTS
Explant and co-cultivation conditions
Different types of coffee tissues were tested under our transformation conditions; GFP
detection was performed 30 days after co-cultivation to attest stable transformation events (Table
IV.1). In this study, the detection of GFP activity was successfully applied to monitor the
transformation efficiency for all the studied parameters. No GFP activity was detected in zygotic
embryo fragments and a very low level was observed when using embryogenic cell suspensions. On
the other hand, maintained friable embryogenic callus cultures were revealed to be an excellent
support for genetic transformation, since significantly higher transformation efficiency (17%) was
obtained with 4-month-old proliferating embryogenic calli using the same co-cultivation conditions.
Using epifluorescence analysis, strong GFP activity was detected in embryogenic callus cultures 5 and
30 days after co-cultivation and in derived somatic embryos at all ontogenetic stages (Fig. IV.1).
Some other co-cultivation parameters that were demonstrated to be decisive in establishing an
efficient A. rhizogenes-mediated transformation protocol (Alpizar et al., 2006) were tested to set up
co-cultivation conditions with A. tumefaciens using specifically embryogenic callus cultures. Two
concentrations of bacteria suspension were first compared for their efficiency in enhancing genetic
transformation with embryogenic callus cultures (Table IV. 1). Using an undiluted A. tumefaciens
suspension exhibiting an OD600 between 0.6-0.7 proved to be slightly better than the diluted bacterial
solution (1/10). Similarly, we observed a weak increase in transformation efficiency by reducing the
co-cultivation temperature from 27°C to 20°C (Table IV.1). However, the lower temperature during
this period prevented bacterial overgrowth which made the decontamination process difficult and
could lead to callus necrosis.

Agrobacterium-mediated transformation of C. arabica
149
Table IV. 1 Effect of different co-cultivation factors on transformation efficiency
Co-cultivation factors Treatments Nb of co-
cultivated
explants
Nb
transformed
explants
Transformation
efficiency (%)
Explant type Zygotic embryo 88 0 0 ± 0
Cell suspension
(4 months)
192 4 0.02 ± 0.03
Embryogenic
callus culture
(4 months)
240 41 17 ± 0.02
Agrobacterium conc. (OD600) 1 (OD600 = 0.6) 80 10 12.5 ± 11.1
1/10 102 2 1.9 ± 4.1
Co-cultivation temperature (°C) 20 215 10 4.7 ± 4.3
27 350 2 0.6 ± 1.2
*The transformation efficiency was analyzed by the proportion (p) of transformed calli (p=x/n), where x was the
number of transformed calli and n the number of experiments. A 3 δ confidence limit for binomial distribution
was calculated using the formula p3√p(1-p/n) level of confidence 99%
Figure IV. 1 GFP fluorescence in embryogenic callus cultures transformed with A. tumefaciens and in derived
somatic embryos. Transient expression in embryogenic callus 5 days after co-cultivation, bar scale = 50 µM (A).
Stable expression in embryogenic callus culture 30 days after co-cultivation, bar scale = 50 µM (B). Stable
expression in globular and heart stage 6 months after co-cultivation, bar scale = 100 µM (C). Stable expression
in torpedo mature somatic embryos 7 months after co-cultivation, bar scale = 500 µM (D).

Agrobacterium-mediated transformation of C. arabica
150
Effect of the embryogenic culture proliferation medium composition on subsequent
transformation
The composition of the nutritive medium used for embryogenic callus proliferation prior to
genetic transformation can directly influence embryogenic callus physiological status, hence the
success of transformation. We therefore tested different salt concentrations and auxin:cytokinin ratios
for their effect on callus growth intensity - on which the availability of tissues suitable for
transformation depends - and transformation efficiency. Successful transformation was only obtained
with the diluted MS/2 and MS/4 salt concentrations (Table IV. 2). This later gave significantly higher
transformation efficiency, but embryogenic callus growth was greatly affected by this much diluted
salt concentration, as callus weight increase was 2 to 2.5 times less compared to the values obtained
with other salt concentrations. On the other hand, MS and 1.5 MS media rich in salts were not
appropriate for coffee transformation. The MS/2 salt concentration, which enabled efficient
embryogenic callus proliferation and subsequent efficient transformation, was the condition used for
the other transformation experiments. As regards the auxin:cytokinin ratio in the proliferation medium,
we first observed that 6-BA had a strong negative effect on genetic transformation, as very efficient
transformation was obtained without exogenous cytokinin (Fig. IV.2 A). It can be noted that 6-BA was
not necessary either to sustain embryogenic callus proliferation, as acceptable growth intensity over 3
sub-cultures was obtained without 6-BA. Similarly to cytokinin, the 2,4-D concentration had a weak
effect on embryogenic callus growth (IV.2 B). A relatively high auxin concentration (9 µM 2,4-D) in
the embryogenic callus proliferation medium led to the highest transformation efficiency, confirming
the positive effect of an auxinic environment on the pre-culture medium prior to coffee transformation.
Table IV. 2 Effect of different salts concentrations in the embryogenic callus culture proliferation medium on
callus growth and transformation efficiency.
Salts concentration in
the ECP proliferation
media
Callus growth during a
4 week sub-culture
(mg)
Nb of co-cultivated
calli
Transformation
efficiency
(%)
MS/4 103 ± 20.7 b* 87 15.6 ± 6.6**
MS/2 267 ± 24.1 a 160 10.5 ± 14.1
MS 254 ± 60.5 a 100 0 ± 0
1.5MS 217 ± 53.6 a 160 0 ± 0
* Callus growth was measured by the difference between the final and initial weight of embryogenic cultures after a 4-week
proliferation cycle. The initial weight was calibrated at 120 ± 10 mg. Each data corresponds to a mean ± SD from 4
measurements. We performed an ANOVA followed by the Tukey HSD test to determine the significant differences between
the means of all treatments. Values with different letters are significantly different at P≤0.05. ** The transformation
efficiency was analyzed by the proportion (p) of transformed calli (p=x/n), where x was the number of transformed calli and
n the number of experiments. A 3 δ confidence limit for binomial distribution was calculated using the formula p3√p(1-p/n)
level of confidence 99%. Each value is the mean from 4 replicates.

Agrobacterium-mediated transformation of C. arabica
151
Figure IV. 2 Effect of 6-BA and 2,4-D concentrations in the proliferation medium on growth intensity and
transformation efficiency of coffee embryogenic callus cultures. All the 6-BA concentrations were tested in the
presence of 4.52 µM 2,4-D and all the 2,4-D concentrations were tested in the presence of 12 µM 6-BA. Callus
growth was measured by the difference between the final and initial weight of embryogenic cultures after a
4-week proliferation cycle. The initial weight was calibrated at 120 ± 10 mg. Each data corresponds to a mean ±
SD from 4 measurements. We performed an ANOVA followed by the Tukey HSD test to determine the
significant differences between the means of all treatments. Values with different letters are significantly
different at P≤0.05. Transformation efficiency was assessed by observing GFP epifluorescence 6 weeks after the
end of co-cultivation. The transformation efficiency was analyzed by the proportion (p) of transformed calli
(p=x/n), where x was the number of transformed calli and n the number of experiments. A 3 δ confidence limit
for binomial distribution was calculated using the formula p3√p(1-p/n) level of confidence 99%. All the
transformation experiments were conducted independently in four replicates containing each 60 calli (240 calli/
hormonal combination).
0
50
100
150
200
250
300
350
400
450
0
10
20
30
40
50
60
70
80
0 3.2 13 23 32
Callu
s grow
th (m
g)Tr
ansf
orm
atio
n e
ffic
ien
cy (
%)
BAP [µM]
Transformation efficiency
0
50
100
150
200
250
300
350
0
10
20
30
40
50
60
70
80
0 1.8 4.5 9 18
Callu
s grow
th (m
g)Tr
ansf
orm
atio
n e
ffic
ien
cy (
%)
2.4D [µM]
Transformation efficiency
b
A
B
a
ab
b
b
a a
a
a
a

Agrobacterium-mediated transformation of C. arabica
152
In spite of the overall success of coffee transformation, we noticed the persistence of strong
disparity for the same optimized conditions. Whereas for some jars almost all the callus produced
hygromycin-resistant calli, in others no resistant callus was observed. We suspected that the variability
observed in the transformation results came from the existence of an additional effect related to
heterogeneity within the embryogenic material. Careful observation of the embryogenic callus cultures
led us to distinguish between three callus phenotypes for the same culture conditions. All the
phenotypes were friable but some differences in colour and texture could be seen. These phenotypes,
called whitish, yellow and grey, are shown in Figs. IV. 3A, B, C. The grey one is more compact when
compared to the yellow and the whitish corresponded to the most airy and fast-growing one. The
whitish phenotype was the most frequent (60-70%) whereas the yellow and grey ones represented 25-
35% and 5-10% of the population, respectively. Based on this observation, we started to separate the
calli into the three batches according to the phenotype and tested them for genetic transformation.
Figure IV.4 shows that no transformation event was observed using the grey callus phenotype and less
than 1% for the whitish one. On the other hand, very high transformation efficiency (75%) was
reached using the yellow friable calli, which was thus highly suitable material for coffee genetic
transformation. Histological studies revealed important differences between the three embryogenic
callus phenotypes (Fig. IV.3). The whitish phenotype (Fig. IV. 3 A) displayed a much loosened
structure comprising isolated embryogenic cells, along with small sized pro-embryos (always <10
cells) [Fig. IV.3 D]. A proembryo segmentation and degeneration process was observed,
corresponding to the initiation and rapid degeneration of somatic embryogenesis events. Cells
constituting this type of callus did not exhibit a dense cytoplasm (not those belonging to proembryos)
but had small starch grains and the visible mitosis stages suggested rapid divisions and growth (Fig.
IV. 3 G). The yellow callus (Fig. IV. 3B) corresponded to a highly homogeneous tissue mainly
comprising small cell aggregates similar to proembryogenic masses (PEMs) (Fig. IV. 3E). The cells
exhibited a high nucleus:cytoplasm ratio and exhibited a voluminous and central nucleus, numerous
small starch grains around the nucleus and a very dense cytoplasm rich in soluble and reserve proteins
(Fig. IV.3 H). The cell walls were variable in thickness as is typically observed for embryogenic cells
(Schwendiman et al., 1990; Verdeil et al., 2001). The grey phenotype (Fig. IV.3 C) was much more
heterogeneous and constituted of a mix of degenerating tissues along with active and intermediate
areas (Fig. IV.3 F). The cells were more vacuolated with a non-central nucleus, a small nucleolus and
less abundant but bigger starch grains (Fig. IV.3 I).

Agrobacterium-mediated transformation of C. arabica
153
Figure IV. 3 Morphological and histological aspect of the different callus phenotypes observed in maintained
embryogenic cultures assayed for coffee genetic transformation. Whitish type embryogenic callus: morphology,
scale bar = 2 mm (A) and histological aspect (D), (G). Note the very loosened structure of the callus and the
presence of proembryos (pe), isolated embryogenic cells (ec) along with abundant degenerating cells and
proembryos (arrow), scale bar = 73 µM (D); observe the segmentation and degenerating process of proembryos
(arrow) and the weakly dense cytoplasm of all cells, scale bar = 36.5 µM (G). Yellow type embryogenic callus:
morphology, scale bar = 2 mm (B) and histological aspect (E); embryogenic callus comprising small cell
aggregates similar to proembryogenic masses (PEMs); observe the strong homogeneity of the tissues, scale bar =
73 µM (E); note the high nucleus:cytoplasm ratio of all cells, the voluminous and central nucleus (n) and the
numerous small starch grains (s) around the nucleus; observe in all cells the very dense cytoplasm rich in soluble
and reserve proteins (blue staining), scale bar = 36.5 µM (H). Grey type embryogenic callus: morphology, scale
bar = 2 mm (C) and histological aspect (F), (I); note the heterogenous callus structure comprising a mix of
degenerating tissues (on the left) along with active (on the right) and intermediate areas, scale bar = 73 µM (F);
most of the cells are vacuolated with a non-central nucleus (n), a small nucleolus (nl) and less abundant but
bigger starch grains (s), scale bar = 30 µM (I).
All these observations are generally associated with degenerating tissues. Sub-culturing the
different types of calli separately showed that each phenotype was maintained over the sub-cultures
(data not shown). The stability of these embryogenic callus phenotypes offered an opportunity to
select the transformation-competent yellow phenotype and easily eliminate the undesirable ones

Agrobacterium-mediated transformation of C. arabica
154
during the proliferation process aimed at constituting stocks of highly competent embryogenic
material with a view to genetic transformation experiments.
Figure IV. 4 Transformation efficiency depending on the phenotype of maintained embryogenic callus cultures.
Transformation efficiency was assessed by observing GFP epifluorescence 6 weeks after the end of co-
cultivation. The transformation efficiency was analyzed by the proportion (p) of transformed calli (p=x/n), where
x was the number of transformed calli and n the number of experiments. A 3 δ confidence limit for binomial
distribution was calculated using the formula p3√p(1-p/n) level of confidence 99%. For each callus phenotype,
all the transformation experiments were conducted independently in three replicates containing 40 calli (120
calli/phenotype).
Effect of culture age on transformation efficiency
Long-term maintenance of competent yellow type embryogenic callus was achieved by sub-
culturing it every month on fresh gelled proliferation media. Embryogenic callus cultures with very
variable proliferation durations (i.e. age of the culture) were transformed with A. tumefaciens. Figure
IV.5 shows how the age of the embryogenic callus culture strongly affected transformation efficiency.
Surprisingly, the best transformation efficiency (almost 100%) was achieved by using embryogenic
callus cultures with at least 7 months of proliferation, and much lower transformation efficiency
(around 15%) was obtained with the primary embryogenic callus. Transformation efficiency gradually
0
20
40
60
80
100
Whitish Yellow Gray
Tran
sfo
rmat
ion
eff
icie
ncy
(%
)
Embryogenic callus culture phenotype

Agrobacterium-mediated transformation of C. arabica
155
increased in line with the age of the embryogenic culture, with a maximum for 7 and 9 months
maintained at a high level over a long period of time, since 70% efficiency was still obtained with 16-
month-old embryogenic cultures. Twenty-six-month-old embryogenic cultures had almost completely
lost their ability for genetic transformation.
Figure IV. 5 Effect of the embryogenic callus culture age on A. tumefaciens-mediated transformation efficiency
in C. arabica. Transformation efficiency was assayed 6 weeks after the end of co-cultivation by GFP
epifluorescence. The transformation efficiency was analyzed by the proportion (p) of transformed calli (p=x/n),
where x was the number of transformed calli and n the number of experiments. A 3 δ confidence limit for
binomial distribution was calculated using the formula p3√p(1-p/n) level of confidence 99%. All the
transformation experiments were conducted independently in five to six replicates containing each 40 calli for
each culture age (200 to 240 calli/culture age).
Histological studies revealed a change in the quality of embryogenic callus tissues depending
on the culture age without any changes at the nude eye (Fig. IV.6). While the most homogeneous and
active tissues were observed for 7 and 9-month-old embryogenic callus cultures that showed the
typical histological aspect of the yellow phenotype (Fig. IV.6 B), the histological appearance of the
primary embryogenic callus (no proliferation period) and old embryogenic callus cultures was very
different. Observation of primary embryogenic callus indicated a very heterogeneous structure (Fig.
IV.6 A) with coexisting degenerating and active areas. The cells exhibited a small nucleus and low
starch and cytoplasm soluble protein contents. On a histological level, the old embryogenic cultures
0
10
20
30
40
50
60
70
80
90
100
110
0 1 4 7 9 16 26
Tran
sfo
rmat
ion
eff
icie
ncy
(%
)
Embryogenic culture age (months)

Agrobacterium-mediated transformation of C. arabica
156
were much more heterogeneous than at 7 months and appeared as a mix of isolated cells, pro-embryos
and masses oriented towards somatic embryogenesis (Fig. IV.6 C). Other areas comprised cells with
protein-rich cytoplasm similar to those from younger embryogenic cultures.
Figure IV. 6. Histological aspect of coffee embryogenic callus cultures depending on the age of the culture.
Primary embryogenic callus produced on leaf explants; note the heterogeneous structure where degenerating
(arrow) and active areas co-exist; the cells are characterized by a small and non-central nucleus and low starch
and cytoplasm soluble protein contents, scale bar = 36.5 µM (A). Seven-month-old embryogenic callus culture;
observe the highly homogeneous structure mainly comprising proembryogenic masses (PEMs) whose cells
exhibit a high nucleus:cytoplasm ratio and dense cytoplasm rich in soluble and reserve proteins, scale bar = 73
µM (B). Twenty-six-month-old embryogenic callus culture; heterogeneous aspect of a mix of isolated cells,
proembryos, masses oriented towards somatic embryogenesis (arrow), along with areas of cells with protein rich
cytoplasm similar to those from younger embryogenic cultures, scale bar = 73 µM (C).
Transgenic coffee plant regeneration and molecular analysis
Transgenic plants were regenerated using 7-month-old embryogenic cultures with the yellow
phenotype, according to the optimum proliferation and co-culture conditions established in this work.
A total of 560 calli was co-cultivated. The transfer of embryogenic calli to hygromycin selection
medium enhanced rapid browning (Fig. IV.7 A), but two months later a lot of resistant yellowish calli
had grown on the surface of most of the necrotic calli (Fig. IV.7 B). After 4 months of hygromycin
selection, of the 560 co-cultivated calli a total of 462 produced independent yellow resistant calli
(transformation efficiency = 82.5%). All the non-transformed cultures (negative control) turned brown
and died during the hygromycin selection period and neither yellow calli nor embryo regeneration
could be observed. Each resistant callus line regenerated several putatively transformed somatic

Agrobacterium-mediated transformation of C. arabica
157
embryos on the hygromycin-enriched medium (Fig. IV.7 C). Almost all resistant torpedo-shaped
mature embryos germinated and developed whole plantlets (Figs. IV. 7D, E). Several thousand
putatively transformed plants were regenerated. Among them a hundred and twenty plants from sixty
independent transformation events (2 plants/transformation event), were chosen to be acclimatized in
the greenhouse for further molecular controls (Fig. IV.7 E).
PCR analysis was conducted to detect the HPTII hygromycin resistance gene from the DNA
of 60 putatively transformed plants derived from independent transformation events (1
plant/transformation event). Bands indicating the presence of the HPTII gene were systematically
detected in the analyzed plants (Fig. IV.8) indicating the high efficacy of hygromycin selection. No
band was observed in untransformed plants and in the blank negative control. Southern blot analysis
was performed to determine the copy number of the HPTII gene integrated into the coffee genome
(Fig. IV.9). Eleven plants from independent transformation events were analyzed. Five of them
presented one transgene insertion (event n° 2, 3, 9, 10, 11). The other ones presented multiple copy
insertion: two (n°5 and 7), four (n°6), 5 (n°8), 6 (n° 4) and 7 (n° 12).

Agrobacterium-mediated transformation of C. arabica
158
Figure IV. 7 Regeneration of transformed coffee plants from maintained embryogenic cultures. Calli in selective
media containing 100 mg.L-1
hygromycin and 125 mg.L-1
cefotaxime, 4 months after co-cultivation with A.
tumefaciens LBA1119 without plasmid, used as a control (A). Regeneration of resistant calli in selective media
containing 100 mg.L-1
hygromycin and 125 mg.L-1
cefotaxime, 4 months after co-cultivation with A. tumefaciens
LBA1119 carrying pMDC32; the yellow calli are resistant to hygromycin (B). Regeneration of torpedo-shaped
somatic embryos 6 months after co-cultivation (C). In vitro plantlet development 8 months after co-cultivation
(D). Acclimatization of transgenic plants in the greenhouse 12 months after co-cultivation (E).

Agrobacterium-mediated transformation of C. arabica
159
Figure IV. 8 PCR detection of the hygromycin gene in transgenic coffee plants. The plants were produced from
7-month-old embryogenic callus cultures co-cultivated with A. tumefaciens strain LBA1119 carrying out the
pMDC32 binary vector. M - Molecular weight DNA markers (1kb), C – untransformed coffee plant (control), 1–
19 transgenic coffee plants derived from independent transformation events , B – blank, PCR mix without DNA,
P – plasmid. Arrow indicate fragment correspond to hygromycin gene (506 bp).
Figure IV. 9 Southern blot analyses of transgenic coffee plants. Coffee DNA from leaf material was digested
with EcoRI, electrophoresed and probed with a 32
P labeled HTPII gene fragment. The number of bands reflects
the number of transgene insertions. Lane 1, untransformed coffee (control). Lanes 2-12, transgenic plants from
independent transformation events. P - plasmid control (pMDC32). The markers‘ sizes are indicated on the left.

Agrobacterium-mediated transformation of C. arabica
160
DISCUSSION
Over the last ten years, embryogenic callus directly produced by leaf explants has been the
most used tissue for Agrobacterium-mediated transformation in coffee (Etienne et al., 2008).
Nevertheless, as well as for other perennial crops, the availability of embryogenic tissues suitable for
genetic transformation remains one of the main bottlenecks for developing genetic transformation
strategies. In this work, we established for the first time the conditions for long-term proliferation of
embryogenic cultures in the C. arabica species and described a highly efficient and reliable
Agrobacterium-mediated transformation method based on the use of these embryogenic cultures.
Stable transformation was efficiently monitored using the GFP reporter gene. The fluorescent
marker GFP has the main advantage compared to other reporter genes that it enables non-invasive
detection of transformed cells without the introduction of co-factors or destruction of the biological
sample (Chalfie et al., 1994). Similarly, GFP visual selection was recently used as the sole marker to
detect transgenic calli lines of Hevea brasiliensis without antibiotic pressure (Leclercq et al., 2010).
Using long-term embryogenic callus cultures to transform Arabica coffee proved to be very efficient
and, under the best conditions, stable expression of the GFP gene was observed in up to 95% of the
tested calli. In previous work on coffee, transformation efficiency ranged from less than 0.1% for the
recalcitrant C. arabica (Leroy et al., 2000) to 33% for C. canephora (Canche-Moo et al., 2006). The
reliability of detecting GFP fluorescence to monitor transformation success in coffee was confirmed
by a large-scale trial aimed at regenerating fully-transformed plantlets using the hygromycin marker
gene with which similar transformation efficiencies (82.5%) were obtained. As previously reported
(Mishra et al., 2002; Ogita et al., 2004), our study showed that the 50-100 mg.l-1
hygromycin rate is
highly efficient in selecting transformed cells as no escapes were observed.
Parameters already known to affect coffee transformation were evaluated using long-term
embryogenic callus cultures as explants. In the majority of studies on A. tumefaciens-mediated
transformation in the C. arabica species, the co-culture temperature used was 25-26°C (Hatanaka et
al., 1999; Ogita et al., 2004). We demonstrated here that a reduction to 20°C increased transformation
efficiency. A cooler co-cultivation temperature (15-18°C) also increased the efficiency of A.
rhizogenes-mediated transformation in the same species (Alpizar et al., 2006). Fullner and Nester
(Fullner and Nester, 1996) showed that temperatures above 29°C affected Agrobacterium T-DNA
machinery transfer and tumour formation did not occur at this temperature and the best co-culture
temperature was around 22°C. The same authors (Fullner et al., 1996) showed that 19°C was the
optimum temperature for a pilus assembly and T-DNA transfer.
The positive effect on genetic transformation of reducing the strength of mineral salts in the
pre-culture medium is consistent with the literature. Although it has been largely demonstrated that
ions are involved in bacterial attachment to plants (Romantschuk, 1992), transformation has been
Agrobacterium-mediated transformation of C. arabica
161
successfully achieved in numerous species by using half-strength or more diluted salt solution media
or solutions specifically lacking certain salts such as CaCl2 in the pre-culture medium (Montoro et al.,
2000) or co-cultivation medium (Azadi et al., 2010; Cheng et al., 1997). The role of growth regulators
on transformation has also been reported.(Blanc et al., 2006) showed that simultaneously increasing
the auxin and cytokinin supply in the pre-culture medium prior to transformation stimulated the
development of active and fast growing cells, hence transformation efficiency. It has been shown
during long-term culture that cultures may lose the need for auxin and/or cytokinin to maintain active
growth. This process known as ‗habituation‘, which is common in callus cultures from some plant
species such as sugar beet (Van Geyt and Jacobs, 1985), was described as a shift from auxo- to
autotrophic state for growth regulator requirement (Meins and Foster, 1985). Coffee embryogenic
callus cultures effectively do not require auxin or cytokinin to proliferate, though it was possible to
stimulate it by optimum exogenous concentrations of both growth regulators. Similarly, genetic
transformation of long-term maintained embryogenic cultures was possible without auxin or cytokinin
supply. Our results specifically showed the very negative role of a cytokinin supply and the positive
role of auxins in acquiring transformation ability.
To establish long-term embryogenic callus cultures in coffee, active embryogenic tissues have
to be sub-cultured every 4 weeks on the proliferation medium. It is well accepted that a lack of regular
sub-cultures leads embryogenic calli to lose their embryogenic potential as a result of cell ageing. Sub-
cultures were also used to homogenize the culture by selecting recently formed active embryogenic
tissues. Sub-culturing every 14-21 days on a maintenance (i.e. proliferation) medium is an essential
step in establishing long-term cultures in many perennial crops such as mango (Ara et al., 2005), cacao
(Maximova et al., 2005), Pinus patula (Ford et al., 2005), P. taeda (Tang and Newton, 2005), Picea
mariana (Tremblay et al., 2005), P. radiate (Walters et al., 2005) and other forest trees (Jain, 2006).
The process of establishing coffee embryogenic cultures leads to the development and maintenance of
three morphologically different callus phenotypes with highly contrasting potentials for genetic
transformation. We demonstrated that the yellow type is an ideal material for transformation purposes
(almost 100% transformation efficiency) while the grey and white ones were totally recalcitrant.
Several morphological variants have also been observed during the proliferation and maintenance of
embryogenic calli from cotton (Wu et al., 2008). The authors showed that the transformation
efficiency of fine-grained yellow or light yellow embryogenic callus was much higher than the coarse-
grained grey or brown callus, although no histological or biochemical characterization was carried out
to explain such differences.
A priority of any team involved in developing a transformation procedure is to identify the
suitable target cell type. On a histological level, the yellow coffee callus with transformation ability
proved to merely consist of PEMs that were proliferating compact cell masses able to produce somatic
embryos and consisted of small, very dense cytoplasm embryogenic cells similar to those observed in

Agrobacterium-mediated transformation of C. arabica
162
the Dacus carota model (Ibaraki and Kurata, 2001; Pierik, 1997). Only observation of the yellow
phenotype guarantees the presence of such competent PEMs, hence successful transformation, insofar
as the maintained embryogenic cultures are not too old (< 1.5 years). In the case of primary
embryogenic callus and of old yellow callus embryogenic cultures, decrease of transformation
efficiencies was systematically accompanied by a marked reduction in the presence of PEMs.
Moreover, our study showed that the positive effect of an auxin balance on the embryogenic
callus transformation potential was also accompanied histologically by an increase in PEM presence
(data not shown). Taken together, these results indicate that PEMs are probably the competent tissue
for coffee genetic transformation. PEMs have been used previously for genetic transformation of other
woody species including Vitis vinifera (Mauro et al., 1995), V. rotundifolia (Dhekney et al., 2008) and
American chestnust (Andrade et al., 2009). It is interesting that, although embryogenic tissue is the
most used tissue for coffee transformation, relatively weak transformation efficiencies were obtained
with primary embryogenic callus directly regenerated on leaf explants. The histological heterogeneity
of coffee primary embryogenic calli was previously reported (Söndahl et al., 1979). Our work
confirmed the strong heterogeneity of this tissue but also revealed its low transformation-competent
PEM contents. Consequently, we recommend avoiding direct use of primary embryogenic callus for
transformation experiments and the completion of some proliferation cycles to allow the selection of
PEMs and consequently drastically increase transformation potential with a view to routine functional
analysis.
The reasons for the high genetic transformation ability of PEMs present in maintained coffee
embryogenic cultures could be morphological and/or epigenetic. The particular structure of this cell
type could favorably influence the Agrobacterium-mediated transformation process. For instance,
(Sangwan et al., 1992) showed in Arabidopsis thaliana that, irrespective of their origin, the competent
cells were small, isodiametric with thin primary cell walls, small vacuoles, prominent nuclei and dense
cytoplasm. Most of these characteristics correspond to those of coffee PEMs. The small size of PEMs
associated with their looser organization increases bacterial accessibility. In addition, the high
regenerative potential of this cell type is an indispensable quality for regenerating transgenic plants.
Furthermore, genetic and epigenetic changes occur during long-term cultures of rapidly dividing
dedifferentiated cells. Mechanisms such as changes in DNA methylation, reactivation of transposable
elements, histone modifications or siRNA biogenesis have been recently described (Tanurdznic et al.,
2008; Valledor et al., 2007). Hormone habituation and somaclonal variations in long-term
embryogenic cultures – which are two manifestations of epigenetic regulation (Meins and Foster,
1985; Valledor et al., 2007) – were reported in coffee in the present study and in an earlier one
(Etienne and Bertrand, 2003), respectively. It was shown that the auxin 2,4-dichlorophenoxyacetic
acid (2,4-D) maintains an undifferentiated state and habituation to in vitro proliferation through
increased DNA methylation (Causevic et al., 2005; Von Aderkas and Bonga, 2000). Our results

Agrobacterium-mediated transformation of C. arabica
163
highlighted that a high 2,4-D:6-BA ratio in the proliferation medium gave successful genetic
transformation. It could therefore be suggested that this stimulation may have resulted from DNA
hypermethylation.
CONCLUSIONS
Our work shows that obtaining and monitoring long-term maintained embryogenic cultures is
a reliable way of producing transformed plants in a recalcitrant woody species. The transformation
process set up in the present study undoubtedly benefited from the well-established regeneration
protocols developed for the commercial application of C. arabica somatic embryogenesis to the mass
distribution of elite heterozygous clones (Bertrand et al., 2010; Menéndez-Yuffá et al., 2010) and from
the profound knowledge of cell characteristics and cellular mechanisms involved in embryogenic
tissues and developing embryos. It is noteworthy in our study that most of the progress obtained in
increasing the transformation efficiency was achieved by optimizing the production conditions of the
embryogenic tissues used for transformation experiments much more significantly than with
conventional optimization of the physical co-cultivation conditions. The establishment of maintained
embryogenic cultures and optimization of their physiological status could be a valuable way of
establishing reliable transformation conditions in other recalcitrant woody species in view of high-
throughput functional analysis of genes.
METHODS
Plant material
All the studies were conducted using the genotype C. arabica var. Caturra. The leaf explants
were collected from trees maintained in a greenhouse located at IRD (Montpellier, France) and the
seeds came from Finca Santa Edwige (Alajuela, Costa Rica). The induction of embryogenic calli was
carried out as previously described (Etienne, 2005). Briefly, 1 cm2 pieces of young leaves from the
mother-tree were surface-sterilized and used as explants. Leaves were disinfected by immersion in
10% calcium hypochlorite solution containing 1% Tween 80 for 20 min followed by 8% calcium
hypochlorite solution for 10 min and rinsed 4 times with sterile water. The explants were cultured for
1 month on MS/2 (Murashige and Skoog, 1962) ‗C‘ callogenesis medium containing 2.26 μM 2,4-
dichlorophenoxyacetic acid (2,4-D), 4.92 μM indole-3-butyric acid (IBA) and 9.84 μM iso-

Agrobacterium-mediated transformation of C. arabica
164
pentenyladenine (iP). The explants were then transferred for 6-8 months to MS/2 ‗ECP‘ embryogenic
callus production medium containing 4.52 μM 2,4-D and 17.76 μM 6-benzylaminopurine (6-BA).
Yellow or whitish primary embryogenic callus appeared on the initial necrotic callus. Primary
embryogenic callus was induced in baby food jars at 27°C in the dark. All the media used in this work
were supplemented with 30 g/L sucrose and had the pH adjusted to 5.7 prior to the addition of 2.8 g/L
phytagel. The media were autoclaved at 120°C and 1.1 kg/cm2 for 20 min, and then 25 ml of medium
was dispensed into each 100 x 15 mm Petri dish or baby food jar.
Establishment of an embryogenic cell suspension
Primary embryogenic calli were transferred to 250 ml Erlenmeyer flasks at a density of 1 g/L
in MS/2 ‗CP‘ liquid proliferation medium [78] with 4.52 μM 2.4-D and 4.65 μM kinetin, and shaken
at 100 rpm in the dark at 27°C. Cell suspension cultures of embryogenic aggregates were generally
established after 3 months under such conditions.
Zygotic embryo extraction
Sterilization was carried out by immersing the seed in 8% HClO bleach solution. The seeds
were stirred for 5 min., then submitted to a vacuum for 20 min and stirred again for 5 min. They were
finally rinsed 3 times in sterile water, and soaked in Petri dishes containing sterile water (2 cm deep)
placed in the dark at 27°C. Under these conditions, the seeds were totally imbibed after 48-72h. The
embryos were extracted after removing the endosperm and directly placed under co-cultivation
conditions after injury with a scalpel blade.
Establishment of maintained embryogenic callus cultures
Long-term embryogenic cultures were successfully established using the primary embryogenic
callus and by the monthly transfer of yellowish fragments collected from the upper part of
embryogenic calli to fresh semi-solid ‗ECP‘ MS/2 embryogenic callus production medium [78] with
4.5µM 2.4D and 12µM 6-BA solidified with 2.8 g/L phytagel. The cultures were placed in baby food
jars at 27°C in the dark. To optimize the proliferation conditions, the following modifications to the
ECP medium were compared by assessing the subsequent callus growth and transformation efficiency
after 3 sub-cultures: auxin concentration (0, 1.8, 4.5, 9 and 18 µM 2.4D), cytokinin concentration (0,

Agrobacterium-mediated transformation of C. arabica
165
3, 13, 23 and 32 µM 6-BA) and Macro and Microelement salt concentration (MS/4, MS/2, MS,
1.5MS). Moreover, in order to evaluate the importance of callus morphology and culture ageing,
different embryogenic callus phenotypes observed under the same culture conditions [yellow, whitish
and grey (Fig. IV.1)] and embryogenic cultures of different ages (primary embryogenic callus or 1, 4,
7, 9, 16 and 26-month-old embryogenic callus cultures exhibiting the same yellow phenotype) were
compared for subsequent transformation efficiency.
Agrobacterium strain and binary vector
The disarmed strain of A. tumefaciens LBA1119 carrying a binary vector (pBIN35SGFP)
containing the reporter gene GFP5 coding for green fluorescent protein under control of the
constitutive cauliflower mosaic virus (CaMV) 35S promoter was used for all experiments aimed at
establishing a transformation protocol. The LBA1119 strain carrying the binary vector pMDC32
(Curtis and Grossniklaus, 2003) containing the HPTII gene conferring hygromycin resistance was
used to regenerate transgenic plants and validate the transformation protocol using the same culture
conditions.
Co-cultivation and decontamination
Coffee explants were maintained in their culture container, i.e. baby food jars, and immersed
in 10 ml of A. tumefaciens suspension (OD600=0.6) for 10 min without shaking. The suspension was
removed and the inoculated explants were co-cultivated at 27 or 20°C for 5 days in the dark. After this
period, the explants were rinsed twice with 20 ml sterile water, and then 20 ml of ECP medium
containing 1.2 g/L cefotaxime was added to each jar. The cultures were placed on a rotary shaker at 30
rpm for 3 hours. After that time, the liquid was removed and the calli rinsed with ECP medium for 15
min. The liquid was removed and the explants were blotted on dry filter paper to remove excess
bacterial solution. They were subsequently placed in Petri dishes containing ECP medium with 500
mg/L cefotaxime. From each jar, 4 Petri dishes were made up containing 20 explants each. The
cultures were placed in the dark for 4 weeks at 27°C and then observed to assess GFP reporter gene
activity. To optimize the co-cultivation conditions, different explants (zygotic embryo fragments, 4-
month-old embryogenic cell suspensions and 4-month-old embryogenic callus cultures),
Agrobacterium suspension concentrations (undiluted OD600=0.6) or diluted to 1/10 by adding ‗ECP‘
medium) and temperatures (20 and 27°C) were compared by assessing subsequent transformation
efficiency. The last two parameters were tested on four-month-old embryogenic callus cultures.

Agrobacterium-mediated transformation of C. arabica
166
Evaluation of transformation efficiency by GFP visualization
All the tissues tested for genetic transformation were used to evaluate stable expression of
GFP 30 days after Agrobacterium inoculation. Plants were screened for GFP expression using a Fluo
III fluorescence microscope (Leica) with GFP1 (excitation filter 425 nm; emission filter 480 nm),
GFP2 filters (excitation 480 nm; emission 510 nm) and under green fluorescence (excitation filter 546
nm; emission filter 590 nm). The autofluorescence from chlorophyll was blocked using a red
interference filter. Transformation efficiency was calculated as the proportion (p) of transformed
explants (p=x/n), where x was the number of transformed explants exhibiting GFP and n the number
of experiments.
Histological observations
The samples were fixed for 24 h in a solution containing 1% glutaraldehyde, 2%
paraformaldehyde and 1% caffeine in a 0.2 mM phosphate buffer at pH 7.2. After this, they were
dehydrated in a graded series of ethanol, embedded in a 7100 resin (LKB) and cut into 3 µm
longitudinal sections. The sections were double-stained with PAS (periodic acid-Schiff)-NBB
(naphthol blue black). PAS specifically stains polysaccharides red (walls and starch) and NBB stains
soluble and insoluble proteins blue (Fisher, 1968; Buffard-Morel et al., 1992). Sections were observed
by conventional light microscopy through a DM600 Leica microscope and photographed. Two
magnification lenses were used: Lens 109 Numerical aperture = 0.30 HC PL Fluotar (Ref. Leica
11506505) and Lens 209 Numerical aperture = 0.70 HC Plan APO (Ref. Leica 1506166). Pictures
were taken with a Retiga 2000R camera (GImaging Co.).
Regeneration of transgenic plants
The best culture conditions were applied in a large-scale experiment to transform 560 calli
from 7-month-old embryogenic cultures using the LBA1119 strain carrying the binary vector
pMDC32. After decontamination, the cultures were subcultured every 4 weeks twice on ‗R‘
regeneration medium (Etienne, 2005) containing 17.76 μM 6-BA and 50 mg/L hygromycin and
decreasing cefotaxime concentrations (250, 125 µg.ml-1
) and twice on ‗M‘ maturation medium
containing 1.35 μM 6-BA, 100 mg/L hygromicin and 125 mg/L cefotaxime. The other subcultures
were carried out on ‗M‘ maturation medium containing 1.35 μM 6-BA devoid of cefotaxime and
hygromicin until plantlet development. Several plants regenerated from each resistant callus. Ten
months after co-cultivation, the plantlets were acclimatized in the greenhouse. During the entire

Agrobacterium-mediated transformation of C. arabica
167
regeneration process, the cultures were maintained under a 14 h photoperiod (20 µmol.m-2
s-1
light
intensity) at 26°C until acclimatization.
PCR and Southern blot analysis of transgenic plants
Sixty putatively transformed greenhouse plants derived from independent transformation
events (1 plant taken at random/transformation event) and produced in the large-scale experiment were
subjected to PCR analysis to detect the presence of the hygromycin resistance gene. The leaves were
frozen in liquid nitrogen and DNA extraction was carried out with a CTAB procedure (Doyle and
Doyle, 1987) with modified extraction buffer (2% CTAB, 1.4mM NaCl, 100mM Tris HCl, 20mM
EDTA pH 0.8). The primers used for amplification of a fragment of HPTII gene from the pMDC32
vector were: 5‘-GCCTGAACTCACCGCGACGTC-3‘ and 5‘-GCACTGACGGTGTCGTCCAT-3‘
(fragment size 506 bp). PCR was carried out in a 25 µl volume containing 50 ng of leaf genomic
DNA, 1U Taq DNA polymerase, 1X buffer (Promega, Madison USA), 0.2 mM each dNTP, 2mM
MgCl2, 0.2 µM each primer. Amplification was performed in thermal cycler GeneAmp® PCR system
9700, Applied Biosystem) in the following reaction: 1 cycle of 2min 95°C, followed by 30 cycles 1
min at 95°C, 1 min 55°C, 1 min 72°C and 4 min 72°C of final extension. The reaction products were
electrophoresed in 1% (w/v) agarose gels and visualized by staining with ethidium bromide.
Among the PCR-positive plants, 11 derived from independent transformation events were chosen to
perform Southern blot analysis to determine the number of transgenes integrated into the genome.
Briefly, 20 µg of genomic DNA was digested with the restriction endonuclease EcoRI. DNA fragment
separation by electrophoresis, transfer to nylon membrane, radioactive probe labeling and
hybridization were performed as previously reported (Noir et al., 2004).
Data processing
Transformation efficiency was calculated as the proportion (p) of transformed explants
(p=x/n), where x was the number of transformed explants exhibiting GFP and n the number of
experiments. A 3 δ confidence limit for binomial distribution was calculated using the formula p ±
3p(1-p/n) level of confidence 99%. All the transformation experiments were conducted
independently in three or four replicates. Callus growth was measured by the difference between the
final and initial weight of embryogenic cultures after a 4-week proliferation cycle. The initial weight
was calibrated at 120 ± 10 mg. Each data corresponds to a mean ± SD from 4 measurements. We
performed an ANOVA followed by the Tukey HSD test to determine the significant differences
between the means of all treatments.

168
CHAPTER V
IDENTIFICATION AND FUNCTIONAL VALIDATION OF CANDIDATE
GENES TO COFFEE LEAF RUST RESISTANCE (CLR)
This chapter is subdivised in three parts. In part I, it describes the approaches used for estimation of
the number of candidate genes (CG) to CLR resistance in the resistant cultivar. The part II, presents
the strategy used for cloning the candidate genes while the developed procedure for functional
validation of the CG in transgenic coffee plants are described Part III.

Identification of candidate genes
169
Identification and functional validation of candidate genes to
CLR
INTRODUCTION
The SH3 resistance factor against the coffee leaf rust (CLR)(Hemileia vastatrix) was originally
identified into C. liberica species (2n=2x=22) (Wagner & Bettencourt, 1965). A natural coffee hybrid
between C. arabica and C. liberica discovered in India (called S.26) (Vishveshwara, 1974;
Sreenivasan et al., 1993) and carrying the SH3 resistance factor has been used in C. arabica
(2n=4x=44) breeding programs in India as main source of rust resistance.
The segregation analysis of an F2 population derived from a cross between a susceptible and a
liberica-introgressed accession was essayed against three different races of H. vastatrix. The analysis
revealed that the SH3 gene segregated at 3:1 ratio, as expected for a single dominant gene (Prakash et
al., 2004). The liberica introgressed-fragment carrying the SH3 resistance gene wass localized in a
distal position in the C. arabica chromosome 1 (Herrera et al., 2007). Several molecular markers were
found linked to the resistance (Chapter II).
Sequence-characterized amplified region (SCAR) markers associated with SH3 gene were
developed (Mahé et al., 2008) and used to screen a bacterial artificial chromosome (BAC) library from
C. arabica cv. IAPAR 59 (Noir et al., 2004) to generate a physical map of SH3 locus (Chapter II).
Although C. arabica cv. IAPAR 59 is resistant to coffee leaf rust, this cultivar does not have SH3
resistant factor but contains other unidentified resistance gene(s). Several BAC clones of this region
were identified. The analysis of BAC sequences revealed eight members of a putative R gene family
that are present in two homoelogous loci and are distributed in two regions (hereafter indicated as A
and B) separated by more than 160 kb. The subgenome Ea has 3 copies in region A and 2 copies in
region B whereas subgenome Ca contains 2 copies in region A and 1 copy in region B. The identified
R gene family belongs to the CNL subclass (hereafter SH3-CNL family) (Chapter III). No other
putative R genes were detected in the SH3 region.
A ‗Candidate gene approach‘ was used to try cloning the SH3 genes from the C. arabica S.795
accession (derivate of S.26 hybrid) containing the C. liberica introgression.

Identification of candidate genes
170
PART I.
Estimate of SH3-CNL gene members in the resistant cultivar
The first question to be answered was how many members of the SH3-CNL family exist in the SH3
introgressed region of C. arabica S.795 resistant accession? Two approaches were essayed: Southern
blot and sequence analysis.
a) Estimate of the number of the SH3-CNL members by Southern blot analysis
This approach is based on the comparative analysis of SH3-CNL specific hybridization patterns of
introgressed and non introgressed accessions.
Material and Methods
Total DNA from the introgressed accession (S.795) and from two non introgressed cultivars
(IAPAR 59 and Bourbon) was isolated from leaves using a CTAB procedure (Doyle and Doyle 1990)
with modified extraction buffer (4% CTAB, 1.4mM NaCl, 100mM Tris HCl, 20mM EDTA pH 0.8).
Genomic DNA was digested with DraI, EcoRI or BamHI restriction enzymes. The restriction
fragments were separated by electrophoresis and transferred on to Hybond-N+ (Amersham
Biosciences) nylon membranes for Southern hybridizations. SH3-CNL family specific probe was
generated by PCR amplification using primers designed on the NBS domain (left primer: 5‘-
CGGTCTCGGTAAGACCACTC-3‘and right primer 5‘-CCTCTGCAAATGGAAATGCT-3‘). The
obtained 516 bp fragment was labeled with 32
P-ATP and used as probe with hybridization stringent
conditions (Sambrok et al., 1989).
Result and Discussion
The expected sizes of the eight restriction fragments containing the probe target on IAPAR-59 was
determined by an in silico restriction analysis with DraI, EcoRI or BamHI on the BAC sequences
containing the SH3-CNL members table V.1. Except one of all expected fragments were identified on
the respective hybridization patterns; due to the size, the BamHI restriction fragment corresponding to

Identification of candidate genes
171
the B_Ca member (51622 bp) comigrated with the high molecular weight fragments and was not
detectable. None additional band was detected in the hybridization patterns of IAPAR-59, suggesting
that this family is exclusively present at the SH3 locus in this cultivar. This result is consistent with
previous data obtained by BAC filter hybridization using the SH3-CNL family specific probe. In this
experiment all positive BAC clones from the IAPAR BAC library appeared to belong to the SH3
region.
Table V. 1 In silico restriction analysis on the BAC sequences containing the SH3-CNL members
SH3-CNL members
DraI BamHI EcoRI
Fragment size (bp)
A1_Ea
4800 3836 1840
A2_Ea
3927 5685 3821
A3_Ea
3686 7044 3109
B1_Ea
5576 5491 4899
B2_Ea 6287 8815 3901
A1_Ca
4804 3815 3013
A2_Ca
3753 5387 4214
B_Ca 5070 51622 5270
The comparative analysis of the hybridization patterns of the introgressed and non introgressed
cultivar showed that the three IAPAR59 restriction fragments containing the Ca copies of the R gene
family (blue arrows in figure V.1) were lacking in the introgressed accession and at least four
additional fragments were present in the S.795 (red arrows). These observations confirmed that the C.
liberica introgression replaced the homoeologous Ca region of C. arabica as previously suggested
(Chapter 2). In the EcoRI restriction pattern five additional bands were observed in the S.795
hybridization pattern (Figure V.1). To date it is not possible establish if this observation is the result of
a restriction site internal to the target sequence or it is an additional member of the SH3-CNL family.
To a better comprehension of the southern hybridization interpretation a schematic representation
of the patterns obtained with EcoRI enzyme is proposed in figure V.2. In this schema the fragments
corresponding to the sub genome Ea are represented in black while the sub genome C
a and the
introgression from C. liberica are shown as blue and red fragments, respectively. The Ea+C
a and E
a+L
represent the hybridization of IAPAR-59 and S.795 cultivar, respectively.

Identification of candidate genes
172
Figure V. 1 Southern blot patterns of C. arabica cultivars hybridized with SH3-CNL specific probe. Total DNA
was digested with EcoRI DraI and BamHI. Lane 1: S.795 (a liberica-introgressed accession that contains the SH3
resistance factors), lane 2 and 3: IAPAR 59 and Bourbon, respectively (non-introgressed accessions). The blue
arrows indicate the restriction fragments of non introgressed accessions missing in the S.795 accession; the red
arrows indicate the restriction fragments originating from the C. liberica introgression the S.795 accession.
The copy number estimation based on southern hybridization has some limitations. First, the
detection of additional bands into hybridization patterns obtained with given restriction enzyme could
be complicated by superposition of different hybridization signals of fragments with very similar sizes,
as observed for the IAPAR59 patterns, where co migrating fragments produced bands with stronger
hybridization signal (e.g., in figure V.1, the DraI pattern, A1_Ca was not separated from A1_E
a, as
well as A2_Ca co-migrate with A3_E
a). Second, the hybridization signal of restriction fragments with
very large size could not be separated from the load of high molecular weight fragments; For instance,
in the BamHI hybridization pattern, the fragment corresponding to the B_Ca member (51622 bp) was
not distinguishable (Figure V.1). Finally, partial gene duplication or gene remnants containing the
probe target could be accounted as member of this family.
The additional hybridization bands observed in the pattern of the S.795 introgressed cultivar (red
arrows in figure V.1) are thought to represent putative candidate genes for the SH3 resistance factor.

Identification of candidate genes
173
To a better comprehension of the southern hybridization interpretation a schematic representation
of the patterns obtained with EcoRI enzyme is proposed in figure V.2. In this schema the fragments
corresponding to the sub genome Ea are represented in black while the sub genome C
a and the
introgression from C. liberica are shown as blue and red fragments, respectively. The Ea+C
a and E
a+L
represent the hybridization of IAPAR-59 and S.795 cultivar, respectively.
Figure V. 2 Schematic representation of hybridization pattern obtained with EcoRI in non-introgressed and
introgressed acession of C. arabica. The fragment sizes are on the left. The black and blue and bands correspond
to the hybridization fragments of non introgressed accessions assigned to the Ea and C
a sub genomes,
respectively. The red bands correspond to the C. liberica introgressed fragment on the S.795 accession.
b) Estimate of the number of the SH3-CNL members by sequence analysis
This approach is based on the discrimination of the SH3-CNL family members by sequence
polymorphism, i.e. single nucleotide polymorphism (SNP) and insertion/deletion (INDEL). Since
introns are expected to accumulate more mutations than coding regions (which are subject to natural
purifying selection), their sequences should have more useful polymorphism to discriminate the
different copies of the SH3-CNL family in S.795 cultivar. Consequently, based on the SH3-CNL
member sequences, primers were designed on exon 1 and 2 to allow the amplification of a region
containing the intron of each known SH3-CNL member.

Identification of candidate genes
174
Material and Methods
A pair of primers was designed to amplify a gene portion containing the intron of the SH3-
CNL family members, Left: 5‘- GAGACCTTCTGAAGCAGCTTGT-3‘ and right 5‘-
ACTCAGAGCCAACACCTGCAAC-3‘. In order to minimize the false polymorphism introduced by
polymerase error, DNA amplification was performed with High fidelity Platinum kit (Invitrogen
Carlsbad, CA). The mixes were put together and amplified using Biorad Thermal cycler. PCR
conditions was as follow: 94°C 4 min followed by 30 cycles of 1 min 94°C, 1 min 55°C, 4 min 68°C
and final extension of 7 min 68°C. In order to verify the PCR result, a 10µl aliquot from each
amplification was analyzed by 1% agarose gel electrophoresis.
The PCR amplicons were cloned into pCR®2.1-TOPO
® kit from Invitrogen and inserted into
E. coli-TOP10 chemically competent cells according to the manufacturer‘s protocol. Plasmid DNA
was isolated using Promega Wizard® Plus Minipreps DNA purification System (Promega Corporation,
Madison, WI, USA) according to manufacture instruction. Three independent PCR and cloning were
carried out and 32 clones from each PCR were sequenced using M13-universal-reverse primers. The
experiment was repeated twice. A total of 192 clones were sequenced and analyzed using Staden and
Bioedit software (Hall, T.A. 1999).
Results and Discussion
Based on sequence polymorphisms (INDELs and SNPs), at least ten different SH3-CNL sequences
were identified in the introgressed accession (S.795). Five of them clearly correspond to the members
of the Ea sub genome. The other five sequences were considered originate from the C. liberica
introgressed region. Again, these results confirmed that the introgression of C. liberica fragment
replaced the homoeologous Ca region of C. arabica.
Furthermore, this approach could underestimate the SH3-CNL member number: in fact, PCR could
fail to amplify some SH3-CNL family member due to eventual sequence mutations that prevent the
primer annealing. On the other hand, the copy number could be overestimated due to the presence of
partial gene duplications or gene remnants containing the target for the primers.
Conclusion
Although, the two approaches described above have some limitation, both strategies provided
similar estimate number of SH3-CNL members present in liberica-introgressed region (4 or 5 copies).
Each one of these member is considered as potential candidate for the SH3 resistance gene.

Identification of candidate genes
175
PART II
Cloning SH3-CNL candidate genes to CLR resistance
The analysis of SH3 loci in both sub genomes of C. arabica and in the genome of C.
canephora species showed that the structure of the locus is conserved even if genome-specific
insertion/deletion events have been evidenced (Chapter III). Using the same hypothesis that the
structure of the SH3 locus is also conserved in the introgressed segment from C. liberica and that an
orthologous copy exists for each identified member, a strategy based on cloning PCR amplified copies
was implemented in order to isolate all the members of the SH3-CNL family.
Material and Methods
Specific primers of each member present in sub genome Ea from C. arabica cv. IAPAR-59
were designed based on the flanking region (Table V.2). These primers were tested for amplification
in C. arabica S.795 CLR resistant cultivar.
Table V. 2 Primers sequence designed to amplify candidate genes against to coffee leaf rust.
SH3_R gene LEFT PRIMER RIGHT PRIMER
A1 AATATTCTGAACATGTGGTTTAGGCACTCT TATATTCTATGATCGGCTGGTTCAAAACAT
A2 CCTTGATAAGAAACATGATGAAATACACGA GTCCGAGTCATCAAGAAGAGTAAATAGGAA
A3 TCTGAAATTATCCCTTGTTATTTTGACTGC GAAAATTTGAGCATTATTGAACACAGTGAG
B1 CAGCAAAGGAACATATGCCATTTGAAAG GATCTGTTGAAGATTCCCTGCACCATAA
B2 TCTGTATGTTCCCCCAATTGAGCATTTA GTCGACAAGTATGCCCTGAAAGAGTCTG
DNA amplification was essayed with three different polymerase enzymes: ExpandTM
20Kbplus
PCR System (Roche Applied Science, Mannheim Germany), High fidelity Platinum Taq (Invitrogen)
and Gold Star (Eurogentec). When using the ExpandTM
20Kbplus
PCR System, PCR were performed as
follows: one cycle of 1 min at 95°C, 10 cycles of 10 sec at 94°C, 45 sec at 50°C, 5 min at 68°C
followed by 20 cycles of 10 sec at 94°C, 45 sec at 50°C, 7min at 68°C plus 10 sec per cycle, and final
extension of 7 min at 68°C. For Platinum Taq (Invitrogen) and Gold Star (Eurogentec), PCR were

Identification of candidate genes
176
performed as follows: 4 min at 94°C, 35 cycles of 30 sec at 94°C, 30 sec at 55°C, 5 min at 68°C and
final extension of 7 min at 68°C.
The amplicons were gel-stained using Crystal violet and the DNA bands were purified using a
S. N. A. P™ purification column (Invitrogen Carlsbad, CA). The PCR products were cloned into
pCR®-XL-TOPO
® kit from Invitrogen and chemically competent cells (Invitrogen Carlsbad, CA)
according to the manufacturer‘s protocol. Eight colonies were randomly selected for screening. PCR
reactions of eight randomly chosen colonies were used to select bacterial clones containing the
complete amplicon.
The colony PCR was performed as follows: 10 min at 94°C, followed by 30 cycles of 30 sec at
94°C, 30 sec at 55°C, 4 min at 72°C and final extension of 10 min at 72°C. The colonies that had been
confirmed to contain the complete insert were transferred onto 5 ml Luria broth media with 50 µg/ml
kanamycin and incubated at 37°C overnight. Plasmid DNA was isolated using Promega Wizard® Plus
Minipreps DNA purification System (Promega Corporation, Madison, WI, USA) according to
manufacturer instruction. Two independent PCRs and sequencing were carried out to verify the
reproducibility of the information.
Plasmid DNA was sequenced at Genome Express (Grenoble, France) using M13-universal-
forward and reverse primers and other five internal primers were designed using the Primer3 program
(Whitehead Institute, USA) to allow whole gene sequence (Table V.3).
The cloned sequences were assembled using Staden package (Staden, 1996). The complete
clone sequences were aligned using Bioedit v.7.0 (Hall, T.A. 1999) and compared with those of C.
arabica IAPAR-59.
Table V. 3 Internal primers used for complete sequencing of SH3_CNL members
Results and Discussion
All SH3-CNL members specific PCRs on C. arabica accession S.795 as template produced
amplicons sizing around 4000 bp. Among the clones obtained with specific primers for A1, B1 and B2
INTERNAL
PRIMERS
SH3_CNL Members
A1 A2 A3 B1 B2
INT1 TGCGACGATTGTTGAAAGAC TCCATCGTCCAAGATACAGC CGAGGAATCAACAGCCTCAC TCCATCGTCCAAGATACAGC TCCATCGTCCAAGATACAGC
INT2 CCCAACAGTGCAATACGATG TTTGTTGGGATGGAAGATGA GAGGATGAAGGCTGGGAGTT TTTGTTGGGATGGAAGATGA TTTGTTGGGATGGAAGATGA
INT3 GTTGGCAAGTGTGGAAACCT GCTGGGAGTTGCTTCAAAAG TCGAATGTGGACAGCAGAAG
GCTGGGAGTTGCTTCAAAAG GCTGGGAGTTGCTTCAAAAG
INT4 AAGTGGTGGCTGTGGATTTC TCGAATGTGGACAGCAGAAG CCGATTAAGGTGCCTGATGT
TCGAATGTGGACAGCAGAAG TCGAATGTGGACAGCAGAAG
INT5 CCATAATCGGGGGAAGGTAT GCCTTGGAGACACTTCCATC CCAAAGAATTCATGGGATCG
GCCTTGGAGACACTTCCATC GCCTTGGAGACACTTCCATC

Identification of candidate genes
177
members, only the sequences of members belonging to the Ea subgenome were obtained. On the other
hand, clones obtained with specific primers for A2 and A3 members contained two different types of
sequence, from which, one was identical to the corresponding one on the Ea subgenome and the other
was different from all known SH3-CNL sequences. As expected, the sequences of the two new SH3-
CNL members corresponded to two of the five sequences obtained with the sequencing approach for
the estimation of the number SH3-CNL introgressed members (Table V.4). The sequence of the A3
member showed an interrupted open read frame (ORF) that prevent a full size translation and was
considered as a pseudogene. On the contrary, the A2 member exhibits a conserved ORF and,
consequently, represents of candidate for SH3 resistance gene.
As aforementioned, we estimate that at least 4-5 of SH3-CNL members have been introgressed
into S.795. However, only two introgressed genes (corresponding to the A2 and A3 members) were
amplified using this approach. The most probable explanation is that the member specific primers
failed to anneal in the introgressed region. In fact, to ensure their specificity, the primers where
designed on regions quite distant from the coding region. These regions are not expected to be under
purifying selection and it is probable that they have undergone mutations that prevent the primer
annealing.
Table V.4. Result of amplification of SH3 members from C. arabica S.795 acession.
Gene Type of
sequence
OBS Candidate gene
A1_Ea
1 Identical to Ea (non introgressed)
A2_Ea
2 2 clones fully sequenced from liberica introgression ORF conserved candidate
A3_Ea 2 2 clones fully sequenced from liberica introgression ORF interrupted no candidate
B1_Ea 1 Identical to E
a (non introgressed)
B_Ea 1 Identical to E
a (non introgressed)
Conclusion
Only two genes from the 4-5 estimated introgressed SH3-CNL members into C. arabica were
cloned using the methodology employed. The A3 member is a pseudogene but the A2 member has
conserved ORF and was considered a candidate gene.

Identification of candidate genes
178
PART III
Construction of expression vectors and functional gene
validation
Two sequences were cloned using A2 specific primers. One of them was identical to E
a_A2 from
IAPAR-59; the other was different from all the known C. arabica sequences and was therefore
considered as introgressed from C. liberica. This SH3-CNL copy has a conserved ORF and
consequently represents a candidate gene for the SH3 resistance. A complementation test was
performed to verify the ability of this gene to induce SH3 resistance. The C. arabica cultivar Caturra is
susceptible to race II of H. vastatrix for which SH3 gene is effective; for this reason the Caturra
cultivar was used for coffee transformation experiments.
Material and Methods
a) Construction of expression vectors
We used the gateway technology to obtain expression clones containing the candidate gene
(CG) A2 that was cloned from S.795 cultivar. The gateway system is considered as a universal cloning
method that takes advantage of the site-specific recombination properties of bacteriophage lambda to
provide rapid and highly efficient way to move the gene of interest into multiple vector system (Curtis
and Grossniklaus, 2003).
As the first step into directional cloning, we amplify the CG adding a TAG (CACC) in the 5‘
primer and the fragment was cloned into pENTR/D-TOPO (Invitrogen). Two different reverse primers
were designed with or without stop codon. The amplification of the CG gene without stop codon was
generated to allow fusion with GFP gene. Once flanked by attL recombination site, the sequence was
recombined with attR sites using LR clonase mix (enzymes from lambda bacteriophage - Integrase
(Int), Excisionase (Xis) and the host integration factor (IHF) from E. coli producing the expression
clone (Figure V.3).

Identification of candidate genes
179
Figure V. 3 Construction of binary vectors used for plant transformation carrying out candidate R genes against
CLR.
The vectors of pMDC series were used as expression clones (Curtis and Grossniklaus, 2003).
Theses vectors have double 35S promoter and a gene for hygromycin selection in planta. The pMDC
series of binary vectors are freely available for non commercial research (Curtis and Grossniklaus,
2003). Three different vectors were used. The pMDC43 and pMDC83 allow the fusion of the interest
gene with Green fluorescent protein (gfp6) gene at C or N-terminal and are used to localize the interest
protein, respectively. The pMDC32 vector has no gfp6 fusion (Figure V.4).
The pENTR clone containing the CG was recombined with the pMDC vectors (i.e pMDC32,
pMDC43, pMDC83) using the LR clonase enzyme. Since both plasmid (pENTR and pMDC vector)
have the same resistance to kanamycin antibiotic, previously to the LR reaction, the pENTR carrying
out the CG was digested with Mlu I enzyme that eliminate the kanamycin gene.

Identification of candidate genes
180
Figure V. 4 Expression cassettes used to clone candidates genes.
We used the vectors of pMDC series as expression clone. These vector has double promoter
35S and a gene for hygromycin selection in planta. The pMDC series of binary vectors is freely
available for non commercial research (Curtis and Grossniklaus, 2003). Three different vectors were
used. The pMDC43 and pMDC83 allow the fusion of the interest gene with Green fluorescent protein
(gfp6) gene at C or N-terminal, respectively while the pMDC32 vector has no gfp6 fusion (Figure V.4)
and are used to localize the interest protein.
The pENTR clone containing the CG was recombined with the pMDC vectors (i.e pMDC32,
pMDC43, pMDC83) using the LR clonase enzyme. Since both plasmid (pENTR and pMDC vector)
have resistance to kanamycin antibiotic, previously to the LR reaction, the pENTR carrying out the
CG was digested with Mlu I enzyme that eliminate the kanamycin gene.
The LR reaction was achieved as follow:
150 ng of entry vector (pENTR)
150 ng of the pMDC vector
2 µl LR clonase mix enzymes

Identification of candidate genes
181
The reaction was incubated overnight at 25°C. To stop the reaction 1µl of K proteinase was
add to the mix. The samples were incubated at 37°C during 1h. 1µl of reaction was added to
chemically competent cell of E. coli (Top10). The cells were kept on ice during 30 min after incubated
at 42°C for 30 s. 250 µl of SOC medium was added to each tube. The tubes were incubated at 37°C
during 1h. 100 µl of bacterial culture was spread onto LB solid medium containing 50µl/mg
kanamycin. Colonies that grew up under selective medium were analyzed by PCR and restriction.
Positive clones were completely sequenced. After confirmation of CG integrity the expression clones
were inserted into Agrobacterium tumefaciens strain LBA1119.
Genetic transformation coffee
We used the transformation methodology established in Chapter IV for CG validation in
coffee plants (for details see Chapter IV). Once the embryogenic calluses are obtained, they can be
sub-cultured each 3 weeks on the maintenance medium (MS medium containing 4.5µM 2,4D and 12
µM 6-BA, Etienne, 2005) until 12 months. Alternatively embryogenic calli competent for genetic
transformation can be cryopreserved and used afterwards for transformation experiments. The 3
expression vectors were used to transform embryogenic cells of C. arabica cv. Caturra. Two different
agrobacteria suspensions (0.6-0.8 OD600) were grown up with each one of the expression clone. Each
suspension was used to inoculate two jars containing coffee embryogenic calluses that have
proliferated 4 months on the maintenance medium. From each jar 4 plate dishes containing 20 calluses
approx. 3 mm diameter were made. A total of 320 calluses were inoculated for each expression vector.
The negative control for transformation consisted of a jar inoculated with an A. tumefaciens LBA1119
without expression vector (Figure V.5). An illustrated general view of the transformation procedure is
shown in Figure 6 V.

Identification of candidate genes
182
Figure V. 5 Schema representing the coffee transformation experiment for CG functional validation. Two A.
tumefaciens suspensions (1 and 2) each carrying out the same expression clones were used inoculate to two jars
(a and b) containing the embryogenic callus coffee. From each jar 4 plate dishes containing 20 calluses were
made (A to D). One jar was inoculated with A. tumefaciens LBA1119 suspension without expression vector and
used as negative control.
Analysis of transgenic coffee plants
Hygromicin and or GFP detection by PCR
Genomic DNA was isolated from leaves of putative transgenic and non transgenic nursery
plants. The leaves were frozen in liquid nitrogen and DNA extraction was carried out with a CTAB
procedure (Doyle and Doyle 1990) with modified extraction buffer (2% CTAB, 1.4mM NaCl, 100mM
Tris HCl, 20mM EDTA at pH 0.8). Primers for amplification of a fragment HPTII gene: 5‘-
GCCTGAACTCACCGCGACGTC-3‘ and 5‘-GCACTGACGGTGTCGTCCAT-3‘ (fragment size 506
bp) and for amplification of GFP6 gene: 5‘-ATGAGTAAAGGAGAAGAACT-3‘ and
5‘-TTAAAGCTCATCATGTTTGT-3‘ (fragment size 1000 bp)
PCR was carried out in a 25µl volume containing 50ng of genomic DNA, 1U Taq DNA polymerase,
1X buffer (Promega, Madison USA), 0.2 mM each dNTP, 2mM MgCl2, 0.2 µM of each primer.
Amplification was performed in thermal cycler GeneAmp® PCR system 9700, Applied Biosystem) in
the following reaction: 1 cycle of 2min 95°C, followed by 30 cycles 1 min at 95°C, 1 min 55°C, 1 min

Identification of candidate genes
183
72°C and 4 min 72°C of final extension. The reaction products were electrophoresed in 1% (w/v)
agarose gels and visualized by staining with ethidium bromide.
GFP visualization
Leaves and roots of transgenic coffee plants were observed using a fluorescence
stereomicroscope A Leica MZ FlouIII (optic 0.63 Zeiss) supplied with a DC 300F camera (Leica
Microsystem, Wetzlar, Germany), band-pass excitation filter (480 nm BP 40) and long-pass emission
filter (510 nm LP) was utilized for visualization of GFP.
Rust resistance bioassay using transgenic coffee plants
Plantlets were inoculated using the procedure previously described by Silva et al. (2002).
Briefly, the urediospores of Hemileia vastatrix race II were spread with a camel hair brush over the
lower surface of young coffee leaves. Distilled water was then kindly sprayed on to the inoculated
surface and the plants were kept for 24 h in a dark moist chamber. The symptoms were evaluated 4
weeks after inoculation.

Identification of candidate genes
184
Figure V. 6 Overview of the transformation method used to produce transgenic coffee plants.
Results and discussion
The transformation of embryogenic callus was achieved following the protocol that we have
established for coffee (for details see chapter 4). For each expression vectors constructed with A2
candidate gene, 320 calluses were co-cultivated. Four months after co-cultivation, 143, 210 and 251
hygromicin resistant calluses were produced for pMDC43+CG, pMDC83+CG and pMDC32+CG
respectively, representing 44, 65 and 78% of transformation efficiency respectively.
A fragment of HTPII gene that confers resistance to hygromycin was amplified by PCR in all
analyzed putative transgenic plants and a fragment of GFP6 gene was amplified in those plants
transformed with pMDC43 and 83. However, although the GFP gene was proved to be present in the
transgenic plants, the subcellular localization of the fusion protein using a fluorescence
stereomicroscope failed.
The presence of the GFP can lead to an improper folding of the fusion protein or hiding a
localization signal that could be essential for a proper location. Moreover the vectors of pMDC series

Identification of candidate genes
185
used the GFP6, which is soluble into cytoplasm becoming less fluorescent. Woody species such as
coffee trees are rich in autofluorescent compounds and sensitive detection of GFP in these species is
sometimes difficult. For example similarly, no detection of GFP6 was also observed in transgenic
apple trees using fluorescence stereomicroscope (Hily and Liu, 2009).
A total of 30 transgenic coffee plants produced with each vector (pMDC43+CG or
pMDC83+CG) and 60 with pMDC32+CG were successfully transferred to the greenhouse. Plants
from twelve transformation events from pMDC32 containing the A2 candidate gene (2 plants for each
event) were inoculated with the urediospores of Hemileia vastatrix race II. Two non transformed
plants (hence, susceptible to coffee leaf rust rust) were also inoculated as positive controls. Thirty days
after inoculation the yellow spots were observed in both transgenic and control plants; 10 days later
the urediospores were produced (Figure V.7). This means that A2 member was not able to confer
resistance to race two of Hemileia vastatrix.
Since at least 4-5 members were introgressed in the S.795 cultivar it is possible that other gene
present into SH3 locus be responsible for conferring the CLR resistance rather than A2 candidate, or
that the combinatory expression of different members be required to confer resistance.
In some cases, more than one gene into a cluster of R genes is needs to confer resistance. One
example is the locus Pikm that confer resistance to rice blast caused by Magnaporthe oryzae
(Ashikawa et al., 2008). Two candidate NBS-LRR genes were found in this region and consider as
candidates genes. Genetic complementation analysis of transgenic rice lines individually carrying each
one of the genes do not conferred resistance to rice blast. However transgenic lines carrying both of
these genes expressed blast resistance. Although the two genes contain all the conserved motifs
necessary for to function independently as a resistance gene both are required to confer resistance to
rice blast (Ashikawa et al., 2008). Similar results were observed by Lee et al. (2009).
Figure V. 7 Transgenic coffee plants carrying out the candidate genes A2 not conferred resistance to CLR. A:
Apparition of yellow spots 30 days after inoculation with race II of Hemileia vastatrix. B: development of spores
45 days after inoculation.
A B

Identification of candidate genes
186
As we were not able to clone all introgressed members and the only cloned member did not
confer rust resistance, a new strategy to isolate the candidate genes was initiated. The new strategy
consists in developing a pooled BAC library directly in the S.795 introgressed (Figure 8). This library
has been constructed at INRA, Toulouse
(http://cnrgv.toulouse.inra.fr/fr/services/non_gridded_bac_library). The previous determination of
genetic and physical map of SH3 locus from the IAPAR-59 cultivar will help the quick localization of
the resistant locus making easy the isolation of all candidate genes in the S.795 cultivar. Currently, the
S.795 pooled BAC library is been screened to localize the locus SH3. The selected BACs will be
completely sequenced and the candidate genes will be isolated. The same expression clones
construction aforementioned will be employed to clone the CG. The transformation method that we
developed in the present work represents a reliable tool for functional validation of CG in coffee as its
high repeatability and efficiency was demonstrated.
Figure V. 8 Strategy used for constructing a pooled BAC library of S.795 resistant cultivar to coffee leaf rust
(http://cnrgv.toulouse.inra.fr/fr/services/non_gridded_bac_library).

187
CHAPTER VI

General Discussion and Perspectives
188
General Discussion and Perspectives
Coffee is one of the most important agricultural products in international trade. Coffee leaf
rust (CLR), caused by the fungus Hemileia vastatrix is the main disease of cultivated C. arabica and it
can substantially reduce the production of coffee beans if no disease management is employed. The
major challenge of coffee breeders is to create coffee cultivars combining high yield, cup quality and
durable resistance to pests and diseases. Although CLR can be controlled by chemicals, the most
economical and ecologically friendly strategy to control the disease is the use of resistant cultivars.
Hence, different breeding programs were developed with most of them using the Timor hybrid
(introgressed by C. canephora) as the source of resistance. These programs resulted, since the eighties,
to the selection and deployment on a large scale of resistant cultivars. However, examples of loss of
resistance have been reported during recent years in different countries.
The cloning and the characterization of resistance genes can lead to a better understanding of
R gene diversity and organization and of the molecular basis of plant-pathogen interactions. All these
data can provide useful information to improve the breeding strategies to develop cultivars with
durable resistance in field conditions. Towards this objective, this thesis presents the results of efforts
focused on the SH3 locus from coffee that confers resistance to the CLR.
1. Positional cloning approach
The resistance provided by SH3 is dominant (Prakash et al., 2004). The SH3 resistance factor was
introgressed into C. arabica gene pool through a natural hybridization with C. liberica. As a first step
to positional cloning of the SH3 resistant factor, the genetic and physical mapping of SH3 region was
realised in C. arabica with the help of a BAC library from cultivar IAPAR-59 (Chapter II). Although
this cultivar is resistant to coffee leaf rust, it lacks the C. liberica introgression and consequently the
SH3 resistant factor.
The complete sequence of the SH3 locus (550 kb) in three coffee genomes (Ea and C
a) from C.
arabica cv. IAPAR-59 and Cc genome from C. canephora accession HD 200-94 revealed the
presence of a variable number of potential R genes (3-5, according to the genome considered)
belonging to a family of CC-NBS-LRR (CNL) class of genes. Southern hybridization and sequence
analysis of partial PCR-amplified SH3-CNL members from a C. liberica-introgressed genotype (S.795)

General Discussion and Perspectives
189
indicated that while IAPAR-59 has 8 SH3-CNL members, the resistant cultivar S.795 contains at least
9 or 10 SH3-CNL members. A comparative analysis between the SH3 loci in the two cultivars
demonstrated that the introgressed segment from the C. liberica genome has occurred into Ca sub-
genome of C. arabica (Chapter II). Since five (5) SH3-CNL members were localized in Ea sub genome
of C. arabica, then at least 4 or 5 members were inferred to be present into the C. liberica-introgressed
segment carrying the SH3 resistant factor in the cultivar S. 795 and therefore were considered as
candidate genes to CLR.
The challenge to clone all the candidate genes (CG) for the SH3 resistant factor from cultivar
S.795 was initially based on direct PCR-amplification of the SH3-CNL members using specific primers
targeting the flanking regions of the different members identified in C. arabica. This approach was
partially successful since only two genes corresponding to introgression from C. liberica were cloned
(A2 and A3 members). The A2 introgressed gene had a conserved ORF and appeared clearly as a good
candidate gene that is involved in the SH3 resistant factor. On the contrary, the A3 sequence showed an
early stop codon that prevents the complete translation of the gene which was consequently excluded
from the candidate genes. As aforementioned, it was estimated that 4-5 copies have been introgressed
into the cultivar S.795. However, only two introgressed copies were amplified using this approach,
probably because the flanking regions are not conserved between C. arabica and C. liberica or the
members detected in C. arabica are not present in the C. liberica-introgressed segment.
Since this approach was not efficient to identify all the CGs present in the the introgressed
resistant genotype S.795, a non gridded BAC library from this cultivar was recently constructed
(http://cnrgv.toulouse.inra.fr/en/services/non_gridded_bac_library). The screening of this library in
collaboration with INRA-CNRV allowed the identification of a few BAC clones containing SH3-CNL
members (Figure VI.1). The sequencing of these BAC clones is now in progress and the sequences of
the other candidate genes will soon be available. In order to individuate the gene(s) responsible for the
resistance, a complementation test on a susceptible genotype will be performed with all the candidate
genes.

General Discussion and Perspectives
190
Figure VI. 1 Identification of BAC clones containing the SH3 locus in the S.795 resistant cultivar of C. arabica.
A. BAC clones containing the SH3 locus; B. Pulse field of BACs digested with Not I enzyme; C. BACs
fingerprint digested by Eco RI enzymes.
BACs identified by molecular marks BA64 and BA67 linked to SH3 locus

General Discussion and Perspectives
191
2. Development of tools for reliable functional gene validation
Coffee leaf rust is caused by the biotrophic fungus Hemileia vastatrix, a specific disease of coffee
plants. In such a case of tight relation/co-evolution between host and pathogen, functional validation
of candidate genes of resistance to coffee leaf rust cannot be conducted in model plants such as
Arabidopsis or tobacco, for which, highly efficient genetic transformation procedures have been
established. On the other hand, reliable transformation procedures have yet to be established in most
of woody plants including coffee trees. Different reasons can explain this delay in developing efficient
tools for the functional validation in woody plants. First, the global recalcitrant character to in vitro
culture probably associated to i) the long biological cycles directly related to the long-term
morphogenetic responses and ii) the high oxidative processes and elevated phenol contents generally
found in perennial species. Secondly, the in vitro regeneration systems on which the genetic
transformation protocols are based do not allow the plant regeneration from adult tissues for a lot of
species. Therefore, for such species, transformed plants are derived from zygotic embryos or young
seedlings, and consequently do not reproduce exactly the same genotype of the studied variety.
Consequently, due to the difficulty to work on woody species most of researchers prefer to work on
model plants where the available high throughput transformation technologies and related genomic
tools allow rapid, reliable and quantitative generation of data necessary for a more fundamental and
attractive research.
Even if different transformation technologies have been occasionally employed with perennial
species (particle bombardment, protoplast electroporation), the currently most employed method is the
use of the natural vector, Agrobacterium tumefaciens, put in contact with in vitro cultured explants
that have the capability to regenerate whole plants using the somatic embryogenesis or adventitious
regeneration pathways. Various coffee research groups mainly in Brazil (Embrapa), Colombia
(Cenicafe), Japan (Ochanomizu University), Venezuela (University of Venezuela), India (Tissue
Culture and Biotechnology Center of Coffee Board) and France (Nestlé and CIRAD-IRD) have used
several methods, different explants and culture conditions to transform coffee tree. Although some
success has been achieved, particularly through the production of transgenic plants expressing some
agronomically interesting genes such as resistance to insect and silencing genes of caffeine
biosynthesis, coffee transformation efficiency is still very low and the production of transgenic plants
has not been systematically obtained (Leroy et al., 2000; Ogita et al., 2004; Ribas et al., 2005,
Albuberque et al., 2009). At the beginning of this thesis work, no reliable protocol for coffee
transformation existed for C. arabica. In fact, no extended analysis had been achieved about the
physiological status of target cells and this is known to be a crucial step for successful plant

General Discussion and Perspectives
192
transformation. The main bottleneck to achieve a reliable transformation in C. arabica is the difficulty
to obtain embryogenic tissues and to establish the optimal conditions for their proliferation. Another
problem is to obtain target materials in enough quantities for further transformation experiments. In
the present work it was demonstrated that the establishment of such proliferation conditions for
embryogenic callus was a necessary but not sufficient step to ensure efficient transformation. Indeed,
it was demonstrated that the culture conditions of the embryogenic callus cultures previous to co-
culturing with the agrobacteria, and hence the physiological status of embryogenic cells, strongly
influenced the success of genetic transformation.
The process of establishing coffee embryogenic cultures led to the development of three
morphologically different callus phenotypes with highly contrasting potentials for genetic
transformation. The yellow type selected within the optimal 6-14 month proliferation period appeared
to be an ideal material for transformation purposes (up to 95% transformation efficiency). This
exceptionally high successful transformation rate could be due to the enrichment in transformation
competent target cells occurring during the established selecting process based on the two parameters:
callus phenotype and age. The highly competent cultures are effectively constituted of only pro-
embryogenic masses (PEM). Similarly, PEM cells have been previously identified as the target tissues
for A. tumefaciens transformation of Arabidopsis thaliana (Sangwan et al., 1992) and Vitis
rotundifolia (Dhekney et al., 2008).
Although the methodology established in this study for coffee transformation is highly
efficient and reliable, the process is still long to be used in high throughput functional genomics. On
average, 27 months are required to obtain transgenic coffee plants starting from the initial leaf explant.
The best alternative to reduce this time is probably the use of cryopreserved tissues. Once established
the best conditions for embryogenic callus proliferation and transformation, the callus can be cryo-
preserved for long-term storage as germplasm to be used in future transformation experiments
avoiding maintenance, ageing of tissues and disappearance of competent cells (Jain, 2006). The use of
cryo-preserved competent coffee cells decreases to 12 months the process duration required to obtain
transgenic coffee plants (see Figure VI. 1). Preliminary results of coffee transformation using
cryopreserved embryogenic tissues were very encouraging (Fourty, 2009). Interestingly, the
performance of cryopreserved tissues was higher than non-cryopreserved tissues. Up to 70% of stable
GFP expression was observed in cryopreserved tissues against 40% in non-cryopreserved. The
positive effect of cryopreservation on the success of the transformation could be due to the resulting
process of ―cellular selection‖ of PEMs occurring during the cryopreservation procedure. Is is well
known that embryogenic cells proved to be more resistant to different stresses including
cryopreservation.

General Discussion and Perspectives
193
PEMs and embryogenic cells exhibit characteristics of metabolically very active cells with
prominent central nucleus, visible nucleolus and small vacuole, along with large starch, protein and
lipid reserves. These features make them probably resistant to most stresses including
cryopreservation and consequently more competent to a range of biological processes like somatic
embryogenesis and genetic transformation. These reserves are important to restart the cellular activity
after bearing a stress such as Agrobacterium infection for example. A bank of cryopreserved
competent coffee tissues for transformation has been established in our laboratory and actually allows
the routine functional validation of coffee candidate genes. In theory, any candidate gene could be
functionally validated and since the developed transformation method is supported by a very efficient
somatic embryogenesis procedure, large quantities of fully transformed plants can be regenerated.
It is well known that the transformation efficiency generally decreases in line with the length
of genes to insert in plant genomes via Agrobacterium-T DNA. Although the tested CLR candidate
gene has approximately 4000 bases and hence corresponds to a long gene, very high transformation
efficiency was achieved. The selection of coffee transgenic tissues based on the resistance to
Hygromicin was demonstrated to be highly efficient since no escape was detected among all the
analyzed transformation events. This result is in agreement with those recently published on coffee
tree by Mishra et al. (2006). Furthermore, fifty percent of the plants were proven to have integrated
only one transgene insertion. Variations in the level of expression of foreign genes have been partly
attributed to differences in the number of transgene insertions (Bhat, 2002). Hence, it is more desirable
to produce plants containing only one insertion copy of the candidate gene in view of functional
genomics purposes to suppress the variations associated to the number of insertions.
In conclusion, the transformation methodology that was developed here fulfills the different
requirements to be used for functional genomics and could in future become the reference protocol for
functional validation of agronomically interesting genes in coffee. Several candidate genes are already
available from EST collections (Vieira et al., 2006; Fernandez et al., 2004), microarray projects (Privat
et al, in press) and from the present work. The coffee genome sequencing and annotation of C.
canephora Pierre species (Argout et al., 2010) is now in progress and will rapidly generate thousands
of candidate genes that must have their functions validated.

General Discussion and Perspectives
194
Leaf Explants
Calluses induction
Calluses maintenance
Co-culture A tumefaciens
Calluses selection
Embryos selection
In vitro development
Acclimatization Transgenic plants
8 months At least 6 months 4 months 2 months 4 months 1-2 months
26 months
Calluses cryopreservation
12 months
Figure VI. 2 Compared time durations for producing transgenic coffee plants using leaf explants versus
cryopreserved calluses
3. Diversity and evolution of R genes in Coffea
The genomic sequence analysis of the SH3 locus in three coffee species allowed characterizing
the evolutionary features of the SH3-CNL family. It was demonstrated that: (i) this family evolved by a
birth-death model, (ii) gene conversion events (intra and inter-genomes) were frequent among the SH3-
CNL members; (iii) diversifying selection appears to act in the LRR regions (Chapter, III). It has been
previously suggested that gene conversion plays a major role in evolution of NBS-LRR genes for at
least two perennial species: grapevine and poplar (Yang et al., 2008). The characterization of SH3-
CNL genes in coffee seems to confirm the hypothesis that gene conversion is one of the most
important mechanisms to generate gene diversity in perennial plants.
In addition, SH3-CNL genes have sequence similarity with several well characterized
resistance genes. These features are consistent with a role of the SH3-CNL family in the recognition of
pathogen aggressions and this makes it a very good candidate to CLR resistance, as well as for other
biotic aggressors, such as nematodes (Meloidogyne sp, Pratylenchus spp) and fungal diseases
(Colletotrichum kahawae, Cercospora coffeicola, Fusarium stilboides, Hemileia coffeicola, Fusarium
xylarioides).
In fact, it has been demonstrated that R genes within a cluster can determine resistance to
different pathogens (Michelmore & Meyers, 1998). For example: the locus Rpg1 from soybean
confers resistance against to a diverse kind of pathogens including: Pseudomonas syringae,
Phytophthora soja, soybean mosaic virus and peanut mottle virus (Asfield et al., 2004). Two highly
similar genes located a distance of 115 kb apart on the potato chromosome 12 confer resistance to two
unrelated pathogens: potato cyst nematode and potato virus X (van der Vossen et al., 2000). RPP8 and
HRT from Arabidopsis are paralogous genes that encode resistance to Peronospora parasitica and
turnip crinkle virus respectively (Cooleya et al., 2000). Similarly, the Mi locus from tomato encodes

General Discussion and Perspectives
195
resistance to a nematode and an aphid species (Rossi et al., 1998 and Vos, P. et al., 1998; Seah et al.,
2007).
The characterization of the SH3 locus can also be used in syntenic approaches to isolate
resistance gene analogs or potential novel resistant alleles in the ortholog regions of closely related
species. The exploitation of the available genetic diversity for resistance genes in cultivated and wild
species of coffee could be very useful in the frame of breeding strategies aiming at the development of
cultivars exhibiting durable resistances.
Furthermore, the whole sequencing and annotation of the coffee genome (C. canephora
Pierre) that are now in progress (Argout et al., 2010) will provide the opportunity to study the number,
distribution, genomic organization and the diversity of R genes in the Coffea genome. In particular, it
will be possible to confirm the importance of gene conversion as general mechanisms to generate gene
diversity in R genes.
4. Interactions between SH3-gene and H. vastatrix effectors
Plant resistant proteins recognize a pathogen invasion interacting with their effectors. Any effector
recognized by a R protein is qualified as an avirulence gene (Avr) (Dangl and McDowell, 2006).
Pathogen virulence effectors that trigger indirect recognition are often found as presence–absence
alleles across a pathogen species (Dangl and Jones, 2006) and can only escape detection by becoming
non-functional. On the other hand, effectors proteins that are recognized by a direct physical
interaction with the R protein, can avoid detection by altering binding sites while they maintain their
function (Catanzariti et al., 2010). Pathogens with narrow host ranges and an inability to survive apart
from their hosts (obligate biotrophs like rust) may have undergone evolution of virulence effectors
with subtle effects that do not result in altered or modified host machinery (Dodds et al., 2006). The
determination of molecular basis between R gene-Avr protein interactions could reflect the co-
evolution model of SH3 and effectors from H. vastratrix.
The direct interaction between R and Avr genes could be conducted using yeast two-hybrid
assay. In this method, GAL4 DNA binding domain (BD) and transcriptional activation domain (AD)
are merged with R and Avr proteins respectively. Coexpression of these protein fusions activate
expression of the HIS3 and lacZ reporter genes in transformed yeast cells, indicating that these
corresponding R and Avr proteins can form physical interactions in yeast. This method has been used
to determine direct interaction in rust-flax system between AvrL567 effectors and the corresponding L
proteins (Dodds et al., 2006) and between M and AvrM (Catanzariti et al., 2010).

General Discussion and Perspectives
196
The whole sequencing of H. vastatrix genome is now in progress and will soon open new
experimental perspectives. Random sequencing of coffee rust genome using 454 technology obtained
16Mb of data in Colombia (Escobar et al., 2010). A total of 5,629 sequences were functionally
annotated. From this, around 100 annotated sequences seem to be related to virulence as revealed by
similarity with RXRL effectors with other plant pathogens and related proteins (Escobar et al., 2010
ASIC). Moreover, an EST database realized at three differentiation/infection stages (germinated
uredospores, apressoria and haustoria) from an isolate of race XIV (containing the virulence genes v2,
3, 4, 5) has been created (Talinhas et al., 2010).
The isolation of race-specific Avr and R genes in other plant species has generated new
opportunities for studying the mechanisms of plant-pathogen interaction. For example, AVR3a (a
RXLR cytoplasmic effector) from Phytophthora infestans and each gene belonging to the R3 locus
from potato (which possess 4 paralogs from NB-LRR class: R3-3, R3-1, R3-3, R3-4) were co-
expressed by agro-infiltration in N. benthamiana. The results indicated that AVR3a is specifically
recognized by R3a among the examined NBS-LRR genes of the R3 locus (Bos et al., 2006).
Similar experiments could be envisaged in the future to study gene pair interaction between SH
genes from coffee and effectors proteins from H. vastatrix. The isolation of R genes from coffee
together with the identification of effectors genes from H. vastatrix involved in pathogenicity will
provide a better understanding of the molecular basis of coffee-rust interaction.
5. Durable resistance to Coffee Leaf Rust
Durable resistance refers to resistance that remains effective during its prolonged and widespread
use in environments favorable to the pathogen or disease spread (Johnson, 1981).
Biotrophic pathogens such as H. vastatrix are usually able to overcome host resistance by deletion
or mutation of Avr genes leading to failure of R gene-mediated recognition and subsequent
hypersensitive response (HR) and other responses (van der Vossen, 2005).
Resistance to diseases provided by single dominant R genes is sometimes ephemeral due to
evolution of new virulent races. The most durable resistance genes are those that require multiple
mutations by the pathogen for virulence, with mutations causing the highest fitness penalty (Palloix et
al., 2009). The gene pyramiding approach (i.e. simultaneous introduction of several R genes targeting
different races of the same pathogen into one elite breeding line) should provide a broader and more
durable resistance since mutational events in multiples Avr genes will be required to produce new
virulent pathogens (van der Vossen, 2005). The gene pyramiding assisted by MAS (Molecular assisted
selection) has been used in many species to improve disease resistance.
General Discussion and Perspectives
197
The best DNA markers are those derived from sequences of the R genes themselves or their
adjacent flanking regions. Thus, R gene sequences can be used to create precise ‗within the gene‘
(WTG) molecular markers, without the need for pathogen testing during introgression breeding.
Markers derived from R gene sequences therefore allow each gene to be traced accurately through
each breeding generation without the need to carry out difficult and laborious phenotypic screenings
(Hammond-Kosack and Kanurya 2007).
During the last few years, several rust resistance factors have been genetically analyzed, and
associated molecular markers were reported. In contrast to the present work on the SH3 resistance
factor inherited from C. liberica, the other works were focused on rust resistance factors introgressed
into C. arabica from C. canephora through the Timor hybrid. The developed markers concerned a
partial rust resistance (Herrera et al. 2009; Romero et al. 2010) and a complete resistance gene (de
Brito et al. 2010). These introgressed regions carry resistance genes that are related the resistance
factors known as SH6 to SH9. However, the relationships are not yet clearly established (Diola et al.,
2010) and preliminary data showed that the SH3 region is different from those identified in the Timor
hybrid.
All together, the characterization of the SH3 gene sequence as well as those from others SH
genes could facilitate the traceability of the introgression of these genes into elite cultivars using the
pyramiding approach. Consequently the pyramiding of SH3 and other SH resistant genes into elite
coffee genotypes should provide a broader spectrum and more durable disease resistance to coffee leaf
rust.
Similarly, different alleles of one gene, or the same alleles (allele-dosage) (Tan et al., 2010)
could also be used in pyramiding approach. It has been demonstrated that pyramiding of different
alleles of Pm3 locus from wheat permitted a combined and thus broader resistance compared with
those conferred by the parental alleles (Brunner et al., 2010).
Such pyramiding strategy could be facilitated by the development of a new and promissing
type of variety based on F1 hybrids (Bertrand et al. 2005). Such C. arabica intraspecific F1 hybrids
were selected in Central America from 1991 to 2006 and are currently propagated on a large scale
through somatic embryogenesis (Etienne 2005; Menéndez-Yuffa et al., 2010; Etienne et al., 2010). In
addition to high productivity and strong homeostasis associated to heterosis, this type of variety offers
the possibility of developing new rust resistance varieties in less time (around 10 years). In particular,
durable resistance could be achieved by the combination in F1 hybrids of complementary SH genes
inherited from both parents and therefore making it more difficult for H. vastatrix to break the
resistance.

References
198
References
Aarts, N. (1998). Different requirements for EDS1 and NDR1 by disease resistance genes define at least two R
gene mediated signalling pathways in Arabidopsis. Proc Natl Acad Sci USA 95, 10306-10311.
Adams, K., and Wendel, J. (2005). Polyploidy and genome evolution in plants. Current Opinion in Plant
Biology, 135-141.
Aga, E., Bryngelsson, T., Bekele, E., Salomon, B. (2003). Genetic diversity of forest arabica coffee (Coffea
arabica L.) in Ethiopia revealed by random amplified polymorphic DNA (RAPD) analysis. Hereditas 138,
36–46.
Akita, M., and Valkonen, J.P. (2002). A novel gene family in moss (Physcomitrella patens) shows sequence
homology and a phylogenetic relationship with the TIR-NBS class of plant disease resistance genes. J Mol
Evol 55, 595-605.
Albrecht, M., and Takken, F.L. (2006). Update on the domain architectures of NLRs and R proteins. Biochem
Biophys Res Commun 339, 459 - 462.
Albuquerque, E.V.S., Cunha, W.G., Barbosa, A.E.A.D., Costa, P.M., Teixeira, J.B., Vianna, G.R., Cabral, G.B.,
Fernandez, D., and Grossi-de-Sa, M.F. (2009). Transgenic coffee fruits from Coffea arabica genetically
modified by bombardment. In Vitro Cellular & Developmental Biology - Plant 45, 532-539.
Allen, R.L. (2004). Host-parasite coevolutionary conflict between Arabidopsis and downy mildew. Science 306,
1957-1960.
Almeida, S. R.. Doenças do cafeeiro. in: Rena, A. B.; Malavolta, E.; Rocha, M.; Yamada, T. (eds.). cultura do
cafeeiro: fatores que afetam a produtividade. piracicaba: potafós, 1986. p. 391-399.
Alpizar, E., Dechamp, E., Espeout, S., Royer, M., Lecouls, A.C., Nicole, M., Bertrand, B., Lashermes, P., and
Etienne, H. (2006). Efficient production of Agrobacterium rhizogenes-transformed roots and composite
plants for studying gene expression in coffee roots. Plant Cell Rep 25, 959-967.
Ameline-Torregrosa, C., Wang, B.B., O'Bleness, M.S., Deshpande, S., Zhu, H.Y., Roe, B., Young, N.D., and
Cannon, S.B. (2008). Identification and characterization of nucleotide-binding site-Leucine-rich repeat
genes in the model plant Medicago truncatula. Plant Physiology 146, 5-21.
Anderson, E. (1949). Introgressive hybridization. Wiley, New York, NY.
Anderson, P.A. (1997). Inactivation of the flax rust resistance gene M associated with loss of a repeated unit
within the leucine-rich repeat coding region. Plant Cell 9, 641-651.
Andrade, G.M., Nairn, C.J., Le, H.T., and Merkle, S.A. (2009). Sexually mature transgenic American chestnut
trees via embryogenic suspension-based transformation. Plant Cell Reports 28, 1385-1397.
Anthony F, Bertrand B, Quiros O, Wilches A, Lashermes P, et al. (2001) Genetic diversity of wild coffee
(Coffea arabica L.) using molecular markers. Euphytica 118, 53–65
Anthony, F., Combes, M.C., Astorga, C., Bertrand, B., Graziosi, G., and Lashermes, P. (2002). The origin of
cultivated Coffea arabica L. varieties revealed by AFLP and SSR markers. Theor. Appl. Genet. 104, 894–
900.

References
199
Anthony, F. & Lashermes, P. 2005. The coffee (Coffea arabica L.) genome: diversity and evolution. Pp. 207–
228 in: Sharma, A.K. & Sharma, A. (eds.), Plant Genome: Biodiversity and Evolution, vol. 1B,
Phanerogams. Science Publishers Inc., New Hampshire.
Anthony, F., Diniz, L.E.C., Combes, M.-C., and Lashermes, P. (2010). Adaptive radiation in Coffea subgenus
Coffea L. (Rubiaceae) in Africa and Madagascar. Plant Syst Evol.
Ara, H., Jaiswal, U., and Jaiswal, V. (2005). Mango (Mangifera indica L.). In Protocols for somatic
embryogenesis in woody plants (the Netherlands, Jain SM and Gupta PK), pp. 229-256.
Argout, X., Crouzillat, D., Lashermes, P., Priyono P, Yepes, M., and Wincker, P. (2010). Sequencing the coffee
genome: Overall strategy and progress made in the frame of ICGN. Paper presented at: The 23rd
International Conference on Coffee Science (Bali, Indonésia, ASIC), p.49.
Ashfield, T., Ong, L. E., Nobuta, K., Schneider, C. M., Innes, R. W. (2004). Convergent evolution of disease
resistance gene specificity in two flowering plant families. Plant Cell 16, 309–318
Ashikawa, I., Hayashi, N., Yamane, H., Kanamori, H., Wu, J., Matsumoto, T., Ono, K., and Yano, M. (2008).
Two adjacent nucleotide-binding site-leucine-rich repeat class genes are required to confer Pikm-specific
rice blast resistance. Genetics 180, 2267-2276.
Ausubel, F.M. (2005). Are innate immune signaling pathways in plants and animals conserved? Nat Immunol 6,
973-979.
Avelino, J., Willocquet, L., Savary, S. (2004). Effects of crop management patterns on coffee rust epidemics.
Plant Pathology, 541-547.
Axtell, M.J., Chisholm, S.T., Dahlbeck, D., and Staskawicz, B.J. (2003a). Genetic and molecular evidence that
the Pseudomonas syringae type III effector protein AvrRpt2 is a cysteine protease. Mol Microbiol 49, 1537
- 1546.
Axtell, M.J., and Staskawicz, B.J. (2003b). Initiation of RPS2-specified disease resistance in Arabidopsis is
coupled to the AvrRpt2-directed elimination of RIN4. Cell 112, 369-377.
Azevedo, F.A., Mourão Filho, F.A.A., Mendes, B.M.J., Almeida, W.A.B., Schinor, E.H., Pio, R., Barbosa, J.M
Guidetti-Gonzalez S., Carré H., Lam E. (2006). Genetic transformation of Rangpur lime (Citrus limonia
Osbeck) with the bO (bacterio-opsin) gene and its initial evaluation for Phytophthora nicotianae resistance,
Plant Mol. Biol. Rep. 24, 1–12.
Azadi, P., Chin, D.P., Kuroda, K., Khan, R.S., and Mii, M. (2010). Macro elements in inoculation and co-
cultivation medium strongly affect the efficiency of Agrobacterium-mediated transformation in Lilium.
Plant Cell, Tissue and Organ Culture (PCTOC) 101, 201-209.
Bai, J., Pennill, L., Ning, J., Lee, S., Ramalingam, J., Webb, C., Zhao, B., Sun, Q., Nelson, J., Leach, J., et al.
(2002). Diversity in nucleotide binding site-leucine-rich repeat genes in cereals. Genome Research, 1871-
1884.
Blanc, G., Baptiste, C., Oliver, G., Martin, F., and Montoro, P. (2006). Efficient Agrobacterium tumefaciens-
mediated transformation of embryogenic calli and regeneration of Hevea brasiliensis Mull Arg. plants.
Plant Cell Reports, 724-733.
Barker, G., Batley, J., O‘Sullivan, H., Edwards, K.J. and Edwards, D. (2003) Redundancy based detection of
sequence polymorphisms in expressed sequence tag data using autoSNP. Bioinformatics, 19, 421–422.
Bakker, E.G., Toomajian, C., Kreitman, M., and Bergelson, J. (2006). A genome-wide survey of R gene
polymorphisms in Arabidopsis. Plant Cell 18, 1803-1818.

References
200
Barbosa-Mendes, J.M., Filho, F.d.A.A.M., Filho, A.B., Harakava, R., Beer, S.V., and Mendes, B.M.J. (2009).
Genetic transformation of Citrus sinensis cv. Hamlin with hrpN gene from Erwinia amylovora and
evaluation of the transgenic lines for resistance to citrus canker. Scientia Horticulturae 122, 109-115.
Barker, C. L., Donald, T., Pauquet, J., Ratnaparkhe, M. B., Bouquet, A., Adam-Blondon, A. F., Thomas, M. R.,
Dry, I. (2005). Genetic and physical mapping of the grapevine powdery mildew resistance gene, Run1,
using a bacterial artificial chromosome library. Theor Appl Genet 111, 370-377.
Barkley, N. A., and. Wang, M. L. (2008). Application of TILLING and EcoTILLING as Reverse Genetic
approaches to elucidate the function of genes in plants and animals current genomics 9, 212-226.
Batley, J., Barker, G., O‘Sullivan, H., Edwards, K.J. and Edwards, D. (2003) Mining for single nucleotide
polymorphisms and insertions ⁄ deletions in maize expressed sequence tag data. Plant Physiol. 132, 84–91.
Baumgarten, A., Cannon, S., Spangler, R., and May, G. (2003). Genome-level evolution of resistance genes in
Arabidopsis thaliana. Genetics 165, 309-319.
Bella, J., Hindle, K.L., McEwan, P.A., and Lovell, S.C. (2008). The leucine-rich repeat structure. Cellular and
Molecular Life Sciences 65, 2307-2333.
Bent, A. (1996). Function meets structure in the study of plant disease resistance genes. Plant Cell 8, 1757-1771.
Bent, A. and D. Mackey (2007). Elicitors, Effectors and R Genes: The new paradigm and a lifetime supply of
questions. Annu. Rev. Phytopathol. 45, 399-436.
Bent, A., Kunkel, B., Dahlbeck, D., Brown, K., Schmidt, R., Giraudat, J., Leung, J., and Staskawicz, B. (1994).
RPS2 of Arabidopsis thaliana: a leucine-rich repeat class of plant disease resistance genes. Science 265,
1856-1860.
Bennett, M. D., Leitch, I. J. (1995). Nuclear DNA Amounts in Angiosperms. Annals of Botany 76, 113-176.
Bergelson, J. (2001). Evolutionary Dynamics of Plant R-Genes. Science 292, 2281-2285.
Berthaud, J. (1978) L‘hybridation interspécifique entre Coffea arabica L et Coffea canephora Pierre. Obtention et
comparaison des hybrides triploïdes, Arabusta et hexaploïdes. Deuxième partie. Café-Cacao-Thé 22, 87–
112.
Bertrand, B., Etienne, H., Cilas, C., Charrier, A., Baradat, P. (2005) Coffea arabica hybrid performance for
yield, fertility and bean weight. Euphytica 141, 255‐262.
Bertrand, B., Alpizar, E., Montagnon, C., Georget, F., and Etienne, H. (2010). Performance of Arabica F1
hybrids in agroforestry and full-sun cropping systems in comparison with pure lines varieties. Agroforestery
Systems.
Bespalhok Filho, J.C., Kobayashi, A.K., Pereira, L.F.P., Vieira L.G.E. (2001). Transformação de laranja visando
resistência ao cancro cítrico usando genes de peptídeos antibacterianos, Biotec. Cien. Desenv. 23, 62–66.
Bettencourt, A. J., Rodrigues Jr, C. J., Lopes, J. (1965). Study of the physiologic specialization of the coffee rust
H. vastatrix and selection of coffee clones for the establishment of a standard range of differential hosts for
this rust. In: Progress report 1960-65, pp.28-46, Coffee Rusts Research Center, Oeiras, Portugal.
Bettencourt, A.J. Considerações gerais sobre o ‗híbrido de timor‘. Campinas: Instituto Agronômico, 1973. 20p
(circular, 23).
Bettencourt, A. J. (1981). Melhoramento genético do cafeeiro.Transferência de factores de resistência à Hemileia
vastatrix Berk & Br. para as principais cultivares de Coffea arabica L. Centro de Investigação das
Ferrugens do Cafeeiro (CIFC/IICT), Lisboa.

References
201
Bettencourt, A. J. (1983). Características agronómicas de selecções derivadas de cruzamentos entre Híbrido de
Timor e as variedades Caturra, Villa Sarchi e Catuaí. In: Simpósio sobre Ferrugens do Cafeeiro, Oeiras,
Portugal, pp.353-373.
Bettencourt, A. J., Rodrigues Jr, C. J. (1988) Principles and practice of coffee breeding for resistance to rust and
other diseases. In: Clarke RJ, Macrae R (eds), Coffee Agronomy Vol. 4, pp.199-234. Elsevier Applied
Science Publishers LTD, London and New York.
Bhat, S. (2002). Molecular and genetic analyses of transgenic plants: Considerations and approaches. Plant
Science 163, 673-681.
Bhullar, N., Street, K., Mackay, M., Yahiaoui, N., and Keller, B. (2009). Unlocking wheat genetic resources for
the molecular identification of previously undescribed functional alleles at the Pm3 resistance locus. Proc
Natl Acad Sci U S A 106, 9519-9524.
Bishop-Hurley, S. L., Zabkievicz, R, J., Grace, L. J., Gardner, R. C., Wagner, A., Walter, C. (2001) Conifer
genetic engineering: Transgenic Pinus radiata (D. Don) and Picea abies (Karst) plants are resistant to the
herbicide Buster. Plant Cell Reports 20, 235-243.
Bolar, J., Brown, S., Norelli, J.L., and Aldwinckle, H. (1999). Factors affecting the transformation of Marshall
McIntosh apple by Agrobacterium tumefaciens. Plant and Cell Tissue Organ Culture 55, 31-38.
Boller, T., Felix, G. (2009). A renaissance of elicitors: perception of Microbe-Associated Molecular Patterns and
danger signals by Pattern-Recognition Receptors. Annual Review of Plant Biology 60, 379-406.
Boller T, He, S. Y. (2009). Innate immunity in plants: an arms race between Pattern Recognition Receptors in
plants and effectors in microbial pathogens. Science 324, 742-744.
Bonga, J., Klimaszewska, K., and von Aderkas, P. (2010). Recalcitrance in clonal propagation, in particular of
conifers. Plant Cell Tissue and Organ Culture, 241-254.
Borejsza-Wysocka E., Norelli J. L., Aldwinckle H. S., Malnoy M. (2010). Stable expression and phenotypic
impact of attacin E transgene in orchard grown apple trees over a 12 year period BMC Biotechnology 10,
41.
Bouchez, D., Bendahmane, A., Lurin C., Sturbois, B. (2006). Nouvelles approches génétiques. In: Dossier Les
atouts de la génomique végétale BIOFUTUR 38, 265 p.
Botella, M.A. (1998). Three genes of the Arabidopsis RPP1 complex resistance locus recognize distinct
Peronospora parasitica avirulence determinants. Plant Cell 10, 1847-1860.
Boxtel, J., Berthouly, M., Carasco, C., Dufour, M., and Eskes, A. (1995). Transient expression of B-
glucuronidase following biolistic delivery of foreign DNA into coffee tissues. Plant Cell Reports 14, 748-
752.
Bremer, B. and Eriksson, T. (2009). Time tree of rubiaceae: phylogeny and dating the family, subfamilies, and
tribes Int. J. Plant Sci. 170, 766–793.
Bridson, D. M., Verdcourt, B. (1988). Rubiaceae. ed. Flora of tropical East Africa. Balkema, Rotterdam. 415-
747.
Bridson, D. M, Verdcourt, B. (2003). Rubiaceae. In: Pope GV, ed. Flora Zambesiaca, Vol. 5, Part 3, Rubiaceae.
Kew: Royal Botanic Gardens, 379–720.
Brito, G., Caixeta, E., Gallina, A., Zambolim, E., Zambolim, L., Diola, V., and Loureiro, M. (2010). Inheritance
of coffee leaf rust resistance and identification of AFLP markers linked to the resistance gene. Euphytica,
255-264.
References
202
Buffard-Morel, J., Verdeil, J.L., and Pannetier, C. (1992). Somatic embryogenesis of coconut (Cocos nucifera
L.) from leaf explants: histological study. Can J Bot 70, 735-741.
Buchanan, S. G., and Gay, N. J. (1996) Structural and functional diversity in the leucine-rich repeat family of
proteins, Prog. Biophys. Mol. Biol. 65, 1–44.
Burch-Smith, T.M., Schiff, M., Caplan, J.L., Tsao, J., Czymmek, K., and Dinesh-Kumar, S.P. (2007). A novel
role for the TIR domain in association with pathogen-derived elicitors. PLoS Biology 5, 68.
Byrne, P. F., McMullen, M. D. (1996) Defining genes for agricultural traits: QTL analysis and the candidate
gene approach. Probe 7, 24–27.
Caicedo, A. (1999). Diversity and molecular evolution of the RPS2 resistance gene in Arabidopsis thaliana. Proc
Natl Acad Sci USA 96, 302-306.
Canche-Moo, R.L.R., Ku-Gonzalez, A., Burgeff, C., Loyola-Vargas, V.M., Rodríguez-Zapata, L.C., and
Castaño, E. (2006). Genetic transformation of Coffea canephora by vacuum infiltration. Plant Cell, Tissue
and Organ Culture 84, 373-377.
Cannon, S.B., Zhu, H., Baumgarten, A.M., Spangler, R., May, G., Cook, D.R., and Young, N.D. (2002).
Diversity, distribution, and ancient taxonomic relationships within the TIR and non-TIR NBS-LRR
resistance gene subfamilies. Journal of Molecular Evolution 54, 548-562.
Caplan, J., Padmanabhan, M., and Dinesh-Kumar, S.P. (2008). Plant NB-LRR immune receptors: from
recognition to transcriptional reprogramming. Cell Host Microbe 3, 126-135.
Capucho, A., Caixeta, E., Zambolim, E., and Zambolim, L. (2009). Inheritance of coffee leaf rust resistance in
Timor Hybrid UFV 443-03. Pesquisa Agropecuaria Brasileira, 276-282.
Cardoso, S., Barbosa-Mendes, J., Boscariol-Camargo, R., Christiano, R., Bergamin, A., Vieira, M., Mendes, B.,
and Mourao, F. (2010). Transgenic Sweet Orange (Citrus sinensis L. Osbeck) Expressing the attacin A
Gene for Resistance to Xanthomonas citri subsp citri. Plant Mol Biol Rep, 185-192.
Carvalho, A. (1952). Taxonomia de Coffea arabica L. Caracteres morfologicos dos haploides. Bragantia 12,
201–212.
Carvalho, A., Medina Filho, H. P., Fazuoli, L. C., Guerreiro Filho, O., Lima, M. M. A. (1991). Aspectos
genéticos do cafeeiro. Revista Brasileira de Genética l4, 135–183.
Catanzariti, A.-M., Dodds, P.N., and Ellis, J.G. (2007). Avirulence proteins from haustoria-forming pathogens.
FEMS Microbiology Letters 269, 181-188.
Catanzariti, A-M., Dodds, P. N., Ve, T., Kobe, B., Ellis, J. G., Staskawicz, B. J. (2010). The Avrm effector from
flax rust has a structured c-terminal domain and interacts directly with the M resistance protein. Molecular
Plant-Microbe Interactions 23, 49-57.
Causevic, A., Delaunay, A., Ounnar, S., Richezza, M., Delmontte, F., Brignolas, F., Hagège, D., and Maury, S.
(2005). DNA methylation and demethylation treatments modify phenotype and cell wall differentiation
state in sugarbeet cell lines. Plant Physiology Biochemistry 43, 681-691.
Cenci, A., Combes, M.-C., and Lashermes, P. (2010). Comparative sequence analyses indicate that Coffea
(Asterids) and Vitis (Rosids) derive from the same paleo-hexaploid ancestral genome. Molecular Genetics
and Genomics 283, 493-501.
Chalfie, M., Tu, Y., Euskirchen, G., Ward, W.W., and Prasher, D.C. (1994). Green fluorescent protein as a
marker for gene expression. Science (New York, NY) 263, 802-805.

References
203
Charrier, A. and Berthaud, J. (1985) Botanical classification of coffee, pp. 13–47. In: Coffee: botany,
biochemistry and productions of beans and beverage (M.N. Clifford and K.C. Wilson Eds.), Croom Helm,
London.
Chaves, G. M. (1976) Melhoramento do cafeeiro visando a obtenção de cultivares resistentes a hemileia vastatrix
berk. et br. revista ceres 23, 321-332.
Chaves, G. M., Filho J da C., De Carvalho, M.G., Matsuoko K., Coelho D. T., Shimoya, C (1970). A ferreugem
do cafeeiro (Hemileia vastatrix Berk. & Br. Revisão de literatura com observações e comentários sobre a
enfermidade no Brasil. Seiva (Brasil) 30 (ed especial) 1 -75.
Chapman, B. A., Bowers, J. E., Feltus F. A., and Paterson, A. H. 2006 Buffering of crucial functions by
paleologous duplicated genes may contribute cyclicality to angiosperm genome duplication. Proc. Natl.
Acad. Sci. USA 103, 2730–2735.
Chen, Q., Han, Z., Jiang, H., Tian, D., and Yang, S. (2010). Strong positive selection drives rapid diversification
of R-genes in Arabidopsis relatives. Journal of Molecular Evolution 70, 137-148.
Cheng, M., Fry, J.E., Pang, S., Zhou, H., Hironaka, C.M., Duncan, D.R., Conner, T.W., and Wan, Y. (1997).
Genetic Transformation of Wheat Mediated by Agrobacterium tumefaciens. Plant Physiology 115, 971-980.
Chervitz, S. A., Aravind, L., Sherlock, G., Ball, C. A., Koonin, E. V., Dwight, S. S., Harris, M. A., Dolinski, K.,
Mohr, S., Smith, T., Shuai-Weng, Cherry J. M, Botstein D (1998) Comparison of the complete protein sets
of worm anfd yeast: orthology and divergence. Science 282, 2022–2028.
Chibucos, M.C., and Tyler, B.M. (2009). Common themes in nutrient acquisition by plant symbiotic microbes,
described by the Gene Ontology. BMC Microbiol 9 Suppl 1, S6.
Chisholm, S.T., Coaker, G., Day, B., and Staskawicz, B.J. (2006). Host-microbe interactions: shaping the
evolution of the plant immune response. Cell 124, 803-814.
Clarindo, WR, Carvalho CR (2009). Comparison of the Coffea canephora and C. arabica karyotype based on
chromosomal DNA content Plant Cell Rep (2009) 28:73–81.
Collier, S.M., and Moffett, P. (2009). NB-LRRs work a "bait and switch" on pathogens. Trends in Plant Science
14, 521-529.
Combes, M. C., Andrzejewski, S., Anthony, F., Bertrand, B., Rovelli, P., et al. (2000). Characterisation of
microsatellite loci in Coffea arabica and related coffee species. Mol Ecol 9, 1178–1180.
Cooley, M.B., Pathirana, S., Wu, H.-J., Kachroo, P., and Klessig, D.F. (2000). Members of the Arabidopsis
HRT/RPP8 family of resistance genes confer resistance to both viral and oomycete pathogens. Plant Cell
12, 663-676.
Coulibaly, I., Noirot, M., Lorieux, M., Charrier, A., Hamon, S., Louarn, J. (2002). Introgression of self-
compatibility from Coffea heterocalyx to the cultivated species Coffea canephora. Theoretical and Applied
Genetics 105, 994–999.
Cramer, P.J.S. (1957) in F.L. Wellman, Review of Literature of Coffee Research in Indonesia. ASIC Editorial
lnternational American Institute of Agricultural Sciences, Turrialba, Costa Rica.
Cros, J., Combes, M. C., Chabrillange, N., Duperray, C., Monnot des Angles A., et al. (1995). Nuclear DNA
content in the subgenus Coffea (Rubiaceae): inter- and intra-specific variation in African species. Can J Bot
73, 14–20.
Cros, J., Combes, M. C., Trouslot, P., Anthony. F., Hamon, S., Charrier, A., Lashermes, P. (1998). Phylogenetic
relationships of Coffea species: new evidence based on the chloroplast DNA variation analysis. Mol
Phylogenet Evol 9, 109–117.

References
204
Cruz-Hernandez, A., Witjaksono, Litz, R.E., and Lim, M.G. (1998). Agrobacterium tumefaciens - mediated
transformation of embryogenic avocado cultures and regeneration of somatic embryos. Plant Cell Reports,
497-503.
Cseke, L.J., Cseke, S.B., and Podila, G.K. (2007). High efficiency poplar transformation. Plant Cell Reports 26,
1529-1538.
Cuming, A. C. (2009). Plant-pathogen interactions: a view from the evolutionary basement. New Phytologist
183, 237-239.
Curtis, M.D., and Grossniklaus, U. (2003). A Gateway Cloning Vector Set for High-Throughput Functional
Analysis of Genes in Planta. Plant Physiology 133, 462-469.
Dai, L., Wu, J., Li, X., Wang, X., Liu, X., Jantasuriyarat, C., Kudrna, D., Yu, Y., Wing, R., Han, B., et al.
(2010). Genomic structure and evolution of the Pi2/9 locus in wild rice species. Theor Appl Genet 121,
295-309.
Dangl, J.L., and Jones, J.D.G. (2001). Plant pathogens and integrated defence responses to infection. Nature 411,
826-833.
David, P., Chen, N., Pedrosa-Harand, A., Thareau, V., Sévignac, M., Cannon, S., Debouck, D., Langin, T., and
Geffroy, V. (2009). A nomadic subtelomeric disease resistance gene cluster in common bean. Plant Physiol
151, 1048-1065.
Davis, A. P., Bridson, D., Rakotonasolo, F. (2005). A reexamination of Coffea subgenus Baracoffea and
comments on the morphology and classification of Coffea and Psilanthus (Rubiaceae-Coffeeae). In: Keating
RC, Hollowell VC, Croat T (eds) Festschrift for William G. D‘Arcy: the legacy of a taxonomist
(Monograph in Syst Bot 104). MBG Press, St. Louis, pp 398–420.
Davis, A., Govaerts, R., Bridson, D., and Stoffelen, P. (2006). An annotated taxonomic conspectus of the genus
Coffea (Rubiaceae). Botanical Journal of the Linnean Society, 465-512.
Davis, A. P., Govaerts, R., Bridson, D. M., Stoffelen, P. (2006). An annotated taxonomic conspectus of the
genus Coffea (Rubiaceae). Bot J Linn Soc 152, 465–512.
Davis, A. P., Chester, M., Maurin, O., Fay, M. F. (2007). Searching for the relatives of Coffea (Rubiaceae,
Ixoroideae): the circumscription and phylogeny of Coffeeae based on plastid sequence data and
morphology. Am J Bot 94, 313–329.
Davis, A. P., Rakotonasolo, F. (2008). A taxonomic revision of the baracoffea alliance: nine remarkable Coffea
species from western Madagascar. Bot J Linn Soc 158, 355–390.
Daley, J.M., Palmbos, P.L., Wu, D. and Wilson, T.E. (2005) Nonhomologous end joining in yeast. Annu. Rev.
Genet. 39, 431–451.
Deslandes, L., Olivier, J., Theulieres, F., Hirsch, J., Feng, D.X., Bittner-Eddy, P., Beynon, J., and Marco, Y.
(2002). Resistance to Ralstonia solanacearum in Arabidopsis thaliana is conferred by the recessive RRS1-R
gene, a member of a novel family of resistance genes. Proc Natl Acad Sci USA 99, 2404 - 2409.
Devos, K.M., Brown, J.K.M. and Bennetzen, J.L. (2002) Genome size reduction through illegitimate
recombination counteracts genome expansion in Arabidopsis. Genome Res. 12, 1075–1079.
Dhekney, S.A., Li, Z.T., Dutt, M., and Gray, D.J. (2008). Agrobacterium-mediated transformation of
embryogenic cultures and plant regeneration in Vitis rotundifolia Michx. (muscadine grape). Plant Cell
Reports 27, 865-872.
References
205
Di Matteo, A., Bonivento, D., Tsernoglou, D., Federici, L., Cervone, F. (2006). Polygalacturonase-inhibiting
protein (PGIP) in plant defence: a structural view. Phytochemistry 67, 528-533.
Di Matteo, A., Federici, L., Mattei, B., Salvi, G., Johnson, K. A., Savino, C., De Lorenzo, G., Tsernoglou, D.,
Cervone, F. (2003). The crystal structure of polygalacturonaseinhibiting protein (PGIP), a leucine-rich
repeat protein involved in plant defense. Proceedings of the National Academy of Sciences of the United
States of America 100, 10124-10128.
Diniz, L. E. C., Sakiyama, N. S., Lashermes, P., Caixeta, E. T., Oliviera, A. C.B., Zambolin, E. M,, Loureiro, M.
E., Pereira, A. A., Zambolin, L. (2005). Analysis of AFLP markers associated to the Mex-1 locus in Icatu
progenies. Crop Breeding and Applied Biotechnology 5, 387-393.
Diola, V., Cação, S.M.B., Caixeta, E.T., Brito, G.G., Zambolin, E.M., and Pereira, L.F.P. (2010). Genetic and
Physical mapping of the resistant gene for H. vastatrix race II in coffee. Paper presented at: The 23rd
International Conference on Coffee Science (Bali, Indonésia, ASIC) p.56
Dixon, M., Jones, D., Keddie, J., Thomas, C., Harrison, K., and Jones, J. (1996). The tomato Cf-2 disease
resistance locus comprises two functional genes encoding leucine-rich repeat proteins. Cell, 451-459.
Dodds, P., Lawrence, G., and Ellis, J. (2001a). Contrasting modes of evolution acting on the complex N locus
for rust resistance in flax. Plant Journal, 439-453.
Dodds, P., Lawrence, G., and Ellis, J. (2001b). Six amino acid changes confined to the leucine-rich repeat beta-
strand/beta-turn motif determine the difference between the P and P2 rust resistance specificities in flax.
Plant Cell, 163-178.
Dodds, P.N. (2006). Direct protein interaction underlies gene-for-gene specificity and coevolution of the flax
resistance genes and flax rust avirulence genes. Proc Natl Acad Sci USA 103, 8888-8893.
D‘Oliveira, B. (1957). As ferrugens do cafeeiro. Rev Café Port 4, 5–15.
Dron, M., Clouse, S.D., Dixon, R.A., Lawton, M.A., and Lamb, C.J. (1988). Glutathione and fungal elicitor
regulation of a plant defense gene promoter in electroporated protoplasts. Proc Natl Acad Sci U S A 85,
6738-6742.
Drouaud, J., Camilleri, C., Bourguignon, P. Y., Canaguier, A., Bérard. A., Vezon. D., Giancola, S., Brunel, D.,
Colot, V., Prum, B., Quesneville, H., Mézard, C. (2006). Variation in crossing-over rates across
chromosome 4 of Arabidopsis thaliana reveals the presence of meiotic recombination ―hot spots‖. Genome
Research 16,106-114.
Doyle, J.J., and Doyle, J.L.A. (1987). A rapid DNA isolation procedure for small quantities of fresh leaf tissue.
Phytochemical Bulletin 19, 11-15.
Dublin, P., Enjalric, F., Lardet, L., Carron, M. P., Trolinder, N., Pannetier, C. (1991) Estate crops. In: Debergh
PC, Zimmerman RH (eds) Micropropagation: technology and practice. Kluwer Academic Publ, Dordrecht,
The Netherlands, pp 337-361
Duran, C., Appleby, N., Vardy, M., Imelfort, M., Edwards, D. and Batley, J. (2009c) Single nucleotide
polymorphism discovery in barley using autoSNPdb. Plant Biotechnol. J. 7, 326–333.
Durrant, W.E., and Dong, X. (2004). Systemic acquired resistance. Annu Rev Phytopathol 42, 185-209.
Dussert S, Lashermes P, Anthony F, Montagnon C, Trouslot P, et al. (2003). Coffee (Coffea canephora). In:
Hamon P, Seguin M, Perrier X, Glaszmann JC (eds) Genetic diversity of cultivatedtropical plants. Science
Publishers Inc., Plymouth, pp 239–258.
Dutt, M., & J. W. Grosser (2010). An embryogenic suspension cell culture system for Agrobacterium-mediated
transformation of citrus. Plant Cell Reports 29, 1251-1260.

References
206
Edwards, D., and Batley, J. (2010). Plant genome sequencing: applications for crop improvement. Plant
Biotechnol J 8, 2-9.
Ellis, J. (1997). Advances in the molecular genetic analysis of the flax-flax rust interaction. Annu Rev
Phytopathol 35, 271-291.
Ellis, J.G., Lawrence, G.J., Luck, J.E., and Dodds, P.N. (1999). Identification of regions in alleles of the flax rust
resistance gene L that determine differences in gene-for-gene specificity. Plant Cell 11, 495-506.
Ellis, J., Dodds, P., and Pryor, T. (2000). Structure, function and evolution of plant disease resistance genes.
Current Opinion in Plant Biology, 278-284.
Ellis, J., Dodds, P., and Lawrence, G. (2007). Flax rust resistance gene specificity is based on direct resistance-
avirulence protein interactions. Annual Review of Phytopathology, 289-306.
Escobar, C., Rivera, L.F., Botero, D., Rozo, Y., M., R.L., Villamizar, M., S., R., Castro, H., Varzea, V., and
Cristancho, M. (2010). Draft genome sequence of the coffee rust (Hemileia vastatrix); Development of
molecular markers for diversity studies of the pathogen. Paper presented at: The 23rd International
Conference on Coffee Science (Bali, Indonesia, ASIC) p. 50.
Eskes, A. B. (1989). Resistance. In: Kushalappa AC and Eskes AB (Ed‘s.) Coffee rust: Epidemiology,
Resistance, and Management, CRC Press, Florida, pp 171-291.
Eskes, A., Mendes, M., and Robbs, C. (1991). Laboratory and field studies on parasitism of Hemileia vastatrix
with Verticillium lecanii and V. leptobactrum. Cafe Cacao the, 275-282.
Eskes, A.B. (2005). Phenotypic expression of resistance to coffee leaf rust and its possible realtionship with
durability. In Durable resistance to coffee leaf rust, L. Zambolim, E.M. Zambolim, and V.M.P. Várzea, eds.
(Viçosa, Universidade Federal de Viçosa), p. 540p.
Eskes, A. B. (1983). Incomplete resistance to coffee leaf rust Hemileia vastatrix. University of Wageningen.
PhD thesis.
Eskes, A.B. Resistance. In: Kushalappa, A.C.; EskeS, A.B. (Ed.). Coffee rust: epidemiology, resistance, and
management. Boca Raton: CRC Press, 1989. p.171-291.
Eskes, A. B., Hoosgstraten, J.G.J., Toma-Braghini, M. & Carvalho, A. (1990) Race specificity and inheritance of
incomplete to coffee leaf rust in some icatu coffee progenies de timor derivatives of Hibrido de Timor.
Euphytica 47,11-19.
Eskes, A. B., Mendes, M. D. L. and Robbs, C. F. (1991). Laboratory and field studies on parasitism of
Hemileian vastatrix with Verticillium lecanii and V. leptobactrum. Café Cacao Tea XXXV 4, 275-282.
Eskes, A. B. (2005) Phenotypic expression of resistance to coffee leaf rust and its possible relationship with
durability. In: Zambolim L, Zambolim EM, Várzea VMP (eds) Durable resistance to coffee leaf
rust.UFVVic¸osa,Brasil, pp 305–332.
Eskes, A., Leroy T. (2009). In: Wintgens Jean Nicolas (ed.). Coffee: growing, processing, sustainable
production: A guidebook for growers, processors, traders, and researchers. Weinheim: Wiley-VCH, p. 61-
90.
Etienne, H., and Bertrand, B. (2003). Somaclonal variation in Coffea arabica: effects of genotype and
embryogenic cell suspension age on frequency and phenotype of variants. Tree Physiology 23, 419-426.
Etienne, H. (2005). Protocol of somatic embryogenesis: Coffee (Coffea arabica L. and C. canephora P.). In
Protocols for somatic embryogenesis in woody plants (the Netherlands, Jain SM and Gupta PK), pp. 167-
179.

References
207
Etienne, H., Lashermes, P., Menéndez-Yuffá, A., De Guglielmo-Cróquer, Z., Alpizar, E., Sreenath, H. L. (2008).
Coffee. In: Kole C, Hall TC (eds) A Compendium of Transgenic Crop Plants, Volume 8, Plantation Crops,
Ornamentals and Turf Grasses, Blackwell Publishing, Oxford, UK, pp 57-84.
Etienne, H., Bertrand, B., Ribas, A., Lashermes, P., Malo, E., Alpizar, E., Bobadilla, R., Simpson, J., Dechamp,
E., Jourdan, I., Georget, F. (2010). Current application of coffe (Coffe arabica) somatic embryogenesis for
industrial propagation of elite heterozygous materials in Central America and Mexico and for routine
functional genomics: [Abstract]. In : IUFRO Working Party 2.09.02 : Somatic Embbryogenesis of Forest
Trees Conferences, August 19‐21, 2010, Suwon, Korea. Advances in somatic embryogenesis of trees and its
application for the future forests and plantations. s.l.: s.n.,p. 54‐55. IUFRO Working Party 2.09.02 : Somatic
Embyogenesis of Forest Tree Conference, 2010‐08‐19/2010‐08‐21, Suwon, Corée.
Fagerlind F (1937). Embryologische, Zytologische und Bestäubugsexperimentelle Studien in der Familie
Rubiaceae nebst Bermerkungen über Einige Polyphoiditatsprobleme. Acta Horti-Bergiani 11, 199-460.
Fagoaga, C., Rodrigo, I., Conejero, V., Hinarejos, C. , Tuset, J.J., Arnau, J., Pina J.A., Navarro L., Peña L.
(2001). Increased tolerance to Phytophthora citrophthora in transgenic orange plants constitutively
expressing a tomato pathogenesis related protein PR-5, Mol. Breed. 7, 175–185.
Fernandez, R., and Medendez (2003). Transient gene expression in secondary somatic embryos from coffee
tissues electroporated with the genes GUS and BAR. Electronic Journal of Biotechnology 6, 29-38.
Ferrier-Cana, E., Geffroy, V., Macadré, C., Creusot, F., Imbert-Bolloré, P., Sévignac, M., and Langin, T. (2003).
Characterization of expressed NBS-LRR resistance gene candidates from common bean. Theor Appl Genet
106, 251-261.
Feuillet, C., Travella, S., Stein, N., Albar, L., Nublat, A., and Keller, B. (2003). Map-based isolation of the leaf
rust disease resistance gene Lr10 from the hexaploid wheat (Triticum aestivum L.) genome. Proceedings of
the National Academy of Sciences of the United States of America 100, 15253-15258.
Fitch,W.M. (1970) Distinguishing homologous from analogous protein. Syst. Zool. 19, 99–113.
Fisher, D. (1968). Protein staining of ribboned open sections for light microscopy. Histochimie 16, 92-96.
Flachowsky H., Peil A., Sopanen T., Elo A., Hanke V (2007) Overexpression of BpMADS4 from silver birch
(Betula pendula Roth.) induces early-flowering in apple (Malus · domestica Borkh.) Plant Breeding 126,
137-145.
Flor, H. H. (1942) Inheritance of pathogenicity in Melampsora lini. Phytopathology 32, 653-669.
Flor, H. H. (1971). Current status of the gene-for-gene concept. Annu Rev Phytopathol 9, 275-296.
Ford, C., Fischer, L., Jones, S., Nigro, S., Makunga, N., and van Staden, J. (2005). Somatic embryogenesis in
Pinus patula. In Protocols for somatic embryogenesis in woody plants (the Netherlands, Jain SM and Gupta
PK), pp. 121-139.
Fritz-Laylin, L.K., Krishnamurthy, N., Tor, M., Sjolander, K.V., and Jones, J.D.G. (2005). Phylogenomic
analysis of the receptor-like proteins of rice and arabidopsis. Plant Physiology 138, 611-623.
Fourty C. (2009). Mise au point des conditions de cryoconservation des tissus embryogènes de caféier pour
appuyer les expérimentations de transformation génétique. BTSA ANABIOTEC, La Raque, Ecole
Supérieure, Lasbordes. juin-septembre 2009.
Fullner, K.J., Lara, J.C., and Nester, E.W. (1996). Pilus assembly by Agrobacterium T-DNA transfer genes.
Science (New York, NY) 273, 1107-1109.
Fullner, K.J., and Nester, E.W. (1996). Temperature affects the T-DNA transfer machinery of Agrobacterium
tumefaciens. Journal of Bacteriology 178, 1498-1504.

References
208
Galli, F. E. Manual de Fitopatologia - Doenças das Plantas Cultivadas, Editora Ceres, São Paulo. 1980, 600 p.
Ganal MW, Tanksley SD (1996). Recombination around the Tm2a and Mi resistance genes in different crosses
of Lycopersicon peruvianum. Theor Appl Genet 92, 101-108.
Geffroy, V., Macadre, C., David, P., Pedrosa-Harand, A., Sevignac, M., Dauga, C., and Langin, T. (2009).
Molecular analysis of a large subtelomeric nucleotide-binding-site-leucine-rich-repeat family in two
representative genotypes of the major gene pools of Phaseolus vulgaris. Genetics 181, 405-419.
Gimenez-Ibanez, S., and Rathjen, J.P. (2010). The case for the defense: plants versus Pseudomonas syringae.
Microbes Infect 12, 428-437.
Giri, C.C., Shyamkumar, B., and Anjaneyulu, C. (2004). Progress in tissue culture, genetic transformation and
applications of biotechnology to trees: An overview. Trees - Structure and Function 18, 115-135.
Goevarts, R. M. Ruhsam, L., Andersson, E., Robbrecht, D., Bridson, A., Davis, I., Schanzer, B., Sonké (2006).
World checklist of Rubiaceae. Royal Botanic Gardens, Kew. http://www.kew.org/wcsp/rubiaceae/.
Gomez-Lim, M.A., and Litz, R.E. (2004). Genetic transformation of perennial tropical fruits. In Vitro Cellular &
Developmental Biology-Plant 40, 442-449.
Gonçalves M.M. & Marcelino Rodrigues L (1976) Estudos sobre o café de Timor : II - Nota sobre as
possibilidades de produção do "Híbrido de Timor" no seu habitat /. - Lisboa : Missão de Estudos
Agronómicos do Ultramar, 1976. - 35 p. : il.. - (Comunicações ; 86).
Gouveia, M., Ribeiro, A., Varzea, V., and Rodrigues, C. (2005). Genetic diversity in Hemileia vastatrix based on
RAPD markers. Mycologia, 396-404.
Grace, L.J., Charity, J.A., Gresham, B., Kay, N. Walter, C. (2005). Insect-resistant transgenic Pinus radiata.
Plant Cell Reports 24, 103-111.
Grant, M. (1995). Structure of the Arabidopsis RPM1 gene enabling dual specificity disease resistance. Science
269, 843-846.
Haddad, F., Maffia, L., Mizubuti, E., and Teixeira, H. (2009). Biological control of coffee rust by antagonistic
bacteria under field conditions in Brazil. Biological Control, 114-119.
Hall, T.A. (1999). BioEdit: a user-friendly biological sequence alignment editor and analysis program for
Windows 95/98. Nucl Acids Symp Ser 41, 95-98.
Halpin, C., Thain, S. C., Tilston, E. L., Guiney, E., Lapierre, C., Hopkins D. (2007). Ecological impacts of trees
with modified lignin. Tree Genetics & Genomes 11, 101-110.
Hammond-Kosack KE, Jones JDG. (1996). Resistance gene-dependent plant defense responses. Plant Cell 8(10):
1773-1791.
Hammond-Kosack, K.E., and Jones, J.D.G. (1997). Plant Disease Resistance Genes. Annu Rev Plant Physiol
Plant Mol Biol 48, 575-607.
Hammond-Kosack, K., and Parker, J. (2003). Deciphering plant-pathogen communication: fresh perspectives for
molecular resistance breeding. Current Opinion in Biotechnology, 177-193.
Hammond-Kosack, K. E., and Kanyuka, K. (2007) Resistance genes (R genes) in plants. In: Encyclopedia of
Life Sciences. John Wiley & Sons, Ltd: Chichester http://www.els.net
Hasegawa, H. (2002). Efficient plant regeneration from protoplasts isolated from long-term, shoot primordia-
derived calluses of garlic. Journal of Plant Physiology 159, 449-452.

References
209
Hatanaka, T., Choi, Y.E., Kusano, T., and Sano, H. (1999). Transgenic plants of coffee Coffea canephora from
embryogenic callus via Agrobacterium tumefaciens-mediated transformation. Plant Cell Reports 19, 106-
110.
Hayashi, K., and Yoshida, H. (2009). Refunctionalization of the ancient rice blast disease resistance gene Pit by
the recruitment of a retrotransposon as a promoter. Plant Journal, 413-425.
Heath, M.C. (2000). Nonhost resistance and non-specific plant defenses. Curr Opin Plant Biol 3, 315-319.
Herrera, J.C., D'Hont, A., and Lashermes, P. (2007). Use of fluorescence in situ hybridization as a tool for
introgression analysis and chromosome identification in coffee (C. arabica L.). Genome 50, 619-626.
Herrera, P., Alvarado, A., Cortina, G., Combes, M., Romero, G., and Lashermes, P. (2009). Genetic analysis of
partial resistance to coffee leaf rust (Hemileia vastatrix Berk & Br.) introgressed into the cultivated Coffea
arabica L. from the diploid C-canephora species. Euphytica, 57-67.
Hert, D. G., Fredlake, C. P., Barron, A. E. (2008). Advantages and limitations of next-generation sequencing
technologies: A comparison of electrophoresis and non-electrophoresis methods. Electrophoresis 29, 4618-
4626.
Hily, J., and Liu, Z. (2009). A simple and sensitive high-throughput GFP screening in woody and herbaceous
plants. Plant Cell Rep 28, 493-501.
Holub, E.B. (2001). The arms race is ancient history in Arabidopsis, the wildflower. Nat Rev Genet 2, 516-527.
Horvath, B., Peszlen, I., Peralta, P., Kasal, B., Li, L. (2010) Effect of lignin genetic modification on wood
anatomy of aspen trees. IAWA J, 31, 29–38.
Hückelhoven, R. (2007). Cell wall-associated mechanisms of disease resistance and susceptibility. Annu Rev
Phytopathol 45, 101-127.
Hulbert, S.H., Webb, C.A., Smith, S.M., and Sun, Q. (2001). Resistance gene complexes: Evolution and
Utilization. Annual Review of Phytopathology 39, 285-312.
Hulbricht, L. (1938). Hybridization in Tradescantia III: the evidence of introgressive hybridization. American
Journal of Botany 25, 396–402.
Huang, L., Brooks, S., Li, W., Fellers, J., Nelson, J., and Gill, B. (2009). Evolution of new disease specificity at
a simple resistance locus in a crop-weed complex: reconstitution of the Lr21 Gene in wheat. Genetics, 595-
602.
Huo N, Lazo GR, Vogel JP, You FM, Ma Y, Hayden DM, Coleman- Derr D, Hill TA, Dvorak J, Anderson OD,
Luo MC, Gu YQ (2008) The nuclear genome of Brachypodium distachyon: analysis of BAC end
sequences. Funct Integr Genom 8, 135–147.
Hurst, L. (2002). The Ka/Ks ratio: diagnosing the form of sequence evolution. . Trends in Genetics 18, 486-489.
Hwang, C.F., Bhakta, A.V., Truesdell, G.M., Pudlo, W.M., and Williamson, V.M. (2000). Evidence for a role of
the N terminus and leucine-rich repeat region of the Mi gene product in regulation of localized cell death.
Plant Cell 12, 1319-1329.
Ibaraki, Y., and Kurata, K. (2001). Automation of somatic embryo production. Plant Cell and Organ Tissue
Culture 65, 179-199.
Imelfort, M., and Edwards, D. (2009). De novo sequencing of plant genomes using second-generation
technologies. Brief Bioinform 10, 609-618.

References
210
Innes, R.W., Ameline-Torregrosa, C., Ashfield, T., Cannon, E., Cannon, S.B., Chacko, B., Chen, N.W.G.,
Couloux, A., Dalwani, A., Denny, R., et al. (2008). Differential accumulation of retroelements and
diversification of NB-LRR disease resistance genes in duplicated regions following polyploidy in the
ancestor of soybean. Plant Physiology 148, 1740-1759.
Jain, S. (2006). An update Overview of Advances in somatic embryogenesis in forest trees. In Plantation
technology in tropical forest science, Springer, ed. (Tokyo), pp. 113-122.
Jebanathirajah, J.A., Peri, S., and Pandey, A. (2002). Toll and interleukin-1 receptor (TIR) domain-containing
proteins in plants: a genomic perspective. TRENDS in Plant Science 7, 388-391.
Jewell, E., Robinson, A., Savage, D., Erwin, T., Love, C.G., Lim, G.A.C., Li, X., Batley, J., Spangenberg, G.C.
and Edwards, D. (2006) SSRPrimer and SSR taxonomy tree: Biome SSR discovery. Nucleic Acids Res. 34,
W656–W659.
Johnson R (1981). Durable resistance: definition of, genetic control, and attainment in plant breeding.
Phytopathology, 71:567-568.
Jones, D.A., and Jones, J.D.G. (1997). The role of leucine-rich repeat proteins in plant defenses. Adv Bot Res
24, 90 - 167.
Jones, D.A., Thomas, C.M., Hammond-Kosack, K.E., Balint-Kurti, P.J., and Jones, J.D.G. (1994). Isolation of
the tomato Cf-9 gene for resistance to Cladosporium fulvum by transposon tagging. Science 266, 789-793.
Jones, J.D.G., and Dangl, J.L. (2006). The plant immune system. Nature 444, 323-329.
Jordan, T., Schornack, S., and Lahaye, T. (2002). Alternative splicing of transcripts encoding Toll-like plant
resistance proteins - what's the functional relevance to innate immunity? Trends Plant Sci 7, 392 - 398.
Jube, S., and Borthakur, D. (2009). Development of an Agrobacterium-mediated transformation protocol for the
tree-legume Leucaena leucocephala using immature zygotic embryos. Plant Cell Tissue and Organ Culture
96, 325-333.
Kajava, A.V. (1998). Structural diversity of leucine-rich repeat proteins. J Mol Biol 277, 519-527.
Kajava, A. (2001). Review: Proteins with Repeated Sequence—Structural Prediction and Modeling. Journal of
Structural Biology 134, 132-144.
Kanazin, V., Marek, L., and Shoemaker, R. (1996). Resistance gene analogs are conserved and clustered in
soybean. Proceedings of the National Academy of Sciences of the United States of America, 11746-11750.
Karlin, S., and Altschul, S.F. (1993). Applications and statisstics for multiple high-scoring segments in
molecular sequences. Proc Natl Acad Sci USA 90, 5877-5877.
Kellis M, Birren BW, Lander ES: Proof and evolutionary analysis of ancient genome duplication in the yeast
Saccharomyces cereviseae. Nature 2004, 428:617-624.
Kim, H.K., Lee, S.K., Cho, J.I., Lee, S., An, G.H., Jwa, N.S., Kim, B.R., Cho, Y.C., Han, S.S., Bhoo, S.H.F., et
al. (2005). Characterization of rice mutants with enhanced susceptibility to rice blast. Mol Cells 20, 385-
391.
Kimura, M. 1983. The neutral theory of molecular evolution. Cambridge University Press, Cambridge, England.
King, J. L. and Jukes, T. H. (1969) Non-Darwinian evolution. Science 164, 788-798.
Kiraly, L., Barnaz, B., and Kiralyz, Z. (2007). Plant resistance to pathogen infection: Forms and mechanisms of
innate and acquired resistance. Journal of Phytopathology 155, 385-396.

References
211
Kobe, B., and Deisenhofer, J. (1993) Crystal structure of porcine ribonuclease inhibitor, a protein with leucine-
rich repeats, Nature 366, 751–756.
Kobe, B., and Deisenhofer, J. (1994) The leucine-rich repeat: A versatile binding motif, Trends Biochem. Sci.
19, 415–421.
Kobe, B. and Kajava, A. V. (2001) The leucine-rich repeat as a protein recognition motif. Curr. Opin. Struct.
Biol. 11, 725– 732.
Kondou, Y., Higuchi, M., and Matsui, M. (2010). High-Throughput Characterization of Plant Gene Functions by
Using Gain-of-Function Technology. Annu Rev Plant Biol. 61, 373-393.
Krishna, H., and Singh, S.K. (2007). Biotechnological advances in mango (Mangifera indica L.) and their future
implication in crop improvement — A review. Biotechnol Adv 25, 223-243.
Kruijt, M., Brandwagt B. F., and Wit, P. J. G. M. (2004). Rearrangements in the Cf-9 disease resistance gene
cluster of wild tomato have resulted in three genes that mediate Avr9 responsiveness. Genetics 168, 1655-
1663.
Krug CA (1934) Contribuição para o estudo da citologia do gênero Coffea. Campinas, Instituto Agronômico,
Boletim Técnico 11. pp.1-10.
Krug, C.A. and Mendes, J.E.T. (1940) Cytological observations in Coffea. J. Genet. 39, 189-203.
Krutovsky, K. V., Troggio, M., Brown, G. R., Jermstad, K. D., Neale, D. B. (2004) Comparative mapping in the
Pinaceae. Genetics 168, 447–461.
Kuang, H., Woo, S.S., Meyers, B.C., Nevo, E., and Michelmore, R.W. (2004). Multiple genetic processes result
in heterogeneous rates of evolution within the major cluster disease resistance genes in lettuce. Plant Cell
16, 2870-2894.
Kuang, H.H., Wei, F.S., Marano, M.R., Wirtz, U., Wang, X.X., Liu, J., Shum, W.P., Zaborsky, J., Tallon, L.J.,
Rensink, W., et al. (2005). The R1 resistance gene cluster contains three groups of independently evolving,
type I R1 homologues and shows substantial structural variation among haplotypes of Solanum demissum.
Plant Journal 44, 37-51.
Kuang, H., Caldwell, K. S., Meyers, B. C., and Michelmore, R.W. (2008). Frequent sequence exchanges
between homologs of RPP8 in Arabidopsis are not necessarily associated with genomic proximity. Plant
Journal 54, 69-80.
Kumar, V., Madhava Naidu, M., and Ravishankar, G.A. (2006a). Developments in coffee biotechnology—in
vitro plant propagation and crop improvement. Plant Cell, Tissue and Organ Culture 87, 49-65.
Kumar, V., Satyanarayana, K.V., Sarala Itty, S., Indu, E.P., Giridhar, P., Chandrashekar, A., and Ravishankar,
G.A. (2006b). Stable transformation and direct regeneration in Coffea canephora P ex. Fr. by
Agrobacterium rhizogenes mediated transformation without hairy-root phenotype. Plant Cell Reports 25,
214-222.
Kushalappa AC, Eskes AB (1989). Advances in coffee rust research. Annu Rev Phytopathol 27:503-531.
Lander, E. S., Green, P., Abrahamson, J., Bralow, A., Daly, M. J., Loincoln, S. E., Newburg, L. (1987). MAP
MAKER: An interactive computer package for constructing primary genetic linkage maps of experimental
and natural populations. Genomics 1, 174-181.
Lashermes, P., Cros, J., Marmey, P., Charrier, A. (1993). Use of random amplified DNA markers to analyse
genetic variability and relationships of Coffea species. Genetic Resources and Crop Evolution 40, 91–99.

References
212
Lashermes, P., Trouslot, P., Anthony, F., Combes, M. C., Charrier, A. (1996a). Genetic diversity for RAPD
markers between cultivated and wild accessions of Coffea arabica. Euphytica 87, 59–64.
Lashermes, P., Cros, J., Combes, M. C., Trouslot, P., Anthony, F., Hamon, S., Charrier, A. (1996b). Inheritance
and restriction fragment length polymorphism of chloroplast DNA in the genus Coffea L. Theoretical and
Applied Genetics 93, 626– 632.
Lashermes, P., Combes, M. C., Trouslot, P., Charrier, A. (1997). Phylogentic relationships of coffee-tree species
(Coffea L.) as inferred from ITS sequences of nuclear ribosomal DNA. Theoretical and Applied Genetics
94, 947–955.
Lashermes, P., Combes, M. C., Robert, J., Trouslot, P., D'hont, A., Anthony, F., Charrier, A. (1999). Molecular
characterisation and origin of the Coffea arabica L. genome. Mol Gen Genet 261, 259-266.
Lashermes, P., Andrzejewski, S., Bertrand, B., Combes, M. C., Dussert, S., Graziosi, G., Trouslot, P., Anthony,
F. (2000). Molecular analysis of introgressive breeding in coffee (Coffea arabica L.). Theoretical and
Applied Genetics 100, 139–146.
Lashermes, P., Combes, M. C., Prakash, N. S., Trouslot, P., Lorieux, M., Charrier, A. (2001). Genetic linkage
map of Coffea canephora: effect of segregation distortion and analysis of recombination rate in male and
female meiosis. Genome 44, 589-596.
Lashermes, P., Bertrand, B., Herve, E. (2009) Breeding Coffee (Coffea arabica) for Sustainable Production in
S.M. Jain, P.M. Priyadarshan (eds.), Breeding Plantation Tree Crops: Tropical Species, Springer Science
2009 Chapter 14, 525-543.
Lashermes, P., Combes, M.C., Ribas, A., Cenci, A., Mahe, L., and Etienne, H. (2010). Genetic and physical
mapping of the SH3 region that confers resistance to leaf rust in coffee tree (Coffea arabica L.). Tree
Genetics & Genomes 6, 973-980.
Lawrence, G.J., Finnegan, E.J., Ayliffe, M.A., and Ellis, J.G. (1995). The L6 gene for flax rust resistance is
related to the Arabidopsis bacterial resistance gene RPS2 and the tobacco viral resistance gene N. Plant Cell
7, 1195-1206.
Lawson, M.J., Jiao, J., Fan, W., and Zhang, L. (2009). A Pattern Analysis of Gene Conversion Literature.
Compar Funct Genom 2009, 1-12.
Leclercq, J., Lardet, L., Martin, F., Chapuset, T., Oliver, G., and Montoro, P. (2010). The green fluorescent
protein as an efficient selection marker for Agrobacterium tumefaciens-mediated transformation in Hevea
brasiliensis (Mull. Arg). Plant Cell Reports 29, 513-522.
Lee, S.-K., M.-Y. Song, Y.-S. Seo, H.-K. Kim, S. Ko, P.-J. Cao, J.-P. Suh, et al. (2009). Rice Pi5-mediated
resistance to Magnaporthe oryzae requires the presence of two coiled-coil-nucleotide-binding-leucine-rich
repeat genes. Genetics 181, 1627-1638.
Leeve, V., Garin, E., Klimaszewska, K., and Seguin, A. (1999). Stable genetic transformation of white pine
(Pinus strobus L.) after cocultivation of embryogenic tissues with Agrobacterium tumefaciens. Molecular
Breeding 5, 429-440.
Leipe, D.D., Koonin, E.V., and Aravind, L. (2004). STAND, a class of P-loop NTPases including animal and
plant regulators of programmed cell death: multiple, complex domain architectures, unusual phyletic
patterns, and evolution by horizontal gene transfer. In, pp. 1 - 28.
Leister, D. (2004). Tandem and segmental gene duplication and recombination in the evolution of plant disease
resistance genes. Trends in Genetics 20, 116-122.

References
213
Leroy J-F. (1980). Evolution et taxogenèse chez les Caféiers (Coffea L., Psilanthus Hook.f. et Nostolachma
Durand). Hypothèse sur leur origine. Compte Rendu Hedomadaire des Séances de l‘Académie des Sciences
Série D, Sciences Naturelles 29: 593–596.
Leroy, T., Henry, A.-M., Royer, M., Altosaar, I., Frutos, R., Duris, D., and Philippe, R. (2000). Genetically
modified coffee plants expressing the Bacillus thuringiensis cry 1Ac gene for resistance to leaf miner. Plant
Cell Reports 19, 382-385.
Levy AA, FeldmanM: Genetic and epigenetic reprogramming of the wheat genome upon allopolyploidization.
Biol J Linn Soc 2004, 82, 607-613.
Liberato, J. R. & Silva, M. C. (2006). Coffee Rust (Hemileia vastatrix) Pest and Diseases Image Library.
Updated on 10/1/2006 12:42:23 PM. Available online: http://www.padil.gov.au
Librado, P., and Rozas, J. (2009). DnaSP v.5 A software for comprehensive analysis of DNA polymorphism
data. Bioinformatics 25, 1451-1452.
Liu, L., Fan, X., Zhang, J., Yan, M., and Bao, M. (2009). Long-term cultured callus and the effect factor of high-
frequency plantlet regeneration and somatic embryogenesis maintenance in Zoysia japonica. In Vitro
Cellular & Developmental Biology - Plant 45, 673-680.
Liu, J., X. Liu, L. Dai and G. L. Wang. (2007). Recent progress in elucidating the structure function and
evolution of disease resistance genes in plants. J. Genet. Genomics 34, 765-776.
Lopez-Noguera, S., Petri, C., and Burgos, L. (2009). Combining a regeneration-promoting ipt gene and site-
specific recombination allows a more efficient apricot transformation and the elimination of marker genes.
Plant Cell Reports 28, 1781-1790.
Lotze, M.T., Zeh, H.J., Rubartelli, A., Sparvero, L.J., Amoscato, A.A., Washburn, N.R., DeVera, M.E., Liang,
X., Tor, M., and Billiar, T. (2007). The grateful dead: damage-associated molecular pattern molecules and
reduction/oxidation regulate immunity. Immunol Rev 220, 60-81.
Louarn, J. (1992) La fertilité des hybrides interspécifiques et les relations génomiques entre caféiers diploïdes
d‘origine africaine (Genre Coffea L. sous-genre Coffea). Thèse de Doctorat Université d‘ Orsay-Paris-Sud,
France.
Luck, J.E. (2000). Regions outside of the leucine-rich repeats of flax rust resistance proteins play a role in
specificity determination. Plant Cell 12, 1367-1377.
Lukasik, E., and Takken, F.L.W. (2009). STANDing strong, resistance proteins instigators of plant defence.
Current Opinion in Plant Biology 12, 427-436.
Luo, M. C., Thomas, C., You, F. M., Hsiao, J., Ouyang, S., Buell, C. R., Malandro, M., McGuire, P. E.,
Anderson, O. D., Dvorak, J. (2003), High-throughput fingerprinting of bacterial artificial chromosomes
using the snapshot labeling kit and sizing of restriction fragments by capillary electrophoresis. Genomics
82, 378–389.
Lupas, A., Van Dyke, M., and Stock, J. (1991). Predicting coiled coil from protein sequences. Science 252,
1162-1164.
Mackey, D., Holt, B.F., Wiig, A., and Dangl, J.L. (2002). RIN4 interacts with Pseudomonas syringae type III
effector molecules and is required for RPM1-mediated resistance in Arabidopsis. Cell 108, 743 - 754.
Mahé, L., Le Pierres, D., Combes, M., and Lashermes, P. (2007). Introgressive hybridization between the
allotetraploid Coffea arabica and one of its diploid ancestors, Coffea canephora, in an exceptional
sympatric zone in New Caledonia. Genome, 316-324.

References
214
Mahé L, Combes MC, Varzea VMP, Guilhaumon C, Lashermes P (2008). Development of sequence
characterized DNA markers linked to leaf rust (Hemileia vastatrix) resistance in coffee (Coffea arabica L.).
Molecular breeding 21: 105-113.
Mahfud, M. C., Mior Ahmad, Z. A, Meon, S. and Kadir, J. (2006) In vitro and in vivo tests for parasitism of
Verticillium psalliotae on Hemileia vastatrix Berk. and Br.(2006) Malaysian Journal of Microbiology, Vol
2(1) 2006, pp.46-50.
Malnoy, M., J. S. Venisse, e E. Chevreau. (2005). Expression of a bacterial effector, harpin N, causes increased
resistance to fire blight in Pyrus communis. Tree Genetics & Genomes 9, 41-49.
Malnoy, M., Xu, M., Borejsza-Wysocka, E., Korban, S. S., Aldwinckle, H. S. (2008) Two receptor-like genes,
Vfa1 and Vfa2, confer resistanceto the fungal pathogen Venturia inaequalis inciting apple scab disease.
Mol Plant Microbe Interact 21, 448–458.
Marra, M. A., Kucaba, T. A., Dietrich, N. L., Green, E. D., Brownstein, B., Wilson, R. K., McDonald, K. M.,
Hillier, L., McPherson, J., Waterston, R. (1997). High throughput fingerprint analysis of large-insert clones.
Genome Res 7, 1072-1084.
Marques DV, Bettencourt AJ (1979) Resistência à H. vastatrix numa população de Icatú. Garcia de Orta (Série
de Estudos Agronómicos) 6:19-24.
Martin, G. B. (1993). Map-based cloning of a protein kinase gene conferring disease resistance in tomato.
Science 262, 1432-1436.
Martin, G.B., Bogdanove, A.J., and Sessa, G. (2003). Understanding the functions of plant disease resistance
proteins. Annual Review of Plant Biology 54, 23-61.
Mauricio, R., Stahl, E. A., Korves, T., Tian, D., Kreitman, M., and Bergelson, J. (2003) Natural Selection for
Polymorphism in the Disease Resistance Gene Rps2 of Arabidopsis thaliana Genetics 163, 735–746.
Maurin, O., Davis, A. P., Chester, M., Mvungi, E. F., Jaufeerally-Fakim, Y., Fay, M. F. (2007). Towards a
phylogeny for Coffea (Rubiaceae): identifying well-supported lineages based on nuclear and plastid DNA
sequences. Ann Bot Lond 100, 1565–1583.
Mauro, M.C., Toutain, S., Walter, B., Pinck, L., Otten, L., CoutosThevenot, P., Deloire, A., and Barbier, P.
(1995). High efficiency regeneration of grapevine plants transformed with the GFLV coat protein gene.
Plant Science, 97-106.
Maximova, S., Miller, C., Antúnez de Mayolo, G., Pishak, S., Young, A., and Guiltinan, M.J. (2003). Stable
transformation of Theobroma cacao L. and influence of matrix attachment regions on GFP expression.
Plant Cell Reports 21, 872-883.
Maximova, S.N., Marelli, J.-P., Young, A., Pishak, S., Verica, J.A., and Guiltinan, M.J. (2006). Over-expression
of a cacao class I chitinase gene in Theobroma cacao L. enhances resistance against the pathogen,
Colletotrichum gloeosporioides. Planta 224, 740-749.
McDowell, J.M., Dhandaydham, M., Long, T.A., Aarts, M.G.M., Goff, S., Holub, E.B., and Dangl, J.L. (1998).
Intragenic recombination and diversifying selection contribute to the evolution of downy mildew resistance
at the RPP8 locus of Arabidopsis. Plant Cell 10, 1861-1874.
McDowell, J.M., and Woffenden, B.J. (2003). Plant disease resistance genes: recent insights and potential
applications. TRENDS in Biotechnology 21, 178-183.
McDowell, J. (2004). Convergent evolution of disease resistance genes. Trends in Plant Science, 315-317.
McDowell, J., and Simon, S. (2006). Recent insights into R gene evolution. Molecular Plant Pathology, 437-448.

References
215
McHale, L., Tan, X., Koehl, P., and Michelmore, R.W. (2006). Plant NBS-LRR proteins: adaptable guards.
Genome Biol 7, 212.
Meins, F., and Foster, R. (1985). Reversible, cell-heritable changes during the developement of tobacco pith
tissues. Dev Biol 108, 1-5.
Menéndez-Yuffá, A., Barry-Etienne, D., Bertrand, B., Georget, F., and Etienne, H. (2010). A comparative
analysis of the development and quality of nursery plants derived from somatic embryogenesis and from
seedlings for large-scale propagation of coffee (Coffea arabica L.). Plant Cell, Tissue and Organ Culture
(PCTOC).
Mettulio R, Rovelli P, Anthony F, Anzueto F, Lashermes P, et al. (1999). Polymorphic microsatellites in Coffea
arabica. Proc Intl Sci Colloquium Coffee 18, 344–347.
Meyers, B.C. (1998). The major resistance gene cluster in lettuce is highly duplicated and spans several
megabases. Plant Cell 10, 1817-1832.
Meyers, B.C., Dickerman, A.W., Michelmore, R.W., Sivaramakrishnan, S., Sobral, B.W., and Young, N.D.
(1999). Plant disease resistance genes encode members of an ancient and diverse protein family within the
nucleotide-binding superfamily. Plant J 20, 317 - 332.
Meyers, B., Kozik, A., Griego, A., Kuang, H., and Michelmore, R. (2003). Genome-wide analysis of NBS-LRR-
encoding genes in Arabidopsis. Plant Cell, 809-834.
Meyers BC, Galbraith DW, Nelson T, Agrawal V (2004) Methods for transcriptional profiling in plants. Be
fruitful and replicate. Plant Physiol 135, 637–652.
Meyers, B.C., Kaushik, S., and Nandety, R.S. (2005). Evolving disease resistance genes. Current Opinion in
Plant Biology 8, 129-134.
Michelmore, R.W., and Meyers, B.C. (1998). Clusters of resistance genes in plants evolve by divergent selection
and a birth-and-death process. Genome Res 8, 1113-1130.
Mindrinos, M., Katagiri, F., Yu, G.L., and Ausubel, F.M. (1994). The A. thaliana disease resistance gene RPS2
encodes a protein containing a nucleotide-binding site and leucine-rich repeats. Cell 78, 1089-1099.
Mishra, M.K., S., S.H.L., and S., S.C. (2002). Agrobacterium-mediated transformation of coffee: An assessment
of factors affecting gene transfer efficiency. Proceedings of Placrosym XV, 251-255.
Mondragon-Palomino, M., and Gaut, B. (2005). Gene conversion and the evolution of three leucine-rich repeat
gene families in Arabidopsis thaliana. Mol Biol Evol, 2444-2456.
Montoro, P., Etienne, H., and Carron, M. (1994). Embryogenèse somatique entretenue chez Hevea brasiliensis.
Revue de Cytologie et de Biologie Végétales - Le Botaniste 17, 113-119.
Montoro, P., Teinseree, N., Rattana, W., Kongsawadworakul, P., and Michaux-Ferriere, N. (2000). Effect of
exogenous calcium on Agrobacterium tumefaciens -mediated gene transfer in Hevea brasiliensis (rubber
tree) friable calli. Plant Cell Reports 19, 851-855.
Montoro, P., Lagier, S., Baptiste, C., Marteaux, B., Pujade-Renaud, V., Leclercq, J., and Alemanno, L. (2008).
Expression of the HEV2.1 gene promoter in transgenic Hevea brasiliensis. Plant Cell, Tissue and Organ
Culture 94, 55-63.
Monosi, B., Wisser, R., Pennill, L., and Hulbert, S. (2004). Full-genome analysis of resistance gene homologues
in rice. Theoretical and Applied Genetics, 1434-1447.
Moreno, C., Lazar, J., Jacob, H.J., and Kwitek, A.E. (2008). Comparative genomics for detecting human disease
genes. Advances in Genetics 60, 655-697.

References
216
Motoike, S.Y., Skirvin, R.M., Norton, M.A., and Otterbacher, A.G. (2001). Somatic embryogenesis and long
term maintenance of embryogenic lines from fox grapes. Plant Cell Tissue and Organ Culture, 121-131.
Muralidharan, E., and Mascarenhas, A. (1995). Somatic embryogenesis in Eucalyptus. In Somatic
embrryogenesis in woody plants, S. Jain, P. Gupta, and R. Newton, eds. (Netherlands, Kluver), pp. 23-40.
Murashige, T., and Skoog, F. (1962). A revised medium for rapid growth and bio assays with tobacco tissue
cultures. Physiol Plant 15, 473-497.
Mysore, K. (2004). Nonhost resistance: how much do we know? Trends in Plant Science 9, 97-104.
Nachman, M. W. (2002). Variation in recombination rate across the genome: evidence and implications. Current
Opinion in Genetics & Development 12, 657-663.
Navarro, L., Zipfel, C., Rowland, O., Keller, I., Robatzek, S., Boller, T., and Jones, J.D. (2004). The
transcriptional innate immune response to flg22. Interplay and overlap with Avr gene-dependent defense
response and bacterial pathogenesis. Plant Physiol 135, 1113 - 1128.
Nei, M. (1987). Molecular Evolutionary Genetics (New York, Columbia University Press).
Neu, C., Stein, N., Keller, B. (2002). Genetic mapping of the Lr20–Pm1 resistance locus reveals suppressed
recombination on chromosome arm 7AL in hexaploid wheat. Genome 45, 737-744.
Noel, L. (1999). Pronounced intraspecific haplotype divergence at the RPP5 complex disease resistance locus in
Arabidopsis. Plant Cell 11, 2099-2111.
Noir, S., Anthony, F., Bertrand, B., Combes, M. C., Lashermes, P. (2003) Identification of a major gene (Mex-1)
from Coffea canephora conferring resistance to Meloidogyne exigua in Coffea arabica. Plant Pathology 52,
97-103.
Noir, S., Patheyron, S., Combes, M.C., Lashermes, P., Chalhoub, B. (2004). Construction and characterisation of
a BAC library for genome analysis of the allotetraploid coffee species (Coffea arabica L.). Theor Appl
Genet 109, 225-230.
Noirot M, Poncet V, Barre P, Hamon P, Hamon S, Kochko A (2003). Genome size variations in diploid African
Coffea species. Ann Bot 92, 709–714.
Noreen, I.M.A., Kaptein, R., Sauer, R.T., and Boelens, R. (1999). The tetramerization domain of the Mnt
repressor consists of two right-handed coiled coils. Nat. Struct. Biol. 6, 755–759.
Noronha-Wagner H, Bettencourt AJ (1967). Genetic study of resistance of Coffea sp. to leaf rust. I. Identification
and behavior of four factors conditioning disease reaction in Coffea arabica to twelve physiologic races of
Hemileia vastatrix. Can. J. Bot. 45, 2021-2031.
Nudo, L.P., and Catap, E.S. Immunostimulatory effects of Uncaria perrottetii (A. Rich.) Merr. (Rubiaceae)
vinebark aqueous extract in Balb/C mice. J Ethnopharmacol.
Nürnberger, T., Brunner, F., Kemmerling, B. and Piater, L. (2004). Innate immunity in plants and animals:
striking similarities and obvious differences. Immunol. Rev. 198, 249–266.
Ogita S, Uefuji H, Yamaguchi Y, Sano H (2003). RNA interference: producing decaffeinated coffee plants.
Nature 423, 823.
Ogita, S., Uefuji, H., Morimoto, M., and Sano, H. (2004). Application of RNAi to confirm theobromine as the
major intermediate for caffeine biosynthesis in coffee plants with potential for construction of decaffeinated
varieties. Plant Mol Biol 54, 931-941.

References
217
Ohyanagi, T. and Matsushima, N. (1997). Classification of tandem leucine-rich repeats within a great variety of
proteins, FASEB J., 11, A949.
Orozco-Castillo, C., Chalmers, K. J., Waugh, R., Powell, W. (1994). Detection of genetic diversity and selective
gene introgression in coffee using RAPD markers. Theor Appl Genet 87, 934–940.
Orozco-Castillo, C., Chalmers, K. J., Powell, W., Waugh, R. (1996). RAPD and organelle specific PCR re-
affirms taxonomic relationships within the genus Coffea. Plant Cell Rep 15, 337–341.
Osborn, T. C., Pires, J. C., Birchler, J. A., Auger, D. L., Chen, Z. J., Lee, H-S., Comai, L., Madlung, A., Doerge,
R. W., Colot, V. et al. (2003). Understanding mechanisms of novel gene expression in polyploids. Trends
Genet 2003 19,141-147.
Paillard, M., Lashermes, P., Pétiard, V. (1996). Construction of a molecular linkage map in coffee. Theor Appl
Genet 93, 41–47.
Palloix, A., V. Ayme., B. Moury. (2009). Durability of plant major resistance genes to pathogens depends on the
genetic background, experimental evidence and consequences for breeding strategies. New Phytologist 183,
190-199.
Palmer, J.D., Soltis, D.E., Chase, M.W. (2004). The plant tree of life: an overview and some points of view.
American Journal of Botany 91, 1437-1445.
Palomino, C., Satovic, Z., Cubero, J., and Torres, A. (2006). Identification and characterization of NBS-LRR
class resistance gene analogs in faba bean (Vicia faba L.) and chickpea (Cicer arietinum L.). Genome,
1227-1237.
Pan, Q., Liu, Y., Budai-Hadrian, O., Sela, M., Carmel-Goren, L., Zamir, D., and Fluhr, R. (2000a). Comparative
genetics of nucleotide binding site-leucine rich repeat resistance gene homologues in the genomes of two
dicotyledons: tomato and Arabidopsis. Genetics 155, 309-322.
Pan Q, Wendel J, Fluhr R (2000b). Divergent evolution of plant NBS-LRR resistance gene homologues in dicot
and cereal genomes. J Mol Evol 50, 203-213.
Parker, J.E. (1997). The Arabidopsis downy mildew resistance gene RPP5 shares similarity to the toll and
interleukin-1 receptors with N and L6. Plant Cell 9, 879-894.
Parasharami, V. A., Naik, V.B., von Arnold, S., Nadgauda, R.S., Clapham, D.H. (2006) Stable transformation of
mature zygotic embryos and regeneration of transgenic plants of chair pine (Pinus roxburghii Sarg.). Plant
Cell Reports 24, 708-714.
Parniske, M., and Jones, J.D. (1999). Recombination between diverged clusters of the tomato Cf-9 plant disease
resistance gene family. Proc Natl Acad Sci USA 96, 5850-5855.
Parniske, M., Hammond-Kosack, K. E., Golstein, C., Thomas, C. M., Jones, D. A., Harrison, K., Wulff, B. B,
Jones, J. D. (1997). Novel disease resistance specificities result from sequence exchange between tandemly
repeated genes at the Cf-4/9 locus of tomato. Cell 91, 821-832.
Paterson, A. H., Bowers, J. E., Bruggmann, R., Dubchak, I., Grimwood, J., Gundlach, H., Haberer, G., Hellsten,
U., Mitros, T., Poliakov, A., et al. (2009). The Sorghum bicolor genome and the diversification of grasses.
Nature 457, 551-556.
Pedley, K. F., and Martin, G. B. (2003). Molecular basis of Pto-mediated resistance to bacterial speck disease in
tomato. Annu Rev Phytopathol 41, 215-243.
Pena, L., M. Martin–Trillo, J. Juarez, J.A. Pina, L. Navarro, and J.M. Martinez–Zapater. (2001). Constitutive
expression of Arabidopsis LEAFY or APETELA1 genes in citrus reduces their generation time. Nat.
Bioltechnol. 19, 263–267.

References
218
Penuela, S., Danesh, D., and Young, N.D. (2002). Targeted isolation, sequence analysis, and physical mapping
of nonTIR NBS-LRR genes in soybean. Theoretical and Applied Genetics 104, 261-272.
Pérez-Clemente, R.M., Pérez-Sanjuán, A., García-Férriz, L., Beltrán, J.-P., and Cañas, L.A. (2004). Transgenic
peach plants (Prunus persica L.) produced by genetic transformation of embryo sections using the green
fluorescent protein (GFP) as an in vivo marker. Molecular Breeding 14, 419-427.
Peters, J. L., Cnudde, F., Gerats, T. (2003). Forward genetics and map-based cloning approaches. Trends in Plant
Science 8, 484-491.
Petri, C., and Burgos, L. (2005). Transformation of fruit trees. Useful breeding tool or continued future prospect?
Transgenic Research 14, 15-26.
Petri, C., Wang H., Alburquerque, N., Faize, M., Burgos, L. (2008). Agrobacterium-mediated transformation of
apricot (Prunus armeniaca L.) leaf explants. Plant Cell Reports 27, 1317-1324.
Pflieger, S., Lefebvre, V., and Causse, M. (2001). The candidate gene approach in plant genetics: a review.
Molecular Breeding, 275-291.
Pierik, R. (1997). In vitro culture of higher plant (Boston, Kluver academic publisher).
Pniewski, T., Kapusta, J., and Płucienniczak, A. (2006). Agrobacterium-mediated transformation of yellow lupin
to generate callus tissue producing HBV surface antigen in a long-term culture. Journal of Applied Genetics
47, 309-318.
Porter, B., Paidi, M., Ming, R., Alam, M., Nishijima, W., and Zhu, Y. (2009). Genome-wide analysis of Carica
papaya reveals a small NBS resistance gene family. Molecular Genetics and Genomics, 609-626.
Polák, J., Pívalová, J., Kundu, J.K., Jokes, M., Scorza, R., Ravelonandro, M. (2008) Behaviour of transgenic
plum pox virus-resistant Prunus domestica l. clone c5 grown in the open field under a high and permanent
infection pressure of the PPV-REC strain Journal of Plant Pathology, 90, 33-36.
Prakash, N. S., Combes, M. C., Naveen, K. S., Lashermes, P. (2002). AFLP analysis of introgression in coffee
cultivars (Coffea arabica L.) derived from a natural interspecific hybrid. Euphytica 124, 265-271.
Prakash, N.S., Marques, D.V., Varzea, V.M.P., Silva, M.C., Combes, M.C., and Lashermes, P. (2004).
Introgression molecular analysis of a leaf rust resistance gene from Coffea liberica into C. arabica L.
Theoretical and Applied Genetics 109, 1311-1317.
Prakash, N. S., Combes, M. C., Dussert, S., Naveen, S., Lashermes, P. (2005a). Analysis of genetic diversity in
Indian robusta coffee genepool (Coffea canephora) in comparison with a representative core collection
using SSRs and AFLPs. Genetic Res Crop Evol 52, 333–343.
Prakash, N. S., Ganesh, D., Bhat, S. S. (2005b). Population dynamics of coffee leaf rust (Hemileia vastatrix) and
recent advances in India. In: Zambolim L, Zambolim E and Várzea VMP (ed) Durable resistance to coffee
leaf rust, Universidade Federal de Viçosa, Brasil, pp 411-442.
Prakash, M. G., and K. Gurumurthi. (2008). Genetic transformation and regeneration of transgenic plants from
precultured cotyledon and hypocotyl explants of Eucalyptus tereticornis Sm. using Agrobacterium
tumefaciens. In Vitro Cellular & Developmental Biology - Plant 45, 429-434.
Rafalski, J. A. (2002). Novel genetic mapping tools in plants: SNPs and LD-based approaches. Plant Sci 162,
329-333.
Rafalski, J. A. (2010). Association genetics in crop improvement. Current Opinion in Plant Biology 13, 174-180.
Raina, S. N., Mukai, Y., Yamamoto, M. (1998). In situ hybridization identifies the diploid progenitor species of
Coffea arabica (Rubiaceae). Theor Appl Genet 97, 1204–1209.

References
219
Rairdan, G.J., and Moffett, P. (2006). Distinct domains in the ARC region of the potato resistance protein Rx
mediate LRR binding and inhibition of activation. Plant Cell 18, 2082-2093.
Ramachandran, M., Srinivasan, C. S. (1979). Four generations of selection for resistance to race I of leaf rust in
arabica cv. S.288 x ‗Kents‘. Indian Coffee 43,159 -161.
Ramiro, D., Escoute, J., Petitot, A., Nicole, M., Maluf, M., and Fernandez, D. (2009). Biphasic haustorial
differentiation of coffee rust (Hemileia vastatrix race II) associated with defence responses in resistant and
susceptible coffee cultivars. Plant Pathology, 944-955.
Rao, H.Y., Wu, N.F., Huang, M.R. (2001). Two insect-resistance genes were transferred into poplar hybrid and
transgenic poplar showed insect-resistance. Mol Breed Woody Plants 5, 239–245.
Rensing, S. A., Lang, D., Zimmer, A. D., Terry, A., Salamov et al. (2008). The Physcomitrella genome reveals
evolutionary insights into the conquest of land by plants. Science 319, 64-69.
Ribas, A.F., Kobayashi, A.K., Pereira, L.F.P., and Vieira, L.G.E. (2005). Genetic transformation of Coffea
canephora by particle bombardment. Biologia Plantarum 49, 493-497.
Ribas, A. F., Kobayashi, A. K., Pereira, L. F. P., Vieira, L. G. E. (2006a). Production of herbicide-resistance
coffee plants (Coffea canephora L.) via Agrobacterium tumefaciens-mediated transformation. Braz Arc
Biol Technol 49, 11–19.
Ribas, A.F., Pereira, L.F.P., and Vieira, L.G.E. (2006b). Genetic transformation of coffee. Brazilian Journal of
Plant Physiology 18, 83-94.
Richly, E., Kurth, J., and Leister, D. (2002). Mode of amplification and reorganization of resistance genes during
recent Arabidopsis thaliana evolution. Mol Biol Evol 19, 76 - 84.
Richter, T. E., Pryor, A. J., Bennetzen, J. L., Hulbert, S. H. (1995). New rust resistance specificities associated
with recombination at the Rp1 complex in maize. Genetics 141, 373–381.
Richter, T.E., and Ronald, P.C. (2000). The evolution of disease resistance genes. Plant Molecular Biology 42,
195-204.
Rijo L, Vasconcelos MI (1984). Formação de calose e lenhina em combinações incompatíveis Coffea spp. - H.
vastatrix. In: Simpósio sobre Ferrugens do Cafeeiro, Oeiras, Portugal, pp.269-279.
Rivillas, O. C. A., Caycedo, J. E. L., Vallejo, L. F. G. (1999). Recomendaciones para el manejo de la roya del
cafeto en Colombia. Bol. Téc. Cenicafé 19, 36 p.
Robbrecht, E., Puff, C. (1986). A survey of the Gardenieae and related tribes (Rubiaceae). Bot Jarb Syst 108,
63–137.
Robbrecht, E. (1988). Tropical woody Rubiaceae. Opera Bot Belg 1, 1–271.
Robbrecht, E., Manen, C. F. (2006). The major evolutionary lineages of the coffee family (Rubiaceae,
angiosperms). Syst Geogr Plants 76, 85–146.
Robinson, A.J., Love, C.G., Batley, J., Barker, G. and Edwards, D. (2004). Simple sequence repeat marker loci
discovery using SSR primer. Bioinformatics, 20, 1475–1476.
Rodrigues Jr, C. J., Bettencourt, A. J., Lopes, J. (1965). Study of the physiologic specialization of the coffee rust
H. vastatrix and selection of coffee clones for the establishment of a standard range of differential hosts for
this rust. In: Progress report 1960-65, pp.121-27. Coffee Rusts Research Center, Oeiras, Portugal.
Rodrigues Jr, C. J., Bettencourt, A. J., Rijo, L. (1975). Races of the pathogen and resistance to coffee rust. Annu.
Rev. Phytopathol.13, 49-70.

References
220
Rodrigues, C., Medeiros, E., and Lewis, B. (1975). Relationship between a phytoalexin-like response in coffee
leaves (Coffea arabica L) and compatibility With Hemileia vastatrix Berk and Br. Physiological Plant
Pathology, 35-41.
Rodrigues Jr, C. J. (1990). Coffee Rusts: history, taxonomy, morphology, distribution and host resistance.
Fitopatol. Bras. 15, 5-9.
Rodrigues Jr, C. J., Várzea, V. M. P., Medeiros, E. (1992). Evidence for the resistance of physiological races of
Colletotrichum coffeanum Noack sensu Hindorf. Kenya Coffee 57, 1417-1420.
Rodrigues Jr, C. J., Várzea, V. M. P., Godinho, I. L., Palma, S., Rato, R. C. (1993) New physiologic races of
Hemileia vastatrix In: Proceedings of the 15th International Conference on Coffee Science (ASIC),
Montpellier, France, pp 318-321.
Rodrigues Jr, C. J., Várzea, V., Silva, M. C., Guerra-Guimarães, L., Rocheta, M., Marques, D. V. (2000) Recent
advances on coffee leaf rust. In: Proceedings of the International Scientific Symposium on Coffee,
Bangalore, India, pp.179-193.Romantschuk, M. (1992). Attachment of Plant Pathogenic Bacteria to Plant
Surfaces. Annual Review of Phytopathology 30, 225-243.
Romero, G. G., Alvarado, G., Cortina H. A., G., Ligarreto G. M., Galeano, N. F., Herrera J. C. P. (2010). Partial
resistance to leaf rust (Hemileia vastatrix) in coffee (Coffea arabica L.): genetic analysis and molecular
characterization of putative candidate genes. Molecular Breeding 25,685-697.
Ronald, P.C. (1997). The molecular basis of disease resistance in rice. Plant Mol. Biol. 35, 179-186
Rose, L.E., Bittner-Eddy, P.D., Langley, C.H., Holub, E.B., Michelmore, R.W., and Beynon, J.L. (2004). The
maintenance of extreme amino acid diversity at the disease resistance gene, RPP13, in Arabidopsis
thaliana. Genetics 166, 1517-1527.
Rosillo, A. G., Acuna, J. R., Gaitan, A. L., de Pena, M. (2003). Optimized DNA delivery into Coffea arabica
suspension culture cells by particle bombardment. Plant Cell Tiss Org Cult 74, 75–79.
Rossi, M. (1998). The nematode resistance gene Mi of tomato confers resistance against the potato aphid. Proc
Natl Acad Sci USA 95, 9570-9754.
Salentijn, Elma M. J., Andy Pereira, Gerco C. Angenent, C. Gerard Linden, Frans Krens, Marinus J. M.
Smulders, e Ben Vosman (2007). Plant translational genomics: from model species to crops. Molecular
Breeding 20, 1-13.
Salmeron, J.M. (1996). Tomato Prf is a member of the leucine-rich repeat class of plant disease resistance genes
and lies embedded within the Pto kinase gene cluster. Cell 86, 123-133.
Sambrook, J., Fritsch, E. F., Maniatis, T. (1989). Molecular cloning: a laboratory manual. Cold Spring Harbor
Laboratory Press, Cold Spring Harbor, New York, USA.
Sanger, F., Nicklen, S., Coulson, A. R. (1977). DNA sequencing with chain-terminating inhibitors. Proc Natl
Acad Sci USA 74, 5463-5467.
Sangwan, R.S., Bourgeaois, Y., Braown, S., Vasseur, G., and Sangwan-Norreel, B. (1992). Characterization of
competent cells and early events of Agrobacterium-mediated genetic transformation in Arabidopsis
thaliana. Planta 188, 439-456.
Sato, S., Nakamura, Y., Kaneko, T., Asamizu, E., Kato, T., Nakao, M., Sasamoto, S., Watanabe, A., Ono, A.,
Kawashima, K., et al. (2008). Genome Structure of the Legume, Lotus japonicus. DNA Research 15, 227-
239.
Sawyer, S. (1989). Statistical test for detecting gene conversion. Mol Biol and Evolution 6, 526-553.

References
221
Schieber, E., Zentmyer, GA Distribution and spread of coffee rust in Latin America. In: FULTON, RH (ed.).
Coffee rust in the Américas. New York: 1984. p.1-14.
Schnable, P.S., Ware, D., Fulton, R.S., Stein, J.C., Wei, F., Pasternak, S., Liang, C., Zhang, J., Fulton, L.,
Graves, T.A., et al. (2009). The B73 Maize Genome: Complexity, Diversity, and Dynamics. Science 326,
1112-1115.
Schulze-Lefert, P., and Bieri, S. (2005). Recognition at a distance. Science 308, 506-508.
Schweizer, P. (2007). Nonhost resistance of plants to powdery mildew—New opportunities to unravel the
mystery. Physiol Mol Plant Pathol 70, 3-7.
Schwendiman, J., Pannetier, C., and Michaux-Ferrière, N. (1990). Histology of embryogenic formations during
in vitro culture of oil palm Elaeis guineensis Jacq. Oléagineux 45, 409-418.
Seah, S., Telleen, A.C., and Williamson, V.M. (2007). Introgressed and endogenous Mi-1 gene clusters in
tomato differ by complex rearrangements in flanking sequences and show sequence exchange and
diversifying selection among homologues. TAG Theoretical and Applied Genetics 114, 1289-1302.
Semple, C., and K. H. Wolfe. (1999). Gene duplication and gene conversion in the Caenorhabditis elegans
genome. J. Mol. Evol. 48, 555–564.
Seong, E.S., and Song, K.J. (2007). Factors affecting the early gene transfer step in the development of
transgenic ‗Fuji‘ apple plants. Plant Growth Regulation 54, 89-95.
Sera, G., Sera, T., Ito, D., de Azevedo, J., da Mata, J., and Doi, D. (2007). Resistance to leaf rust in coffee
carrying SH3 gene and others SH genes. Brazilian Archives of Biology and Technology, 753-757.
Sharma, V.K., Hansch, R.H., Mendel, R.R., and Schulze, J. (2005). Influence of picloram and thidiazuron on
high frequency plant regeneration in elite cultivars of wheat with long-term retention of morphogenecity
using meristematic shoot segments. Plant Breeding, 242-246.
Shan, L., He, P., Li, J., Heese, A., Peck, S.C., Nürnberger, T., Martin, G.B., and Sheen, J. (2008). Cell Host
Microbe 4, 17–27.
Shen, P. and Huang, H. V. (1986). Homologous recombination in Escherichia coli: dependence on substrate
length and homology. Genetics 112, 441-457.
Shen, K.A., Chin, D.B., Arroyo-Garcia, R., Ochoa, O.E., Lavelle, D.O., Wroblewski, T., Meyers, B.C., and
Michelmore, R.W. (2002). Dm3 is one member of a large constitutively-expressed family of NBS-LRR
encoding genes. Mol Plant Microbe Interact 15, 251-256.
Shirasu, K. and Schulze-Lefert, P. (2000). Regulators of cell death in resistance. Plant Molec Biol. 44, 371-385.
Shiu, S. H., Bleecker, A. B. (2001). Receptor-like kinases from Arabidopsis form a monophyletic gene family
related to animal receptor kinases. Proceedings of the National Academy of Sciences of the United States of
America 98, 10763-10768.
Silva, M., Nicole, M., Guerra-Guimaraes, L., and Rodrigues, C. (2002). Hypersensitive cell death and post-
haustorial defence responses arrest the orange rust (Hemileia vastatrix) growth in resistant coffee leaves.
Physiol Mol Plant Pathol, 169-183.
Silva, M. C., Várzea, V., Guerra-Guimarães, L., Azinheira, H. G., Fernandez, D., Petitot, A. S., Bertrand, B.,
Lashermes, P. and Nicole, M. (2006). Coffee resistance to the main diseases: leaf rust and coffee berry
disease Braz. J. Plant Physiol., 18, 119-147, 2006.

References
222
Silvestrini, M., Maluf, M., Silvarolla, M., Guerreiro, O., Medina, H., Vanini, M., Oliveira, A., de Gaspari-
Pezzopane, C., and Fazuoli, L. (2008). Genetic diversity of a Coffea Germplasm Collection assessed by
RAPD markers. Genetic Resources and Crop Evolution, 901-910.
Smith, S.M. (2004). Allelic and Haplotypic Diversity at the Rp1 Rust Resistance Locus of Maize. Genetics 167,
1939-1947.
Somssich, I.E. and Hahlbrock, K. (1998). Pathogen defence in plants - a paradigm of biological complexity.
Trends in Plant Science 3, 86-90.
Söndahl, M., Spahlinger, D., and Sharp, C. (1979). A histological study of high frequency and low frequency
induction of somatic embryos in cultured leaf explants of Coffea arabica L. Z Pflanzenphysiol 94, 101-108.
Song, W., Wang, G., Chen, L., Kim, H., Pi, L., Holsten, T., Gardner, J., Wang, B., Zhai, W., Zhu, L., et al.
(1995). A receptor kinase-like protein encoded by the rice disease resistance gene, Xa21. Science
(Washington) 270, 1804-1806.
Spiral J, Thierry C, Paillard M, Pétiard V (1993). Obtention de plantules de Coffea canephora Pierre (Robusta)
transformées par Agrobacterium rhizogenes. C. R. Acad Sci Paris 3,1–6.
Sreenivasan, M. S., Ram, A. S., Prakash, N. S. (1994). Search for new sources of resistance to coffee rust. In:
Central Coffee Research Institute (ed) Project report on ―Pathology and improvement of coffee for the main
diseases‖, a collaborative project of CRRC, Portugal and CCRI, India. CRRC/CCRI, Portugal/India, p 24.
Srinivasan, K. H., Narasimhaswamy, R. L. (1975). A review of coffee breeding work done at the Government
coffee experiment station, Balehonnur. Indian coffee 34, 311-321.
Staden, R., Judge, D. P, Bonfield, J. K. (1998). The Staden package, Methods in Molecular Biology 132, 115-
130.
Staden, R. (1996). The Staden Sequence Analysis Package. Mol Biotechnol 5, 233-241.
Stahl, E.A., Dwyer, G., Mauricio, R., Kreitman, M., and Bergelson, J. (1999). Dynamics of disease resistance
polymorphism at the RPM1 locus of Arabidopsis. Nature 400, 667-671.
Staskawicz, B. (2001) Genetics of plant-pathogen interactions specifying plant disease resistance. Plant Physiol.
125, 73-76.
Stirling, B., Newcombe, G., Vrebalov, J., Bosdet, I., Bradshaw, H. D. (2001). Suppressed recombination around
the MXC3 locus, a major gene for resistance to poplar leaf rust. Theor Appl Genet 103, 1129-1137.
Stoffelen, P., Noirot, M., Couturon, E., Bontems, S., De Block, P., Anthony, F. (2009) Coffea anthonyi Stoff. &
F. Anthony, a new selfcompatible Central African coffee species, closely related to an ancestor of C.
arabica L. Taxon 58, 133–140.
Strohm, M., Jouanin, L., Kunert, K.J., Pruvost, C., Polle, A., Foyer, C. H., Rennenberg H. (1995). Regulation of
glutathione synthesis in leaves of transgenic poplar (Populus tremula×P. alba) overexpressing glutathione
synthetase. The Plant Journal, 7, 141–145.
Sun, Q., Collins, N.C., Ayliffe, M., Smith, S.M., Drake, J., Pryor, T., and Hulbert, S.H. (2001). Recombination
between paralogues at the RP1 rust resistance locus in maize. Genetics, 423-438.
Swiderski, M.R., and Innes, R.W. (2001). The Arabidopsis PBS1 resistance gene encodes a member of a novel
protein kinase subfamily. Plant J 26, 101-112.
Talhinhas, P., Azinheira, H.G., Loureiro, A., Batista, D., Vieira, B., Pina-Martins, F., Tisserrant, E., Petitot, A.S.,
Paulo, O.S., Duplessis, S., et al. (2010). Overview of the functional virulent genome of the coffee leaf rust

References
223
pathogen Hemileia vastatrix. Paper presented at: The 23rd International Conference on Coffee Science
(Bali, Indonésia, ASIC), p. 51.
Tamura, K., Dudley, J., Nei, M., and Kumar, S. (2007). MEGA4: Molecular Evolutionary Genetics Analysis
(MEGA) software version 4.0. Mol Biol Evol 24, 1596-1599.
Tan, X., Meyers B.C., Kozik A., West M.A., Morgante, M., Clair D. A. S., Bent A. F and Michelmore R W
(2007). Global expression analysis of nucleotide binding site-leucine rich repeat-encoding and related genes
in Arabidopsis BMC Plant Biology 7:56.
Tan, B., Li, D.L., Xu, S.X., Fan, G.E., Fan, J., and Guo, W.W. (2009). Highly efficient transformation of the
GFP and MAC12.2 genes into precocious trifoliate orange (Poncirus trifoliata [L.] Raf), a potential model
genotype for functional genomics studies in Citrus. Tree Genetics & Genomes 5, 529-537.
Tang, W., and Newton, R.J. (2005a). Transgenic Christmas Trees Regenerated from Agrobacterium tumefaciens-
mediated Transformation of Zygotic Embryos Using the Green Fluorescence Protein as a Reporter.
Molecular Breeding 16, 235-246.
Tang, W., Charles, T.M., Newton, R. J. (2005b). Overexpression of the pepper transcription factor CaPF1 in
transgenic Virginia pine (Pinus virginiana Mill.) confers multiple stress tolerance and enhances organ
growth. Plant Molecular Biology 59, 603-617.
Tang, W., Newton, R.J., Lin, J., Charles, T.M. (2006). Expression of a transcription factor from Capsicum
annuum in pine calli counteracts the inhibitory effects of salt stress on adventitious shoot formation.
Molecular Genetics and Genomics 276, 242-253.
Tanurdznic, M., Vaughn, M.W., Jiang, H., Tae-Jin, L., Slotkin, R.K., Sosinski, B., Thompson, F., Doerge, R.W.,
and Martienssen, R.A. (2008). Epigenomic consequences of immortalized plant cell suspension culture.
PLoS Biol 6, 2880-2895.
Tereso, S., Miguel, C., Zoglauer, K., Valle-Piquera, C., and Oliveira, M.M. (2006). Stable Agrobacterium-
mediated transformation of embryogenic tissues from Pinus pinaster Portuguese genotypes. Plant Growth
Regulation 50, 57-68.
Thomas, C. M., Jones, D. A., Parniske, M., Harrison, K., Balint-Kurti, P. J., Hatzixanthis, K., and Jones J. D. G.
(1997). Characterization of the tomato Cf-4 gene for resistance to Cladosporium fulvum ldentifies
sequences that determine recognitional specificity in Cf-4 and Cf-9 The Plant Cell, Vol. 9, 2209-2224
Tian, D., Araki, H. Stahl, E. Bergelson J. and Kreitman M (2002). Signature of balancing selection in
Arabidopsis. Proc. Natl. Acad. Sci. USA 99, 11525–11530.
Tiffin, P., and Moeller, D. (2006). Molecular evolution of plant immune system genes. Trends in Genetics 22,
662-670.
Torto-Alalibo, T., Collmer, C.W., Lindeberg, M., Bird, D., Collmer, A., and Tyler, B.M. (2009). Common and
contrasting themes in host cell-targeted effectors from bacterial, fungal, oomycete and nematode plant
symbionts described using the Gene Ontology. BMC Microbiol 9 Suppl 1, S3.
Tränkner, C., Lehmann, S., Hoenicka, H., Hanke, M-V., Fladung, M., Lenhardt, D., Dunemann, F (2010). Over-
expression of an FT-homologous gene of apple induces early flowering in annual and perennial plants.
Planta 232, 1309-1324.
Tremblay, F., Iraqi, D., and Meskaoui, S. (2005). Protocolos somatic embryogenesis : Black spruce (Picea
mariana) (Mills.) B.S.P. In Protocols for somatic embryogenesis in woody plants (the Netherlands, Jain SM
and Gupta PK), pp. 59-68.
Trontin, J.F., Walter, C., Klimaszewska, K., Park, Y.S., and Lelu-Walter, M.A. (2007). Recent progress in
genetic transformation of four Pinus spp. Transgenic Plant Journal 1, 314-329.

References
224
Valledor, L., Hasbún, R., Meijón, M., Rodríguez, J.L., Santamaría, E., Viejo, M., Berdasco, M., Feito, I., Fraga,
M.F., J., C.M., et al. (2007). Involvement of DNA methylation in tree development and micropropagation
Plant Cell Tissue and Organ Culture 91, 75-86.
van der Biezen, E.A., and Jones, J.D.G. (1998). The NB-ARC domain: a novel signalling motif shared by plant
resistance gene products and regulators of cell death in animals. Curr Biol 8, 226-227.
van den Burg, H. A.,Westerink, N., Francoijs, K. J. et al. (2003). Natural disulfide bond-disrupted mutants of
AVR4 of the tomato pathogen Cladosporium fulvum are sensitive to proteolysis, circumvent Cf-4-mediated
resistance, but retain their chitin binding ability. Journal of Biological Chemistry 278, 27340–27346.
van der Hoorn, R. A. L., Roth, R., and De Wit, P. J. G. M. (2001). Identification of distinct specificity
determinants in resistance protein Cf-4 allows construction of a Cf-9 mutant that confers recognition of
avirulence protein AVR4. Plant Cell 13, 273-285.
van der vossen HAM (2001). Coffee breeding practices. In: Clarke RJ and Vitzthum OG (ed) Coffee. Recent
Developments – Agronomy, vol 1, Blackwell Science Ltd, London, pp184-201.
van der Hoorn, R., and Kamoun, S. (2008). From Guard to Decoy: A new model for perception of plant
pathogen effectors. Plant Cell, 2009-2017.
van der Hoorn, R.A., De Wit, P.J., and Joosten, M.H. (2002). Balancing selection favors guarding resistance
proteins. Trends Plant Sci 7, 67-71.
van der Vossen, E., van der Voort, J., Kanyuka, K., Bendahmane, A., Sandbrink, H., Baulcombe, D., Bakker, J.,
Stiekema, W., and Klein-Lankhorst, R. (2000). Homologues of a single resistance-gene cluster in potato
confer resistance to distinct pathogens: a virus and a nematode. Plant Journal, 567-576.
van der Vossen, H.A.M. (2005). State-of-art of developing durable resistance to biotrophic pathogens in crop
plants, such as coffee leaf rust. In Durable resistance to coffee leaf rust, L. Zambolim, E.M. Zambolim, and
V.M.P. Várzea, eds. (Viçosa, Universidade Federal de Viçosa), p. 540p.
van Geyt, J.P.C., and Jacobs, M. (1985). Suspension culture of sugar beet (Beta vulgaris L.) induction and
habituation of dedifferentiated and self regenerating cell lines. Plant Cell Rep 4, 66-69.
van Rijk, A. and Bloemendal, H. (2003). Molecular mechanisms of exon shuffling: illegitimate recombination.
Genetica, 118, 245–249.
Várzea VMP, Rodrigues Jr. CJ, Silva MC, Gouveia M, Marques DV, Guerra-Guimarães L, Ribeiro A (2002).
Resistência do cafeeiro à Hemileia vastatrix. In: Zambolim L (ed.), O Estado da Arte de Tecnologias na
Produção de Café, pp.297-320. Universidade Federal Viçosa, Departamento de Fitopatologia, Brasil.
Várzea VMP, Marques DV (2005) Population variability of Hemileia vastatrix vs coffee durable resistance. In:
Zambolim L, Zambolim E and Várzea VMP (ed) Durable resistance to coffee leaf rust. Universidade
Federal de Viçosa, Brasil, pp 53-74.
Verdeil, J.L., Hocher, V., Huet, C., Grosdemange, F., Escoute, J., Ferrière, N., and Nicole, M. (2001).
Ultrastructural changes in coconut calli associated with the acquisition of embryogenic competence. Ann
Bot 88, 9-18.
Vieira, L. G. E., Andrade, A. C., Colombo, C. A., Araujo, A. H., Metha, A. et al. (2006). Brazilian coffee
genome project: an EST-based genomic resource. Braz J Plant Physiol 18, 95–108.
Vishveshwara, S. (1974). Periodicity of Hemileia in arabica selection. Indian Coffee 38, 49–51.
Von Aderkas, P., and Bonga, J. (2000). Influencing micropropagation and somatic embryogenesis in mature
trees by manipulation of phase change, stress and culture environment. Tree Physiol 20, 921-928.

References
225
Vos, P., Simons, G., Jesse, T., Wijbrandi, J., Heinen, L., Hogers, R., Frijters, A., Groenendijk, J., Diergaarde, P.,
Reijans, M., Fierens-Onstenk, J., de Both, M., Peleman, J., Liharska, T., Hontelez, J., Zabeau, M. (1998).
The tomato Mi-1 gene confers resistance to both root-knot nematodes and potato aphids. Nat Biotech 16,
1365–1369.
Vogel, J.P., Garvin, D.F., Mockler, T.C., Schmutz, J., Rokhsar, D., Bevan, M.W., Barry, K., Lucas, S., Harmon-
Smith, M., Lail, K., et al. (2010). Genome sequencing and analysis of the model grass Brachypodium
distachyon. Nature 463, 763-768.
Xiao, S.Y., Emerson, B., Ratanasut, K., Patrick, E., O'Neill, C., Bancroft, I., and Turner, J.G. (2004). Origin and
maintenance of a broad-spectrum disease resistance locus in Arabidopsis. Mol Biol Evol 21, 1661-1672.
Xiao, S., Wang, W., and Yang, X. (2008). Evolution of Resistance Genes in Plants. In H. Heine (ed.), Innate
Immunity of Plants, Animals, and Humans. 1 Nucleic Acids and Molecular Biology 21.Springer-Verlag
Berlin Heidelberg, p.1-25
Xu, Y., Tao, X., Shen, B., Horng, T., Medzhitov, R., Manley, J.L., and Tong, L. (2000). Structural basis for
signal transduction by the Toll/interleukin-1 receptor domains. Nature 408, 111 - 115.
Xu, Q., Wen, X., and Deng, X. (2007). Phylogenetic and evolutionary analysis of NBS-encoding genes in
Rosaceae fruit crops. Molecular Phylogenetics and Evolution 44, 315-324.
Walters, C., Find, J., and Grace, L. (2005). Somatic embryogenesis and genetic transformation in Pinus radiata.
In Protocols for somatic embryogenesis in woody plants (the Netherlands, Jain SM and Gupta PK), pp. 167-
179.
Wang, G. L. (1998). Xa21D encodes a receptor-like molecule with a leucine-rich repeat domain that determines
race-specific recognition and is subject to adaptive evolution. Plant Cell 10, 765-779.
Warren, R. (1998). A mutation within the leucine rich repeat domain of the Arabidopsis disease resistance gene
RPS5 partially suppresses multiple bacterial and downy mildew resistance. Plant Cell 10, 1439-1452.
Wang, H., Yang, W., and Liu, D. (2006). Isolation and characterization of NBS-LRR resistance gene homology
sequences from wheat. Scientia Agricultura Sinica 39, 1558-1564.
Wei, F., Gobel-Werner, K., Morroll, S. M., Kurth, J., Mao. L., Wing, R. A., Leister, D., Schulze-Lefert, P.,
Wise, R. P. (1999). The Mla (powdery mildew) resistance cluster is associated with three NBS-LRR gene
families and suppressed recombination within a 240-kb DNA interval on chromosome 5S (1HS) of barley.
Genetics 153, 1929–1948.
Wessler, S., T.E. Bureau, and S.E. White (1995). LTR-retrotransposons and MITEs—important players in the
evolution of plant genomes. Curr. Opin. Genet. Dev. 5, 814–821.
Whitham, S., Dinesh-Kumar, S.P., Choi, D., Hehl, R., Corr, C., and Baker, B. (1994). The product of the tobacco
mosaic virus resistance gene N: similarity to Toll and the interleukin-1 receptor. Cell (Cambridge) 78, 1101-
1115.
Wicker, T., Yahiaoui, N., and Keller, B. (2007). Contrasting rates of evolution in Pm3 loci from three wheat
species and rice. Genetics 177, 1207-1216.
Wu, S.-J., Wang, H.-H., Li, F.-F., Chen, T.-Z., Zhang, J., Jiang, Y.-J., Ding, Y., Guo, W.-Z., and Zhang, T.-Z.
(2008). Enhanced Agrobacterium-mediated transformation of embryogenic calli of upland cotton via
efficient selection and timely subculture of somatic embryos. Plant Mol Biol Rep 26, 174-185.
Wulff, B.B., Thomas, C.M., Smoker, M., Grant, M., and Jones, J.D. (2001). Domain swapping and gene
shuffling identify sequences required for induction of an Avr-dependent hypersensitive response by the
tomato Cf-4 and Cf-9 proteins. Plant Cell 13, 255 - 272.

References
226
Wrigley G (1995). Coffee. In: Smartt J, Simmonds NW (eds) Evolution of crop plants. Longman ScientiÞc and
Technical, UK, pp 438-443.
Yao, J.-L., Cohen, D., Atkinson, R., Richardson, K., and Morris, B. (1995). Regeneration of transgenic plants
from the commercial apple cultivar Royal Gala. Plant Cell Reports 14, 407-412.
Yahiaoui, N., Brunner, S., and Keller, B. (2006). Rapid generation of new powdery mildew resistance genes
after wheat domestication. Plant Journal 47, 85-98.
Yaish, M.W.F., de Miera, L.E.S., and de la Vega, M.P. (2004). Isolation of a family off resistance gene analogue
sequences of the nucleotide binding site (NBS) type from Lens species. Genome 47, 650-659.
Yang, Y., Shah, J., and Klessig, D.F. (1997). Signal perception and transduction in plant defense responses.
Genes Dev 11, 1621-1639.
Yang, Z., Nielsen, R., Goldman, N., and Pedersen A-M. K. (2000). Codon-Substitution Models for
Heterogeneous Selection Pressure at Amino Acid Sites Genetics 155, 431–449
Yang, S., Zhang, X., Yue, J. X., Tian, D., and Chen, J. Q. (2008). Recent duplications dominate NBS-encoding
gene expansion in two woody species. Molecular Genetics and Genomics 280, 187-198.
Yevtushenko, D.P., and Misra, S. (2010). Efficient Agrobacterium-mediated transformation of commercial
hybrid poplar Populus nigra L. x P. maximowiczii A. Henry. Plant Cell Reports 29, 211-221.
Zambolim, L., Maciel-Zambolim, E. Vale, F.X.R., Pereira, A. A., Sakiyama, N. S. & Caixeta, E. T.
Physiologycal races of Hemileia vastatrix Berk. et Br. in Brazil – Physiological variability, current situation
and future prospects. In: Zambolim, L., Maciel-Zambolim, E. & Várzea, V.M.P. (Eds.) Durable Resistance
to Coffee Leaf Rust. Viçosa MG. Universidade Federal de Viçosa. 2005. pp. 75-98.
Zhang, X., Choi, J., Heinz, J., and Chetty, C. (2006). Domain-specific positive selection contributes to the
evolution of Arabidopsis Leucine-rich repeat receptor-like kinase (LRR RLK) genes. Journal of Molecular
Evolution, 612-621.
Zhou, T., Wang, Y., Chen, J.Q., Araki, H., Jing, Z., Jiang, K., Shen, J., and Tian, D. (2004). Genome-wide
identification of NBS genes in japonica rice reveals significant expansion of divergent non-TIR NBS-LRR
genes. Molecular Genetics and Genomics 271, 402-415.
Zhou, J., and Chai, J. (2008). Plant pathogenic bacterial type III effectors subdue host responses. Current
Opinion in Microbiology 11, 179-185.
Zhu, H., Cannon, S., Young, N., and Cook, D. (2002). Phylogeny and genomic organization of the TIR and non-
TIR NBS-LRR resistance gene family in Medicago truncatula. Molecular Plant-Microbe Interactions, 529-
539.
Zipfel, C., Robatzek, S., Navarro, L., Oakeley, E.J., Jones, J.D., Felix, G., and Boller, T. (2004). Bacterial
disease resistance in Arabidopsis through flagellin perception. Nature 428, 764 - 767.
Zipfel, C., and Felix, G. (2005). Plants and animals: a different taste for microbes? Curr Opin Plant Biol 8, 353-
360.
Zipfel, C., (2009). Early molecular events in PAMP-triggered immunity Current Opinion in Plant Biology 12
,414–420.
Zhu, Q., Dröge-Laser, W., Dixont, R. A., and Lambs C (1996). Transcriptional activation of plant defense genes
Current Opinion in Genetics & Development 1996 6, 624-630.

References
227
Zok, A., R. Oláh, é. Hideg, V. G. Horváth, P. B. Kós, P. Majer, Gy. Váradi, e E. Szegedi. (2009). Effect of
Medicago sativa ferritin gene on stress tolerance in transgenic grapevine. Plant Cell, Tissue and Organ
Culture (PCTOC) 12, 339-344.

Characterization of a locus of resistance to coffee leaf rust (Hemileia vastratrix) in coffee trees:
genomic organization, diversity and development of tools for functional gene validation
Coffee leaf rust (CLR) caused by the biotrophic fungus Hemileia vastatrix (Berk & Br.) is the most devastating
disease of Arabica coffee (Coffea arabica). Resistance to CLR in its allotetraploid species appears so far
conditioned primarily by 9 major resistance factors (SH1-SH9) either singly or in combination. Arabica varieties
harboring the SH3 resistant factor introgressed from a wild coffee species (C. liberica) have demonstrated
agronomical acceptable durable resistance in field conditions. The main objective of this work was to study the
genomic organization, evolution and diversity of SH3 locus in coffee and in parallel to develop tools for
functional gene validation of resistance candidate genes to CLR. As the first step, a physical map spanning the
SH3 region in C. arabica was constructed and the position of the resistance locus was delimited within an
interval of 550 kb. The region was completely sequenced in three coffee genomes, Ea and C
a subgenomes from
C. arabica and Cc genome from C. canephora. Sequence analysis revealed the presence of a variable number of
members CC subclass of NBS-LRR genes thatappeared to be exclusively present at this locus in C. arabica.
Comparative genomic analysis indicated that i) the origin of most of the SH3-CNL copies predates the divergence
between Coffea species ii) the ancestral SH3-CNL copy was inserted in the SH3 locus after the divergence
between Solanales and Rubiales lineages. Furthermore, duplications, deletions, gene conversion and positive
selection appeared as the main forces that drive SH3-CNL evolution. Different approaches have been undertaken
to clone candidate genes to CLR. In parallel, a highly efficient and reliable Agrobacterium tumefaciens-mediated
protocol was established for coffee. Transgenic plants containing one of the candidate gene were successful
produced and acclimated into the greenhouse. The preliminary bioassay against H. vastatrix was achieved. The
setting-up of efficient protocols for cloning resistance genes and for genetic transformation paves the way for
routine functional genomics in coffee. The better knowledge on CLR resistance gene diversity would allow
optimization of breeding schemes for durable resistance to this major coffee disease.
Key-words: Coffee, resistance gene, molecular evolution, molecular evolution, rust, genetic transformation
Charactérisation d’un locus de résistance à la rouille orangée (Hemileia vastatrix) chez le caféier
(Coffea arabica): organisation génomique, diversité et développement des outils pour la
validation fonctionnelle
La rouille orangée du caféier causée par le champignon biotrophe Hemileia vastatrix (Berk & Br.) est la maladie
la plus dévastatrice du caféier (Coffea arabica L.). La résistance à la rouille dans l'espèce allotétraploïde C.
arabica semble jusqu'à présent conditionnée principalement par 9 facteurs de résistance majeurs (SH1-SH9), seuls
ou en combinaison. Les variétés d'Arabica contenant le facteur de résistance SH3 introgressé d'une espèce de
caféier sauvage (C. liberica) ont démontré une résistance durable au champ. L'objectif principal de ce travail
était d'étudier l'organisation génomique, l'évolution et la diversité du locus SH3 chez le caféier et parallèlement
de développer des outils permettant la validation fonctionnelle des gènes candidats pour la résistance à la
rouille. Comme Une carte physique couvrant la région SH3 a tout d‘abord été construite chez C. arabica et la
position du locus de résistance a été délimitée dans un intervalle de 550 kb. La région a été séquencée chez trois
génomes de caféier, Ea et C
a sous-génomes de C. arabica et C
c génome de C. canephora. L‘analyse des
séquences a révélé la présence d'un nombre variable de membres de la sous-classe CC-NBS-LRR ; ces gènes
semblant être exclusivement présents à ce locus chez C. arabica. L‘analyse génomique comparative indique que
i) l'origine de la plupart des copies SH3-CNL est antérieure à la divergence entre les espèces de Coffea, ii) la
copie ancestrale SH3-CNL a été insérée dans le locus SH3 après la divergence entre les Solanales et Rubiales. En
outre, les mécanismes de duplication, délétion, conversion génique et de sélection positive semblent être les
principales forces qui déterminent l'évolution des membres de la famille SH3-CNL. Différentes approches ont été
entreprises pour le clonage des gènes candidats de résistance à la rouille. En parallèle, un protocole très efficace
de transformation par Agrobacterium tumefaciens a été développé chez le caféier. Des plantes transgéniques
contenant l'un des gènes R candidats ont été produites et acclimatées. Le bio-essai pour évaluer la résistance à H.
vastatrix a été mis au point. La mise en place de protocoles efficaces pour le clonage des gènes de résistance et la
transformation génétique ouvre la voie à la génomique fonctionnelle en routine chez le caféier. L‘amélioration
des connaissances sur la diversité des gènes de résistance à la rouille permettra l'optimisation des schémas de
sélection pour la résistance durable à cette maladie majeure du caféier.
Mot-clés: Caféier, gènes de résistance, évolution moléculaire, rouille, transformation génétique.