characterization of a biodegradable electrospun - T-Space
143
CHARACTERIZATION OF A BIODEGRADABLE ELECTROSPUN POLYURETHANE NANOFIBER SCAFFOLD SUITABLE FOR ANNULUS FIBROSUS TISSUE ENGINEERING by Masoud Yeganegi A thesis submitted in conformity with the requirements for the degree of Masters of Applied Science and Engineering Department of Materials Science and Engineering and Institute of Biomaterials and Biomedical Engineering University of Toronto © Copyright by Masoud Yeganegi 2009
Transcript of characterization of a biodegradable electrospun - T-Space

CHARACTERIZATION OF A BIODEGRADABLE ELECTROSPUN POLYURETHANE NANOFIBER SCAFFOLD SUITABLE FOR
ANNULUS FIBROSUS TISSUE ENGINEERING
by
Masoud Yeganegi
A thesis submitted in conformity with the requirements for the degree of Masters of Applied Science and Engineering
Department of Materials Science and Engineering and Institute of Biomaterials and Biomedical Engineering
University of Toronto
© Copyright by Masoud Yeganegi 2009

ii
Characterization of a Biodegradable Electrospun Polyurethane Nanofiber Scaffold Suitable for Annulus Fibrosus Tissue Engineering
Masoud Yeganegi
Masters of Applied Science and Engineering
Department of Materials Science and Engineering
and Institute of Biomaterials and Biomedical Engineering University of Toronto
2009
I: Abstract
The current study characterizes the mechanical and biodegradation properties of a
polycarbonate polyurethane (PU) electrospun nanofiber scaffold intended for use in the growth
of a tissue engineered annulus fibrosus (AF) intervertebral disc component. Both the tensile
strength and initial modulus of aligned scaffolds were higher than those of random scaffolds and
remained unaffected during a 4 week biodegradation study, suggesting a surface-mediated
degradation mechanism. The resulting degradation products were non-toxic. Confined
compressive mechanical force of 1kPa, was applied at 1Hz to in vitro bovine AF tissue grown on
the scaffolds to investigate the influence of mechanical force on AF tissue production, which was
found to decrease significantly at 72 hours relative to 24 hours, independent of any effects from
mechanical forces. Overall, the consistent rate of PU degradation, along with mechanical
properties comparable to those of native AF tissue, and the absence of cytotoxic effects, make
this polymer suitable for further investigation for use in tissue-engineering the AF.

iii
II. Acknowledgements
I would like to thank Dr. Jian Wang, Dr. Liu Yang, Dr. Meilin Yang, Dr. Amritha De Croos,
Douglas Holmyard, and Robert Temkin for their guidance throughout the various stages of this
Masters work. With the members of the Santerre and Kandel lab, I have enjoyed years of
cooperative team effort and will hopefully share many more years of continued friendship.
Most importantly, I’d like to take thank my dedicated mentors, Dr. Rita Kandel and Prof. Paul
Santerre. Their excellence in their respective fields, commitment to research, and attention to
detail has forged a standard in my mind that I will forever be pursuing. This unwavering
commitment has been balanced by their understanding toward several tragedies in my life in the
past few years. Their invaluable academic, professional and personal guidance will be greatly
missed. Thank you.
I’d like to dedicate this work to my dad, my sisters, and my mom, whom I recently came so
close to losing. You have encouraged me to achieve my best, and helped guide me toward that
goal. I will forever be grateful.
Masoud Yeganegi
Spring 2009

iv
II. Table of Contents
I: Abstract ..................................................................................................................................... ii
II. Acknowledgements ................................................................................................................ iii
II. Table of Contents ................................................................................................................... iv
III. Table of Figures ................................................................................................................... vii
IV. Table of Statistics................................................................................................................. xii
VI: Introduction ............................................................................................................................1
A. Annulus Fibrosus: ...............................................................................................................4
B. Mechanical Properties: .......................................................................................................4
C. Mechanobiology of Annulus Fibrosus: .............................................................................5
D. Degenerative Disc Disease: ...............................................................................................10
E. Tissue Engineering using Biodegradable Polymers: ......................................................12
F. Electrospinning: .................................................................................................................14
G. Proposed Work: ................................................................................................................15
H. References: .........................................................................................................................17
VII: Characterization of a Biodegradable Electrospun Polyurethane Nanofiber Scaffold: Mechanical Properties and Cytotoxicity .............................................................30
A. Introduction .......................................................................................................................32
B. Experimental Section ........................................................................................................34
1. Materials ........................................................................................................................34
2. Biodegradation Study ...................................................................................................36
3. Assessment of Mechanical Properties ..........................................................................36
4. Differential Scanning Calorimetry...............................................................................37
5. Evaluation of Degradation Products............................................................................37
6. Cytotoxicity Study .........................................................................................................38
7. Statistical analysis .........................................................................................................39
C. Results and Discussion ......................................................................................................39
D. Conclusion .........................................................................................................................43
E. Acknowledgements ............................................................................................................44
F. References: .........................................................................................................................45
G. Figures ................................................................................................................................51

v
VIII: Application of Dynamic Compressive Forces on Annulus Fibrosus Cells Grown on a Biodegradable Electrospun Nanofiber Scaffold ............................................61
A. Introduction .......................................................................................................................63
B. Experimental Section ........................................................................................................67
1. Scaffold fabrication ......................................................................................................67
2. Annulus fibrosus cell culture .......................................................................................68
3. Mechanical Stimulation ...............................................................................................68
4. AF cell morphology ......................................................................................................69
5. DNA content ..................................................................................................................70
6. Quantification of Proteoglycan and Collagen Synthesis and Proliferation ...............70
7. Statistical analysis .........................................................................................................71
C. Results ................................................................................................................................71
1. Effect of Mechanical Stimulation on AF Cells ...........................................................71
2. Effect of Mechanical Stimulation on AF Matrix Synthesis ........................................71
D. Discussion...........................................................................................................................72
E. Conclusions ........................................................................................................................73
F. Acknowledgements ............................................................................................................73
G. References: .........................................................................................................................75
H. Figures ................................................................................................................................83
IX: Conclusions and Future Work ............................................................................................90
Appendix A: Scaffold Preparation ............................................................................................95
A. Electrospinning .................................................................................................................95
1. Preparation of nanofibrous polycarbonate urethane scaffolds (random scaffolds) ......95
2. Preparation of nanofibrous polycarbonate urethane scaffolds (aligned scaffolds) ......96
3. Humidity Effects .............................................................................................................97
Appendix B: Biodegradation ...................................................................................................102
A. Reagent Preparation:........................................................................................................102
B. Standard Curve for CE Enzyme Activity ...........................................................................102
C. Calculating CE Activity .....................................................................................................103
D. Scaffold Thickness .............................................................................................................104
Appendix C: Mechanical Testing ............................................................................................105
Appendix D: Annulus Fibrosus Tissue Culture .....................................................................110

vi
A. Optimization of protocol for cell seeding on scaffolds: ....................................................112
Appendix E: Cytotoxicity Evaluation .....................................................................................116
A. Cytotoxic evaluation of degradation products was performed using the MTT and Live/Dead Assays: ...........................................................................................................116
1. MTT Assay ...................................................................................................................116
2. Live/Dead Assay ..........................................................................................................117
3. Live / Dead Assay Images: ...........................................................................................119
Appendix F: Statistics Tables ..................................................................................................124

vii
III. Table of Figures
Introduction
Figure 1. The anatomy of the human vertebral column and the intervertebral disc. (DePuy Spine) ......................................................................................................... 2
Figure 2. Mechanical loading of the disc results in a complex set of physical changes that may be transduced as mechanical stimuli to the cells. 4 .................................. 3
Figure 3. Current lumbar disc prostheses. SB Charite´ III (A). Prodisc II (B). Maverick (C). 67 .................................................................................................... 12
Figure 4. Stress induced strain along with material morphology and chemistry, can affect the environmental degradation of the material 84 ........................................ 14
Characterization of a Biodegradable Electrospun Polyurethane Nanofiber Scaffold: Mechanical Properties and Cytotoxicity
Figure 1. Scanning Electron Microscopy Images of aligned (a) and random (b) electrospun Polycarbonate Urethane Nanofiber Scaffolds. (Solution: 16 wt.% PU, injection rate: 0.5 ml/hr, potential difference: 18 kilovolts) ................. 51
Figure 2. Determination of Cholesterol Esterase (CE) Half Life. It was determined that the half life of CE in the presence of the aligned PU scaffolds was approximately 12 hours. Thus CE was added daily to adjust the enzyme activity (n = 3). ...................................................................................................... 52
Figure 3. Cumulative absolute mass loss (a) and cumulative relative mass loss (b) during biodegradation. Scaffolds were incubated in 100 units/ml CE over 4 weeks. Data are reported as mean ± standard error (n=6). (*) Absolute mass loss was found to increase significantly at every week (p<0.05) for all groups, while no statistical differences were observed between the scaffold groups within each week. Relative mass loss was found to increase significantly in the case of aligned scaffolds. ....................................................... 53
Figure 4. (a) Elastic Modulus and (b) Tensile Strength of the electrospun polyurethane nanofiber scaffolds following the pre-wetting (for one week in pH 7.0 PBS at 37ºC) and drying process, comparing non-ADO vs. ADO, as well as aligned vs. random scaffolds. Data are reported as mean ± standard error (n=6). ............................................................................................................ 54
Figure 5. Differential Scanning Calorimetry for as-made and pre-wet/dried samples for (a) aligned PU, (b) aligned PU+0.5%ADO and (c) random PU+0.5%ADO. Ti is the glass transition temperature for the polycarbonate soft segment. Tii indicates the onset of the soft segment melt phase. Tiii and

viii
Tiv are soft-segment melting transition temperatures. Tv indicates the hard-segment melting transition temperature. ............................................................... 55
Figure 6. a) Initial Modulus and (b) Tensile Strength of the electrospun polyurethane nanofiber scaffolds over four weeks of biodegradation in CE (100 units/ml) at 37ºC, PBS pH=7.0. Data are reported as mean ± standard error (n=6). Aligned scaffolds showed significantly higher modulus than random scaffolds at all time points. Ultimate stress of aligned polymers decreased in the first week of degradation, but remained stable thereafter. .............................. 56
Figure 7. Transmission Electron Microscopy of a non-soluble degradation product .......... 57
Figure 8. Assessing the cytotoxicity of PU degradation products: MTT Assay was used to evaluate potential cytotoxicity of various concentrations of (a) non-soluble and (b) soluble degradation products on bovine annulus fibrosus cells. The experiment was repeated 4 times (n=8 per condition). Data are expressed as mean ± SEM. H2O2 was used as a positive control. ........................ 58
Figure 9. Cell viability of PU degradation products: AF cells were incubated for 24 hours with various concentrations of (a) non-soluble and (b) soluble degradation products. Live/Dead Assay was used to assess cell viability. The number of dead cells were counted and expressed as percent of total number of cells. The experiment was repeated 4 times (n=8 per condition) and data expressed as mean±SEM. H2O2 was used as a positive control. ............ 59
Figure 10. Representatipve images of Live/Dead Assay of AF cells treated with (a) untreated negative control (media with carrier); (b) H2O2-treated positive control; (c) 0.1 wt. % non-soluble degradation products; (d) 100 volume% soluble degradation products ................................................................................ 60
Application of Dynamic Compressive Forces on Annulus Fibrosus Cells Grown on a Biodegradable Electrospun Nanofiber Scaffold
Figure 1. Scanning Electron Microscopy Images of Aligned (a) and Random (b) Electrospun Polycarbonate Urethane Nanofiber Scaffolds ................................... 83
Figure 2. Mechanical Stimulation Apparatus: The polymer is held in place over the porous titanium base by Tygon tubing, which in turn allows seeding media to remain in contact with the scaffold during cell seeding. At the time of mechanical stimulation, an agarose plug is placed above the cells to transmit the force through to the cells. ................................................................................ 84
Figure 3. SEM images of AF cells immediately (b), 6 hr (d); 24 hr (f); 72 hr (h) post-stimulation. The corresponding non-stimulated controls are denoted (a, c, e, g). Stimulated samples are more spread than control samples, particularly at early time points. ................................................................................................... 86

ix
Figure 4. DNA Content (µg) at various time points following mechanical stimulation (3 day Tissue, stimulated for 1hr at 1Hz and 1kPa). No significant changes were observed between the control and stimulated groups nor between the different time points (n=3, α=0.05). ...................................................................... 87
Figure 5. Evaluation of DNA content (a) and Thymidine Incorporation (b) at 24 hours and 72 hours post-stimulation. Controls were treated similarly but were not stimulated. The results are expressed as ± SEM (n=15, α=0.05).. No significant differences were detected between the two conditions. ...................... 88
Figure 6. Collagen (a) and Proteoglycan (b) synthesis at 24 hours and 72 hours post-stimulation. No significant changes were observed between the control and stimulated groups at either time point. However, there is a significant decrease in matrix accumulation, by 72 hours compared to 24 hours post-stimulation, for the combined group of stimulated and non-stimulated samples, (N=15, α=0.05). ..................................................................................... 89
Appendices
Figure A.1. Various instrumental apparatus (A to C) constructed to attempt to control humidity using a dehumidifier (full and partial air flow into a close/open enclosure) with corresponding SEM images of the resultant scaffolds. The effects of air current and increase in temperature (due to the heat carried from the pump by the dehumidified air), scaffold alignment and fiber diameter was found to be inferior under all conditions. ....................................... 98
Figure A.2. Final apparatus for regulating humidity to 30% R.H. The effects of air current were reduced by introducing a porous wooden base on which the electrospinning apparatus was placed. Further, a cooling reservoir was used to cool the dehumidified air from 50 ºC to 25ºC. ................................................. 99
Figure A.3. The humidity profile using the final equipment set-up. Humidity remains stabilized at the desired level (<30% R.H.) after approximately 10-20 minutes of starting the dehumidification. ........................................................... 100
Figure A.4. Scanning electron microscopy indicating processed fiber dimension, their alignment, and confirming that transverse fibers were not a significant occurrence ........................................................................................................... 101
Figure B.1. Changes in the thickness of scaffolds throughout the biodegradation process ... 104
Figure C.1. Weekly tensile testing of scaffolds: Each polymer sample was clamped on either side and tested using an Instron® model 8501 under a tensile strain of 10 mm/min to the breaking point. ....................................................................... 106
Figure C.2. Stress-strain curves for PU aligned scaffolds under tensile mechanical stress. The various curves are repeats of the same sample group. The initial

x
modulus was found by calculating the slope of the stress-strain curve in the initial elastic portion of each curve. Ultimate stress was also reported on. The ultimate strain is defined by the strain experienced by the sample at the ultimate stress...................................................................................................... 107
Figure C.3. Stress-strain curves for PU + 0.5% ADO aligned scaffolds under tensile mechanical stress: The various curves are repeats of the same sample group. The initial modulus was found by calculating the slope of the stress-strain curve in the initial elastic portion of each curve. Ultimate stress was also reported on. The ultimate strain is defined by the strain experienced by the sample at the ultimate stress. .............................................................................. 108
Figure C.4. Stress-strain curves for PU + 0.5% ADO random scaffolds under tensile mechanical stress: The various curves are repeats of the same sample group. The initial modulus was found by calculating the slope of the stress-strain curve in the initial elastic portion of each curve. Ultimate stress was also reported on. The ultimate strain is defined by the strain experienced by the sample at the ultimate stress. .............................................................................. 109
Figure D.1. Multiple discs were dissected from a single tail and the isolated AF cells were combined to provide sufficient cells for an experiment and improve consistency. Only outer AF cells were used in all experiments. ........................ 111
Figure D.2. Methods evaluated (A to D): (A) Cell suspension on the polymer scaffold alone, (B) Cell suspension on scaffold, supported by an agarose gel base, (C) cell suspension confined by a Teflon insert, (D) cell confinement through the use of Tygon tubing; (E) The seeding method selected for all subsequent experiments which consisted of using a Tygon tubing and a porous titanium disc and (F) the corresponding apparatus for mechanical stimulation of tissue. ........................................................................................... 113
Figure D.3. SEM images at low (A) and higher magnification (B) showing scaffolds seeded at 0.8 million cells / cm2. This density produced cellular layers, where cell-cell contact dominated cell-polymer contact. It was therefore decided to reduce cell seeding density to 0.8 million cells / cm2 ....................... 114
Figure D.4. Percent cell attachment to determine optimal seeding density: DNA content was measured 24 hours after seeding. The attachment level dropped significantly at the highest seeding density. The lower seeding density of 0.8 million cells / cm2 was chosen for subsequent mechanical stimulation studies (N = 6 per condition). ............................................................................. 115
Figure E.1. MTT Optimization: Absorbance vs. Cell Number vs. Incubation Period .......... 118
Figure E.2. Representative images of Live/Dead assay of AF Cells incubated for 24 hours (37 ºC, 5% CO2): in either (A) F12 Ham’s Media containing 5% FBS (negative control); or (B) Ham’s F12 Media containing 0.01 wt% H2O2 (Positive Control) ................................................................................................ 119

xi
Figure E.3. Live/Dead Assay: Photomicrograph of AF cells subjected to Non-Soluble Degradation Products of PU aligned polymers at various concentrations [(A) 0.001 wt. %, (B) 0.005 wt. %, (C) 0.01 wt. %, (D) 0.025 wt. %, (E) 0.05 wt. %, or (F) 0.1 wt. % (g/100mL)] ............................................................ 120
Figure E.4. Live/Dead Assay: Photomicrograph of AF cells subjected to Non-Soluble Degradation Products of PU + 0.05% ADO aligned polymers at various concentrations [(A) 0.001 wt. %, (B) 0.005 wt. %, (C) 0.01 wt. %, (D) 0.025 wt. %, (E) 0.05 wt. %, or (F) 0.1 wt. % (g/100mL)] ........................................... 121
Figure E.5. Live/Dead Assay: Photomicrograph of AF cells subjected to Buffer Soluble Degradation Products of PU aligned polymers at various concentrations [(A) 20 %, (B) 40 %, (C) 50 %, (D) 60 %, (E) 80 %, (F) 100 % (percent by volume)] .............................................................................................................. 122
Figure E.6. Live/Dead Assay: Photomicrograph of AF cells subjected to Buffer Soluble Degradation Products of PU + 0.05% ADO aligned polymers at various concentrations [(A) 20 %, (B) 40 %, (C) 50 %, (D) 60 %, (E) 80 %, (F) 100 % (percent by volume)] ...................................................................................... 123
xii
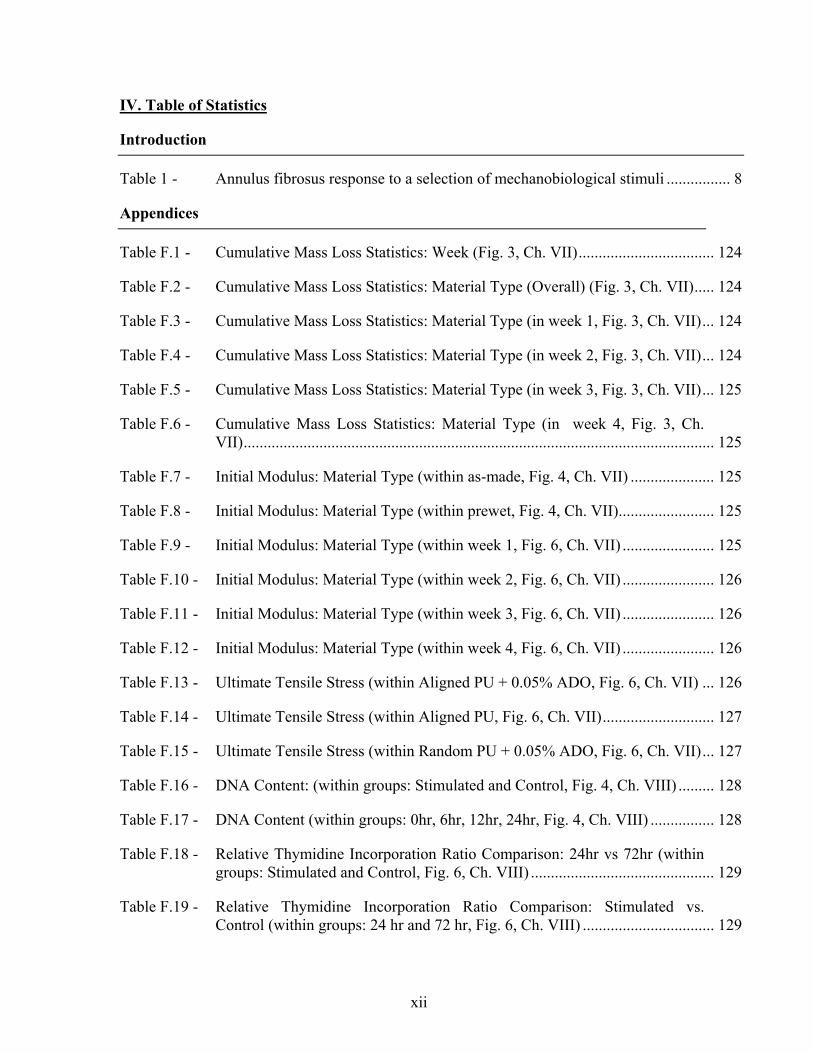
IV. Table of Statistics
Introduction
Table 1 - Annulus fibrosus response to a selection of mechanobiological stimuli ................ 8
Appendices
Table F.1 - Cumulative Mass Loss Statistics: Week (Fig. 3, Ch. VII) .................................. 124
Table F.2 - Cumulative Mass Loss Statistics: Material Type (Overall) (Fig. 3, Ch. VII) ..... 124
Table F.3 - Cumulative Mass Loss Statistics: Material Type (in week 1, Fig. 3, Ch. VII) ... 124
Table F.4 - Cumulative Mass Loss Statistics: Material Type (in week 2, Fig. 3, Ch. VII) ... 124
Table F.5 - Cumulative Mass Loss Statistics: Material Type (in week 3, Fig. 3, Ch. VII) ... 125
Table F.6 - Cumulative Mass Loss Statistics: Material Type (in week 4, Fig. 3, Ch. VII) ...................................................................................................................... 125
Table F.7 - Initial Modulus: Material Type (within as-made, Fig. 4, Ch. VII) ..................... 125
Table F.8 - Initial Modulus: Material Type (within prewet, Fig. 4, Ch. VII) ........................ 125
Table F.9 - Initial Modulus: Material Type (within week 1, Fig. 6, Ch. VII) ....................... 125
Table F.10 - Initial Modulus: Material Type (within week 2, Fig. 6, Ch. VII) ....................... 126
Table F.11 - Initial Modulus: Material Type (within week 3, Fig. 6, Ch. VII) ....................... 126
Table F.12 - Initial Modulus: Material Type (within week 4, Fig. 6, Ch. VII) ....................... 126
Table F.13 - Ultimate Tensile Stress (within Aligned PU + 0.05% ADO, Fig. 6, Ch. VII) ... 126
Table F.14 - Ultimate Tensile Stress (within Aligned PU, Fig. 6, Ch. VII) ............................ 127
Table F.15 - Ultimate Tensile Stress (within Random PU + 0.05% ADO, Fig. 6, Ch. VII) ... 127
Table F.16 - DNA Content: (within groups: Stimulated and Control, Fig. 4, Ch. VIII) ......... 128
Table F.17 - DNA Content (within groups: 0hr, 6hr, 12hr, 24hr, Fig. 4, Ch. VIII) ................ 128
Table F.18 - Relative Thymidine Incorporation Ratio Comparison: 24hr vs 72hr (within groups: Stimulated and Control, Fig. 6, Ch. VIII) .............................................. 129
Table F.19 - Relative Thymidine Incorporation Ratio Comparison: Stimulated vs. Control (within groups: 24 hr and 72 hr, Fig. 6, Ch. VIII) ................................. 129

xiii
Table F.20 - Relative Collagen Content Ratio Comparison: 24hr vs 72hr (within groups: Stimulated and Control, Fig. 6, Ch. VIII) ........................................................... 129
Table F.21 – Relative Collagen Content Ratio Comparison: Stimulated vs. Control (within groups: 24 hr and 72 hr, Fig. 6, Ch. VIII) .............................................. 129
Table F.22 - Relative Proteoglycan Content Ratio Comparison: 24hr vs 72hr (within groups: Stimulated and Control, Fig. 6, Ch. VIII) .............................................. 130
Table F.23 - Relative Proteoglycan Content Ratio Comparison: Stimulated vs. Control (within groups: 24 hr and 72 hr, Fig. 6, Ch. VIII) .............................................. 130

1
VI: Introduction

2
II. Introduction
The human vertebral column provides axial support to the body and protects the spinal cord.
The intervertebral discs lying between the vertebrae provide flexibility and help prevent damage
to the vertebral column by dissipating mechanical loads and shocks.1 The hyaline cartilage
endplates found at each end, represent the anatomical limits of the disc. The nucleus pulposus, a
remnant of the embryonic notochord, contains few cartilage-like cells dispersed in the
proteoglycan-rich matrix and forms the gelatinous central zone of intervertebral discs. The
nucleus pulposus’ fluid nature allows it to deform under pressure transmitting any applied forces.
Surrounding the nucleus pulposus are about 20 sheets of concentric fibrocartilaginous lamellae
called the annulus fibrosus, which are formed from embryonic mesynchymal tissue.2 The
lamellae consist of fibers that are oriented at 60º to the vertical axis of the disc. The alignment of
these fibers alternates between successive lamellae and is of great importance to the stability of
the annulus fibrosus. The lamellae are not fully continuous, with 40-50% of lamellae failing to
completely circumscribe the nucleus pulposus. 2
Figure 1. The anatomy of the human vertebral column and the intervertebral disc. (DePuy
Spine)
Lumbar
Cervical
Thoracic
Vertebral Body
IntervertebralDisc
Annulus Fibrosus
NucleusPulposus
3
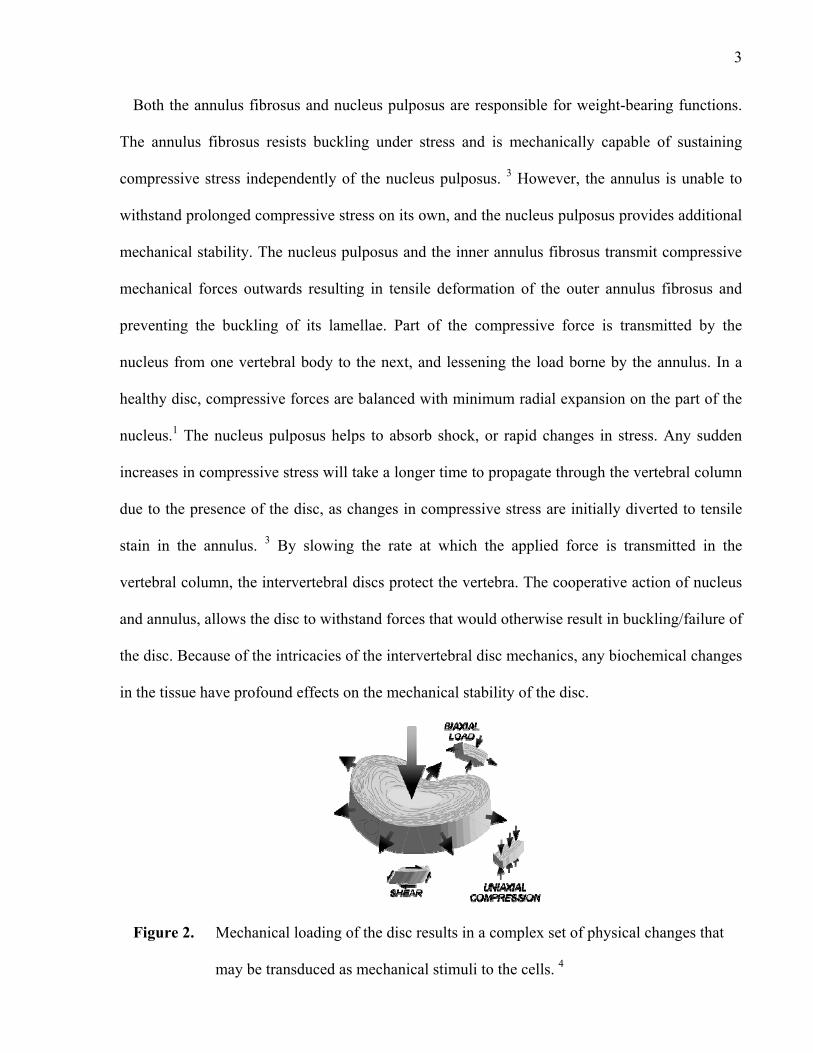
Both the annulus fibrosus and nucleus pulposus are responsible for weight-bearing functions.
The annulus fibrosus resists buckling under stress and is mechanically capable of sustaining
compressive stress independently of the nucleus pulposus. 3 However, the annulus is unable to
withstand prolonged compressive stress on its own, and the nucleus pulposus provides additional
mechanical stability. The nucleus pulposus and the inner annulus fibrosus transmit compressive
mechanical forces outwards resulting in tensile deformation of the outer annulus fibrosus and
preventing the buckling of its lamellae. Part of the compressive force is transmitted by the
nucleus from one vertebral body to the next, and lessening the load borne by the annulus. In a
healthy disc, compressive forces are balanced with minimum radial expansion on the part of the
nucleus.1 The nucleus pulposus helps to absorb shock, or rapid changes in stress. Any sudden
increases in compressive stress will take a longer time to propagate through the vertebral column
due to the presence of the disc, as changes in compressive stress are initially diverted to tensile
stain in the annulus. 3 By slowing the rate at which the applied force is transmitted in the
vertebral column, the intervertebral discs protect the vertebra. The cooperative action of nucleus
and annulus, allows the disc to withstand forces that would otherwise result in buckling/failure of
the disc. Because of the intricacies of the intervertebral disc mechanics, any biochemical changes
in the tissue have profound effects on the mechanical stability of the disc.
Figure 2. Mechanical loading of the disc results in a complex set of physical changes that
may be transduced as mechanical stimuli to the cells. 4

4
Annulus Fibrosus:
The outer annulus fibrosus (AF) consists of concentric lamella, mainly made up of collagen
fibers, and oriented at approximately 60º to the vertical. The AF extracellular matrix contains
collagen fibrils, proteoglycans and water. Water makes up 60% of the annulus fibrosus, while
collagen and proteoglycans account for 50-70% and 10-20% of the dry weight respectively. 5
The composition of the annulus fibrosus is radially non-uniform in that collagen type I is
restricted to the annulus fibrosus and not present in the healthy nucleus pulposus. Within the
annulus fibrosus, the concentration of collagen type I is highest in the outer lamellae and lowest
at the inner lamellae nearest the NP.6 Conversely, collagen type II which is the main collagen
type present in nucleus pulposus decreases in concentration radially towards the annulus
fibrosus.5 The relative proportion of collagen type I to collagen type II in the annulus fibrosus
varies from 70:30 in the innermost layers and 85:15 in the outer layers.5 Other types of collagen
also exist in smaller amounts in the annulus fibrosus, with Collagens V, VI, IX, XI, XII and XIV
all contributing to the matrix.7 The interlamellar space also contains proteoglycan aggregates,
with water imbibing properties similar to those found within the nucleus of the disc, while the
lamellar layers are comprised of proteoglycan monomers which interact with, and modulate the
behaviour of the collagen fibrils. 7
Mechanical Properties:
The mechanical properties of intervertebral discs are complex and the literature on this topic
shows significant variation.8-11 In addition, due to its structural arrangement, the mechanical
behavior of AF is relatively complex. Studies indicate that the annulus fibrosus exhibits both
matrix viscoelastic and biphasic viscoelastic behavior.11 Matrix viscoelastic behavior indicates
the intrinsic flow-independent viscoelastic properties of the solid extracellular matrix, whereas

5
the biphasic viscoelastic properties reflect time and rate-dependent effects due to fluid-solid
interactions in the tissue. The elastic modulus of single lamellae of annulus fibrosus has been
found to vary with radial position in the disc with values ranging from 5±4 MPa for posterior
inner AF, 20±12 MPa for posterior outer AF, 10±6 MPa for anterior inner AF, and 49±32 MPa
for anterior outer AF 12. The ultimate stress of single lamellae of annulus fibrosus similarly
varies radially from 0.9±0.3 MPa for posterior inner AF, 1.1±0.3 MPa for posterior outer AF,
0.9±0.7 MPa for anterior inner AF, and 3.3±1.3 MPa for anterior outer AF. 12 The AF
experiences a variety of forces in vivo, and thus the impact of mechanical forces on AF tissue is
of great interest. It has been well established that mechanical loading plays an important role in
regulating behavior in various tissues.13-17 Muscle forces, general loading of the joints and
movement of joints relative to each other act to apply a range of stresses on the disc, including
compressive, shear, tensile, osmotic and hydrostatic forces, which along with other forces,
initiate a response from the AF cells.18-26 A number of studies demonstrating the
mechanosensitivity of the AF are outlined below.
Mechanobiology of Annulus Fibrosus:
The in vivo biological response of annulus fibrosus in the rat tail to short-term dynamic
compression have been investigated by MacLean et al. The expression of anabolic and catabolic
genes was affected by a 2 hour dynamic compression of the intervertebral disc, under an applied
stress of 1 MPa (12.6N) at 0.2 Hz. Anabolic genes for collagen I and collagen II were
downregulated while catabolic genes for collagenase and aggrecanase were upregulated in the
annulus.27 Compressive stresses of 1 MPa and 0.2 MPa were applied in another in vivo study at
three frequencies of 0.01 Hz, 0.2 Hz, and 1 Hz. It was found that the application of 1 MPa at all
frequencies significantly increased catabolic genes for collagenase (21-, 7-, 8-fold respectively)
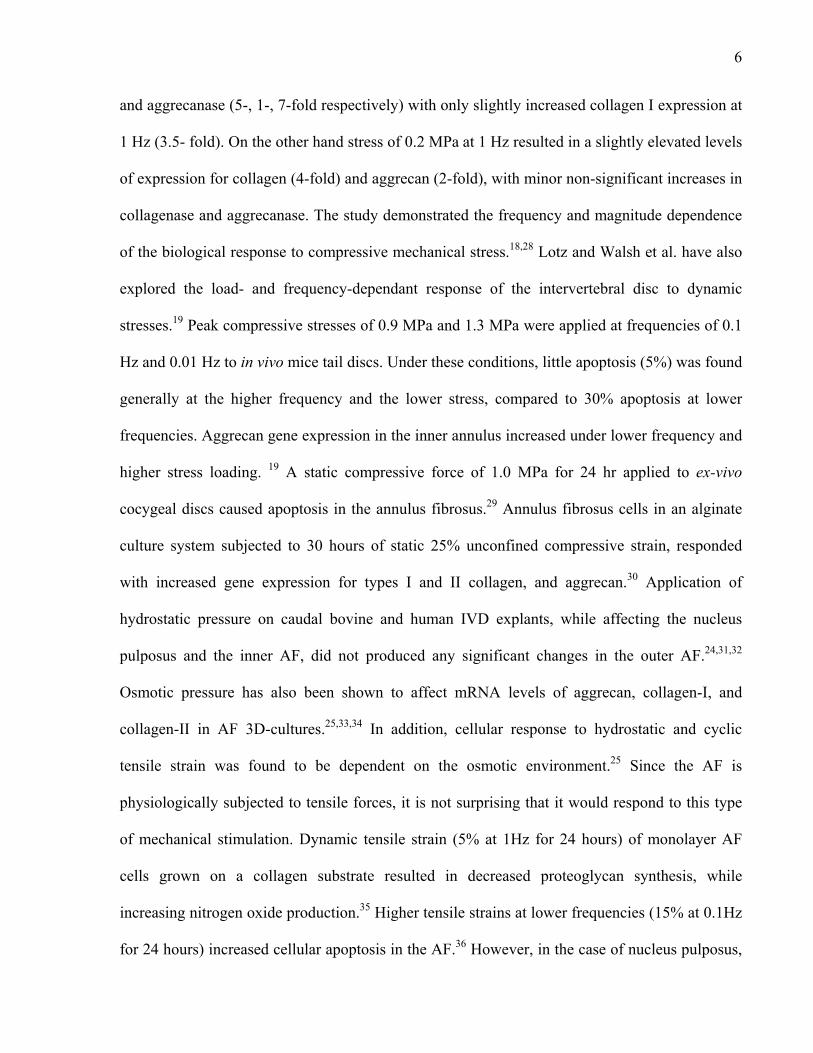
6
and aggrecanase (5-, 1-, 7-fold respectively) with only slightly increased collagen I expression at
1 Hz (3.5- fold). On the other hand stress of 0.2 MPa at 1 Hz resulted in a slightly elevated levels
of expression for collagen (4-fold) and aggrecan (2-fold), with minor non-significant increases in
collagenase and aggrecanase. The study demonstrated the frequency and magnitude dependence
of the biological response to compressive mechanical stress.18,28 Lotz and Walsh et al. have also
explored the load- and frequency-dependant response of the intervertebral disc to dynamic
stresses.19 Peak compressive stresses of 0.9 MPa and 1.3 MPa were applied at frequencies of 0.1
Hz and 0.01 Hz to in vivo mice tail discs. Under these conditions, little apoptosis (5%) was found
generally at the higher frequency and the lower stress, compared to 30% apoptosis at lower
frequencies. Aggrecan gene expression in the inner annulus increased under lower frequency and
higher stress loading. 19 A static compressive force of 1.0 MPa for 24 hr applied to ex-vivo
cocygeal discs caused apoptosis in the annulus fibrosus.29 Annulus fibrosus cells in an alginate
culture system subjected to 30 hours of static 25% unconfined compressive strain, responded
with increased gene expression for types I and II collagen, and aggrecan.30 Application of
hydrostatic pressure on caudal bovine and human IVD explants, while affecting the nucleus
pulposus and the inner AF, did not produced any significant changes in the outer AF.24,31,32
Osmotic pressure has also been shown to affect mRNA levels of aggrecan, collagen-I, and
collagen-II in AF 3D-cultures.25,33,34 In addition, cellular response to hydrostatic and cyclic
tensile strain was found to be dependent on the osmotic environment.25 Since the AF is
physiologically subjected to tensile forces, it is not surprising that it would respond to this type
of mechanical stimulation. Dynamic tensile strain (5% at 1Hz for 24 hours) of monolayer AF
cells grown on a collagen substrate resulted in decreased proteoglycan synthesis, while
increasing nitrogen oxide production.35 Higher tensile strains at lower frequencies (15% at 0.1Hz
for 24 hours) increased cellular apoptosis in the AF.36 However, in the case of nucleus pulposus,

7
higher tensile forces and lower frequencies (20% at 0.05Hz for 24 hours) produced higher
collagen synthesis and increased cellular proliferation. Axial traction tensile forces applied to
intact IVD explants (at 0.8MPa for 4 hours) resulted in a decrease in proteoglycan synthesis in
the AF.23 Mechano-biological response of AF cells to a collection of stimuli has been
summarized in Table 1 below.

8
Table 1 - Annulus fibrosus response to a selection of mechanobiological stimuli
Ref. Species Experiment
Setup Stress Type
Strain Value
Stress Value
Frequency Length Setup Notes
Effects
37 Porcine Lumbar (4-5 months)
In Vitro Monolayer
Tensile 20% - STATIC 60 s Type I
Collagen Substrate
Lower Cell Death, Increased Proliferation at 12-24hrs ; gene expression: No change MMP-1, TIMP-1,2 at 12-24hrs, increased TGF-b1, decreased
TNF-a at 12-24hrs
8-40 Porcine Lumbar (4-5 months) 38-40
In Vitro Monolayer
Tensile 5-8% - 0.5 Hz 24 h
Gelatin or Type I
Collagen Substrate
No change in cell viability, Col 1, 2, aggrecan decreased at 6hr, but increased at 9hr and no change at 24hr. ; MMP-1,2,3 and TIMP-1,2
unchanged at 24h
36 Rabbit Lumbar (4wks)
In Vitro Monolayer
Tensile 15% - 0.1Hz 24 h Type I
Collagen Substrate
Significantly increased cell death
35 Rabbit Lumbar (4wks)
In Vitro Monolayer
Tensile 5% - 1Hz 24 h Type I
Collagen Substrate
Proteoglycan synthesis decreased at 8-24hrs, no change in aggrecan
23 Porcine Intact IVD (6 months)
In Vitro Intact IVD
Traction Stress
- 0.8
MPa STATIC 4h -
Proteoglycan synthesis decreased in outer anulus, but no change in inner anulus
30,41 Porcine Lumbar (4-5 months)
In Vitro In Alginate Gel
Comp. 25% (1% ctrl.)
<100 kPa
STATIC 30 h - No change (NC) in cell viability ; increased col-1, col-2, aggrecan,
vimentin gene expression
42 Bovine Intact IVD (2 yr)
In Vitro Intact IVD
Comp. -
0.5-15 kg (0.2-
0.6 MPa)
STATIC 8 h - 3H-pro incorporation: NC (no change) at 0.2-0.4 MPa, decreased at
0.6MPa ; 35S-incorporation: increased at 0.2-0.6MPa
43 Rabbit Cells In Vitro
Monolayer Vibratory
Comp. 0.1 g 6 Hz
2, 4, 6, 8 hr
Tissue Culture Plate
Supressed gene expression for Aggrecan, Collagen 3, MMP-3
18 Murine In Vivo Comp. 1 and 0.2
MPa
1 , 0.2, 0.01 Hz
2h -
1 Hz, 1MPa: small increase in aggrecan, large increases in aggrecanase, collagenase, MMP-3 0.01Hz, 1MPa: large increases in aggrecan, col-1, col-2, small increases in aggrecanase and collagenase 1 MPa in general up-regulated aggrecanase (except at 0.2Hz), collagenase and MMP-3 (at
all frequencies), with small changes in anabolic gene expression (3.5 increase in col-1 at 1Hz) Catabolic gene levels lower at 0.2 Hz compared to 1 and 0.01 Hz 0.2 MPa: The only significant changes were at 1Hz: a
small (2x and 4x) increase in aggrecan , col-1
44 Murine In Vivo Comp. 1 MPa 1 Hz 0.5, 2, 4
hr -
Increasing load duration caused increase for Collagen 1, Collagen 2, MMP3, MMP13.
27 Murine In Vivo Comp. 1 MPa 0.2 Hz 2h - Upregulated collagenase and MMP-3 ; Decrease in Collagen 1 and
Collagen 2, No significant changes in aggrecan (slight decrease)

9
Ref. Species Experiment
Setup Stress Type
Strain Value
Stress Value
Len. Setup Notes
Effects
31 Human Tissue Explant
In Vitro Hydrostatic - 1-10 MPa 20 s and 2
h -
10 atm: upregulation of all ECM protein genes. Increase in Collagen-1 (141% of controls), aggrecan (121%). 30 atm: Collagen-2 similar to 10atm, collagen-1 reduced to 42% of controls. MMP-1 and TGFb-1
down-regulated to 71% and 54% of controls. 31
Human Tissue Explant In Vitro Hydrostatic -
2.5, 7.5 MPa
20 s - Proteoglycan synthesis did not change at 2.5 or 7.5 MPa
24,32 Human Tissue Explant In Vitro Hydrostatic - 1-30 atm 2 h -
Collagen and proteoglycan synthesis did not change || noc changes observed for MMP-3 and TIMP-1
45 Canine Lumbar (3-6 yrs) and Rabbit Lumbar
In Vitro Osmotic Pressure
15-25% PEG
loading-swelling pressure
- 5 h - Proteoglycan synthesis decreased in both 15, 25% PEG
34 Porcine Lumbar (4-5 months)
In Vitro in alginate
Osmotic Pressure
255-450 mOsm
- 4 h - 255 mOsm: Increased collagen 2, aggrecan 450 mOsm: increased
biglycan and decorin mRNA
33 Human Lumbar (29-62 yr)
In Vitro in alginate
Osmotic Pressure
255-450 mOsm
- 4 h - 450 mOsm: Increased ADAMTs, decreased IL-6
10
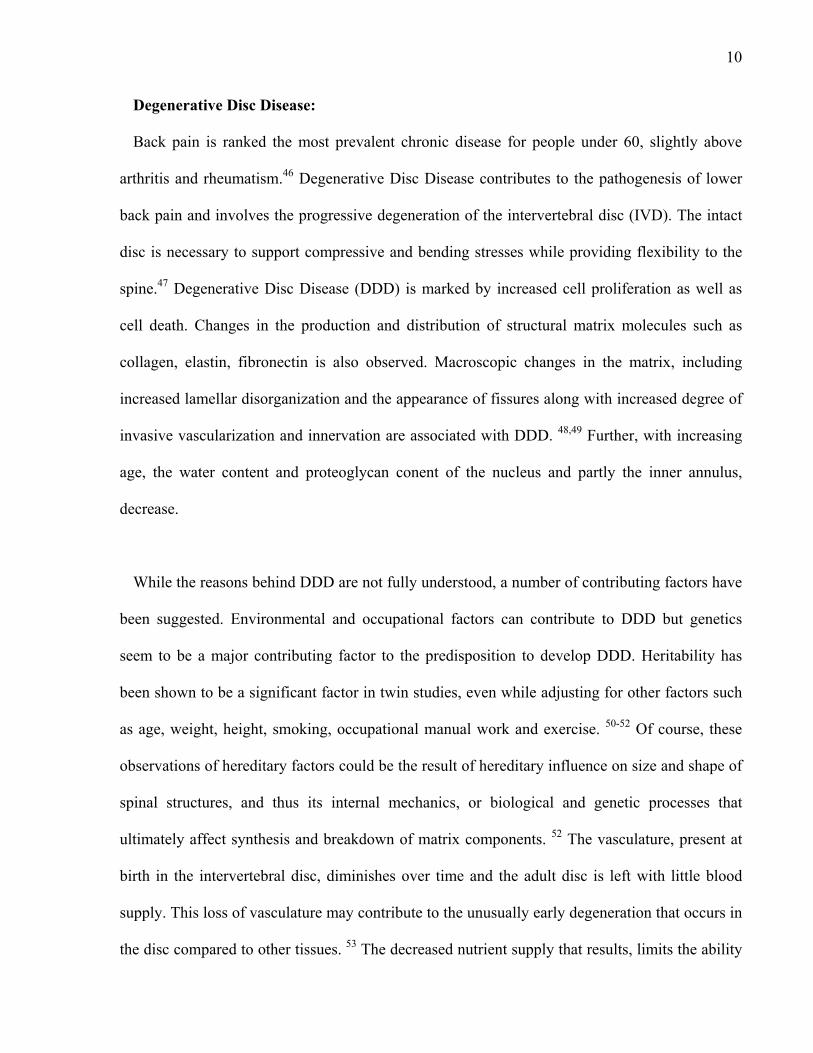
Degenerative Disc Disease:
Back pain is ranked the most prevalent chronic disease for people under 60, slightly above
arthritis and rheumatism.46 Degenerative Disc Disease contributes to the pathogenesis of lower
back pain and involves the progressive degeneration of the intervertebral disc (IVD). The intact
disc is necessary to support compressive and bending stresses while providing flexibility to the
spine.47 Degenerative Disc Disease (DDD) is marked by increased cell proliferation as well as
cell death. Changes in the production and distribution of structural matrix molecules such as
collagen, elastin, fibronectin is also observed. Macroscopic changes in the matrix, including
increased lamellar disorganization and the appearance of fissures along with increased degree of
invasive vascularization and innervation are associated with DDD. 48,49 Further, with increasing
age, the water content and proteoglycan conent of the nucleus and partly the inner annulus,
decrease.
While the reasons behind DDD are not fully understood, a number of contributing factors have
been suggested. Environmental and occupational factors can contribute to DDD but genetics
seem to be a major contributing factor to the predisposition to develop DDD. Heritability has
been shown to be a significant factor in twin studies, even while adjusting for other factors such
as age, weight, height, smoking, occupational manual work and exercise. 50-52 Of course, these
observations of hereditary factors could be the result of hereditary influence on size and shape of
spinal structures, and thus its internal mechanics, or biological and genetic processes that
ultimately affect synthesis and breakdown of matrix components. 52 The vasculature, present at
birth in the intervertebral disc, diminishes over time and the adult disc is left with little blood
supply. This loss of vasculature may contribute to the unusually early degeneration that occurs in
the disc compared to other tissues. 53 The decreased nutrient supply that results, limits the ability

11
of cells to synthesize new matrix and may limit cell division and could account for the decline in
cell density. Apart from the sparse vascular supply in the outer annulus, diffusion across the
cartilage endplates provides much of the essential solutes for nutrition and metabolic exchange.
Proteoglycan content of the cartilage endplates are very important to transport and control of
water content in the disc, and especially in the nucleus pulposus. Calcification of the cartilage
endplate would affect not only diffusion of nutrients into the disc, but extrusion of metabolic
degradation products that could be toxic to cells. Notochordal cells, which are believed to be
involved in the formation and preservation of nucleus pulposus, gradually disappear with age.54
Changes in the cartilage endplate such as calcification correlate with degeneration of the disc and
particularly that of nucleus pulposus. 55-57 Overall, the emergence of degenerative disc disease
has been linked to lack of vascularity, mechanical trauma to the vertebral body or the disc tissue,
loss of notochordal cells and influence by genetic predispositions, age, gender and other
environmental factors.50-53,55,56,58,59
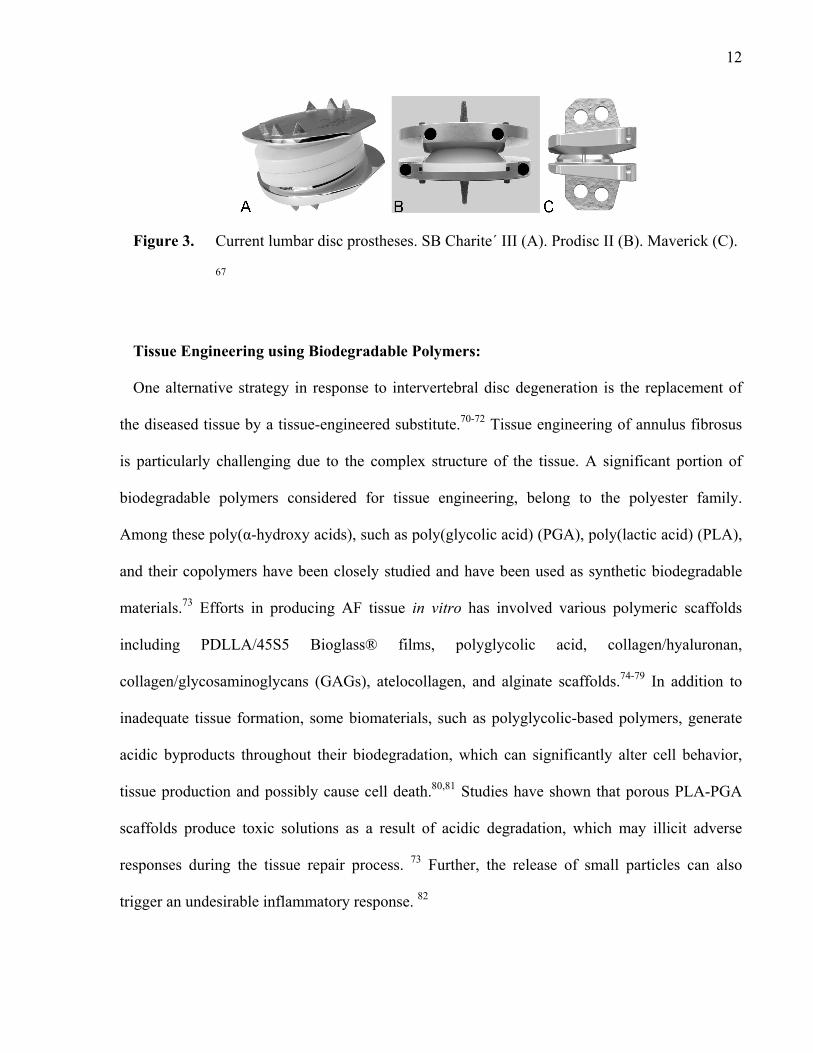
Currently, existing treatments include discectomy, the use of a prosthetic substitute, or the
fusion of adjacent vertebrae, none of which is optimal. Spinal fusion of degenerated disc may be
effective in some cases, but a number of patients can develop degeneration, due to reduced
flexibility, loss of disc height, and increased stress, in adjacent segments. 60-66 Complications can
also occur in patients undergoing disc replacement with synthetic substrates. Dislocations and
mechanical failure, although rare, have been reported.67 The formation of wear debris can induce
an inflammatory response mediated by various cytokines, leading to pain, osteolysis, fibrous
tissue formation, prosthetic loosening and pain.67-69
12
Figure 3. Current lumbar disc prostheses. SB Charite´ III (A). Prodisc II (B). Maverick (C).
67
Tissue Engineering using Biodegradable Polymers:
One alternative strategy in response to intervertebral disc degeneration is the replacement of
the diseased tissue by a tissue-engineered substitute.70-72 Tissue engineering of annulus fibrosus
is particularly challenging due to the complex structure of the tissue. A significant portion of
biodegradable polymers considered for tissue engineering, belong to the polyester family.
Among these poly(α-hydroxy acids), such as poly(glycolic acid) (PGA), poly(lactic acid) (PLA),
and their copolymers have been closely studied and have been used as synthetic biodegradable
materials.73 Efforts in producing AF tissue in vitro has involved various polymeric scaffolds
including PDLLA/45S5 Bioglass® films, polyglycolic acid, collagen/hyaluronan,
collagen/glycosaminoglycans (GAGs), atelocollagen, and alginate scaffolds.74-79 In addition to
inadequate tissue formation, some biomaterials, such as polyglycolic-based polymers, generate
acidic byproducts throughout their biodegradation, which can significantly alter cell behavior,
tissue production and possibly cause cell death.80,81 Studies have shown that porous PLA-PGA
scaffolds produce toxic solutions as a result of acidic degradation, which may illicit adverse
responses during the tissue repair process. 73 Further, the release of small particles can also
trigger an undesirable inflammatory response. 82

13
In this study, polycarbonate-urethane polymers were used because of their expected
biocompatible and biodegradable nature. Polyurethanes (PUs) have been used in biomedical
devices since the 1960s. Traditionally, research by investigators in the 80’s and 90’s had been
directed at producing biostable polyurethanes in an effort to shield them from biodegradation
processes. However in the past decade, the focus has shifted to utilizing the flexible chemistry of
PUs in developing bioactive/biocompatible and biodegradable polyurethanes for the purpose of
tissue engineering or regeneration.83,84 As an elastomer, the mechanical properties of PU can be
carefully controlled. Polyurethanes can have a broad range of mechanical properties depending
on the chemistry of the specific copolymer. Tensile strengths of PUs have been found to be in the
range of 6-40 MPa.85 The shift to biodegradable PU-based materials has been accompanied with
a change in the diisocyanates used in their synthesis. Aromatic diisocyanates, which are prone to
carcinogenic effects on tissue, have been replaced with diisocyanates such as hexane
diisocyanate, whose ultimate degradation products are more likely to be non-toxic.86-90 Early
studies on the biodegradation of polyurethanes cited environmental stress cracking, driven by
factors including surface oxidation, residual stress, polyether soft-segment chemistry, molecular
morphology, the presence of MDM and foreign body giant cells (FBGC), as well as an unknown
biological element.84 However, a more inclusive approach to polyurethane biodegradation,
termed environmental biodegradation, has been proposed which accounts for biodegradation due
to hydrolytic enzymes. Santerre and Labow were first to study PU degradation using
physiologically relevant enzymes.91 Enzymes such as cholesterol esterase (CE) were shown to
preferably degrade ester linkages immediately adjacent to the hard segment. CE is present in
monocytes as they differentiate into macrophages and has been reported to degrade PUs.92,93
Further, CE has been shown to exceed the degradation potential of many other enzymes by more

14
than 100-fold. 94 The results of these studies have also demonstrated that PU biodegradation is
affected by a variety of factors such as hard-segment chemistry and stress induced strain. 84
Figure 4. Stress induced strain along with material morphology and chemistry, can affect the
environmental degradation of the material 84
Short-term studies on in vitro and in vivo biocompatibility of biodegradable polyurethane
polymers have shown no abnormal growth behaviour, nor morphological changes or inhibition in
metabolic activity.95 Considering the collection of previous work in this area, it was
hypothesized that the byproducts resulting from the degradation of polycarbonate urethanes in
this study would likely be non-toxic to AF cells as well.
Electrospinning:
Polycarbonate urethanes can be fabricated in many different forms and most importantly, they
may be suitable for use in the process of electrospinning.96 In this process, the polymer is
dissolved in a volatile solvent and subjected to a high voltage compared to a rotating deposition
surface.96. This electrical field overcomes surface tension of the solution and causes the solution

15
to separate into fine fibers. The produced fibers mimic the aligned nature of the annulus
fibrosus, and thus provide a more appropriate surface for growth of such a tissue. The high
surface to volume ratio of these scaffolds is expected to favor cell attachment and retention of
cell phenotype. 97,98 Studies have shown that by depositing electrospun nanofibers onto a rotating
mandrel, one can dictate the mechanical anisotropy of scaffolds, addressing the importance of
mechanical strength of fibrous scaffolds for AF tissue regeneration.99
Proposed Work:
To achieve biological repair of a degenerate disc using a tissue-engineered construct, it is
necessary to develop methods that encourage production of tissue that closely mimics its
physiological counterpart. The overall strategy behind the use of an electrospun polyurethane
nanofiber scaffold for tissue engineering the AF, involves the growth of an AF tissue layer on the
surface of an aligned scaffold. Multiple layers of the resulting aligned AF tissue can then be
combined to produce a tissue engineered AF construct. We hypothesize that PU is an appropriate
scaffold to use for tissue engineering the annulus fibrosus. This will be determined by
characterizing the mechanical, biodegradation and cytotoxic characteristics of an elastomeric
polycarbonate-urethane. The four objectives of this work are 1) to determine the mechanical
properties of the aligned and random electrospun polycarbonate-urethane nanofiber scaffold. It
was anticipated that aligned scaffolds would have superior mechanical properties to random
scaffolds. The mechanical properties of these polymers in relation to those of native AF tissue
were of particular interest; 2) to study the effects of biodegradation on PU’s mechanical
properties to determine the level to which the scaffold can provide mechanical support
throughout the biodegradation process; 3) to determine the cytotoxic effects of the PU
degradation products on AF cells. It was anticipated that PU should produce non-toxic

16
degradation byproducts given previous studies of related biomaterials 84; 4) to investigate the
response by AF cells grown on polyurethane electrospun scaffolds, to cyclic compressive
mechanical forces. Previous studies have shown some mechanical forces to be detrimental and
others beneficial to AF tissue development, making it difficult to anticipate the response of AF
tissue to the proposed mechanical forces. Compression was chosen as a starting point for
analysis of mechanical forces on the AF tissue as they have been shown to initiate a response
from AF cells.

17
References:
(1) Bogduk, Nikolai. Clinical anatomy of the lumbar spine and sacrum, Elsevier Churchill
Livingstone: Edinburgh, 2005.
(2) Marchand, F. and Ahmed, A. M. Investigation of the laminate structure of lumbar disc
anulus fibrosus. Spine, 1990, 5, 402-410.
(3) Markolf, K. L. and Morris, J. M. The structural components of the intervertebral disc. A
study of their contributions to the ability of the disc to withstand compressive forces.
J.Bone Joint Surg.Am., 1974, 4, 675-687.
(4) Setton, L. A. and Chen, J. Mechanobiology of the intervertebral disc and relevance to
disc degeneration. J.Bone Joint Surg.Am., 2006, 52-57.
(5) Eyre, D. R. and Muir, H. Types I and II collagens in intervertebral disc. Interchanging
radial distributions in annulus fibrosus. Biochem.J., 1-7-1976, 1, 267-270.
(6) Bruehlmann, S. B., Rattner, J. B., Matyas, J. R., and Duncan, N. A. Regional variations in
the cellular matrix of the annulus fibrosus of the intervertebral disc. J.Anat., 2002, 2,
159-171.
(7) Eyre, D. R., Matsui, Y., and Wu, J. J. Collagen polymorphisms of the intervertebral disc.
Biochem.Soc.Trans., 2002, Pt 6, 844-848.
(8) Riches, P. E., Dhillon, N., Lotz, J., Woods, A. W., and McNally, D. S. The internal
mechanics of the intervertebral disc under cyclic loading. J.Biomech., 2002, 9, 1263-
1271.

18
(9) Alkalay, R. The Material and Mechanical Properties of the Healthy and Degenerated
Intervertebral Disc. In Integrated Biomaterials Science, Springer US, 2002.
(10) Baer, A. E., Laursen, T. A., Guilak, F., and Setton, L. A. The micromechanical
environment of intervertebral disc cells determined by a finite deformation,
anisotropic, and biphasic finite element model. J.Biomech.Eng, 2003, 1, 1-11.
(11) Wu, H. C. and Yao, R. F. Mechanical behavior of the human annulus fibrosus.
J.Biomech., 1976, 1, 1-7.
(12) Ebara, S., Iatridis, J. C., Setton, L. A. et al. Tensile properties of nondegenerate human
lumbar anulus fibrosus. Spine, 15-2-1996, 4, 452-461.
(13) Bao, X., Clark, C. B., and Frangos, J. A. Temporal gradient in shear-induced signaling
pathway: involvement of MAP kinase, c-fos, and connexin43. Am.J.Physiol Heart
Circ.Physiol, 2000, 5, H1598-H1605.
(14) Breen, E. C. Mechanical strain increases type I collagen expression in pulmonary
fibroblasts in vitro. J.Appl.Physiol, 2000, 1, 203-209.
(15) Chen, N. X., Ryder, K. D., Pavalko, F. M. et al. Ca(2+) regulates fluid shear-induced
cytoskeletal reorganization and gene expression in osteoblasts. Am.J.Physiol Cell
Physiol, 2000, 5, C989-C997.
(16) Klein-Nulend, J., Helfrich, M. H., Sterck, J. G. et al. Nitric oxide response to shear stress
by human bone cell cultures is endothelial nitric oxide synthase dependent.
Biochem.Biophys.Res.Commun., 8-9-1998, 1, 108-114.

19
(17) Kreke, M. R., Huckle, W. R., and Goldstein, A. S. Fluid flow stimulates expression of
osteopontin and bone sialoprotein by bone marrow stromal cells in a temporally
dependent manner. Bone, 2005, 6, 1047-1055.
(18) MacLean, J. J., Lee, C. R., Alini, M., and Iatridis, J. C. Anabolic and catabolic mRNA
levels of the intervertebral disc vary with the magnitude and frequency of in vivo
dynamic compression. J.Orthop.Res., 2004, 6, 1193-1200.
(19) Walsh, A. J. and Lotz, J. C. Biological response of the intervertebral disc to dynamic
loading. J.Biomech., 2004, 3, 329-337.
(20) Setton, L. A. and Chen, J. Cell mechanics and mechanobiology in the intervertebral disc.
Spine, 1-12-2004, 23, 2710-2723.
(21) Perie, D., Korda, D., and Iatridis, J. C. Confined compression experiments on bovine
nucleus pulposus and annulus fibrosus: sensitivity of the experiment in the
determination of compressive modulus and hydraulic permeability. J.Biomech., 2005,
11, 2164-2171.
(22) Sowa, G. and Agarwal, S. Cyclic tensile stress exerts a protective effect on intervertebral
disc cells. Am.J.Phys.Med.Rehabil., 2008, 7, 537-544.
(23) Terahata, N., Ishihara, H., Ohshima, H., Hirano, N., and Tsuji, H. Effects of axial traction
stress on solute transport and proteoglycan synthesis in the porcine intervertebral disc
in vitro. Eur.Spine J., 1994, 6, 325-330.

20
(24) Handa, T., Ishihara, H., Ohshima, H. et al. Effects of hydrostatic pressure on matrix
synthesis and matrix metalloproteinase production in the human lumbar intervertebral
disc. Spine, 15-5-1997, 10, 1085-1091.
(25) Wuertz, K., Urban, J. P., Klasen, J. et al. Influence of extracellular osmolarity and
mechanical stimulation on gene expression of intervertebral disc cells. J.Orthop.Res.,
2007, 11, 1513-1522.
(26) Lotz, J. C., Hsieh, A. H., Walsh, A. L., Palmer, E. I., and Chin, J. R. Mechanobiology of
the intervertebral disc. Biochem.Soc.Trans., 2002, Pt 6, 853-858.
(27) MacLean, J. J., Lee, C. R., Grad, S. et al. Effects of immobilization and dynamic
compression on intervertebral disc cell gene expression in vivo. Spine, 15-5-2003, 10,
973-981.
(28) Iatridis, J. C., MacLean, J. J., Roughley, P. J., and Alini, M. Effects of mechanical
loading on intervertebral disc metabolism in vivo. J.Bone Joint Surg.Am., 2006, 41-
46.
(29) Ariga, K., Yonenobu, K., Nakase, T. et al. Mechanical stress-induced apoptosis of
endplate chondrocytes in organ-cultured mouse intervertebral discs: an ex vivo study.
Spine, 15-7-2003, 14, 1528-1533.
(30) Chen, J., Yan, W., and Setton, L. A. Static compression induces zonal-specific changes in
gene expression for extracellular matrix and cytoskeletal proteins in intervertebral
disc cells in vitro. Matrix Biol., 2004, 7, 573-583.

21
(31) Ishihara, H., McNally, D. S., Urban, J. P., and Hall, A. C. Effects of hydrostatic pressure
on matrix synthesis in different regions of the intervertebral disk. J.Appl.Physiol,
1996, 3, 839-846.
(32) Liu, G. Z., Ishihara, H., Osada, R., Kimura, T., and Tsuji, H. Nitric oxide mediates the
change of proteoglycan synthesis in the human lumbar intervertebral disc in response
to hydrostatic pressure. Spine, 15-1-2001, 2, 134-141.
(33) Boyd, L. M., Richardson, W. J., Chen, J. et al. Osmolarity regulates gene expression in
intervertebral disc cells determined by gene array and real-time quantitative RT-PCR.
Ann.Biomed.Eng, 2005, 8, 1071-1077.
(34) Chen, J., Baer, A. E., Paik, P. Y., Yan, W., and Setton, L. A. Matrix protein gene
expression in intervertebral disc cells subjected to altered osmolarity.
Biochem.Biophys.Res.Commun., 10-5-2002, 3, 932-938.
(35) Rannou, F., Richette, P., Benallaoua, M. et al. Cyclic tensile stretch modulates
proteoglycan production by intervertebral disc annulus fibrosus cells through
production of nitrite oxide. J.Cell Biochem., 1-9-2003, 1, 148-157.
(36) Rannou, F., Lee, T. S., Zhou, R. H. et al. Intervertebral disc degeneration: the role of the
mitochondrial pathway in annulus fibrosus cell apoptosis induced by overload.
Am.J.Pathol., 2004, 3, 915-924.
(37) Lee CS, Chen J, and Upton MU A single period of hyperphysiologic stretch induces IL6,
TGF-beta and cell proliferation in annulus fibrosus cells. Proceedings of the
International Society for Study of the Lumbar Spine, 2009,

22
(38) Chen J, Yan W, and Setton LA Tensile stretch alters metalloproteinase activity
and gene expression in anulus fibrosus cells. Trans Orthop Res Soc, 2004, 29, 834-
(39) Wenger KH, Seth A, and Hasty KA Transforming growth factor parallels collagenase,
not collagen gene expression in stretched fibrochondrocytes. Trans Orthop Res Soc, 2004, 29,
95-
(40) Wenger KH, Woods JA, and Robertson JT Counter-regulatory expression
of genes coding for collagens and collagenases in stretched annulus cells. Proceedings of the
International Society for Study of the Lumbar Spine, 2009,
(41) Chen J, Yan W, and Setton LA Hexosaminidase expression in intervertebral
disc cells subjected to static compression. Proceedings of the InternationalSociety for Study of
the Lumbar Spine, 2003,
(42) Ohshima, H., Urban, J. P., and Bergel, D. H. Effect of static load on matrix synthesis
rates in the intervertebral disc measured in vitro by a new perfusion technique.
J.Orthop.Res., 1995, 1, 22-29.
(43) Yamazaki, S., Banes, A. J., Weinhold, P. S. et al. Vibratory loading decreases
extracellular matrix and matrix metalloproteinase gene expression in rabbit annulus
cells. Spine J., 2002, 6, 415-420.
(44) MacLean, J. J., Lee, C. R., Alini, M., and Iatridis, J. C. The effects of short-term load
duration on anabolic and catabolic gene expression in the rat tail intervertebral disc.
J.Orthop.Res., 2005, 5, 1120-1127.

23
(45) Bayliss, M. T., Urban, J. P., Johnstone, B., and Holm, S. In vitro method for measuring
synthesis rates in the intervertebral disc. J.Orthop.Res., 1986, 1, 10-17.
(46) Rapoport, J., Jacobs, P., Bell, N. R., and Klarenbach, S. Refining the measurement of the
economic burden of chronic diseases in Canada. Chronic.Dis.Can., 2004, 1, 13-21.
(47) Urban, J. P. and Roberts, S. Degeneration of the intervertebral disc. Arthritis Res.Ther.,
2003, 3, 120-130.
(48) Kauppila, L. I. Ingrowth of blood vessels in disc degeneration. Angiographic and
histological studies of cadaveric spines. J.Bone Joint Surg.Am., 1995, 1, 26-31.
(49) Freemont, A. J., Watkins, A., Le, Maitre C. et al. Nerve growth factor expression and
innervation of the painful intervertebral disc. J.Pathol., 2002, 3, 286-292.
(50) Sambrook, P. N., MacGregor, A. J., and Spector, T. D. Genetic influences on cervical
and lumbar disc degeneration: a magnetic resonance imaging study in twins. Arthritis
Rheum., 1999, 2, 366-372.
(51) Virtanen, I. M., Karppinen, J., Taimela, S. et al. Occupational and genetic risk factors
associated with intervertebral disc disease. Spine, 1-5-2007, 10, 1129-1134.
(52) Battie, M. C. and Videman, T. Lumbar disc degeneration: epidemiology and genetics.
J.Bone Joint Surg.Am., 2006, 3-9.
(53) Roughley, P. J. Biology of intervertebral disc aging and degeneration: involvement of the
extracellular matrix. Spine, 1-12-2004, 23, 2691-2699.

24
(54) Hunter, C. J., Matyas, J. R., and Duncan, N. A. The notochordal cell in the nucleus
pulposus: a review in the context of tissue engineering. Tissue Eng, 2003, 4, 667-677.
(55) Moore, R. J. The vertebral endplate: disc degeneration, disc regeneration. Eur.Spine J.,
2006, S333-S337.
(56) Holm, S., Holm, A. K., Ekstrom, L., Karladani, A., and Hansson, T. Experimental disc
degeneration due to endplate injury. J.Spinal Disord.Tech., 2004, 1, 64-71.
(57) Crock, H. V. and Yoshizawa, H. The blood supply of the lumbar vertebral column.
Clin.Orthop.Relat Res., 1976, 115, 6-21.
(58) Miller, J. A., Schmatz, C., and Schultz, A. B. Lumbar disc degeneration: correlation with
age, sex, and spine level in 600 autopsy specimens. Spine, 1988, 2, 173-178.
(59) Roberts, S., Evans, H., Trivedi, J., and Menage, J. Histology and pathology of the human
intervertebral disc. J.Bone Joint Surg.Am., 2006, 10-14.
(60) Lopez-Espina, C. G., Amirouche, F., and Havalad, V. Multilevel cervical fusion and its
effect on disc degeneration and osteophyte formation. Spine, 20-4-2006, 9, 972-978.
(61) Javedan, S. P. and Dickman, C. A. Cause of adjacent-segment disease after spinal fusion.
Lancet, 14-8-1999, 9178, 530-531.
(62) Huang, R. C. and Sandhu, H. S. The current status of lumbar total disc replacement.
Orthop.Clin.North Am., 2004, 1, 33-42.
(63) Seo, M. and Choi, D. Adjacent segment disease after fusion for cervical spondylosis;
myth or reality? Br.J.Neurosurg., 2008, 2, 195-199.

25
(64) Cheh, G., Bridwell, K. H., Lenke, L. G. et al. Adjacent segment disease
followinglumbar/thoracolumbar fusion with pedicle screw instrumentation: a
minimum 5-year follow-up. Spine, 15-9-2007, 20, 2253-2257.
(65) Hilibrand, A. S. and Robbins, M. Adjacent segment degeneration and adjacent segment
disease: the consequences of spinal fusion? Spine J., 2004, 6 Suppl, 190S-194S.
(66) Park, C. K., Ryu, K. S., and Jee, W. H. Degenerative changes of discs and facet joints in
lumbar total disc replacement using ProDisc II: minimum two-year follow-up. Spine,
15-7-2008, 16, 1755-1761.
(67) Anderson, P. A. and Rouleau, J. P. Intervertebral disc arthroplasty. Spine, 1-12-2004, 23,
2779-2786.
(68) Wilson-MacDonald, J. and Boeree, N. Controversial topics in surgery: degenerative disc
disease: disc replacement. For. Ann.R.Coll.Surg.Engl., 2007, 1, 6-11.
(69) Resnick, D. K. and Watters, W. C. Lumbar disc arthroplasty: a critical review.
Clin.Neurosurg., 2007, 83-87.
(70) Chang, G., Kim, H. J., Kaplan, D., Vunjak-Novakovic, G., and Kandel, R. A. Porous silk
scaffolds can be used for tissue engineering annulus fibrosus. Eur.Spine J., 2007, 11,
1848-1857.
(71) O'Halloran, D. M. and Pandit, A. S. Tissue-engineering approach to regenerating the
intervertebral disc. Tissue Eng, 2007, 8, 1927-1954.

26
(72) Johnson, W. E., Wootton, A., El, Haj A. et al. Topographical guidance of intervertebral
disc cell growth in vitro: towards the development of tissue repair strategies for the
anulus fibrosus. Eur.Spine J., 2006, 15, S389-S396.
(73) Gunatillake, P. A. and Adhikari, R. Biodegradable synthetic polymers for tissue
engineering. Eur.Cell Mater., 20-5-2003, 1-16.
(74) Sato, M., Asazuma, T., Ishihara, M. et al. An atelocollagen honeycomb-shaped scaffold
with a membrane seal (ACHMS-scaffold) for the culture of annulus fibrosus cells
from an intervertebral disc. J.Biomed.Mater.Res.A, 1-2-2003, 2, 248-256.
(75) Thonar, E., An, H., and Masuda, K. Compartmentalization of the matrix formed by
nucleus pulposus and annulus fibrosus cells in alginate gel. Biochem.Soc.Trans.,
2002, Pt 6, 874-878.
(76) Wilda, H. and Gough, J. E. In vitro studies of annulus fibrosus disc cell attachment,
differentiation and matrix production on PDLLA/45S5 Bioglass composite films.
Biomaterials, 2006, 30, 5220-5229.
(77) Rong, Y., Sugumaran, G., Silbert, J. E., and Spector, M. Proteoglycans synthesized by
canine intervertebral disc cells grown in a type I collagen-glycosaminoglycan matrix.
Tissue Eng, 2002, 6, 1037-1047.
(78) Alini, M., Li, W., Markovic, P. et al. The potential and limitations of a cell-seeded
collagen/hyaluronan scaffold to engineer an intervertebral disc-like matrix. Spine, 1-
3-2003, 5, 446-454.

27
(79) Mizuno, H., Roy, A. K., Vacanti, C. A. et al. Tissue-engineered composites of anulus
fibrosus and nucleus pulposus for intervertebral disc replacement. Spine, 15-6-2004,
12, 1290-1297.
(80) Ishihara, H. and Urban, J. P. Effects of low oxygen concentrations and metabolic
inhibitors on proteoglycan and protein synthesis rates in the intervertebral disc.
J.Orthop.Res., 1999, 6, 829-835.
(81) Li, H. Y. and Chang, J. pH-compensation effect of bioactive inorganic fillers on the
degradation of PLGA. Composites Science and Technology, 2005, 14, 2226-2232.
(82) Taylor, M. S., Daniels, A. U., Andriano, K. P., and Heller, J. Six bioabsorbable polymers:
in vitro acute toxicity of accumulated degradation products. J.Appl.Biomater., 1994,
2, 151-157.
(83) Guelcher, S. A. Biodegradable polyurethanes: synthesis and applications in regenerative
medicine. Tissue Eng Part B Rev., 2008, 1, 3-17.
(84) Santerre, J. P., Woodhouse, K., Laroche, G., and Labow, R. S. Understanding the
biodegradation of polyurethanes: from classical implants to tissue engineering
materials. Biomaterials, 2005, 35, 7457-7470.
(85) P.Bruin, G.J.Veenstra, A.J.Nijenhuis, and A.J.Pennings Design and synthesis of
biodegradable poly(ester-urethane) elastomer networks composed of non-toxic
building blocks. Die Makromolekulare Chemie, Rapid Communications, 1988, 8,
589-594.

28
(86) Zhang, J. Y., Beckman, E. J., Piesco, N. P., and Agarwal, S. A new peptide-based
urethane polymer: synthesis, biodegradation, and potential to support cell growth in
vitro. Biomaterials, 2000, 12, 1247-1258.
(87) Skarja, G. A. and Woodhouse, K. A. Synthesis and characterization of degradable
polyurethane elastomers containing and amino acid-based chain extender.
J.Biomater.Sci.Polym.Ed, 1998, 3, 271-295.
(88) Saad, B., Ciardelli, G., Matter, S. et al. Degradable and highly porous polyesterurethane
foam as biomaterial: effects and phagocytosis of degradation products in osteoblasts.
J.Biomed.Mater.Res., 15-3-1998, 4, 594-602.
(89) Cohn, D., Stern, T., Gonzalez, M. F., and Epstein, J. Biodegradable poly(ethylene
oxide)/poly(epsilon-caprolactone) multiblock copolymers. J.Biomed.Mater.Res.,
2002, 2, 273-281.
(90) Woo, G. L., Mittelman, M. W., and Santerre, J. P. Synthesis and characterization of a
novel biodegradable antimicrobial polymer. Biomaterials, 2000, 12, 1235-1246.
(91) Wang, G. B., Labow, R. S., and Santerre, J. P. Biodegradation of a poly(ester)urea-
urethane by cholesterol esterase: isolation and identification of principal
biodegradation products. J.Biomed.Mater.Res., 5-9-1997, 3, 407-417.
(92) Labow, R. S., Meek, E., and Santerre, J. P. Synthesis of cholesterol esterase by
monocyte-derived macrophages: a potential role in the biodegradation of
poly(urethane)s. J.Biomater.Appl., 1999, 3, 187-205.

29
(93) Labow, R. S., Sa, D., Matheson, L. A., and Santerre, J. P. Polycarbonate-urethane hard
segment type influences esterase substrate specificity for human-macrophage-
mediated biodegradation. J.Biomater.Sci.Polym.Ed, 2005, 9, 1167-1177.
(94) Tang, Y. W., Labow, R. S., and Santerre, J. P. Enzyme-induced biodegradation of
polycarbonate-polyurethanes: dependence on hard-segment chemistry.
J.Biomed.Mater.Res., 15-12-2001, 4, 597-611.
(95) van, Minnen B., van Leeuwen, M. B., Stegenga, B. et al. Short-term in vitro and in vivo
biocompatibility of a biodegradable polyurethane foam based on 1,4-
butanediisocyanate. J.Mater.Sci.Mater.Med., 2005, 3, 221-227.
(96) Stankus, J. J., Guan, J., and Wagner, W. R. Fabrication of biodegradable elastomeric
scaffolds with sub-micron morphologies. J.Biomed.Mater.Res.A, 15-9-2004, 4, 603-
614.
(97) Thapa, A., Miller, D. C., Webster, T. J., and Haberstroh, K. M. Nano-structured polymers
enhance bladder smooth muscle cell function. Biomaterials, 2003, 17, 2915-2926.
(98) Yang, L., Kandel, R. A., Chang, G., and Santerre, J. P. Polar Surface Chemistry of
Nanofibrous Polyurethane Scaffold Affects Annulus Fibrosus Cell Attachment and
Early Matrix Accumulation. J.Biomed.Mater.Res.A, 2008,
http://www3.interscience.wiley.com/journal/121582889/.
(99) Nerurkar, N. L., Elliott, D. M., and Mauck, R. L. Mechanics of oriented electrospun
nanofibrous scaffolds for annulus fibrosus tissue engineering. J.Orthop Res, 2007, 8,
1018-1028.

30
VII: Characterization of a Biodegradable Electrospun
Polyurethane Nanofiber Scaffold: Mechanical Properties
and Cytotoxicity

31
Characterization of a Biodegradable Electrospun
Polyurethane Nanofiber Scaffold: Mechanical
Properties and Cytotoxicity
Masoud Yeganegi1, 2, Rita A Kandel 1, 2, 3, and J Paul Santerre2, 4
1CIHR- Bioengineering of Skeletal Tissues Team, Mount Sinai Hospital, Toronto, M5G 1X5
Canada
2Institute of Biomaterials and Biomedical Engineering and Department of Materials Science and
Engineering, University of Toronto, Toronto, M5S 3G9 Canada
3 Department of Pathobiology and Laboratory Medicine, Mt. Sinai Hospital, University of
Toronto, Toronto, M5G 1X5 Canada
4Faculty of Dentistry, University of Toronto, Toronto, M5G 1G6 Canada
To whom correspondence should be sent:
Dr. Paul Santerre
Department of Biological and Diagnostic Sciences
Faculty of Dentistry
University of Toronto
124 Edward St., Toronto, Ontario, Canada
M5G 1G6
Phone: (416) 979 4903 x4341
Email: [email protected]

32
Introduction
The human vertebral column is made up of 26 vertebral bodies that provide support to the
body and protect the spinal cord. The intervertebral discs lying between the vertebrae provide
flexibility and help dissipate mechanical loads and shocks that would otherwise damage the
vertebral column.1 The intervertebral discs are composed of the annulus fibrosus, a
fibrocartilaginous tissue, which surrounds the gelatinous inner nucleus pulposus. The hyaline
cartilage endplates found at each end represent the anatomical limits of the disc and contribute to
the interface of the disc and bone.
The annulus fibrosus (AF) is responsible for withstanding circumferential tensile forces and to
a lesser extent compressive forces.2 The outer AF consists of concentric lamella, made up of
collagen fibers, and oriented at approximately 60º to the vertical. The alignment of these fibers
alternates between successive lamellae and is of great importance to the functional nature of the
annulus fibrosus.3 The AF extracellular matrix contains collagen fibrils, proteoglycans and water.
Water makes up 60% of the annulus fibrosus, while collagen and proteoglycans account for 50-
70% and 10-20% of the dry weight respectively. 4 The composition of the annulus fibrosus is
radially non-uniform in that collagen type I decreases in concentration radially towards the
center of the disc.5 Conversely, collagen type II which is present in small quantities in the AF,
increases in concentration toward its innermost lamellae. The relative proportion of collagen type
I to collagen type II in the annulus fibrosus varies from 70:30 in the innermost layers and 85:15
in the outer layers.4 Other types of collagen also exist in smaller amounts in the annulus
fibrosus.6

33
The mechanical properties of intervertebral discs are complex and the literature on this topic
shows significant variability, 7-10 perhaps in part due to the diversity of experimental conditions
and mechanical models used to measure material properties. Studies indicate that the annulus
fibrosus exhibits both matrix viscoelastic (flow-independent) and biphasic viscoelastic (flow-
dependent) behaviour. 10 The elastic modulus of a single lamella of annulus fibrosus has been
found to vary with radial position in the disc with values ranging from 5±4 MPa for posterior
inner AF, 20±12 MPa for posterior outer AF, 10±6 MPa for anterior inner AF, and 49±32 MPa
for anterior outer AF. 2 The ultimate stress of a single lamella of annulus fibrosus also varies
radially from 0.9±0.3 MPa for posterior inner AF, 1.1±0.3 MPa for posterior outer AF, 0.9±0.7
MPa for anterior inner AF, and 3.3±1.3 MPa for anterior outer AF. 2 Thus the forces experienced
by the AF tissue can be quite high and therefore an intact AF is critical to proper disc function.
Back pain is ranked the most prevalent chronic disease for people under 60.11 Degenerative
disc disease may contribute to the pathogenesis of lower back pain and involves the progressive
degeneration of the intervertebral disc (IVD). The intact disc is necessary to support compressive
and bending stresses while providing flexibility to the spine.12 Currently, existing treatments
include, discectomy, the use of a prosthetic substitute, or the fusion of adjacent vertebrae, none
of which are optimal. Spinal fusion may be effective in some cases, but a number of patients can
develop degeneration, due to reduced flexibility and increased stress in adjacent segments. 13-16
Complications, can also occur in patients undergoing disc replacement with synthetic substrates.
Dislocations, slippage, wear and mechanical failure, although rare, have been reported.17 The
formation of wear debris can induce an inflammatory response mediated by various cytokines,
leading to pain, osteolysis, fibrous tissue formation, prosthetic loosening and pain.17,18

34
One alternative strategy for the treatment of intervertebral disc degeneration is the replacement
of the diseased tissue by a tissue-engineered substitute.19-21 Tissue engineering of the annulus
fibrosus is particularly difficult due to the complex structure of the tissue. Efforts in producing
AF tissue in vitro have involved various polymeric scaffolds including PDLLA/45S5 Bioglass®
films, polyglycolic acid, collagen/hyaluronan, collagen/gag, atelocollagen, and alginate
scaffolds.22-27 In addition to inadequate tissue formation, some biomaterials, such as
polyglycolic-based polymers, create acidic byproducts throughout their biodegradation, which
can significantly alter cell behavior, tissue production and possibly cause cell death.28,29
In this study, a potentially more suitable alternative, polycarbonate-urethane polymers, were
used owing to their biocompatible, biodegradable and reproducible nature. Further, this polymer
can be synthesized with the addition of molecules that may enhance cell attachment. It is
possible to use electrospin this polymer and fabricate aligned fibers, which mimic the aligned
nature of the annulus fibrosus, and thus providing a more appropriate scaffold to support the
growth of such a tissue, especially as topographical properties have been shown to influence cell
alignment.30 The high surface to volume ratio of these scaffolds is expected to favor cell
attachment and retention of cell phenotype. 31,32 The purpose of this study was to characterize the
electrospun PU nanofiber biomaterial, and determine its suitability for use in repairing the AF.
Experimental Section
Materials
Polyurethanes have been used in biomedical devices since the 1960s. Efforts in the 80’s and
90’s had previously been directed at producing biostable polyurethanes, however in the past
decade, the focus has shifted to developing bioactive/biocompatible and biodegradable

35
polyurethanes for the purpose of tissue engineering or regeneration.33,34 In this study,
polycarbonate urethane (PU) was synthesized, as has been described, with hexane
diisocyanate:polycarbonate diol:butane diol molar ratio of 3:2:1 35. In addition, an anionic
dihydroxyl oligomer (ADO) additive was synthesized through the reaction of lysine
diisocyanate, polytetramethylene oxide, and hydroxyethyl methacrylate (HEMA). 32 This anionic
additive has been previously shown to increase AF cellular adhesion mediated by protein
adsorption to the surface. 32
Electospinning was employed to fabricate either random or aligned nanofiber scaffolds using
the base polymer (PU) with or without ADO (0.5 wt.%). The polymer was dissolved in
1,1,1,3,3,3-hexafluora-2-propanol at a concentration of 16 wt.%. The scaffold was then
electrospun, by injecting the polymer solution from a metallic syringe at a rate of 0.5 ml/hr onto
the collecting surface. An 18 kilovolts difference was applied across the syringe and the
collecting surface. In the case of aligned scaffolds, the collecting surface consisted of a
cylindrical aluminum mandrel rotating at 1250 rpm, such that the surface of the mandrel moved
at 10 meters/s.32,36 For the random scaffold, a stationary aluminum plate was used. Relative
humidity (<30%) and temperature (approximately 25ºC) were controlled to minimize adverse
effects on the scaffold quality and reproducibility. The resulting electrospun films were
approximately 106 ± 5µm and 550 ± 50µm thick for aligned and random scaffolds respectively.
The fibers ranged from 200-400 nm in diameter as measured by scanning electron microscopy
(Figure 1).

36
Biodegradation Study
Cholesterol Esterase (CE) has been shown to be present in monocytes as they differentiate into
macrophages and has been reported to degrade PUs.37,38 Thus this enzyme was selected to
evaluate the biodegradation of the PU scaffolds. CE (C3766, Sigma Aldrich, St. Louis, MO) was
adjusted to 10 units/ml, with 1 unit defined as generating 1 nmol/min of p-nitrophenol from p-
nitrophenylbutyrate (as measured colorimetrically by the DU 800 Beckman Coulter
Spectrophotometer).37 This enzyme concentration was selected based on previous CE dose
response studies, and was chosen to ensure that adequate degradation would occur throughout
the four week study. 39 The half-life of CE in the presence of the polymer was approximately 12
hours (Figure 2), thus, throughout the 4-week biodegradation study, appropriate volumes of a
concentrated enzyme solution (100 units/ml) were added daily to adjust the CE activity to a final
concentration of 10 units/ml in a phosphate buffer solution (PBS, pH 7.0, 37ºC) containing the
samples.
Assessment of Mechanical Properties
To evaluate their biodegradation properties, dried scaffolds were cut into 6mm x 30mm pieces
(thickness of 106 ± 5µm and 550 ± 50µm for aligned and random scaffolds respectively) and
weighed (Ohaus Explorer analytical balance) prior to placing in the enzymatic solution. The
differences in thickness between the aligned and random scaffolds stem from the fact that
following the fabrication process, thinner random polymers are difficult to remove from the
deposition surface due to their inferior mechanical properties, and thus thicker polymers were
required to prevent polymer deformation prior to mechanical testing. The scaffolds were
collected weekly, washed in dH2O, lyophilized and weighed to determine average mass loss. The
dried scaffolds underwent tensile testing prior to and during the 4-week biodegradation period to

37
assess mechanical properties. Each polymer sample was carefully immobilized on either end
using metallic clamps, and the tensile strength was evaluated using a mechanical testing device
(Instron® model 8501) under a tensile strain of 10 mm/min to breaking point. The initial
modulus and the ultimate stress were used as measures of intrinsic mechanical properties
throughout the degradation period.
Differential Scanning Calorimetry
Differential scanning calorimetry (DSC) was performed to assess the crystallinity of scaffolds
and changes in their microstructure due to the pre-wetting and drying process. The samples were
pre-wet in phosphate buffer in the absence of CE for one week, washed in distilled water and
lyophilized. The dried samples were then compared to as-made controls to understand the effects
of the wetting and drying processes on the scaffolds. A small section of each sample, weighing
approximately 2–3 mg, was cooled using liquid nitrogen and the thermograms were recorded
between −100 to 200°C at a heating rate of 15°C/min (DSC was performed using the TA
Instruments differential scanning calorimeter (model 2910) at the Brockhouse Institute for
Material Research, McMaster University, Hamilton, Ontario, Canada). Data recorded for the first
of two consecutive heating cycles was used to analyze possible crystalline state changes.
Evaluation of Degradation Products
The soluble and non-soluble degradation products were collected. Phosphate buffered saline
(PBS) containing the degradation products, was spun down at 3,000 RCF to isolate the non-
soluble particulate. Aliquots of the non-soluble degradation products were placed directly in
formvar-coated grids and imaged using transmission electron microscopy (TEM, FEI Tecnai 20,

38
Hillsboro, Oregon) to visualize particulate size and morphology. Following the separation of
soluble and non-soluble degradation products, cytotoxicity studies were performed.
Cytotoxicity Study
To evaluate if the degradation products were cytotoxic, bovine annulus fibrous cells were
chosen as a valid model for human lumbar AF 40-42. Briefly, to obtain AF cells, intervertebral
discs from bovine caudal spines (6–9 months old) were dissected out aseptically. Five discs from
one spine were combined to obtain sufficient cells for an experiment. The outer annulus was
separated from the disc and minced into small pieces. To isolate the cells, the tissues underwent
serial digestion with 0.5% protease (Sigma, St. Louis, MO) for 1 hour at 37° C, followed by
0.25% collagenase A (Roche, Laval, Quebec, Canada) overnight at 37° C. The cell suspension
was filtered through a sterile mesh (pore size: 70µm), and re-suspended in Ham’s F12 media
supplemented with 5% fetal bovine serum (FBS). AF cells were placed in monolayer culture
(seeding density of 1x10⁵/cm2) and grown for 48 hours in Ham’s F12 media containing 5% fetal
bovine serum. The non-soluble degradation products were added to the tissue culture media at
concentrations ranging from 0.001 to 0.1 wt %. Soluble degradation products (in PBS) were
added to the media at various concentrations ranging from 20% to 100%. Cytotoxicity of the
degradation products was assessed using the MTT assay and Live/Dead fluorescent imaging. In
the MTT assay, mitochondrial dehydrogenase of viable cells cleave the tetrazolium ring of 3-
(4,5-Dimethylthiazol-2-yl)-2,5-diphenyltetrazolium bromide (MTT) yielding purple formazan
crystals which are insoluble in aqueous solutions. The resulting crystals were dissolved in
methoxyethanol (acidified with HCL to pH: 3). The resulting purple solution was measured
spectrophotometrically at a wavelength of 570nm (Thermo Scientific model Multiskan Ex
photometer). Hydrogen peroxide (0.01%) served as a positive control.43 In the live/dead assay

39
(L-3224, Invitrogen, Burlington, ON) Calcein AM is enzymatically converted to its fluorescent
variant, which in cells with intact membranes, is concentrated within the cytoplasm. Ethidium
homodimer-1 enters cells with damaged membranes and binds to nucleic acids and becomes
fluorescent. ImageJ (ver. 1.4g) was used to find regions of interest (ROI) by isolating local
maxima, which targeted the intensified Calcein AM observed around the nucleus of viable cells.
These ROIs were then manually examined to ensure that only viable cells were detected and
counted. This procedure was similarly used to detect dead cells stained by Ethidium homodimer-
1. On average, nearly 600 cells were counted for each data point.
Statistical analysis
All test groups contained at least four samples and each experiment was repeated at least 3
times. The results from all experiments were combined and expressed as the mean ± standard
error of the mean. The data were analyzed using a one-way analysis of variance and all pair-wise
comparisons between groups were conducted using the Scheffe post hoc test. Significance was
assigned at p-values < 0.05.
Results and Discussion
Comparing the mass of polymers before and after degradation, it was observed that
degradation by CE reached an average of 2.0 mg per sample for all groups by week four. This
enzyme concentration had specifically been adjusted to produce such an extent of degradation as
appropriate for the purposes of evaluating any changes in mechanical properties and subsequent
assessment of degradation product cytotoxicity. The rate of biodegradation was 0.56 ± 0.05
mg/week and was relatively linear over the four weeks (r2=0.86) (Figure 3a), reaching a
maximum cumulative mass loss of 30±2% for aligned scaffolds and 7±2% for random scaffolds

40
at four weeks. The absolute mass loss was similar for both random and aligned scaffolds despite
differences in relative mass loss (Figure 3b). This, combined with the fact that all samples
possessed the same surface area available for enzymatic degradation, suggests that surface-
mediated degradation took place rather than bulk material breakdown. These findings, likely
explained by diffusion limitations imposed by the scaffold on cholesterol esterase, are in
agreement with previous studies on polyurethane biomaterials in which CE mediated surface
degradation was primarily observed.44,45
The aligned samples experienced a significant decrease (45.6 MPa to 8.9 MPa, p<0.05) in the
initial modulus following a wetting and drying process and prior to degradation (Figure 4a). In
addition, a significant drop in tensile strength (13.8 MPa to 6.6 MPa, p<0.05) was also observed
in aligned scaffolds (Figure 4b). There was no observed difference between PU and
PU+0.5%ADO samples, suggesting that ADO did not appear to have any plasticizing or
hardening effects on the mechanical behaviour of the scaffolds. In order to further study the
structural transformations introduced in the materials during the pre-wetting and drying process,
samples were analyzed using differential scanning calorimetry (DSC). The thermal transition
temperatures were relatively similar for both PU and PU+0.5%ADO scaffolds (Figure 5 a and b).
The Tv hard segment melting transition temperature remained relatively unchanged near 93ºC
across all samples and was unaffected by the pre-wetting process. Likewise, the Tg values for
polycarbonate near -36°C remained relatively unchanged. This temperature corresponds to the
crystalline segments containing polar urethane groups, which are anticipated to be the most
stable regions of the polymer due to extensive hydrogen bonding within this domain. Perhaps the
most striking difference between the as-made controls and the pre-wet samples was the shift in
the soft-segment melting transition temperature (Tiii and Tiv in Figure 5) from approximately

41
51ºC to 68ºC respectively. The shift of this phase towards higher temperatures for the PCN phase
of the polymer suggests a loss of PCN phase purity (pure polycarbonate has a melt transition
temperature of 45ºC 35) and an increase in phase mixing of hard segment with the soft segment
content. More evidence that the pre-wetting process disrupted the crystalline state of the soft
segment polycarbonate (PCN) phase was observed near 33ºC (Tii, Figure 5). The appearance of
the onset of the soft segment melt phase for the prewet sample is distant from the endotherm at
67ºC. Such a broad transition is characteristic of a heterogeneous phase. These transformations
may be disrupting the organization of the crystalline matrix for the soft segments and are
believed to be contributing in part to the softening of the material post exposure to aqueous
medium and the resulting deterioration in its mechanical properties. In the case of random
scaffolds, no significant drop in mechanical properties were observed with exposure to water.
This may be explained in part by the slower buffer uptake by random scaffolds due to their
substantially greater thickness (550 ± 50µm for random vs 106 ± 5µm for oriented scaffolds).
Further, DSC results for random scaffolds show a slightly lower shift in the soft-segment melt
temperature (a shift of 12°C as compared to 17°C), which may partially account for the
differences in the effects of buffer uptake. Aligned scaffolds are subjected to stress induced
strain due to the forces experienced by polymer fibers as they deposit onto the rotating mandrel.
Such stress induced strain in polyurethanes, which has been recognized as affecting material
morphology and chemistry, may contribute to the varying responses of aligned and random
scaffolds to buffer uptake.46
After the initial exposure to the aqueous medium, the mechanical properties of the scaffolds
showed no further significant changes during the course of the four week biodegradation study,
despite showing a degradation rate of 0.56 ± 0.05 mg/week (Figures 3 and 6). The surface-
42
mediated biodegradation mechanism helps explain the lack of a significant drop in mechanical
properties, since the observed mass losses are accompanied by similar drops in thickness of the
scaffolds. Throughout the four week biodegradation process, corresponding to a maximum 30 %
mass loss, the aligned scaffolds retained values of approximately 8.0 MPa for the modulus and
2.3 MPa for the tensile strength, thereby remaining within the same range as those of native
tissue (Figure 6). Random scaffolds were similarly unaffected by the four week biodegradation
study, although the relative mass loss was significantly lower which could partly explain the
absence of any changes in mechanical properties. The reported literature values of elastic
modulus for a single lamella of native human AF are 5±4 MPa for posterior inner AF, 20±12
MPa for posterior outer AF, 10±6 MPa for anterior inner AF, and 49±32 MPa for anterior outer
AF. 2 The ultimate stress of single lamellae of annulus fibrosus similarly varies radially from
0.9±0.3 MPa for posterior inner AF, 1.1±0.3 MPa for posterior outer AF, 0.9±0.7 MPa for
anterior inner AF, and 3.3±1.3 MPa for anterior outer AF. 2 Overall, the initial moduli and
ultimate stress of the different scaffold groups were comparable and in some cases superior to
those of native AF tissue.
In this study, cholesterol esterase was used to degrade the polymer samples. Although this
gives an indication of what may occur in vivo as CE is known to be secreted by macrophages
37,38, the latter also secrete other proteases as well as oxidative agents, which would introduce
oxidative degradation in addition to the hydrolytic degradation cause by CE. Hence, further In
vivo studies are required to fully assess the biodegradation behavior. The degradation products
were spun down and separated into soluble and non-soluble products. The non-soluble products,
imaged by transition electron microscopy, varied in shape and size (Figure 7). The thickness of
the fiber fragment was found to be approximately on average 400 nm, which is comparable to

43
that of the electrospun nanofibers (Figure a). Different concentration gradients of the soluble and
non-soluble degradation products were applied to bovine annulus fibrosus cells grown in
monolayer culture. The MTT colorimetric assay indicated no significant cytotoxic effects from
either non-soluble or soluble degradation products, from the scaffolds made from PU or
PU+ADO (Figure 8a and b). Although the MTT assay is used to measure cytotoxicity, it is an
indicator of metabolic activity. Thus, a live/dead assay was performed concurrently with the
MTT assay to confirm the findings. The live/dead assay confirmed that the material’s
degradation products did not induce cytotoxicity (Figures 9 and 10). These results are in
agreement with our hypothesis that degradation of PU would likely produce non-toxic
byproducts given previous studies of related biomaterials. 34 This work has concentrated on
investigating possible effects of degradation products on cell viability and morphology. Future
studies are required to explore additional indicators of toxicity such as the effect degradation
fragments on cell proliferation and extracellular matrix synthesis.
Conclusion
The findings in this study have shown that electrospun aligned scaffolds produced superior
mechanical properties in relation to random scaffolds and suggest this formulation as a more
appropriate scaffold for engineering annulus fibrosus tissue. An important consideration in the
design of such scaffolds is the issue of structural changes due to water uptake into the material,
particularly as it relates to the rate of degradation. It was established that exposure to aqueous
media disrupted the material’s chemical structure and resulted in a reduction of its mechanical
properties. DSC showed the appearance of disrupted soft segment crystal phase with changes in
the degree of phase mixing of hard and soft segments as well as the PCN crystal state within the
polymer. The degradation of the polymer by cholesterol esterase provided a useful model for
44
biodegradation, yielding a controlled and consistent mass loss rate. Of particular importance, the
degradation of the materials, which resulted in mass losses as high as 30% over four weeks, did
not result in a significant deterioration of mechanical properties, indicating a surface degradation
process rather than bulk material breakdown. This finding is supported by the fact that absolute
mass loss appears to be independent of the thickness of the scaffold and appears to be in
agreement with previous studies in which CE mediated surface degradation has been observed.44
The degradation products did not cause significant acute cytotoxicity in-vitro. Additional
mechanical studies to explore the changes in mechanical properties of the aligned polymer in the
presence of AF tissue grown on the PU substrate will provide further understanding of the role of
this polymer for AF tissue engineering. In summary, the results of this report, namely the
relatively constant rate of material degradation, the observed mechanical behavior resembling
that of AF tissue, and the absence of cytotoxic effects make this polymer a suitable biomaterial
candidate for use in the formation of tissue-engineered annulus fibrosus.
Acknowledgements
The funding for this work was provided by a University of Toronto Fellowship Award, an
Ontario Graduate Scholarship in Science and Technology (OGSST), in addition to an NSERC-
CIHR Collaborative Health Research Program (CHRP) grant (312882) and a CIHR operating
grant (MOP86723).
45
References:
(1) Bogduk, Nikolai. Clinical anatomy of the lumbar spine and sacrum, Elsevier Churchill
Livingstone: Edinburgh, 2005.
(2) Ebara, S., Iatridis, J. C., Setton, L. A. et al. Tensile properties of nondegenerate human
lumbar anulus fibrosus. Spine, 2-15-1996, 4, 452-461.
(3) Marchand, F. and Ahmed, A. M. Investigation of the laminate structure of lumbar disc
anulus fibrosus. Spine, 1990, 5, 402-410.
(4) Eyre, D. R. and Muir, H. Types I and II collagens in intervertebral disc. Interchanging
radial distributions in annulus fibrosus. Biochem.J., 7-1-1976, 1, 267-270.
(5) Bruehlmann, S. B., Rattner, J. B., Matyas, J. R., and Duncan, N. A. Regional variations in
the cellular matrix of the annulus fibrosus of the intervertebral disc. J.Anat., 2002, 2,
159-171.
(6) Roughley, P. J. Biology of intervertebral disc aging and degeneration: involvement of the
extracellular matrix. Spine, 12-1-2004, 23, 2691-2699.
(7) Riches, P. E., Dhillon, N., Lotz, J., Woods, A. W., and McNally, D. S. The internal
mechanics of the intervertebral disc under cyclic loading. J.Biomech., 2002, 9, 1263-
1271.
(8) Alkalay, R. The Material and Mechanical Properties of the Healthy and Degenerated
Intervertebral Disc. In Integrated Biomaterials Science, Springer US, 2002.

46
(9) Baer, A. E., Laursen, T. A., Guilak, F., and Setton, L. A. The micromechanical
environment of intervertebral disc cells determined by a finite deformation, anisotropic,
and biphasic finite element model. J.Biomech.Eng, 2003, 1, 1-11.
(10) Wu, H. C. and Yao, R. F. Mechanical behavior of the human annulus fibrosus. J.Biomech.,
1976, 1, 1-7.
(11) Rapoport, J., Jacobs, P., Bell, N. R., and Klarenbach, S. Refining the measurement of the
economic burden of chronic diseases in Canada. Chronic.Dis.Can., 2004, 1, 13-21.
(12) Urban, J. P. and Roberts, S. Degeneration of the intervertebral disc. Arthritis Res.Ther.,
2003, 3, 120-130.
(13) Lopez-Espina, C. G., Amirouche, F., and Havalad, V. Multilevel cervical fusion and its
effect on disc degeneration and osteophyte formation. Spine, 4-20-2006, 9, 972-978.
(14) Javedan, S. P. and Dickman, C. A. Cause of adjacent-segment disease after spinal fusion.
Lancet, 8-14-1999, 9178, 530-531.
(15) Boden, S. D. Overview of the biology of lumbar spine fusion and principles for selecting a
bone graft substitute. Spine, 8-15-2002, 16 Suppl 1, S26-S31.
(16) Huang, R. C. and Sandhu, H. S. The current status of lumbar total disc replacement.
Orthop.Clin.North Am., 2004, 1, 33-42.
(17) Anderson, P. A. and Rouleau, J. P. Intervertebral disc arthroplasty. Spine, 12-1-2004, 23,
2779-2786.
(18) Anderson, J. M. Inflammatory response to implants. ASAIO Trans., 1988, 2, 101-107.

47
(19) Chang, G., Kim, H. J., Kaplan, D., Vunjak-Novakovic, G., and Kandel, R. A. Porous silk
scaffolds can be used for tissue engineering annulus fibrosus. Eur.Spine J., 2007, 11,
1848-1857.
(20) O'Halloran, D. M. and Pandit, A. S. Tissue-engineering approach to regenerating the
intervertebral disc. Tissue Eng, 2007, 8, 1927-1954.
(21) Johnson, W. E., Wootton, A., El, Haj A. et al. Topographical guidance of intervertebral
disc cell growth in vitro: towards the development of tissue repair strategies for the
anulus fibrosus. Eur.Spine J., 2006, 15, S389-S396.
(22) Sato, M., Asazuma, T., Ishihara, M. et al. An atelocollagen honeycomb-shaped scaffold
with a membrane seal (ACHMS-scaffold) for the culture of annulus fibrosus cells from
an intervertebral disc. J.Biomed.Mater.Res.A, 2-1-2003, 2, 248-256.
(23) Thonar, E., An, H., and Masuda, K. Compartmentalization of the matrix formed by nucleus
pulposus and annulus fibrosus cells in alginate gel. Biochem.Soc.Trans., 2002, Pt 6,
874-878.
(24) Wilda, H. and Gough, J. E. In vitro studies of annulus fibrosus disc cell attachment,
differentiation and matrix production on PDLLA/45S5 Bioglass composite films.
Biomaterials, 2006, 30, 5220-5229.
(25) Rong, Y., Sugumaran, G., Silbert, J. E., and Spector, M. Proteoglycans synthesized by
canine intervertebral disc cells grown in a type I collagen-glycosaminoglycan matrix.
Tissue Eng, 2002, 6, 1037-1047.
48
(26) Alini, M., Li, W., Markovic, P. et al. The potential and limitations of a cell-seeded
collagen/hyaluronan scaffold to engineer an intervertebral disc-like matrix. Spine, 3-1-
2003, 5, 446-454.
(27) Mizuno, H., Roy, A. K., Vacanti, C. A. et al. Tissue-engineered composites of anulus
fibrosus and nucleus pulposus for intervertebral disc replacement. Spine, 6-15-2004, 12,
1290-1297.
(28) Ishihara, H. and Urban, J. P. Effects of low oxygen concentrations and metabolic inhibitors
on proteoglycan and protein synthesis rates in the intervertebral disc. J.Orthop.Res.,
1999, 6, 829-835.
(29) Li, H. Y. and Chang, J. pH-compensation effect of bioactive inorganic fillers on the
degradation of PLGA. Composites Science and Technology, 2005, 14, 2226-2232.
(30) Johnson, W. E., Wootton, A., El, Haj A. et al. Topographical guidance of intervertebral
disc cell growth in vitro: towards the development of tissue repair strategies for the
anulus fibrosus. Eur.Spine J., 2006, 15, S389-S396.
(31) Thapa, A., Miller, D. C., Webster, T. J., and Haberstroh, K. M. Nano-structured polymers
enhance bladder smooth muscle cell function. Biomaterials, 2003, 17, 2915-2926.
(32) Yang, L., Kandel, R. A., Chang, G., and Santerre, J. P. Polar Surface Chemistry of
Nanofibrous Polyurethane Scaffold Affects Annulus Fibrosus Cell Attachment and
Early Matrix Accumulation. J.Biomed.Mater.Res.A, 2008,
http://www3.interscience.wiley.com/journal/121582889/.

49
(33) Guelcher, S. A. Biodegradable polyurethanes: synthesis and applications in regenerative
medicine. Tissue Eng Part B Rev., 2008, 1, 3-17.
(34) Santerre, J. P., Woodhouse, K., Laroche, G., and Labow, R. S. Understanding the
biodegradation of polyurethanes: from classical implants to tissue engineering
materials. Biomaterials, 2005, 35, 7457-7470.
(35) Tang, Y. W., Labow, R. S., and Santerre, J. P. Enzyme-induced biodegradation of
polycarbonate-polyurethanes: dependence on hard-segment chemistry.
J.Biomed.Mater.Res., 12-15-2001, 4, 597-611.
(36) Stankus, J. J., Guan, J., and Wagner, W. R. Fabrication of biodegradable elastomeric
scaffolds with sub-micron morphologies. J.Biomed.Mater.Res.A, 9-15-2004, 4, 603-
614.
(37) Labow, R. S., Meek, E., and Santerre, J. P. Synthesis of cholesterol esterase by monocyte-
derived macrophages: a potential role in the biodegradation of poly(urethane)s.
J.Biomater.Appl., 1999, 3, 187-205.
(38) Labow, R. S., Sa, D., Matheson, L. A., and Santerre, J. P. Polycarbonate-urethane hard
segment type influences esterase substrate specificity for human-macrophage-mediated
biodegradation. J.Biomater.Sci.Polym.Ed, 2005, 9, 1167-1177.
(39) Tang, Y. W., Labow, R. S., and Santerre, J. P. Enzyme induced biodegradation of
polycarbonate-polyurethanes: dose dependence effect of cholesterol esterase.
Biomaterials, 2003, 12, 2003-2011.

50
(40) Demers, C. N., Antoniou, J., and Mwale, F. Value and limitations of using the bovine tail
as a model for the human lumbar spine. Spine, 12-15-2004, 24, 2793-2799.
(41) Cotterill, P. C., Kostuik, J. P., D'Angelo, G., Fernie, G. R., and Maki, B. E. An anatomical
comparison of the human and bovine thoracolumbar spine. J.Orthop.Res., 1986, 3, 298-
303.
(42) Wilke, H. J., Krischak, S., and Claes, L. Biomechanical comparison of calf and human
spines. J.Orthop.Res., 1996, 3, 500-503.
(43) Hoffmann, M. E. and Meneghini, R. Action of hydrogen peroxide on human fibroblast in
culture. Photochem.Photobiol., 1979, 1, 151-155.
(44) Christenson, E. M., Patel, S., Anderson, J. M., and Hiltner, A. Enzymatic degradation of
poly(ether urethane) and poly(carbonate urethane) by cholesterol esterase.
Biomaterials, 2006, 21, 3920-3926.
(45) Skarja, G. A. and Woodhouse, K. A. In vitro degradation and erosion of degradable,
segmented polyurethanes containing an amino acid-based chain extender.
J.Biomater.Sci.Polym.Ed, 2001, 8, 851-873.
(46) Santerre, J. P., Woodhouse, K., Laroche, G., and Labow, R. S. Understanding the
biodegradation of polyurethanes: from classical implants to tissue engineering
materials. Biomaterials, 2005, 35, 7457-7470.

51
Figures
Figure 1. Scanning Electron Microscopy Images of aligned (a) and random (b) electrospun
Polycarbonate Urethane Nanofiber Scaffolds. (Solution: 16 wt.% PU, injection rate:
0.5 ml/hr, potential difference: 18 kilovolts)
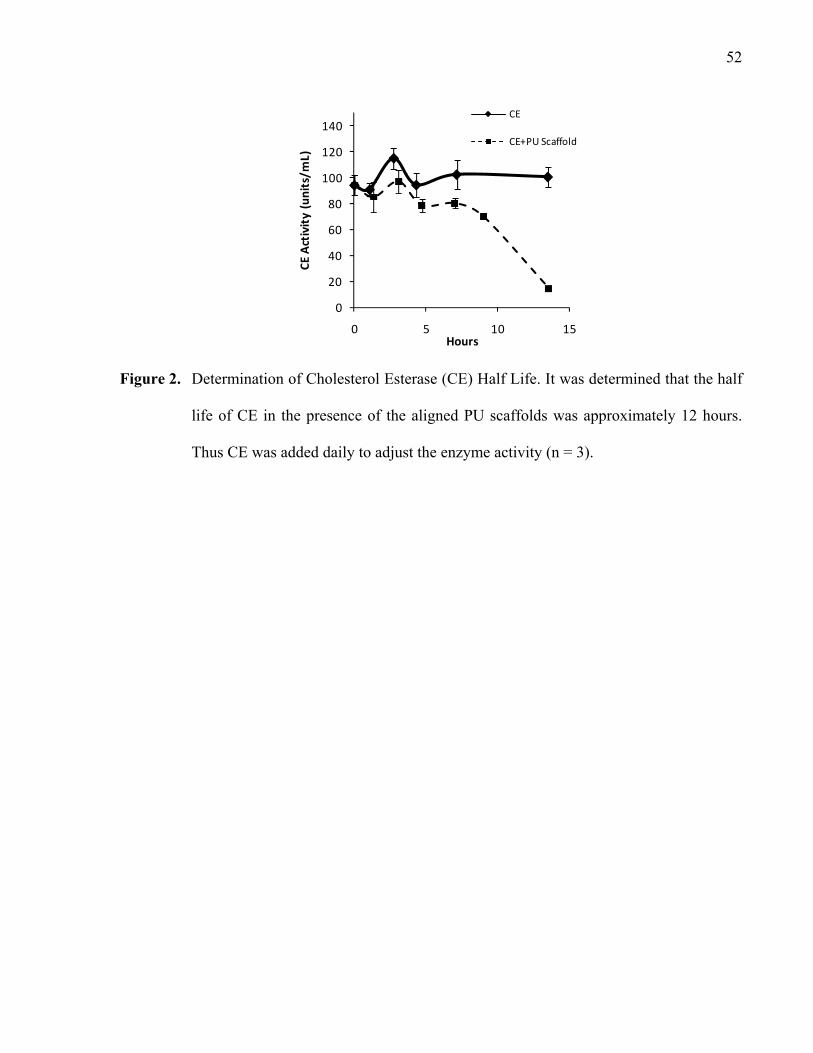
52
Figure 2. Determination of Cholesterol Esterase (CE) Half Life. It was determined that the half
life of CE in the presence of the aligned PU scaffolds was approximately 12 hours.
Thus CE was added daily to adjust the enzyme activity (n = 3).
0
20
40
60
80
100
120
140
0 5 10 15
CE Activity (units/mL)
Hours
CE
CE+PU Scaffold

53
Figure 3. Cumulative absolute mass loss (a) and cumulative relative mass loss (b) during
biodegradation. Scaffolds were incubated in 100 units/ml CE over 4 weeks. Data are
reported as mean ± standard error (n=6). (*) Absolute mass loss was found to increase
significantly at every week (p<0.05) for all groups, while no statistical differences
were observed between the scaffold groups within each week. Relative mass loss was
found to increase significantly in the case of aligned scaffolds.
0
0.5
1
1.5
2
2.5
3
Week 1 Week 2 Week 3 Week 4
Weight Loss (mg)
Aligned PU+0.5%ADO
Aligned PU Random PU+0.5%ADO
*
*
*
(a)
0%
5%
10%
15%
20%
25%
30%
35%
Week 1 Week 2 Week 3 Week 4
Weight Loss (% of Original)
Aligned PU+0.5%ADO
Aligned PU Random PU+0.5%ADO
*
*
*
(b)

54
Figure 4. (a) Elastic Modulus and (b) Tensile Strength of the electrospun polyurethane
nanofiber scaffolds following the pre-wetting (for one week in pH 7.0 PBS at 37ºC)
and drying process, comparing non-ADO vs. ADO, as well as aligned vs. random
scaffolds. Data are reported as mean ± standard error (n=6).
0
10
20
30
40
50
60
Aligned PU Aligned PU
+ ADO
Random ADO
Elastic Modulus (M
Pa) As Made
Pre‐wet
(a) *
****
0
2
4
6
8
10
12
14
16
18
Aligned PU Aligned PU
+ ADO
Random ADO
Tensile Strength (M
Pa) As Made
Pre‐wet
(b) *
****
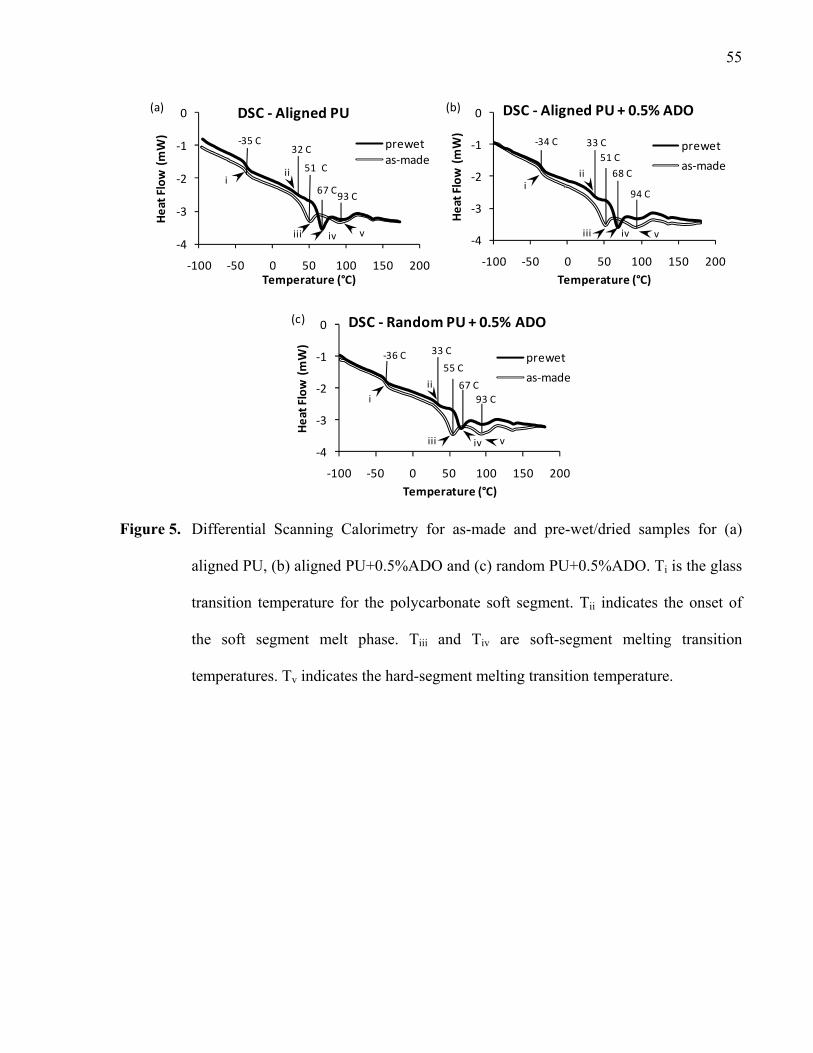
55
Figure 5. Differential Scanning Calorimetry for as-made and pre-wet/dried samples for (a)
aligned PU, (b) aligned PU+0.5%ADO and (c) random PU+0.5%ADO. Ti is the glass
transition temperature for the polycarbonate soft segment. Tii indicates the onset of
the soft segment melt phase. Tiii and Tiv are soft-segment melting transition
temperatures. Tv indicates the hard-segment melting transition temperature.
‐35 C32 C
67 C93 C
51 C
‐4
‐3
‐2
‐1
0
‐100 ‐50 0 50 100 150 200
Heat Flow (mW)
Temperature (°C)
DSC ‐ Aligned PU
prewetas‐made
ii
iii iv v
i
(a)
‐34 C 33 C
68 C
94 C
51 C
‐4
‐3
‐2
‐1
0
‐100 ‐50 0 50 100 150 200
Heat Flow (mW)
Temperature (°C)
DSC ‐ Aligned PU + 0.5% ADO
prewet
as‐madeii
iii iv v
i
(b)
‐36 C 33 C
67 C
55 C
93 C
‐4
‐3
‐2
‐1
0
‐100 ‐50 0 50 100 150 200
Heat Flow (mW)
Temperature (°C)
DSC ‐ Random PU + 0.5% ADO
prewet
as‐madeii
iii iv v
i
(c)

56
Figure 6. a) Initial Modulus and (b) Tensile Strength of the electrospun polyurethane nanofiber
scaffolds over four weeks of biodegradation in CE (100 units/ml) at 37ºC, PBS
pH=7.0. Data are reported as mean ± standard error (n=6). Aligned scaffolds showed
significantly higher modulus than random scaffolds at all time points. Ultimate stress
of aligned polymers decreased in the first week of degradation, but remained stable
thereafter.
* ** * *
0
2
4
6
8
10
12
14
Pre‐wet Week 1 Week 2 Week 3 Week 4
Initial M
odulus (M
Pa)
Aligned PU
Aligned PU+ADO
Random PU+ADO
(a)
0
2
4
6
8
10
Pre‐wet Week 1 Week 2 Week 3 Week 4
Ultim
ate Stress (M
Pa)
Aligned PU
Aligned PU+ADO
Random PU+ADO
**
**
(b)

57
Figure 7. Transmission Electron Microscopy of a non-soluble degradation product
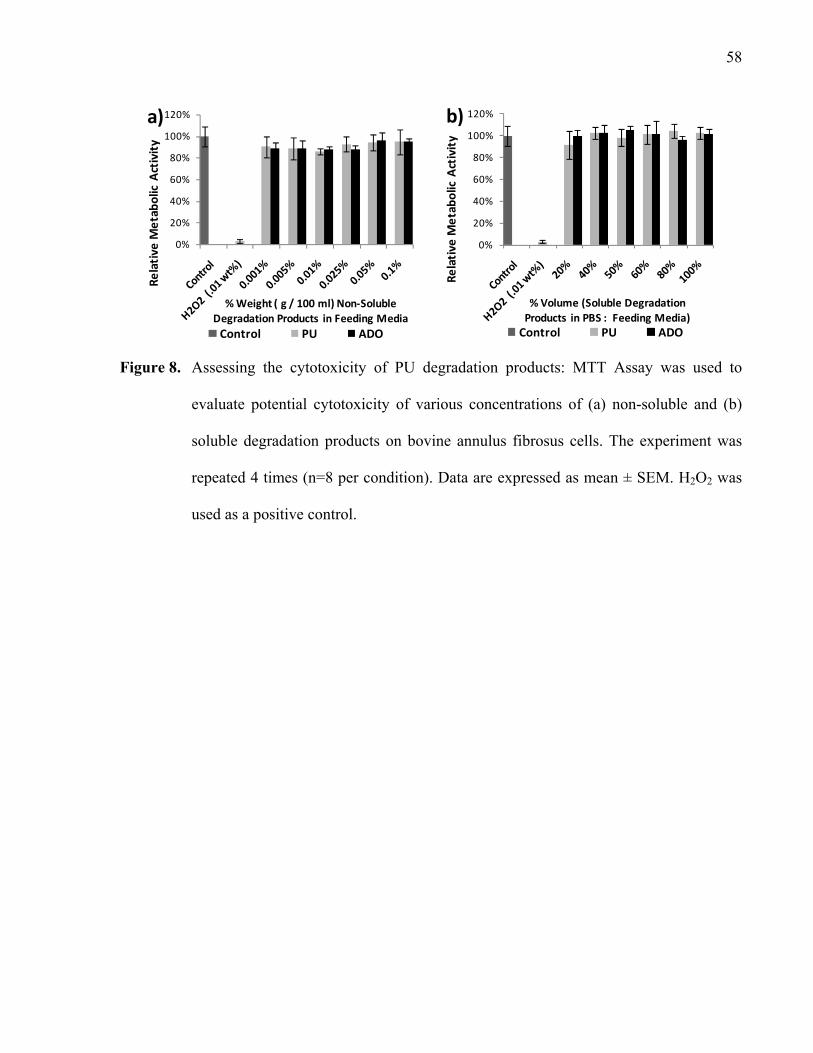
58
Figure 8. Assessing the cytotoxicity of PU degradation products: MTT Assay was used to
evaluate potential cytotoxicity of various concentrations of (a) non-soluble and (b)
soluble degradation products on bovine annulus fibrosus cells. The experiment was
repeated 4 times (n=8 per condition). Data are expressed as mean ± SEM. H2O2 was
used as a positive control.
0%
20%
40%
60%
80%
100%
120%
Relative
Metabolic Activity
% Weight ( g / 100 ml) Non‐Soluble
Degradation Products in Feeding Media
Control PU ADO
a)
0%
20%
40%
60%
80%
100%
120%
Relative
Metabolic Activity
% Volume (Soluble Degradation
Products in PBS : Feeding Media)Control PU ADO
b)

59
Figure 9. Cell viability of PU degradation products: AF cells were incubated for 24 hours with
various concentrations of (a) non-soluble and (b) soluble degradation products.
Live/Dead Assay was used to assess cell viability. The number of dead cells were
counted and expressed as percent of total number of cells. The experiment was
repeated 4 times (n=8 per condition) and data expressed as mean±SEM. H2O2 was
used as a positive control.
0%
20%
40%
60%
80%
100%
% Live Cells (Live
/ Total)
% Weight ( g / 100 ml) Non‐Soluble
Degradation Products in Feeding Media
a)
Control PU ADO
0%
20%
40%
60%
80%
100%
% Live Cells (Live
/ Total)
% Volume (Soluble DegradationProducts in PBS: Feeding Media)
b)
Control PU ADO

60
Figure 10. Representatipve images of Live/Dead Assay of AF cells treated with (a) untreated
negative control (media with carrier); (b) H2O2-treated positive control; (c) 0.1 wt. %
non-soluble degradation products; (d) 100 volume% soluble degradation products

61
VIII: Application of Dynamic Compressive Forces on
Annulus Fibrosus Cells Grown on a Biodegradable
Electrospun Nanofiber Scaffold
62
Application of Dynamic Compressive Forces on
Annulus Fibrosus Cells Grown on a Biodegradable
Electrospun Nanofiber Scaffold
Masoud Yeganegi1, 2, J Paul Santerre2, 4, and Rita A Kandel 1, 2, 3
1CIHR- Bioengineering of Skeletal Tissues Team, Mount Sinai Hospital, Toronto, M5G 1X5
Canada
2Institute of Biomaterials and Biomedical Engineering and Department of Materials Science and
Engineering, University of Toronto, Toronto, M5S 3G9 Canada
3Department of Pathobiology and Laboratory Medicine, Mt. Sinai Hospital, University of
Toronto, Toronto, M5G 1X5 Canada
4Faculty of Dentistry, University of Toronto, Toronto, M5G 1G6 Canada
To whom correspondence should be sent:
Rita Kandel, M.D.
Professor, Dept. of Laboratory Medicine and Pathobiology
University of Toronto
600 University Ave. Toronto, Ontario, Canada
M5G 1X5
Phone: 416-586-8516
Fax: 416-586-8628
E-mail: [email protected]

63
Introduction
The human vertebral column provides axial support to the body and protects the spinal cord.
The intervertebral discs lying between the vertebrae provide flexibility and help to prevent
damage to the vertebral column by dissipating mechanical loads and shocks.1 The hyaline
cartilage endplates found at each end represent the anatomical limits of the disc. The nucleus
pulposus forms the gelatinous central zone of intervertebral disc. Surrounding the nucleus
pulposus is a series of concentric fibrocartilaginous lamellae called the annulus fibrosus. Each
lamella consists of collagen fibers that are oriented at 60º to the vertical axis of the disc. The
alignment of these fibers alternates between successive lamellae and is of great importance to the
functionality of the annulus fibrosus.2 The composition of the AF is radially non-uniform.
Within the annulus fibrosus, the concentration of collagen type I is highest in the outer lamellae
and lowest toward in the centre.3 Conversely, collagen type II, which is also present in nucleus
pulposus increases in concentration toward the innermost lamellae in the annulus fibrosus. The
relative proportion of collagen type I to collagen type II in the annulus fibrosus varies from 70:30
in the innermost layers and 85:15 in the outer layers.4
Due to its structural arrangement, the mechanical behaviour of AF is relatively complex.
Studies indicate that the annulus fibrosus exhibits both matrix viscoelastic (flow-independent)
and biphasic viscoelastic (flow-dependent) behaviour. 5-8 The elastic modulus of a single lamella
of annulus fibrosus has been found to vary with the radial position in the disc displaying values
ranging from 5±4 MPa for posterior inner AF, 20±12 MPa for posterior outer AF, 10±6 MPa for
anterior inner AF, and 49±32 MPa for anterior outer AF 9. The ultimate stress of a single lamella
of annulus fibrosus similarly varies radially from 0.9±0.3 MPa for posterior inner AF, 1.1±0.3
MPa for posterior outer AF, 0.9±0.7 MPa for anterior inner AF, and 3.3±1.3 MPa for anterior

64
outer AF (n=15). 9 The forces experienced by AF can be quite high, and thus the impact of
mechanical forces on AF tissue is of great interest. It has been well established that mechanical
loading plays an important role in regulating the behavior of various tissues, including the AF.
Muscle forces, general loading of the joints, and movement of joints relative to each other act to
apply a range of stresses on the disc, including compressive, shear, tensile, osmotic and
hydrostatic. The AF cells sense these forces and respond through changes in gene expression.9
A number of studies have demonstrated the mechanosensitivity of the AF. The in vivo
biological response of annulus fibrosus in the rat tail, to short-term dynamic compression, has
been investigated by MacLean et al. 10-12 The expression of anabolic and catabolic genes was
affected by a 2 hour dynamic compression of the intervertebral disc, under an applied stress of 1
MPa (12.6N) at 0.2 Hz. Matrix genes, collagen I and collagen II, were slightly downregulated
while catabolic genes, collagenase and aggrecanase, were upregulated in the annulus.10 Stresses
of 1 MPa and 0.2 MPa were applied in another disc study at three frequencies of 0.01 Hz, 0.2 Hz,
and 1 Hz. It was found that the application of 1 MPa at all frequencies significantly increased the
catabolic genes, collagenase (21-, 7-, 8-fold respectively) and aggrecanase (5-, 1-, 7-fold
respectively) with only slightly increased collagen I expression at 1 Hz (3.5- fold) in the AF. On
the other hand, stress of 0.2 MPa at 1 Hz resulted in a slightly elevated level of expression for
collagen (4-fold) and aggrecan (2-fold), with minor non-significant increases in collagenase and
aggrecanase. This study has demonstrated the frequency and magnitude dependence of the
biological response to compressive mechanical stress. 11,12 Lotz and Walsh et. al. have also
explored the load- and frequency-dependant response of the intervertebral disc to dynamic
stresses. 13 Peak stresses of 0.8 MPa and 1.3 MPa were applied at frequencies of 0.1 Hz and 0.01
Hz to in vivo mice tail discs. Under these conditions, little apoptosis of AF cells was found

65
generally at the higher frequency and the lower stress. Aggrecan gene expression in the inner
annulus increased under lower frequency and higher stress loading. Similar results were
observed under almost identical experimental conditions, with peak compressive stresses of 0.9
MPa and 1.3 MPa applied at 0.1 Hz and 0.01 Hz. 13 Static compressive force of 1.0 MPa for 24
hr applied to ex-vivo cocygeal discs caused apoptosis in the annulus fibrosus.14 Annulus fibrosus
cells in an alginate culture system subjected to 30 hours of static 25% unconfined compressive
strain, responded with increased gene expression for types I and II collagen, and aggrecan.15
Application of hydrostatic pressure on caudal bovine and human IVD explants, while affecting
the nucleus pulposus and the inner AF, did not produce any significant changes in the outer
AF.16-18 Osmotic pressure has also been shown to affect mRNA levels of aggrecan, collagen-I,
and collagen-II in AF 3D-cultures.19-21 Interestingly, cellular response to hydrostatic and cyclic
tensile strain was found to be dependent on the osmotic environment.19 The AF is
physiologically subjected to tensile forces 9, and thus a response to tensile mechanical
stimulation is expected. Dynamic tensile strain (5% at 1Hz for 24 hours) of monolayer AF cells
grown on a collagen substrate resulted in decreased proteoglycan synthesis, while increasing
nitrogen oxide production.22 Higher tensile strains at lower frequencies (15% at 0.1Hz for 24
hours) increased cellular apoptosis in the AF.23 Axial traction tensile forces applied to intact IVD
explants (at 0.8MPa for 4 hours) resulted in a decrease in proteoglycan synthesis in the AF.24
Thus the effects of mechanical forces on AF cells can be variable depending on the conditions.
Back pain is ranked as the most prevalent chronic disease for people under 60.25 Degenerative
disc disease is associated with lower back pain and involves the progressive degeneration of the
intervertebral disc (IVD). An intact disc is necessary to support compressive and bending
stresses while providing flexibility to the spine.26 Currently, existing treatments include the use
66
of a prosthetic substitute, or the fusion of neighbouring vertebrae, neither of which is optimal.
Spinal fusion of degenerated disc may be effective in some cases, but a number of patients can
develop degeneration, due to reduced flexibility and increased stress, in adjacent segments. 27-30
Complications, such as slippage, wear and mechanical failure of the device materials can also
occur in patients undergoing disc replacement with synthetic substrates.31,32
One strategy towards addressing intervertebral disc degeneration is through the replacement of
the diseased tissue by a tissue-engineered substitute.33-35 Tissue engineering of annulus fibrosus
is of particularly challenging due to the complex structure of the tissue.2 Efforts in producing AF
tissue in vitro has involved various polymefric scaffolds including PDLLA/45S5 Bioglass®
films, polyglycolic acid, collagen/hyaluronan, collagen/gag, atelocollagen, and alginate
scaffolds.36-41 In addition to inadequate tissue formation, some biomaterials, such as
polyglycolic-based polymers, create acidic byproducts throughout their biodegradation, which
can significantly alter cell behavior, tissue production and possibly cause cell death.42,43 In this
study, degradable polycarbonate-urethane (PU) polymers were used due to their biocompatible,
biodegradable and reproducible nature. Electrospinning was employed to fabricate aligned fibers,
mimicking the aligned nature of the annulus fibrosus, and thus providing a more appropriate
surface for growth of such a tissue.
In a previous study, we demonstrated that AF cells can be grown on electrospun PU fibers and
they could synthesize and accumulate extracellular matrix.44 The high surface to volume ratio of
these scaffolds favors cell attachment and retention of cell phenotype. 44,45 Given the mechano-
sensitivity of AF cells, the purpose of this study was to assess the effect of dynamic compressive
67
mechanical forces on AF cells grown on an aligned biodegradable electrospun nanofiber
scaffold.
Experimental Section
In recent years, efforts have focused on developing bioactive/biocompatible biodegradable
polyurethanes for the purpose of tissue engineering or regeneration.46,47 In this study, a
degradable polycarbonate urethane (PU) was synthesized, as has been previously described, with
hexane diisocyanate:polycarbonate diol:butane diol ratio of 3:2:1 48. In addition, an anionic
dihydroxyl oligomer (ADO) additive was synthesized through the reaction of lysine
diisocyanate, polytetramethylene oxide, and hydroxyethyl methacrylate (HEMA).44 This anionic
additive has been previously shown to increase AF cellular adhesion mediated by protein
adsorption to the surface.44
Scaffold fabrication
Electospinning was employed to fabricate either random or aligned nanofiber scaffolds using
the base polymer (PU) with or without ADO (0.5 wt.%). The polymer was dissolved in
1,1,1,3,3,3-hexafluora-2-propanol at a concentration of 16 wt.%. The scaffold was then formed
by electrospinning, through the injection of the polymer solution from a metallic syringe at a rate
of 0.5 ml/hr onto the collecting surface. An 18 kilovolts difference was applied across the
syringe and the collecting surface. In the case of aligned scaffolds, the collecting surface
consisted of a cylindrical aluminum mandrel rotating at 1250 rpm, such that the surface of the
mandrel moved at 10 m/s. Relative humidity and temperature were maintained at <30% relative
humidity and approximately 25ºC. The resulting electrospun fibers ranged from 200-400 nm in
diameter as measured by scanning electron microscopy (Figure 1). Polymers were punched into
68
circular sections (D=6mm, and thickness of 80 ± 10µm) and fixated over a porous titanium disc
(D=4mm, h=2mm). The construct was held in place by the Tygon tubing (D=4mm) surrounding
the components. The tubing created a well-like structure to prevent cell spillage and provided
cells with a confined area to attach within a specific region of the scaffold. The porous titanium
base allowed for the application of compression to the scaffold while ensuring media diffusion
from below (Figure 2).
Annulus fibrosus cell culture
Bovine annulus fibrous cells were used as a model for human cells.49-51 Annulus fibrosus from
bovine caudal spines (6–9 months old) were dissected out aseptically. Five discs were combined
from one tail for each experiment. To isolate the cells, the tissues were chopped into 1mm pieces
and underwent serial digestion with 0.5% protease (Sigma, St. Louis, MO) for 1 hour at 37° C,
followed by 0.25% collagenase A (Roche, Laval, Quebec, Canada) overnight at 37° C. The cell
suspension was washed, filtered through a sterile mesh, and resuspended in Ham’s F12
supplemented with 5% fetal bovine serum (FBS). A 40µL aliquot of AF cell suspension was
seeded onto the surface of the scaffold at a density of 8x10⁵/cm2 and allowed to attach for 3
hours. Ham’s F12 media containing 5% fetal bovine serum was then used to submerge the entire
construct. Ascorbic acid was added to media 72 hours post-seeding (final concentration of 100
µg/mL).
Mechanical Stimulation
Cells were mechanically stimulated using a Mach-1 mechanical tester (Biosyntech, Laval, PQ,
Canada) under confined compression. Titanium alloy plates with a porous surface layer (35 vol%
layer of sintered Ti·6Al·4V powders) 52,53 were used as supports for the PU membranes while

69
applying 1kPa of compressive force to cylindrical agarose gels (D=3.5mm, h=4mm, 2% agarose
in Ham’s F12 media), which had been placed over the cells within the tubing. The use of the
porous agarose inserts protected the cells and allowed the culture medium to diffuse to the cells.
The mechanical properties of the agarose gel likely differ from those of the AF tissue layer, and
thus the relative strain experienced is also likely to be different. However, because the layer of
cells lies between the agarose plug and the underlying polymer, the compressive force
experienced throughout the agarose gel and the AF tissue layer is expected to be the same, as
required by a state of mechanical equilibrium. Mechanical loading of the disc results in a
complex set of mechanical stimuli experience by the cells, including tensile, compressive and
shear load.54 Compression was chosen as a starting point for analysis of mechanical forces on the
AF tissue. In all cases, mechanical stimulation was conducted at a frequency of 1 Hz, 1kPa, for 1
hour. The aforementioned parameters for this mechanical stimulation study were chosen upon
examining previous studies in the area. The 1Hz frequency of dynamic compressive stimulation
was chosen since it represents the natural step frequency. Further, a number of studies have
demonstrated the frequency and magnitude dependence of the AF response to compressive
mechanical stress. Lower loads and appropriately higher frequencies have been found to increase
anabolic gene expression, while abnormally higher loads, lower frequency or static compression
have proved detrimental to tissue production and AF cell viability.11-14 Control cells were treated
in an identical manner but did not receive mechanical stimulation.
AF cell morphology
Cell morphology was evaluated at various time points following the application of mechanical
stimulation. The cell-scaffold constructs were washed in Ca2+ and Mg2+ free PBS three times and
fixed in 2.5% gluteraldehyde for 1 hour and stored at 4ºC. They were later dehydrated in

70
increasing concentrations of ethanol (i.e. 50%, 70%, 90%, 95%, 100%) before critical point
drying. All samples were sputter coated with gold and evaluated using scanning electron
microscopy (SEM) (FEI XL30 ESEM, Hillsbro, OR, USA).
DNA content
To determine cellularity at various time points, samples were papain digested (Sigma; 40
μg/mL, 1 mM EDTA, 20 mM ammonium acetate, and 2 mM DL-dithiothreitol) for up to 48
hours at 65°C. The DNA content of the cells was determined using the Hoechst 33258 dye assay
(Polysciences, Warrington, PA) and fluorometry (Thermoscientific model Fluoroskan at an
excitation wavelength of 365 nm, and emission wavelength of 458 nm). Calf thymus DNA
(Sigma, Oakville, ON) was used to generate a standard curve.
Quantification of Proteoglycan and Collagen Synthesis and Proliferation
Collagen and proteoglycan synthesis was determined by incubating cells with [3H]-proline and
[35S]-sulfate (4µCi/well) for 24 hours. The samples were harvested, and washed in Ca2+ and
Mg2+ free PBS three times, papain digested and incorporated radioactivity determined using a β-
liquid scintillation counter (Beckman model LS 6500, Mississauga, Ontario).
To measure proliferation, cells were incubated with [3H]-thymidine (2µCi/well) for 24 hours.
The samples were harvested, and washed in Ca2+ and Mg2+ free PBS three times, papain digested
and counted using a β-liquid scintillation counter. CPM (counts-per-minute) measurements were
normalized to DNA content.

71
Statistical analysis
All conditions were done in at least quadruplet and each experiment repeated at least 3 times.
The results from all experiments were combined and expressed as the mean ± standard error of
the mean. The data were analyzed using a one-way analysis of variance and all pair-wise
comparisons between groups were conducted using the Scheffe post hoc test. Significance was
assigned at p-values < 0.05.
Results
Effect of Mechanical Stimulation on AF Cells
The application of 1kPa of confined cyclic compressive force on 3-day old AF tissue at 1Hz
resulted in changes in cell morphology. Scanning electron microscopy showed that stimulated
cells spread noticeably more immediately post-stimulation and at 6 hours post-stimulation.
Further, AF cell density appeared to be greater in stimulated samples than their un-stimulated
counterparts (Figure 3). These differences were less apparent at later time points and mostly
absent by 72 hours. To verify the observation of varying cell density from the SEM data, DNA
content was measured post-stimulation (Figure 3). Cell density as measure by DNA content was
found to remain unaffected by the mechanical stimulation (Figure 5a). Further, proliferation was
also found to be comparable between stimulated and control samples for both 24 and 72 hour
time points.
Effect of Mechanical Stimulation on AF Matrix Synthesis
Dynamic compressive mechanical stimulation (1kPa, 1Hz, 1hr) similarly did not significantly
affect collagen synthesis (Figure 4a) or proteoglycan synthesis (Figure 4b) in the 24 hours post-
stimulation. Synthesis at 72 hours post-stimulation produced similar results, however, there was

72
a significant decrease in synthesis of collagen and proteoglycans at 72 hours compared to 24
hours post-stimulation. Despite the changes in morphology (Figure 3) which persisted for at least
72 hours, matrix synthesis (normalized to DNA) remained unaffected by the compressive
mechanical stimulation.
Discussion
With regards to cell spreading, previous studies have shown that when compressive
deformation is applied to AF cells in a three-dimensional culture system, an early increase in
vimentin mRNA expression and subunit polymerization occurs, characteristic of changes in the
cytoskeleton of AF cells.55 The observed changes in cell spreading in the current study are also
consistent with the findings by Handa et al. 55 In terms of AF cell density, since DNA content
was not significantly different in stimulated and non-stimulated samples, it was concluded that
the SEM images only provided a qualitative measure of the cellular density and did not reflect a
complete picture of the cell state or tissue surfaces. It is difficult to reconcile the SEM findings
alongside the cell analysis data. It is possible that the dehydration process required for SEM
imaging resulted in dislodging AF cells in un-stimulated samples. This would suggest that AF
cells in stimulated samples may have been more strongly attached than those of the control group
as a result of applied mechanical forces. Future studies would have to evaluate cell retention in
order to validate this hypothesis. Compressive mechanical forces did not result in significant
changes in matrix synthesis. It is possible that mRNA instability prevents changes in gene
expression to remain present long enough to result in detectable changes in matrix synthesis,
without further application of compressive force.56 Further, dynamic compressive stimulation of
AF cells has been shown to alter gene expression in AF in a frequency and magnitude dependant
manner. 10,12,13,57 In one such study, no significant changes were observed at 0.5hr of stimulation

73
(0.2 MPa), while significant changes were observed following 2hr and 4hr of stimulation.
Therefore, it is possible that AF cells simply did not respond strongly to the particular set of
parameters (1 kPa confined compression, 1Hz, 1hr) applied in this study. Future studies may
attempt to vary the applied force and duration of mechanical stimulation. Other parameters that
can be investigated in the future, to determine AF response to mechanical stimulation include
apoptosis, changes in cell-specific matrix genes (types I, and II collagen and aggrecan) and
catabolic genes (MMP-3, MMP-13, and ADAMTs-4). Different modes of mechanical force such
as tensile, shear or hydrostatic forces may also be influential on AF cells and should be explored.
Conclusions
The findings in this study have shown that confined dynamic compressive mechanical
stimulation of 1kPa at 1Hz caused an increase in extent of cell spreading early on as per SEM
images. These effects were observed immediately following stimulation and persisted for at least
72 hours post-stimulation. However, the morphological effects did not result in significant
changes in DNA content, cell proliferation, or matrix synthesis at 24 or 72 hours post-
stimulation. Matrix synthesis decreased for both stimulated and control samples at 72 hours
when compared to 24 hours post-stimulation. The results of this study, suggest that compressive
forces on the AF cells under the aforementioned conditions, have little influence on AF tissue
growth. Additional studies should be aimed at alternative mechanical stimulation parameters to
yield a more significant response from AF cells.
Acknowledgements
The funding for this work was provided by the Ontario Graduate Scholarship in Science and
Technology (OGSST), the University of Toronto Fellowship Award, an NSERC-CIHR

74
Collaborative Health Research Program (CHRP) Grant (312882), and a CIHR Operating Grant
(MOP86723).

75
References:
(1) Bogduk, Nikolai. Clinical anatomy of the lumbar spine and sacrum, Elsevier Churchill
Livingstone: Edinburgh, 2005.
(2) Marchand, F. and Ahmed, A. M. Investigation of the laminate structure of lumbar disc
anulus fibrosus. Spine, 1990, 5, 402-410.
(3) Bruehlmann, S. B., Rattner, J. B., Matyas, J. R., and Duncan, N. A. Regional variations in
the cellular matrix of the annulus fibrosus of the intervertebral disc. J.Anat., 2002, 2,
159-171.
(4) Eyre, D. R. and Muir, H. Types I and II collagens in intervertebral disc. Interchanging
radial distributions in annulus fibrosus. Biochem.J., 1-7-1976, 1, 267-270.
(5) Riches, P. E., Dhillon, N., Lotz, J., Woods, A. W., and McNally, D. S. The internal
mechanics of the intervertebral disc under cyclic loading. J.Biomech., 2002, 9, 1263-
1271.
(6) Alkalay, R. The Material and Mechanical Properties of the Healthy and Degenerated
Intervertebral Disc. In Integrated Biomaterials Science, Springer US, 2002.
(7) Baer, A. E., Laursen, T. A., Guilak, F., and Setton, L. A. The micromechanical
environment of intervertebral disc cells determined by a finite deformation, anisotropic,
and biphasic finite element model. J.Biomech.Eng, 2003, 1, 1-11.
(8) Wu, H. C. and Yao, R. F. Mechanical behavior of the human annulus fibrosus. J.Biomech.,
1976, 1, 1-7.

76
(9) Ebara, S., Iatridis, J. C., Setton, L. A. et al. Tensile properties of nondegenerate human
lumbar anulus fibrosus. Spine, 15-2-1996, 4, 452-461.
(10) MacLean, J. J., Lee, C. R., Grad, S. et al. Effects of immobilization and dynamic
compression on intervertebral disc cell gene expression in vivo. Spine, 15-5-2003, 10,
973-981.
(11) Iatridis, J. C., MacLean, J. J., Roughley, P. J., and Alini, M. Effects of mechanical loading
on intervertebral disc metabolism in vivo. J.Bone Joint Surg.Am., 2006, 41-46.
(12) MacLean, J. J., Lee, C. R., Alini, M., and Iatridis, J. C. Anabolic and catabolic mRNA
levels of the intervertebral disc vary with the magnitude and frequency of in vivo
dynamic compression. J.Orthop.Res., 2004, 6, 1193-1200.
(13) Walsh, A. J. and Lotz, J. C. Biological response of the intervertebral disc to dynamic
loading. J.Biomech., 2004, 3, 329-337.
(14) Ariga, K., Yonenobu, K., Nakase, T. et al. Mechanical stress-induced apoptosis of endplate
chondrocytes in organ-cultured mouse intervertebral discs: an ex vivo study. Spine, 15-
7-2003, 14, 1528-1533.
(15) Chen, J., Yan, W., and Setton, L. A. Static compression induces zonal-specific changes in
gene expression for extracellular matrix and cytoskeletal proteins in intervertebral disc
cells in vitro. Matrix Biol., 2004, 7, 573-583.
(16) Handa, T., Ishihara, H., Ohshima, H. et al. Effects of hydrostatic pressure on matrix
synthesis and matrix metalloproteinase production in the human lumbar intervertebral
disc. Spine, 15-5-1997, 10, 1085-1091.
77
(17) Ishihara, H., McNally, D. S., Urban, J. P., and Hall, A. C. Effects of hydrostatic pressure on
matrix synthesis in different regions of the intervertebral disk. J.Appl.Physiol, 1996, 3,
839-846.
(18) Liu, G. Z., Ishihara, H., Osada, R., Kimura, T., and Tsuji, H. Nitric oxide mediates the
change of proteoglycan synthesis in the human lumbar intervertebral disc in response to
hydrostatic pressure. Spine, 15-1-2001, 2, 134-141.
(19) Wuertz, K., Urban, J. P., Klasen, J. et al. Influence of extracellular osmolarity and
mechanical stimulation on gene expression of intervertebral disc cells. J.Orthop.Res.,
2007, 11, 1513-1522.
(20) Boyd, L. M., Richardson, W. J., Chen, J. et al. Osmolarity regulates gene expression in
intervertebral disc cells determined by gene array and real-time quantitative RT-PCR.
Ann.Biomed.Eng, 2005, 8, 1071-1077.
(21) Chen, J., Baer, A. E., Paik, P. Y., Yan, W., and Setton, L. A. Matrix protein gene
expression in intervertebral disc cells subjected to altered osmolarity.
Biochem.Biophys.Res.Commun., 10-5-2002, 3, 932-938.
(22) Rannou, F., Richette, P., Benallaoua, M. et al. Cyclic tensile stretch modulates
proteoglycan production by intervertebral disc annulus fibrosus cells through
production of nitrite oxide. J.Cell Biochem., 1-9-2003, 1, 148-157.
(23) Rannou, F., Lee, T. S., Zhou, R. H. et al. Intervertebral disc degeneration: the role of the
mitochondrial pathway in annulus fibrosus cell apoptosis induced by overload.
Am.J.Pathol., 2004, 3, 915-924.
78
(24) Terahata, N., Ishihara, H., Ohshima, H., Hirano, N., and Tsuji, H. Effects of axial traction
stress on solute transport and proteoglycan synthesis in the porcine intervertebral disc
in vitro. Eur.Spine J., 1994, 6, 325-330.
(25) Rapoport, J., Jacobs, P., Bell, N. R., and Klarenbach, S. Refining the measurement of the
economic burden of chronic diseases in Canada. Chronic.Dis.Can., 2004, 1, 13-21.
(26) Urban, J. P. and Roberts, S. Degeneration of the intervertebral disc. Arthritis Res.Ther.,
2003, 3, 120-130.
(27) Lopez-Espina, C. G., Amirouche, F., and Havalad, V. Multilevel cervical fusion and its
effect on disc degeneration and osteophyte formation. Spine, 20-4-2006, 9, 972-978.
(28) Javedan, S. P. and Dickman, C. A. Cause of adjacent-segment disease after spinal fusion.
Lancet, 14-8-1999, 9178, 530-531.
(29) Boden, S. D. Overview of the biology of lumbar spine fusion and principles for selecting a
bone graft substitute. Spine, 15-8-2002, 16 Suppl 1, S26-S31.
(30) Huang, R. C. and Sandhu, H. S. The current status of lumbar total disc replacement.
Orthop.Clin.North Am., 2004, 1, 33-42.
(31) Anderson, P. A. and Rouleau, J. P. Intervertebral disc arthroplasty. Spine, 1-12-2004, 23,
2779-2786.
(32) Anderson, J. M. Inflammatory response to implants. ASAIO Trans., 1988, 2, 101-107.

79
(33) Chang, G., Kim, H. J., Kaplan, D., Vunjak-Novakovic, G., and Kandel, R. A. Porous silk
scaffolds can be used for tissue engineering annulus fibrosus. Eur.Spine J., 2007, 11,
1848-1857.
(34) O'Halloran, D. M. and Pandit, A. S. Tissue-engineering approach to regenerating the
intervertebral disc. Tissue Eng, 2007, 8, 1927-1954.
(35) Johnson, W. E., Wootton, A., El, Haj A. et al. Topographical guidance of intervertebral
disc cell growth in vitro: towards the development of tissue repair strategies for the
anulus fibrosus. Eur.Spine J., 2006, 15, S389-S396.
(36) Sato, M., Asazuma, T., Ishihara, M. et al. An atelocollagen honeycomb-shaped scaffold
with a membrane seal (ACHMS-scaffold) for the culture of annulus fibrosus cells from
an intervertebral disc. J.Biomed.Mater.Res.A, 1-2-2003, 2, 248-256.
(37) Thonar, E., An, H., and Masuda, K. Compartmentalization of the matrix formed by nucleus
pulposus and annulus fibrosus cells in alginate gel. Biochem.Soc.Trans., 2002, Pt 6,
874-878.
(38) Wilda, H. and Gough, J. E. In vitro studies of annulus fibrosus disc cell attachment,
differentiation and matrix production on PDLLA/45S5 Bioglass composite films.
Biomaterials, 2006, 30, 5220-5229.
(39) Rong, Y., Sugumaran, G., Silbert, J. E., and Spector, M. Proteoglycans synthesized by
canine intervertebral disc cells grown in a type I collagen-glycosaminoglycan matrix.
Tissue Eng, 2002, 6, 1037-1047.
80
(40) Alini, M., Li, W., Markovic, P. et al. The potential and limitations of a cell-seeded
collagen/hyaluronan scaffold to engineer an intervertebral disc-like matrix. Spine, 1-3-
2003, 5, 446-454.
(41) Mizuno, H., Roy, A. K., Vacanti, C. A. et al. Tissue-engineered composites of anulus
fibrosus and nucleus pulposus for intervertebral disc replacement. Spine, 15-6-2004, 12,
1290-1297.
(42) Ishihara, H. and Urban, J. P. Effects of low oxygen concentrations and metabolic inhibitors
on proteoglycan and protein synthesis rates in the intervertebral disc. J.Orthop.Res.,
1999, 6, 829-835.
(43) Li, H. Y. and Chang, J. pH-compensation effect of bioactive inorganic fillers on the
degradation of PLGA. Composites Science and Technology, 2005, 14, 2226-2232.
(44) Yang, L., Kandel, R. A., Chang, G., and Santerre, J. P. Polar Surface Chemistry of
Nanofibrous Polyurethane Scaffold Affects Annulus Fibrosus Cell Attachment and
Early Matrix Accumulation. J.Biomed.Mater.Res.A, 2008,
http://www3.interscience.wiley.com/journal/121582889/.
(45) Thapa, A., Miller, D. C., Webster, T. J., and Haberstroh, K. M. Nano-structured polymers
enhance bladder smooth muscle cell function. Biomaterials, 2003, 17, 2915-2926.
(46) Guelcher, S. A. Biodegradable polyurethanes: synthesis and applications in regenerative
medicine. Tissue Eng Part B Rev., 2008, 1, 3-17.

81
(47) Santerre, J. P., Woodhouse, K., Laroche, G., and Labow, R. S. Understanding the
biodegradation of polyurethanes: from classical implants to tissue engineering
materials. Biomaterials, 2005, 35, 7457-7470.
(48) Tang, Y. W., Labow, R. S., and Santerre, J. P. Enzyme-induced biodegradation of
polycarbonate-polyurethanes: dependence on hard-segment chemistry.
J.Biomed.Mater.Res., 15-12-2001, 4, 597-611.
(49) Demers, C. N., Antoniou, J., and Mwale, F. Value and limitations of using the bovine tail
as a model for the human lumbar spine. Spine, 15-12-2004, 24, 2793-2799.
(50) Cotterill, P. C., Kostuik, J. P., D'Angelo, G., Fernie, G. R., and Maki, B. E. An anatomical
comparison of the human and bovine thoracolumbar spine. J.Orthop.Res., 1986, 3, 298-
303.
(51) Wilke, H. J., Krischak, S., and Claes, L. Biomechanical comparison of calf and human
spines. J.Orthop.Res., 1996, 3, 500-503.
(52) Spiteri, C. G., Young, E. W., Simmons, C. A., Kandel, R. A., and Pilliar, R. M. Substrate
architecture and fluid-induced shear stress during chondrocyte seeding: role of
alpha5beta1 integrin. Biomaterials, 2008, 16, 2477-2489.
(53) Bhardwaj, T., Pilliar, R. M., Grynpas, M. D., and Kandel, R. A. Effect of material
geometry on cartilagenous tissue formation in vitro. J.Biomed.Mater.Res., 2001, 2, 190-
199.
(54) Setton, L. A. and Chen, J. Mechanobiology of the intervertebral disc and relevance to disc
degeneration. J.Bone Joint Surg.Am., 2006, 52-57.

82
(55) Handa, T., Ishihara, H., Ohshima, H. et al. Effects of hydrostatic pressure on matrix
synthesis and matrix metalloproteinase production in the human lumbar intervertebral
disc. Spine, 15-5-1997, 10, 1085-1091.
(56) MacLean, J. J., Lee, C. R., Alini, M., and Iatridis, J. C. The effects of short-term load
duration on anabolic and catabolic gene expression in the rat tail intervertebral disc.
J.Orthop.Res., 2005, 5, 1120-1127.
(57) Kim, P. K. and Branch, C. L., Jr. The lumbar degenerative disc: confusion, mechanics,
management. Clin.Neurosurg., 2006, 53, 18-25.

83
Figures
Figure 1. Scanning Electron Microscopy Images of Aligned (a) and Random (b) Electrospun
Polycarbonate Urethane Nanofiber Scaffolds
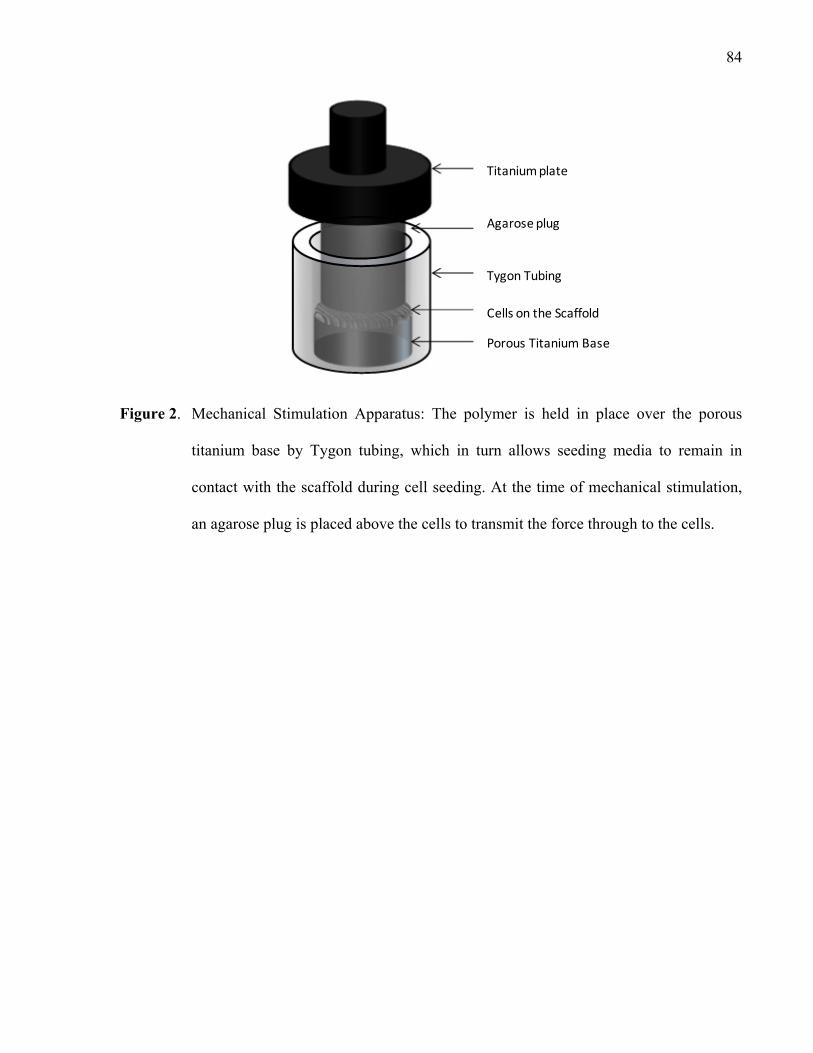
84
Figure 2. Mechanical Stimulation Apparatus: The polymer is held in place over the porous
titanium base by Tygon tubing, which in turn allows seeding media to remain in
contact with the scaffold during cell seeding. At the time of mechanical stimulation,
an agarose plug is placed above the cells to transmit the force through to the cells.
Titanium plate
Agaroseplug
Tygon Tubing
Cells on the Scaffold
Porous Titanium Base

85
a ) b )
c ) d )
e ) f )

86
Figure 3. SEM images of AF cells immediately (b), 6 hr (d); 24 hr (f); 72 hr (h) post-
stimulation. The corresponding non-stimulated controls are denoted (a, c, e, g).
Stimulated samples are more spread than control samples, particularly at early time
points.
a) b)
c) d)
g ) h )

87
Figure 4. DNA Content (µg) at various time points following mechanical stimulation (3 day
Tissue, stimulated for 1hr at 1Hz and 1kPa). No significant changes were observed
between the control and stimulated groups nor between the different time points (n=3,
α=0.05).
0
0.1
0.2
0.3
0.4
0.5
0 hr 6 hr 12 hr 24 hrDNA (ug DNA)
Time (hours) post‐stimulation
Control
Stimlulated

88
Figure 5. Evaluation of DNA content (a) and Thymidine Incorporation (b) at 24 hours and 72
hours post-stimulation. Controls were treated similarly but were not stimulated. The
results are expressed as ± SEM (n=15, α=0.05).. No significant differences were
detected between the two conditions.
0.0
0.1
0.2
0.3
0.4
0.5
0.6
0.7
0.8
0.9
24 hr
[Stim.]
24 hr
[Ctrl.]
72 hr
[Stim.]
72 hr
[Ctrl.]
DNA Content (ug)
a)
0
500
1000
1500
2000
2500
3000
3500
4000
4500
5000
24 hr [Stim.]
24 hr [Ctrl.]
72 hr [Stim.]
72 hr [Ctrl.]
3H‐Thym
idine‐Incorporation
(CPM / ug DNA)
b)
a) b)
c) d)
e) f)
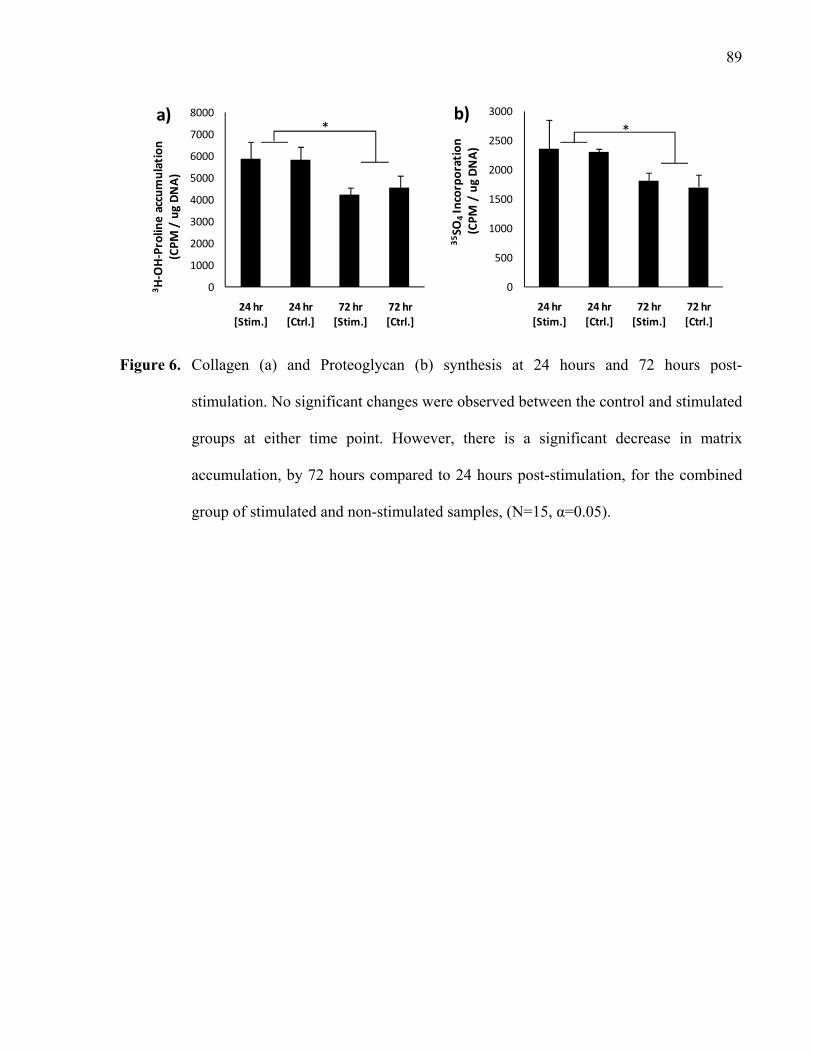
89
Figure 6. Collagen (a) and Proteoglycan (b) synthesis at 24 hours and 72 hours post-
stimulation. No significant changes were observed between the control and stimulated
groups at either time point. However, there is a significant decrease in matrix
accumulation, by 72 hours compared to 24 hours post-stimulation, for the combined
group of stimulated and non-stimulated samples, (N=15, α=0.05).
0
1000
2000
3000
4000
5000
6000
7000
8000
24 hr [Stim.]
24 hr [Ctrl.]
72 hr [Stim.]
72 hr [Ctrl.]
3H‐OH‐Proline accumulation
(CPM / ug DNA)
a)*
0
500
1000
1500
2000
2500
3000
24 hr
[Stim.]
24 hr
[Ctrl.]
72 hr
[Stim.]
72 hr
[Ctrl.]
35SO
4Incorporation
(CPM / ug DNA)
b)*

90
IX: Conclusions and Future Work

91
Conclusions and Future Work
The findings in this thesis have demonstrated the basic characteristics that make the
biodegradable electrospun polycarbonate urethane nanofiber scaffold suitable for producing a
tissue-engineered Annulus Fibrosus. Aligned scaffolds were found to possess superior
mechanical properties in relation to random scaffolds, suggesting that this formulation is a more
appropriate scaffold for engineering annulus fibrosus tissue. While it was found that exposure to
aqueous media disrupted the material structure and resulted in a reduction of the mechanical
properties, the mechanical properties remained comparable to those of native tissue itself. The
observed drop in mechanical strength immediately following the start of incubation for the
aligned scaffolds was explained by differential scanning calorimetry, which showed the
appearance of a disrupted soft segment crystal phase with changes in the degree of phase mixing
of hard and soft segments as well as the PCN crystal state within the polymer.
Of particular importance, it was found that the degradation of the materials, which resulted in
mass losses as high as 30% over four weeks, did not result in a significant deterioration of
mechanical properties, indicating a surface degradation process rather than bulk material
breakdown. The presence of surface degradation may result in a more predictable degradation
rate and rate of release for the degradation products, since diffusion through the bulk is not a
contributing factor.
The degradation of the polymer by cholesterol esterase provided a useful model for
biodegradation, yielding a controlled and consistent mass loss rate, at which CE mediated
surface degradation was primarily observed. The degradation products did not cause significant
acute cytotoxicity in-vitro, indicating that this biodegradable polymer may be appropriate as a

92
substrate for AF cells. Confined compressive mechanical forces were shown to instigate slight
changes to cell morphology, while leaving matrix production unaffected and the dynamic
compressive mechanical stimulation of 1kPa at 1Hz appeared to cause an increase in extent of
cell spreading early on, and an unconfirmed increase in cell density at later time points. These
effects were observed immediately following stimulation and persisted for at least 72 hours post-
stimulation. However, these morphological effects did not result in significant changes in DNA
content, cell proliferation, or matrix synthesis at 24 or 72 hours post-stimulation. It is therefore
recommended that the morphological differences observed under SEM be confirmed by looking
at more specific indicators of AF cellular adhesion.
Future studies may attempt to vary the applied force and duration of mechanical stimulation.
Other parameters that can be investigated to determine the AF response to mechanical
stimulation include apoptosis, changes in cell-specific matrix genes (types I, and II collagen and
aggrecan) and catabolic genes (MMP-3, MMP-13, and ADAMTs-4). Further, different modes of
mechanical force such as tensile, shear or hydrostatic forces may be more influential on AF cell
functionality and should be explored. Additional mechanical studies to explore the changes in
mechanical properties of the aligned polymer in the presence of AF tissue grown on the PU
substrate will provide further understanding of the role of this polymer for AF tissue engineering.
The results of this report, including the relatively constant rate of material degradation, the
observed mechanical behavior resembling that of AF tissue, and the absence of cytotoxic effects
make this polymer a suitable biomaterial candidate for use in the formation of tissue-engineered
annulus fibrosus. Studies have shown annulus fibrosus cells to be responsive to tensile
mechanical stimulation.1-4 While compressive forces on the AF cells under the aforementioned

93
conditions were found to have little influence on tissue growth, future work involving varied
conditions for compressive stimulation or the use of tensile mechanical stimulation, may be more
helpful to promote tissue production that more closely mimics that of the native annulus fibrosus.

94
References:
(1) Benallaoua, M., Richette, P., Francois, M. et al. Modulation of proteoglycan production by
cyclic tensile stretch in intervertebral disc cells through a post-translational mechanism.
Biorheology, 2006, 3-4, 303-310.
(2) Terahata, N., Ishihara, H., Ohshima, H., Hirano, N., and Tsuji, H. Effects of axial traction
stress on solute transport and proteoglycan synthesis in the porcine intervertebral disc in
vitro. Eur.Spine J., 1994, 6, 325-330.
(3) Rannou, F., Richette, P., Benallaoua, M. et al. Cyclic tensile stretch modulates proteoglycan
production by intervertebral disc annulus fibrosus cells through production of nitrite
oxide. J.Cell Biochem., 9-1-2003, 1, 148-157.
(4) Rannou, F., Lee, T. S., Zhou, R. H. et al. Intervertebral disc degeneration: the role of the
mitochondrial pathway in annulus fibrosus cell apoptosis induced by overload.
Am.J.Pathol., 2004, 3, 915-924.

95
95
Appendix A: Scaffold Preparation
Electrospinning
Electrospinning is a process that produces polymer fibers with diameters ranging from a few
nanometers to a few microns. The high voltage power supply produces a voltage in the range of
0–30 kV or higher. For safety, the current should be limited to a few hundred microamperes.
When a strong electrostatic field is applied to the syringe needle or a capillary, a droplet of the
polymer solution held at the tip by surface tension is deformed into a conical shape, which is
called the Taylor cone. When electrostatic force overcomes the surface tension of the solution, a
liquid jet is ejected from the tip of Taylor cone. A polymer nanofiber can be formed after
solvent evaporates while the jet moves from the tip to the grounded collector. There are usually
four parameters affecting the formation of nano-scale polymer fibers, i.e. concentration of
polymer solution, flow rate of polymer solution, distance between needle and collector, and
voltage.
Preparation of nanofibrous polycarbonate urethane scaffolds (random scaffolds)
16% polymer solution (can vary between 15-20%) was prepared by dissolving
polycarbonate in 1,1,1,3,3,3-hexafluora-2-propanol (i.e. 0.4 g in 2.5 ml of HFP).
The solution viscosity was compared relatively to previously prepared solutions using a
simple gravity-based capillary viscometer consisting of a hypodermic needle and 1mL
syringe to ensure consistency between different scaffold fabrications
The polymer solution was transferred to a BD 10 ml syringe, to which an 18G stainless
steel needle was attached. All of air bubbles were removed.
The syringe was fixed to the syringe pump and the wire supplying the voltage
difference was connected to the metallic needle far from its tip.
A foil paper covered collector was placed 18 cm below the needle and connected to the
ground terminal of the voltage generator.

96
96
The syringe pump was turned on at 0.5 ml/hr and the desired volume (1.5-2.5mL) was
delivered.
The power generator was powered up to 18 kilovolts.
Preparation of nanofibrous polycarbonate urethane scaffolds (aligned scaffolds)
16% polymer solution (can vary between 15-20%) was prepared by dissolving
polycarbonate in 1,1,1,3,3,3-hexafluora-2-propanol (i.e. 0.4 g in 2.5 ml of HFP).
The solution viscosity was compared relatively to previously prepared solutions using a
simple capillary viscometer consisting of a hypodermic needle and 1mL syringe to
ensure consistency between different scaffold fabrications
The polymer solution was transferred to a BD 10 ml syringe, to which an 18G stainless
steel needle was attached. Traces of air bubbles were removed.
The syringe was fixed to the syringe pump and the wire supplying the voltage
difference was connected to the metallic needle far from its tip.
The mandrel was placed directly 18cm below the needle and attach the ground terminal
to the mandrel axle.
The surface of the mandrel edge was covered with a strip of foil paper (~48cm x 2cm).
The mandrel speed was adjusted to 1250 rpm (may be varied to optimize conditions)
The syringe pump was set to 0.5 ml/hr and the desired volume (1.5-2.5mL) was
delivered.
Turn on the power generator and slowly increase the voltage to 18 kilovolts.
The power generator was powered up to 18 kilovolts.
Note: 0.05% ADO was added to the solution where required. Following the electrospinning
procedures, all scaffolds were γ-irradiated at 4 MRad (Gammacell 220 Research Irradiator, MDS
Nordion, Canada).

97
97
Humidity Effects
It was found that increased humidity resulted in detrimental polymer quality, by affecting the
degree of solvent evaporation. A number of instrument set ups were devised in an attempt to
lower the humidity of the enclosure containing the electrospinning system. A dehumidifier was
used to pump dehumidified air into the enclosure. However these did not succeed due to
disruption of fiber deposition by the air current, and the increased temperature within the
enclosure (Figure A.1). The final design (Figure A.2) involved the delivery of dehumidified air
in a uniform and controlled manner (Figure A.3), such that the fiber deposition remained
unaffected (Figure A.4). In addition, the dehumidified air was cooled from 50ºC to 25ºC via a
cooling reservoir.
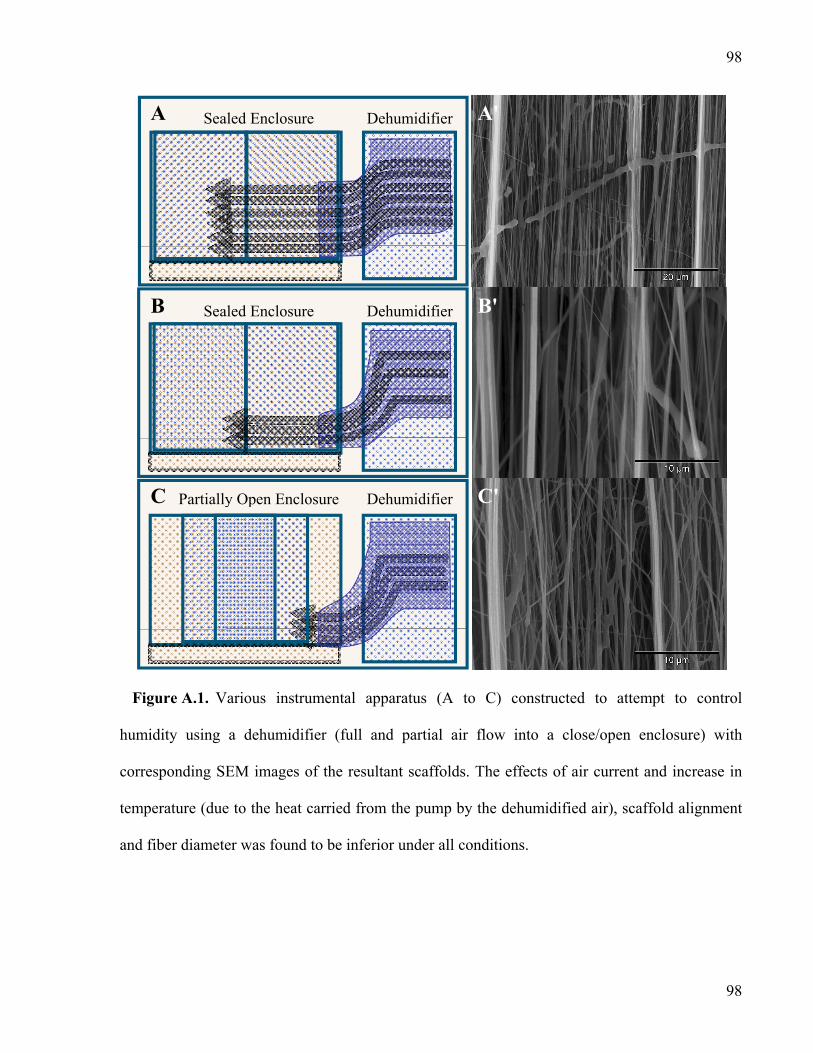
98
98
Figure A.1. Various instrumental apparatus (A to C) constructed to attempt to control
humidity using a dehumidifier (full and partial air flow into a close/open enclosure) with
corresponding SEM images of the resultant scaffolds. The effects of air current and increase in
temperature (due to the heat carried from the pump by the dehumidified air), scaffold alignment
and fiber diameter was found to be inferior under all conditions.
A'
B'
C'
A
B
C
Sealed Enclosure Dehumidifier
Partially Open Enclosure
Sealed Enclosure Dehumidifier
Dehumidifier
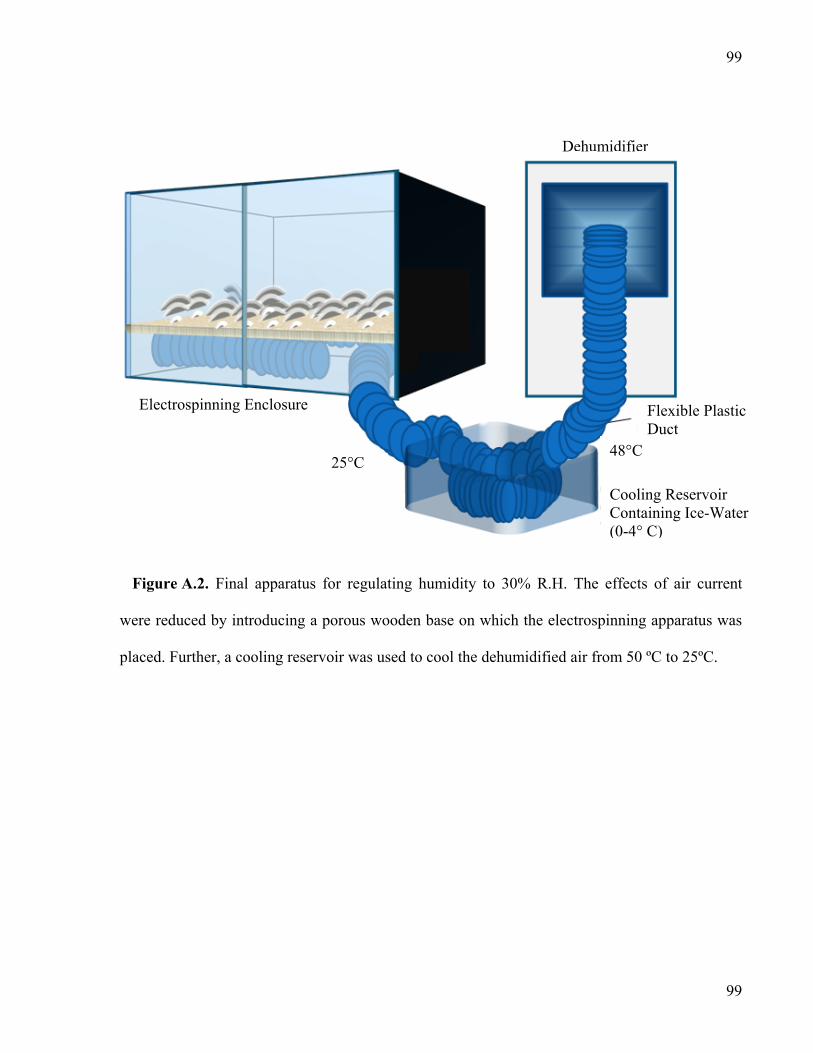
99
99
Figure A.2. Final apparatus for regulating humidity to 30% R.H. The effects of air current
were reduced by introducing a porous wooden base on which the electrospinning apparatus was
placed. Further, a cooling reservoir was used to cool the dehumidified air from 50 ºC to 25ºC.
Dehumidifier
48°C
Flexible Plastic Duct
Cooling Reservoir Containing Ice-Water (0-4° C)
25°C
Electrospinning Enclosure
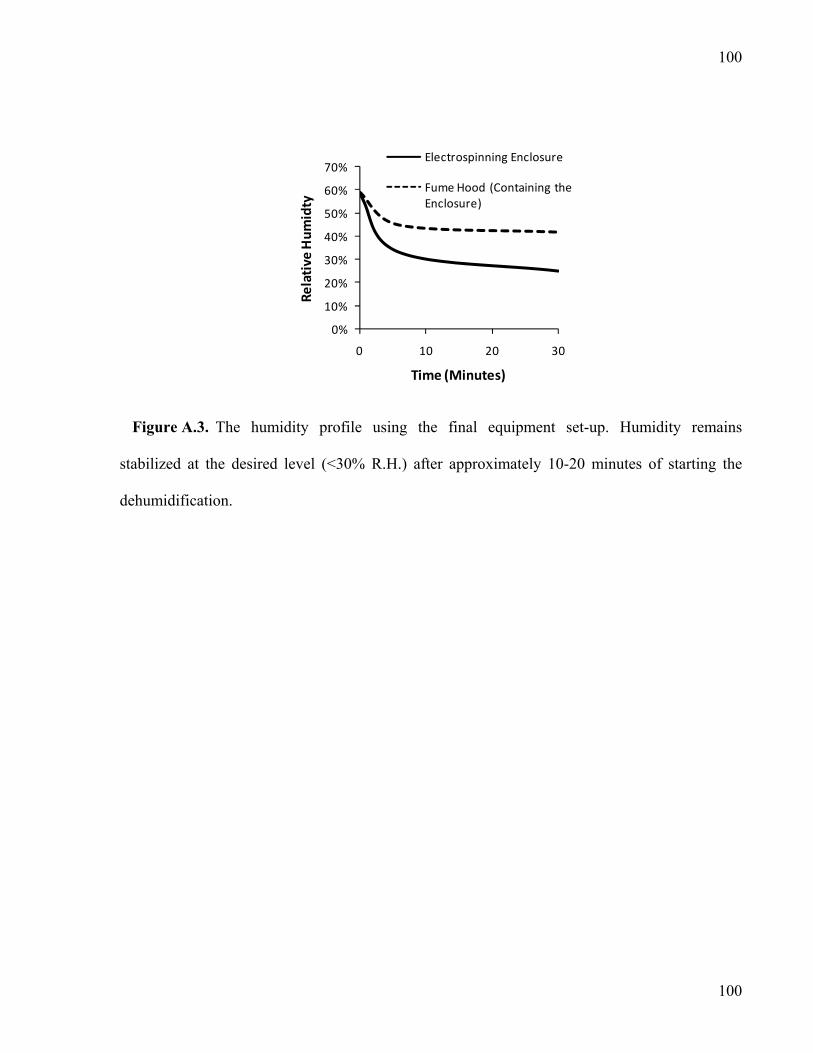
100
100
Figure A.3. The humidity profile using the final equipment set-up. Humidity remains
stabilized at the desired level (<30% R.H.) after approximately 10-20 minutes of starting the
dehumidification.
0%
10%
20%
30%
40%
50%
60%
70%
0 10 20 30
Relative
Humidty
Time (Minutes)
Electrospinning Enclosure
Fume Hood (Containing the Enclosure)

101
101
Figure A.4. Scanning electron microscopy indicating processed fiber dimension, their
alignment, and confirming that transverse fibers were not a significant occurrence
102
102
Appendix B: Biodegradation
The activity of the cholesterol esterase enzyme was measured by analyzing its degradation of
p-nitrophenylbutyrate (p-NPB) into a non-soluble precipitate. 1 CE unit was defined as
generation of 1nmol/min of p-nitrophenol from p-nitrophenylbutyrate.
Reagent Preparation:
1. 1 liter 50mM sodium phosphate buffer was prepared by dissolving 2.6908 gram of
NaH2PO4.H2O; 4.3298 gram Na2HPO4 in 1L of Millipore filtered water
2. 4mM p-nitrophenylbutyrate (p-NPB) substrate solution was prepared by dissolving
17.75l of p-NPB (F.W. 209.2, density: 1.2g/ml in 25 C) to 5.5 ml of acetonitrile in a
25ml glass tube, and adding 19.5ml 50mM Sodium phosphate buffer. The solution was
stored at -70C.
3. The initial standard enzyme solution was prepared by dissolving 15mg of Cholesterol
Esterase (CE) (Sigma; 683U/mg, C-3766) in 50 ml 50mM phosphate buffer, pH 7.0.
Standard Curve for CE Enzyme Activity
1) The Tungsten lamp of DU800 device was warmed up for 20 min before use and set to
401nm.
2) In a 1.5 mL cuvette, the following was added:
50 L of Enzyme Solution
950 L of 50mM Sodium phosphate buffer
500 L of 4mM p-NPB
CE p-nitrophenylbutyrate (p-NPB) p-nitrophenol (yellow) + butyrate
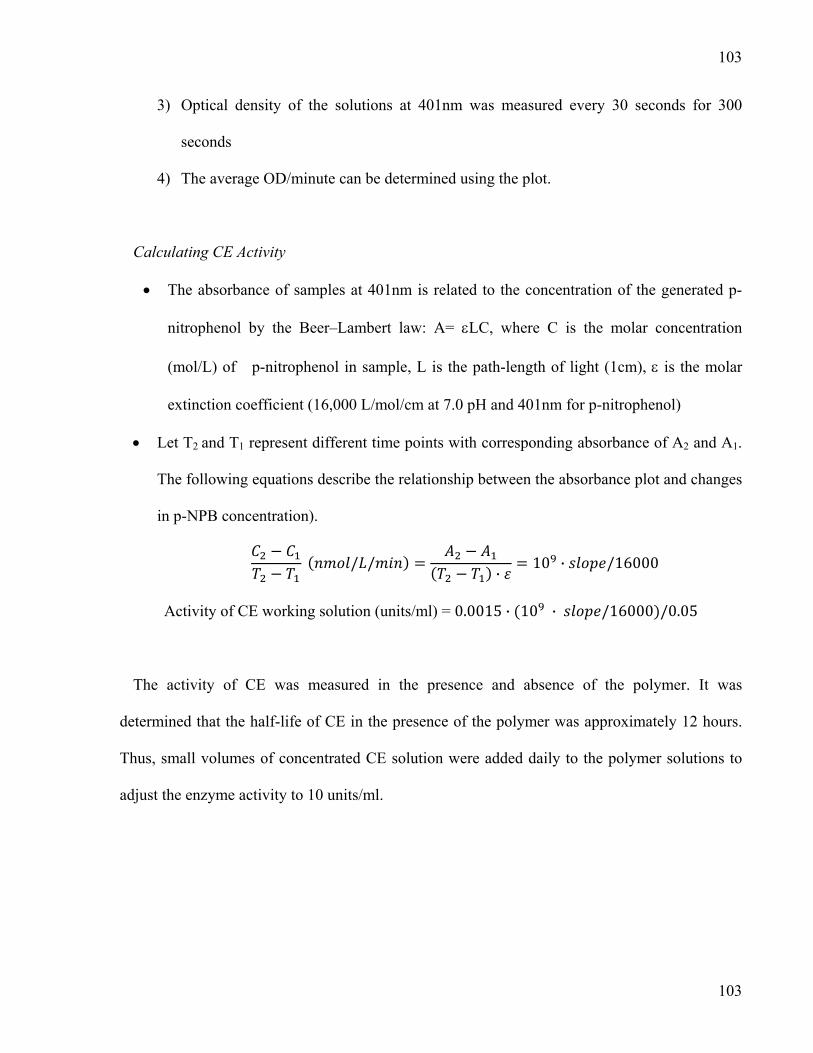
103
103
3) Optical density of the solutions at 401nm was measured every 30 seconds for 300
seconds
4) The average OD/minute can be determined using the plot.
Calculating CE Activity
The absorbance of samples at 401nm is related to the concentration of the generated p-
nitrophenol by the Beer–Lambert law: A= LC, where C is the molar concentration
(mol/L) of p-nitrophenol in sample, L is the path-length of light (1cm), is the molar
extinction coefficient (16,000 L/mol/cm at 7.0 pH and 401nm for p-nitrophenol)
Let T2 and T1 represent different time points with corresponding absorbance of A2 and A1.
The following equations describe the relationship between the absorbance plot and changes
in p-NPB concentration).
/ /·
10 · /16000
Activity of CE working solution (units/ml) = 0.0015 · 10 · /16000 /0.05
The activity of CE was measured in the presence and absence of the polymer. It was
determined that the half-life of CE in the presence of the polymer was approximately 12 hours.
Thus, small volumes of concentrated CE solution were added daily to the polymer solutions to
adjust the enzyme activity to 10 units/ml.

104
104
Scaffold Thickness
The thickness of the various scaffold groups are shown in Figure B.1. The differences in
thickness between the aligned and random scaffolds stem from the fact that following the
fabrication process, thinner random polymers are difficult to remove from the deposition surface
without being subjected to deformation, due to their inferior mechanical properties. Thus thicker
random scaffolds were fabricated to prevent polymer plastic deformation prior to mechanical
testing. On the other hand, thicker aligned scaffolds could not be fabricated, since additional
deposited fibers would begin to lose their aligned nature. It was therefore not possible to
overcome this disparity in polymer thickness, as would be ideal for such an experiment. A
consistent decline in thickness was observed throughout the four weeks of biodegradation, as
would be expected given the presented mass loss. Further, the suspected surface-mediated
degradation seems to be supported by this data as well. The cumulative decline in thickness
appears to be independent of the original thickness of the scaffolds.
Figure B.1. Changes in the thickness of scaffolds throughout the biodegradation process
0
0.1
0.2
0.3
0.4
0.5
0.6
As‐made Pre‐wet Week 1 Week 2 Week 3 Week 4
Thickn
ess (m
m)
Aligned PU+ADO Aligned PU Random PU+ADO

105
105
Appendix C: Mechanical Testing
The nanofiber scaffolds, which measured about 3cm in length, were held at both ends in an
Instron® model 8501 mechanical testing device. A tensile force was applied such that the strain
rate remained at 10 mm/min. Displacement and force data was collected, the dimensions of the
polymers noted and used to convert these raw measurements to stress and strain data. Initial
modulus was determined through analyzing the initial linear behavior of the stress strain curves.
It is important to note that aligned scaffolds were prone to the presence of folds upon
immobilization within the clamps. This folding phenomenon was not observed in the case of
random fibers due to their higher thickness and easier handling. Thus during the mechanical
testing procedure for it was difficult to begin applying the tensile stress in such a manner that all
points along the cross-section of an aligned sample begin to experience strain at the same
moment. Soon after the test begins, as the entire sample begins to experience strain at a uniform
rate with the disappearance of the folds within the scaffold surface. This phenomenon explains
the very small initial toe region visible in some stress-strain curves (such as in Figure C.2A). Due
to the expected fluctuations in the raw data, the linearity of the initial portion of the curve was
extracted by reducing as much as possible, the random variations from the raw data. It was found
that the initial modulus (the longest linear portion found at the outset of the stress strain curves)
was a consistent and relevant measure of material behavior. The ultimate stress, while not as
consistent, was nonetheless analyzed due to its importance.
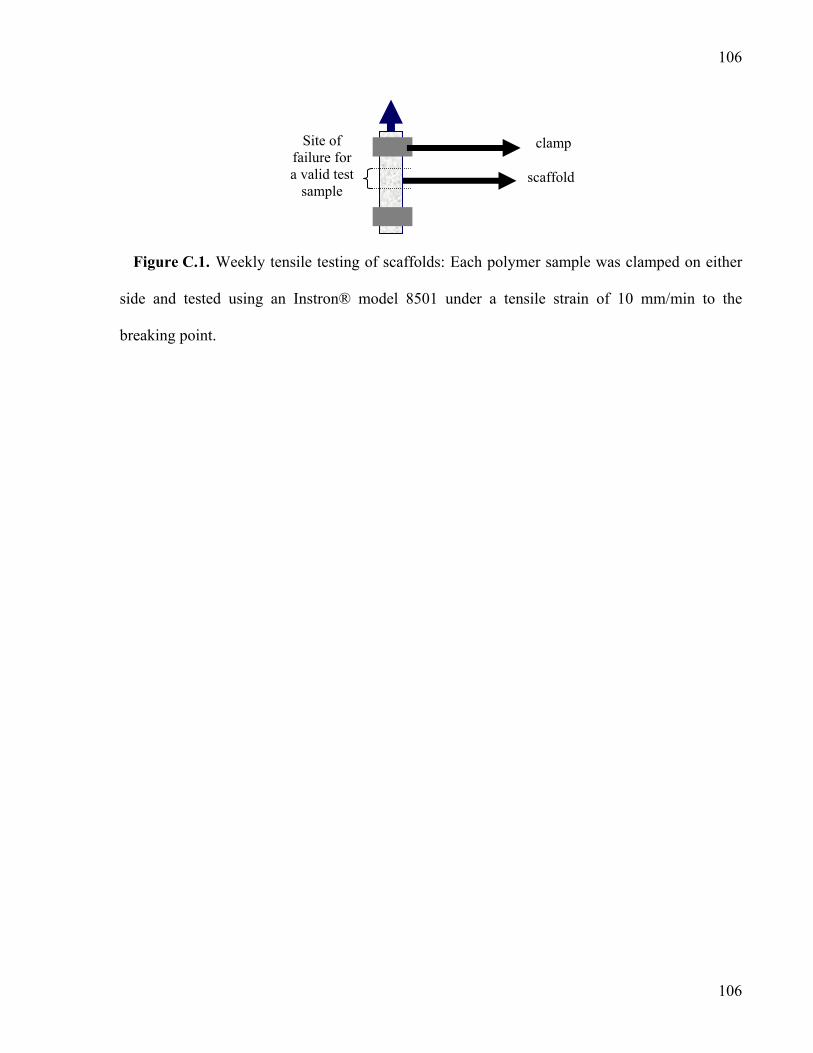
106
106
Figure C.1. Weekly tensile testing of scaffolds: Each polymer sample was clamped on either
side and tested using an Instron® model 8501 under a tensile strain of 10 mm/min to the
breaking point.
clamp
scaffold
Site of failure for a valid test
sample
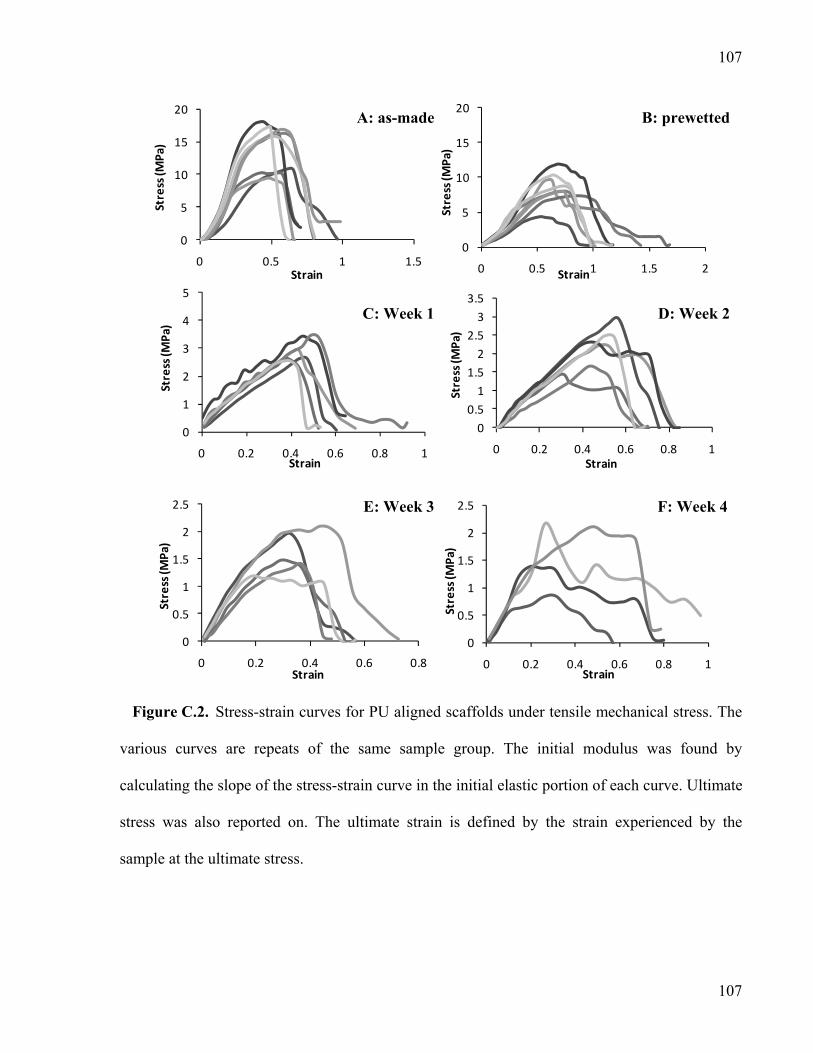
107
107
Figure C.2. Stress-strain curves for PU aligned scaffolds under tensile mechanical stress. The
various curves are repeats of the same sample group. The initial modulus was found by
calculating the slope of the stress-strain curve in the initial elastic portion of each curve. Ultimate
stress was also reported on. The ultimate strain is defined by the strain experienced by the
sample at the ultimate stress.
0
5
10
15
20
0 0.5 1 1.5
Stress (M
Pa)
Strain
0
5
10
15
20
0 0.5 1 1.5 2
Stress (M
Pa)
Strain
0
1
2
3
4
5
0 0.2 0.4 0.6 0.8 1
Stress (M
Pa)
Strain
0
0.5
1
1.5
2
2.5
3
3.5
0 0.2 0.4 0.6 0.8 1Stress (M
Pa)
Strain
0
0.5
1
1.5
2
2.5
0 0.2 0.4 0.6 0.8
Stress (M
Pa)
Strain
0
0.5
1
1.5
2
2.5
0 0.2 0.4 0.6 0.8 1
Stress (M
Pa)
Strain
A: as-made
C: Week 1
E: Week 3
B: prewetted
D: Week 2
F: Week 4

108
108
Figure C.3. Stress-strain curves for PU + 0.5% ADO aligned scaffolds under tensile
mechanical stress: The various curves are repeats of the same sample group. The initial modulus
was found by calculating the slope of the stress-strain curve in the initial elastic portion of each
curve. Ultimate stress was also reported on. The ultimate strain is defined by the strain
experienced by the sample at the ultimate stress.
0
5
10
15
20
0 0.5 1 1.5
Stress (M
Pa)
Strain
0
5
10
15
20
0 0.5 1 1.5 2
Stress (M
Pa)
Strain
0
1
2
3
4
5
0 0.2 0.4 0.6 0.8 1
Stress (M
Pa)
Strain
0
1
2
3
4
5
0 0.2 0.4 0.6 0.8 1 1.2 1.4Stress (M
Pa)
Strain
0
1
2
3
4
5
0 0.2 0.4 0.6 0.8 1
Stress (M
Pa)
Strain
0
1
2
3
4
5
0 0.2 0.4 0.6 0.8 1
Stress (M
Pa)
Strain
A: as-made
C: Week 1
E: Week 3
B: prewetted
D: Week 2
F: Week 4

109
109
Figure C.4. Stress-strain curves for PU + 0.5% ADO random scaffolds under tensile
mechanical stress: The various curves are repeats of the same sample group. The initial modulus
was found by calculating the slope of the stress-strain curve in the initial elastic portion of each
curve. Ultimate stress was also reported on. The ultimate strain is defined by the strain
experienced by the sample at the ultimate stress.
0
1
2
3
4
0 5 10
Stress (M
Pa)
Strain
0
1
2
3
4
0 5 10 15
Stress (M
Pa)
Strain
0
0.5
1
1.5
2
0 1 2 3 4 5
Stress (M
Pa)
Strain
0
0.5
1
1.5
2
2.5
3
0 2 4 6
Stress (M
Pa)
Strain
0
0.5
1
1.5
2
2.5
0 2 4 6
Stress (M
Pa)
Strain
0
0.5
1
1.5
2
2.5
0 1 2 3 4 5
Stress (M
Pa)
Strain
A: as-made
C: Week 1
E: Week 3
B: prewetted
D: Week 2
F: Week 4

110
110
Appendix D: Annulus Fibrosus Tissue Culture
In vitro culture was used in the cytotoxic evaluation and mechanical stimulation studies. The
AF cell seeding procedure is outlined below.
1. Biopsy punches were used to cut fibrous PU membranes into pieces 6 mm in diameter
2. Circular polymer pieces were placed on top of cylindrical Tygon tubing (4mm in
diameter and 6mm in height). A porous titanium disc was used to push and fit the
polymer within the Tygon tubing (see Figure D.2E).
3. The constructs were irradiated at 4 MRad
4. The Tygon/membrane/titanium disc constructs were incubated overnight in 24 well
plates containing 1.5 mL of Ham’s F12 media.
5. Bovine tails were dissected (Figure D.); outer AF tissue was removed and chopped into
1mm pieces. The tissue underwent serial digestion with 0.5% protease (Sigma, St.
Louis, MO) for 1 hr at 37° C, followed by 0.25% collagenase A (Roche, Quebec,
Canada) overnight at 37° C.
6. The cell suspension was washed, filtered through a sterile mesh, and resuspended in
Ham’s F12 supplemented with 5% fetal bovine serum (FBS).
7. 20-30 µL Ham’s F12 supplemented with 5% FBS was placed into each well of a 96-
well plate; constructs were then added.
8. 40µL of cell suspension containing the desired AF cell numbers (8x10⁵/cm2) was added
to the top of the scaffolds, ensuring all air bubbles were removed and the cells were
allowed to adhere for 2-4 hours in the incubator.
9. Additional Ham’s F12 supplemented with 5% FBS was then added to submerge
constructs entirely.

111
111
10. After 24 hours, the constructs were transferred to a 24-well plate containing 2mL of
media
11. The media was replenished every 2 days with 1.5mL of F12 supplemented with
5%FBS in addition to ascorbic acid (final concentration of 100 µg/mL) starting on day
3.
12. Constructs were washed 3 times in serum-free Ham’s F12 media containing ascorbic
acid and further incubated in serum free F12 media overnight prior to mechanical
stimulation experiments.
Figure D.1. Multiple discs were dissected from a single tail and the isolated AF cells were
combined to provide sufficient cells for an experiment and improve consistency. Only outer AF
cells were used in all experiments.
IVD

112
112
Optimization of protocol for cell seeding on scaffolds:
Several methods were attempted for cell seeding on polymer scaffolds, each with a number of
problems, such as scaffold folding/wrinkling, cell suspension spillage, and the inability to
immobilize the seeded scaffold for mechanical stimulation. These issues were resolved in the
finalized setup where polymers were biopsy-punched into circular sections (D=6mm, and
thickness of 80 ± 10µm) and fixed over a porous titanium disc (D=4mm, h=2mm), by the Tygon
tubing (Figure D.2E). The tubing created a well-like structure to prevent cell spillage and
provided cells with a confined area to attach within a specific region of the scaffold. The porous
titanium base allowed the application of compression to the scaffold while ensuring media
diffusion from below. A cell seeding density optimization study was performed, where cell-
seeded scaffolds were papain digested and cell attachment was measured through analysis of
DNA content. The extent and uniformity of cell attachment was evaluated by SEM analysis.
Lower seeding densities were found to produce higher percent attachment (of original seeded
cell suspension). Further, a seeding density of 8 million cells / cm2 produced thick cellular layers,
where cell-cell contact dominated cell-polymer contact (Figure D.3). A seeding density of 0.8
million cells / cm2 was chosen to ensure that cell-polymer contact was sufficient (Figure D.4).

113
113
Figure D.2. Methods evaluated (A to D): (A) Cell suspension on the polymer scaffold alone,
(B) Cell suspension on scaffold, supported by an agarose gel base, (C) cell suspension confined
by a Teflon insert, (D) cell confinement through the use of Tygon tubing; (E) The seeding
method selected for all subsequent experiments which consisted of using a Tygon tubing and a
porous titanium disc and (F) the corresponding apparatus for mechanical stimulation of tissue.
Titanium plate
Agarose plug
Tygon Tubing
Cells on the Scaffold
Porous Titanium Base
A B C
E F
D
Cell suspension
Agarose Gel
Teflon Insert

114
114
Figure D.3. SEM images at low (A) and higher magnification (B) showing scaffolds seeded at
0.8 million cells / cm2. This density produced cellular layers, where cell-cell contact dominated
cell-polymer contact. It was therefore decided to reduce cell seeding density to 0.8 million cells /
cm2
A
B
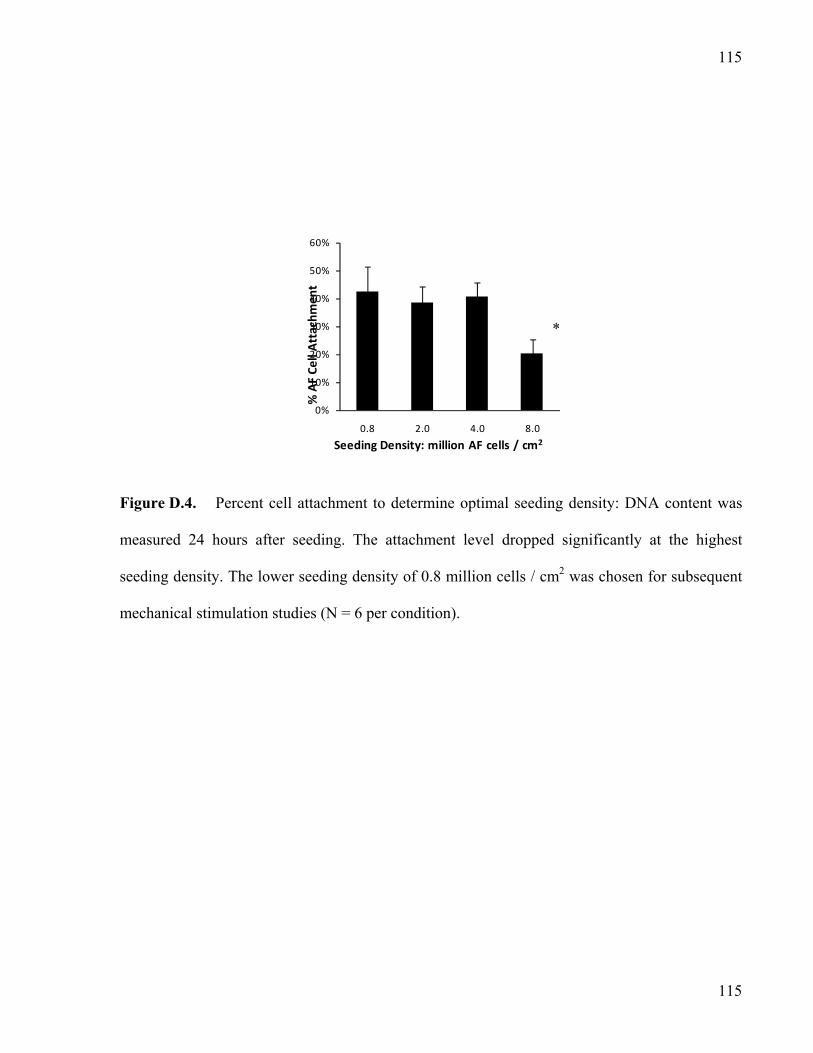
115
115
Figure D.4. Percent cell attachment to determine optimal seeding density: DNA content was
measured 24 hours after seeding. The attachment level dropped significantly at the highest
seeding density. The lower seeding density of 0.8 million cells / cm2 was chosen for subsequent
mechanical stimulation studies (N = 6 per condition).
0%
10%
20%
30%
40%
50%
60%
0.8 2.0 4.0 8.0
Seeding Density: million AF cells / cm2
*% AF Cell Attachmen
t

116
116
Appendix E: Cytotoxicity Evaluation
Cytotoxic evaluation of degradation products was performed using the MTT and Live/Dead
Assays:
Frozen degradation products (previously maintained in PBS), were thawed.
Degradation solutions were mixed and spun down at 3000 RCF to form a non-soluble
pellet
The supernatant was filtered using a syringe filter of size 0.20 um
The non-soluble degradation products were resuspended in F12 containing 5% FBS.
Soluble and non-soluble degradation products were added to 96-well plates containing
200k/cm2 AF cells in monolayer cultures and incubated for 24 hours (160µL per well).
Degradation products were combined from 4 samples for each specific condition.
Following the 24 hour incubation period, the MTT and Live/Dead Assays was
performed
Media was aspirated and 1 mL of fresh medium containing MTT or Live/Dead reagents
were added to the cells
MTT Assay
It was found that the appropriate cell density (near confluent) of 100k/cm2 monolayer
cultures produced satisfactory differences between negative controls and positive controls
(Figure E.). Two hours was found to be sufficient to detect such a difference, without
reaching a saturation point
The solutions were allowed to incubate (at 37ºC and 5% CO2) for 2 hours before
the MTT solution was aspirated
117
117
200µl of methylcellusolve (pH3.5) was used to dissolve the formazan precipitate
(plates were shaken for one to two minutes to allow the precipitate to dissolve)
200µl aliquots of the formazan solutions were pipetted into a 96 well plate and read
at 570nm
Live/Dead Assay
The degradation product solution was gently aspirated, and the cells were washed
lightly with Ham’s F12 media. This process was performed for both the positive
and negative controls as well.
160µL of Ham’s F12 media containing 4 μM calcein AM and 4 μM ethidium
homodimer EthD-1 (Invitrogen L-3224, Burlington, Ontario) were added directly
to cells.
Each sample was allowed to incubate (at 37 ºC and 5% CO2) for 15 minutes prior
to confocal imaging (Figure E.2) (Calcein: 494/517 nm, Ethidium homodimer-1:
528/617 nm)
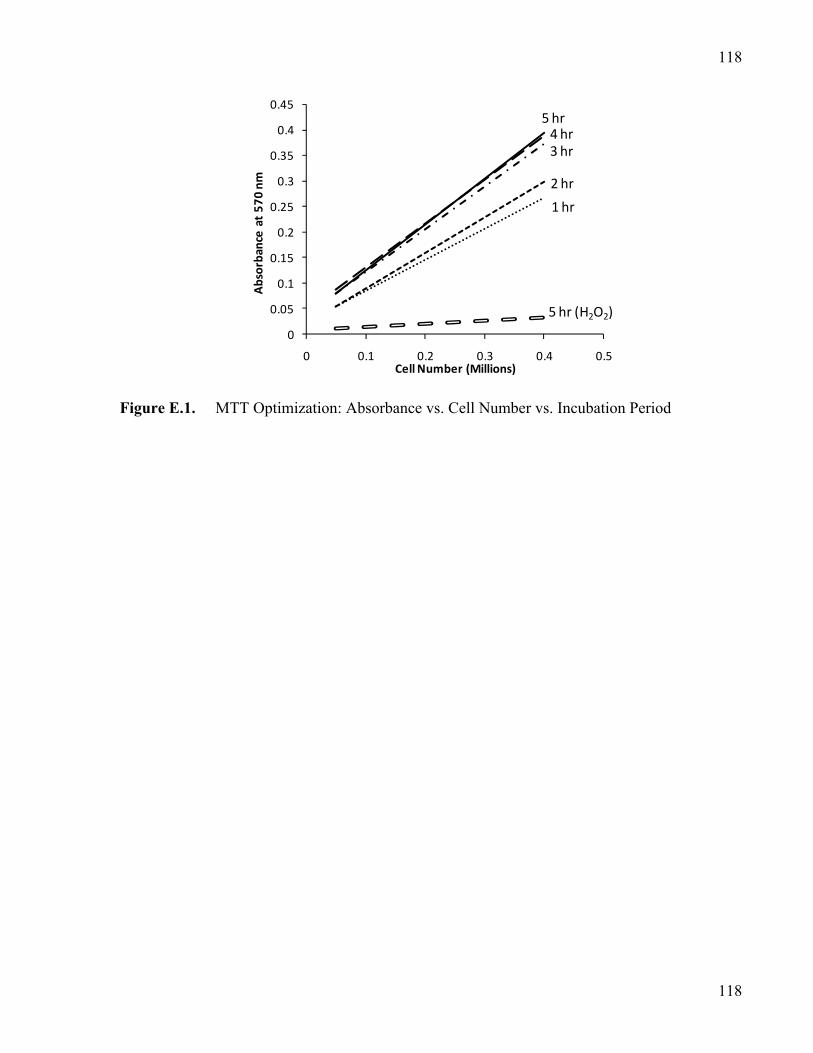
118
118
Figure E.1. MTT Optimization: Absorbance vs. Cell Number vs. Incubation Period
0
0.05
0.1
0.15
0.2
0.25
0.3
0.35
0.4
0.45
0 0.1 0.2 0.3 0.4 0.5
Absorbance at 570 nm
Cell Number (Millions)
1 hr
2 hr
3 hr4 hr
5 hr
5 hr (H2O2)

119
119
Live / Dead Assay Images:
Figure E.2. Representative images of Live/Dead assay of AF Cells incubated for 24 hours (37
ºC, 5% CO2): in either (A) F12 Ham’s Media containing 5% FBS (negative control); or (B)
Ham’s F12 Media containing 0.01 wt% H2O2 (Positive Control)
A
B
*

120
120
Figure E.3. Live/Dead Assay: Photomicrograph of AF cells subjected to Non-Soluble
Degradation Products of PU aligned polymers at various concentrations [(A) 0.001 wt. %, (B)
0.005 wt. %, (C) 0.01 wt. %, (D) 0.025 wt. %, (E) 0.05 wt. %, or (F) 0.1 wt. % (g/100mL)]
A B
C D
E F

121
121
Figure E.4. Live/Dead Assay: Photomicrograph of AF cells subjected to Non-Soluble
Degradation Products of PU + 0.05% ADO aligned polymers at various concentrations [(A)
0.001 wt. %, (B) 0.005 wt. %, (C) 0.01 wt. %, (D) 0.025 wt. %, (E) 0.05 wt. %, or (F) 0.1 wt. %
(g/100mL)]
A B
C D
E F

122
122
Figure E.5. Live/Dead Assay: Photomicrograph of AF cells subjected to Buffer Soluble
Degradation Products of PU aligned polymers at various concentrations [(A) 20 %, (B) 40 %,
(C) 50 %, (D) 60 %, (E) 80 %, (F) 100 % (percent by volume)]
A B
C D
E F
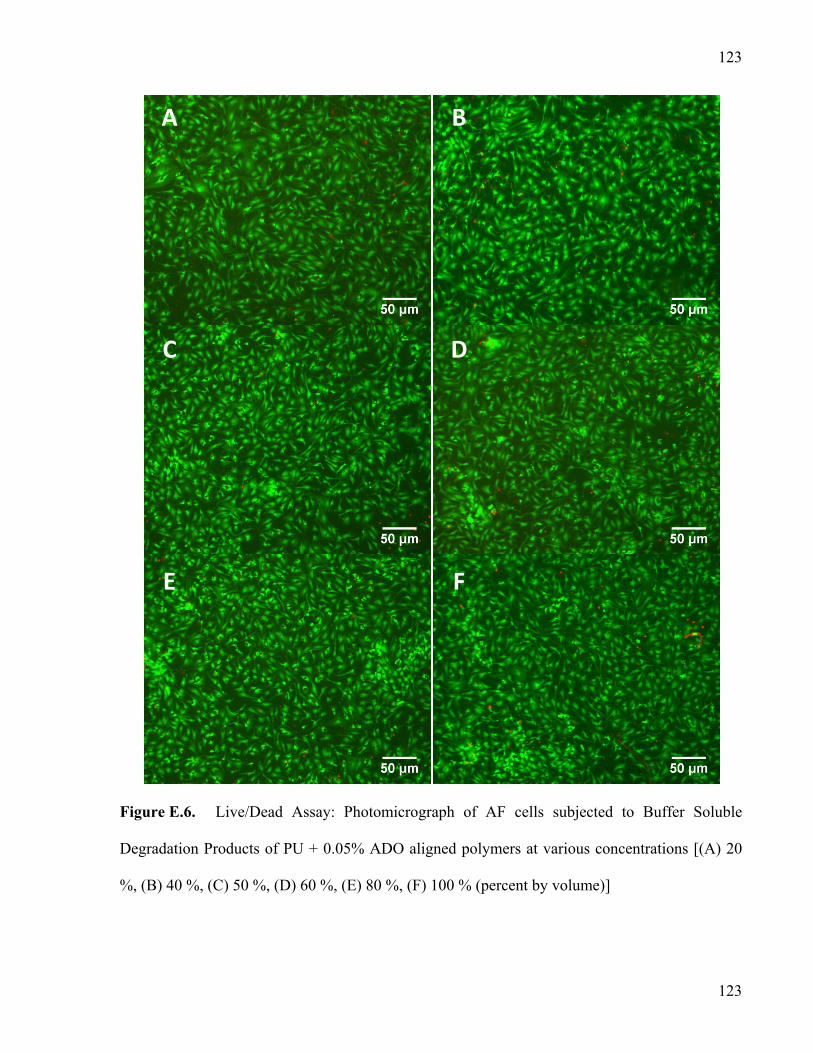
123
123
Figure E.6. Live/Dead Assay: Photomicrograph of AF cells subjected to Buffer Soluble
Degradation Products of PU + 0.05% ADO aligned polymers at various concentrations [(A) 20
%, (B) 40 %, (C) 50 %, (D) 60 %, (E) 80 %, (F) 100 % (percent by volume)]
A B
C D
E F
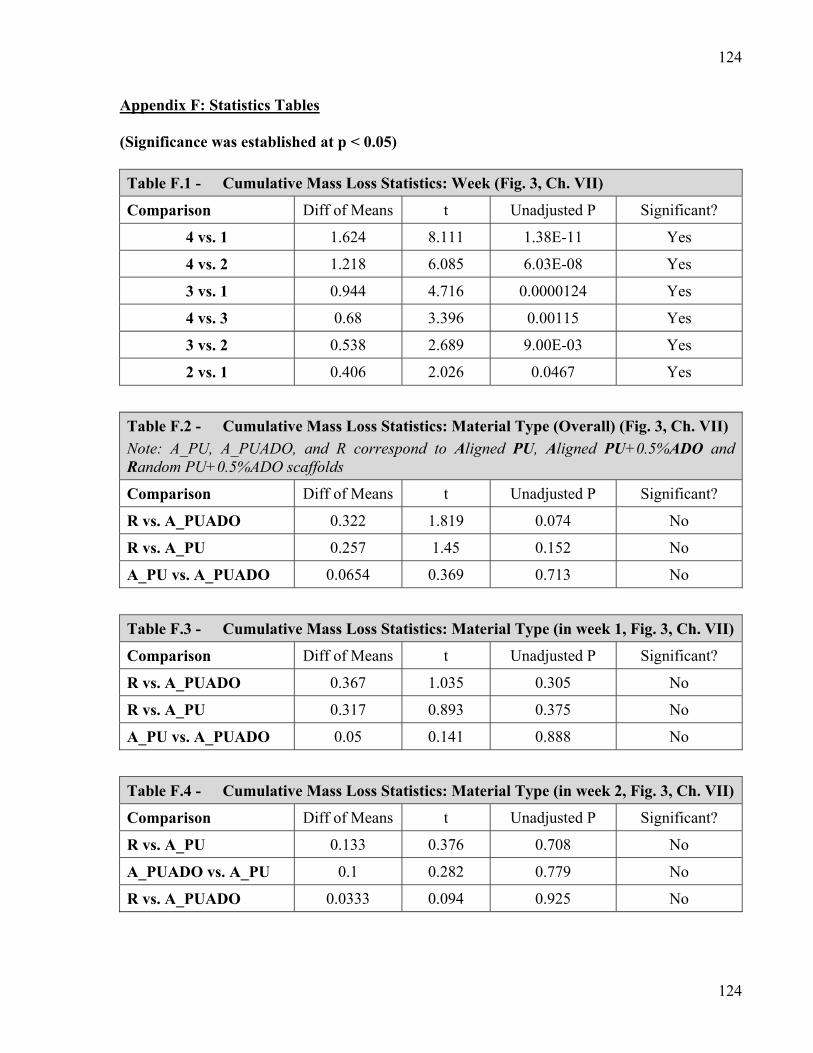
124
124
Appendix F: Statistics Tables
(Significance was established at p < 0.05)
Table F.1 - Cumulative Mass Loss Statistics: Week (Fig. 3, Ch. VII)
Comparison Diff of Means t Unadjusted P Significant?
4 vs. 1 1.624 8.111 1.38E-11 Yes
4 vs. 2 1.218 6.085 6.03E-08 Yes
3 vs. 1 0.944 4.716 0.0000124 Yes
4 vs. 3 0.68 3.396 0.00115 Yes
3 vs. 2 0.538 2.689 9.00E-03 Yes
2 vs. 1 0.406 2.026 0.0467 Yes
Table F.2 - Cumulative Mass Loss Statistics: Material Type (Overall) (Fig. 3, Ch. VII)
Note: A_PU, A_PUADO, and R correspond to Aligned PU, Aligned PU+0.5%ADO and Random PU+0.5%ADO scaffolds
Comparison Diff of Means t Unadjusted P Significant?
R vs. A_PUADO 0.322 1.819 0.074 No
R vs. A_PU 0.257 1.45 0.152 No
A_PU vs. A_PUADO 0.0654 0.369 0.713 No
Table F.3 - Cumulative Mass Loss Statistics: Material Type (in week 1, Fig. 3, Ch. VII)
Comparison Diff of Means t Unadjusted P Significant?
R vs. A_PUADO 0.367 1.035 0.305 No
R vs. A_PU 0.317 0.893 0.375 No
A_PU vs. A_PUADO 0.05 0.141 0.888 No
Table F.4 - Cumulative Mass Loss Statistics: Material Type (in week 2, Fig. 3, Ch. VII)
Comparison Diff of Means t Unadjusted P Significant?
R vs. A_PU 0.133 0.376 0.708 No
A_PUADO vs. A_PU 0.1 0.282 0.779 No
R vs. A_PUADO 0.0333 0.094 0.925 No

125
125
Table F.5 - Cumulative Mass Loss Statistics: Material Type (in week 3, Fig. 3, Ch. VII)
Comparison Diff of Means t Unadjusted P Significant?
R vs. A_PUADO 0.315 0.889 0.378 No
R vs. A_PU 0.307 0.865 0.39 No
A_PU vs. A_PUADO 0.00833 0.0235 0.981 No
Table F.6 - Cumulative Mass Loss Statistics: Material Type (in week 4, Fig. 3, Ch. VII)
Comparison Diff of Means t Unadjusted P Significant?
R vs. A_PUADO 0.574 1.62 0.11 No
A_PU vs. A_PUADO 0.303 0.856 0.395 No
R vs. A_PU 0.271 0.764 0.448 No
Table F.7 - Initial Modulus: Material Type (within as-made, Fig. 4, Ch. VII)
Comparison Diff of Means t Unadjusted P Significant?
A_PU vs. R 44646200.38 10.357 2.98E-09 Yes
A_PUADO vs. R 42608198.01 10.208 3.77E-09 Yes
A_PU vs. A_PUADO 2038002.376 0.488 0.631 No
Table F.8 - Initial Modulus: Material Type (within prewet, Fig. 4, Ch. VII)
Comparison Diff of Means t Unadjusted P Significant?
A_PUADO vs. R 11331747.28 7.289 0.000000899 Yes
A_PU vs. R 10845488.33 7.28 0.000000915 Yes
A_PUADO vs. A_PU 486258.958 0.304 0.765 No
Table F.9 - Initial Modulus: Material Type (within week 1, Fig. 6, Ch. VII)
Comparison Diff of Means t Unadjusted P Significant?
A_PUADO vs. R 4916816.546 10.072 8.54E-08 Yes
A_PU vs. R 4557873.192 9.793 0.000000121 Yes
A_PUADO vs. A_PU 358943.354 0.735 0.474 No
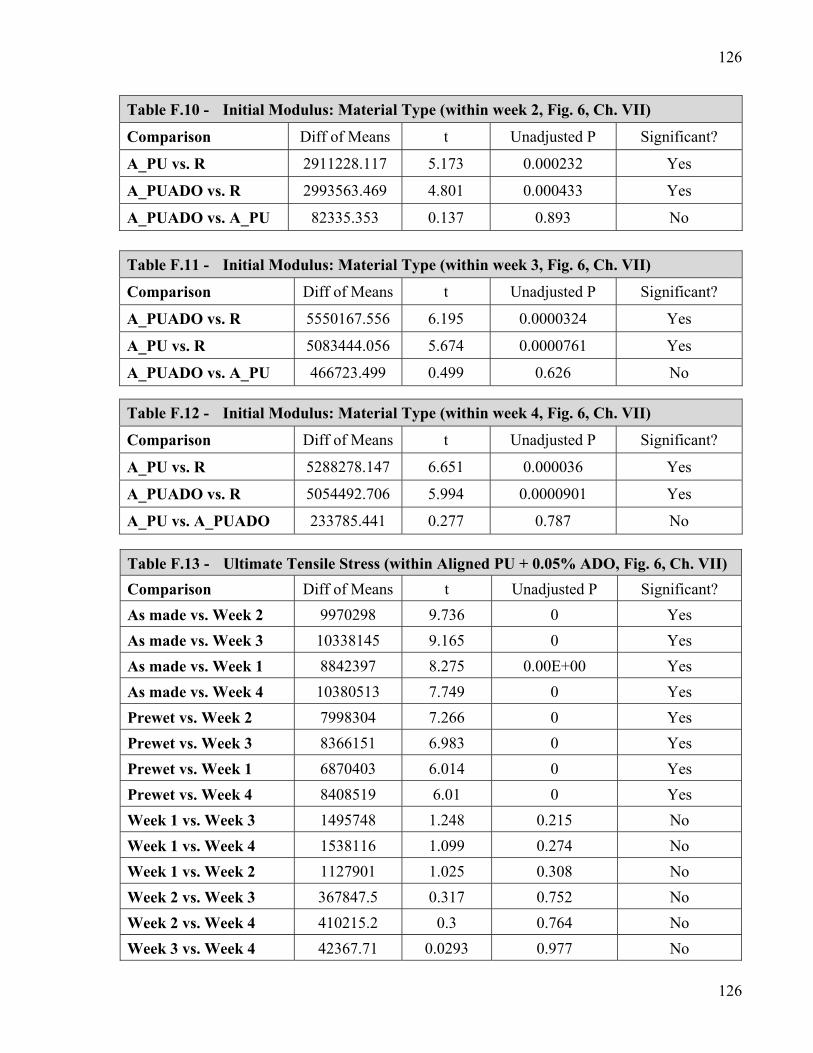
126
126
Table F.10 - Initial Modulus: Material Type (within week 2, Fig. 6, Ch. VII)
Comparison Diff of Means t Unadjusted P Significant?
A_PU vs. R 2911228.117 5.173 0.000232 Yes
A_PUADO vs. R 2993563.469 4.801 0.000433 Yes
A_PUADO vs. A_PU 82335.353 0.137 0.893 No
Table F.11 - Initial Modulus: Material Type (within week 3, Fig. 6, Ch. VII)
Comparison Diff of Means t Unadjusted P Significant?
A_PUADO vs. R 5550167.556 6.195 0.0000324 Yes
A_PU vs. R 5083444.056 5.674 0.0000761 Yes
A_PUADO vs. A_PU 466723.499 0.499 0.626 No
Table F.12 - Initial Modulus: Material Type (within week 4, Fig. 6, Ch. VII)
Comparison Diff of Means t Unadjusted P Significant?
A_PU vs. R 5288278.147 6.651 0.000036 Yes
A_PUADO vs. R 5054492.706 5.994 0.0000901 Yes
A_PU vs. A_PUADO 233785.441 0.277 0.787 No
Table F.13 - Ultimate Tensile Stress (within Aligned PU + 0.05% ADO, Fig. 6, Ch. VII)
Comparison Diff of Means t Unadjusted P Significant?
As made vs. Week 2 9970298 9.736 0 Yes
As made vs. Week 3 10338145 9.165 0 Yes
As made vs. Week 1 8842397 8.275 0.00E+00 Yes
As made vs. Week 4 10380513 7.749 0 Yes
Prewet vs. Week 2 7998304 7.266 0 Yes
Prewet vs. Week 3 8366151 6.983 0 Yes
Prewet vs. Week 1 6870403 6.014 0 Yes
Prewet vs. Week 4 8408519 6.01 0 Yes
Week 1 vs. Week 3 1495748 1.248 0.215 No
Week 1 vs. Week 4 1538116 1.099 0.274 No
Week 1 vs. Week 2 1127901 1.025 0.308 No
Week 2 vs. Week 3 367847.5 0.317 0.752 No
Week 2 vs. Week 4 410215.2 0.3 0.764 No
Week 3 vs. Week 4 42367.71 0.0293 0.977 No
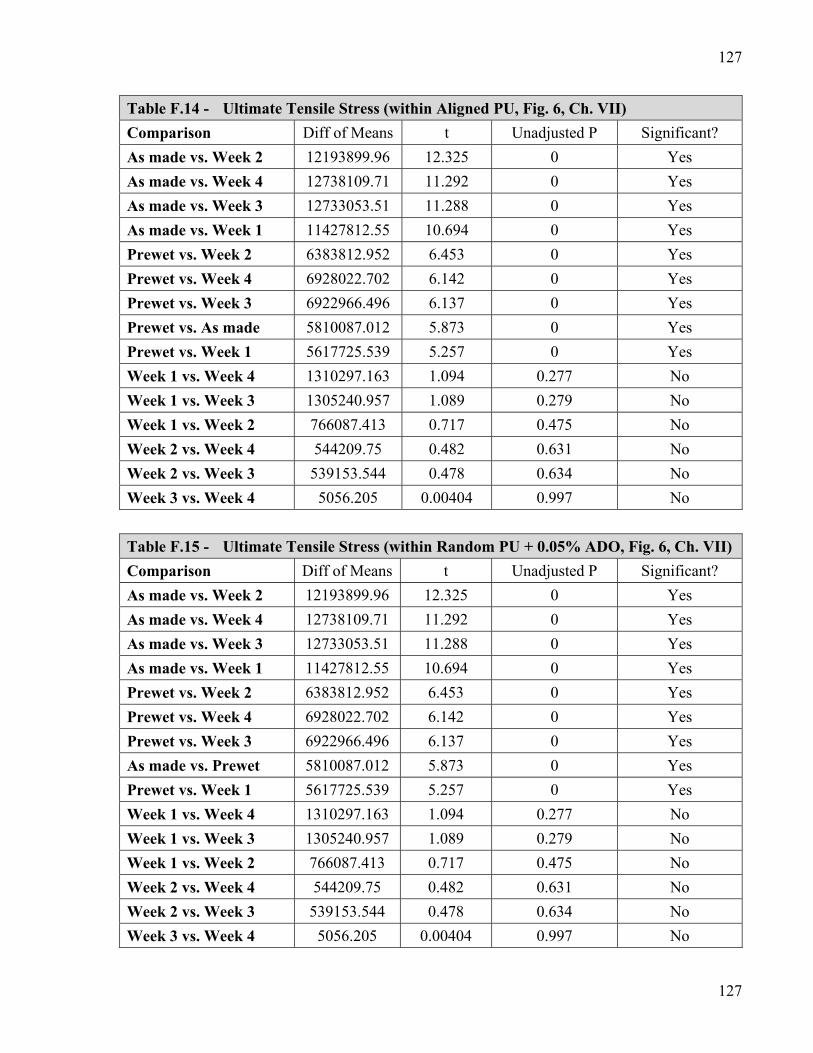
127
127
Table F.14 - Ultimate Tensile Stress (within Aligned PU, Fig. 6, Ch. VII)
Comparison Diff of Means t Unadjusted P Significant?
As made vs. Week 2 12193899.96 12.325 0 Yes
As made vs. Week 4 12738109.71 11.292 0 Yes
As made vs. Week 3 12733053.51 11.288 0 Yes
As made vs. Week 1 11427812.55 10.694 0 Yes
Prewet vs. Week 2 6383812.952 6.453 0 Yes
Prewet vs. Week 4 6928022.702 6.142 0 Yes
Prewet vs. Week 3 6922966.496 6.137 0 Yes
Prewet vs. As made 5810087.012 5.873 0 Yes
Prewet vs. Week 1 5617725.539 5.257 0 Yes
Week 1 vs. Week 4 1310297.163 1.094 0.277 No
Week 1 vs. Week 3 1305240.957 1.089 0.279 No
Week 1 vs. Week 2 766087.413 0.717 0.475 No
Week 2 vs. Week 4 544209.75 0.482 0.631 No
Week 2 vs. Week 3 539153.544 0.478 0.634 No
Week 3 vs. Week 4 5056.205 0.00404 0.997 No
Table F.15 - Ultimate Tensile Stress (within Random PU + 0.05% ADO, Fig. 6, Ch. VII)
Comparison Diff of Means t Unadjusted P Significant?
As made vs. Week 2 12193899.96 12.325 0 Yes
As made vs. Week 4 12738109.71 11.292 0 Yes
As made vs. Week 3 12733053.51 11.288 0 Yes
As made vs. Week 1 11427812.55 10.694 0 Yes
Prewet vs. Week 2 6383812.952 6.453 0 Yes
Prewet vs. Week 4 6928022.702 6.142 0 Yes
Prewet vs. Week 3 6922966.496 6.137 0 Yes
As made vs. Prewet 5810087.012 5.873 0 Yes
Prewet vs. Week 1 5617725.539 5.257 0 Yes
Week 1 vs. Week 4 1310297.163 1.094 0.277 No
Week 1 vs. Week 3 1305240.957 1.089 0.279 No
Week 1 vs. Week 2 766087.413 0.717 0.475 No
Week 2 vs. Week 4 544209.75 0.482 0.631 No
Week 2 vs. Week 3 539153.544 0.478 0.634 No
Week 3 vs. Week 4 5056.205 0.00404 0.997 No

128
128
Table F.16 - DNA Content: (within groups: Stimulated and Control, Fig. 4, Ch. VIII)
Within Group: Stimulated
Comparison Diff of Means t Unadjusted P Critical Level Significant?
0 vs. 12 1.567 4 2.203 0.410 No
0 vs. 24 0.472 3 0.664 0.886 No
0 vs. 6 0.351 2 0.494 0.728 No
6 vs. 12 1.215 3 1.709 0.453 No
6 vs. 24 0.121 2 0.170 0.905 No
24 vs. 12 1.094 2 1.538 0.281 No
Within Group: Control
Comparison Diff of Means t Unadjusted P Critical Level Significant?
12 vs. 24 1.689 4 2.375 0.343 No
12 vs. 6 0.809 3 1.137 0.702 No
12 vs. 0 0.584 2 0.821 0.564 No
0 vs. 24 1.106 3 1.555 0.518 No
0 vs. 6 0.225 2 0.317 0.824 No
6 vs. 24 0.880 2 1.238 0.385 No
Table F.17 - DNA Content (within groups: 0hr, 6hr, 12hr, 24hr, Fig. 4, Ch. VIII)
Within Group: 0hr
Comparison Diff of Means t Unadjusted P Critical Level Significant?
Ctrl vs. Stim. 0.199 2 0.280 0.844 No
Within Group: 6hr
Ctrl vs. Stim. 0.0734 2 0.103 0.942 No
Within Group: 12hr
Ctrl vs. Stim. 1.951 2 2.743 0.057 No
Within Group: 24hr
Ctrl vs. Stim. 0.833 2 1.171 0.411 No
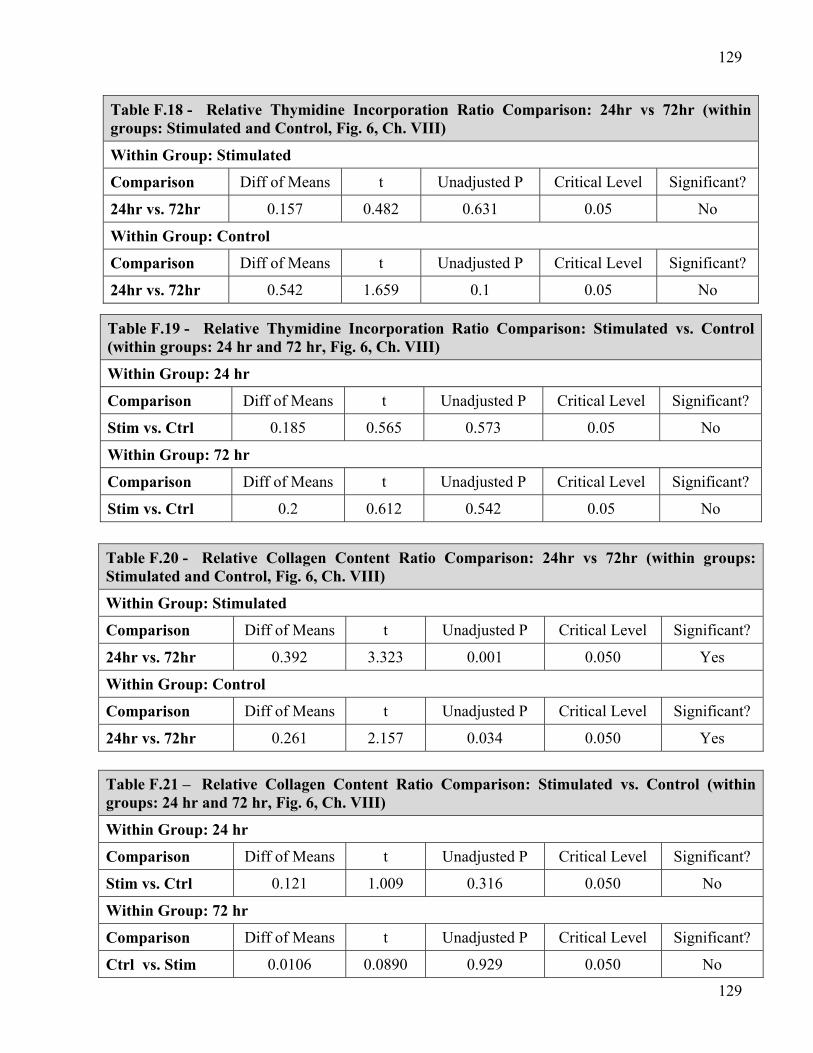
129
129
Table F.18 - Relative Thymidine Incorporation Ratio Comparison: 24hr vs 72hr (within groups: Stimulated and Control, Fig. 6, Ch. VIII)
Within Group: Stimulated
Comparison Diff of Means t Unadjusted P Critical Level Significant?
24hr vs. 72hr 0.157 0.482 0.631 0.05 No
Within Group: Control
Comparison Diff of Means t Unadjusted P Critical Level Significant?
24hr vs. 72hr 0.542 1.659 0.1 0.05 No
Table F.19 - Relative Thymidine Incorporation Ratio Comparison: Stimulated vs. Control (within groups: 24 hr and 72 hr, Fig. 6, Ch. VIII)
Within Group: 24 hr
Comparison Diff of Means t Unadjusted P Critical Level Significant?
Stim vs. Ctrl 0.185 0.565 0.573 0.05 No
Within Group: 72 hr
Comparison Diff of Means t Unadjusted P Critical Level Significant?
Stim vs. Ctrl 0.2 0.612 0.542 0.05 No
Table F.20 - Relative Collagen Content Ratio Comparison: 24hr vs 72hr (within groups: Stimulated and Control, Fig. 6, Ch. VIII)
Within Group: Stimulated
Comparison Diff of Means t Unadjusted P Critical Level Significant?
24hr vs. 72hr 0.392 3.323 0.001 0.050 Yes
Within Group: Control
Comparison Diff of Means t Unadjusted P Critical Level Significant?
24hr vs. 72hr 0.261 2.157 0.034 0.050 Yes
Table F.21 – Relative Collagen Content Ratio Comparison: Stimulated vs. Control (within groups: 24 hr and 72 hr, Fig. 6, Ch. VIII)
Within Group: 24 hr
Comparison Diff of Means t Unadjusted P Critical Level Significant?
Stim vs. Ctrl 0.121 1.009 0.316 0.050 No
Within Group: 72 hr
Comparison Diff of Means t Unadjusted P Critical Level Significant?
Ctrl vs. Stim 0.0106 0.0890 0.929 0.050 No

130
130
Table F.22 - Relative Proteoglycan Content Ratio Comparison: 24hr vs 72hr (within groups: Stimulated and Control, Fig. 6, Ch. VIII)
Within Group: Stimulated
Comparison Diff of Means t Unadjusted P Critical Level Significant?
24hr vs. 72hr 0.263 2.080 0.041 0.050 Yes
Within Group: Control
Comparison Diff of Means t Unadjusted P Critical Level Significant?
24hr vs. 72hr 0.341 2.633 0.010 0.050 Yes
Table F.23 - Relative Proteoglycan Content Ratio Comparison: Stimulated vs. Control (within groups: 24 hr and 72 hr, Fig. 6, Ch. VIII)
Within Group: 24 hr
Comparison Diff of Means t Unadjusted P Critical Level Significant?
Stim vs. Ctrl 0.0293 0.229 0.819 0.050 No
Within Group: 72 hr
Comparison Diff of Means t Unadjusted P Critical Level Significant?
Stim vs. Ctrl 0.107 0.840 0.404 0.050 No