Characterization and engineering properties of the NGTS ...
39
AIMS Geosciences, 5(3): 665–703. DOI: 10.3934/geosci.2019.3.665 Received: 27 February 2019 Accepted: 19 August 2019 Published: 29 August 2019 http://www.aimspress.com/journal/geosciences Research article Characterization and engineering properties of the NGTS Onsøy soft clay site Aleksander S. Gundersen 1, *, Ragnhild C. Hansen 1 , Tom Lunne 1 , Jean-Sebastien L’Heureux 2 and Stein O. Strandvik 1 1 Offshore Geotechnics, Norwegian Geotechnical Institute, Sognsveien 72, N-0855 Oslo, Norway 2 Geotechnics and Natural Hazards Trondheim, Norwegian Geotechnical Institute, Høgskoleringen 9, N-7034 Trondheim, Norway * Correspondence: Email: [email protected]; Tel: +4741841333. Abstract: In the 1960s, NGI investigated numerous potential research sites and established the first Onsøy soft clay site in 1968. In 2016, the NGTS project established five research sites, one of which is the NGTS Onsøy soft clay site. The purpose of this paper is to provide a reference for further in-situ and laboratory testing at the site and easy access to high-quality soil investigation data. The paper interprets the soil conditions providing engineering soil properties, comments on data reliability and quality, and correlations between different soil parameters where appropriate. The lightly overconsolidated soft clay site has been characterized based on extensive in-situ and laboratory testing. In-situ methods include electrical resistivity tomography, multichannel analysis of surface waves, total soundings, rotary pressure soundings, cone penetration testing with and without seismic and electrical resistivity measurements, dilatometer with seismic measurements, self-boring pressuremeter, electric piezometers, thermistor string, hydraulic fracture testing and earth pressure cells. Soil samples were obtained using Sherbrook block sampler, Geonor φ 72 mm piston sampler, Geonor φ 54 mm composite piston sampler and hydraulic piston and push samplers with liners. Laboratory tests include multi-sensor core logging, index testing, cyclic and monotonic, consolidated and unconsolidated triaxial tests, bender element tests, oedometer tests with constant rate of strain and incremental loading and direct simple shear tests.
Transcript of Characterization and engineering properties of the NGTS ...

AIMS Geosciences, 5(3): 665–703. DOI: 10.3934/geosci.2019.3.665 Received: 27 February 2019 Accepted: 19 August 2019 Published: 29 August 2019
http://www.aimspress.com/journal/geosciences
Research article
Characterization and engineering properties of the NGTS Onsøy soft
clay site
Aleksander S. Gundersen1,*, Ragnhild C. Hansen1, Tom Lunne1, Jean-Sebastien L’Heureux2
and Stein O. Strandvik1
1 Offshore Geotechnics, Norwegian Geotechnical Institute, Sognsveien 72, N-0855 Oslo, Norway 2 Geotechnics and Natural Hazards Trondheim, Norwegian Geotechnical Institute, Høgskoleringen
9, N-7034 Trondheim, Norway
* Correspondence: Email: [email protected]; Tel: +4741841333.
Abstract: In the 1960s, NGI investigated numerous potential research sites and established the first Onsøy soft clay site in 1968. In 2016, the NGTS project established five research sites, one of which is the NGTS Onsøy soft clay site. The purpose of this paper is to provide a reference for further in-situ and laboratory testing at the site and easy access to high-quality soil investigation data. The paper interprets the soil conditions providing engineering soil properties, comments on data reliability and quality, and correlations between different soil parameters where appropriate. The lightly overconsolidated soft clay site has been characterized based on extensive in-situ and laboratory testing. In-situ methods include electrical resistivity tomography, multichannel analysis of surface waves, total soundings, rotary pressure soundings, cone penetration testing with and without seismic and electrical resistivity measurements, dilatometer with seismic measurements, self-boring pressuremeter, electric piezometers, thermistor string, hydraulic fracture testing and earth pressure cells. Soil samples were obtained using Sherbrook block sampler, Geonor φ 72 mm piston sampler, Geonor φ 54 mm composite piston sampler and hydraulic piston and push samplers with liners. Laboratory tests include multi-sensor core logging, index testing, cyclic and monotonic, consolidated and unconsolidated triaxial tests, bender element tests, oedometer tests with constant rate of strain and incremental loading and direct simple shear tests.

666
AIMS Geosciences Volume 5, Issue 3, 665–703.
Keywords: soft clay; in-situ testing; laboratory testing; test site; site characterization; undrained shear strength; stiffness; NGTS Onsøy
Abbreviations: bgl: Below ground level; cv: Coefficient of consolidation; ∆V: Change in volume; ED: Dilatometer modulus; ε: Strain; FDT: Soil reaction force to combined pressure and rotation in rotary pressure sounding test; fs: Sleeve friction; Gmax: Small strain shear modulus; γ: Total unit weight; γs: Unit weight of solid particles; γd: Dry unit weight; ID: Dilatometer soil behavior type index; IL: Liquid index; Ip: Plasticity index, wL − wP; K0: Coefficient of earth pressure at rest, σ'h0/σ'v0; kv, kh: Vertical and horizontal hydraulic conductivity; M: Constrained modulus; m: Modulus number; n: Porosity; OCR: Overconsolidation ratio, σ'p/σ'v; P: Measured water pressure in hydraulic fracture stress test; P0: Dilatometer corrected first reading; P1: Dilatometer corrected second reading; φ: Angle of internal friction; qc: Cone resistance; qt: Cone resistance corrected for pore water pressure effects; Qt: Normalized cone resistance; ρ: Electrical resistivity; ρb: Dry bulk density; ρt: Wet bulk density; SC: South-Central testing area of NGTS Onsøy soft clay site; SEC: Southeast Corner testing area of NGTS Onsøy soft clay site; St: Soil sensitivity; su: Undrained (undisturbed) shear strength of soil; suC: Static triaxial compression undrained shear strength; suD: Static DSS undrained shear strength; suE: Static triaxial extension undrained shear strength; su,rem: Remolded shear strength; sufv: Shear strength by field vane testing; sufv,rem: Remolded shear strength by field vane testing; σ'h0: In-situ horizontal effective stress; σh: Total horizontal stress; σ'p: Preconsolidation stress (apparent); σ'v: Vertical effective stress; σ'v0: In-situ vertical effective stress; T: Temperature; t: Time; u: Water pressure; u0: In-situ pore pressure; u2: Pore pressure measured through a filter location in the cylindrical cone part just above conical part; vp: Compression wave velocity; vs: Shear wave velocity; vvh: Vertically (v) propagated, horizontally (h) polarized shear wave velocity; w: Water content; wP: Plastic limit; wL: Liquid limit; z: Depth below ground level; zbedrock: Vertical distance from ground level to bedrock
1. Introduction
Since its establishment in the 1950s, the Norwegian Geotechnical Institute (NGI) has had a need for testing and developing geotechnical tools and models for applications in soft clays. Already in the early 1960s, soft clay sites were developed for research purposes in the great Oslo region [1]. In the late 1960’s there was a need for a homogenous soft clay deposit for testing shear box and field vane, and the first Onsøy soft clay site was established [2]. The marine deposit at Onsøy was found very suitable due to its uniformity and deposit thickness. Later studies showed that the Onsøy clay is similar to North Sea clays Troll and Luva [3]. The Onsøy area has been used extensively for development of new tools and to carry out large-scale field testing ever since the first establishment.
The Onsøy area is located in southeastern Norway, about 100 km from Oslo, just north of Fredrikstad as illustrated in Figure 1. Prior to year 2000, all tests were carried out closely together within an area of about 140 m × 120 m as illustrated in Figure 2. Due to industrial development, a second test site was then established in year 2000 some 300 m to the northwest, see Figure 2. Lunne et al. [4] describes the soil characteristics and use of the Onsøy sites up until 2001. The test areas used before 2016 are referred to as Onsøy historic sites in this paper.

667
AIMS Geosciences Volume 5, Issue 3, 665–703.
Figure 1. Map of Onsøy area located just north of Fredrikstad.
Figure 2. Location of NGTS Onsøy test site and Onsøy historic test sites.

668
AIMS Geosciences Volume 5, Issue 3, 665–703.
In 2016, the Norwegian GeoTest Sites (NGTS) project established NGTS soft clay site at Onsøy, which is located in a different valley (Åledalen) to the historic sites, about 1.3 km southwest along the road Gamle Ålevei (see Figure 2). The NGTS Onsøy site has a potential testing area of approximately 80 m × 75 m. The fieldwork carried out at the NGTS Onsøy site is summarized in Table 1, and Figure 3 presents the site layout including locations of boreholes and in-situ tests.
This paper presents a full geotechnical characterization and engineering properties of the newly developed NGTS Onsøy soft clay site. Symbols are in accordance with ISO standard for marine soil investigations [5]. The lightly over-consolidated clay deposit at Onsøy has been characterized through an extensive field and laboratory testing program. NGI [6] provides a complete summary of the factual data. The purpose of this paper is to provide a reference for further in-situ and laboratory testing as well as model testing at the site and easy access to high-quality soil investigation data. The paper interprets the in-situ and laboratory test data and provides what the authors consider best estimate engineering soil properties. Comments are given on data reliability and quality, and correlations between different soil parameters are provided where appropriate.
Figure 3. Site layout including locations of boreholes and in-situ tests.

669
AIMS Geosciences Volume 5, Issue 3, 665–703.
Table 1. Summary of geophysical, in-situ and laboratory tests conducted at the NGTS Onsøy site, with general test procedure references and key parameters.
Test Measured Interpreted Reference/Comment
Geophysical/non-intrusive Electrical resistivity tomography (ERT) Resistivity zbedrock, soil type Multi-channel analysis of surface waves
(MASW) vp vs, Gmax
In-situ Rotary pressure sounding (RPS) FDT zbedrock [7] Cone penetration test (CPTU, SCPT, RCPT) qc, fs, u2, vs, ρ σ'p, M, Gmax, su, φ' [8] Seismic flat dilatometer (SDMT) P0, P1, ID, KD, ED, vs su, K0, σ'p [9] Self-boring pressuremeter test (SBP) P0, Pf, PL, Em su, K0 [10] Pore pressure (electrical piezometers) u, t u0 [11] Field vane test (FVT) Torque sufv, sufv,rem [12] Ground temperature monitoring T, t Thermistor string Hydraulic fracture test (HFT) ∆V, u, t σ'h [13] Earth pressure cell test (EPCT) u, σh σ'h Sampling Geonor (φ 72 mm) fixed piston [14] Geonor (φ 54 mm) fixed piston (composite) [14] Sherbrooke block (φ 250 mm) [14,15] Hydraulic piston sampler (φ 76 mm, 3 m long) [16] Hydraulic push sampler (φ 76 mm, 3 m long) [16] Laboratory Water content w [17] Unit weight (density) γd, γt (ρd, ρt) [18] Unit weight of solid particles γs [19] Atterberg limits wL, wP Ip (PI), IL [20] Grain size distribution % sand, silt, clay [21,22] Fall cone test Penetration su, su,rem [23] Carbon content % TC, TOC NGU in-house Salinity κ gNaCl [24] X-ray inspection (XRI) NGU in-house Scanning Electron Microscopy (SEM)
Multi sensor core logging (MSCL) ρb, MS n NGU in-house Incremental loading oedometer (IL) t, σ'v, ε σ'p, cc, cv, cα, kv [25] Constant rate of strain oedometer (CRS) t, σ'v, ε σ'p, cc, cv, kv [26,27] Hydraulic conductivity kv, kh rk [26,28] Triaxial test: CAUC, CAUE, CAUcy ε, τ, p, u φ, p, su, τf, E [29,30] Direct simple shear (DSS) τh, σ'v suD, G [31,32] Bender element test (BE) vs Gmax [33,34]

670
AIMS Geosciences Volume 5, Issue 3, 665–703.
2. Engineering geology
2.1. Depositional environment
From a geological point of view, the engineering geology at the NGTS Onsøy site is equivalent to the Onsøy historic sites [4]. The area has undergone significant isostatic uplift following the last deglaciation phase of the region that started about 11,300 years ago [35]. This resulted in a fall of relative sea level. The highest post-glacial sea level in the region (marine limit) is about 170 m above the present level [35]. The depositional environment at the site is expected to have changed from rapid deposition of glacial marine clays during deglaciation to more placid deposition in an estuarine environment during the early Holocene (post glacial period). This is supported by the important bioturbation observed on x-ray imagery of the cores in Figure 4.
Figure 4. X-ray images from 1 m to 19.8 m below ground level.
An important concentration of shell fragments and whole marine shells (of the aclis type) were found in the NGTS Onsøy clay. Twelve shells were sent to the Poznan radiocarbon laboratory for 14C-dating. The results are plotted in Figure 5 and suggest that the NGTS Onsøy site most likely emerged from the sea at approximately 2735 ± 30 BP. The deepest samples collected at 15.7 m gave an age of 10.330 ± 30 before present (BP), which corresponds approximately to the end of the Younger Dryas period and the beginning of the Holocene. Based on the radiocarbon dates, the sedimentation rate throughout the Holocene is estimated to about 1.5 mm/year (Figure 5). This is similar to sedimentation rates observed in other fjords settings [36]. Some of the 14C dates are in reversed order in Figure 5. This can be due to resedimentation of shells due to, for example, mass movement processes or other erosive agents in the source area.

671
AIMS Geosciences Volume 5, Issue 3, 665–703.
Figure 5. Age of shell based on 14C measurements with depth. Sedimentation rate of 1.5 mm/year is included for reference.
Results from total soundings (TS), rotary pressure soundings (RPS) and geophysical measurements were used to assess the bedrock depth at the site. The depth to bedrock varies from approximately 40 m in the east of the site, to about 8 m on the west side, see Figure 6. Results from ERT surveying show that steep flanks border the bedrock depression. This compares well with the geological map of the area, which shows several relatively narrow topographic depression with infill of thick marine deposits between bare rock (Figure 7). Throughout the Holocene, the clay deposited directly on the seafloor by draping the bedrock topography and by filling the bedrock valley. Hence, the clay deposit is thicker in the middle of the basin and thinner towards the bare rock. Consequently, soil properties may differ over the site for a given depth. Once the site was above sea level, the sub aerial exposure produced a weathered crust.

672
AIMS Geosciences Volume 5, Issue 3, 665–703.
Figure 6. Approximate depths to bedrock at the NGTS Onsøy site.
Figure 7. Quaternary map of the NGTS Onsøy site location (pink outline). Orange color represents bare rock and light blue indicates thick marine deposit.

673
AIMS Geosciences Volume 5, Issue 3, 665–703.
2.2. Source of material
The Glomma River, Norway’s largest river, shares the northernmost of its outlets with the Seut River. During higher sea level positions, the test site was most likely influenced almost wholly by the Glomma River as most of Onsøy was inundated by the sea [35]. Thus, the source of material supplied has an important contribution from the whole of southeastern Norway and has primarily been produced by glacial erosion, with secondary fluvial transport. Very little is a result of weathering. The bedrock in the Glomma’s drainage area is mostly gneiss and granite with quartzite and sandstone in its upper reaches.
The material supplied to the site therefore has a significant contribution from glacial rock flour and contains both clay minerals (mostly illite and chlorite) and quartz and feldspars. As the relative sea level felt in the region, the source material changed to more local sources, but this material is expected to have partly been derived from reworking of similar deposits and eroded crystalline bedrock.
2.3. Stress history
The geological history shows no evidence suggesting a significant loading event has occurred at the NGTS site. The sea level in the Oslo area has been rising steadily during the Holocene and the soils were deposited during a single period of submergence [37]. Therefore, it would be expected that the soils are essentially normally consolidated, but due to some surface weathering, desiccation, creep and ageing an apparent preconsolidation can be observed.
The apparent preconsolidation stress from oedometer tests at the NGTS Onsøy site show values in the order of 30 kPa higher than the vertical effective in-situ stress as discussed in Section 5.2. This is similar to the findings at the Onsøy historic sites [4].
Once above sea level, groundwater fluctuations may have induced some changes in stress history. At present, the groundwater level is about 1 m below the ground surface (assessed from CPTU results), and the site elevation is about 6.5 m above sea level. Although the ground surface is relatively horizontal, the site lies in a topographic basin, which can probably explain the thick marine sediments being deposited here. The in-situ pore pressure, u0, was derived from four permanent electrical piezometers and cone penetration tests with pore pressure measurements. The four piezometers are located in two clusters within the site. The in-situ pore pressure increases with 11 kPa/m from zero at 1 m bgl and shows little variation with time (see Figure 13). This fits well with results from nearby sites, which show pore pressures typically 5 to 10% greater than hydrostatic [4].
2.4. Stratigraphy
The soil layering and the stratigraphy has been assessed by combining results from in-situ tests, laboratory data, visual inspection of split cores, and from X-ray imagery (Figure 4). The XRI system consists of an X-ray tube, an image intensifier and a high quality digital camera. The resulting images can be used to assess e.g. (i) soil type; (ii) soil macro fabric; (iii) the presence of inclusions such as stones, shells, sandy zones and root holes etc.; (iv) the presence of fissures, shear planes,

674
AIMS Geosciences Volume 5, Issue 3, 665–703.
discontinuities etc.; (v) degree of bioturbation; and (vi) indications of sample disturbance. X-ray transparency of a sediment is strongly influenced by the grain-size and the images are generally light grey for the fine-grained soils and dark grey for coarse-grained soils.
The grain size is fairly constant throughout the clay deposit, however water content, plasticity, patterns of bioturbation and shell content varies. Based on the overall data interpretation, the site stratigraphy is divided into four main units numbered I to IV (Figure 8). The bedrock topography has led to thicker deposit in the middle of the basin, decreasing in thickness towards the west and northwest. This has led to different soil properties and layering across the site. The stratigraphy presented in the following describes the soil units as they have been identified at the main areas of investigation, South-central (SC) and Southeast corner (SEC) (see Figures 3 and 6). The horizontal distance from South-central location to Southeast corner location is about 39 m. Figure 8 plots the water content, liquid limit, plastic limit, plasticity index, and clay and fines content with depth for South-central (SC) and Southeast corner (SEC) locations.
Unit I is approximately 1 m thick and represents the top soil layer consisting of a weathered clay crust. Unit II is identified as a clay of high to very high plasticity index, typically around 44% and a typical water content of 70%. Visual inspection of the split core section shows much bioturbation in the clay of Unit II, with some shells and shell fragments. The depth to the bottom of Unit II increases with increasing depth to bedrock i.e. towards the east side of the test site as suggested by the leftmost plot in Figure 8. The depth to bottom of Unit II is approximately 8 m bgl and 10.5 m for South-central and Southeast corner locations respectively. Index results identify Unit III as clay of medium high plasticity index, typically about 27% with water content of about 45%. For the South-central location, the thickness of this layer (~5.5 m) is small compared to the southeast corner (~9 m). The plot on the right hand side in Figure 8 shows that Unit II generally has higher clay content than Unit III. A very high concentration of shells was found in Unit III, which is encountered below Unit II. A 3 cm thick sand layer is observed close to the base of Unit III in core ONSB14 and in CPTU data. This sand layer could mark the contact with Unit IV. The top of Unit IV has similar index properties as Unit II, but water content, plasticity index and clay content are expected to decrease towards bedrock. Some samples within Unit IV exhibit higher sensitivity compared to the other soil units at the test site. Results from rotary pressure soundings suggest the depth to bedrock is approximately 24.1 m at South-central location and about 28.4 m in the Southeast corner.

675
AIMS Geosciences Volume 5, Issue 3, 665–703.
Figure 8. Water content, plasticity data and grain size with depth for South-central and Southeast corner locations.
2.5. Ground temperature
Ground temperature fluctuations are monitored by means of a thermistor string installed in the Southeast corner, late August 2018 to a depth of 5.25 m. Figure 9 illustrates the ground temperatures with depth from September 2018 to January 2019 based on thermistor string data. Measurements from two cone penetration tests in February 2016 are included for comparison. Significant fluctuations occur within the top 3 meters of strata throughout the year as suggested by Figure 9. At depths larger than 7 m, the temperature is expected to be in the range between 6 °C and 8 °C throughout the year.

676
AIMS Geosciences Volume 5, Issue 3, 665–703.
Figure 9. Ground temperatures with depth as measured by thermistor string and CPTU.
3. Soil composition
3.1. Grain size distribution
The clay content, fines content and sand content with depth can be observed from the rightmost plot in Figure 8. The leftmost point represents the clay content, the line represents the silt content and the distance from the clay + silt marker to 100% represents the sand content. Units II and III have clay contents of about 68% and 50% respectively. Unit III generally contains more silt particles and a small fraction of the soil volume is made up by sand particles. The top of Unit IV shows typical clay content of about 59%, but the clay content decreases with depth. For the South-central location, the clay content decreases to approximately 45% at 18.5 m depth. The silt content at this depth is about 50%.
3.2. Organic content and salt content
Figure 10 shows the organic content and salt content at the NGTS Onsøy site and the Onsøy historic site. The organic content values from the historic site are determined by chemical oxidation with nitric acid and are typically about 0.6%. The organic content values for the NGTS Onsøy site were determined by the loss on ignition method (LOI at 450 °C) and are about 3 to 3.8% higher. This

677
AIMS Geosciences Volume 5, Issue 3, 665–703.
fits well with other comparative studies where the differences in methods are in the order of 3% [38]. There is evidence of iron sulphide spots that are commonly the result of the decomposition of organic matter in marine sediments.
Salinity tests were performed by means of electrical conductivity to determine the NaCl equivalents of the pore water according to ISO 11265 [24]. The salt content increases from values less than 10 g/L below the surface to values close to 30 g/L at a depth of 6 m (Figure 10). From this depth, the salt content remain fairly constant before decreasing from 17 to 19 m. The salt content values at the NGTS Onsøy and historic Onsøy sites are fairly consistent (Figure 10).
Figure 10. Organic content and salt content with depth at the NGTS Onsøy site and historic Onsøy site.
The NGTS Onsøy clay is essentially a homogenous dark grey soft clay with increasing silt content with depth [39]. Throughout the soil profile there is evidence of iron sulphide spots as seen on the XRI images in Figure 4 (dark spots), which occurs because of decomposition of organic matter. SEM images at the Onsøy historic sites showed a clay matrix consisting of a random arrangement of individual clay plates and finely grounded rock flour in a relatively dense flocculated arrangement [4]. The NGTS Onsøy clay is expected to have similar fabric given similar depositional environment and source material.

678
AIMS Geosciences Volume 5, Issue 3, 665–703.
4. State and index properties
4.1. Water content and degree of saturation
Figure 8 shows the water content with depth for locations South-central (SC) and Southeast corner (SEC). Results from the Onsøy historic sites are included for reference and comparison. The dry crust (Unit I) stretches down to the groundwater table approximately 1 m below ground level. Units II and III have typical water contents of 70% and 45% respectively. The typical water content towards the top of Unit IV is about 65%, but similarly to the Onsøy historic sites, the water content decreases steadily towards bedrock reaching a water content of about 57% around 20 m bgl for South-central location [4] (see Figure 8). Apart from the dry crust, all units are fully saturated.
4.2. Total unit weight
The total unit weight (γ) from water content, Multi-Sensor Core Logging (MSCL) [40] and direct measurements are illustrated in Figure 11. The results with the different methods compare reasonably well. The dry crust has a typical unit weight of 17.5 kN/m3 in accordance with Onsøy historic sites. Unit II and top of Unit IV have typical unit weight of 16.2 kN/m3 and the unit weight for Unit III generally falls around 17.8 kN/m3. Best estimate profiles for estimation of vertical in-situ stresses are included in the figure.
Figure 11. Total unit weight from direct measurements, water content and MSCL. Measurements and best estimate unit weight of solid particles are included for reference.

679
AIMS Geosciences Volume 5, Issue 3, 665–703.
4.3. Unit weight of solid particles
Figure 11 illustrates the unit weight of solid particles for the NGTS Onsøy site and Onsøy historic sites with depth. The best estimate value of γs = 27.1 kN/m3, used for further interpretation herein, is included in the figure.
4.4. Atterberg limits and plasticity index
Plastic limit (wP), liquid limit (wL) and plasticity index (Ip) for different locations within the site are plotted with depth in Figure 8 along with measured water contents. The liquid limit was determined using the fall cone apparatus. This figure shows clearly the presence of two clay layers, unit II having a typical Ip of 44% and unit III with typical Ip of 27%. The liquid limit is generally close to the measured water content for south central location while this relationship varies in the southeast corner. The results suggest a gradual transition between Units II and III. The depth to the different layers varies across the site as discussed in Section 2.4.
Figure 12 illustrates the plasticity index with liquid limit in a Casagrande plasticity chart. It is evident that the results fall into two clusters. The plasticity data plots along and above the “A” line, and Unit II can be classified as clay of “high to very high plasticity” according to BS5930 (1999) [41]. Unit III is classified as clay of low to medium high plasticity. Results from Onsøy historic sites compare reasonably well to the NGTS Onsøy results, especially the results from Unit II.
Figure 12. Casagrande plasticity chart with results of Atterberg limits.

680
AIMS Geosciences Volume 5, Issue 3, 665–703.
5. Engineering properties
This section presents the in-situ stress state, strength properties, stiffness properties and permeability for the NGTS Onsøy soft clay site including best estimate profiles.
All laboratory tests were carried out by the NGI laboratory in Oslo, which minimizes uncertainties related to potential difference in testing procedures. In pursue of best estimate soil parameters, the principles by Lunne et al [42] have been used to exclude soil samples with normalized change in void ratio, ∆e/ei, larger than 0.07 (poor to very poor sample quality). As illustrated in Figures 22 and 23, block samples generally exhibit high quality compared to the tube samples and most emphasis has been on block sample results when available. In the figures, “block” denotes the results on Sherbrooke block samples and "tube" denotes the results on thin walled tube samples. Thin walled tube samples are φ 72 mm Geonor piston samples and φ 76 mm hydraulic piston and push samples (Table 1). Results on φ 54 mm Geonor composite piston samples have been included in Figures 22 and 23 for comparison, but have not been included as basis for the best estimate profiles. For comments on the sample quality see Section 5.7.
An extensive study on the effect of using different cone penetrometer types on measured CPTU results have been carried out at the site [43] (see Section 5.8). Twenty-three tests involving seven different penetrometer types from five different manufacturers were analyzed. Results with cone penetrometer type 2 have been used herein to comment on appropriate CPTU correlations for the NGTS Onsøy soft clay (see Section 5.8).
5.1. In-situ vertical effective stress
Figure 13 illustrates the best estimate in-situ vertical effective stress (σ'v0) and the in-situ pore pressure (u0) with depth. Horizontal lines show piezometer measurements from March 2017 to November 2018 which suggest that pore pressure variations are relatively small. One piezometer was installed to bedrock (7.8 m bgl) at which a more permeable layer may be encountered. The effective vertical stress was derived by subtracting the best estimate pore pressure from the total vertical stress based on total unit weight profiles in Figure 11. The equations below define the best estimate effective stress profile.
𝜎𝑣0′ = 17.5𝑧 𝑧 ∈ [0,1] (1a)
𝜎𝑣0′ = 5.01(𝑧 − 1) + 17.5 𝑧 ∈ [1,9] (1b)
𝜎𝑣0′ = 6.15(𝑧 − 9) + 57.56 𝑧 ∈ [9,14] (1c)
𝜎𝑣0′ = 6.10(𝑧 − 14) + 87.29 𝑧 ∈ [14,20] (1d)

681
AIMS Geosciences Volume 5, Issue 3, 665–703.
5.2. Apparent preconsolidation stress and OCR
Figure 13 illustrates the apparent preconsolidation stress, σp', and the overconsolidation ratio, OCR, with depth. The in-situ vertical effective stress is included for comparison. The Janbu principles have been used in the interpretation of σp' from constant rate of strain (CRS) oedometer tests [44]. Lunne et al. [44] showed that the preconsolidation stress is strongly influenced by sample disturbance, hence only samples with ∆e/ei < 0.07 have been included in Figure 13.
The correlation introduced by Marchetti [45,46] in 1980, based on the horizontal stress index (KD) from dilatometer measurements, was used to predict OCRDMT according to Eq 2. This correlation is valid for dilatometer soil behavior type index (ID) lower than 1.2.
𝑂𝐶𝑅𝐷𝑀𝑇 = (0.5𝐾𝐷)1.56, 𝐼𝐷 < 1.2 (2)
The overconsolidation ratio from DMT plots higher than the laboratory measurements and it should be borne in mind that this correlation was proposed based on comparison between DMT data and old oedometer tests on Italian clays with unknown sample quality.
Overconsolidation ratio estimated from the normalized cone resistance, OCR = k*Qt, using k = 0.3 is illustrated in Figure 13 [47]. This correlation plots on the low side of the laboratory results. A k-value of 0.36 seems to be more appropriate for the NGTS Onsøy site. Results from high quality oedometer tests on block samples have been emphasized to determine the best estimate apparent preconsolidation stress profile in Eq 3 and Figure 13. This equation yields OCR values largely in the range between 1.3 and 1.8 from 3 m to 20 m bgl.
𝜎𝑝′ = 6.9(𝑧 + 4.54), 3 ≤ 𝑧 ≤ 20 (3)
Figure 13. In-situ pore pressure, vertical effective stress, apparent preconsolidation stress, and OCR with depth.

682
AIMS Geosciences Volume 5, Issue 3, 665–703.
5.3. In-situ horizontal effective stress and K0
To estimate the in-situ horizontal effective stress is one of the most difficult tasks in geotechnical engineering. The tests and correlations used to find the best estimate profile for the NGTS Onsøy site are listed below and described in the following.
• Based on in-situ tests Self-boring pressuremeter [10,48] Earth pressure cell tests Hydraulic fracture stress tests [13,49] Field vane combined with CAU compression [50] Dilatometer [46]
• Derived from correlations to OCR and index tests Brooker and Ireland (1965) [51] Mayne and Kulhawy (1982) [52] L’Heureux et al. (2017) [53]
Figure 14 illustrates the estimated coefficient of earth pressure at rest, K0, and the in-situ horizontal effective and total stresses with depth. The in-situ tests were carried out in the Southeast Corner. The self-boring pressuremeter testing was carried out in accordance with ISO 22476-5:2012 [10] and interpreted assuming elastic soil behaviour in the vicinity of in-situ horizontal stress [48]. The results from self-boring pressuremeter testing suggest a K0-value generally in the range of 0.55 to 0.7, as illustrated in Figure 14. Results from earth pressure cell tests at 6 m and 8 m depth bgl vary significantly. The cells were highly susceptible to buckling during installation and the measurements are considered uncertain by the authors. Results from hydraulic fracture stress tests are generally in the high range of the results as illustrated in Figure 14. It is believed that water pressures higher than the fracture stress were not maintained sufficiently long to minimize the effect of disturbed zone on the measured water pressure during closing of crack.
The empirical correlation by Brooker and Ireland with plasticity index of 30% and OCR of 1.5 was used as a rough estimate of K0. This correlation yields an approximate K0 of 0.68 which is in general agreement with the results in Figure 14.

683
AIMS Geosciences Volume 5, Issue 3, 665–703.
Figure 14. In-situ horizontal effective and total stress and coefficient of earth pressure at rest, K0, with depth.
Aas et al. [50] considered the stress field around the field vane prior to shearing and at failure, and proposed a method to estimate K0 using the field vane results and parallel anisotropically consolidated undrained triaxial compression tests (CAUC). For the NGTS Onsøy clay, CAUC triaxial tests were consolidated to best estimate in-situ stresses using a K0-value of 0.6. The coefficient of earth pressure at rest is estimated using Eq 4. This equation produces K0-values in the range of 0.58 to 0.70, as illustrated in Figure 14.
𝐾0 =𝜎′3𝑓𝜎′𝑣0
+𝑠𝑢𝑓𝑣 − 𝑠𝑢𝑓𝑣,𝑟𝑒𝑚
𝜎′𝑣0 (4)
In Eq 4, σ'3f is the radial effective stress at failure in a CAU compression test, σ'v0 is the in-situ vertical effective stress prior to field vane testing, and sufv and sufv,rem are the intact and remoulded shear strength by field vane testing respectively.
L’Heureux et al. [53] presented guidelines and correlations for estimation of K0 for Norwegian clays based on a database including eight different sites with plasticity indices ranging from 13% to 41% and overconsolidation ratios ranging from 1 to 8. For this database, the plasticity index had little influence on K0 and Eq 5 presents the best fit to the data. The K0-values obtained from Eq 5 compare well with the results presented in Figure 14.
𝐾0 = 0.53𝑂𝐶𝑅0.47 (5)
Mayne and Kulhawy [52] investigated the relationships between K0 and OCR for primary loading-unloading-reloading conditions reviewing laboratory data from over 170 different soils.
684
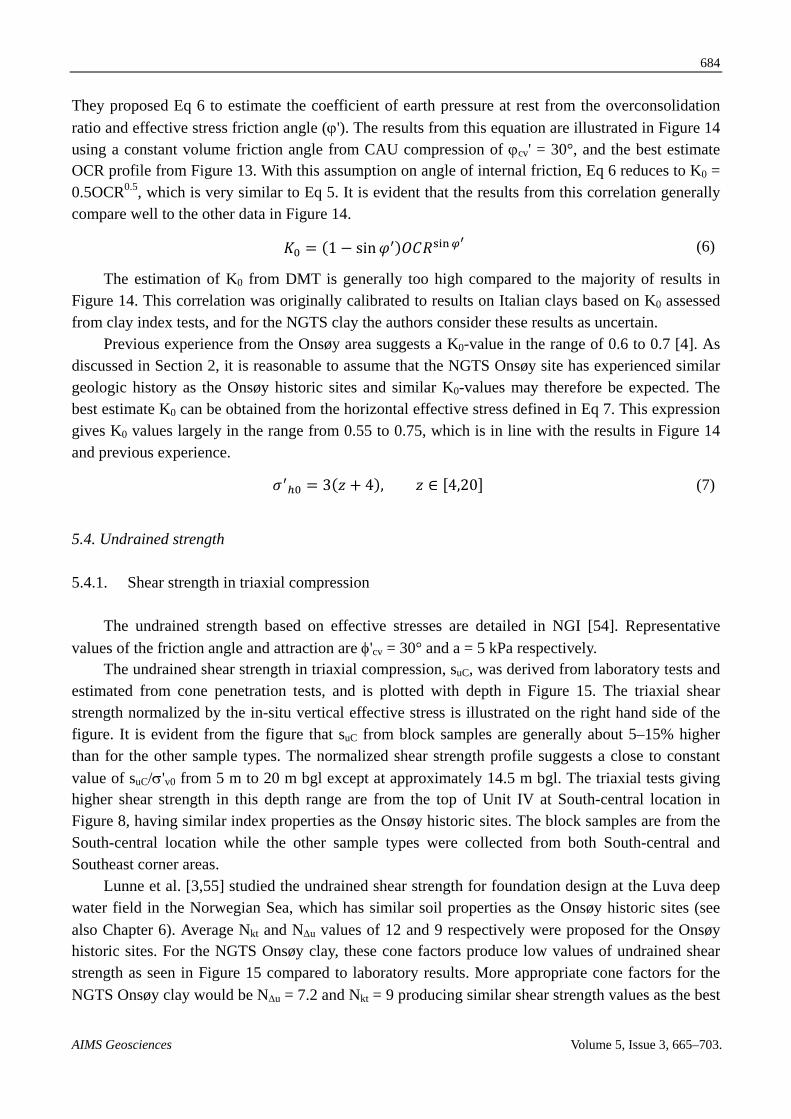
AIMS Geosciences Volume 5, Issue 3, 665–703.
They proposed Eq 6 to estimate the coefficient of earth pressure at rest from the overconsolidation ratio and effective stress friction angle (ϕ'). The results from this equation are illustrated in Figure 14 using a constant volume friction angle from CAU compression of ϕcv' = 30°, and the best estimate OCR profile from Figure 13. With this assumption on angle of internal friction, Eq 6 reduces to K0 = 0.5OCR0.5, which is very similar to Eq 5. It is evident that the results from this correlation generally compare well to the other data in Figure 14.
𝐾0 = (1 − sin𝜑′)𝑂𝐶𝑅sin𝜑′ (6)
The estimation of K0 from DMT is generally too high compared to the majority of results in Figure 14. This correlation was originally calibrated to results on Italian clays based on K0 assessed from clay index tests, and for the NGTS clay the authors consider these results as uncertain.
Previous experience from the Onsøy area suggests a K0-value in the range of 0.6 to 0.7 [4]. As discussed in Section 2, it is reasonable to assume that the NGTS Onsøy site has experienced similar geologic history as the Onsøy historic sites and similar K0-values may therefore be expected. The best estimate K0 can be obtained from the horizontal effective stress defined in Eq 7. This expression gives K0 values largely in the range from 0.55 to 0.75, which is in line with the results in Figure 14 and previous experience.
𝜎′ℎ0 = 3(𝑧 + 4), 𝑧 ∈ [4,20] (7)
5.4. Undrained strength
5.4.1. Shear strength in triaxial compression
The undrained strength based on effective stresses are detailed in NGI [54]. Representative values of the friction angle and attraction are φ'cv = 30° and a = 5 kPa respectively.
The undrained shear strength in triaxial compression, suC, was derived from laboratory tests and estimated from cone penetration tests, and is plotted with depth in Figure 15. The triaxial shear strength normalized by the in-situ vertical effective stress is illustrated on the right hand side of the figure. It is evident from the figure that suC from block samples are generally about 5–15% higher than for the other sample types. The normalized shear strength profile suggests a close to constant value of suC/σ'v0 from 5 m to 20 m bgl except at approximately 14.5 m bgl. The triaxial tests giving higher shear strength in this depth range are from the top of Unit IV at South-central location in Figure 8, having similar index properties as the Onsøy historic sites. The block samples are from the South-central location while the other sample types were collected from both South-central and Southeast corner areas.
Lunne et al. [3,55] studied the undrained shear strength for foundation design at the Luva deep water field in the Norwegian Sea, which has similar soil properties as the Onsøy historic sites (see also Chapter 6). Average Nkt and N∆u values of 12 and 9 respectively were proposed for the Onsøy historic sites. For the NGTS Onsøy clay, these cone factors produce low values of undrained shear strength as seen in Figure 15 compared to laboratory results. More appropriate cone factors for the NGTS Onsøy clay would be N∆u = 7.2 and Nkt = 9 producing similar shear strength values as the best

685
AIMS Geosciences Volume 5, Issue 3, 665–703.
estimate profile in Figure 15. The reason for the difference in cone factors for the Onsøy historic sites and the NGTS Onsøy site is not known at this stage.
Karlsrud et al. [56] presented CPTU correlations for Norwegian clays based on block samples from 17 different sites in Norway. Eq 8 gives the best estimate Ν∆u for this database for low sensitive clays (St < 15) with input of OCR and Ip in percent. The best estimate OCR profile and Ip of 30% produce Ν∆u-values largely in the range between 8.0 and 8.4 which is reasonable for the tube samples and high for the block samples as illustrated in Figure 15.
𝑁Δ𝑢 = 6.9 − 4.0 log(𝑂𝐶𝑅) + 0.07𝐼𝑃 (8)
With most emphasis on the tests on block samples, the best estimate shear strength in triaxial compression is provided by below equations.
𝑠𝑢𝐶 = 15.8 𝑘𝑃𝑎, 2 ≤ 𝑧 ≤ 5 (9a)
𝑠𝑢𝐶 = 0.43𝜎𝑣0′ , 5 < 𝑧 ≤ 20 (9b)
Figure 15. Undrained shear strength in compression, suC, and compression strength normalized by the in-situ overburden stress with depth.

686
AIMS Geosciences Volume 5, Issue 3, 665–703.
5.4.2. Shear strength anisotropy
The strength anisotropy ratio describes the influence of loading direction on the undrained shear strength. Triaxial compression and extension tests and direct simple shear (DSS) tests have been carried out on NGTS Onsøy clay to characterize the strength anisotropy, see Figure 16. The intact strength from one field vane test is included for reference and compares well with strength from direct simple shear tests. The anisotropy ratios suD/suC and suE/suC are plotted with depth on the right-hand side of the figure. Best estimate anisotropy ratios of 0.74 and 0.52 have been determined for the shear strength in direct simple shear and triaxial extension respectively. For plasticity indices larger than 10%, The NIFS project recommends anisotropy ratios according to Eqs 10 and 11 for Norwegian clays [57]. Using a plasticity index of 30% yields suD/suC = 0.72 and suE/suC = 0.46 which compare reasonably well with the best estimate for NGTS Onsøy soft clay.
𝑠𝑢𝐷𝑠𝑢𝐶
= 0.63 + 0.00425(𝐼𝑃 − 10) (10)
𝑠𝑢𝐸𝑠𝑢𝐶
= 0.35 + 0.00375(𝐼𝑃 − 10) (11)
Figure 16. Undrained shear strength from direct simple shear and CAU extension tests, normalized by the CAU compression shear strength on the right-hand side.

687
AIMS Geosciences Volume 5, Issue 3, 665–703.
5.4.3. Remolded shear strength and sensitivity
The remolded shear strength and sensitivity have been estimated from fall cone tests and field vane tests, and are plotted with depth in Figure 17. The remolded shear strength from 2 m depth to 6 m depth (about 1–3 kPa) is generally lower than in depth range 8 m to 12 m bgl (about 3–5 kPa). The sensitivity is generally between 5 and 8 down to 14 m depth, while some tests on deeper samples exhibit higher sensitivities, which may be related to the decrease in salt content seen in Figure 10. In the upper half of the profile, the field vane test measures a lower remolded strength compared to fall cone tests.
Figure 17. Remolded shear strength and sensitivity with depth.
5.5. Stress-strain behavior
5.5.1. Small strain shear modulus, Gmax
Figure 18 illustrates the small strain shear modulus, Gmax, which was derived from bulk density and shear wave velocity. The bulk density was measured directly in the laboratory and calculated from the measured water content, see Section 4.2. The shear wave velocity was measured in-situ with seismic dilatometer and seismic CPTU. The seismic dilatometer measures shear wave velocity

688
AIMS Geosciences Volume 5, Issue 3, 665–703.
by means of two geophones located half a meter from each other. Three hits were recorded for each depth producing coefficient of variations generally lower than 1%. The seismic add-on to the cone penetration test consisted of two accelerometers. Three tests were carried out at each depth and stacked on top of each other to amplify the signal. The shear wave velocity from SDMT and SCPTU compare well as seen in Figure 18.
The shear wave velocity was also measured on DSS samples in the laboratory using bender elements [33,34]. The specimens were loaded to a best estimate of the in-situ stresses. It is evident from the results that the laboratory tests produced lower values of vs than the in-situ tests. With most emphasis on the in-situ measurements, the best estimate Gmax profile is defined in Figure 18. The bender element test at approximately 19.2 m bgl illustrates the influence of sample disturbance on the estimated small strain shear modulus.
L’Heureux and Long [58] studied the relationship between shear wave velocity and geotechnical parameters for Norwegian clays using a database with high quality soil data from 28 Norwegian sites. Correlations between shear wave velocity, index parameters, effective overburden pressure, undrained shear strength and CPTU parameters were presented. The correlations based on in-situ vertical effective stress (Eq 12) and undrained shear strength in CAU compression (Eq 13) are included in Figure 18 giving reasonable match to the in-situ measured results. In these equations the units for both the vertical effective stress and undrained shear strength is kilo pascal (kPa). The profile using Eq 12 is generally higher than the measured results, which may be partly due the presence of the relatively thick dry crust.
𝑣𝑠 = 1.11𝜎𝑣0′ + 53.24 [𝑚 𝑠⁄ ] (12)
𝑣𝑠 = 12.72𝑠𝑢𝐶0.66 [𝑚 𝑠⁄ ] (13)
Equation 14 defines the correlation between undrained shear strength in direct simple shear (suD), plasticity index (Ip, %) and overconsolidation ratio (OCR) suggested by Andersen in 2015 [59].
𝐺𝑚𝑎𝑥
𝑠𝑢𝐷=
⎝
⎜⎛
30 +300
𝐼𝑝100� + 0.03
⎠
⎟⎞𝑂𝐶𝑅−0.25 (14)
Using a plasticity index of 35% and best estimate profiles for suD and OCR yields the results in Figure 18. The results with this correlation plots on the low side of the in-situ measurements which is expected as the correlation is based on laboratory data and thereby influenced by sample disturbance.

689
AIMS Geosciences Volume 5, Issue 3, 665–703.
Figure 18. Shear wave velocity and small strain shear modulus with depth.
5.5.2. Undrained failure strain and stiffness anisotropy
Figure 19 illustrates the shear strain at failure from CAU triaxial tests and direct simple shear tests. The shear strain at failure for CAU tests was taken as γf =1.5εf, where εf is the axial strain at failure. The figure demonstrates loading direction dependency for the failure strain. It is noted that the failure strain in DSS loading is generally higher than the failure strain in triaxial extension tests, as is the shear strength. The general shape of the stress-strain curve in triaxial compression can be defined by the equations below, where τ0 is the initial shear stress and κ is a hardening parameter.
𝜏 = 𝜅(𝑠𝑢𝐶 − 𝜏0) + 𝜏0 (15)
𝜏0 = 𝜎𝑣0′(1 − 𝐾0)
2 (16)
𝜅 = 2�𝛾 𝛾𝑓⁄
1 + 𝛾 𝛾𝑓⁄ (17)

690
AIMS Geosciences Volume 5, Issue 3, 665–703.
Figure 19. Failure strain from CAUC tests, CAUE tests and DSS tests.
5.5.3. Compressibility in oedometer tests
The compressibility in oedometer tests can be assessed using the Janbu modulus concept [44,60]. For effective stresses below σp', the constrained modulus, M, is assumed to be constant and is denoted M0. For effective stresses exceeding σp', the deformation modulus will be stress dependent. The stress dependency is approximately linear and can be expressed as a function of the modulus number, m, and a reference stress, pr'.
𝑀 = 𝑀0, 𝜎𝑣′ ≤ 𝜎𝑝′ (18)
𝑀 = 𝑚(𝜎𝑣′ − 𝑝𝑟′ ), 𝜎𝑣′ > 𝜎𝑝′ (19)
The constrained modulus in overconsolidated stress range, modulus number and the reference stress are illustrated with depth in Figure 20. Modulus numbers and reference stress from block samples are generally higher than for other sample types which may indicate influence of sample disturbance on these parameters. NGI [6] presents the stress-strain curves for each test which were carried out with a strain rate of 1.4%/hr. Best estimate profiles with most emphasis on block samples are included in the Figure 20.

691
AIMS Geosciences Volume 5, Issue 3, 665–703.
Figure 20. Constrained modulus, modulus number and reference stress with depth.
5.6. Coefficient of permeability and coefficient of consolidation
Of the important geotechnical parameters, the coefficient of permeability is one of the most variable. It represents the ease with which a fluid can flow through a porous medium, and denotes hydraulic conductivity if the fluid is water. Figure 21 illustrates the hydraulic conductivity calculated from the excess pore pressure in CRS oedometer tests with depth. The given values are at zero axial strain, which is considered representative for in-situ conditions. For soft clays, kv0 often falls within a narrow range of 5 × 10⁻¹⁰ m/s to 5 × 10⁻⁹ m/s [61] which is also the case for the NGTS Onsøy clay site, with a best estimate of 10−9 m/s. Anisotropy in the hydraulic conductivity is expected, but not measured for the Onsøy clay at this stage. Hydraulic conductivity parallel to platy particles can be as much as seven times higher than the hydraulic conductivity normal to platy particles [61]. From the CRS tests, a relationship for the hydraulic conductivity with axial strain, εa, was determined:
𝑙𝑜𝑔10(𝑘𝑣) = −0.032𝜀𝑎 − 9.1 (20)
where the axial strain is in percent and valid for the range 0–30 %. This equation can be used to find the hydraulic conductivity for void ratios other than the in-situ condition.
The coefficient of consolidation can be calculated from the hydraulic conductivity and stiffness modulus. Figure 21 includes the coefficient of consolidation in overconsolidated stress range in oedometer boundary conditions with depth.

692
AIMS Geosciences Volume 5, Issue 3, 665–703.
Figure 21. Coefficient of permeability and coefficient of consolidation with depth.
5.7. Sample quality
Based on oedometer and triaxial tests on soft plastic Norwegian clays, Lunne et al. [42] introduced a sample quality criterion based on change in void ratio over initial void ratio (normalized change in void ratio), ∆e/ei, during consolidation to best estimate in-situ stresses in the laboratory. In the assessment of best estimate engineering properties in previous sections, only samples with normalized change in void ratio smaller than 0.07, i.e. fair to excellent sample quality, have been drawn upon (see Figures 22 and 23). Sample quality could also be assessed qualitatively upon inspection of stress-strain behavior and stress path curves [62] which can be found in NGI [6].
Figures 22 and 23 illustrate the normalized change in void ratio with depth for CAU triaxial tests and CRS oedometer tests respectively. For the NGTS Onsøy clay, the normalized change in void ratio generally tends to increase with depth, which is believed to be related to increasing stress relief.
For the triaxial tests, all block samples are characterized as very good to excellent and generally exhibit higher quality compared to other tests at similar depths (see Figure 22). For the CRS oedometer tests, the block samples are amongst the best quality samples. Therefore, most emphasis has been on the block sample results in the determination of best estimate engineering properties.

693
AIMS Geosciences Volume 5, Issue 3, 665–703.
According to Figures 22 and 23, the 76 mm samples show large variations in sample quality. Samples referred to as 76 mm samples were sampled using a 3 m long seabed sampler where the sampling procedure and sampler details were modified at several stages during the project to improve the sample quality (based on same principles as explained in Lunne et al. [44]). It is believed that the variability in sample quality is to some extent due to the sampling procedures and sampling details themselves.
Only two tests were carried out on 54 mm samples which is considered too few to draw any conclusions. The 72 mm samples are from one continuous borehole and it is believed that the results show natural variability related to the soil itself, sampling and testing.
For the tube samples, there is relatively large scatter in the depth range between approximately 8 m and 12 m depth bgl. In this depth range, the plasticity index may have influenced the sample quality of the tube samples.
Figure 22. Change in void ratio over initial void ratio from CAU triaxial tests with depth.

694
AIMS Geosciences Volume 5, Issue 3, 665–703.
Figure 23. Change in void ratio over initial void ratio with depth.
5.8. Repeatability of CPTU results
Thirty-four cone penetration tests have been carried out at the NGTS Onsøy site in total. NGI [43] presents a study on the repeatability of measured results and effect of cone penetrometer type on the measured results from four of the NGTS sites including Onsøy. This study is an update of the results presented by Lunne et al. [63]. Twenty three of thirty-four tests were included involving seven different penetrometer types from five different manufacturers. The tests included were carried out within an area of 5 m by 12 m towards the southeast corner of the site.
The study revealed that zero shift due to temperature difference between air and soil could contribute significantly to the observed scatter in measured results. Based on that, the results were corrected for temperature effects. This significantly decreased the scatter in the data. The study suggested that the penetration pore pressure, u2, provides the most repeatable measurement followed by corrected cone resistance, qt, which showed somewhat higher variability. Some of the cone types give good repeatability for sleeve friction, fs, while some show relatively large variation.
Comparing results from different cone types reveal that the penetration pore pressure generally produces less scatter compared to the corrected cone resistance and sleeve friction, see Figure 24. The measured sleeve friction is very small for the soft clay and vary significantly from one cone type

695
AIMS Geosciences Volume 5, Issue 3, 665–703.
to another. This is in line with previous experience [64,65]. Hence one should be careful using sleeve friction, and also the friction ratio, when interpreting soil parameters for design. Since the measured u2 appears to be the most reliable parameter, it should be used in addition to qt for deriving soil parameters.
Figure 24. Measured CPTU parameters for the NGTS Onsøy soft clay site using seven different cone types.
6. Use of test site for engineering purposes
Lunne et al. [4] described the use of the Onsøy historic test sites up to 2001. The very first application was the large well-instrumented test fill carried out in 1972 and reported by Berre [66]. Later Berre re-analyzed the test fill using new samples and laboratory and produced two papers, first on the behavior before the test fill was brought to failure [67] and secondly on the failure behavior [68].
A large pile loading program was carried out in the period from 1985 to 1987 [69]. The results of the tests were used to develop a revised method for calculating bearing capacity based on effective stress strength parameters. In connection with evaluations of different types of offshore anchor types for floating offshore structures, both drag anchors [70] and plate anchor [71] were tested.
As outlined by Lunne at al. [4], a large number of in-situ tests as well as new samplers were tested out to check the performance and to develop new interpretation methods. As discussed in Section 5, the NGTS Onsøy clay has been used to develop a long seabed sampler. Most of this work was initiated because of the need to obtain high quality data for soil characterization in connection with offshore developments in deep waters.

696
AIMS Geosciences Volume 5, Issue 3, 665–703.
As discussed in Section 2.3, the Onsøy clay was deposited after the last glaciation as a marine clay and it has never been subjected to vertical effective stresses higher than today. It is very similar to several clay deposits found at oil and gas fields offshore Norway. One example is the large Troll field in the Norwegian Trench in the North Sea at a water depth of 320–350 m. Another example is the Luva (later name changed to Aasta Hansteen) field in the Norwegian Sea at a water depth of 1200 m where a major soil investigation was carried out in 2009 [3]. Soil characterization required for the Luva field showed that shallow gas coming out of solution during recovering samples to deck caused severe sample disturbance and laboratory tests could not give soil parameters representative for in-situ conditions. It was therefore decided that soil parameters had to rely, to a large extent, on results of in-situ tests. A detailed study showed that the geological setting and the soil parameters at the Luva site are very similar to the Onsøy historic site. Figure 25 illustrates the similarities between Luva, Troll and Onsøy historic sites in terms of plasticity index and OCR, and Figure 26 compares corrected cone resistance and penetration pore pressure as measured with CPTUs.
Figure 25. Plasticity index and overconsolidation ratio with depth for the offshore sites Luva and Troll, and the Onsøy historic site.

697
AIMS Geosciences Volume 5, Issue 3, 665–703.
Figure 26. Corrected cone resistance and pore water pressure measured behind cone for the offshore sites Luva and Troll, and the Onsøy historic site.
The similarities between soil conditions at the Onsøy historic site and the Luva site justified the use of cone and T-bar factors developed at Onsøy for the Luva soil characterization, see Table 2 below. The outcome of this was a significant cost reduction for the project.
Table 2. Cone factors and T-bar factors for several onshore and offshore clays including Onsøy historic (from Lunne et al., [3]).
Clay Nkt Range (average)
N∆u Range (average)
NT-bar Range (average)
Nball Range (average)
Onsøy historic 10–13 (12.5)
5–7 (6)
8–9 (8.5)
7.5–9 (8.5)
General soft clays—JIP 10–14 (12)
4–9 (6)
8.5–12.5 (10.5)
8.5–12.5 (10.5)
Recommended for Luva 12.5 8.5 9.5 9.5
The Onsøy historic site was also used for a large R&D projects on effect of ageing on piles [72]. Pile load tests were carried out over a period of more than 2 years and showed significant effects as illustrated in Figure 27. The figure shows shaft capacity with time including the proposed relationship between time and shaft capacity. The shaft capacity with time is here related to the shaft capacity after full consolidation of the clay (Qus0) which is assumed to be 100 days after pile installation (t0 = 100). The factor ∆10 is the inclination of the slope in Figure 27.

698
AIMS Geosciences Volume 5, Issue 3, 665–703.
Figure 27. Effect of time on pile bearing capacity (from Karlsrud et al. [72]).
7. Recommendations for further work
To estimate the in-situ horizontal effective stress is a major challenge to geotechnical engineers. Unfortunately, the results from earth pressure cells and hydraulic fracture stress tests showed some variations for the tests at the NGTS Onsøy site, and the quality is uncertain. For further testing with earth pressure cells, it is recommended to continuously monitor the total horizontal stress and the pore pressure with time to see the development of stress state surrounding the blade using more robust equipment. For further hydraulic fracture testing it is recommended to maintain the hydraulic fracture pressure for a longer time to minimize the effect of disturbed zone on measured results. To gain further insight into the coefficient of earth pressure at rest it may be beneficial to carry out CK0U tests.
The relationship between undrained shear strength and cone penetration results has been the subject of numerous studies in Norway and worldwide. To understand why Nkt and N∆u factors are different at the NGTS site compared to the Onsøy historic sites, it is suggested to further investigate these results.
8. Summary and conclusions
Geotechnical test sites have been instrumental for the development of soil investigation tools, benchmark testing, realization of large offshore developments etc. At Onsøy, researchers have studied the ageing effect on axial pile capacity, behavior and failure of a test fill, behavior of plate anchors etc. The current test site at Onsøy is the NGTS Onsøy site, which is located 1.3 km away from the Onsøy historic sites in a topographically narrow basin. The results from 14C shell dating

699
AIMS Geosciences Volume 5, Issue 3, 665–703.
suggest that the site emerged from the sea approximately 2735 years before present and that deeper shell fragments date back to the beginning of the Holocene with an approximate sedimentation rate of 1.5 mm/year. The soil stratigraphy consists of a dry crust down to the location of the groundwater table, which is 1 m below ground level on average. Below the dry crust, a medium to high plasticity dark grey silty soft clay with occasional pockets of sand and shell fragments is encountered. The soft clay exhibits an apparent preconsolidation stress caused by surface weathering, desiccation and ageing. The water content, plasticity and total unit weight varies within the test site most probably due to the topography of the area. The coefficient of earth pressure at rest was estimated using several different methods generally resulting in K0-values in the range from 0.55 to 0.7. The ratio between undrained shear strength and overburden stress is approximately constant, and the stiffness and strength anisotropy compare well with the general recommendations for Norwegian soft clays. The stiffness from constant rate of strain oedometer tests in overconsolidated stress range are largely in the range between 1 MPa and 4 MPa. The Sherbrook block samples generally yield the highest stiffness and strength results in accordance with previous experience at NGI. This paper presents the author's interpretation of best estimate engineering properties, and comments on the appropriateness of relevant correlations.
Acknowledgments
The authors would like to thank The Norwegian Research Council for their generous infrastructure grant to establish the five Norwegian GeoTest Sites for research (Grant No. 245650/F50). The authors would also like to acknowledge the significant contributions from Pagani, Geomil Equipment, In-situ Site Investigation, the Norwegian Public Roads Administration, Geological Survey of Norway and colleagues at NGI Field Investigations (Kristoffer Kåsin, Pål Kristian Karstensen, Rolf Ove Karlsen and Håvard Saur) and NGI Geosurveys (Helge Smebye and Sara Bazin) which are highly appreciated.
Conflict of interest
All authors declare no conflicts of interest in this paper.
References
1. NGI (1965) Grunnundersøkelse i forbindelse med planlagt forsøksfelt på Presterød ved Tønsberg. Report No.: F.281 [in Norwegian]. Oslo: Norwegian Geotechnical Institute.
2. NGI (1968) Undersøkelser efter mulige forsøksfelter for skjærboks og K0 pel. Report No.: F.281-8 (rapport 2) [in Norwegian]. Oslo: Norwegian Geotechnical Institute.
3. Lunne T, Andersen KH, Yang S, et al. (2012) Undrained shear strength for foundation design at the Luva deep water field in the Norwegian Sea. Geotechnical and geophysical site characterization 4: 1105–1114.
4. Lunne T, Long M, Forsberg CF (2003) Characterisation and engineering properties of Onsøy clay. Charact Eng Prop Nat Soils 1: 395–427.

700
AIMS Geosciences Volume 5, Issue 3, 665–703.
5. ISO (2014) Petroleum and natural gas industries—Specific requirements for offshore structures. Part 8: Marine soil investigations (ISO 19901-8). Geneva, Switzerland: International Organization for Standardization.
6. NGI (2018) Norwegian GeoTest Sites—Field and laboratory test results from NGTS soft clay site—Onsøy. Report No.: 20160154-10-R. Rev. 1. Oslo: Norwegian Geotechnical Institute.
7. NGF (1989) Melding 7: Veiledning for utførelse av dreietrykksondering. Rev.1 [in Norwegian]. Oslo: Norwegian Geotechnical Society.
8. ISO (2012) Geotechnical investigation and testing—Field testing. Part 1: Electrical cone and piezocone penetration test (ISO 22476-1). Geneva, Switzerland: International Organization for Standardization.
9. ISO (2017) Geotechnical investigation and testing—Field testing. Part 11: Flat dilatometer test (ISO 22476-11). Geneva, Switzerland: International Organization for Standardization.
10. ISO (2012) Geotechnical investigation and testing—Field testing. Part 5: Flexible dilatometer test (ISO 22476-5). Geneva, Switzerland: International Organization for Standardization.
11. NGF (2017) Melding 6: Veiledning for måling av grunnvannsstand og poretrykk. Rev. 2 [In Norwegian] Oslo: Norwegian Geotechnical Society.
12. NGF (1989) Melding 4: Veiledning for utførelse av vingeboring. Rev. 1 [in Norwegian]. Oslo: Norwegian Geotechnical Society.
13. Bjerrum L, Andersen KH (1972) In-situ measurements of lateral pressures in clay. European Conference on Soil Mechanics and Foundation Engineering, 5 Madrid 1972 Proceedings. Madrid: Sociedad Española de Mecánica del Suelo y Cimentaciones.
14. NGF (2013) Melding 11: Veiledning for prøvetaking [In Norwegian]. Oslo: Norwegian Geotechnical Society.
15. Lefebvre G, Poulin C (1979) A new method of sampling in sensitive clay. Can Geotech J 16: 226–233.
16. NGI (2017) Testing of new samplers for SWORD. Evaluation of sample quality—phase 2 and 3. Report No.: 20150530-02-R. Rev. 1.
17. ISO (2014) Geotechnical investigation and testing—Laboratory testing of soil. Part 1: Determination of water content (ISO 17892-1). Geneva, Switzerland: International Organization for Standardization.
18. ISO (2014) Geotechnical investigation and testing—Laboratory testing of soil. Part 2: Determination of bulk density (ISO 17892-2). Geneva, Switzerland: International Organization for Standardization.
19. ISO (2015) Geotechnical investigation and testing—Laboratory testing of soil. Part 3: Determination of particle density (ISO 17892-3). Geneva, Switzerland: International Organization for Standardization.
20. ISO (2018) Geotechnical investigation and testing—Laboratory testing of soil. Part 12: Determination of liquid and plastic limits (ISO 17892-12). Geneva, Switzerland: International Organization for Standardization.
21. Moum J (1965) Falling drop used for grain-size analysis of fine-grained materials. Sedimentology 5: 343–347.

701
AIMS Geosciences Volume 5, Issue 3, 665–703.
22. ISO (2016) Geotechnical investigation and testing—Laboratory testing of soil. Part 4: Determination of particle size distribution (ISO 17892-4). Geneva, Switzerland: International Organization for Standardization.
23. NS (1988) Geotechnical testing—Laboratory methods. Determination of undrained shear strength by fall-cone testing (NS 8015). Oslo: Standards Norway.
24. ISO (1994) Soil quality. Determination of the specific electrical conductivity (ISO 11265). Geneva, Switzerland: International Organization for Standardization.
25. ISO (2017) Geotechnical investigation and testing—Laboratory testing of soil. Part 5: Incremental loading oedometer test (ISO 17892-5) Geneva, Switzerland: International Organization for Standardization.
26. Sandbækken G, Berre T, Lacasse S (1986) Oedometer Testing at The Norwegian Geotechnical Institute. In: Yong RN, Townsend FC, editors. Consolidation of soils: testing and evaluation, STP 892, American Society for Testing and Materials, 329–353.
27. NS (1993) Geotechnical testing—Laboratory methods. Determination of one-dimensional consolidation properties by oedometer testing—Method using continuous loading (NS 8018). Oslo: Standards Norway.
28. ISO (2004) Geotechnical investigation and testing—Laboratory testing of soil. Part 11: Determination of permeability by constant and falling head (ISO 17892-11). Geneva, Switzerland: International Organization for Standardization.
29. Berre T (1982) Triaxial Testing at the Norwegian Geotechnical Institute. Geotech Test J 5: 3–17. 30. ISO (2018) Geotechnical investigation and testing—Laboratory testing of soil. Part 9:
Consolidated triaxial compression tests on water saturated soils (ISO 17892-9). Geneva, Switzerland: International Organization for Standardization.
31. Bjerrum L, Landva A (1966) Direct Simple-Shear Tests on a Norwegian Quick Clay. Géotechnique 16: 1–20.
32. ASTM (2015) Standard Test Method for Consolidated Undrained Direct Simple Shear Testing of Fine Grain Soils (ASTM D6528-17). West Conshohocken, PA: ASTM International.
33. Dyvik R, Madshus C (1985) Lab measurements of Gmax using bender elements. In: Khosla V, editor. Advances in the Art of Testing Soils under Cyclic Conditions: Proceedings of a Session in Conjunction with the ASCE Convention in Detroit, Michigan 1985, New York: American Society of Civil Engineers, 186–196.
34. Dyvik R, Olsen T (1989) Gmax measured in oedometer and DSS tests using bender elements. Proceedings to the 12th International Conference on Soil Mechanics and Foundation Engineering. Rio de Janeiro, Brazil, 39–42.
35. Sørensen R (1979) Late Weichselian deglaciation in the Oslofjord area, south Norway. Boreas 8: 241–246.
36. Rise L, Bøe R, Sveian H, et al. (2006) The deglaciation history of Trondheimsfjorden and Trondheimsleia, Central Norway. Nor J Geol/Nor Geol Foren 86.
37. Kenney TC (1964) Sea-Level Movements and the Geologic Histories of the Post-Glacial Marine Soils at Boston, Nicolet, Ottawa and Oslo. Géotechnique 14: 203–230.
38. Vereș DȘ (2002) A comparative study between loss on ignition and total carbon analysis on mineralogenic sediments. Stud UBB Geol 47: 171–182.

702
AIMS Geosciences Volume 5, Issue 3, 665–703.
39. ISO (2017) Geotechnical investigation and testing—Identification and classification of soil. Part 2: Principles for a classification (ISO 14688-2:2017). Geneva, Switzerland: International Organization for Standardization.
40. Zolitschka B, Mingram J, Van Der Gaast S, et al. (2002) Sediment logging techniques. Tracking environmental change using lake sediments, Springer, 137–153.
41. BSI (1999) Code of practice for site investigations (BS 5930). London, United Kingdom: British Standard Institute.
42. Lunne T, Berre T, Strandvik S (1997) Sample disturbance effects in soft low plastic Norwegian clay. Symposium on Recent Developments in Soil and Pavement Mechanics. Rio de Janeiro.
43. NGI (2018) Norwegian GeoTest Sites—Impact of cone penetrometer type on CPTU results at 4 NGTS sites—silt, soft clay, sand and quick clay. Report No.: 20160154-21-R. Oslo: Norwegian Geotechnical Institute.
44. Lunne T, Berre T, Andersen KH, et al. (2008) Effects of sample disturbance on consolidation behaviour of soft marine Norwegian clays. In: Huang A, Mayne P, editors. 3rd International Conference on Site Characterization, Taipei, Taiwan, 1471–1479.
45. Marchetti S, Monaco P, Totani G, et al. (2001) The flat dilatometer test (DMT) in soil investigations. A report by the ISSMGE Technical Committee 16 on Ground Property Characterisation from In-situ Testing. International Conference on Insitu Measurement of Soil Properties. Bali, Indonesia, 95–131.
46. Marchetti S (1980) In situ tests by flat dilatometer. J Geotech Eng Div 106: 299–321. 47. Lunne T, Powell JJ, Robertson PK (1997) Cone penetration testing in geotechnical practice.
CRC Press. 48. Marsland A, Randolph MF (1977) Comparison of the results from pressuremeter tests and large
in situ plate tests in London Clay. Géotechnique 27: 455–477. 49. Bjerrum L, Andersen KH (1972) In-situ measurement of lateral pressures in clay. Nor Geotech
Inst Publ, 29–38. 50. Aas G, Lacasse S, Lunne T, et al. (1986) Use of in situ tests for foundation design on clay. Use
of In Situ Tests in Geotechnical Engineering, 1–30. 51. Brooker EW, Ireland HO (1965) Earth pressures at rest related to stress history. Can Geotech J 2:
1–15. 52. Mayne P, Kulhawy FH (1982) K0–OCR relationships in soil. J Geotech Eng Div 108: 851–872. 53. L’Heureux JS, Ozkul Z, Lacasse S, et al. (2017) Bestemmelse av hviletrykk (K0) i norske
leirer—anbefalinger basert på en sammenstilling av lab-, felt-og erfaringsdata [in Norwegian]. Geoteknikkdagen 2017, Oslo, Norway.
54. NGI (2019) Norwegian GeoTest Sites—Interpreted test results from NGTS soft clay site—Onsøy. Report No.: 20160154-11-R. Rev. 0.
55. NGI (2006) Shear strength parameters determined by in situ tests for deep water soft soils. Summary Report/Manual. Report No.: 20041618-6. Oslo: Norwegian Geotechnical Institute.
56. Karlsrud K, Lunne T, Kort DA, et al. (2005) CPTU correlations for clays. Proceedings of the 16th international conference on soil mechanics and geotechnical engineering. Osaka, Japan, 693–702.

703
AIMS Geosciences Volume 5, Issue 3, 665–703.
57. NVE (2014) En omforent anbefaling for bruk av anisotropifaktorer i prosjektering i norske leirer [In Norwegian]. Report No.: 14/2014. NVE, Statens vegvesen, Jernbaneverket.
58. L’Heureux JS, Long M (2017) Relationship between shear-wave velocity and geotechnical parameters for Norwegian clays. J Geotech Geoenviron Eng 143: 04017013.
59. Andersen KH (2015) Cyclic soil parameters for offshore foundation design. In: Meyer V, editor. Frontiers in offshore geotechnics III, ISFOG 2015. Oslo: Taylor & Francis Group, London, 5–82.
60. Janbu N (1963) Soil compressibility as determined by odometer and triaxial tests. European Conference on Soil Mechanics and Foundation Engineering, Proceedings. Wiesbaden, 19–25.
61. Mitchell JK, Soga K (2005) Fundamentals of soil behavior. Third Edition, John Wiley & Sons New York.
62. Karlsrud K, Hernandez-Martinez FG (2013) Strength and deformation properties of Norwegian clays from laboratory tests on high-quality block samples. Can Geotech J 50: 1273–1293.
63. Lunne T, Strandvik S, Kåsin K, et al. (2018) Effect of cone penetrometer type on CPTU results at a soft clay test site in Norway. Cone Penetration Testing IV: Proceedings of the 4th International Symposium on Cone Penetration Testing (CPT 2018), Delft, The Netherlands.
64. Powell JJ, Lunne T (2005) A comparison of different sized piezocones in UK clays. Proceedings of the 16th International Conference on Soil Mechanics and Geotechnical Engineering. Osaka, Japan, 729–734.
65. Cabal K, Robertson PK (2014) Accuracy and Repeatability of CPT Sleeve Friction Measurements. Proceedings of the 3rd International Symposium on Cone Penetration Testing (CPT'14). Las Vegas, Nevada, USA.
66. Berre T (1974) Belastningsforsak på plastisk leire i Onsøy [In Norwegian]. Nor Geotech Inst Publ 102: 21–30.
67. Berre T (2013) Test fill on soft plastic marine clay at Onsøy, Norway. Can Geotech J 51: 30–50. 68. Berre T (2017) Test fill brought to failure on soft plastic marine clay at Onsøy, Norway. Can
Geotech J 55: 563–576. 69. Karlsrud K (2012) Prediction of load-displacement behavior and capacity of axially loaded piles
in clay based on analyses and interpretation of pile load test results (Doctoral dissertation). Norwegian University of Science and Technology.
70. Dahlberg R, Strøm PJ (1999) Unique onshore tests of deepwater drag-in plate anchors. Offshore Technology Conference. Houston, Texas, USA.
71. Heyerdahl H, Eklund T (2001) Testing of plate anchors. Proc Offshore Technology Conference. Houston, Texas, USA.
72. Karlsrud K, Jensen TG, Lied EKW, et al. (2014) Significant ageing effects for axially loaded piles in sand and clay verified by new field load tests. Offshore Technology Conference, Houston, Texas, USA.
© 2019 the Author(s), licensee AIMS Press. This is an open access article distributed under the terms of the Creative Commons Attribution License (http://creativecommons.org/licenses/by/4.0)