Characteristics of Stop and Go Wave in One Dimensional ...
14
Characteristics of Stop and Go Wave in One Dimensional Interrupted Pedestrian Flow Through Narrow Channel H. Gayathri 1 · Siddharatha Gulhare 1 · Ashish Verma 2 1 Department of Civil Engineering, Indian Institute of Science, Bangalore, India, E-mail: [email protected], [email protected] 2 Department of Civil Engineering and Robert Bosch Centre for Cyber Physical Systems, Indian Institute of Science, Bangalore, India, E-mail: [email protected] Received: 30 August 2018 / Last revision received: 4 December 2018 / Accepted: 12 January 2019 DOI: 10.17815/CD.2018.18 Abstract Pedestrian microscopic simulation models can aid crowd management only if they can reproduce the crowd behavior correctly. To calibrate and validate the model, it is important to understand crowd movement during various activities involved in mass gath- ering events. A common practice in such gathering is to hold attendees in waiting area in near corridors separated by crowd barriers before the event and release in small batches to avoid overcrowding inside. This can make crowd aggressive during such entries. Crowd flow characteristics due to such behavior is difficult to recreate in pedestrian experimental studies in laboratory setting. This paper studied interrupted flow of such crowd through a narrow corridor, made of strong railing channel inside a temple. Interrupted flow lead to formation of one dimensional stop and go waves. These stop and go waves were studied from the trajectory data. The average speed of waves propagating over longer distance were also estimated. The quantitative output from this study can be used to calibrate and validate simulation models of such activity during mass gathering events. Keywords Religious mass gathering · stop and go waves · pedestrian dynamics · India 1 Introduction Mass gatherings can be music concerts, religious observance, sport events, rallies etc. In such gatherings, concentration of large crowd in small space pose potential crowd risk situations. It is always a challenge for event managers/organizers to manage such Collective Dynamics 3, A18:1–14 (2018) Licensed under
Transcript of Characteristics of Stop and Go Wave in One Dimensional ...

Characteristics of Stop and Go Wave inOne Dimensional Interrupted PedestrianFlow Through Narrow Channel
H. Gayathri1 · Siddharatha Gulhare1 · Ashish Verma2
1 Department of Civil Engineering, Indian Institute of Science, Bangalore, India,E-mail: [email protected], [email protected]
2 Department of Civil Engineering and Robert Bosch Centre for Cyber Physical Systems,Indian Institute of Science, Bangalore, India,E-mail: [email protected]
Received: 30 August 2018 / Last revision received: 4 December 2018 / Accepted: 12 January 2019
DOI: 10.17815/CD.2018.18
Abstract Pedestrian microscopic simulation models can aid crowd management only ifthey can reproduce the crowd behavior correctly. To calibrate and validate the model, it isimportant to understand crowd movement during various activities involved in mass gath-ering events. A common practice in such gathering is to hold attendees in waiting area innear corridors separated by crowd barriers before the event and release in small batches toavoid overcrowding inside. This can make crowd aggressive during such entries. Crowdflow characteristics due to such behavior is difficult to recreate in pedestrian experimentalstudies in laboratory setting. This paper studied interrupted flow of such crowd through anarrow corridor, made of strong railing channel inside a temple. Interrupted flow lead toformation of one dimensional stop and go waves. These stop and go waves were studiedfrom the trajectory data. The average speed of waves propagating over longer distancewere also estimated. The quantitative output from this study can be used to calibrate andvalidate simulation models of such activity during mass gathering events.
Keywords Religious mass gathering · stop and go waves · pedestrian dynamics · India
1 Introduction
Mass gatherings can be music concerts, religious observance, sport events, rallies etc.In such gatherings, concentration of large crowd in small space pose potential crowdrisk situations. It is always a challenge for event managers/organizers to manage such
Collective Dynamics 3, A18:1–14 (2018) Licensed under

2 H. Gayathri · S. Gulhare · A. Verma
large crowd and plan their smooth and safe movement prior to such gatherings. Variousguidelines have also been prepared to supplement crowd management. But, with advancesin science and technology, it is possible to use microscopic pedestrian simulation models[1–6] to evaluate various crowd management plans prior to the event and they can also beused to run real time simulation to predict any crowd risk during the event. These toolscan provide aid to crowd management only if they can re-enact every aspect of crowdbehavior accurately. Therefore, along with the advancements in simulation tools, it isalso very important to conduct detailed empirical study to understand different aspects ofcrowd flow characteristics at such events, which can be used to calibrate and validate thesimulation models later.
A common practice at many events (concerts, religious events, shows, sale, etc.) is tonot allow crowd to enter the premises before designated time and to allow only in batches.Attendees are made to wait in queues in narrow corridors (created using crowd controlbarriers to avoid people cutting in line) at the designated waiting areas (Fig. 1). Laterthey are allowed to enter premises in smaller batches to avoid any chaos inside. Oncethe previous batch is processed, next batch of attendees are released from the waitingarea. However, excitement, long waiting hours, competitive behavior to get inside earlierand perception of unfair treatment by guards/volunteers can make crowd aggressive atthe entrance. Other factors such as hunger, thirst, unfavorable weather (in case of openwaiting area) makes the situation more vulnerable to crowd risk. It is difficult to measurebehavior of crowd, but it is possible to measure the crowd flow characteristics for suchinterrupted flow, which is assumed to implicitly account for the behavior.
This study contributes to the existing empirical knowledge by observing the One-Dimensional movement of crowd entering in batches inside the main premise of a temple(using data from Mahakaleshwar Temple in Ujjain, India) after long waiting hours to wit-ness important religious rituals during early morning hours. The formation of stop andgo waves are studied for the interrupted flow using trajectory data. The results from thisstudy can be used to calibrate and validate models to simulate the entry of crowd into suchvenues, which is a component of overall crowd management plan.
2 Review of Literature
Lot of macroscopic pedestrian studies have been conducted on real crowd in past. How-ever, there are few microscopic studies based on field data because of challenges of fielddata collection and difficulties in accurate data extraction. The various field challenges in-cludes, difficulty in installing camera at desired position/angle, inability to capture a flowphenomenon that is deemed relevant, etc. Because of these challenges, many researchersin recent years have shifted their focus from field data collection to pedestrian experimentsbecause of the freedom to control the conditions (lighting, camera position, experimen-tal setup, crowd composition etc.) for automatic microscopic data extraction. Pedestriandynamics is a very complex phenomenon [7] and these pedestrian experiments give op-portunity to control other influencing variables, which can potentially lead to crowd risksituations. Experimental studies on single file movement [7–10], evacuation [11–13], bot-
Characteristics of Stop and Go Wave 3
Figure 1 Crowd waiting outside in narrow channels created using crowd control barrier. Left image: lineof people waiting for the iPhone 3G outside of the Apple Store in Newyork (Source: Apple Store,5th Ave., NYC, 7/12/08 - 13 of 19 https://www.flickr.com/photos/goodrob13/2664214748).Right image: Pilgrims in Ujjain, India waiting in zig-zag narrow channels built at waiting hallin Mahakaleshwar temple to attend early morning rituals (Source: CCTV footage from Ma-hakaleshwar temple)
tleneck [14–17] have been conducted in the past. [17–21] have investigated stop and gowaves in single file movement experiments. [22] have experimentally studied the propa-gation speed of starting waves of pedestrians.
However, it can be argued that the emotional situation of the participants in such studiesis relaxed, and therefore the real effects are not shown [23]. Heterogeneity, exertion,excitement, genuine stress to stay together in their groups, possible perception of unfairtreatment by authorities, etc. are some of the traits of real crowd, which are difficult toreproduce in experimental setups. Gulhare et al. [24] had found field and experiment datafor single file movement to be significantly different and suggested that data collectedfrom field should be used for model calibration. [25] performed the macroscopic fieldstudy of shock wave at upstream of bottleneck for uninterrupted flow. There have beenvery less focus to understand stop and go waves in pedestrians for interrupted flow, whichis prevalent at the entrance of many mass gathering events. This paper attempts to studymicroscopic flow for interrupted pedestrian flow from a real field data in mass gathering.
3 Data Collection
Shivrathri festival is widely celebrated in India during February and pilgrims from variousplaces visit Mahakaleshwar temple, in Ujjain, India, during this time. Videography datausing GoPro cameras was collected during this festival time inside the temple in Februrary2017. A special ritual is performed at the main hall in the temple every morning from4:30AM called Bhasma Arthi. The word Bhasma means ash and Arthi means offering toGod. It is a kind of ritual that is performed in the temple using the ash made with cowdung. Unlike the localites, the pilgrims who visit during Shivrathri festival exhibit a senseof urgency to experience the special occasion as they consider this as a rare opportunity toobserve the rituals. Therefore, this sense of urgency to be there in prime locations inside

4 H. Gayathri · S. Gulhare · A. Verma
the ritual hall triggers their mind psychologically. The admission for the event is limitedand devotees have to make advance booking. Hundreds of devotees visit every day toattend the event. They are allowed to enter and wait at the waiting hall from 12AM. Thedevotees try to come early to get front positions in the zig-zag constrained corridors of thewaiting hall (Fig. 2). The corridors are separated by strong steel railings of approximately0.9 m height. The entry to main hall is allowed from 4AM and devotees are releasedfrom waiting area in batches in some time intervals, they walk at free flow speed forapproximately 100m to enter the main hall, which is two floors below and connected viaramps. The stop and go waves were created with the release of batch of people, which arecaptured using two cameras (frame rate: 30 frames per second) installed perpendicular tothe direction of movement (Fig. 2). Both cameras capture the same long corridor at twodifferent sections for 35 minutes duration. The videos were later synchronized in timewith the help of flashlight illuminated at the area visible in both cameras. The corridorhad few 2m long benches with 35cm of seat depth. Since, the camera only captured the1-D motion of devotees, the effect of chair on crowd dynamics was ignored and can betreated as a limitation of the study. In the later parts of paper term pedestrians is used todenote devotees.
Figure 2 (a) Schematic diagram of corridor with screenshots of videos. The study section is confinedto 3 meters in center (sections) to avoid parallax error and angular distortion. (b) Schematicrepresentation of hall and location of study sections and camera positions

Characteristics of Stop and Go Wave 5
4 Data Analysis
4.1 Data Extraction
The pixel coordinates of position of each pedestrian was manually extracted at 2 fps byclicking on the same body part (generally shoulder) using Traffic Data Extraction tool[26]. Each pedestrian was manually traced from right side to left side of the video forapproximately 6m ignoring the extreme corners considering only the middle portion i.e.section 1 and section 2 (Fig. 2(a)), to avoid parallax error and angular distortion. Extremecorners are the portions that are not used for analysis but are captured. The pedestriansmay arrange themselves in 2-Dimension utilizing the full width of corridor. Careful ap-proximations were made in determining the position whenever pedestrians were not com-pletely visible. However, it would have led to some errors in trajectory data. Total 592pedestrian trajectories were extracted from camera 1 and 615 trajectories were extractedfrom camera 2 by clicking more than 158,000 times in span of multiple weeks. Informa-tion like pedestrian ID (vehicle number in the TDE), time stamp and x-pixel coordinates(1-D motion) were used for further analysis.
4.2 Camera Calibration
The long corridor railing was marked at regular interval of 57cm with blue colored ad-hesive tape. The x-pixel coordinates (px) of these markings were collected and plottedagainst real distance along X direction (x in meters) (Fig. 3). The third order polynomialregression (Eq. 1 and 2) were derived to find relation between real coordinate system andpixel coordinate system.
For section 1,
x =−4.932×10(−9)px3 +9.631×10(−6)px
2 −0.0117px +9.069;(R2 = 0.999) (1)
For section 2,
x = 9.69+(−4.932×10(−9)px3 +9.631×10(−6)px
2 −0.0117px +9.069);(R2 = 0.999)(2)
Where, px is x-pixel coordinate and x is global real coordinate. The distance between twosections is 9.69 m and this is added to section 1 in order to get the global real coordinatein section 2 (Section 1 ranges from x=3m to x=6m and section 2 starts from x=12.5m tox=15.5m.)
4.3 Density and Trajectories
The process of releasing pedestrians in batches to the main hall started at 4 AM, provid-ing sufficient time for pedestrians to comfortably reach and settle in the main hall. Therestricted number of attendees and the constrained corridors in waiting hall were designedfor comfortable single file movement. The timeline of density at both sections can givesome estimate of urgency in the crowd. The density is calculated by dividing number of

6 H. Gayathri · S. Gulhare · A. Verma
Figure 3 Regression curve fitted on scatter plot of real vs. pixel coordinates for camera calibration insection 1
pedestrians by the area of section. The moving average density is calculated for every 5seconds using Eqn. 3. Similarly trajectory is also plotted from moving average of posi-tions for every 5 seconds. The high density values in the study sections demonstrate thedense packing of crowd indicating the presence of urgency in the crowd (Fig. 4 and 5).
dt = 1/n(t+n/2)
∑( j=t−n/2+1)
d j (3)
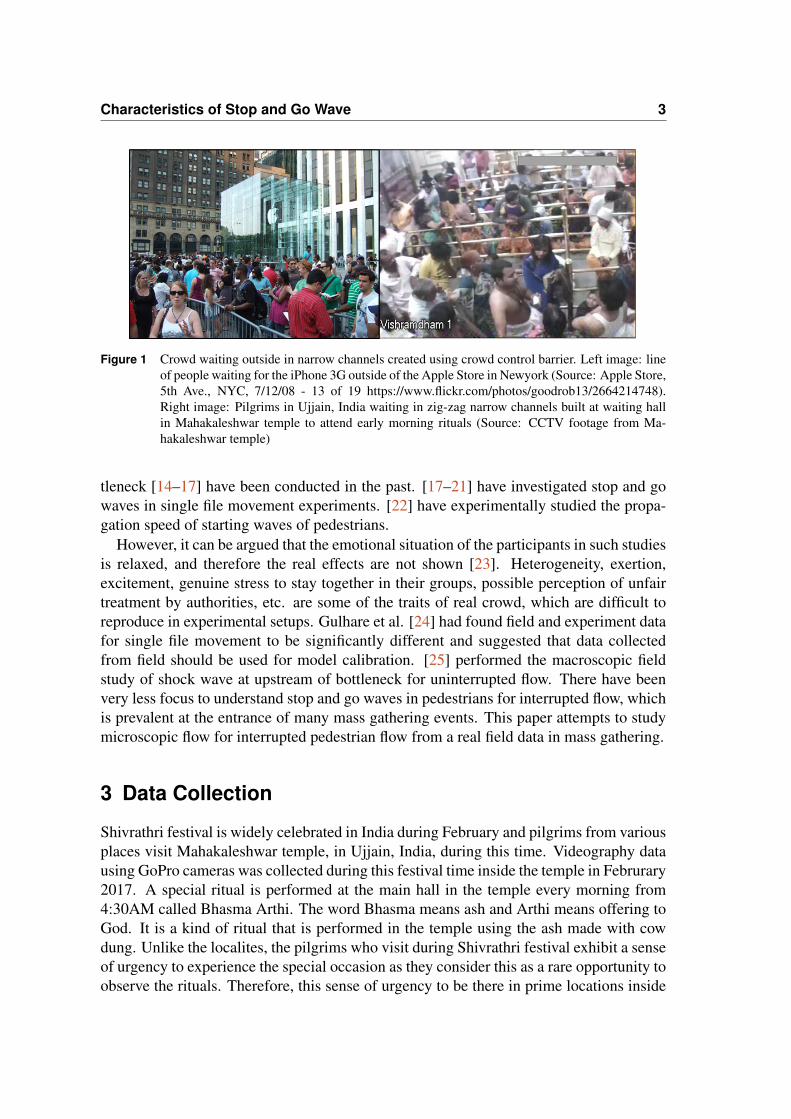
Density vs velocity graph is plotted for both the sections. It is observed that theirrelationship is linear. (Fig. 6)
4.4 Determination of Stop and Go Points
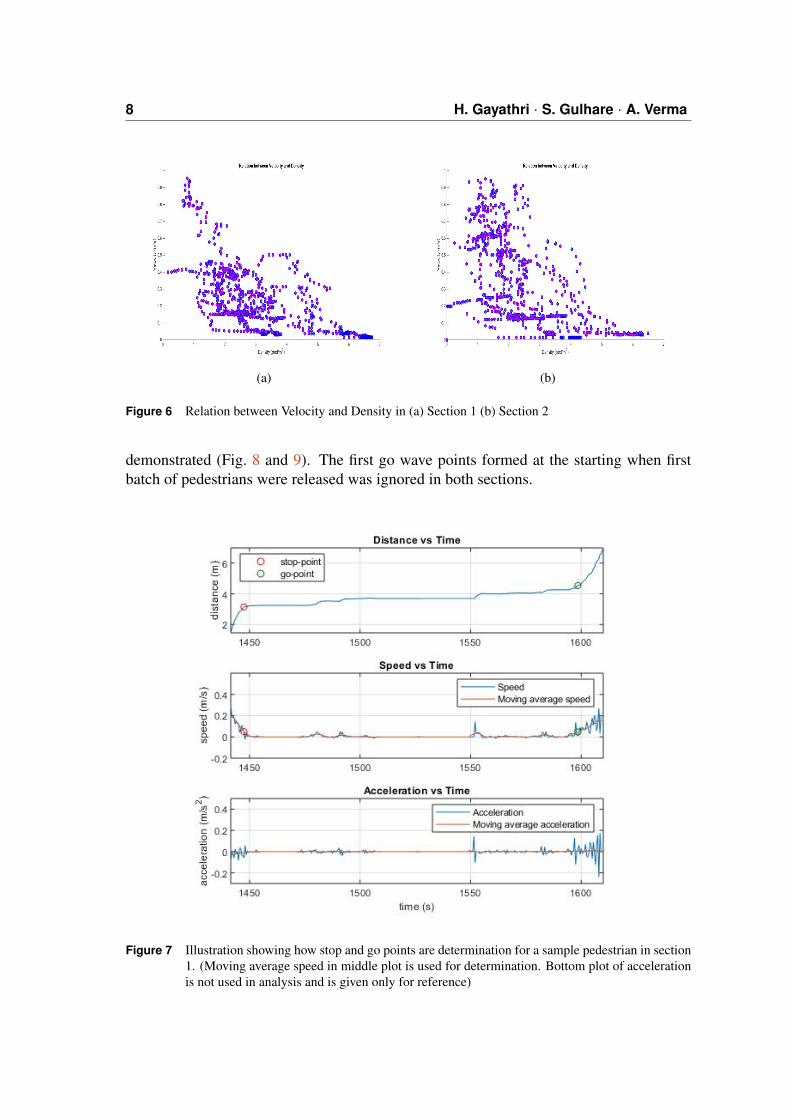
When the gates were opened to release a batch of pedestrians, the pedestrians in frontmoved which created space for other pedestrian behind to move and so on. This createda go wave. Once the gate was closed, all pedestrians came to halt one after another,which propagated a stop wave (or shockwave). The instantaneous speed was calculatedfrom trajectory data and later moving average speed for 5 seconds was calculated frominstantaneous speed to reduce noise. Since, the density was high, walking speeds werealso low, therefore for the purpose of this study, the threshold speed was set to a verylow value 5cm/s. When waiting pedestrians gained speed above 5cm/s, it was considereda go-point. Similarly, when speed of moving pedestrian reduced below 5cm/s, it wasconsidered a stop-point. The determination of stop and go points for one of the pedestriansin section 1 is illustrated (Fig. 7). The locations of stop and go points in both sections are

Characteristics of Stop and Go Wave 7
Figure 4 Top figure shows the timeline of density and bottom figure shows the trajectories in section 1.(Some trajectories are highlighted for better illustration)
Figure 5 Top figure shows the timeline of density and bottom figure shows the trajectories in section 2.(Some trajectories are highlighted for better illustration)
8 H. Gayathri · S. Gulhare · A. Verma
(a) (b)
Figure 6 Relation between Velocity and Density in (a) Section 1 (b) Section 2
demonstrated (Fig. 8 and 9). The first go wave points formed at the starting when firstbatch of pedestrians were released was ignored in both sections.
Figure 7 Illustration showing how stop and go points are determination for a sample pedestrian in section1. (Moving average speed in middle plot is used for determination. Bottom plot of accelerationis not used in analysis and is given only for reference)

Characteristics of Stop and Go Wave 9
Figure 8 Stop and go points superimposed on trajectories of sections 1
Figure 9 Stop and go points superimposed on trajectories of section 2
4.5 Speed of Local Stop and Go Waves
The stop and go points were clustered separately to form waves. First of all points lyingwithin study sections (from 3m to 6m in section 1; from 12.5m to 15.5m in section 2)were only selected for analysis. The first criteria for clustering was that the adjacentpoint should be within 3 seconds and secondly it should be within 5 meter distance (int-x plane). Points, which could not be clustered, were ignored. Seven stop waves andseven go waves were obtained for each section, which are consistent with Fig. 8 andFig. 9. The speed of waves within the sections are tabulated (Tab. 1 and 2). The speed ofwaves were determined by fitting linear regression to each cluster. The stop-waves weremore consistent in speed and R-square values as compared to go-waves. The speeds have

10 H. Gayathri · S. Gulhare · A. Verma
Table 1 Estimated Speed of Various Stop Waves in Both Sections
Wave no.Section 1 Section 2
Speed(m/s)
R2 Shockpointnos.
Speed(m/s)
R2 Shockpointnos.
1 -0.45 0.83 22 -0.24 0.91 132 -0.49 0.91 20 -0.45 0.95 173 -0.29 0.61 16 -0.34 0.93 194 -0.39 0.93 14 -0.39 0.96 125 -0.11 0.65 14 -0.15 0.84 146 -0.36 0.81 10 -0.28 0.90 97 -0.26 0.75 17 -0.36 0.98 9
Table 2 Estimated Speed of Various Go Waves in Both Sections
Wave no.Section 1 Section 2
Speed(m/s)
R2 Shockpointnos.
Speed(m/s)
R2 Shockpointnos.
1 -0.53 0.72 22 -0.63 0.89 132 -0.52 0.87 17 -0.61 0.38 213 -0.10 0.72 19 -0.43 0.35 224 -0.33 0.63 10 -0.98 0.68 85 -0.36 0.66 10 -0.39 0.94 116 -0.20 0.74 10 -0.51 0.79 117 -0.28 0.74 19 -0.16 0.26 8
negative values because both stop waves and go waves travel backwards. Shock pointnumbers are the number of points involved in a particular stop or go wave.
4.6 Average Propagation Speed of Stop and Go Waves
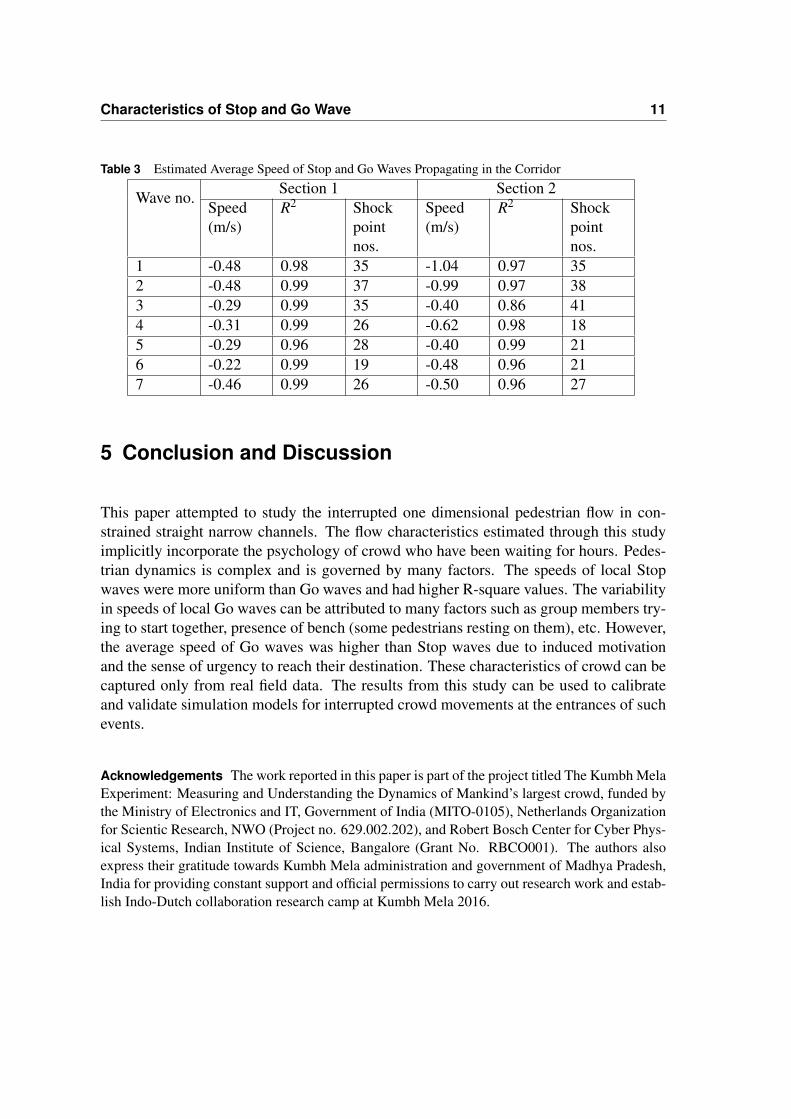
The purpose of using two cameras on the same corridor was to understand the charac-teristics of stop and go waves propagating over long distance. Wave numbers in Tab. 1and 2 corresponds to the same waves propagating through both the sections. The averagespeed of the waves was determined by fitting linear regression into wave clusters havingsame wave number. The average speeds clearly indicates that Go waves on average travelfaster than Stop waves (Tab. 3). This clearly shows that the sense of urgency to reach themain hall and to occupy prime locations to witness the rituals, triggers the pilgrims mindpsychologically and hence when the queue is released, pilgrims try to rush to the mainhall leading to high average speed of Go waves than stop waves.
Characteristics of Stop and Go Wave 11
Table 3 Estimated Average Speed of Stop and Go Waves Propagating in the Corridor
Wave no.Section 1 Section 2
Speed(m/s)
R2 Shockpointnos.
Speed(m/s)
R2 Shockpointnos.
1 -0.48 0.98 35 -1.04 0.97 352 -0.48 0.99 37 -0.99 0.97 383 -0.29 0.99 35 -0.40 0.86 414 -0.31 0.99 26 -0.62 0.98 185 -0.29 0.96 28 -0.40 0.99 216 -0.22 0.99 19 -0.48 0.96 217 -0.46 0.99 26 -0.50 0.96 27
5 Conclusion and Discussion
This paper attempted to study the interrupted one dimensional pedestrian flow in con-strained straight narrow channels. The flow characteristics estimated through this studyimplicitly incorporate the psychology of crowd who have been waiting for hours. Pedes-trian dynamics is complex and is governed by many factors. The speeds of local Stopwaves were more uniform than Go waves and had higher R-square values. The variabilityin speeds of local Go waves can be attributed to many factors such as group members try-ing to start together, presence of bench (some pedestrians resting on them), etc. However,the average speed of Go waves was higher than Stop waves due to induced motivationand the sense of urgency to reach their destination. These characteristics of crowd can becaptured only from real field data. The results from this study can be used to calibrateand validate simulation models for interrupted crowd movements at the entrances of suchevents.
Acknowledgements The work reported in this paper is part of the project titled The Kumbh MelaExperiment: Measuring and Understanding the Dynamics of Mankind’s largest crowd, funded bythe Ministry of Electronics and IT, Government of India (MITO-0105), Netherlands Organizationfor Scientic Research, NWO (Project no. 629.002.202), and Robert Bosch Center for Cyber Phys-ical Systems, Indian Institute of Science, Bangalore (Grant No. RBCO001). The authors alsoexpress their gratitude towards Kumbh Mela administration and government of Madhya Pradesh,India for providing constant support and official permissions to carry out research work and estab-lish Indo-Dutch collaboration research camp at Kumbh Mela 2016.

12 H. Gayathri · S. Gulhare · A. Verma
References
[1] Helbing, D., Molnar, P.: Social force model for pedestrian dynamics. Phys. Rev. E51, 4282–4286 (1995). doi:10.1103/PhysRevE.51.4282
[2] Okazaki, S., Matsushita, S.: A study of simulation model for pedestrian movementwith evacuation and queuing. In: Smith, R.A., Dickie, J.F. (eds.) International Con-ference on Engineering for Crowd Safety, pp. 271–280 (1993)
[3] Chraibi, M., Seyfried, A., Schadschneider, A.: Generalized centrifugal-force modelfor pedestrian dynamics. Physical review. E, Statistical, nonlinear, and soft matterphysics 82 4 Pt 2, 046111 (2010)
[4] Blue, V., Adler, J.: Cellular automata microsimulation of bidirectional pedestrianflows. Transportation Research Record: Journal of the Transportation ResearchBoard 1678, 135–141 (1999). doi:10.3141/1678-17
[5] Bellomo, N., Gibelli, L.: Toward a mathematical theory ofbehavioral-social dynamics for pedestrian crowds 25(13), 2417–2437(2015). doi:10.1142/s0218202515400138. Exported fromhttps://app.dimensions.ai on 2019/01/25
[6] Johansson, F.: Microscopic modeling and simulation of pedestrian traffic (2013).(Unpublished Master’s thesis), Linkoping University, Sweden
[7] Seyfried, A., Steffen, B., Klingsch, W., Boltes, M.: The fundamental diagram ofpedestrian movement revisited. Journal of Statistical Mechanics: Theory and Ex-periment 2005(10), P10002 (2005)
[8] Chattaraj, U., Seyfried, A., Chakroborty, P.: Comparison of pedestrian fundamentaldiagram across cultures. Advances in Complex Systems 12(03), 393–405 (2009).doi:10.1142/S0219525909002209
[9] Cao, S., Zhang, J., Salden, D., Ma, J., Shi, C., Zhang, R.: Pedestrian dynamics insingle-file movement of crowd with different age compositions. Phys. Rev. E 94,012312 (2016). doi:10.1103/PhysRevE.94.012312
[10] Jelic, A., Appert-Rolland, C., Lemercier, S., Pettre, J.: Properties of pedestri-ans walking in line: Fundamental diagrams. Phys. Rev. E 85, 036111 (2012).doi:10.1103/PhysRevE.85.036111
[11] Muir, H.C., Bottomley, D.M., Marrison, C.: Effects of motivation andcabin configuration on emergency aircraft evacuation behavior and rates ofegress. The International Journal of Aviation Psychology 6(1), 57–77 (1996).doi:10.1207/s15327108ijap0601 4

Characteristics of Stop and Go Wave 13
[12] Nagai, R., Fukamachi, M., Nagatani, T.: Evacuation of crawlers and walkers fromcorridor through an exit. Physica A: Statistical Mechanics and its Applications367(C), 449–460 (2006)
[13] Daamen, W., Hoogendoorn, S.: Capacity of doors during evac-uation conditions. Procedia Engineering 3, 53–66 (2010).doi:10.1016/j.proeng.2010.07.007. First International Conference onEvacuation Modeling and Management
[14] Hoogendoorn, S.P., Daamen, W.: Pedestrian behavior at bottlenecks. TransportationScience 39(2), 147–159 (2005). doi:10.1287/trsc.1040.0102
[15] Duives, D., Daamen, W., Hoogendoorn, S.: Anticipation behavior up-stream of a bottleneck. Transportation Research Procedia 2, 43–50 (2014).doi:10.1016/j.trpro.2014.09.007. The Conference on Pedestrian andEvacuation Dynamics 2014 (PED 2014), 22-24 October 2014, Delft, The Nether-lands
[16] Kretz, T., Grunebohm, A., Schreckenberg, M.: Experimental study of pedestrianflow through a bottleneck. Journal of Statistical Mechanics: Theory and Experiment2006(10), P10014 (2006)
[17] Portz, A., Seyfried, A.: Analyzing stop-and-go waves by experiment and modeling.In: Peacock, R.D., Kuligowski, E.D., Averill, J.D. (eds.) Pedestrian and EvacuationDynamics, pp. 577–586. Springer US, Boston, MA (2011)
[18] Ziemer, V., Seyfried, A., Schadschneider, A.: Congestion dynamics in pedestriansingle-file motion. Springer pp. 89–96 (2016). Conference on Traffic and GranularFlow 2015
[19] Tordeux, A., Schadschneider, A.: White and relaxed noises in opti-mal velocity models for pedestrian flow with stop-and-go waves. Jour-nal of Physics A: Mathematical and Theoretical 49(18), 185101 (2016).doi:10.1088/1751-8113/49/18/185101
[20] Seyfried, A., Portz, A., Schadschneider, A.: Phase coexistence in congested statesof pedestrian dynamics. In: Bandini, S., Manzoni, S., Umeo, H., Vizzari, G. (eds.)Cellular Automata, pp. 496–505. Springer Berlin Heidelberg, Berlin, Heidelberg(2010)
[21] Kuang, H., Fan, Y., Li, X., Kong, L.: Asymmetric effect and stop-and-go waveson single-file pedestrian dynamics. Procedia Engineering 31, 1060–1065 (2012).doi:10.1016/j.proeng.2012.01.1142
[22] Tomoeda, A., Yanagisawa, D., Imamura, T., Nishinari, K.: Propagation speed of astarting wave in a queue of pedestrians. Physical review. E, Statistical, nonlinear, andsoft matter physics 86, 036113 (2012). doi:10.1103/PhysRevE.86.036113

14 H. Gayathri · S. Gulhare · A. Verma
[23] Koshi, M., Iwasaki, M., Ohkura, I.: Some findings and an overview on vehicularflow characteristics. In: Proceedings of the 8th International Symposium on Trans-portation, pp. 403–426 (1983)
[24] Gulhare, S., Verma, A., Chakroborty, P.: Comparison of pedestrian dataof single file movement collected from controlled pedestrian experiment andfrom field in mass religious gathering. Collective Dynamics 3, 1–14 (2018).doi:10.17815/CD.2018.16
[25] Virkler, M.R., Elayadath, S.: Pedestrian density characteristics and shockwaves pp.671–683 (1994). Proceedings of the Second International Symposium on HighwayCapacity. Vol. 2. Sydney, N.S.W
[26] Munigety, C.R., Vicraman, V., Mathew, T.V.: Semiautomated tool for extraction ofmicrolevel traffic data from videographic survey. Transportation Research Record2443(1), 88–95 (2014). doi:10.3141/2443-10