Characteristics of rainfall during tropical cyclone periods in
12
Nat. Hazards Earth Syst. Sci., 8, 1463–1474, 2008 www.nat-hazards-earth-syst-sci.net/8/1463/2008/ © Author(s) 2008. This work is distributed under the Creative Commons Attribution 3.0 License. Natural Hazards and Earth System Sciences Characteristics of rainfall during tropical cyclone periods in Taiwan K. K. W. Cheung 1 , L.-R. Huang 2 , and C.-S. Lee 2 1 Climate Risk Concentration of Research Excellence and Department of Physical Geography, Macquarie University, Sydney, Australia 2 Department of Atmospheric Sciences, National Taiwan University, Taiwan Received: 8 August 2008 – Revised: 18 November 2008 – Accepted: 18 November 2008 – Published: 23 December 2008 Abstract. Due to the Central Mountain Range with an el- evation up to about 4 km, the amount and distribution of rainfall in Taiwan associated with typhoons or tropical cy- clones (TCs) depends not only on the distribution of con- vection within the TCs (internal structure) and influences from monsoon-scale environmental flow, but also on the oro- graphic effect. This study analyzes the spatial and temporal characteristics of rainfall associated with 62 TC cases that af- fected Taiwan by using observations from the 371 automatic rain stations available in the period 1989–2002. It is found from the climatology maps that highly different rainfall dis- tributions occurred for TCs that approached the Taiwan area from different directions. By performing objective clustering analysis of the rainfall time series of all the rain gauges, sev- eral characteristic temporal rainfall profiles are obtained. The geographic distribution of rain gauges that possess a partic- ular temporal profile is also consistent with the possible TC track types that bring maximum rain to the Taiwan area at different times. Based on data in the 1989–2002 period, the development of a TC rainfall climatology-persistence (CLIPER) model is described. CLIPER is an optimized combination of clima- tology and persistence with different relative weighting for different forecast periods. Independent cases (other than the model development database) during 2003–2004 are used to validate the model. Objective measures like equitable threat score and bias score show that CLIPER’s skill is accept- able for practical applications for 24-h rain threshold below 100mm. However, the underestimation bias for more heavy rainfall is serious and CLIPER seems to have better perfor- mance for the northwestern Taiwan than for the other lo- cations. Future directions for improvement of the CLIPER model are discussed. Correspondence to: K. K. W. Cheung ([email protected]) 1 Introduction Impact from typhoons or tropical cyclones (TCs) is one of the major natural hazards to the coastal cities in Southeast Asia and in particular to Taiwan. According to the records of issu- ing typhoon sea and land warnings from the Central Weather Bureau (CWB) of Taiwan in the period 1961–2004, an av- erage number of nearly five TCs affected Taiwan every year and nearly two made landfall. About 74% of these TCs oc- curred during July–September. Some of the most disastrous cases include Typhoon Herb (1996), Typhoon Zeb (1998), Typhoon Billis (2000), Typhoons Toraji and Nari (2001) and Typhoon Mindulle (2004). In particular, Typhoon Nari stayed over land of Taiwan for 51 h and brought 1.051 mm of total rainfall to Taipei City. Sometimes, the difficulty in fore- casting rainfall associated with TCs was further increased by the fact that heavy rainfall was brought by monsoonal flows enhanced or modified by the TC circulation. A recent ex- ample is Typhoon Mindulle (2004) that was accompanied by strong Asian summer monsoonal southwesterlies and re- sulted in large amount of rainfall in the southwest area of Taiwan (Lee et al., 2006). Therefore, improving the skill of rainfall prediction from the short range (1–12 h) up to 3 days becomes a major target for the Taiwan local forecasters and personnel in hazard mitigation organizations such as the Na- tional Science and Technology Center for Disaster Reduction (NCDR). Although understanding and predicting the physical pro- cesses when a TC makes landfall (including precipitation) has become the focus of some major research programs such as the “Hurricane Landfall” project in the US Weather Research Program (Elsberry, 2005), it is generally recog- nized that the progress in improving TC intensity forecast and quantitative precipitation forecast has been slow. Re- cent studies indicated that some high-resolution (as fine as ∼2 km) dynamical model simulations were capable of cap- turing roughly the rainfall pattern for scales as small as the Published by Copernicus Publications on behalf of the European Geosciences Union.
Transcript of Characteristics of rainfall during tropical cyclone periods in

Nat. Hazards Earth Syst. Sci., 8, 1463–1474, 2008www.nat-hazards-earth-syst-sci.net/8/1463/2008/© Author(s) 2008. This work is distributed underthe Creative Commons Attribution 3.0 License.
Natural Hazardsand Earth
System Sciences
Characteristics of rainfall during tropical cyclone periods in Taiwan
K. K. W. Cheung1, L.-R. Huang2, and C.-S. Lee2
1Climate Risk Concentration of Research Excellence and Department of Physical Geography, Macquarie University,Sydney, Australia2Department of Atmospheric Sciences, National Taiwan University, Taiwan
Received: 8 August 2008 – Revised: 18 November 2008 – Accepted: 18 November 2008 – Published: 23 December 2008
Abstract. Due to the Central Mountain Range with an el-evation up to about 4 km, the amount and distribution ofrainfall in Taiwan associated with typhoons or tropical cy-clones (TCs) depends not only on the distribution of con-vection within the TCs (internal structure) and influencesfrom monsoon-scale environmental flow, but also on the oro-graphic effect. This study analyzes the spatial and temporalcharacteristics of rainfall associated with 62 TC cases that af-fected Taiwan by using observations from the 371 automaticrain stations available in the period 1989–2002. It is foundfrom the climatology maps that highly different rainfall dis-tributions occurred for TCs that approached the Taiwan areafrom different directions. By performing objective clusteringanalysis of the rainfall time series of all the rain gauges, sev-eral characteristic temporal rainfall profiles are obtained. Thegeographic distribution of rain gauges that possess a partic-ular temporal profile is also consistent with the possible TCtrack types that bring maximum rain to the Taiwan area atdifferent times.
Based on data in the 1989–2002 period, the developmentof a TC rainfall climatology-persistence (CLIPER) model isdescribed. CLIPER is an optimized combination of clima-tology and persistence with different relative weighting fordifferent forecast periods. Independent cases (other than themodel development database) during 2003–2004 are used tovalidate the model. Objective measures like equitable threatscore and bias score show that CLIPER’s skill is accept-able for practical applications for 24-h rain threshold below100 mm. However, the underestimation bias for more heavyrainfall is serious and CLIPER seems to have better perfor-mance for the northwestern Taiwan than for the other lo-cations. Future directions for improvement of the CLIPERmodel are discussed.
Correspondence to:K. K. W. Cheung([email protected])
1 Introduction
Impact from typhoons or tropical cyclones (TCs) is one of themajor natural hazards to the coastal cities in Southeast Asiaand in particular to Taiwan. According to the records of issu-ing typhoon sea and land warnings from the Central WeatherBureau (CWB) of Taiwan in the period 1961–2004, an av-erage number of nearly five TCs affected Taiwan every yearand nearly two made landfall. About 74% of these TCs oc-curred during July–September. Some of the most disastrouscases include Typhoon Herb (1996), Typhoon Zeb (1998),Typhoon Billis (2000), Typhoons Toraji and Nari (2001)and Typhoon Mindulle (2004). In particular, Typhoon Naristayed over land of Taiwan for 51 h and brought 1.051 mm oftotal rainfall to Taipei City. Sometimes, the difficulty in fore-casting rainfall associated with TCs was further increased bythe fact that heavy rainfall was brought by monsoonal flowsenhanced or modified by the TC circulation. A recent ex-ample is Typhoon Mindulle (2004) that was accompaniedby strong Asian summer monsoonal southwesterlies and re-sulted in large amount of rainfall in the southwest area ofTaiwan (Lee et al., 2006). Therefore, improving the skill ofrainfall prediction from the short range (1–12 h) up to 3 daysbecomes a major target for the Taiwan local forecasters andpersonnel in hazard mitigation organizations such as the Na-tional Science and Technology Center for Disaster Reduction(NCDR).
Although understanding and predicting the physical pro-cesses when a TC makes landfall (including precipitation)has become the focus of some major research programssuch as the “Hurricane Landfall” project in the US WeatherResearch Program (Elsberry, 2005), it is generally recog-nized that the progress in improving TC intensity forecastand quantitative precipitation forecast has been slow. Re-cent studies indicated that some high-resolution (as fine as∼2 km) dynamical model simulations were capable of cap-turing roughly the rainfall pattern for scales as small as the
Published by Copernicus Publications on behalf of the European Geosciences Union.

1464 K. K. W. Cheung et al.: Tropical cyclone rainfall characteristics in Taiwan
Taiwan island (e.g., Wu et al., 2002; Chiao and Lin, 2003).However, the maximum accumulated rainfall was sometimesnot well simulated and the skill of forecasts varied from timeto time, which reduced greatly the value of these numericalproducts in hazard mitigation applications. Before the skillof dynamical models is improved to an acceptable level foroperational applications, forecasters usually rely on variousstatistical models for rainfall estimation and issuing warn-ings. The fact that the distributions of convection and rain-fall in TCs have certain characteristic patterns both whenthey are over open oceans (Lonfat et al., 2004) and whenmaking landfall (Chan et al., 2004) allows the applicationof statistical descriptions and predictions based on climatol-ogy. For instance, Lonfat et al. (2004) found from microwaveimageries that generally the maximum rainfall of a TC is lo-cated in the front quadrants (relative to storm motion), andthis location shifts from the front-left quadrant for weakerTCs to the front-right quadrant for stronger TCs. Based onsatellite and radar observations of four TCs that made land-fall along the south China coast in 1999, Chan et al. (2004)also found that stronger convection generally appeared in thefront and then the left quadrant of a TC but vertical windshear might influence the distribution of convection (Cor-bosiero and Molinari, 2002). The purpose of this study isto provide a detailed statistical analysis of the characteristicsof TC-related rainfall in the Taiwan area and illustrate theskill level of a simple climatology-based statistical model forTC rainfall prediction.
The organization of this paper is as follows. In order tounderstand how the typhoon-related rainfall climatology isestablished, Sect. 2 first gives a brief description of the dataused and the quality control processes. Section 3 providesstatistical analyses of the spatial and temporal rainfall char-acteristics as well as some special rainfall patterns in whichthe East Asian monsoon system plays an important role. Sec-tion 4 describes the establishment of a statistical model forTC rainfall prediction based on climatology and persistence,and provides evaluation of the model forecast. The study isconcluded with a summary and discussion in Sect. 5.
2 Data
Before 1989, the rainfall distribution in Taiwan was mea-sured mainly by the 22 traditional weather stations over theisland (Yeh, 2002). Although data from some of these sta-tions have been available long enough (e.g., since the 1950’s)for climate studies, extreme rainfall cannot be well capturedby the coarse-resolution network. By 1989, the automaticrain gauge network was completed that made the total num-ber of rain stations to be 371 including several off-coast is-land stations (Fig. 1), and the number keeps increasing inrecent years. As can be seen in the figure, the rain stationsare quite uniformly distributed in the plain area but are lessdense in the Central Mountain Range (CMR). However, tor-
3000 m 2500 m 2000 m 1500 m 1000 m 500 m 200 m 0 m
Fig. 1 Locations of the 371 rainfall stations in Taiwan. The contours mark topography with
heights 1 km and 2 km respectively.
27
Fig. 1. Locations of the 371 rainfall stations in Taiwan. The con-tours mark topography with heights 1 km and 2 km respectively.
rential rains occur over the CMR are frequently enhanced byorographic lifting. When such an effect is present, the rainamount is often very high and its distribution also greatly af-fected by topography. Thus the rain stations at the mountainarea are important to capture the peak rain rate. Data fromthese 371 rain stations are updated every ten minutes and theyare sent automatically through a radio wireless network intothe CWB.
Sometimes, rain gauges have malfunction periods that in-dicate simply a zero reading. Therefore, a quality controlprocedure is carried out for all rain data used in the study.The temporal rain profiles of all the rain stations during TCperiods are examined. When some unusual periods of zerorain are encountered, data from other stations in the vicin-ity are checked. If the accumulated rain of the problematicstation is still similar to the nearby stations (i.e., data is onlymissing in a short period), then the data during the periodwith zero reading is replaced manually with data from thenearest station after scaling by the ratio of accumulated rainsof those two stations in the entire TC period. Otherwise,if the accumulated rain of the problematic station is zero orvery low, the station in that particular TC period is treated asmissing data. Note also that in this quality control procedure,
Nat. Hazards Earth Syst. Sci., 8, 1463–1474, 2008 www.nat-hazards-earth-syst-sci.net/8/1463/2008/

K. K. W. Cheung et al.: Tropical cyclone rainfall characteristics in Taiwan 1465
care is taken to compare data from stations at different alti-tudes because orographic effect sometimes generates rain ina mountainous area but not in a nearby plain area.
3 Characteristics of TC-related rainfall in Taiwan
3.1 Tropical cyclone tracks
Except for a few tropical storms that brought little rain to theTaiwan area, 61 TCs during 1989–2002 are considered in thisstudy. The tracks of TCs that affected the Taiwan area canroughly be divided into two categories: east-west (E-W) ori-ented and south-north (S-N) oriented. The E-W tracks con-sist of 34 TCs during 1989–2002 that formed in the monsoontrough region east of the Philippines or central North Pacificand then migrated westward (Fig. 2a). Nearly half of theseTCs made landfall to the Taiwan main island. A peculiar caseis Typhoon Nat (1991) that made landfall at the southern tipof Taiwan and entered the South China Sea (SCS). However,after a looping path it re-intensified and moved northwardagain. The CWB issued two separate warning periods forNat, and it is also treated as two separate cases when its rain-fall is analyzed in this study (and hence the total number ofcases is 62, see Table 1). On the other hand, the S-N casesconsist of 27 TCs in the same period that formed in eitherthe western North Pacific (WNP) or SCS, and then migratednorthward (Fig. 2b). There is also an exceptional case in thiscategory. Typhoon Nari (2001) formed at about 400–500 kmnortheast of Taiwan, moved southwestward and then madelandfall at northern Taiwan, which is the only case with asouthward component of movement in the period.
3.2 Spatial characteristics
The spatial characteristics of TC rainfall is studied by firstsetting up climatology based on the 62 TC cases. The do-main used for study is 118◦–126◦ E, 18◦–27◦ N, with gridsize 0.5◦×0.5◦ latitude/longitude. When one of the 62 TCtracks passes through one of the grids in the domain (basedon hourly positions interpolated from the best tracks), therainfall data of the 371 rain gauges are recorded. Thusafter examining all 62 TC cases, statistics on the average,maximum and minimum rainfall, standard deviation and thenumber of TCs ever passed through each grid box and foreach rain gauge are obtained. In other words, for eachrain gauge there is a map of rainfall describing the cli-matology of that particular station when a TC is situatedat different position in the domain (Fig. 3). For example,Fig. 3 indicates that Taipei station (46692) will be receiv-ing more rainfall when the TC center is located northeastof Taiwan or over land west of the CMR. In order to re-fine the rainfall map so that rainfall estimation for localizedregions in Taiwan can be provided, the climatology withinthe 0.5◦×0.5◦ latitude/longitude grid boxes are further inter-
Typhoon NatTyphoon Nat
Typhoon NariTyphoon Nari
Fig. 2 The (a) 34 east-west oriented and (b) 27 south-north oriented TC tracks during 1989−2002
in the Taiwan area. Note the special track types of Typhoons Nat (1991) and Nari (2001).
28
Typhoon NatTyphoon Nat
Typhoon NariTyphoon Nari
Fig. 2 The (a) 34 east-west oriented and (b) 27 south-north oriented TC tracks during 1989−2002
in the Taiwan area. Note the special track types of Typhoons Nat (1991) and Nari (2001).
28
Fig. 2. The(a)34 east-west oriented and(b) 27 south-north orientedTC tracks during 1989–2002 in the Taiwan area. Note the specialtrack types of Typhoons Nat (1991) and Nari (2001).
polated to 0.1◦×0.1◦ latitude/longitude grid boxes using theBarnes objective analysis (Barnes, 1973).
To obtain a simple picture of TC rainfall climatologyover Taiwan, the climatological maps within 2◦
×2◦ lati-tude/longitude grids of the original domain are averaged andthe resulting maps are placed according to the relative posi-tion of the involved TCs to the Taiwan island (Fig. 4, see alsoChang et al., 1993).
www.nat-hazards-earth-syst-sci.net/8/1463/2008/ Nat. Hazards Earth Syst. Sci., 8, 1463–1474, 2008

1466 K. K. W. Cheung et al.: Tropical cyclone rainfall characteristics in Taiwan
Table 1. List of the 62 TC cases in the rainfall climatology database.Time shown for the land warning period is local time that is 8 hahead of UTC.
Year CWB TC Number Name Land Warning Period (LTC)
1989 19 Sarah 15:00 L 8 Sep–15:20 L 13 Sep1990 03 Marian 15:40 L 18 May–14:50 L 19 May1990 05 Ofelia 21: 30L 21 Jun–04:30 L 24 Jun1990 06 Percy 04:10 L 27 Jun–15:10 L 29 Jun1990 12 Yancy 04:40 L 18 Aug–04:15 L 20 Aug1990 14 Abe 16:15 L 29 Aug–03:45 L 31 Aug1990 17 Dot 16:00 L 6 Sep–21:10 L 8 Sep1991 07 Amy 09:45 L 17 Jul–21:10 L 19 Jul1991 11 Ellie 15:15 L 16 Aug–15:45 L 18 Aug1991 20 Nat (1) 15:10 L 22 Sep–21:10 L 23 Sep1991 20 Nat (2) 15:50 L 30 Sep–06:30 L 2 Oct1991 23 Ruth 09:35 L 29 Oct–09:30 L 30 Oct1992 02 Bobbie 21:10 L 26 Jun–15:40 L 28 Jun1992 15 Omar 21:55 L 3 Sep–15:00 L 5 Sep1992 16 Polly 15:30L 27 Aug–09:40 L 31 Aug1992 19 Ted 15:20 L 20 Sep–09:30 L 23 Sep1993 11 Tasha 03:30 L 18 Aug–21:00 L 18 Aug1993 14 Yancy 09:15 L 1 Sep–09:00 L 2 Sep1993 16 Abe 15:45 L 11 Sep–21:30 L 12 Sep1994 05 Tim 15:00 L 9 Jul–15:40 L 11 Jul1994 12 Caitlin 08:30 L 3 Aug–14:30 L 4 Aug1994 13 Doug 14:30 L 6 Aug–06:15 L 9 Aug1994 15 Fred 14:40 L 19 Aug–05:50 L 22 Aug1994 16 Gladys 10:15 L 31 Aug–02:30 L 2 Sep1994 27 Seth 20:40 L 7 Oct–20:40 L 10 Oct1995 02 Deanna 05:40 L 8 Jun–14:50 L 8 Jun1995 09 Kent 03:20 L 30 Aug–05:40 L 31 Aug1995 15 Ryan 20:325 L 1 Sep–03:40 L 23 Sep1996 03 Cam 03:20 L 22 May–11:50 L 23 May1996 07 Gloria 15:15 L 24 Jul–15:30 L 27 Jul1996 08 Herb 23:20 L 29 Jul–23:20 L 1 Aug1996 18 Sally 15:10 L 7 Sep–11:45 L 8 Sep1997 14 Winnie 05:20 L 17 Aug–23:45 L 18 Aug1997 17 Amber 20:40 L 27 Aug–23:40 L 29 Aug1997 19 Cass 10:00 L 30 Aug–20:20 L 30 Aug1997 26 Ivan 20:25 L 19 Oct–17:10 L 21 Oct1998 01 Nichole 05:55 L 9 Jul–09:45 L 10 Jul1998 02 Otto 14:55 L 3 Aug–09:00 L 5 Aug1998 09 Yanni 23:30 L 27 Sep–08:55 L 29 Sep1998 10 Zeb 20:20 L 13 Oct–02:45 L 17 Oct1998 12 Babs 08:50 L 26 Oct–23:05 L 27 Oct1999 06 Maggie 08:40 L 5 Jun–20:45 L 6 Jun1999 11 Sam 20 15L 19 Aug–23:26 L 21 Aug1999 20 Dan 20:45 L 7 Oct–20:10 L 9 Oct2000 04 Kaitak 05:45 L 8 Jul–23:05 L 9 Jul2000 10 Bilis 14:45 L 21 Aug–20:05 L 23 Aug2000 12 Prapiroon 14:45 L 28 Aug–08:40 L 30 Aug2000 15 Bopha 20:40 L 8 Sep–08:40 L 10 Sep2000 19 Yagi 14:50 L 24 Oct–03:25 L 26 Oct2000 20 Xangsane 02:45 L 31 Oct–17:45 L 1 Nov2000 21 Bebinca 10:15 L 6 Nov–08:55 L 7 Nov2001 01 Cimaron 20:35 L 11 May–17:50 L 13 May2001 02 Chebi 08:10 L 22 Jun–05:35 L 24 Jun2001 04 Utor 20:30 L 3 Jul–17:10 L 5 Jul2001 05 Trami 20:15 L 10 Jul–21:00 L 11 Jul2001 08 Toraji 11:10 L 28 Jul–14:35 L 31 Jul2001 16 Nari 02:45 L 15 Sep–17:10 L 19 Sep2001 19 Lekima 14:30 L 24 Sep–09:10 L 28 Sep2001 21 Haiyan 14:25 L 15 Oct–17:30 L 16 Oct2002 05 Rammasun 14:45 L 2 Jul–17:25 L 4 Jul2002 08 Nakri 05:50 L 9 Jul–20:15 L 10 Jul2002 16 Sinlaku 05:15 L 5 Sep–05:50 L 8 Sep
It can be seen that heavy rainfall occurred at the east coastof Taiwan when TCs were located at the south (120◦–122◦ E,
Fig. 3 Computation domain and the 0.5o×0.5o latitude/longitude grid boxes used in computing
the statistics of TC rainfall during 1989−2002. The rainfall climatology map shown is for the Taipei station (46692) after a Barnes objective analysis to a fine 0.1o×0.1o latitude/longitude grid.
29
Fig. 3. Computation domain and the 0.5◦×0.5◦ latitude/longitude
grid boxes used in computing the statistics of TC rainfall during1989–2002. The rainfall climatology map shown is for the Taipeistation (46692) after a Barnes objective analysis to a fine 0.1◦
×0.1◦
latitude/longitude grid.
19◦–23◦ N) or southwest (118◦–120◦ E, 19◦–21◦ N). In thissituation, the eastern side of the CMR was under impact fromthe TC circulation and orographic lifting effect enhanced therainfall there (Lin et al., 2002). However, the CMR alsoblocked the strong easterly winds of the cyclone from thewest coast and thus less rainfall was obtained over there.When TCs made landfall and located in 120◦–122◦ E, 23◦–25◦ N, the rainfall distribution also concentrated on the east.Another situation with heavy TC rainfall was when the TCcenter located at northeast (122◦–124◦ E, 25◦–27◦ N) of Tai-wan. Large amount of rain fell on northwestern Taiwan be-cause the TC circulation impinged directly on the northernpart of the CMR and enhanced orographic lifting effect there.When the TC center was more to the west, the western side ofthe CMR also received large amount of rainfall as shown inthe panel 120◦–122◦ E, 25◦–27◦ N. Comparatively, the rain-fall amount would be much less when the TC center was atother positions relative to the Taiwan island.
3.3 Temporal characteristics
Besides the accumulated rainfall amount, the temporal pro-file is also important in understanding the characteristics ofrainfall brought by TCs. For this purpose, the hourly rain raterecorded at each of the 365 stations in Taiwan main island(i.e., the 6 off-coast island stations are neglected in this anal-ysis) during the 62 TC impacts are averaged. Since the time
Nat. Hazards Earth Syst. Sci., 8, 1463–1474, 2008 www.nat-hazards-earth-syst-sci.net/8/1463/2008/

K. K. W. Cheung et al.: Tropical cyclone rainfall characteristics in Taiwan 1467
Fig. 4 TC rainfall climatology in the Taiwan area (contours shown are hourly rain rate with
interval 2 mm h-1). Each 2o×2o latitude/longitude panel represents the distribution when the TCs are located in that panel relative to the central Taiwan map.
30
Fig. 4. TC rainfall climatology in the Taiwan area (contours shownare hourly rain rate with interval 2 mm h−1). Each 2◦×2◦ lati-tude/longitude panel represents the distribution when the TCs arelocated in that panel relative to the central Taiwan map.
period of each TC affecting Taiwan (when the CWB typhoonwarning was raised) is different, this time period and the as-sociated rain data are first normalized to 100 time units be-fore averaging. While a time unit for each of the TCs maybe different, the rain rate (mm h−1) in each time unit is cal-culated such that data from different TCs can be compared.Then the 365 rain rate time series are input to a hierarchicalclustering analysis with the correlation coefficient betweentwo time series as their distance measure. Similar clustersresult when using the single-linkage, complete-linkage or theaverage-distance-within-clusters methods of calculating dis-tances between clusters, and the final results are based onthe last one. When the correlation coefficient between twoclusters drops to about 0.6, six clusters remain that are phys-ically meaningful when considering the locations of the clus-ter members (to be discussed later). The number of membersfor the six clusters is respectively 52, 117, 5, 33, 96, and 62.
The five rain profiles (except cluster number 3) obtainedby the clustering analysis show two typical characteristictemporal patterns of TC rainfall affecting Taiwan (Fig. 5).One has heavier rainfall with the peak rain rate occurred ear-lier (cluster 4 and cluster 5). The other one has the rain rateincreasing gradually with peak rain rate occurred near theend of the TC period (clusters 1, 2 and 6). Moreover, the
0 20 40 60 80 1000.0
0.5
1.0
1.5
2.0
2.5
3.0
3.5
4.0
4.5
5.0
5.5
6.0
6.5
Rai
n R
ate
(mm
/h)
Normalized Time Period
Cluster 1 (52) Cluster 2 (117) Cluster 4 (33) Cluster 5 (96) Cluster 6 (62)
Fig. 5 Five of the six rainfall temporal series (normalized to 100 time units) obtained from a
hierarchical clustering analysis of the 365 rain gauge data during 1989−2002. Number in parentheses gives number of members in each of the clusters.
31
Fig. 5. Five of the six rainfall temporal series (normalized to 100time units) obtained from a hierarchical clustering analysis of the365 rain gauge data during 1989–2002. Number in parenthesesgives number of members in each of the clusters.
peak rain rate in the former pattern is much higher. Detailedcomparison between clusters 4 and 5 also reveals that clus-ter 4 contains another peak rain rate early in the period (ataround the 20th normalized time unit). Cluster 3 is not shownin Fig. 5 because of its small member number and its profileconsists of a single peak at the beginning of the entire timeperiod (to be explained later).
Examination of the location of the station members withineach cluster shows that they are also grouped geographically(Fig. 6). Clusters 1 and 2 account for the rainfall profiles atthe plain and lower-altitude areas west of the CMR. Cluster 3has only 5 members and they are all located at high altitudes(see topography in Fig. 1). Orographic lifting effect plays acomparatively more crucial role for the large rainfall amountrecorded in these stations than in other clusters, and thereforethese 5 members are not combined into other clusters duringthe analysis.
Clusters 4 and 5 possess similar temporal profiles, and theyrespectively account for the rainfall patterns at the east coastand northeastern part of Taiwan. Finally, members in clus-ter 6 all concentrate at the southwestern side of Taiwan. Gen-erally speaking, the temporal rainfall profiles classified ac-cording to the clustering analysis procedure are indeed con-sistent with the track types of TCs affecting Taiwan. Mostof the TCs approached Taiwan from the east (the E-W mem-bers) or from the south (the S-N members that formed in theSouth China Sea or recurved from the Philippines). Thus, theeast coast of Taiwan is often the first region to receive heavyrainfall, which explains the first peak rain rate in the profileof cluster 4. As most of the TCs in the WNP travel north-westward, those approaching the Taiwan area would bringrain to the northeastern Taiwan where the cluster-5 memberssituate. The peak rain rate for the members in clusters 1, 2
www.nat-hazards-earth-syst-sci.net/8/1463/2008/ Nat. Hazards Earth Syst. Sci., 8, 1463–1474, 2008

1468 K. K. W. Cheung et al.: Tropical cyclone rainfall characteristics in Taiwan
32
120 121 122
22
23
24
25
26
La
titud
e (o N
)
Longitude (oE)
Cluster 1 (52) Cluster 2 (117) Cluster 3 (5) Cluster 4 (33) Cluster 5 (96)
Fig. 6 Geographic locations of rain gauge members of the six clusters.
Cluster 6 (62)
6
5
43
21
Fig. 6. Geographic locations of rain gauge members of the six clus-ters.
and 6 all occur later when the landfalling TCs pass throughthe CMR of Taiwan or when the northward traveling TCsmove to higher latitudes.
3.4 Monsoon-related rainfall patterns
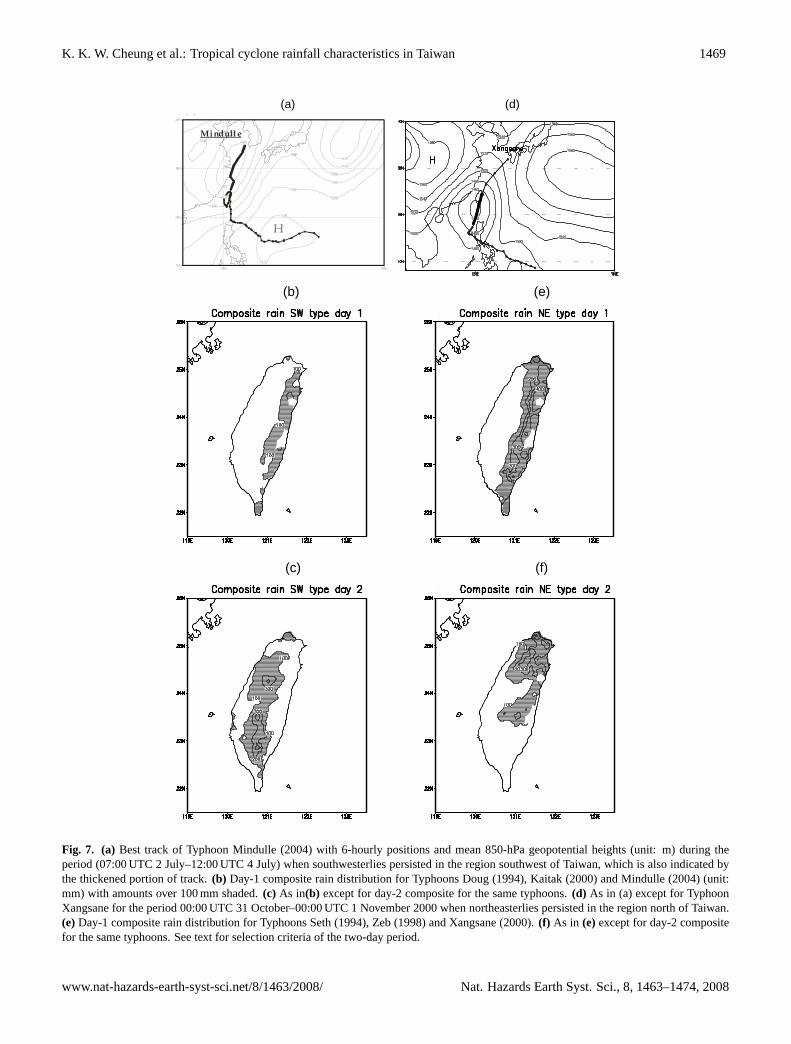
Besides the internal distribution of convection within a TCand Taiwan’s topographic influence, the rainfall pattern whena TC affects the Taiwan area is frequently modified by thelarge-scale monsoonal flow. Sometimes, the rainfall amountand distribution change dramatically that causes much fore-cast difficulty. For instance, two typical scenarios have beendiscussed widely in the Taiwan meteorological community.The first one is the warm, moist southwesterly flow dur-ing the summer monsoon period induced by TC circula-tion, which usually occurs when the TC center is north ofTaiwan. Due to the abundant moisture supply, the rainfallamount can be enhanced substantially. A well-known exam-ple that occurred recently is Typhoon Mindulle (2004) thatmade landfall at the east coat of Taiwan around 12:00 UTC1 July, stayed over land for about 30 h and then moved outto the ocean again around 06:00 UTC 2 July (Fig. 7a). Whenthe center of Mindulle was just north of Taiwan, the conver-
gence of its circulation with the monsoonal southwesterliesinduced severe convection over the southwestern part of Tai-wan and brought heavy rain there. When Mindulle movedfurther northward, its effect to the Taiwan area decreasedbut strong southwesterlies still persisted. These southwest-erlies impinged on the CMR and the orographic-lifting effectcaused more torrential rain (Lee et al., 2005). As a conse-quence, the accumulated rainfall during 2–4 July covered theentire southwestern part of Taiwan as well as some moun-tainous regions.
There were some historical cases of which torrential rainwas closely related to the enhanced southwesterlies. Exam-ples are Typhoon Ellen (1959), Agnes (1981), Doug (1994)and Kai-Tak (2000). In order to examine the characteristicrain pattern associated with these TCs, composite rain dis-tributions for the three recent cases of Doug, Kai-Tak andMindulle, which have similar track type when they passedthrough northeastern Taiwan, are calculated. The compositeperiod for each TC is determined by examining the averagelow-level (925-hPa) meridional wind component in a region(110◦–120◦ E, 10◦–20◦ N) southwest of Taiwan, and the twodays with substantial increase in wind speed is chosen. In theday-1 composite, rainfall concentrates at the eastern side ofTaiwan (Fig. 7b) that is mainly associated with the TC circu-lation. In day 2 when the TC center moves further northward,convergence of TC circulation with the southwesterlies shiftsthe rain to the other side of the CMR (Fig. 7c). Variation inthese three typhoon cases indeed exist, with Typhoon Dougcontributing more rain to northwestern Taiwan and TyphoonMindulle more to southwestern Taiwan in the day-2 compos-ite.
Another scenario occurs during the autumn when thewarm, moist TC air mass confronts the cold, dry winter mon-soonal flow that produces near frontal rainfall to the area. Arecent example is Typhoon Xangsane (2000) that was locatedwest of the Philippines at the end of October and then passedthrough the east coast of Taiwan in early November (Fig. 7d).The high pressure system in mainland China combined withXangsane’s circulation to enhance the northeasterlies in theTaiwan area especially that north of Taiwan. As for the caseswith enhanced southwesterlies, two other historical TCs areidentified with similar situation as in Typhoon Xangsane,which are Typhoon Seth (1994) and Typhoon Zeb (1998).They all satisfy the following conditions in a 2-day period:(1) a surface frontal system existed north of Taiwan that in-dicated high pressure system in mainland China, (2) strongnortheasterlies were recorded by an island station (Penchi-ayu, station code 46695 near 122.07◦ E, 25.63◦ N) north ofTaiwan, and (3) heavy daily rain (>130 mm) occurred innorthern Taiwan. Composite rain distributions are then cal-culated for these three TC cases. In the day-1 compositewhen only the TC circulation was affecting Taiwan, rainfallagain concentrates at the eastern side of the CMR (Fig. 7e).Due to the strong convergence between TC circulation andthe monsoonal northeasterlies in day 2, peak rainfall oc-
Nat. Hazards Earth Syst. Sci., 8, 1463–1474, 2008 www.nat-hazards-earth-syst-sci.net/8/1463/2008/
K. K. W. Cheung et al.: Tropical cyclone rainfall characteristics in Taiwan 1469
(a) (d)
Mindulle
H
( )
Fig. 7 (a) Best track of Typhoon Mindulle (2004) with 6-hourly positions and mean 850-hPa geopotential heights (unit: m) during the period (0700 UTC 2 July – 1200 UTC 4 July) when southwesterlies persisted in the region southwest of Taiwan, which is also indicated by the thickened portion of track. (b) Day-1 composite rain distribution for Typhoons Doug (1994), Kaitak (2000) and Mindulle (2004) (unit: mm) with amounts over 100 mm shaded. (c) As in (b) except for day-2 composite for the same typhoons. (d) As in (a) except for Typhoon Xangsane for the period 0000 UTC 31 October – 0000 UTC 1 November 2000 when northeasterlies persisted in the region north of Taiwan. (e) Day-1 composite rain distribution for Typhoons Seth (1994), Zeb (1998) and Xangsane (2000). (f) As in (e) except for day-2 composite for the same typhoons. See text for selection criteria of the two-day period.
33
(b) (e)
(c) (f)
Fig. 7 (continued)
34
Fig. 7. (a) Best track of Typhoon Mindulle (2004) with 6-hourly positions and mean 850-hPa geopotential heights (unit: m) during theperiod (07:00 UTC 2 July–12:00 UTC 4 July) when southwesterlies persisted in the region southwest of Taiwan, which is also indicated bythe thickened portion of track.(b) Day-1 composite rain distribution for Typhoons Doug (1994), Kaitak (2000) and Mindulle (2004) (unit:mm) with amounts over 100 mm shaded.(c) As in(b) except for day-2 composite for the same typhoons.(d) As in (a) except for TyphoonXangsane for the period 00:00 UTC 31 October–00:00 UTC 1 November 2000 when northeasterlies persisted in the region north of Taiwan.(e) Day-1 composite rain distribution for Typhoons Seth (1994), Zeb (1998) and Xangsane (2000).(f) As in (e) except for day-2 compositefor the same typhoons. See text for selection criteria of the two-day period.
www.nat-hazards-earth-syst-sci.net/8/1463/2008/ Nat. Hazards Earth Syst. Sci., 8, 1463–1474, 2008

1470 K. K. W. Cheung et al.: Tropical cyclone rainfall characteristics in Taiwan
Table 2. Correlation coefficient (R) with observations and root-mean-square error (RMSE) of CLIPER in three different forecast periods forthe developmental database in 1989–2002 and the independent cases in 2003–2004.
Dependent cases (1989–2002) Independent cases (2003–2004)
R RMSE R RMSE
3-h Accumulated rainfall 0.63 16.0 0.77 11.46-h Accumulated rainfall 0.61 26.9 0.68 22.224-h Accumulated rainfall 0.50 95.3 0.40 86.6
curred in northern Taiwan (Fig. 7f) that is in much contrastto the TCs interacting with the summer monsoon.
4 Climatology-persistence (CLIPER) rainfall predic-tion model
4.1 Setup of the model
The CLIPER model is a simple weighted combination ofTC rainfall climatology and persistence for estimating rain-fall in the future. The model domain is 118◦–126◦ E and19◦–27◦ N as in that shown in Fig. 3. The strategy usedto construct the rainfall climatology here is based on Leeet al. (2006) and different from that in Marks et al. (2002)that developed the R-CLIPER for Atlantic TCs. The latestversion of R-CLIPER utilizes rain estimates from the Tropi-cal Rain Measurement Mission (TRMM) Microwave Imager(TMI) and derives storm-centered mean rain rate distributionstratified for different TC intensities. This mean rain ratedistribution is azimuthally symmetrical, and when accumu-lated rain amount is computed along the forecast TC track,the rainfall distribution is also symmetrical with respect tothe track. However, when a typhoon is approaching the Tai-wan Island, its structure and convection distribution will begreatly affected by Taiwan’s topography and highly asym-metric rainfall distribution will likely occur. For example,Lee et al. (2006) showed that the features of TC rainfall inthe Taiwan area are closely locked by the topography. There-fore in developing the rainfall CLIPER model for the Taiwanarea, the actual climatological rainfall map is used. When-ever an official forecast track from the CWB is issued, itis first spatially interpolated such that hourly positions areavailable. Then the rainfall database for each of the 365main-island stations is looked up in turn to obtain the cli-matology value for a particular TC center position. Whenthis rain amount is accumulated along the forecast TC track,the rain distribution within a certain forecast period (i.e., theclimatology component of the CLIPER) is obtained.
Next the persistence component of the CLIPER is deter-mined. Various tests based on maximizing the pattern cor-relation (correlation coefficient computed for all stations)between CLIPER forecast rain and observed value on the
persistence duration indicate that a 3-h period is optimalto project a reasonable short-range rainfall estimate. Sinceconvective timescale is sometimes as short as an order of2–3 h, application of a longer persistence amount even de-grades some of the forecasts. Thus the 3-h persistence dura-tion is applied to all of the 365 main-island rain stations (i.e.,persistence is average rain in the 3 h before initial forecasttime). Then experiments are performed to determine the rel-ative contributions from climatology and persistence in thefinal rainfall prediction. Evaluation is again based on pat-tern correlation in 3-h periods up to 24 h. It is found thatthe optimal pattern correlation is realized when the ratio ofclimatology to persistence is 4/6 (7/3) in the 0–3-h (3–6-h)time period, and then only climatology is used after 6 h. Thatis, the CLIPER model can be stated mathematically asα ×
climatology+(1−α)× persistence, in whichα=0.4 (α=0.7) inthe 0–3-h (3–6-h) forecast period andα equals to one other-wise.
4.2 Performance
Verification of CLIPER is performed using forecasts with ini-tial times 6 h apart to ensure independency of cases. Withinthe model database that consists of cases in 1989–2002, cor-relation coefficient (R) between CLIPER’s forecasts (usingthe official CWB forecast tracks) and observations at allthe 365 rain gauges ranges from 0.63 for 3-h accumulatedrainfall to 0.5 for 24-h period (Table 2). The correspond-ing root-mean-square error (RMSE) ranges from 16.0 mm to95.3 mm, indicating that the simple combination of clima-tology and persistence does provide reasonable estimates ofrainfall pattern and amount in the short range. The verifica-tion for the independent cases in 2003–2004 actually indi-cates slightly higher correlation coefficient in the short range(0.77 for 3-h and 0.68 for 6-h forecasts) and lower RMSEfor all time periods (11.4 mm for 3-h and 86.6 mm for 24-hforecasts).
Equitable threat score (ETS) is often used to evaluate rainprediction skill that measures the number of forecasts (loca-tions) that match the observed threshold amount (Tuleya etal., 2007). ETS can be written as
ETS=(H−Hrandom)/(F + O−H−Hrandom) (1)
Nat. Hazards Earth Syst. Sci., 8, 1463–1474, 2008 www.nat-hazards-earth-syst-sci.net/8/1463/2008/

K. K. W. Cheung et al.: Tropical cyclone rainfall characteristics in Taiwan 1471
where F and O are the numbers of forecasts and observationssatisfying the threshold criteria, H is the number of forecasts(locations) that successfully meets the same criteria as theobservation. Hrandom[=F×O/(F+O)] is an “equitable” mea-sure that accounts for the random chance that both forecastand observed meet the criteria. It can be seen that for a per-fect forecast, F=O=H and ETS is equal to one. In addition,the bias score (BS) is simply defined as the ratio of F to Othat indicates the degree of underestimation/overestimation.BS is equal to one for no-bias forecast.
ETS is computed to examine the ability of CLIPER topredict rainfall of a certain amount. Four rain thresholds of50 mm, 130 mm, 200 mm and 350 mm in 24 h are consideredaccording to the definition of different categories of heavyrainfall in the CWB. There are various ways of calculatingthe ETS in a certain area. If all the 365 rain stations areconsidered as independent cases in counting the values of F,O and H for calculating the ETS of 24-h forecast (i.e., spa-tial distribution of forecast rain is considered), the values of0.22, 0.13, 0.08 and 0.04 are obtained for the above men-tioned thresholds respectively. According to the ETS results,the CLIPER developed in this research is comparable withthat of R-CLIPER for Atlantic hurricane rainfall (Marchoket al., 2006).
On the other hand, in order to examine the skill of CLIPERin different locations in Taiwan, ETS for each station is alsocomputed (i.e., no spatial distribution of forecast rain is con-sidered but forecast amount is evaluated at a particular lo-cation). Note that the number of verification cases during2003–2004 is 48, which is statistically acceptable for distri-bution estimation. The following discussions concentrate onthese station-wise ETSs computed in different forecast peri-ods.
The ETS averaged over all stations for a threshold of50 mm in 24 h is about 0.24 in the 0–6-h period and dropsgradually with increasing forecast periods (Table 3). TheETS for 24-h rainfall forecast with the same threshold isabout 0.13. These ETS values decrease substantially forhigher rainfall thresholds, indicating that CLIPER is unableto estimate the extremely heavy rainfall amount. However,these verification results are quite dependent on TC tracks. Ifthe forecast tracks are perfect (i.e., using the best tracks as in-puts to CLIPER), the ETS in the 24-h period for 50 mm/daythreshold increases to 0.22. The ETS’s in other verificationperiods also increase substantially (except for the 0–3-h and0–6-h forecasts with 50-mm threshold but the differences aresmall), indicating that good TC track forecasts are indeed es-sential for even a statistical model based on climatology likeCLIPER.
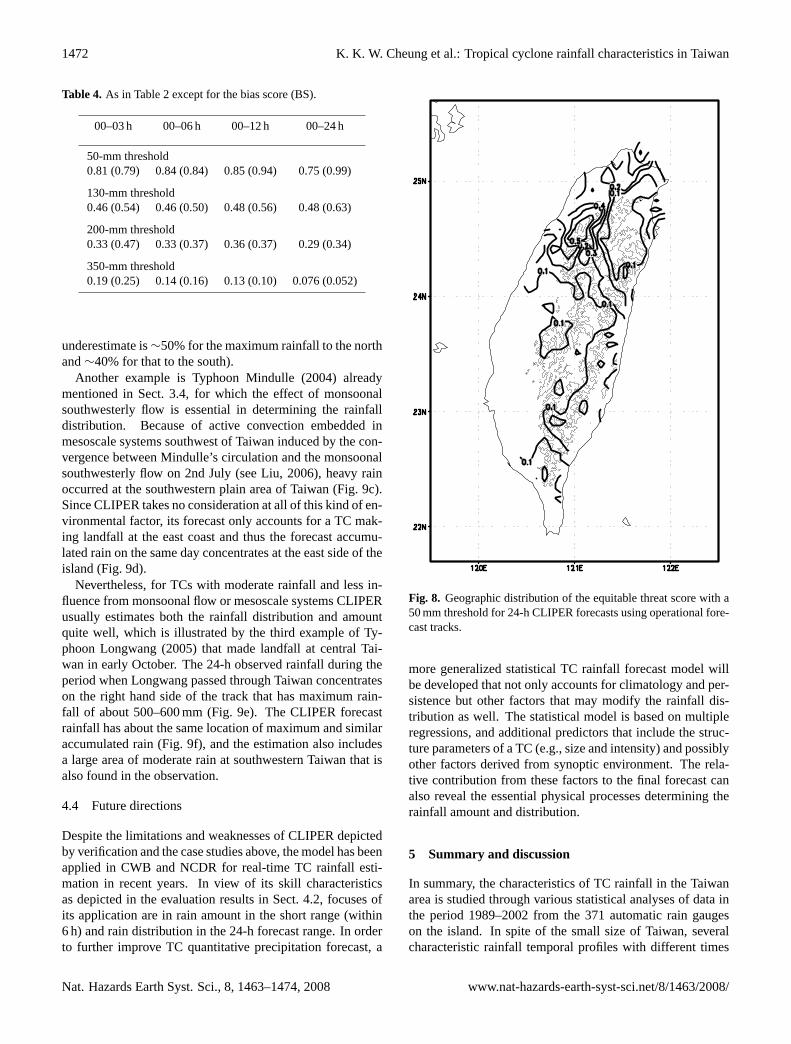
Moreover, it is also found that the ETSs for individual sta-tions have similar geographic distribution for different fore-cast periods. The scores based on forecast TC tracks fornorthwest Taiwan are consistently higher than those in southand southwestern Taiwan, and some have values as high as0.4–0.5 (Fig. 8 for 24-h forecast, those for shorter-range fore-
Table 3. Average equitable threat score (ETS) for all stations of theCLIPER model when using the operational TC forecast tracks dur-ing 2003–2004 as inputs in four different forecast periods and fourdifferent rain threshold. The value in parentheses is the correspond-ing ETS when using the best track as input to the model.
0–3 h 0–6 h 0–12 h 0–24 h
50-mm threshold0.25 (0.22) 0.24 (0.20) 0.19 (0.21) 0.13 (0.22)
130-mm threshold0.16 (0.19) 0.15 (0.16) 0.11 (0.14) 0.064 (0.12)
200-mm threshold0.12 (0.15) 0.11 (0.12) 0.068 (0.099) 0.032 (0.047)
350-mm threshold0.062 (0.10) 0.045 (0.05) 0.024 (0.029) 0.0081 (0.0035)
casts have similar distributions). While the dynamical pro-cesses affecting rainfall in the southwestern part of Taiwanare complicated (e.g., track continuity and secondary centerdue to orographic effect (Liu, 2006), influence from mon-soonal flow, etc.), this geographic distribution of ETS mayimply that the predictability of TC rainfall in different partsof Taiwan is different, and that skill in forecasting rain in thesouthwestern area is particularly low.
Examination of the BS indicates that CLIPER’s forecastshave no serious bias throughout the 24-h forecast period forrainfall threshold near or below 100 mm (Table 4) becauseBS is not far from one. However, for the extremely heavyrainfall thresholds of 200 mm and 350 mm, BS drops sub-stantially and the bias toward underestimation is obvious.Nevertheless, this model forecast bias is also due partiallyto errors in track forecast. If best track is used as input toCLIPER, the bias is corrected to a large extent especially forthe large rainfall thresholds.
4.3 Case studies
Three examples are used to illustrate the performance ofCLIPER. The first case is Typhoon Aere (2004) that pos-sessed a northwestward track in the WNP and then took awestward track when it passed by the northern part of Tai-wan on 25 August. The 24-h accumulated rainfall valid at12:00 UTC 25 August concentrated on the windward side ofthe CMR and there were two maxima: one to the north thatreceived over 1200 mm of rain and another one to the souththat received about 700 mm of rain (Fig. 9a). Because thetrack of Typhoon Aere is quite a common westward-movingTC, CLIPER is able to reproduce the location of the rainmaxima quite accurately if the best track is used as input(Fig. 9b). However, it can be seen that the forecast accu-mulated rain is much lower than that observed (percentage
www.nat-hazards-earth-syst-sci.net/8/1463/2008/ Nat. Hazards Earth Syst. Sci., 8, 1463–1474, 2008
1472 K. K. W. Cheung et al.: Tropical cyclone rainfall characteristics in Taiwan
Table 4. As in Table 2 except for the bias score (BS).
00–03 h 00–06 h 00–12 h 00–24 h
50-mm threshold0.81 (0.79) 0.84 (0.84) 0.85 (0.94) 0.75 (0.99)
130-mm threshold0.46 (0.54) 0.46 (0.50) 0.48 (0.56) 0.48 (0.63)
200-mm threshold0.33 (0.47) 0.33 (0.37) 0.36 (0.37) 0.29 (0.34)
350-mm threshold0.19 (0.25) 0.14 (0.16) 0.13 (0.10) 0.076 (0.052)
underestimate is∼50% for the maximum rainfall to the northand∼40% for that to the south).
Another example is Typhoon Mindulle (2004) alreadymentioned in Sect. 3.4, for which the effect of monsoonalsouthwesterly flow is essential in determining the rainfalldistribution. Because of active convection embedded inmesoscale systems southwest of Taiwan induced by the con-vergence between Mindulle’s circulation and the monsoonalsouthwesterly flow on 2nd July (see Liu, 2006), heavy rainoccurred at the southwestern plain area of Taiwan (Fig. 9c).Since CLIPER takes no consideration at all of this kind of en-vironmental factor, its forecast only accounts for a TC mak-ing landfall at the east coast and thus the forecast accumu-lated rain on the same day concentrates at the east side of theisland (Fig. 9d).
Nevertheless, for TCs with moderate rainfall and less in-fluence from monsoonal flow or mesoscale systems CLIPERusually estimates both the rainfall distribution and amountquite well, which is illustrated by the third example of Ty-phoon Longwang (2005) that made landfall at central Tai-wan in early October. The 24-h observed rainfall during theperiod when Longwang passed through Taiwan concentrateson the right hand side of the track that has maximum rain-fall of about 500–600 mm (Fig. 9e). The CLIPER forecastrainfall has about the same location of maximum and similaraccumulated rain (Fig. 9f), and the estimation also includesa large area of moderate rain at southwestern Taiwan that isalso found in the observation.
4.4 Future directions
Despite the limitations and weaknesses of CLIPER depictedby verification and the case studies above, the model has beenapplied in CWB and NCDR for real-time TC rainfall esti-mation in recent years. In view of its skill characteristicsas depicted in the evaluation results in Sect. 4.2, focuses ofits application are in rain amount in the short range (within6 h) and rain distribution in the 24-h forecast range. In orderto further improve TC quantitative precipitation forecast, a
Fig. 8 Geographic distribution of the equitable threat score with a 50 mm threshold for 24-h
CLIPER forecasts using operational forecast tracks.
35
Fig. 8. Geographic distribution of the equitable threat score with a50 mm threshold for 24-h CLIPER forecasts using operational fore-cast tracks.
more generalized statistical TC rainfall forecast model willbe developed that not only accounts for climatology and per-sistence but other factors that may modify the rainfall dis-tribution as well. The statistical model is based on multipleregressions, and additional predictors that include the struc-ture parameters of a TC (e.g., size and intensity) and possiblyother factors derived from synoptic environment. The rela-tive contribution from these factors to the final forecast canalso reveal the essential physical processes determining therainfall amount and distribution.
5 Summary and discussion
In summary, the characteristics of TC rainfall in the Taiwanarea is studied through various statistical analyses of data inthe period 1989–2002 from the 371 automatic rain gaugeson the island. In spite of the small size of Taiwan, severalcharacteristic rainfall temporal profiles with different times
Nat. Hazards Earth Syst. Sci., 8, 1463–1474, 2008 www.nat-hazards-earth-syst-sci.net/8/1463/2008/

K. K. W. Cheung et al.: Tropical cyclone rainfall characteristics in Taiwan 1473
(a) (b)
400 1300
600 300
(c) (d)
600 800
1000 500
Fig. 9 (a) Observed and (b) CLIPER forecast 24-h accumulated rainfall (unit: mm) for Typhoon
Aere (2004) valid at 1200 UTC 25 August. (c) and (d) As in (a) and (b) except for Typhoon Mindulle (2004) valid at 0000 UTC 2 July. (e) and (f) As in (a) and (b) except for Typhoon Longwang (2005) valid at 0300 UTC 2 Oct. The regions with maximum values are labeled.
36
(e) (f)
500 600
Fig. 9 (continued)
37
Fig. 9. (a)Observed and(b) CLIPER forecast 24-h accumulated rainfall (unit: mm) for Typhoon Aere (2004) valid at 12:00 UTC 25 August.(c) and(d) as in(a) and(b) except for Typhoon Mindulle (2004) valid at 00:00 UTC 2 July.(e) and(f) as in(a) and(b) except for TyphoonLongwang (2005) valid at 03:00 UTC 2 Oct. The regions with maximum values are labeled.
www.nat-hazards-earth-syst-sci.net/8/1463/2008/ Nat. Hazards Earth Syst. Sci., 8, 1463–1474, 2008

1474 K. K. W. Cheung et al.: Tropical cyclone rainfall characteristics in Taiwan
of occurrence of rain maximum are identified based on objec-tive clustering analysis. These temporal profiles also have aparticular geographic distribution that should be determinedby the different impact directions of the TCs.
The spatial characteristics of TC rainfall is studied by es-tablishing corresponding rainfall climatology in a grid cover-ing the Taiwan area. The average rainfall distribution whena TC center is at a particular position relative to Taiwan caneasily be extracted from this climatological database. An im-mediate application of this database is the development ofa climatology-persistence (CLIPER) TC rainfall model. Byoptimizing the correlation coefficients between forecasts andobservations, the respective weightings of climatology andpersistence are determined for forecasts up to 24 h. Verifi-cation results using independent cases in 2003–2004 showthat CLIPER can usually reproduce a reasonable rainfall dis-tribution for forecasts up to 6 h (with a correlation coeffi-cient between 0.6 and 0.7). However, calculation of equi-table threat score and bias score shows that the heavy rainfallevents (those with 24-h accumulated rainfall over 100 mm)are seriously underestimated. One of the major reasons forthis underestimation is that CLIPER takes no considerationat all of the TC structure and synoptic-scale environmentalfactors. Therefore, these factors will be taken into accountwhen developing a more generalized statistical TC rainfallmodel.
Another important factor that affects TC rainfall in the Tai-wan area is its orographic effect. Due to the CMR with ele-vation up to 3 km, the convection structure and rainfall pat-tern of all TCs approaching the area will be modified by theCMR to a certain degree. Since the orographic effect oc-curred in all historical cases, the climatology rainfall valuealready accounts for the effect partially. To further improvethe CLIPER forecast in this aspect, the model output has tobe systematically corrected according to the relative impor-tance of topography for TCs with different tracks and struc-tures. Findings of research in this direction will be reportedin a later paper.
Acknowledgements.Some of the data processing in this study wasperformed by A.-H. Wang and C.-T. Weng of the MeteorologyDivision, National Science and Technology Center for DisasterReduction, Taiwan. This research is partially supported by theNational Science Council of Taiwan under grant NSC 94-2625-Z-002-015.
Edited by: K.-T. ChangReviewed by: H.-J. Chen and another anonymous referee
References
Barnes, S. L.: Mesoscale objective analysis using weighted time-series observations, NOAA Tech. Memo., ERL NSSL-62, Na-tional Severe Storms Lab., Norman, OK, 60 pp. (NTISCOM-73-10781), 1973.
Chan, J. C. L., Liu, K. S., Ching, S. E., and Lai, E. S. T.: Asymmet-ric distribution of convection associated with tropical cyclonesmaking landfall along the South China coast, Mon. Weather Rev.,132, 2410–2420, 2004.
Chang, C. P., Yeh, T. C., and Chen, J. M.: Effects of terrain on thesurface structure of typhoons over Taiwan, Mon. Weather Rev.,121, 734–752, 1993.
Chiao, S. and Lin, Y. L.: Numerical modeling of an orographi-cally enhanced precipitation event associated with tropical stormRachel over Taiwan, Weather Forecast., 18, 325–344, 2003.
Corbosiero, K. L. and Molinari, J.: The effects of vertical windshear on the distribution of convection in tropical cyclones, Mon.Weather Rev., 130, 2110–2123, 2002.
Elsberry, R. L.: Achievement of USWRP Hurricane Landfall re-search goal, Bull. Amer. Meteor. Soc., 86, 643–645, 2005.
Lee, C. S., Lin, L. Y., Cheung, K. K. W., Chen, Y. M., and Kuo,H. C.: A study on the heavy rainfall event in Taiwan associatedwith Typhoon Mindulle (2004) and the accompanied southwest-erly flow, Proceedings of Conference on Weather Analysis andForecasting, Central Weather Bureau, Taiwan, 2005.
Lee, C. S., Huang, L. R., Shen, H. S., and Wang, S. T.: A clima-tological model for forecasting typhoon rainfall in Taiwan, Nat.Hazards, 37, 87–105, 2006.
Lin, Y. L., Ensley, D. B., and Chiao, S.: Orographic influences onrainfall and track deflection associated with the passage of a trop-ical cyclone, Mon. Weather Rev., 130, 2929–2950, 2002.
Liu, Y. C.: A study on mesoscale features associated with TyphoonMindulle (2004) when it was affecting Taiwan, M. Sc., Disser-tation, Department of Atmospheric Sciences, National TaiwanUniversity, 136 pp., 2006 (in Chinese, English abstract avail-able).
Lonfat, M., Marks Jr., F. D., and Chen, S. S.: Precipitation distri-bution in tropical cyclones using the Tropical Rainfall Measur-ing Mission (TRMM), microwave imager: A global perspective,Mon. Weather Rev., 132, 1645–1660, 2004.
Marchok, T., Rogers, R., and Tuleya, R.: New methods for eval-uating rainfall forecasts from operational models for landfallingtropical cyclones, Preprints, 27th Conference on Hurricane andTropical Meteorology, Monterey, Am. Meteorol. Soc., 9A.1,http://ams.confex.com/ams/pdfpapers/108844.pdf, 2006.
Marks, F. D., Kappler, G., and DeMaria, M.: Developmentof a tropical cyclone rainfall climatology and persistence (R-CLIPER) model, Preprints, 25th Conference Hurricane andTropical Meteorology, San Diego, Am. Meteorol. Soc., 327–328,2002.
Tuleya, R. E., DeMaria, M., and Kuligowski, R. J.: Evaluation ofGFDL and simple statistical model rainfall forecasts for US land-falling tropical storms, Weather Forecast., 22, 56–70, 2007.
Wu, C. C., Yen, T. H., Kuo, Y. H., and Wang, W.: Rainfall simu-lation associated with Typhoon Herb (1996) near Taiwan, Part I:The topographic effect, Weather Forecast., 17, 1001–1015, 2002.
Yeh, T. C.: Typhoon rainfall over Taiwan area: The empirical or-thogonal function modes and their applications on the rainfallforecasting, Terr. Atmos. Ocean. Sci., 13, 449–468, 2002.
Nat. Hazards Earth Syst. Sci., 8, 1463–1474, 2008 www.nat-hazards-earth-syst-sci.net/8/1463/2008/