Characteristics of fatal residential fires in Sweden · Characteristics of fatal residential fires...
55
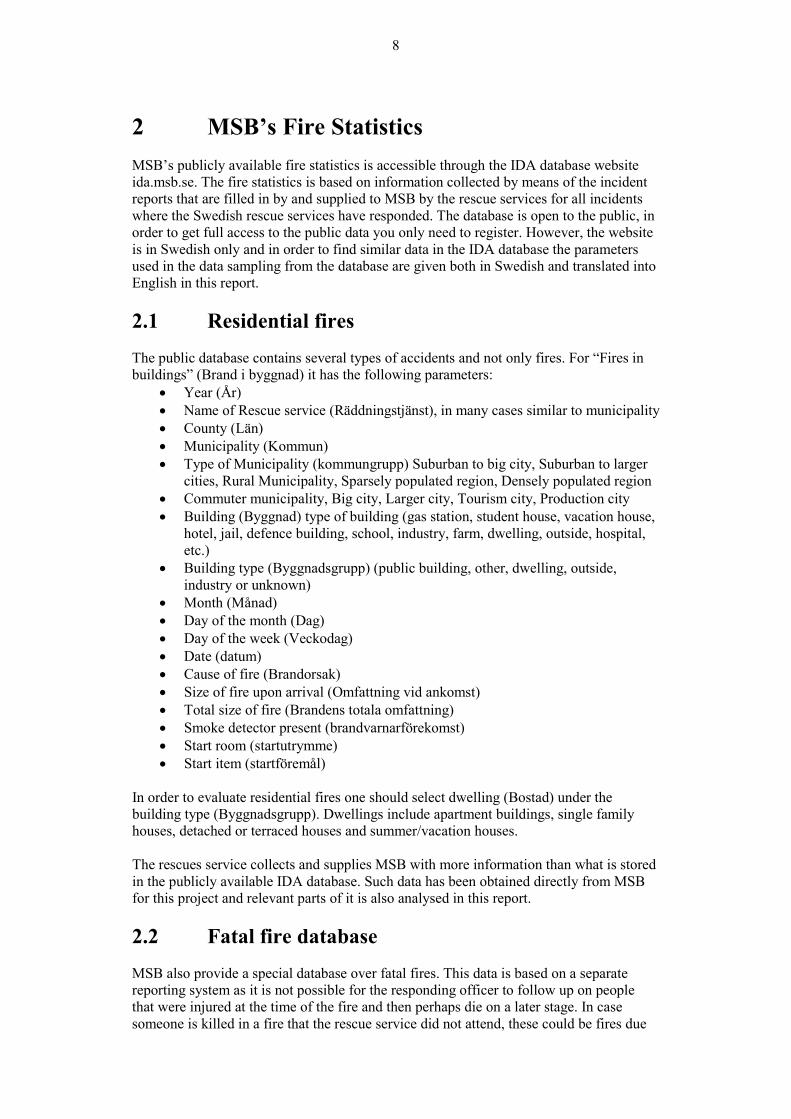
Characteristics of fatal residential fires in Sweden Petra Andersson, Nils Johansson, Michael Strömgren SP Report 2015:53 SP Technical Research Institute of Sweden
Transcript of Characteristics of fatal residential fires in Sweden · Characteristics of fatal residential fires...

Characteristics of fatal residential fires in Sweden
Petra Andersson, Nils Johansson, Michael Strömgren
SP Report 2015:53
SP
Tec
hnic
al R
esea
rch
Inst
itute
of S
wed
en
Characteristics of fatal residential fires in Sweden
Petra Andersson, Nils Johansson, Michael Strömgren

3
Abstract
Characteristics of fatal residential fires in Sweden About 90 persons die every year in Sweden as a result of residential fires. The decrease has been very limited over the last two decades despite safety measures as smoke detectors and the more recent regulations on self-extinguishing cigarettes. In order to decrease the number of fatalities it is important to find characteristics of residential fires that results in fatalities. A comparison between the characteristics of residential fires and fatal residential fires is therefore made in this work where mainly publicly available statistics is used. Further characteristics are found by the use of some additional data made accessible to the research project from the Swedish Civil Contingency Agency. The data shows that fatal residential fires are often large when the rescue service arrive involving several rooms, there is usually only one person in the fire compartment when the rescue service arrive, the fire occurs in the night/early morning and it starts often in a sofa or bed and is in many cases caused by smoking. Key words: Characteristics of Residential fires, characteristics of fatal residential fires, fire statistics SP Sveriges Tekniska Forskningsinstitut SP Technical Research Institute of Sweden SP Report 2015:53 ISBN 978-91-88001-77-1 ISSN 0284-5172 Borås 2015

4
Contents Abstract 3
Contents 4
Preface 5
Sammanfattning 6
1 Introduction 7
2 MSB’s Fire Statistics 8 2.1 Residential fires 8 2.2 Fatal fire database 8 2.3 Terminology 9
3 Residential and fatal residential fires 10 3.1 Type of dwelling 11 3.2 Type of municipality 13 3.3 Time 14 3.4 Smoke detector 16 3.5 Fire start room 16 3.6 Size of fire 18
4 Cause of fire 20 4.1 Unknown cause 22 4.1.1 Residential fires with unknown cause 22 4.1.2 Fatal residential fires with unknown cause 26 4.2 Smoking as a cause of fire 29
5 Start Item 33 5.1 Start item unknown – fatal residential fires 34 5.2 Start item unknown – residential fires in general 36
6 Building characteristics 38 6.1 Number of floors 38 6.2 Fire Compartmentation 39 6.3 Floor where fire started 41 6.4 Number of people left 42
7 Conclusions and continued studies 44
8 References 46
Appendix 1 Incident report 47
Appendix 2 Terminology used for the incident report sheet and in this report 49 Start item 49 Start room 51 Smoke detector 53 Cause of fire 53

5
Preface This report has been prepared within the project “Analys av brandsäkerhetens fysiska bestämningsfaktorer och tekniska åtgärder som stöd till nollvisionen”, a project which will identify technical parameters which have an impact on the number of fatal residential fires and find means to decrease the number of fatalities and injuries in residential fires. The project is funded by MSB which is gratefully acknowledged. In order to conduct the work MSB has provided data to the project and been very helpful in explaining parameters and layout of data. We would like to thank especially Colin McIntyre at MSB for all his help in this.

6
Sammanfattning I Sverige dör det årligen ca 90 personer i en bostadsbrand. Även om risken att omkomma i en bostadsbrand i ett längre perspektiv har minskat så har antalet omkomna varit ungefär det samma de senaste årtiondena trots insatser som rökdetektorer och mer nyligen självslocknande cigaretter. Myndigheten för samhällskydd och beredskap antog 2010 en nollvision att ingen ska skadas allvarligt eller omkomma till följd av brand i Sverige. Då de flesta som förolyckas i bränder omkommer till följd av en bostadsbrand är det av stor vikt att antalet döda i bostadsbränder minskas. Ett steg i att åstadkomma detta är den utlysning om forskningsmedel som MSB gjorde 2014. Tre projekt beviljades i denna utlysning varav ett var “Analys av brandsäkerhetens fysiska bestämningsfaktorer och tekniska åtgärder som stöd till nollvisionen” där tekniska faktorer som kan ha en påverkan på antalet döda i bostadsbränder identifieras tillsammans med potentiella lösningar. Denna rapport utgör det första steget i det projektet vari statistik används för att finna karakteristiska drag för bostadsbränder som har en dödlig utgång. Statistiken som används är MSBs allmänt tillgängliga statistik om bostadsbränder och dödsbrandsdatabasen på ida.msb.se tillsammans med allmänt statistik från SCB och, i några fall, ytterligare data som MSB har genom insatsrapporteringen som inte är allmänt tillgänglig. I rapporten görs jämförelse mellan bostadsbränder och bostadsbränder med dödlig utgång. I de flesta fall görs jämförelsen genom att studera stapeldiagram, i några fall kompletteras detta med en statistik analys genom vilken man kan bestämma huruvida skillnaden mellan bostadsbränder generellt och bostadsbränder med dödlig utgång är statistiskt signifikant. Data för vissa parametrar klassificeras ofta som okänd, särskilt vad gäller brandorsak och startföremål. Det är ändå möjligt att finna en del karakteristika. Data visar att bostadsbränder som resulterar i dödsfall ofta är stora redan när räddningstjänsten kommer till platsen och att branden då involverar mer än ett rum. Bostadsbränder med dödlig utgång kännetecknas också av att det ofta endast är en person i brandcellen när räddningstjänsten kommer till platsen. De flesta bostadsbränderna inträffar på eftermiddagen/kvällen men de bränder som har dödlig utgång inträffar i regel på natten eller mycket tidig morgon. Bränder som startar i sängen eller en soffa/fåtölj resulterar oftare i dödlig utgång jämfört med t.ex. bränder som startar på spisen. Rökning är en vanlig brandorsak för dödliga bostadsbränder.

7
1 Introduction About 90 persons die every year in Sweden as a result of a residential fire. Even if the risk of dying in a residential fire has been decreasing somewhat the past 50 years [1], the risk has now levelled out and the decrease has been very limited over the last two decades despite safety measures as smoke detectors and the more recent regulations on self-extinguishing cigarettes [2]. In recognition of this the Swedish Civil Contingency Agency (MSB) initiated a research effort in 2014 in order to investigate why the numbers are not decreasing more and what could be done to decrease the numbers. Three projects were funded in this effort. One of them was “Analys av brandsäkerhetens fysiska bestämningsfaktorer och tekniska åtgärder som stöd till nollvisionen”, a project which will identify technical parameters which have an impact on the number of fatal residential fires and find means to decrease the number of fatalities and injuries in residential fires. This work is a first step in that project. In this study technical parameters that have an impact on the number of fatal residential fires are identified. The work is based on the statistics concerning residential fires in general and fatal residential fires in particular that MSB has been made available since 1998 [3] together with data that MSB has specially provided to this project and general statistics on Sweden as published by Statistics Sweden (SCB). In order to decrease the number of fatalities in residential fires it is important to decrease in particular residential fires that lead to fatalities as determinants for residential fires and fatal residential fires are different [4]. Therefore it is important to find characteristics of residential fires that results in fatalities. A comparison between the characteristics of residential fires and fatal residential fires is therefore made. In most cases the comparison is made simply by studying diagrams comparing residential fires to fatal residential fires. In some cases, where it can be difficult to determine if the differences that might be noted are truly indicating a difference between different categories or not, the statistical method variance analysis (ANOVA) is used.
8
2 MSB’s Fire Statistics MSB’s publicly available fire statistics is accessible through the IDA database website ida.msb.se. The fire statistics is based on information collected by means of the incident reports that are filled in by and supplied to MSB by the rescue services for all incidents where the Swedish rescue services have responded. The database is open to the public, in order to get full access to the public data you only need to register. However, the website is in Swedish only and in order to find similar data in the IDA database the parameters used in the data sampling from the database are given both in Swedish and translated into English in this report. 2.1 Residential fires The public database contains several types of accidents and not only fires. For “Fires in buildings” (Brand i byggnad) it has the following parameters:
• Year (År) • Name of Rescue service (Räddningstjänst), in many cases similar to municipality • County (Län) • Municipality (Kommun) • Type of Municipality (kommungrupp) Suburban to big city, Suburban to larger
cities, Rural Municipality, Sparsely populated region, Densely populated region • Commuter municipality, Big city, Larger city, Tourism city, Production city • Building (Byggnad) type of building (gas station, student house, vacation house,
hotel, jail, defence building, school, industry, farm, dwelling, outside, hospital, etc.)
• Building type (Byggnadsgrupp) (public building, other, dwelling, outside, industry or unknown)
• Month (Månad) • Day of the month (Dag) • Day of the week (Veckodag) • Date (datum) • Cause of fire (Brandorsak) • Size of fire upon arrival (Omfattning vid ankomst) • Total size of fire (Brandens totala omfattning) • Smoke detector present (brandvarnarförekomst) • Start room (startutrymme) • Start item (startföremål)
In order to evaluate residential fires one should select dwelling (Bostad) under the building type (Byggnadsgrupp). Dwellings include apartment buildings, single family houses, detached or terraced houses and summer/vacation houses. The rescues service collects and supplies MSB with more information than what is stored in the publicly available IDA database. Such data has been obtained directly from MSB for this project and relevant parts of it is also analysed in this report. 2.2 Fatal fire database MSB also provide a special database over fatal fires. This data is based on a separate reporting system as it is not possible for the responding officer to follow up on people that were injured at the time of the fire and then perhaps die on a later stage. In case someone is killed in a fire that the rescue service did not attend, these could be fires due

9
to suicide or in remote areas without nearby neighbours that are not noticed, then these fires are also covered with this reporting system. The system is described by Jonsson et. al. [5]. The parameters reported are similar as those in the fire database, but not completely similar:
• Year (År) • County (Län) • Municipality (Kommun) • Type of Municipality (kommungrupp) Suburban to big city, Suburban to larger
cities, Rural Municipality, Sparsely populated region, Densely populated region, Commuter municipality, Big city, Larger city, Tourism city, Production city.
• Building type (Byggnadsgrupp) (public building, other, dwelling, outside, industry or unknown)
• Building (Byggnad) type of building (gas station, student house, vacation house, hotel, jail, defence building, school, industry, farm, dwelling, outside, hospital, etc.)
• Fire object (Brandobjekt) Forest, container, ship, car, etc • Cause of fire (Brandorsak) • Size of fire (Brandens omfattning) • Smoke detector presence (brandvarnarförekomst) • Gender (Kön) • Age (Åldersklass) • Month (Månad) • Day of week (Veckodag) • Time (Tid på dygnet) • Start room (startutrymme) • Start item (startföremål)
2.3 Terminology The incident reporting sheet that the rescue service use for the reporting is provided in appendix 1. The terminology used in the incident report can be ambiguous in some cases and the way of reporting or defining different situations can vary from rescue service to rescue service. Some guidance has been provided by MSB upon the introduction of the current incident report sheet. This guidance is described in Appendix 2. In this report data for fatal residential fires is compared to data for all residential fires and in that way discrepancies between recue services is evened out. The terminology in this report might not always be similar to the terminology used by e.g. NFPA in the USA as the terminology used here has been translated from the Swedish words and in recognition of the guidance given to the rescue services in order to give an indication what lies behind the words. The terminology used in the report is also discussed in appendix 2. The public database as of 2015-09-30 contains statistics for the years 1999-2014 for fatal fires and 1998-2014 for residential fires. When this work was initiated only data until 2013 was available and therefore data for 1999-2013 is used for the analyses in this report.
10
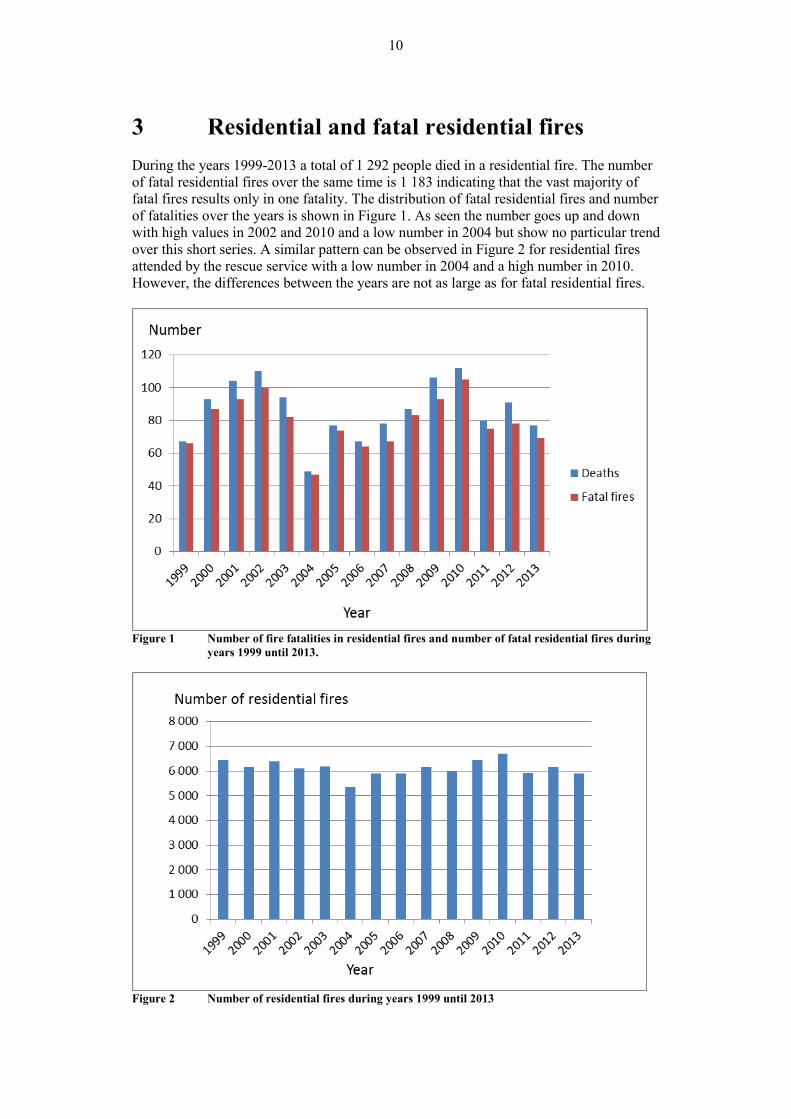
3 Residential and fatal residential fires During the years 1999-2013 a total of 1 292 people died in a residential fire. The number of fatal residential fires over the same time is 1 183 indicating that the vast majority of fatal fires results only in one fatality. The distribution of fatal residential fires and number of fatalities over the years is shown in Figure 1. As seen the number goes up and down with high values in 2002 and 2010 and a low number in 2004 but show no particular trend over this short series. A similar pattern can be observed in Figure 2 for residential fires attended by the rescue service with a low number in 2004 and a high number in 2010. However, the differences between the years are not as large as for fatal residential fires.
Figure 1 Number of fire fatalities in residential fires and number of fatal residential fires during
years 1999 until 2013.
Figure 2 Number of residential fires during years 1999 until 2013

11
.
Figure 3 Portion of residential fire that results in at least one fatality, distribution over years in 1999-2013.
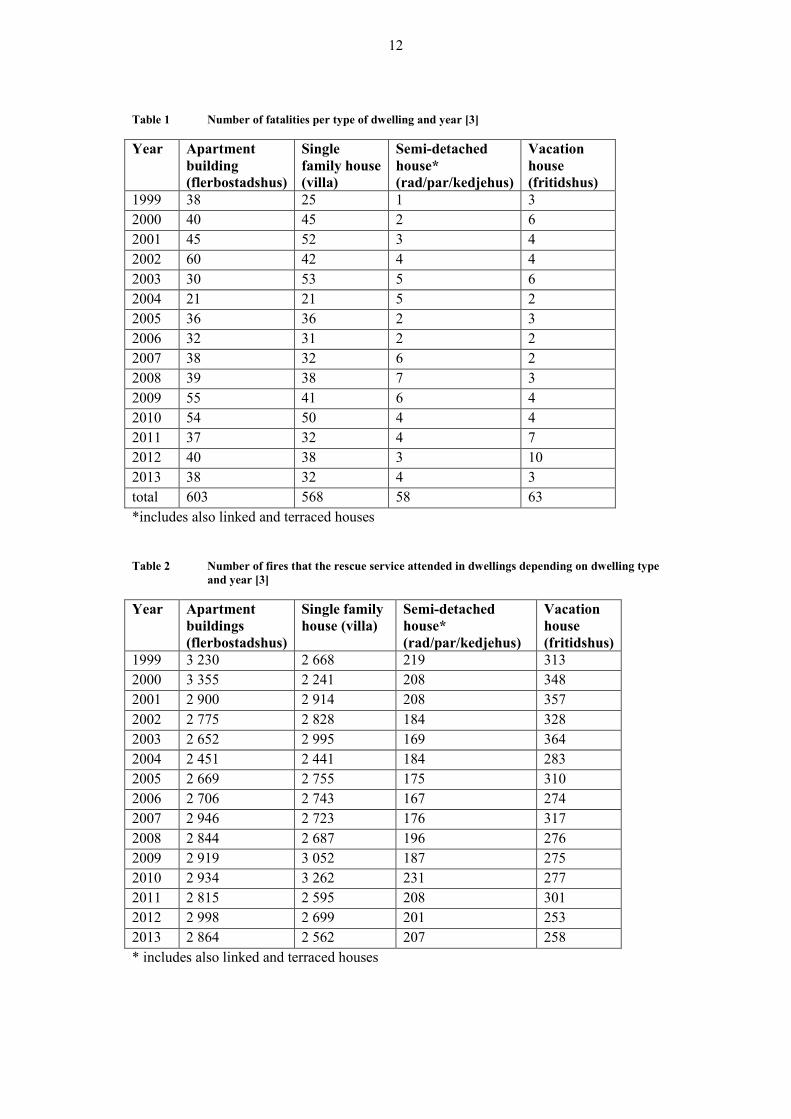
Figure 3 presents the percentage of the residential fires attended by the rescues service that result in at least one fatality. On average it is a bit more than one percent of the residential fires attended by the rescues service that results in fatalities. In order to decrease the number of fatalities in residential fires it is important to decrease the number of residential fires but in particular to decrease the type of residential fires that leads to fatalities. Therefore it is important to find characteristics of residential fires that results in fatalities. A comparison between the characteristics of residential fires and fatal residential fires is therefore made. In order to base the analysis on as much data as possible the whole time period 1999-2013 is used for the analysis. In cases where differences can be seen over time, this is also presented. 3.1 Type of dwelling The yearly number of fatal residential fires and residential fires in general per type of dwelling can be seen in Table 1 and Table 2 respectively. As seen most fatal residential fires occur in apartment buildings and single family houses while the number in Semidetached, linked and terraced houses and vacation houses is lower. The trend is similar for residential fires attended by the rescue service. According to statistics from Statistics Sweden [6] most people in Sweden lives in single family houses, closely followed by apartment buildings as seen in Table 3. By dividing the number of fatalities in a specific type of dwelling, with the number of people living in that type of dwelling, the numbers as presented in Figure 4 is obtained. From Figure 4 one can perhaps see that the number for apartment buildings is a bit higher than the number in single family houses for most years. An ANOVA analysis of the data confirms this difference. The number for semi-detached houses varies a lot but it is in general lower than the number for single family house and apartments. The large variation is due to that it is a rather unusual type of dwelling compared to the others and a small variation in number of fires will have a large impact on the numbers.
12
Table 1 Number of fatalities per type of dwelling and year [3]
Year Apartment building (flerbostadshus)
Single family house (villa)
Semi-detached house* (rad/par/kedjehus)
Vacation house (fritidshus)
1999 38 25 1 3 2000 40 45 2 6 2001 45 52 3 4 2002 60 42 4 4 2003 30 53 5 6 2004 21 21 5 2 2005 36 36 2 3 2006 32 31 2 2 2007 38 32 6 2 2008 39 38 7 3 2009 55 41 6 4 2010 54 50 4 4 2011 37 32 4 7 2012 40 38 3 10 2013 38 32 4 3 total 603 568 58 63 *includes also linked and terraced houses Table 2 Number of fires that the rescue service attended in dwellings depending on dwelling type
and year [3]
Year Apartment buildings (flerbostadshus)
Single family house (villa)
Semi-detached house* (rad/par/kedjehus)
Vacation house (fritidshus)
1999 3 230 2 668 219 313 2000 3 355 2 241 208 348 2001 2 900 2 914 208 357 2002 2 775 2 828 184 328 2003 2 652 2 995 169 364 2004 2 451 2 441 184 283 2005 2 669 2 755 175 310 2006 2 706 2 743 167 274 2007 2 946 2 723 176 317 2008 2 844 2 687 196 276 2009 2 919 3 052 187 275 2010 2 934 3 262 231 277 2011 2 815 2 595 208 301 2012 2 998 2 699 201 253 2013 2 864 2 562 207 258 * includes also linked and terraced houses

13
Table 3 Residents by type of building, % [6]
Year Apartment buildings
Single family houses
Semidetached house
1999 39.4 % 49.8 % 10 % 2000 40.6 % 48.7 % 9.5 % 2001 40.6 % 48.7 % 9.5 % 2002 40.1 % 48.6 % 10.1 % 2003 42.4 % 47 % 9.1 % 2004 41% 48.5 % 9 % 2005 40.7% 48.1 % 9.7 % 2006 39.8% 49.5 % 9.4 % 2007 39.8% 49.5 % 9.4 % 2008 42.7% 48.6 % 8.6 % 2009 43.1% 47.6 % 8.8 % 2010 43.9% 47.3v 8.4 % 2013 40.1% 53.8 %* * * The single family house number probably includes semi-detached, linked and terrace houses
Figure 4 Number of fire fatalities per 100 000 inhabitants depending on dwelling type [3, 6].
3.2 Type of municipality The statistics available in IDA has been split into different type of municipalities as listed in Table 4. Assuming that it is mainly the municipalities in the categories marked with a star in Table 4 that are densely populated, it seems that both residential fires and fatal residential fires are more common in more rural areas.

14
Table 4 Number of residential fires and fatal residential fires for different types of municipality, summary over the years 1999-2013
Type of Municipality
Number of fires
Number of inhabitants according to IDA (over the years)
Fires per 100 000 inhabitants
Number of fire fatalities
Fire fatalities per 100 000 inhabitants
Suburban to big city* 9 997 137 608 757 46 148 0.69 Suburban to larger cities* 3 113 21 572 359 67 44 0.95 Rural Municipality 3 123 4 616 899 122 46 1.80 Sparsely populated region 4 288 2 557 963 88 67 1.38 Densely populated region* 9 557 4 868 862 76 129 1.02 Commuter municipality* 7 579 12 643 257 74 97 0.95 Big city* 14 243 10 239 030 60 184 0.78 Larger city* 24 750 23 629 847 61 321 0.78 Tourism city 4 262 40 892 661 98 72 1.66 Production city 10 595 4 350 195 87 173 1.43 * Category assumed to indicate dense population 3.3 Time The number of residential fires, fire fatalities in residential fires and number of fatal residential fires in January-December respectively over the years 1999-2013 are presented in Table 5. The normalized number of residential fires and fatalities in residential fires per month is shown in Figure 5. As seen the distribution varies in a similar manner even if the curvature is more pronounced for the fatalities with a lower portion occurring in the summer time and a larger portion in December. Table 5. Number of residential fires, fire fatalities in residential fires and number of fatal fires per
month over the time period 1999-2014
Month Number of residential fires
Number of fire fatalities in residential fires
Number of fatal residential fires
January 11 343 1 293 1 184 February 8 779 154 142 March 8 484 134 126 April 7 497 124 112 May 6 938 112 100 June 6 044 100 89 July 5 652 64 60 August 5 550 57 49 September 5 656 50 49 October 6 740 82 71 November 7 341 105 97 December 11 649 122 115

15
Figure 6 shows the distribution of normalized number of residential fires and fatalities in residential fires over the week. As seen the differences are minor even if there is a larger portion of fatalities occurring towards the end of the week compared to the residential fires.
Figure 5 Distribution of normalized fatalities in residential fires and residential fires over the
year.
Figure 6 Distribution of fire fatalities and residential fires over the week
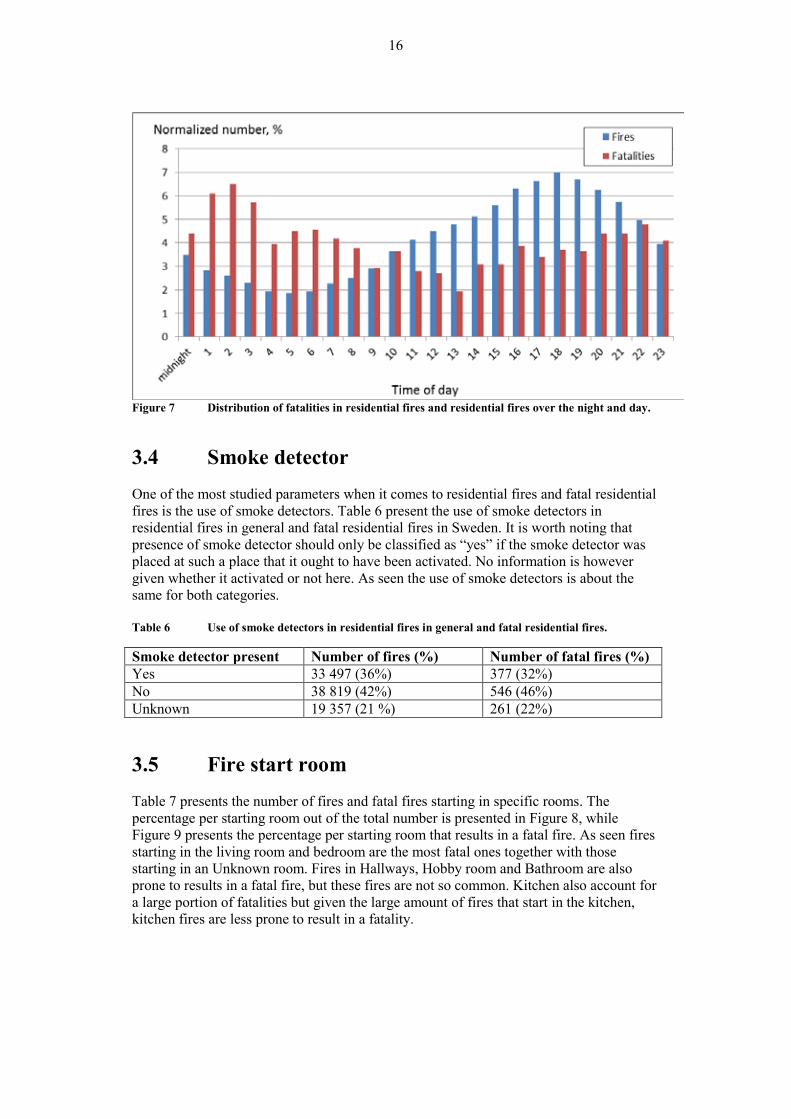
A large difference is however seen in fatalities in residential fires and residential fires for the time of the day when the fire alarm came, where the fatal residential fires peaks between 2 and 3 in the night while residential fires in general peaks between 18 and 19 hours in the evening as presented in Figure 7.
16
Figure 7 Distribution of fatalities in residential fires and residential fires over the night and day.
3.4 Smoke detector One of the most studied parameters when it comes to residential fires and fatal residential fires is the use of smoke detectors. Table 6 present the use of smoke detectors in residential fires in general and fatal residential fires in Sweden. It is worth noting that presence of smoke detector should only be classified as “yes” if the smoke detector was placed at such a place that it ought to have been activated. No information is however given whether it activated or not here. As seen the use of smoke detectors is about the same for both categories. Table 6 Use of smoke detectors in residential fires in general and fatal residential fires.
Smoke detector present Number of fires (%) Number of fatal fires (%) Yes 33 497 (36%) 377 (32%) No 38 819 (42%) 546 (46%) Unknown 19 357 (21 %) 261 (22%) 3.5 Fire start room Table 7 presents the number of fires and fatal fires starting in specific rooms. The percentage per starting room out of the total number is presented in Figure 8, while Figure 9 presents the percentage per starting room that results in a fatal fire. As seen fires starting in the living room and bedroom are the most fatal ones together with those starting in an Unknown room. Fires in Hallways, Hobby room and Bathroom are also prone to results in a fatal fire, but these fires are not so common. Kitchen also account for a large portion of fatalities but given the large amount of fires that start in the kitchen, kitchen fires are less prone to result in a fatality.

17
Table 7 Start room for fatal and residential fires in general
Start room Number of fatalities
Number of fatal fires
Number of residential fires
Living room 346 319 (27%) 7 093 (8%) Bedroom 286 263 (22%) 4 358 (5%) Unknown 254 223 (19%) 3 626 (4%) Kitchen 224 211 (18%) 24 987 (27%) Hallway 43 37 (3%) 1 728 (2%) Other 52 48 (4%) 4 048 (4%) Basement 17 16 (1%) 3 318 (4%) Heating room 15 15 (1%) 4 102 (4%) Balcony 14 13 (1%) 3 164 (3%) Bathroom/sauna 19 17 (1%) 2 112 (2%) Storage 10 9 (0.7%) 2 295 (2%) Garage 7 7 (0.6%) 1 878 (2%) Outside 5 5 (0.4%) 3 113 (3%) Chimney 1 1 (0.1%) 18 786 (19%)
Figure 8 Fire start room for fatal residential fires and residential fires presented as percentage of
total number of fatal residential and residential fires respectively

18
Figure 9 Ratio of fatal residential fire to residential fire per start room
The dwelling type for the 254 fires with unknown start room is listed in Table 8, as seen single family houses is the by far most common building with unknown start room for fatal residential fires. Table 8 Dwelling type for residetial fires with unknown start room.
Dwelling type Byggnad Number of fires Number of fatalities
Single family house Villa 163 185 Apartment building Flerbostadshus 33 37 Vacation house Fritidshus 22 26 Attached/terraced house
Rad-/par-/kedjehus 5 6
3.6 Size of fire Figure 10 shows the size of the fire when the rescues service arrives on site for residential fires and fatal residential fires. It is clearly seen that the fatal fires are rather large in most cases involving one or several rooms while residential fires in general mostly are rather small with smoke only, extinguished or confined to the start item.

19
Figure 10 Size of fire when rescues service arrives at site for fatal residential fires and residential
fires in general.

20
4 Cause of fire Most studies conducted on residential fires and fatal residential fires have been focused on the cause of the fire. The Swedish reporting system contains 19 different causes in the residential fire database as described in Appendix 2. These are to some extent a mixture of causes such as forgotten stove and ignition sources such as heat transfer and sparks. The available data on causes for fatal residential fires together with data for residential fires is provided in Table 9 with the number of fatalities, number of fatal residential fires and residential fires. The number of fatal residential fires and residential fires is also expressed as percentage of total in brackets in Table 9. For fatal fires the most common cause is Unknown followed by smoking. Deliberately lit, Other, Forgotten Stove, Lit candle, Technical malfunction and Heat transfer are of the same order of magnitude. For residential fires the most common causes are Unknown, Chimney fire and Forgotten stove followed by Deliberately lit, Other, Technical malfunction and Heat transfer. Table 9 Cause of fire for fatal residential fires and residential fires during years 1999-2013.
Fire cause Number of fatalities
Number of fatal fires (% of total)
Number of residential fire (% of total)
Swedish term Brandorsak
Translated into English
Okänd Unknown 505* 457* (39) 18635 (20) Rökning Smoking 332 317 (27) 3 325 (4) Anlagd med uppsåt
Deliberately lit 90 83 (7) 7 195 (8)
Värmeöverföring Heat transfer 82 70 (6) 6 085 (7) Glömd spis Forgotten Stove 78 69 (6) 14 503 (16) Annan Other 77 72 (6) 6 933 (8) Levande ljus Lit candle 58 54 (5) 3 317 (4) Tekniskt fel Technical
malfunction 45 39 (3) 8 313 (9)
Gnistor Sparks 10 9 (1) 1 882 (2) Barns lek med eld
Child playing with fire
9 7 (1) 990 (1)
Explosion Explosion 4 4 (0.3) 175 (0.2) Blixtnedslag Lightning 1 1 (0.1) 982 (1) Soteld Chimney fire 1 1 (0.1) 16 103 (18) Återantändning Re-ignition 1 1 (0.1) 820 (1) * includes 9 fatalities/fatal residential fires with “no information”, “cause not given”

21
Figure 11 The cause for fatal residential fires and residential fires presented as % of total number
of residential and fatal residential fires respectively.
The cause for fatal residential fires and residential fires are presented in Figure 11 as % of total number of residential and fatal residential fires respectively. The figure shows that Unknown and Smoking are common causes for fatal residential fires, while Forgotten stove and Technical malfunction seldom results in a fatal fire as compared to how often they do occur. Figure 12 shows the ratio between fatal residential fires and all residential fires for each cause. The figure shows that in particular the cause smoking is particularly fatal followed by unknown and explosion. Fires that are not very deadly include: Chimney fire, Forgotten stove, Technical malfunction, Lightning, Sparks and Re-ignition.
Figure 12 Ratio of fatal residential fires to residential fires as a function of cause
22
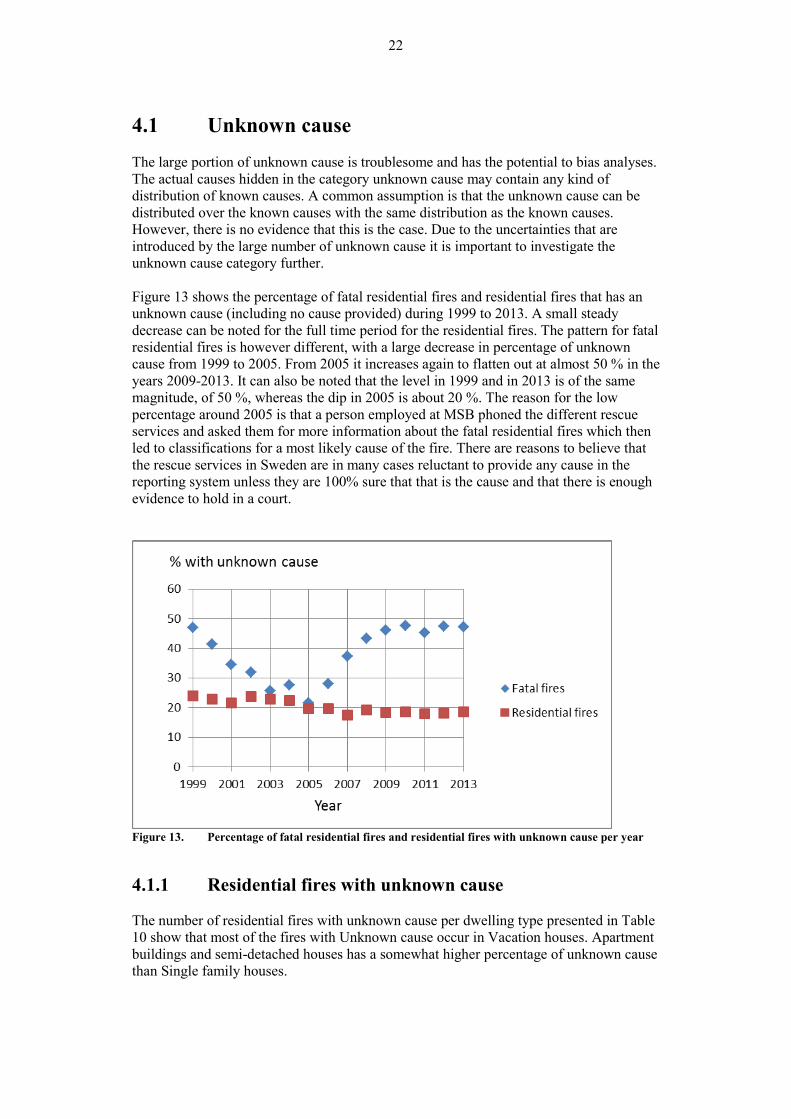
4.1 Unknown cause The large portion of unknown cause is troublesome and has the potential to bias analyses. The actual causes hidden in the category unknown cause may contain any kind of distribution of known causes. A common assumption is that the unknown cause can be distributed over the known causes with the same distribution as the known causes. However, there is no evidence that this is the case. Due to the uncertainties that are introduced by the large number of unknown cause it is important to investigate the unknown cause category further. Figure 13 shows the percentage of fatal residential fires and residential fires that has an unknown cause (including no cause provided) during 1999 to 2013. A small steady decrease can be noted for the full time period for the residential fires. The pattern for fatal residential fires is however different, with a large decrease in percentage of unknown cause from 1999 to 2005. From 2005 it increases again to flatten out at almost 50 % in the years 2009-2013. It can also be noted that the level in 1999 and in 2013 is of the same magnitude, of 50 %, whereas the dip in 2005 is about 20 %. The reason for the low percentage around 2005 is that a person employed at MSB phoned the different rescue services and asked them for more information about the fatal residential fires which then led to classifications for a most likely cause of the fire. There are reasons to believe that the rescue services in Sweden are in many cases reluctant to provide any cause in the reporting system unless they are 100% sure that that is the cause and that there is enough evidence to hold in a court.
Figure 13. Percentage of fatal residential fires and residential fires with unknown cause per year
4.1.1 Residential fires with unknown cause The number of residential fires with unknown cause per dwelling type presented in Table 10 show that most of the fires with Unknown cause occur in Vacation houses. Apartment buildings and semi-detached houses has a somewhat higher percentage of unknown cause than Single family houses.

23
Table 10 Type of dwelling for residential fires with unknown cause
Dwelling type Number of residential fires with unknown cause
Total number of residential fires
% unknown cause
Swedish term Byggnad
English translation
Flerbostadshus Apartment building
10 107 43 043 23
Villa Single family house
7 523 41 162 18
Fritidshus Vacation house
1 776 4 531 39
Rad-/par-/kedjehus
Semi-detached house*
662 2 937 23
* includes also linked and terraced houses The majority of the fires with unknown cause are small upon rescue service arrival but the percentage of fires with unknown cause increases as the fire size increases as seen in Table 11. Table 11 Number of fires per size of residential fire
Size of fire Upon arrival – unknown cause
Upon arrival – all causes
% unknown cause
Total fire involvement – unknown cause
Only smoke 2 110 22 251 9 NA Start item 4 634 24 532 19 7400 One room 4 359 13 819 32 4938 Several rooms 4 203 7 359 57 1803 Several fire compartments
792 1 286 62 5358
Several buildings
- - - 441
Extinguished 2460 22 332 11 NA Unknown, no info
77 94 82 128
For the small fires, i.e. Only smoke, Start item and Extinguished upon arrival, it may be possible to attain more information about the fire by studying start item and start room of these fires. Figure 14- Figure 16 show the most common start rooms for fires that were categorised as Only smoke, Start item or Extinguished upon rescue service arrival. The most common start rooms for the residential fires categorized as Only smoke upon rescue service arrival , see Figure 14, are garbage room and kitchen followed by unknown. Kitchen is the most common starting room for the residential fires with unknown cause that were extinguished when the rescue service arrived as can be seen in Figure 15. Figure 16 shows fires limited to the Start item upon recue service arrival where Garbage room dominate the picture and the other nine causes are fairly evenly distributed.

24
Figure 14. The ten most common start rooms for residential fires with unknown cause that were
categorised as Only smoke at the time of rescue service arrival.
Figure 15. The eleven most common start rooms for residential fires with unknown cause that were
categorised as Extinguished at the time of rescue service arrival.

25
Figure 16 The ten most common start rooms for residential fires with unknown cause that were
categorised as Start item only at the time of rescue service arrival.
In total, Garbage room is the major starting room for small residential fires with unknown cause. Causes for fires in garbage rooms can be several including hot ashes in the garbage, other material not suitable to put in the garbage, arson, self-heating, etc. However given that the garbage room contains a lot of garbage it is not easy to determine the start item if it is piece of paper, a light bulb etc.as there is no category garbage that can be selected (there is only one category “garbage in container”) and therefore the large amount of unknowns for these fires is not so surprising. Figure 17- Figure 19 show start items for the fires with unknown cause where fire size upon rescue service arrival was classified as Only smoke, Extinguished and Start item respectively. In all three diagrams Start item Unknown and Other dominates.
Figure 17. The most common start items for residential fires with unknown cause that were
categorized as Only smoke at the time of rescue service arrival.
26
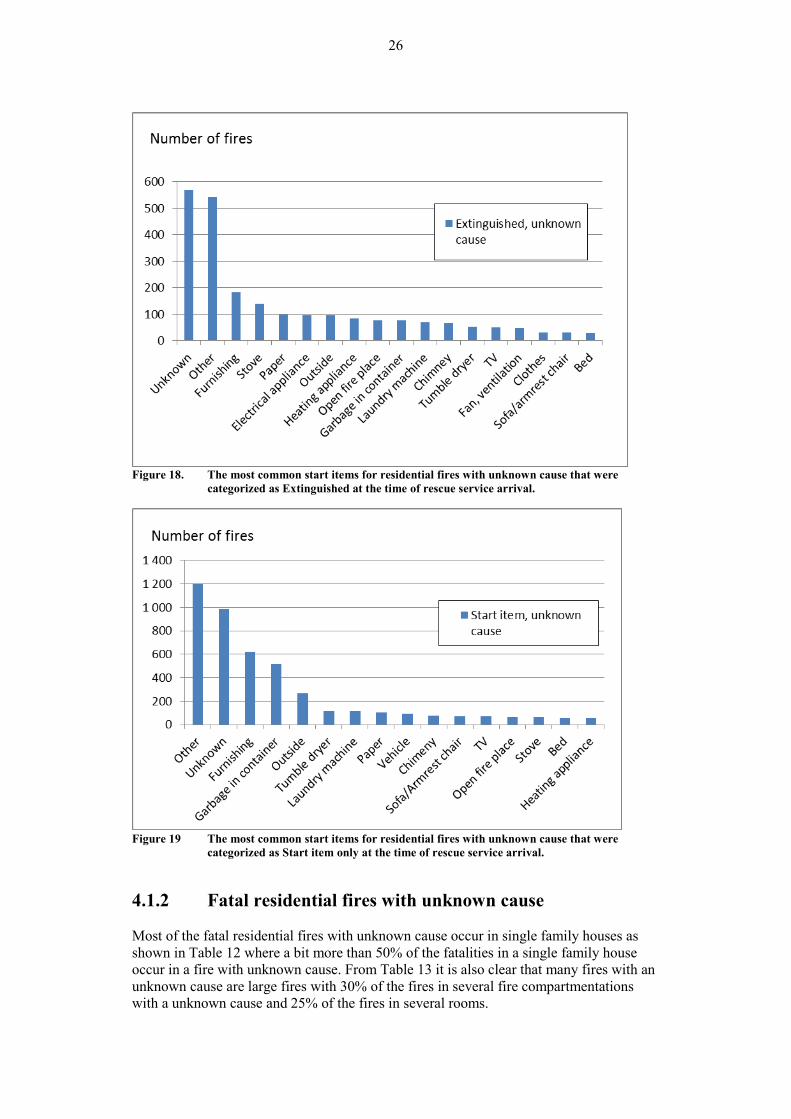
Figure 18. The most common start items for residential fires with unknown cause that were
categorized as Extinguished at the time of rescue service arrival.
Figure 19 The most common start items for residential fires with unknown cause that were
categorized as Start item only at the time of rescue service arrival.
4.1.2 Fatal residential fires with unknown cause Most of the fatal residential fires with unknown cause occur in single family houses as shown in Table 12 where a bit more than 50% of the fatalities in a single family house occur in a fire with unknown cause. From Table 13 it is also clear that many fires with an unknown cause are large fires with 30% of the fires in several fire compartmentations with a unknown cause and 25% of the fires in several rooms.

27
Table 12 Type of dwelling for fatal residential fires with unknown cause.
Dwelling type Number of fatalities with unknown fire cause, (total number)
Number of fatal residential fires with unknown fire cause
Number of residential fires, all causes
Swedish term Byggnad
English translation
Villa Single family house
291 (568) 263 41 162
Flerbostads-hus
Apartment buildings
158 (603) 147 43 043
Fritidshus Vacation house
30 (63) 25 4 531
Rad-/par-/kedjehus
Semi-detached house
18 (58) 14 2 937
Table 13 Size of fire upon arrival for fatal fires with unknown cause.
Size of fire Number of fatalities with unknown cause (total number)
Number of fatal fires Swedish term
Brandens omfattning English translation
Endast rökutveckling Only smoke 2 (28) 2 Brand i startföremål Contained to
start item 14 (270) 12
Brand i ett rum Contained to one room
70 (658) 68
Brand i flera rum In several rooms
308 (1216) 277
Brand i flera brandceller
In several fire cells
35 (112) 28
Branden släckt/slocknad
Extinguished 18 (102) 15
Okänd, Uppgift saknas
Unknown, no info
50 (198) 47
Not knowing the cause of a large fire when arriving at site, is not so strange as it is very difficult to find the cause when several rooms are on fire. The same is true for investigations conducted after the fire. However for fires of smaller size, like those which give only smoke, are confined to start item or the start room as listed in Table 13, it is possible to get an indication of what was the cause of the fire by studying the start item and start room for these fires. This is done in Table 14 for start item only, in Table 15 for one room and Table 16 for extinguished. The two fires with only smoke development started in the kitchen and in a closet, no information is available on item ignited for these fires. Start item and starting room is listed for the 12 fires that was contained to the start item in Table 14. As can be seen most of these fires are in “Furnishing”, Clothing, Bed or Sofa/armrest chair if the start item is not unknown.

28
Table 14 Start room and start item for fatal residential fires confined to the start item only with unknown cause.
Start room ( Swedish: startutrymme) Start item (Swedish: startföremål) Bath room (1 fire 2 dead) (badrum/toalett) Furnishing (Lös inredning) Hallway (Hall) Unknown (okänd) Kitchen (kök) Coffee brewer (Kaffebryggare) Kitchen Clothing (Kläder) Kitchen Unknown (okänd) Bedroom (Sovrum/sovsal) Bed (Säng) Bedroom (2 fires. 2 dead) 1 Other 1 unknown (1 Annan 1 okänd) Living room (Vardagsrum) Furnishing (Lös inredning) Living room (3 fires, 4 dead) Sofa/Armrest chair (Soffa/fåtölj) The start-item and start room for fires in one room only is listed in Table 15 and for fires with smoke only in Table 16. Also in Table 15 and Table 16 the start items Furnishing, Clothing, Sofa/armrest chair and Bed are common if not unknown. Table 15 Start-item and start room for fatal residential fires with unknown cause confined to one
room only.
Start room (fires) Start item Other (5) Other, unknown Hallway (1) Furnishing Garage (1) car Basement (3) Furnishing (1), unknown (2) Kitchen (13) Electric central (1), stove (1), heating appliance (1),
furnishing (2), unknown (8) Unknown (3) Unknown(3) Heating room (2) Unknown(2) Bedroom (16) Electric installation(1), Furnishing (3), Unknown (7),
Sofa/Armrest chair (1), Bed (3), TV (1) Laundry room (1) Tumble dryer (1) Living room (22) Furnishing(3), Unknown (9), Paper (1), Sofa/armrest
chair (6), Bed (2), TV (1) Workshop/hobby room (1) Unknown (1) Table 16 Start-item and start room for fires with unknown cause that were extinguished upon
arrival.
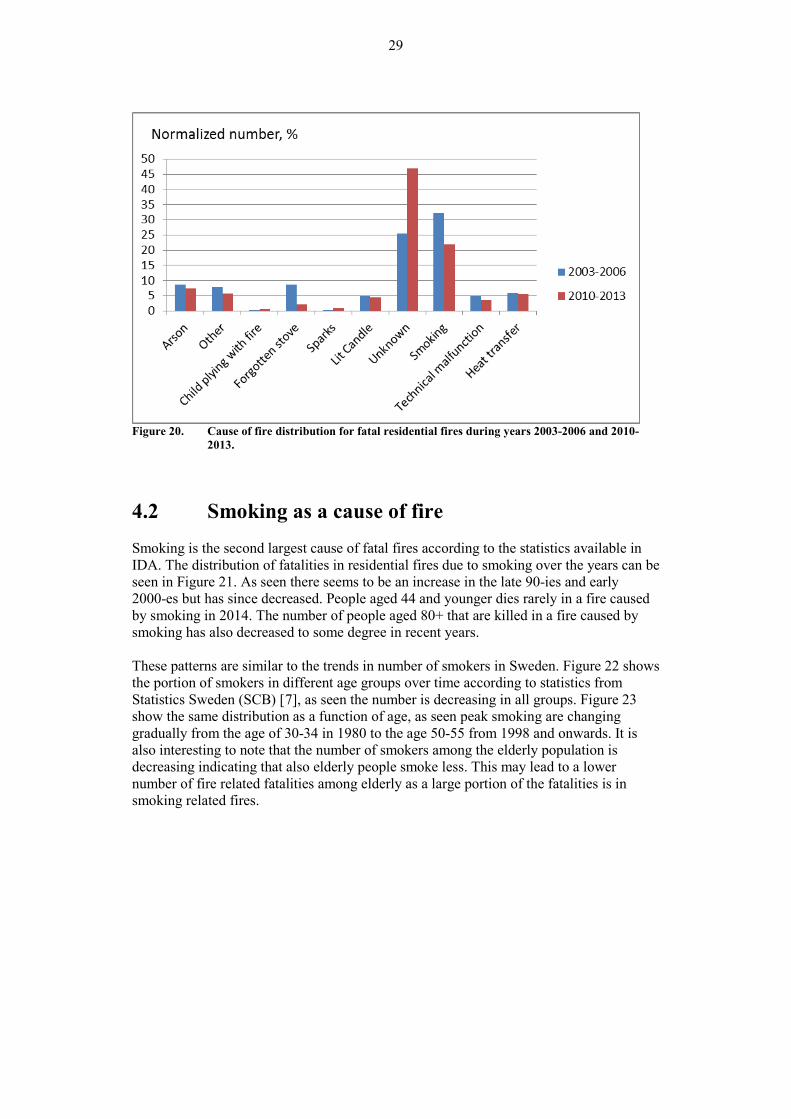
Start room (fires) Start item (fires) Hallway (1) Bed (1) Corridor (1) Furnishing (1) Kitchen (3) Furnishing (2), Unknown (1) Unknown (4 fires, 5 dead) Furnishing (1), Unknown (3 fires 4 dead) Bedroom (3) Clothing (1), Unknown (2) Living room (3 fires 5 dead) Sofa/armrest chair (2), Unknown (1 fire 3 dead) An indication of what causes might be hidden in the large unknown cause is provided in Figure 20 where the distribution of causes during years 2003-2006 is compared to the distribution during years 2010-2013. Smoking and Forgotten stove has a higher portion during the years 2003-2006 while Arson, Other and Technical malfunction shows a slightly higher portion during the years 2003-2006.
29
Figure 20. Cause of fire distribution for fatal residential fires during years 2003-2006 and 2010-
2013.
4.2 Smoking as a cause of fire Smoking is the second largest cause of fatal fires according to the statistics available in IDA. The distribution of fatalities in residential fires due to smoking over the years can be seen in Figure 21. As seen there seems to be an increase in the late 90-ies and early 2000-es but has since decreased. People aged 44 and younger dies rarely in a fire caused by smoking in 2014. The number of people aged 80+ that are killed in a fire caused by smoking has also decreased to some degree in recent years. These patterns are similar to the trends in number of smokers in Sweden. Figure 22 shows the portion of smokers in different age groups over time according to statistics from Statistics Sweden (SCB) [7], as seen the number is decreasing in all groups. Figure 23 show the same distribution as a function of age, as seen peak smoking are changing gradually from the age of 30-34 in 1980 to the age 50-55 from 1998 and onwards. It is also interesting to note that the number of smokers among the elderly population is decreasing indicating that also elderly people smoke less. This may lead to a lower number of fire related fatalities among elderly as a large portion of the fatalities is in smoking related fires.

30
Figure 21 Distribution of fire fatalities caused by smoking.
Figure 22 Number of smokers in different age groups over time in Sweden

31
Figure 23 Age-distribution of smokers
In Figure 24 the number of fire fatalities with cause smoking is plotted with the number of 100.000 persons smoking daily. A steady decline of the number of smokers can be seen where the number of daily smokers in Sweden decreases by about a third from 1999 to 2013. During the same period the number of fire fatalities in residential buildings caused by smoking appear to be decreasing of a similar magnitude. However, this does not account for possible confounders or other changes in smoking habits as only the habits of daily smokers have been measured.
Figure 24 Number of smokers and smoke related fatalities in residential fires from 1999-2014.
The data on number of smokers is based on statistics on SCB on smoking paired with SCB statistics on the population in Sweden [7]. The data on the numbers of smokers in Sweden were adjusted to fit the age groups of fire fatalities data. Due to a mismatch of categories, smokers of the age 16 and 17 are included in the population data for the group 18-24, but not for fatalities (none were recorded). Also, data for smoking for people older

32
than 84 were missing for the time period 1999-2006. An assumption was therefore made that the smoking habits of persons 80-84 were the same as smoking habits of people older than 80 in general. These assumptions may have a limited effect on the graphs and data presented. Smoke habit data is missing for the year 2007 as seen in Figure 24 and Figure 25. There was also a change in methods on how smoke habit data was collected. From 2008 and onwards surveys were done during two year time periods instead of the previous yearly measurements. This can be seen is the graphs as data for 2008 and 2009 are the same in Figure 24 for both years, e.g. they were averaged. In Figure 25 the ratio of fire fatalities with cause smoking in residential buildings and the number of thousand persons smoking daily are plotted for each age group. Variations for age groups 18-24, 25-44, 45-64 and 65-79 seem to be quite stable. The variations during the period 1999-2004 for age group 80+ is large and there is no evident explanation. It is still clear that there is a correlation between age and the risk of dying in a smoke related fire.
Figure 25 Ratio of smoke related fire fatalities in residential buildings per number of thousand
persons smoking daily during 1999-2014, shown per age group.
In order to reduce the number of fires caused by smoking many countries have adopted the use of self-extinguishing cigarettes. In Sweden and EU it came into force in November 2011 that all cigarettes sold in EU should comply with the EN16156 [8] requirements of RIP Reduced Ignition Propensity. No effect of this regulation can however be seen in the statistics yet and the benefit of the requirements have been subject to debate in many countries. The EN 16156 test is conducted on a special filter paper and the requirement is that 75% of them should self-extinguish before they have been consumed if left lying on the paper. In a recent study cigarettes fulfilling this standard were placed in the test apparatus for furniture instead of on the filter paper [9]. The study showed that the cigarette does not self-extinguish in the majority of cases when placed on upholstered furniture and could very well start a fire. The factor that has most influence of whether ignition will occur or not is not the cigarette itself but the material nearby the cigarette [9].

33
5 Start Item Another important characteristics of residential and fatal residential fires is the start item of the fire. This is reported in Table 17 and Figure 26. As seen the unknown start item is the most common start item for fatal residential fires followed by bed, furnishing and sofa. For residential fires in general the most common start item is other, stove, chimney and unknown. From Figure 27 it is obvious that fires starting in bed or sofa/armrest chair are the most fatal followed by clothing and flammable liquid. Table 17 Start item for fatal residential fires and residential fires in general
Start Item Startföremål Number of fatalities
Number of fatal residential fires (% of all fatal residential fires)
Number of residential fires (% of all residential fires)
Unknown Okänd 453 404 (34 %) 10 635 (11%) Bed Säng 178 170 (14 %) 1 014 (1%) Furnishing Lös inredning 143 134 (11%) 7 969 (8%) Sofa/armrest chair
Soffa/fåtölj 117 112 (9%) 854 (0.9%)
Other Annat 81 78 (7%) 17 540 (18%) Stove Spis 81 72 (6%) 16 654 (17%) Clothes Kläder 70 65 (5%) 701 (0.7%) Flammable liquid
Brandfarlig vätska
39 35 (3%) 650 (0.7%)
Electrical appliances
Elinstallationer och elcentral
30 27 (2%) 2 825 (3%)
Fire place Eldstad 15 15 (1%) 7 036 (7%) TV TV 15 14 (1%) 1 322 (1%) Chimney Rökkanal 4 4 (0.3%) 16 470 (17%)
Figure 26 Start item for fatal residential fires and residential fires presented as percentage of total
number of fatal residential fires and residential fires respectively
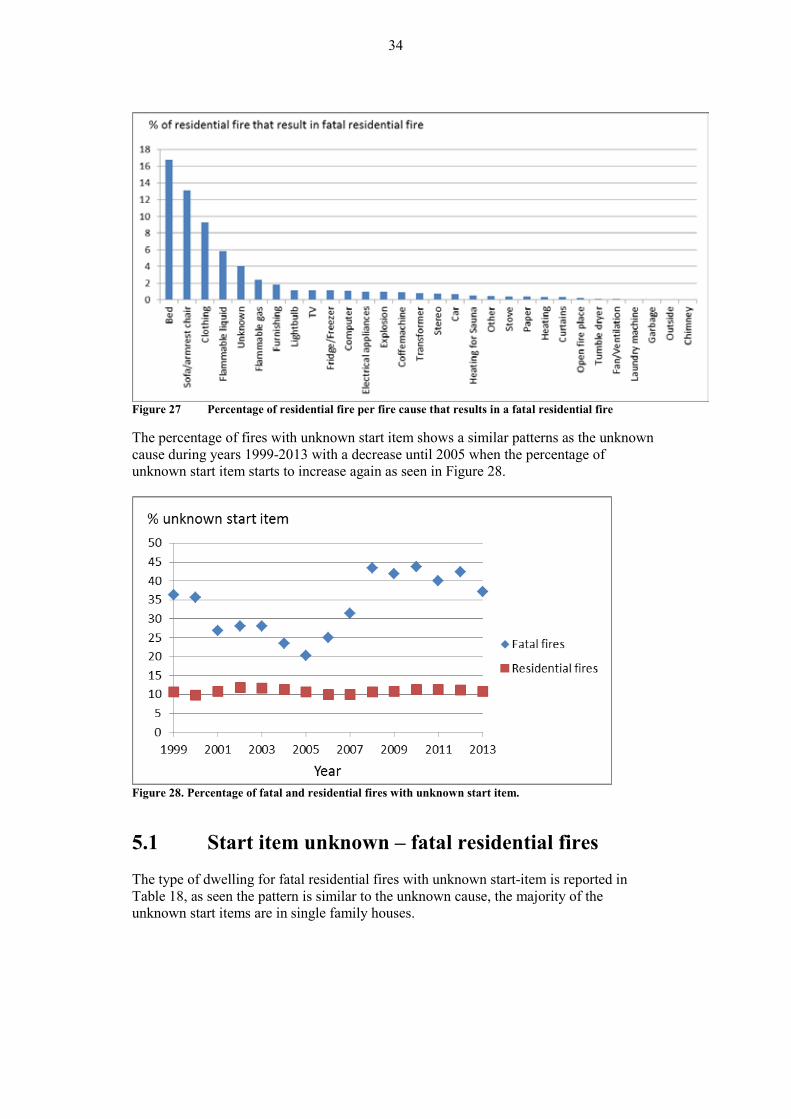
34
Figure 27 Percentage of residential fire per fire cause that results in a fatal residential fire
The percentage of fires with unknown start item shows a similar patterns as the unknown cause during years 1999-2013 with a decrease until 2005 when the percentage of unknown start item starts to increase again as seen in Figure 28.
Figure 28. Percentage of fatal and residential fires with unknown start item.
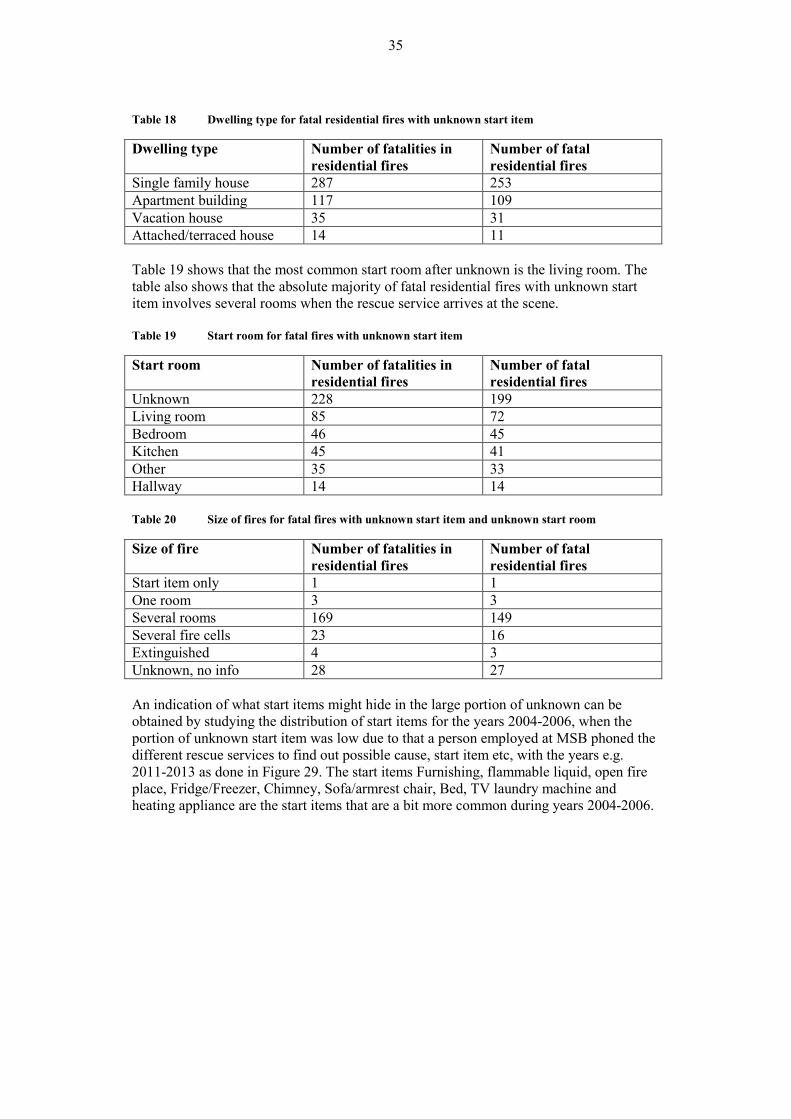
5.1 Start item unknown – fatal residential fires The type of dwelling for fatal residential fires with unknown start-item is reported in Table 18, as seen the pattern is similar to the unknown cause, the majority of the unknown start items are in single family houses.
35
Table 18 Dwelling type for fatal residential fires with unknown start item
Dwelling type Number of fatalities in residential fires
Number of fatal residential fires
Single family house 287 253 Apartment building 117 109 Vacation house 35 31 Attached/terraced house 14 11 Table 19 shows that the most common start room after unknown is the living room. The table also shows that the absolute majority of fatal residential fires with unknown start item involves several rooms when the rescue service arrives at the scene. Table 19 Start room for fatal fires with unknown start item
Start room Number of fatalities in residential fires
Number of fatal residential fires
Unknown 228 199 Living room 85 72 Bedroom 46 45 Kitchen 45 41 Other 35 33 Hallway 14 14 Table 20 Size of fires for fatal fires with unknown start item and unknown start room
Size of fire Number of fatalities in residential fires
Number of fatal residential fires
Start item only 1 1 One room 3 3 Several rooms 169 149 Several fire cells 23 16 Extinguished 4 3 Unknown, no info 28 27 An indication of what start items might hide in the large portion of unknown can be obtained by studying the distribution of start items for the years 2004-2006, when the portion of unknown start item was low due to that a person employed at MSB phoned the different rescue services to find out possible cause, start item etc, with the years e.g. 2011-2013 as done in Figure 29. The start items Furnishing, flammable liquid, open fire place, Fridge/Freezer, Chimney, Sofa/armrest chair, Bed, TV laundry machine and heating appliance are the start items that are a bit more common during years 2004-2006.

36
Figure 29. Comparison of start item of years with low portion of unknown start item with years
with high portion of unknown start item.
5.2 Start item unknown – residential fires in general Table 21 shows the dwelling type for fires with unknown start item for residential fires, as seen unknown start item is a bit more common in single family houses than in apartment buildings. The size of the fire when the rescue service arrives to an unknown start item fire is presented in Table 22. One can see that the fires is in many cases rather large involving one or several rooms already when the rescue service arrives. The residential fires with unknown start item usually starts in an unknown room, the living room, the kitchen, bedroom, other or storage as presented in Table 23. Table 21 Portion of fires with unknown start item for residential fires
Dwelling type Number of fires with unknown start item
Total number of fires
Percentage unknown
Single family house 4 951 (50 %) 41 162 12 % Apartment building 3 139 (31 %) 43 043 7 % Vacation house 1 601 (16%) 4 531 35 % Attached/terraced house
270 (3%) 2 937 9 %
Table 22 Size of fire when rescue service arrives and the end size for residential fires with
unknown start item
Size of fire Upon arrival Total size Only smoke 653 Start item 1 290 1 607 One room 2 417 2 001 Several rooms 3 992 1 057 Several fire cells 769 4 843 Several buildings 382 Extinguished 771 Unknown, no info 69 71

37
Table 23 Start room for residential fires with unknown start item
Start room Startutrymme Number of fires Unknown Okänt 3 416 Living room Vardagsrum 943 Kitchen Kök 896 Bedroom Sovrum/sovsal 726 Other Annat 577 Hallway Hall, korridor 365 Detached storage space Fristående förråd/uthus 507 Basement Källare (ej boyta) 411 Attic Vind 417 Garbage room Soprum/sopnedkast 299 Balcony Balkong/altan and
Balkong/Loftgång 339
Heating room Pannrum 202 Garage Fristående and Inbyggt
Garage and Radgarage 341
Outside Utanför byggnaden, utomhus
189
Storage space Förråd 108 Clothes space Förråd/klädkamamre 116 Stairway Trapphus/korridor,
trapphus 151

38
6 Building characteristics The publicly available data in IDA does not contain much information on different building characteristics. However, data on number of floor and which floor the fire started are recorded by the rescue service in the incident report. Other examples of data that is recorded but not publicly available is the presence of fire compartmentation and number of people left in the fire compartment when the rescue service arrived. In order to do an analysis of these data the project has been granted access to all the data for fires in dwellings stored in MSB databases from the incident reports. In the incident report the rescue services make a note of fatalities and injuries, no update is made of this initial report should a fatality occur at a later stage as in the fatal fire database as described in section 2.2. The analysis conducted here is based on the incident reports and therefore the number of fatalities and fires is somewhat different from the fatal fire database. In this analysis comparisons are made visually between the two groups "Residential fires with no fatalities / injuries" and "Residential fires with fatalities " for data from 2012 and 2013. The data is also analysed with an analysis of variance (ANOVA) in the SPSS program [10]. The general purpose of an ANOVA analysis is to test for significant differences between mean values between groups [11] in order to see if there are any statistical significant differences (p < 0.05) between the groups. 6.1 Number of floors Figure 30 shows the number of floors in the building for residential fires with no fatalities / injuries and residential fires with fatalities. The ground floor is “1”, the first floor is “2” and so forth. It is not possible to make out any difference between the two groups in Figure 31 and according to the ANOVA analysis there is no statistically significant difference between the two groups. Thus, it appears that this building parameter is not a contributing reason to that people die in fires.
Figure 30 Comparison of the number of floors in fires with no fatalities or injuries and fires with
fatalities in residential buildings.

39
The number of floors in a residential building depends on the type of dwelling. The two major groups of dwellings, apartment buildings and single-family houses (Table 2) are studied separately in Figure 31 and Figure 32. The differences between the two groups are small for both apartment building fires and single-family house fires, and no trends can be spotted.
Figure 31 Comparison of the number of floors in fires with no fatalities or injuries and fires with
fatalities in apartment buildings.
Figure 32 Comparison of the number of floors in fires with no fatalities or injuries and fires with
fatalities in single family houses.
6.2 Fire Compartmentation There are some differences in between the two groups in regard to the presence of fire compartmentation as presented in Figure 33. There are no indications that fire compartmentation plays any large role in fire fatalities, because no significant difference between the "Fires with fatalities" and "Fires with no fatalities / injuries" have been

40
noticed. (see Figure 33) It is often unknown whether any fire compartmentation existed in the more extensive fires and there is a significant difference between the "fires in several rooms / fire compartments” compared to less extensive fires (see Figure 34). This makes sense because a fire compartment would probably limit the damage if it existed. It is also notable that the building type “Single-family house” is overrepresented among the most extensive fires (see Figure 35) and it is probably due to the fact that fire compartments seldom exists in this type of building.
Figure 33 Comparison of the presence of fire compartmentation in fires with no fatalities or
injuries and fires with fatalities in residential buildings.
Figure 34 Presence of fire compartmentation in fires with no fatalities or injuries and fires with
fatalities in residential buildings.

41
Figure 35 Size of fires when the rescue service arrived for different types of dwellings.
6.3 Floor where fire started Figure 36 shows the fire start floor for residential fires with no fatalities / injuries and residential fires with fatalities. The ground floor is “1”, the first floor is “2” and so forth. It might be visually hard to determine if there is any significant difference between the two groups "Fires with fatalities" and "Fires with no fatalities / injuries" when it comes to the floor where the fires started as presented in Figure 36. However, according to the ANOVA analysis there is a significant difference between the two groups. The main differences seams to lie in that more fires with no fatalities or injuries occurs in basement levels where no apartments normally exists
Figure 36 Comparison of the floor of fire origin in fires with no fatalities or injuries and fires with
fatalities in residential buildings.

42
Since the number of floors depends on type of dwelling (section 6.1) is it also relevant to study the floor or fire origin in regard to dwelling type. The differences between the groups for apartment fires are small, but Figure 37 illustrates that deadly fires have a tendency to start higher up in the building compared to fires with no fatalities or injuries. When it comes to single-family houses it can be noted that the first floor is more common to be the floor of fire origin amongst the fatal fires. These differences are relatively small however.
Figure 37 Comparison of the floor of fire origin in fires with no fatalities or injuries and fires with
fatalities in apartment buildings.
Figure 38 Comparison of the floor of fire origin in fires with no fatalities or injuries and fires with
fatalities in single family houses.
6.4 Number of people left Based on Figure 39 it is evident that there is a difference between the two groups "Fires with fatalities" and "Fires with no fatalities / injuries" when it comes to number of people left in the fire compartment when the rescue service arrived. These differences are

43
statistically significant. It is more common that none and two or more people are left in the building for the category “Fires with no fatalities/ injuries", while one person more commonly remain in the building in the "Fires with fatalities" category.
Figure 39 Comparison of the number of people left when the rescue service arrived in fires with no
fatalities or injuries and fires with fatalities in residential buildings.

44
7 Conclusions and continued studies This report is based on publicly available data from MSB on residential fires and fatal residential fires together with public statistics from Statistics Sweden on smoking habitats and number of people living in different types of dwellings and some non-public data obtained from MSB concerning number of floors in the building, the floor the fire started on, fire compartmentation and number of people left in the building. Both the publicly available data from MSB and the non-public data is collected by MSB through the incident reporting system together with the special reporting on fatal fires. The number of “Unknowns” is high in the data, both in terms of cause, start item and starting room. However, still it is possible to identify some characteristics when comparing fatal residential fires with residential fires:
• Slightly more than 1% of the residential fires result in at least one fatality
• A fatal residential fire is often large when the rescue service arrives at the scene
• Fatal residential fires occur more commonly in the late night/early morning
• Usually only one person is present in the fire compartment when the rescue service arrives to a fatal residential fire
• There is only marginal differences regarding the presence of smoke detectors in residential fires and fatal residential fires.
• Both fatal residential fires and residential fires are less common in and around larger cities
• Fires starting in beds, sofas, armrest chairs or clothing results more often in fatalities than other start items while fires starting on the stove, in the fire place or the chimney seldom results in fatalities compared to the number of these fires.
• Fires starting in the living room or bedroom result more often in fatalities than fires starting in other rooms.
• Smoking is a common cause in fatal residential fires while lightning, forgotten stove, chimney fire, technical malfunction and re-ignition seldom results in fatalities compared to the number of this type of fires.
• The likelihood of dying in a residential fire might be somewhat higher for a person living in an apartment than for a person living in a single family house. However the differences are small and given the uncertainties in the number of people living in different types of dwellings it might be that there is no difference.
• The number of floors in a building does not seem to differ between fatal and non-fatal fires.
• The fire start floor in an apartment building seems to be slightly higher in fatal
fires than in non-fatal fires.

45
The statistics used in the study have uncertainties in that there are differences in the way different rescue services report their data and define different types of fires and start items/causes. As a comparison between residential and fatal residential fires is done throughout this report it is assumed that these differences have a smaller impact on the results. The statistics from Statistics Sweden also include uncertainties for number of people living in different types of buildings and number of smokers. This might have an impact especially on the comparison of likelihood of fatalities in apartment buildings and single family houses. About 90 person die every year in or after a residential fire. In order to base the analysis on as much data as possible the whole time period 1999-2013 was used for the analysis. The number of unknown causes and unknown start items is very high, unknown is in fact the most common cause or start item. If the actual distribution of start items and cause in the category unknown would be unevenly distributed compared to known items and cause, then the results would change dramatically. As the portion of unknowns has varied over the time period studied, with a much smaller portion during the years 2003-2006 when a person called up the different recue services that had reported fatal fires with unknown causes or start item, these years were also studied in comparison with the other years. This comparison gave that Smoking and Forgotten stove probably are among the causes that would increase most if the number of unknown cause is smaller and the start items Furnishing, Flammable liquid, Sofa/armrest chair, Stove, Bed and TV are among the start items that would increase. The number of TV fires was however larger also before 2004 and the decrease in TV fires during 2011-2013 can be due to the flat screen TVs used today instead of the old type of TVs which contained more mass and where a candles could be placed on the TV. The study showed that in the majority of cases where fatalities had occurred the fire was large already when the rescue service arrived at the site, which means that the initial fire had to have been large enough to give a spread of the fire and not self-extinguish. In many of these cases the start item and/or cause or start room are categorized as unknown. Unknown start item or cause is more common in Single family houses. In case the fire is smaller, like in the start item only, smoke only or extinguished, it is possible to find out more about the fire by studying the start room, start item or cause in some cases. Studying the fatal residential fires with unknown cause one find that they started in Furnishing, Other, Sofa/armrest chair, Bed, Clothing and TV. The most common start room for fatal residential fires with unknown start item is the living room. The next step in this project is to continue with further analyses of the public and proprietary data to determine if differences in building and dwelling characteristics can be identified that can answer questions like why fatal residential fires are large upon rescue service arrival or if there are any organisational factors such as rescue services response time. Differences between single family houses and apartment buildings will be investigated together with differences between municipalities and municipality types. Also the impact of interiors like furniture will be investigated.

46
8 References 1 Jonsson, A., Nilsson, F., Runefors, M., Särdqvist, S:, ”Fire-Related Mortality in Sweeden:
Temporal Trends 1952 to 2013. Fire Technology 2015. DOI: 10.1007/s10694-015-0551-5 2 Van Hees, P., Johansson, N., Bränder i boendemiljö – En förstudie från BRANDFORSK,
LTH, Report 3146, Lund 2010. 3 IDA accessible at ida.msb.se 4 Nilsson, F. Bonander C, Jonsson A, ”Differences in Determinants Amongst Individuals
Reporting Residential Fires in Sweden: Results from a Cross-Sectional Study”, Fire Technology Vol 51:3, 2015
5 Jonsson A., Bergqvist A., Andersson R. ”Assessing the number of fire fatalities in a defined
population”, Journal of Safety Research, Vol 55 December 2015, pp 99-103 6 Bostads-och byggnadsstatistisk årsbok 2012, Statistiska centralbyrån 2012, Yearbook of
housing and building statics 2012, http://www.scb.se/statistik/_publikationer/BO0801_2012A01_BR_BO01BR1201.pdf
7 http://www.statistikdatabasen.scb.se/pxweb/sv/ssd/?rxid=6e2e9f3b-c078-4f81-adc7-
cc0a10940419 8 EN16156:2010 Cigarettes — Assessment of the ignition propensity 9 Larsson, I., Bergstrand, A., ”Studie: självslocknande cigaretter - teori och verklighet”, SP
Arbetsrapport 2015:4P02859 på uppdrag åt MSB, 2015 (to be published) 10 IBM SPSS Software accessible at: http://www-01.ibm.com/software/analytics/spss/
[downloaded 2015-09-29] 11 StatSoft, Inc. Electronic Statistics Textbook, 2013. accessible at
http://www.statsoft.com/textbook/ [downloaded 2016-03-18]

47
Appendix 1 Incident report The reporting sheet for fire in a building is shown below. All terms are in Swedish but the sheet is provided here in order to give an indication of how the data is gathered. The rescue service make crossmarks for the different selections. In some cases only one cross should be made, in some it is allowed to make several.

48

49
Appendix 2 Terminology used for the incident report sheet and in this report Start item The explanation given for the term “Startföremål” to the rescue service is “Item that can be considered to be crucial for the fire occurrence”. The term “startföremål” has thus been translated directly into Start item instead of the term “item first ignited” as used in some countries. Item first ignited can in many cases be different from start item as for tumble dryers where perhaps it is the clothing within the dryer that is the item first ignited. The 41 possible start items in the residential fire reporting are listed in Table 24. More than one alternative can be chosen. Figure 40 shows how the start item reporting section looks like for the residential fires as seen the different start items do not seem to be in an specific order. The fatal residential fire database contains 32 different start items as listed in Table 25. Table 24. Start Items in the residential fires database
Swedish term Translation used in this report
Comment in education material
Andra elinstallationer Electrical appliances Annan lös inredning Furnishing Annat Other Bastuaggregat Heating source for sauna Brandfarlig gas Flammable gas Brandfarlig vätska Flammable liquid Byggnadens utsida Outside Dator Computer Diskmaskin Dishwasher Elcentral Electrical box (Electrical
appliances) Connection appliance intended for distribution of electrical energy
Eldstad Open fire place Expl. Ämne/Sprängämne Explosive Fläkt/annan vent. anläggning Fan/ventilation Gardiner Curtains Glödlampa Light bulb Kaffebryggare Coffee machine Kläder Clothing Kyl/frys Fridge/Freezer Lysrör Florescent lamp Lysrörsarmatur Florescent lamp Lös inredning Furnishing Maskin Machine Okänt Unknown Papper/kartong Paper Personbil Car Rökkanal Chimney Skräp i container/mots Garbage in container or
similar
Soffa/fåtölj Sofa/armrest chair

50
Swedish term Translation used in this report
Comment in education material
Spis Stove Spårfordon Rail vehicle Stereo/Video Stereo/Video player Stereo/video/DVD Stereo/Video
player/DVD player
Strykjärn Iron Säng Bed Torkskåp Drying cabinet Torktumlare Tumble dryer Transformator Transformer TV TV Tvättmaskin Laundry machine Uppvärmningsanordning Heating equipment Övriga vägfordon Other road vehicle
Figure 40. The start item section in the fire reporting system. The different start items do not seem to
appear in any specific order
Table 25. Possible start items in fatal residential fire database
Swedish term Translation used in this report
Andra elinstallationer Electrical appliances Annan lös inredning Furnishing Annat Other Bastuaggregat Heating source for sauna Brandfarlig gas Flammable gas Brandfarlig vätska Flammable liquid Byggnadens utsida Outside Dator Computer Elcentral Electrical appliances Eldstad Open fire place Explosivt Ämne Explosive Fläkt/vent. anläggning Fan/ventilation Gardiner Curtains Glödlampa Light bulb Kaffebryggare Coffee machine Kläder Clothing

51
Swedish term Translation used in this report
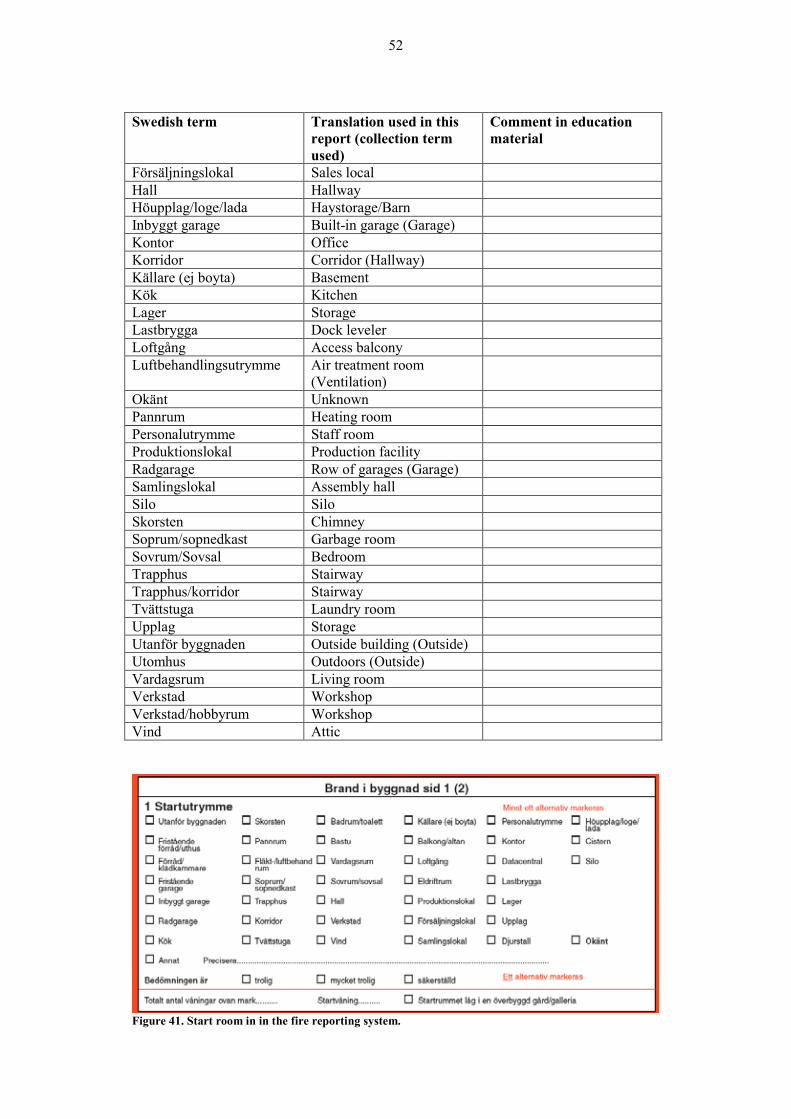
Kyl/frys Fridge/Freezer Lös inredning Furnishing Okänd Unknown Papper/kartong Paper Personbil Car Rökkanal Chimney Skräp i container Garbage in container Soffa/fåtölj Sofa/armrest chair Spis Stove Stereo/Video Stereo/Video player Säng Bed Torktumlare Tumble dryer Transformator Transformer TV TV Tvättmaskin Laundry machine Uppvärmningsanordning Heating equipment Start room No guidance is given on what is meant by the term “startutrymme” (direct translation starting place) in the education material. The possible selections are listed in the table below. More than one alternative can be chosen. Many of the options are not really a room, but as this study focuses on residential fires the term start room has been chosen. Table 26 Start Rooms in the residential fire and fatal residential fire’s database
Swedish term Translation used in this report (collection term used)
Comment in education material
Annat Other Badrum/toalett Bathroom/Toilet
(Bathroom)
Badrum/toalett/bastu Bathroom/Toilet/Sauna (Bathroom)
Balkong/altan Balcony/terrace (Balcony) Balkong/loftgång Balcony/Access balcony
(Balcony)
Bastu Sauna Cistern Tank Datacentral Computer room Djurstall Animal shed Elcentral Electrical box Eldriftrum Electric power room Fläkt/luftbehandlingsrum Fan/air treatment room
(Ventilation)
Fristående förråd/uthus Detached storage house (Storage)
Fristående garage Detached garage (Garage) Storage Storage Förråd/klädkammare Storage/clothing storage
(Storage)
52
Swedish term Translation used in this report (collection term used)
Comment in education material
Försäljningslokal Sales local Hall Hallway Höupplag/loge/lada Haystorage/Barn Inbyggt garage Built-in garage (Garage) Kontor Office Korridor Corridor (Hallway) Källare (ej boyta) Basement Kök Kitchen Lager Storage Lastbrygga Dock leveler Loftgång Access balcony Luftbehandlingsutrymme Air treatment room
(Ventilation)
Okänt Unknown Pannrum Heating room Personalutrymme Staff room Produktionslokal Production facility Radgarage Row of garages (Garage) Samlingslokal Assembly hall Silo Silo Skorsten Chimney Soprum/sopnedkast Garbage room Sovrum/Sovsal Bedroom Trapphus Stairway Trapphus/korridor Stairway Tvättstuga Laundry room Upplag Storage Utanför byggnaden Outside building (Outside) Utomhus Outdoors (Outside) Vardagsrum Living room Verkstad Workshop Verkstad/hobbyrum Workshop Vind Attic
Figure 41. Start room in in the fire reporting system.

53
Smoke detector For smoke detector the guidance is given that it is a smoke detector mounted on a place where it ought to have been activated by the fire. Cause of fire For cause of fire one can choose between 19 different options as provided in the table below. Only one options should be chosen. The following guidance is given: Why did the fire occur? Table 27. Cause of fire in the fire reporting system
Swedish term English translation
Comment in educational material
Anlagd med uppsåt Deliberately lit Fire started with the intention to harm people, property or environment
Annan Other Barns lek med eld Child playing
with fire Fire due to child playing or experimenting with fire. The suspect assumed to be younger than 15 years
Blixtnedslag Lightning Explosion Explosion Friktion Friction Friction producing more heat than is cooled
away. Heat increases until ignition occurs Fyrverkeri Fireworks Glömd spis Forgotten
stove Heat from forgotten stove that causes a fire like dryout
Gnistor Sparks Hantverkare Heta arbeten Hot works Welding, cutting or other work that produices
heat, spraks or smoke Levande ljus Lit candle Okänd Unknown Rökning Smoking Självantändning Self-heating Chemical, physical or biological process that
produces more heat than is cooled away. Heat increases until ignition occurs
Soteld Chimney fire Combustion process starting in soot in chimney Tekniskt fel Technical
malfunction
Värmeöverföring Heat transfer Återantändning Re-ignition

54
Figure 42 Cause of fire in frie reporting system
In the fatal fires database only 16 different options are available as listed in the table below. Table 28. Cause of fire in fatal fires reporting system
Swedish term English translation Anlagd med uppsåt Deliberately lit Annan Other Barns lek med eld Child playing with fire Blixtnedslag Lightning Explosion Explosion Glömd spis Forgotten stove Gnistor Sparks Levande ljus Lit candle Okänd Unknown Orsak ej angiven Cause not given Rökning Smoking Soteld Chimney fire Tekniskt fel Technical malfunction Uppgift saknas No information given Värmeöverföring Heat transfer Återantändning Re-ignition
SP Technical Research Institute of Sweden Box 857, SE-501 15 BORÅS, SWEDEN Telephone: +46 10 516 50 00, Telefax: +46 33 13 55 02 E-mail: [email protected], Internet: www.sp.se www.sp.se
SP Report 2015:53 ISBN 978-91-88001-77-1 ISSN 0284-5172
More information about publications published by SP: www.sp.se/publ
SP Technical Research Institute of Sweden Our work is concentrated on innovation and the development of value-adding technology. Using Sweden's most extensive and advanced resources for technical evaluation, measurement technology, research and development, we make an important contribution to the competitiveness and sustainable development of industry. Research is carried out in close conjunction with universities and institutes of technology, to the benefit of a customer base of about 10000 organisations, ranging from start-up companies developing new technologies or new ideas to international groups.