Characteristics of Employee Transportation Coordinators Center for
65
1 Characteristics of Employee Transportation Coordinators Center for Urban Transportation Research July 2004 Prepared by Nancy L. Brown, MBA, CAE Designs in Development, Inc. In collaboration with Harold T. Welch, Ph.D. High Performance Coaching Post Office Box 4460 • Seminole, Florida, 33775 • (727) 398-5997 Fax (727) 397-6497 • [email protected] • www.ephilanthropy.com For Dr. Welch: [email protected] • office (813) 966-7333
Transcript of Characteristics of Employee Transportation Coordinators Center for

1
Characteristicsof Employee
TransportationCoordinators
Center forUrban Transportation Research
July 2004
Prepared byNancy L. Brown, MBA, CAEDesigns in Development, Inc.
In collaboration with
Harold T. Welch, Ph.D.High Performance Coaching
Post Office Box 4460 • Seminole, Florida, 33775 • (727) 398-5997Fax (727) 397-6497 • [email protected] • www.ephilanthropy.com
For Dr. Welch: [email protected] • office (813) 966-7333

2
Report on Characteristics of Employee TransportationCoordinators
Table of Contents
Overview of Study ..............................................................................................................4
Overview of Instruments......................................................................................................5
Application and Findings...................................................................................................12
Summary of Conclusions...................................................................................................21
Recommendations..............................................................................................................22
Researcher Credentials.......................................................................................................24
Validity and Reliability of Instruments..............................................................................26
Attachments
Attachment A: Summary of Demographics Collected from POC...................................31
Attachment B: Profile of Organizational Characteristics (POC) Summary of Questions.......................................................................................33
Attachment C: Overview of CVAT Terms......................................................................35
Attachment D: Table Addenda.........................................................................................36

3
Attachment D: Table Addenda detail, continued
Table 1:Overview of FIRO-B Responses (n=15) ...........................................................................37Table 2:Comparison of FIRO-B Responses by Program Performance ..........................................38Table 3:Comparison of FIRO-B Responses by ETC-Supervisor Position .....................................40Table 4:Comparison of This study With Other Studies Using FIRO-B .........................................41Table 5:Overview of POC Responses (n=14).................................................................................42Table 6:Difference between high/low performing program in how the work unit is seen now .....44Table 7:Difference between high/low performing program in how the work unit should be.........46Table 8:Difference between how ETCs and their supervisors perceive their work unit to beNow....................................................................................................................................48Table 9:Difference between how ETCs and their supervisors think their work unit should be .....49Table 10:Overview of responses to demographic questions.............................................................51Table 11:Overview of CVAT Part 1 Responses on Personal Values (n=14) ...................................52Table 12:Overview of CVAT Part 2 Responses on Work Unit Culture (n=14) ...............................54Table 13:Difference between ETC and Supervisor perception of personal values ..........................56Table 14:Difference between ETC and Supervisor perception of work unit culture........................58Table 15:Difference in perception of personal values between high and low performingPrograms ........................................................................................................................... 60Table 16:Difference in perception of work unit culture between high and low performingPrograms ............................................................................................................................62Table 17:Chart III from DiSC -- the “official” report ......................................................................64Table 18Chart I and II from DiSC -- anecdotal observations ..........................................................65

4
Overview of Study
The goal of this study was to determine if differences in effectiveness of work site trip reductionprograms (TRP) can be explained by the characteristics of Employee TransportationCoordinators (ETCs) and the relationships they have with their supervisors.The process used for this investigation includes a study of the characteristics of organizationswith the six most successful TRP participation metrics in comparison with the six organizationswith the least successful TRP participation metrics. Also, by comparing personal characteristicsof ETCs and their supervisors from the six most successful programs with personalcharacteristics of ETCs and their supervisors from the six least successful programs, we intend toindicate personal characteristics that may contribute to TRP effectiveness.
The study was undertaken to provide a statistical foundation to refute two null hypotheses:
1. There is no significant difference between selected characteristics of organizations withhighly successful TRP metrics from organizations with low TRP metrics.
2. There is no significant difference between selected individual characteristics of ETCsfrom organizations with highly successful TRP metrics and ETCs from organizationswith low TRP metrics.
Collection of data to study organizational or personal characteristics could have beenaccomplished by several approaches.
1. Referring to existing data-which documents culture change for organizations andperformance appraisal feedback for individuals. This approach is cost effective and canbe time effective with full cooperation from each participating organization, but comeswith the problem of diverse expressions of collected information. Documentationregarding culture change will be tailored to each organization and some organizationswill have no culture statement or internal evaluation. Performance appraisal criteria willnormally be consistent within an organization but vary widely between organizations.Even if organizations share common descriptions the perception of standards ofperformance are not consistent between departments, let alone between companies.
2. The on-site observation by a researcher to gather organizational information and multiplefeedback observations in the form of 360-degree tools used to assess characteristics ofeach participant. This approach provides optimum consistency of common,predetermined criteria, but is so expensive and time restrictive that it is only used for themost demanding or critical applications.
3. Collection of responses to common sets of questions by each participant. The use of self-assessment instruments is time efficient and provides effective data at a reasonable cost.Self-assessment tools rely on the candor and accuracy of participants and often depend onthe assumption of confidentiality placed on individual feedback. Data from self-assessment instruments reflect opinions of participants and contain individual bias,baggage, and potential misperceptions of reality. For this reason, representation of anadequate sample of the defined population is needed.

5
Overview of Instruments
The self-assessment feedback approach was selected for this study. Instruments were selectedthat could be made available on-line, would be relatively easy to administer, would provide datasuitable to build statistical evidence, and that would provoke interest on the part of surveyparticipants. The instruments included:
• DiSC by Inscape Publishing• FIRO-B (Fundamental Interpersonal Relations Orientation – Behavior) by Consulting
Psychologist Press administered through SkillsOne• POC (Profile of Organizational Characteristics) based on the work of Dr. Rensis Likert in
The Human Organization, administered by High Performance Coaching• CVAT (Culture and Values Analysis Tool) by Dr. Reid Nelson, administered by High
Performance Coaching.
Participants were contacted by the Center for Urban Transportation Research (CUTR) with anoverview of the research project, the approximate time to participate, access to websiteinformation, and a commitment of individual confidentiality. Seventy participants were sought;19 actually participated in the study and 18 completed all or some of the instruments.
DiSCAt its most basic level, DiSC measures four factors of an individual's needs-driven behavior:
• Dominance (D) is the DiSC factor that relates to control, power and assertiveness.• Influence (i) relates to an individual’s approach to social situations, and an individual’s
desire to influence others.• Steadiness (S) is the factor of patience, persistence and thoughtfulness.• Conscientiousness: (C) describes a person’s approach to structure and organization.
The instrument allows a person to project his or her perceived “needed” behavior in a situationand compares it with the instinctive response, to yield a composite view of the person in theposition. The DiSC is typically used to help individuals determine their own needs-drivenbehaviors and learn to adapt their behaviors to the needs of others.
Upon completion of the DiSC instrument by an individual, the data is used to construct threegraphs. A first graph (referred to as Graph I) charts perceived needed behavior in a given jobenvironment, a second graph (referred to as Graph II) charts the instinctive response and a thirdgraph (referred to as Graph III) develops a composite view, which is the information sent back tothe person completing the instrument. In responding to the instrument, ETCs were asked tofocus on “doing their jobs as an ETC.” Supervisors were asked to focus on “supervising theirETC.“

6
DiSC is one of several hundred needs-driven, behavior-based instruments available on themarket. However, it is the only one of the instruments that has been validity- and reliability-tested successively through several stratified random samples of the US over its forty years ofexistence. The language in the instrument has also been adapted, as language utilization haschanged over time. Its original creator, Dr. John Geier, a former professor at the University ofMinnesota, found that Graph I tended to correlate with how people projected their jobs to be,because of a tendency to think more carefully about how a person “most” saw their job asopposed to how they functioned least in the position. He called Graph II “the instinctive responseunder pressure.” Graph III is the combination of the two, representing how a person is probablyfunctioning in the role at the point at which they complete the instrument.
With the advent of the use of the computer, and with the instrument being taken in anunsupervised environment, Inscape does not “officially” claim that the differing charts meananything. Anecdotally, however, many long-term administrators like Ms. Brown agree with theoriginal instrument developer, Dr. John Geier, that Graph I correlates most closely to behaviorspeople perceive that they need to emulate within the focus, They also find that Graph II is moreclosely aligned with the instinctive response to pressure (and much less likely to changedramatically over time), and that Graph III provides insight into how well the subject is actuallymerging the wanted (projected) behaviors with his or her own more instinctive responses. Whileno research proves this fact, the additional graphs provide rich insight into individual persons,which can be especially helpful with a resulting small sample size such as the one resulting fromthis initial study.
There are thirteen possible DiSC “Classical Profile Patterns” which may more closely describean individual’s behavior. Participants received a detailed report about their unique behavioralstyle. No style is better than another. The information sent included a description of theperson’s needs-driven behavioral tendencies. The information also describes the person’sdesired environment and - can help the participant discern what he or she can do to be moreeffective in the defined situation. For more information about the DiSC instrument refer to thesection “Validity and Reliability Regarding Instruments.”

7
FIRO-B (Fundamental Interpersonal Relations Orientation – Behavior)The FIRO-B is specifically concerned with individual interpersonal needs and how these needsshow up in one-to-one relationships, and in groups. The FIRO-B provides insights into issues oforganizational culture and team dynamics. This makes the FIRO-B especially valuable forleaders and team members.
FIRO-B describes interpersonal behavior in terms of three primary dimensions:• Need for Inclusion, whether one wants to be “in” or “out” of a particular group• Need for Control, whether one wants to be “up” or “down” (superior or subordinate)• Need for Affection [openness], whether one wants to be “close” or “distant”
FIRO-B measures these three dimensions from two perspectives:• Expressed behavior: behavior one feels most comfortable showing to others• Wanted behavior: behavior one wants from others or to be received from others.
The FIRO-B yields six basic scores, including an expressed score for each dimension: inclusion(Ie), control (Ce), and affection (Ae), and a wanted score for each dimension: inclusion (Iw),control (Cw), and affection (Aw). In addition, there are total scores for each of the threedimensions; total inclusion (It), total control (Ct) and total affection (At). There is also a totalexpressed behavior score (Te), a total wanted behavior score (Tw), and an overall total-totalscore combining both wanted and expressed scores (Tt).
FIRO-B explains how personal needs affect interpersonal relationships. It provides a useful focusfor leadership development, teambuilding, mentoring programs and organizational change. Asapplied to this study to assess characteristics that lead to effective or ineffective programs, theremay be clues from contrasted scores of ETCs and their supervisors. An investigation will bemade to discover if there are statistically significant differences between FIRO-B data and thelevel of program effectiveness.
The following table is a common arrangement for FIRO-B scores and illustrates abbreviationsused with the data:
Inclusion Control Affection TotalsExpressed Ie Ce Ae TeWanted Iw Cw Aw TwTotals It Ct At Tt
8
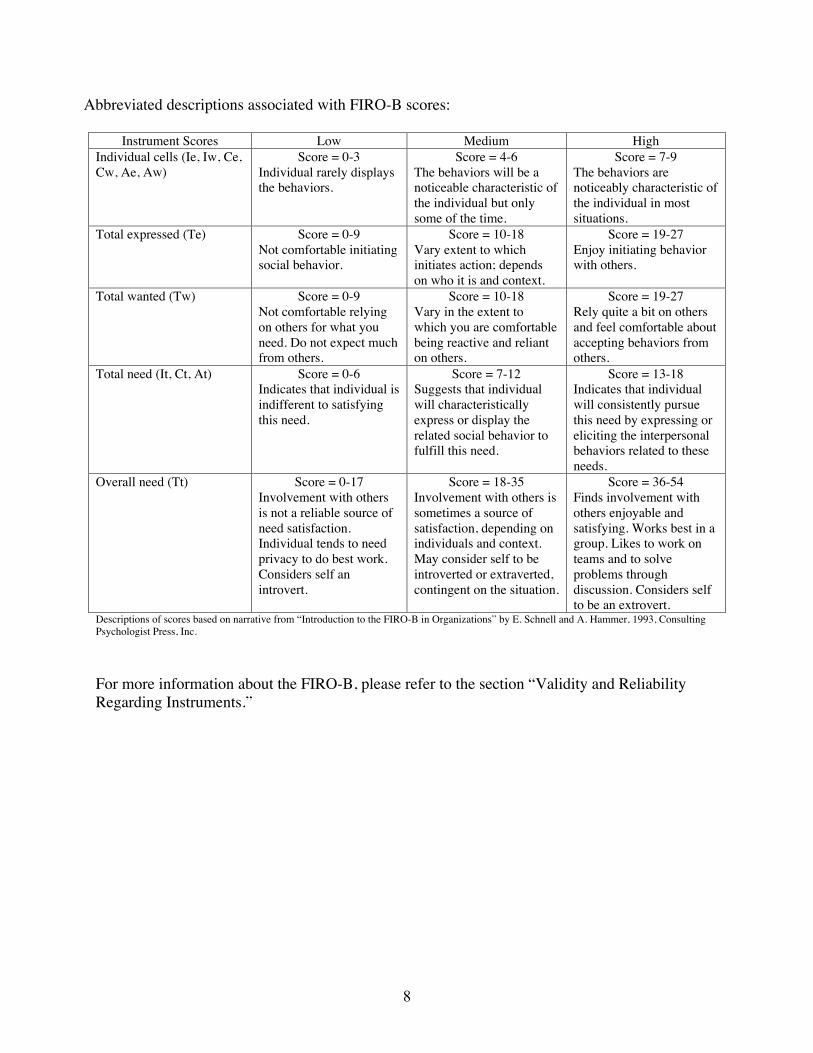
Abbreviated descriptions associated with FIRO-B scores:
Instrument Scores Low Medium HighIndividual cells (Ie, Iw, Ce,Cw, Ae, Aw)
Score = 0-3Individual rarely displaysthe behaviors.
Score = 4-6The behaviors will be anoticeable characteristic ofthe individual but onlysome of the time.
Score = 7-9The behaviors arenoticeably characteristic ofthe individual in mostsituations.
Total expressed (Te) Score = 0-9Not comfortable initiatingsocial behavior.
Score = 10-18Vary extent to whichinitiates action; dependson who it is and context.
Score = 19-27Enjoy initiating behaviorwith others.
Total wanted (Tw) Score = 0-9Not comfortable relyingon others for what youneed. Do not expect muchfrom others.
Score = 10-18Vary in the extent towhich you are comfortablebeing reactive and relianton others.
Score = 19-27Rely quite a bit on othersand feel comfortable aboutaccepting behaviors fromothers.
Total need (It, Ct, At) Score = 0-6Indicates that individual isindifferent to satisfyingthis need.
Score = 7-12Suggests that individualwill characteristicallyexpress or display therelated social behavior tofulfill this need.
Score = 13-18Indicates that individualwill consistently pursuethis need by expressing oreliciting the interpersonalbehaviors related to theseneeds.
Overall need (Tt) Score = 0-17Involvement with othersis not a reliable source ofneed satisfaction.Individual tends to needprivacy to do best work.Considers self anintrovert.
Score = 18-35Involvement with others issometimes a source ofsatisfaction, depending onindividuals and context.May consider self to beintroverted or extraverted,contingent on the situation.
Score = 36-54Finds involvement withothers enjoyable andsatisfying. Works best in agroup. Likes to work onteams and to solveproblems throughdiscussion. Considers selfto be an extrovert.
Descriptions of scores based on narrative from “Introduction to the FIRO-B in Organizations” by E. Schnell and A. Hammer, 1993, ConsultingPsychologist Press, Inc.
For more information about the FIRO-B, please refer to the section “Validity and ReliabilityRegarding Instruments.”

9
POC (Profile of Organizational Characteristics)In his 1961 book, New Patterns of Management, Rensis Likert identified four prototypeorganizations, named Systems I, II, III and IV defined by the degree to which they were open,participative, and satisfying to work in. These organizational levels are:
System I — AuthoritativeSystem II — Paternalistic
System III — ConsultativeSystem IV — Participative
Dr. Likert further identified management style as the key variable. Dr. Likert was able toprovide evidence that as organizations moved toward System IV4 on this scale, they had lowercosts and higher output than those tending toward System I1.
The POC provides an efficient method to collect workplace perceptions of how the organizationlooks to an individual, and how that individual believes it should appear. The processes used byDr. Likert included control, influence, decision-making and goal setting. The POC incorporatessix process characteristics that can be observed in an organization. These include Leadership,Motivation, Communication, Decisions, Goals, and Controls.
The POC collects feedback on the six characteristics in terms of the perspective of how theorganization is seen now and the perspective of how the organization should be. An overall POCIndex is calculated for each perspective and for each characteristic. The POC is most usefulwhen there are sufficient responses to provide sample data for predictions of a generalpopulation. Is the Appendix B reference still current? Appendix B contains the questions usedfor this study and is a reference when investigating the data:
Questions 1, 2, and 3 deal with the organizational characteristic of Leadership; questions 4,5, and 6 deal with Motivation; questions 7 through 10 collect feedback of organizationalCommunication; questions 11 and 12 focus on Decisions; 13 and 14 on Goals; andquestions 15 and 16 on Controls.
For the initial phase of this study, using feedback from ETCs and their supervisors, commentsfrom POC data will only describe the perceptions of management style from their singularperspective. This will have value as long as resulting descriptions of these perspectives arecontained within the scope of comparing program leadership perceptions and not confused withproviding projections of existing organizational characteristics. The desire of this study is todiscover POC data with sufficient correlation to program effectiveness data to act as a catalystfor increased dialogue, vis-à-vis understanding perceived organizational characteristics thatenhance or support successful trip reduction programs.
For more information about the POC, please refer to the section, “Validity and ReliabilityRegarding Instruments.”

10
CVAT (Culture and Values Analysis Tool)Organizational culture is more complex than one survey instrument can hope to address, but theCVAT provides a solid foundation to begin to recognize important components of anorganization’s culture.
Assessing perceptions of what is rewarded and important within an organization providesinsights that can be used to style communications in a way that compliments culturalcharacteristics. CVAT consists of two interlocking instruments supported by licensed software.
1) The Personal Value Profile (CVAT Part 1) measures participants’ perceptions of personalvalues (PV).
2) The Aggregate Value Profile (CVAT Part 2) also uses the same dimensions and format butrelates to participants’ perceptions of work unit values or culture (UC). The CVAT identifies16 dimensions that fall within four categories. These categories are identified below, withexpanded descriptions in the attachments.
• WORK: Effort (A), Time (B), Finish Job (C), Quality (D);• RELATIONS: Affect (E), Empathy (F), Sociability (G), Loyalty (H);• CONTROL: Dominance (I), Status (J), Political (K), Leader (L);• THOUGHT: Abstract (M), Plan/Organize (N), Exposition (O), Flexibility (P).
Data from the administration of Part 1 and Part 2 of the CVAT are used to consult withexecutives and others whose personal styles and assumptions of organizational culture mayinfluence organizational effectiveness and change. Part 1 is focused on the individual and can beused to illustrate personal values (PV). Part 2 is focused on the individual’s perceptions of theirwork environment and can be used to illustrate work unit culture (UC).
Within the scope of this study, the CVAT is an effective tool to assess core values of ETCs andtheir supervisors, to assess the level of similar and dissimilar values, and to obtain perceptions oforganizational culture. The CVAT software facilitates comparisons of responses and willstatistically match similar responses. We anticipated that responses from incumbents fromorganizations with effective programs might be statistically similar to each other and differentfrom responses from incumbents from organizations with ineffective programs. Regrettably, notenough participants completed this portion of our battery to provide data to differentiatecharacteristics of successful programs from less effective programs.
For more information about the CVAT, please refer to the section “Validity and ReliabilityRegarding Instruments.”
The DiSC and the FIRO-B focus more on the characteristics of the individual, while the POCand CVAT focus more on the characteristics of the organization for which the individual works.The combination of these four instruments was selected for this study to provide information thatcould be compared to develop an overall profile of the study participants and their perceptions oftheir work sites. Finding consistencies (or inconsistencies) among the instrument data uses theconcept of “multiple sources of evidence” in the development of cases studies.

11
As a “trial,” we determined that it would be best to utilize several different instruments to seewhich provided the greatest insight. It is common in studies of this nature to utilize severalinstruments. As stated elsewhere in this document, we found that the willingness of theparticipants to actually complete the instruments to be the most limiting factor. Supervisors, inparticular, perhaps because of their many responsibilities, were often unwilling to commit thetime required.

12
Application and FindingsStatistical protocols were set up in anticipation of a minimum of 30 responding work sites, pairedto include a supervisor and an Employee Transportation Coordinator (ETC) for a total of 60participants. A web site, hosted by the National Center for Transit Research (NCTR), wasconstructed which contained information about the purpose of the study and links to the fourfeedback instruments. Each link contained instructions for completing each feedbackinstrument. NCTR staff recruited the study participants with contact information for ETCsprovided by the Washington State DOT trip reduction database of participating work sites.
Recruitment included initial phone calls with a follow-up letter that contained detailedinformation and an Informed Consent form. Participant recruiters relied upon the ETC toprovide contact information for his or her immediate supervisor. Individuals interested inparticipating signed the Informed Consent form and emailed or faxed it back to the recruiter.Upon sending his or her informed consent, the participant received emails that providedindividual pass codes and information for accessing the link to the feedback instruments. Toll-free telephone conferences were offered to all participants for providing verbal instructions foraccessing and completing the instruments. Participants were provided contact information ifthey had any questions or problems.
The study attracted 18 usable responses for DiSC, 15 usable responses for the FIRO-B and 14usable responses for the POC and CVAT.
The design of the study required each participant to commit two hours of time completinginstruments. Ideally, a supervisor and his or her ETC from the same work site would participate;however, each would complete the instruments separately and independently of the other. Manyof the ETC supervisors, who have many other responsibilities, did not choose to participate for arange of reasons given to study directors. Of the eight participating sites ranked as topperforming (rated “A” by CUTR) for vehicular trip reduction, only 25% (2) of the supervisorsparticipated. Due to the resulting small sample size, the researchers are not able to applystatistical protocols to predict individual or work unit characteristics of a larger population.However, inferences may be extracted from the feedback contained in the instrument responsescollected. These inferences might support or direct future investigations relevant to this study.
It appears that the behavioral style represented by the “i” in the DiSC instrument (Influencing)correlates with the more successful programs. Additionally, although the sample size isextremely low, it appears that the lack of Expressed Affection (Ae) in FIRO-B scores may alignwith lower performing programs. This hypothesis could be tested in further studies.
Additionally, as indicated in the section entitled “Recommendations” in the demographics theProfile of Organization Characteristics, the (POC) could be restructured by eliminating somequestions and adding others to help evaluate outside influences, such as how far a work site isfrom public transportation, or how supportive top management is perceived to be of the program.

13
DiSC Scores: Paired supervisors and their ETCsThe trip reduction program requires influencing a change in the travel behaviors of people. Aninstrument that measures, in part, how people perceive the needs of the job and balance themagainst their own need-driven behaviors is the DiSC Personality Profile. One of the initialhunches of the study was that the behavioral work style of the ETC may be associated with theoutcome of the TRP.
D is associated with task-oriented behaviors such as dominating and delegating."i" is associated with people-related behaviors such as influencing and inducing.S is associated with people-related behaviors such as steadiness and security.C is associated with task-oriented behaviors such as conscientiousness and control.
While the study sample for the DiSC™ is too small to draw conclusions, a possible patternemerges from the available data. It is interesting to note that of the five pairs of study work sitesfor which there were data for both the ETCs and their supervisors, the site that had the highestperformance as measured by vehicle trips reduced was also the only site in which both the ETCand the supervisor had a high “i” (Influence) work style as one of their primary needs-drivenbehaviors. (A person with a high “i” personality is one who enjoys influencing others. Theyseek contact with all types of people, look for opportunities to generate enthusiasm andaccomplish goals through others. They are adept at dealing with people and articulate ideaswell.) Of course, one example such as this cannot lead to any conclusions, but the recognition ofboth the supervisor and the ETC that active influencing is a key factor does support our “hunch.”
Pairs of ETCs and SupervisorsProgram Rating ETC SupervisorHighest performing organizationsA C, i i, DA i, S S, CLower performing organizationsB or C S, C i, CB or C S, D ` D, CB or C S, C D, i
DiSC Scores: ETCs aloneDiSC scores for ETCs alone provided much greater insight into the behavioral mindset of theETC. Although the sample size was too small to be considered other than anecdotal, the resultswere revealing in that the high ‘i” (active Influencing) appeared consistently.
The study contained 13 ETCs who completed the DiSC instrument. In examining these scores itis important for the reader to remember that the Graph III score represents a combination of howthe employee projects how he/she should most be, plus how he/she feels he/she is least, asdefined by a specific job focus (“my job as an ETC”). Actual scores of ETCs as compared to theCUTR worksite rating based on vehicle trips reduced are explained in the graph on the followingpage.

14
The following graph illustrates the difference in DiSC scores between high and lowerperforming programs for ETCs alone:
TripReductionRanking DiSC Scores Graph III
high performingE02 A C, i (supervisor also has high i)E17 A i, SE14 A i, SE04* A S, D (i graph I)E10 A i, SE08 A C, iE15 A S, CE09* A C, D (i graph I)
low performingE22 B S, CE21 B S, DE11 B S, CE24 C S, CE25 F i, S
Looking at the ETC data apart from the data for the supervisors, the predominant work style forall ETCs in higher performing programs (VTR <30) was “i”.
• Two of the high performing programs for which the ETCs did not score a high “i” (as indicatedin their Graphs III) as a predominant needs-driven work style indicated that they believed ahigh “i” personality was needed to do the job of the ETC well (as indicated in their Graphs I),meaning that they were attempting to change their natural needs-driven behaviors to meet theneeds of the job.
• The predominant work style for ETCs in the lower performing programs VTR>30 was “S”(Steadiness). A person with a high “S” personality is one who performs in a consistent,predictable manner. He or she prefers stable harmonious work environments with standardoperating procedures and predictable routines. This ETC is task-oriented rather than people-oriented. He or she is uncomfortable with change and desires an environment in which thestatus quo is maintained.
Not fitting the above pattern are two lower performing organizations with ETCs with high “i”work styles. Obviously, a high “i” ETC work style might not be the only predictor of TRPeffectiveness. However, this finding can anecdotally provide insight into other factors that mayimpact TRP effectiveness.

15
• In the first case, the ETC reportedly expressed a lot of frustration over lack of managementsupport Therefore, it might be proposed that no matter how effective the ETC, the ETC mightnot be able to overcome unsupportive management.
• In the second case, the exception concerned the lowest performing work site. Its ETC has ahigh “i” personality but it is not believed that this is evidence that the hunch is wrong. Thework site is located far away from the nearest central business district, which has limited transitservice and free plentiful parking not controlled by the organization. It is suggested that thiswork site’s TRP performance might actually rate well in comparison with other work sites insimilar conditions.
Also not inconsistent with our “hunch” was one work site that was among the highest performingtrip reduction programs. This program has an ETC with her primary needs-driven work stylemeasured as a high “C” and her secondary work style as “i”. The “C” style includes adherenceto key directives, accuracy and attention to detail. In reference to the qualities needed in aneffective ETC, her supervisor’s (perhaps unenlightened) reported opinion was that that the mostimportant activity of the ETC was to “….serve as a compendium of knowledge. We don’t needa cheerleader.”
• Other incentives were known to be at work: this work site has among the largest numbers ofemployees in the study, and they all receive a full transit subsidy. Top management,reportedly, actively advocates for the TRP, which may be unusual in some other organizations.
• While the persuading of a large percentage of employees to use alternative transportation hasalready been accomplished in this organization, we have been advised that there are stillemployees who do not use alternative transportation but could.
• This ETC reportedly further said that she is most proud when she succeeds in convincingsomeone to participate in trip reduction programs. Reportedly, supervisory guidance appears toreward employees who already want to participate in such programs. (For supervisoryapproval, administration of the transit passes is apparently what this ETC must do well.) So, inthis case, her high “C” work style may be very effective: the ETC recognizes that influencingmore employees to use alternative transportation is her goal.
Based on the above examples, one may conclude that the ETC work styles that best match theculture of the work site may enable an ETC to be effective in his or her position.
In conclusion, while the study sample for the DiSC™ is too small to draw definitive conclusions,a pattern appears to emerge from the available data that high “i” ETC work style, whereinencouragement is practiced and found, is one of the keys to the most effective trip reductionprograms.
Conclusions regarding DiSC ScoresWhile data is insufficient to draw actual conclusions, we can infer from both of the tables abovethat recognition of the ETC’s role as one who actively manages processes in a persuasive way isessential to project success. This could perhaps be tested with a larger sample using only theDiSC instrument, or preferably the DiSC and the POC.

16
FIRO-B (Fundamental Interpersonal Relations Orientation - Behaviors) ScoresIn general, respondents to the surveys appear to be more reserved, or private, than the populationat large. This conclusion is inferred from the low overall FIRO-B when compared to otherstudies using FIRO-B data (Table 4). As a group, the participants are likely to be choosy abouthow, when, and where they associate with others. They may also be cautious about how they useor share authority.
It should be noted that the FIRO-B scores represent patterns of interpersonal behavior andexpectations of those persons evaluated. It may appear at a quick glance that the DiSC andFIRO-B information are in conflict. Any difference is minimized as one considers that the FIRO-B scores reflect the unique interpersonal needs that strongly motivate each of us. Within a worksetting is only one of a wide range of situations and environments.
The DiSC, however, utilizes a very specific task focus upon application (“my job as an ETC” or“my job supervising an ETC”). DiSC celebrates the fact that, although each individual may havea greater “comfort level” with one or more behaviors, individuals can change and adaptbehaviors to adjust to varying situations. This, in fact, appears to be what is happening with themore successful ETCs. Although, as a group, ETCs tend to be more private according to theirFIRO-B scores, they are willing to ADJUST their behaviors to improve program outcomes byinfluencing and showing affection (openness) to others in the process of recruitment, solicitation,and related ETC communications.
The following is a recap of the meaning of the FIRO-B score categories:
Inclusion“Expressed inclusion” (Ie) is consistently greater than “wanted inclusion” (Iw) (Table 1),indicating a greater comfort with initiating contact with other people while wanting privacy forthemselves. This score is amplified in Table 2 with the comparison of ETC responses from highperforming programs to responses from lower performing programs. The mean for “wantedinclusion” (Iw) of ETCs from high performing organizations is 3.4, and the mean wantedinclusion (Iw) of ETCs from low performing organizations is 0.8. ETCs with both highperforming programs and low performing programs are comfortable with including others (Ie).However, the ETCs with low performing programs are even more private, and may be perceivedas insincere due to their preference to not be included by others.
ControlThe combination of expressed control and wanted control is described as Control total (Ct) and isthe lowest factor for the group of respondents (Table 1). Control is also a topic of interest inTable 2, in that Control total (Ct) for participants from the top ranked programs and lower rankedprograms both have a mean response that can be considered placed in the lower-middle of thescale. However, the score is the lowest of the three dimensions for the ETCs with highperforming programs and it is the highest of the three dimensions for the ETCs with the lowperforming programs. This finding implies that either inclusion or affection (openness) may bemore of a success factor than expressing or wanting control over events or the ability to influenceothers.

17
AffectionAffection is the dimension with the highest mean score, implying that this need is of greatestimportance to the group of respondents. In an organizational setting, affection is frequentlyreferred to as openness, warmth, or friendliness. The expressed and wanted scores, (Ae) and(Aw), appear at a low-medium level compared to other data sub-sets. Persons with a desire toexpress affection usually want to appear to be open and warm to others.
When overlaid with the DiSC scores for the most successful ETC sites rated most highly for themost vehicular trips reduced, ETCs scored significantly higher in the expressed Affectioncategory (Ae), and essentially the same in the expressed Inclusion category (Ie).
There is data from the FIRO-B that infers that some ETCs may lack commitment to theirprogram. They may be seen as doing an assigned task because it is part of their job, notnecessarily because they believe in it. This inference is based on low mean expressed control(Ce) of 2.4, and low mean wanted inclusion (Iw) of 2.4. They will tend not to be the people whohave a strong need to be in control of events or outcomes and will often like their privacy. Thismight be summed up as, “Whatever; I’ll be in my office.”
This idea is reinforced by the relatively high scores in both the “Now” and “Should” of the POC.There is a consistent level of satisfaction with the existing management style. The ETCs maycome from organizations that utilize highly effective participative processes and practices, or theETC may have figured out how to meet their personal needs within the existing culture.
Conclusions regarding FIRO-B ScoresWhile the sample size is too small to make statistical predictions about a population, there doesseem to be an indication that low expressed Affection (Ae) scores align with low performance oftransportation programs, as compared with the mean of 4.3 expressed Affection for the morehighly performing programs with the mean of 2.5 for those not performing as highly. Thefollowing is a more in-depth explanation of the FIRO-B scores and how they differ from, andmeasure different qualities, than the DiSC scores:

18
Comparison of DiSC and FIRO-B ScoresTRPRanking DiSC Scores Graph III FIRO-B
Ie Ce Ae Iw Cw Awhigh performing bolded #s higher than avg E02 A C, i 5 0 5 6 2 4E17 A i, S 4 3 3 8 1 7E14 A i, S 7 3 8 8 1 3E04* A S, D (i graph I) 4 3 7 7 5 7E10 A i, S 6 1 4 0 2 4E08 A C, i 3 5 3 0 3 0E15 A S, C(supervisor has high i) 4 2 3 0 6 5E09* A C, D (i graph I) 4 2 1 0 2 1
Mean 4.6 2.4 4.3 3.6 2.8 3.9low performingE22 B S, C 6 1 5 2 4 6E21 B S, D 4 3 1 0 3 5E11 B S, C 5 0 3 4 8 3E24 C S, C 4 3 1 0 1 3E25 F i, S n/a n/a n/a n/a n/a n/a
Mean 4.8 1.8 2.5 1.5 4.0 4.3
From the comparison above, one can see that in addition to a tendency to express “Affection”among the highly-performing program DiSC respondents, the FIRO-B respondents of lowerperforming programs tended to express less tendency toward expressing affection toward others.This is illustrated by “Affection expressed and wanted” scores which appear in the bolded boxes.
POC (Profile of Organization Characteristics) ScoresThe POC provides an efficient method to collect workplace perceptions of how the organizationlooks to an individual, and how that individual believes it should appear. As stated previously,the processes used by Dr. Likert included Control, Influence, Decision-making and Goal-setting.The POC incorporates six process characteristics that can be observed in an organization. Theseinclude Leadership, Motivation, Communication, Decisions, Goals, and Controls.
Scores from the POC were generally high (Table 5), reflecting positive perceptions by the ETCsof their work environment and the predominant management style. Tables 6 through 9summarize POC responses. (Add “POC” in the headings for these tables).
This high score can also be a reflection of sample bias, as those willing to participate in thesurvey might express a positive attitude toward the program and be more willing to participate inthe study. Also, participants in this study were simply responding to a questionnaire with little

19
organizational context; whereas, participants in previous POC studies were taking part in a largerorganizational change intervention and, therefore, more discriminate about responses to describeorganizational behaviors.
Scores for “How should the organization be” are typically high because most people want tocontribute to the work activity and want their work units to be participative. Scores for “How doyou see the organization now” are often lower than the scores for the participants in this study.Since participants in this study responded with small valued difference between “now” and“should be,” they may be working in positions that offer considerable autonomy, or they mayhave learned how to work within their system to obtain the autonomy they desire (referencingthe FIRO-B responses). A particular management style did not emerge from this study.
OrganizationalCategories
Thisstudy
POCStudy A
POCStudy B
POCStudy C
POCStudy D
POCStudy E
POCStudy F
Leadership 5.7 4.5 4.1 4.0 2.8 5.0 4.7Motivation 5.7 4.2 3.9 4.4 2.9 4.7 4.4Communications 5.2 4.2 3.8 4.0 2.6 4.8 4.2Decisions 5. 3.7 3.2 3.5 2.2 4.0 4.1Goals 5.1 4.2 4.0 4.8 3.2 4.9 4.7Controls 4.8 3.9 3.6 4.2 3.1 4.5 4.0Overall 5.3 4.2 3.8 4.2 2.8 4.8 4.4
POCStudy n= Description of sample
StudyYear
CUTRABCDEF
1424341216159
Participants in This studyManagers & supervisors at power plantTechnical professionals at nuclear plantOffice/clerical at power plantUnion employees at transmission siteNuclear engineers at nuclear plantAmerican Red Cross managers
2004199019941990199619941999
Scores for questions 8 and 10 of this study have the greatest gap between “now” and “should.”They both come from the Communication category. This group of survey participants thinks thatthe style and effectiveness of communications in their organization can be improved.
CVAT (Culture and Values Analysis Tool) ScoresGeneral findings from the CVAT (Tables 13 and 14) are that supervisors tend to value “Control”and “Relations” more than non-supervisors and high performing programs have ETCs who value“Control” and “Relations” more than lower performing program ETCs (Tables 15 and 16).Overall, study participants value relations (CVAT Part 1; Table 11) greater than their work unitrewards relations-building behaviors (CVAT Part 2; Table 12). Also, study participants indicatethat their work unit rewards control (CVAT Part 2) greater than they personally value control(CVAT Part 1).

20
The sum of categories from Table 11 indicates that Work is the highest valued category ofbehavior for the group of participants; followed by Relations, Control and Thought. In Table 12,we can see that Work is considered to be the highest rewarded category by work units, butRelations is last in perceived organizational culture importance. The dimensions with the greatestdifference between personal values and work unit culture (PV-UC) are Loyalty (H), Leader (L),and Political (K). Loyalty is more important to the individual than it is perceived to be for theorganization, Leadership and political savvy are both considered to be more important to theorganization than to the individual.
CVAT data is supported by DiSC and FIRO-B results to make a distinction between ETCs withhigher performing programs from ETCs with lower performing programs. Personal values ofETCs with high performing programs favor Relations over Work. ETCs with lower performingprograms favor Work over Relations (Table 15). These results are supported by the FIRO-B(Table 2) by a distinction between mean wanted inclusion (Iw) of 3.4 for ETCs with highperforming programs, and 0.8 for ETCs with lower performing programs. The lower level ofneeded inclusion reflects the relationship values by the CVAT score.
It is interesting to note that political savvy (K) within organizations is considered to be of greaterimportance to ETCs with high performing programs than to ETCs with lower performingprograms (Table 16). Flexibility (P) is also considered more important to ETCs with highperforming programs than ETCs with lower performing programs. Political savvy and flexibilitywould help persons navigate cultures that value Work over Relations even when it is clear to theemployees that relations are critical to the successful completion of the ETC job (as correlated byDiSC and FIRO-B Scores.)
The category of Control as part of the organizational culture (Table 12) was exceeded only bythe category of Work. Statements such as, “Respect for authority is important here,” “Status isimportant in this organization,” “It’s important to know the ropes to get ahead,” and “It isimportant to display leadership,” received high scoring for being selected above other options.
The topic of Control is reinforced by the FIRO-B scores. Expressed Control (Ce) is the need tohave control over events or people and is tied for the lowest mean score (Table 1). As a group,the surveyed ETCs as well as their supervisors appear to resist having control, and as a groupthey have little value for control.
Yet, ETCs with high performing programs see that their organization rewards the dimensionsthat identify the category of Control (Table 16). The study implies that ETCs with a betterunderstanding and acceptance of political and control factors, with the skill and desire toinfluence, and the rewards that go with their success will not settle for “Whatever,” but willstrive to reach goals that they believe are important.
When the CVAT scores of ETC personal values are compared to the CVAT scores of supervisorpersonal values, we find that ETCs as a group appear to strongly value Relationships over Work,while ETC supervisors value the dimensions of Work and Thought over Relations (Table 13).This difference is reinforced by the FIRO-B scores that compare ETCs and supervisors (Table3). The greatest difference of mean scores is in wanted Inclusion (Iw); mean ETC score is 2.9and mean supervisor score is 0.3. Relationships and being included is more important to the ETCindividual contributors than it is to the supervisors.
21
Summary of Conclusions1) The data sample is too small to draw statistical conclusions, but large enough to makeinferences that can be further evaluated through continued research.
2) It appears that there is a correlation between the DiSC behavior of Influencing (high “i”) andwith successful ETCs. Additionally, FIRO-B scores indicate that ETCs associated withtransportation programs identified as less effective have lower need of expressed Affection(openness) than ETCs associated with effective transportation programs. An assumption can beinferred that ETCs with characteristics of low influence and little openness may negativelyimpact an ETC program.
3) The CVAT scores indicate that survey participants place low relative value on Control. Theoptions of “I like to be respected,” “I am somewhat status minded,” “I know how to beat thesystem when necessary,” and “I like to lead,” were not selected by many respondents as part oftheir personal values. This was the lowest category selected by this entire sample of respondentsincluding ETCs and supervisors. This is echoed by the FIRO-B mean score for expressedControl which, along with wanted Inclusion, was the lowest of all other interpersonaldimensions.
4) The study, as designed (2 hours for completion), was too long to gain the desired participationand needs to be shortened. Streamlining the use of the POC, DiSC, and FIRO-B, in that order,would be recommended and would result in reducing the time commitment by half. For instance,in a larger study the “should be” questions from the POC could be eliminated to help reduce thetime required to complete the instrument.
5) In the CVAT, political savvy (K) within organizations is considered to be of greaterimportance to ETCs with high performing programs than to ETCs with lower performingprograms (Table 16). Flexibility (P) is also considered more important to ETCs with highperforming programs than ETCs with lower performing programs. Political savvy and flexibilitywould help persons navigate cultures that value Work over Relations even when it is clear to theemployees that relations are critical to the successful completion of the ETC job (as correlated byDiSC and FIRO-B Scores.)

22
Recommendations
1) Evaluate a larger sample of ETCs, using the premise that “expressed Affection” (FIRO-B) and“understanding for the need for Inducement and influencing” (DiSC) are essential to ourtargeted participants, successful ETCs. Market participation by emphasizing the potential forrecognition by their peers and positive acknowledgement from their supervisors.
2) Reduce the number of instruments to two or three. Drop the CVAT, cut down the POC, anddon’t make it a requirement for the supervisors to participate. The time it took to movethrough the process is believed to be problematic. Feedback to the participant recruiterindicated that the time commitment to participate (a minimum of 2 hours before reading thefeedback results and optionally attending a telephone debriefing) was too much. Only two-thirds of the study sample participating completed all the instruments. Supervisors, inparticular, were often too busy to participate. Since time is a factor, and since Supervisors areless likely to participate, the most insightful instruments are the POC, DiSC and FIRO-B, inthat order. All three can be administered in less than one hour.
• The POC is the instrument that is most flexible and can be adjusted to provide the requireddemographics. It can be shortened by eliminating the questions about how the organization“should be,” and retain the focus on how the organization is perceived “now.” The POCwould provide more valuable insight into variations of management style with a largersample. In a larger sample in more diverse communities, the POC process can be furtheradapted to include demographic and geographic information needed to investigate howexternal factors such as the availability of mass transit can influence reduced vehicular trips.
• The DiSC gives powerful information about how the ETCs specifically interpret thebehaviors needed on the job and whether they are attempting to adapt their natural behaviors,if need be, to achieve them. There was a high correlation with the “i” behavior in the highlyperforming groups.
• The FIRO-B is most powerful when used to compare the supervisor’s psychological needs tothose of the ETC in dimensions of Inclusion, Control and Affection. We had hoped toachieve some insight into how the relationship between the supervisor and the ETCimpacted program success; however, the resulting pair sample was too small to find anystatistical significance. In this study, we did find some strongly suggestive correlations forexpressed Affection (openness) when comparing only ETC scores between work groups withhighly effective programs and those with less effective programs. This illustrates how theFIRO-B can be useful to investigate fundamental differences between groups of participants.
• The CVAT is by far the longest and most complex instrument. While it would providevaluable information to future studies about the values of successful organizational cultures(whether Work, Relations, Control or Thought is valued most highly), we have concludedthat it can’t reasonably be administered over the Internet due to its length. Eliminating itwould cut the time commitment significantly.

23
3) Overlay externally gathered information concerning community capacity for mass transitagainst future participants in a study. Even in the same geographic area, work with thislimited sample could not account for variations that might have occurred because a surveyedplant was next door to a mass transit stop, for example. (See item #2 above for discussion ofquestions that might be added to POC to help differentiate such factors.)
4) Perhaps a more limited attempt could be made to evaluate supervisor/ETC pairs. Ideally thismay need to be done in person. The overriding question is, “What relationship dynamicsbetween the ETC and their supervisor leads to an effective program or interferes withobtaining an effective program?”
5) Participation in the study, whether through pairs or ETCs, could possibly be enhanced byworking through local ride-share group networks. If there are any meetings where ETCs arephysically grouped together, perhaps administering the instruments in person to a “captive”audience and then sending them the results, with offer of a telephone conference call recap,could be more effective from a time standpoint.
6) CUTR staff as well as our own staff noted that there has been password confusion betweenthe automatically generated password required by DiSC and the password to get into thewebsite assigned by CUTR. In consulting with DiSC, we learned that they have developedand twice beta-tested a new procedure, which could be used to circumvent theseadministrative problems. With this methodology, the University would be set up with a subaccount, however, the data could still be controlled by the interpreting researcher. There is a$1,500 front-end cost to accomplish this and therefore the procedure would not have beencost-effective for a small sample. With several hundred people participating, it could beworthwhile to investigate.

24
Researcher Credentials
Harold T. Welch, Ph.D., SPHRPresident, High Performance Coaching
Harold Welch has broad experience initiating organizational effectiveness processes for nationaland multi-national applications and for independent, private enterprises. Working as both aninternal and an external consultant, Harold has over twenty years of experience providing coachingand consulting services for companies in oil and gas, health care, manufacturing, utility,transportation, government, construction, entertainment, and non-profit industries.
Dr. Welch has a degree in Management with a master’s degree in Counseling and a doctorate inAdult Education. He is a Certified Career Management Practitioner (CMP) and Senior Professionalin Human Resources (SPHR), and a professional member of the American Counseling Association(ACA).
Experience with FIRO-B• Used with executive coaching, team building, and career development, Dr. Welch has applied hisknowledge of the FIRO-B to overcome organizational performance obstacles and barriers to morehealthy relations between people. The FIRO-B has proven to be a useful tool to demonstrate howconflicting interpersonal needs can interfere with authentic communications.
Experience with POC• Dr. Welch has used the POC instrument for organizations with 3,000 survey participants. Data hasbeen gathered to provide a reference for the senior management team to monitor the impact ofexisting management style and to initiate management changes for desired effect. One seniormanager remarked, “This POC feedback gives me a map of the organization that helps see andunderstand how the management tools I use really changes the way people work.”
Experience with CVAT• The CVAT has given valuable feedback on an individual, team, and organizational level. Whenused with a small organization with 56 employees, data from the CVAT highlighted fundamentaldifferences that had developed between departments and work groups. Employees had conflictingperceptions of what the senior staff considered to be the most important issues facing theorganization. By using the CVAT the senior management team was able to draft a culture changeprocess that incorporated the diverse values that was fragmenting the organization. The result was acohesive and consistent message from senior management, acceptance of a unified purpose withcommon objectives, and movement toward a desired organizational culture.

25
Nancy L. Brown, MBA, CAEPresident, Designs in Development, Inc.
Nancy L. Brown has 18 years of consulting experience ranging from team building to conflictresolution and from strategic planning to staff and volunteer training. She has worked with over 200units of government, schools, professional and non-profit associations. Certifications includeCertified Association Executive, preparing her to develop associations of industry professionals infields ranging from accounting to tennis. Ms. Brown has special expertise in developing voluntaryboards, whether advisory or governing, of the sort often approving community transportationinitiatives. Clients have included County Planning Departments and Community Commuter Serviceadvocacy organizations.
Ms. Brown speaks nationally, is the author of a text entitled Increasing Board Effectiveness whichis used in the University of South Florida ‘s non-profit certificate program in conjunction with theDiSC instrument. She has also served as an adjunct professor for Indiana University and St.Petersburg College.
Experience with the DiSCMs. Brown has administered the DiSC instrument to several thousand persons over the last 18years. She has used it for team building, and in counseling environments to compare anemployee’s perception of his/her job with that of an employer’s. She has also used it as a basisfor volunteer training and for sales training within organizations.
Ms. Brown is also certified to administer the Myers Briggs Personality Profile and also uses it incoaching and training environments in combination with the DiSC instrument.

26
Validity and Reliability of Instruments
DiSC (excerpted from Inscape Publishing, 2800 Series, Research Report)
DiSC Validity There are many ways to measure validity. One approach is to determinethe extent to which the association among scores represents the theoryand model on which the instrument is based.
In the DiSC-model, Scales D (Dominance) and S (Steadiness) are, tosome degree, opposites. So, we would expect to find that those twoscales will be somewhat inversely related (negatively correlated).
In the same way, Scales i (Influence) and C (Conscientiousness) are, tosome degree, opposites. We would also expect them to be inverselyrelated.
If each scale measures something different from other scales, thecorrelation among scales should be smaller than the reliability of theindividual scale. This condition is met when the value of a reliabilitycoefficient is significantly larger than any of the correlations in the samerow and column as that number.
The reliability table below shows reliability coefficients along withinter-scale correlations, to reveal the relationships found for the sample.Note that the reliability coefficients have been adjusted using theSpearman-Brown Formula to compensate for any underestimation dueto scale length.
DiSC Table 3. Adjusted Validity Coefficients and Inter-Scale Correlations AmongTotal Scores (N=812)
D-Most i-Most S-Most C-Most D-Least i-Least S-Least C-Least D-Most .92
i-Most -.07 .89
S-Most -.73 -.21 .88
C-Most -.18 -.63 .11 .84
D-Least -.79 -.04 .73 .26 .92
i-Least .10 -.67 .13 .56 -.07 .85
S-Least .73 .18 -.74 -.20 -.78 -.15 .88
C-Least .33 .60 -.33 -.64 -.46 -.56 .33 .86
(Note: Adjusted reliability coefficients are shown in bold along the diagonal of thetable. Inter-scale correlations are shown below the diagonal.)

27
Results Summary The 2800 Series of the Personal Profile System® used in this study isconsiderably more reliable than the 24-box Personal Profile System 6.1instrument had been marketed previously. For comparison purposeswith 24-box instruments, reliabilities of the 24-box DiSC® instrumentare given below.
Comparing results in Table 4 with those shown in Table 3 above, youwill note that reliabilities were significantly improved for i and C scales.Reliability of C-Most went from .36 to .72 and C-Least from .52 to .74.Similarly, i scale reliabilities increased to .79 for i-Most and .74 for i-Least.
Table 4. Reliabilities of 24-Box DISC InstrumentsReliability of 24-BoxDISC Instruments D-Most .79 D-Least .76
i-Most .50 i-Least .47S-Most .61 S-Least .59C-Most .36 C-Least .52
Reliability of PersonalProfile System® 2800Series (N=812)
As shown on Table 2, Graph III reliabilities range from .85 to .92.Commonly accepted standards require learning instruments todemonstrate reliabilities above .70. The results obtained on thePersonal Profile System 2800 Series are considered to be very good.
FIRO-B (Fundamental Interpersonal Relations orientation - Behaviors)
Validity• Content validity: determined by showing how well the content of the test samples the
class of situations or the subject matter about which conclusions are to be drawn. Contentvalidity is a property of all legitimate scales.
• Concurrent validity: showing how well test scores correspond to measures of concurrentcriterion performances or status. Refers to studies that attempt to demonstrate differences,on the basis of the measuring instrument, between already existent groups or betweenpeople with already know attitudes. To demonstrate the FIRO-B ability to measureinterpersonal relations, there should be evidence that parallel assumptions related to allsituations in which the interpersonal element is significant. Studies are presented thatinclude an investigation of FIRO-B and political attitudes, occupational choice, andconformity behavior. These studies represent several different areas where there was anopportunity to measure concurrent validity. Schutz, W. FIRO: A Three-DimensionalTheory of Interpersonal Behavior. Will Schutz Associates, Inc. 1958. Chapter 4, pp. 66-80.
• Predictive validity: showing how well predictions made from the test are confirmed byevidence gathered at some subsequent time.

28
• Construct validity: evaluated by investigating what psychological qualities a testmeasures, for example, by demonstrating that certain explanatory concepts account tosome degree for performance on the test. Essentially, it is a validation of the theoryunderlying the test. “Since FIRO-B is designed to test a theory, virtually every study inthis book is relevant to predictive [and construct] validity.” (Schutz, p. 77.)
Reliability• Coefficient of Internal Consistency: the measure based on internal analysis of data
obtained on a single trial. Essentially, this measure indicates the degree to which theitems are homogeneous, or measuring the same thing. The most usual test for internalconsistency is the split-half method, the correlation between scores on two halves of thetest.
The usual criterion for reproducibility is that 90 percent of all responses are predictable fromknowledge of scale scores. The FIRO-B scales were developed on about one thousand subjectsand the reproducibility computed for the remainder of the sample. The reproducibility for allscales is very high and consistent over all samples. These reproducibility scores are thecoefficients of internal consistency.
Scale Reproducibility No. of SubjectsIe .94 1615Iw .94 1582Ce .93 1554Cw .94 1574Ae .94 1467Aw .94 1467
Mean .94 1543
Guttman, L. “The basis for scalogram analysis.” In S. Stouffer et al., Measurement andPrediction, Princeton, N.J.: Princeton Univ. Press, 1950.
Profile of Organizational Characteristics (POC)
ValidityChapters 3 and 4 of The Human Organization: Its Management and Value contain informationabout validity, but not expressed as coefficients. For example, information about the WeldonPlant study shows the improvement in the profile with related performance improvements.Seashore and Bowers published additional data on the Weldon plant in a 1970 paper, “Durabilityof Organizational Change” (American Psychologist, 25-3, March 1979). Even more supportingdata on linking management style to performance improvement is provided in New Ways ofManaging Conflict, Likert and Likert, (New York: McGraw-Hill Book Co., 1976).
Concurrent validity requires a survey have empirical association with some criterion or "goldstandard" (DeVellis, 1991). This requires identification of an established, generally accepted test(Litwin, 1995). A high correlation coefficient between the survey and the standard test suggests

29
good concurrent validity. To validate the Organizational Culture Assessment (OCA), the resultswere compared to the Likert POC. The correlation between the OCA data and the Likert POCdata is .95. An analysis of variance produced a significant F-value of .000, indicating that theOCA and the Likert POC are related. Analysis of the residuals indicated the errors are normallydistributed and that the order of the model is correct. The high correlation and the ANOVAindicate that the OCA and POC have high concurrent validity.
ReliabilityA reliable survey is consistent in what it measures. The type of reliability used is internalconsistency reliability. Internal consistency uses a single survey to determine the degree to whichthe questions in the survey are measuring the same thing. The methods used for measuringinternal consistency are split-half reliability. The Human Organization: Its Management andValue, Likert, Rensis, (New York: McGraw-Hill Book Co., 1967), Chapter 7, gives reliabilitydata or inter-correlations from which reliability can be computed or estimated. The 18-item FormS usually yields split-half reliability in the .90 to .96 range when applying the Spearman-Brownformula for estimating the reliability from the r between two halves of the form.
Culture and Values Analysis Tool (CVAT)
Rational and AccountabilityThe CVAT uses dimensions and sub-dimensions to describe individual priorities that determine apersonal values map. Convergence of Iterated Correlations (CONCOR) statistical applicationsare then utilized to describe a culture model of a group of members based on the summary ofindividual value choices. The CVAT protocol is able to discern how organizations and peoplehandle trade-offs as they are required to deal with organizational forces that require choices ofaction or response.
Universal cultural themes involve selections or the prioritization of choices between peopleorientation and production orientation at an individual level (Blake and Mouton 1964; Larson etal. 1976; Nystrom, 1978).
Three principal forces that exist in organizations create tension within the individual and in theorganization. David McClelland (1961) identifies a need for achievement, need for affiliation,and need for power as the basic forces underlying human motivation. Alderfer (1969) alsoidentifies three basic needs (existence, relatedness, and growth) which can be loosely related topower or security, relations, and task achievement.
The CVAT captures these forces in dimensions referred to as Work, Relations, and Control. Anadditional CVAT dimension is added to capture information about cognition or thought, afundamental theme within organizational settings that frequently clashes with the other valuescategories (Nelson 1997). Each dimension is then identified by four sub-dimensions providing16 themes that are usually contradictory but occasionally complementary. Responses toquestions about these sub-dimensions provide a means to apply statistical analysis of clusters ofsimilar responses to describe values and subsequent culture.

30
CONCOR is an algorithm developed by sociologists at Harvard and is commonly used inanalyzing social networks and is applied in the CVAT to locate clusters of individuals withsimilar opinions. CONCOR works by comparing each respondent’s scores on all 16 CVATdimensions with every other person’s scores. When CVAT responses are clustered into groups ofindividuals with statistically similar responses of value profiles the researcher will thendetermine from demographic information whether there is evidence of cultural disparity betweenthe groupings.
Alderfer, Clayton L. 1969. An empirical test of new theory of human needs. OrganizationalBehavior and Human Performance, May: 142-175.
Blake, Robert R., and Jane W. Mouton, 1964. The managerial grid. Houston: Gulf.
Larson, Lars R., Jerry G. Hunt, and Richard H. Osborne. 1976. The great hi-hi leader behaviormyth: A lesson from Occam’s razor. Academy of Management Journal, December: 628-641.
McClelland, David C. 1961. The achieving society. Princeton, NJ: Von Nostrand Reinhold.
Nelson, Reed E., and K. Michael Mathews. 1991. The social networks of high performingorganization. Journal of Business Communications, 28: 367-386.
Nystrom, Paul C. 1978. Managers and the great hi-hi leader myth. Academy of ManagementJournal, June: 325-331.

31
Attachment A:Summary of Demographic Information Collected from POC
1. What is your age group?1. under 25 (0)2. 26-35 (4)3. 36-45 (4)4. 46-55 (3)5. over 55 (3)
2. Which response best describes your education level?1. No college. (0)2. Some college with no degree, or 2-year degree. (4)3. Bachelor-level degree (four year). (5)4. Master-level degree or above. (5)
3. Which response best describes the functional area of your education?1. Business/Economics (8)2. Education/History/Social Science (1)3. Engineering (2)4. General education (2)6. Political Science/Law (1)
4. How many total years work experience do you have?37, 35, 31, 30, 30, 30, 23, 22, 20, 17, 16, 15, 8, 4,
5. How many years have you worked for this organization?27, 20, 17, 12, 11, 10, 9, 7, 7, 5, 5, 4, 4, 2
6. How many years have you been designated ETC or supervised the ETC position?10, 10, 7, 6, 3, 3, 3, 3, 2.5, 2.5, 2.4, 2.4, 2, 1.5
7. Which response best describes your functional work area?Accounting, Finance, Bookkeeping, Payroll (1)Administration, Facilities, Health & Safety (3)Consulting (1)General staff role, Executive Assistant (3)Manufacturing (1)Procurement, Purchasing, Warehouse (3)Production/Operations, customer service (2)
8. The Employee Transportation Program at this location satisfies the intent of the program.Strongly Agree (6)Agree (7)Disagree (1)Strongly Disagree (0)

32
9. Local managers support this program in a way that contributes to its success.Strongly Agree (6)Agree (7)Disagree (1)Strongly Disagree (0)
10. It is clear that top managers believe this program is important.Strongly Agree (2)Agree (11)Disagree (1)Strongly Disagree (0)
11. There is adequate funding for the success of this program.Strongly Agree (4)Agree (8)Disagree (1)Strongly Disagree (1)
12. Employees consider the purpose of this program to be important.Strongly Agree (3)Agree (9)Disagree (1)Strongly Disagree (1)
13. Local managers and supervisors consider this program to be important.Strongly Agree (2)Agree (12)Disagree (0)Strongly Disagree (0)
14. My other work priorities are such that I have an appropriate amount of time for this program.Strongly Agree (3)Agree (10)Disagree (1)Strongly Disagree (0)

33
Attachment B: Profile of Organizational Characteristics (POC)Summary of Questions
Survey participant respond to the following questions with a Likert scale ranging from 0 to 8.Part “a” of each question asks how the respondent perceives the work unit now. Part “b” of eachquestion asks how the respondent thinks it should be.
Topic: Leadership
1. a) How much confidence and trust is generally shown in subordinates?b) How much confidence and trust should be shown in subordinates?
2. a) How free do subordinates feel to talk to superiors about their work?b) How free should subordinates feel to talk to superiors about their work?
3. a) How often are the ideas of subordinates sought and used constructively?b) How often should the ideas of subordinates be sought and used constructively?
Topic: Motivation
4. a) In your organization, which of the following is the predominant form of motivation: fear,threats, punishment, rewards, or involvement?b) In your organization, which of the following should be the predominant form ofmotivation: fear, threats, punishment, rewards, or involvement?
5. a) Where is there a true sense of responsibility for the organization's level of performance?b) Where should there be a true sense of responsibility for the organization's level ofperformance?
6. a) How much cooperative teamwork exists in this organization?b) How much cooperative teamwork should exist in the organization?
Topic: Communication
7. a) What is the general direction of the flow of information needed for decisions about workprocesses and priorities?b) What should be the general direction of the flow of information needed for decisions aboutwork processes and priorities?
8. a) How is the communication of information from upper levels of the organization generallyreceived by lower levels of the organization?b) How should the communication of information from upper levels of the organization begenerally received by lower levels of the organization?
9. a) How accurate is upward communication?b) How accurate should upward communication be?
10. a) How well do superiors understand the problems faced by subordinates?b) How well should superiors understand the problems faced by subordinates?

34
Topic: Decisions
11. a) At what levels are decisions made in your organization?b) At what levels should decisions be made in your organization?
12. a) How often are subordinates involved in decisions that determine the processes andprocedures of their work?b) How often should subordinates be involved in decisions that determine the processes andprocedures of their work?
Topic: Goals
13. a) How are performance goals usually set?b) How should performance goals usually be set?
14. a) How much do subordinates strive to achieve the organization's goals?b) How much should subordinates strive to achieve the organization's goals?
Topic: Controls
15. a) Where is responsibility for review and control functions found in the organization?b) Where should responsibility for review and control functions be found in the organization?
16. a) How are cost, productivity, and other reports containing control data used?b) How should cost, productivity, and other reports containing control data be used?

35
Attachment C: Overview of CVAT Terms
WORK Task Orientation
A. Effort
B. Time
C. Finish Job
D. Quality
Sweat of the brow, often greatest when time is at stake.
Speed orientation; need to get things done now; the "executive trot".
Priority given to finish tasks; drive for closure; end justifies the means.
Emphasis on time or finish job robs from ability to achieve total quality.
RELATIONS Relates to Voluntary Connections With Others
E. Affect
F. Empathy
G. Sociability
H. Loyalty
Getting warmth, intimacy. Brings one close to others to get nurturance.
Desire to understand and care for. Brings closeness to give nurturance.
Focuses on closeness to groups rather than individuals.
Emphasizes durable, long-lasting closeness to people or organizations.
CONTROL How You Attempt to Influence Your Environment
I. Dominance
J. Status
K. Political
L. Leader
Imposing one's will openly and without contrivance.
Create symbolic inequalities between individuals.
Imposing one's will principally through manipulation or leverage.
Secures control through charisma or "referent" power.
THOUGHT Cognition, Thinking in Rational or Creative Terms
M. Abstract
N. Plan/Organize
O. Exposition
P. Flexibility
Deals with generalities and big picture concepts; vision.
Tends to focus on details and order; objectives.
Deals with the transmission of produced ideas.
Individual creativity or organizational adaptability.

36
Attachment D: Table Addenda (Repeated)Attachment D: Table Addenda detail, continued
Attachment D: Table Addenda detail, continued
Table 1:Overview of FIRO-B Responses (n=15) ...........................................................................37Table 2:Comparison of FIRO-B Responses by Program Performance ..........................................38Table 3:Comparison of FIRO-B Responses by ETC-Supervisor Position .....................................40Table 4:Comparison of This study With Other Studies Using FIRO-B .........................................41Table 5:Overview of POC Responses (n=14).................................................................................42Table 6:Difference between high/low performing program in how the work unit is seen now .....44Table 7:Difference between high/low performing program in how the work unit should be.........46Table 8:Difference between how ETCs and their supervisors perceive their work unit to beNow....................................................................................................................................48Table 9:Difference between how ETCs and their supervisors think their work unit should be .....49Table 10:Overview of responses to demographic questions.............................................................51Table 11:Overview of CVAT Part 1 Responses on Personal Values (n=14) ...................................52Table 12:Overview of CVAT Part 2 Responses on Work Unit Culture (n=14) ...............................54Table 13:Difference between ETC and Supervisor perception of personal values ..........................56Table 14:Difference between ETC and Supervisor perception of work unit culture........................58Table 15:Difference in perception of personal values between high and low performingPrograms ........................................................................................................................... 60Table 16:Difference in perception of work unit culture between high and low performingPrograms ............................................................................................................................62Table 17:Chart III from DiSC -- the “official” report ......................................................................64Table 18Chart I and II from DiSC -- anecdotal observations ..........................................................65

37
Table 1: Overview of FIRO-BResponses
Code Ie Ce Ae Iw Cw Aw Te Tw Tt It Ct At TtE02 5 0 5 6 2 4 10 12 22 11 2 9 22E04 4 3 7 7 5 7 14 19 33 11 8 14 33E08 3 5 3 0 3 0 11 3 14 3 8 3 14E09 4 2 1 0 2 1 7 3 10 4 4 2 10E10 6 1 4 0 2 4 11 6 17 6 3 8 17E11 5 0 3 4 8 3 8 15 23 9 8 6 23E14 7 3 8 8 1 3 18 12 30 15 4 11 30E15 4 2 3 0 6 5 9 11 20 4 8 8 20E17 4 3 3 8 1 7 10 16 26 12 4 10 26E21 4 3 1 0 3 5 8 8 16 4 6 6 16E22 6 1 5 2 4 6 12 12 24 8 5 11 24E24 4 3 1 0 1 3 8 4 12 4 4 4 12S12 3 1 3 1 4 5 7 10 17 4 5 8 17S20 6 1 3 0 2 5 10 7 17 6 3 8 17S26 3 8 2 0 1 0 13 1 14 3 9 2 14Mean 4.5 2.4 3.5 2.4 3.0 3.9 10.4 9.3 19.7 6.9 5.4 7.3 19.7s.d. 1.2 2.1 2.1 3.2 2.1 2.2 3.0 5.3 6.6 3.8 2.3 3.5 6.6
d (e-w) 2.1 -0.6 -0.4
Table 1 Footnotes:
Ie = expressed InclusionCe = expressed ControlAe = expressed Affection (openness)Iw = wanted InclusionCw = wanted ControlAw = wanted Affection (openness)It = total InclusionCt = total ControlAt = total Affection (openness)Te = Total expressed needTw = Total wanted needTt = Overall Total scoreRefer to narrative on FIRO-B instrument for further description of elements.

38
Mean: arithmetic mean is the sum of a set of measurements divided by the number ofmeasurements in the set. For this study, arithmetic mean provides a better measure of centrallocation to estimate a population parameter than other expressions of average, such as mode,median, or geometric mean.
s.d. = standard deviation. The square root of the mean of the sum of squared variances frommean. Used as a measure of dispersion that refers to the variability or spread in the data.
d (e-w) = delta, or difference, between mean “e” (expressed) scores and mean “w” (wanted)scores.
Table 2: Comparison of FIRO-B Responses by ProgramPerformance
Top Ie Ce Ae Iw Cw Aw Te Tw Tt It Ct At TtE08 3 5 3 0 3 0 11 3 14 3 8 3 14E09 4 2 1 0 2 1 7 3 10 4 4 2 10E14 7 3 8 8 1 3 18 12 30 15 4 11 30E17 4 3 3 8 1 7 10 16 26 12 4 10 26S12 3 1 3 1 4 5 7 10 17 4 5 8 17Mean 4.2 2.8 3.6 3.4 2.2 3.2 10.6 8.8 19.4 7.6 5.0 6.8 19.4d (e-w) 0.8 0.6 0.4 MiddleE02 5 0 5 6 2 4 10 12 22 11 2 9 22E04 4 3 7 7 5 7 14 19 33 11 8 14 33E10 6 1 4 0 2 4 11 6 17 6 3 8 17E15 4 2 3 0 6 5 9 11 20 4 8 8 20E22 6 1 5 2 4 6 12 12 24 8 5 11 24Mean 5.0 1.4 4.8 3.0 3.8 5.2 11.2 12.0 23.2 8.0 5.2 10.0 23.2d (e-w) 2.0 -2.4 -0.4BottomE11 5 0 3 4 8 3 8 15 23 9 8 6 23E21 4 3 1 0 3 5 8 8 16 4 6 6 16E24 4 3 1 0 1 3 8 4 12 4 4 4 12S20 6 1 3 0 2 5 10 7 17 6 3 8 17S26 3 8 2 0 1 0 13 1 14 3 9 2 14Mean 4.4 3.0 2.0 0.8 3.0 3.2 9.4 7.0 16.4 5.2 6.0 5.2 16.4d (e-w) 3.6 0.0 -1.2
Top-Bot -0.2 -0.2 1.6 2.6 -0.8 0.0 1.2 1.8 3.0 2.4 -1.0 1.6 3.0

39
Table 2 Footnotes:
Ie = expressed InclusionCe = expressed ControlAe = expressed Affection (openness)Iw = wanted InclusionCw = wanted ControlAw = wanted Affection (openness)It = total InclusionCt = total ControlAt = total Affection (openness)Te = Total expressed needTw = Total wanted needTt = Overall Total scoreRefer to narrative on FIRO-B instrument for further description of elements.
Mean: arithmetic mean: the sum of a set of measurements divided by the number ofmeasurements in the set. For this study, arithmetic mean provides a better measure of centrallocation to estimate a population parameter than other expressions of average, such as mode,median, or geometric mean.
s.d. = standard deviation. The square root of the mean of the sum of squared variances frommean. Used as a measure of dispersion that refers to the variability or spread in the data.
d (e-w) = delta, or difference, between mean “e” (expressed) scores and mean “w” (wanted)scores.
Top-Bot = Mean scores of participants representing five organizations with highest ranking oftransportation program effectiveness minus the mean score of participants representing fiveorganizations with lowest ranking of transportation program effectiveness.

40
Table 3: Comparison of FIRO-B Responses by ETC-Supervisor Position
ETC Ie Ce Ae Iw Cw Aw Te Tw Tt It Ct At TtE02 5 0 5 6 2 4 10 12 22 11 2 9 22E04 4 3 7 7 5 7 14 19 33 11 8 14 33E08 3 5 3 0 3 0 11 3 14 3 8 3 14E09 4 2 1 0 2 1 7 3 10 4 4 2 10E10 6 1 4 0 2 4 11 6 17 6 3 8 17E11 5 0 3 4 8 3 8 15 23 9 8 6 23E14 7 3 8 8 1 3 18 12 30 15 4 11 30E15 4 2 3 0 6 5 9 11 20 4 8 8 20E17 4 3 3 8 1 7 10 16 26 12 4 10 26E21 4 3 1 0 3 5 8 8 16 4 6 6 16E22 6 1 5 2 4 6 12 12 24 8 5 11 24E24 4 3 1 0 1 3 8 4 12 4 4 4 12Mean 4.7 2.2 3.7 2.9 3.2 4.0 10.5 10.1 20.6 7.6 5.3 7.7 20.6d (e-w) 1.8 -1.0 -0.3
SupvS12 3 1 3 1 4 5 7 10 17 4 5 8 17S20 6 1 3 0 2 5 10 7 17 6 3 8 17S26 3 8 2 0 1 0 13 1 14 3 9 2 14Mean 4.0 3.3 2.7 0.3 2.3 3.3 10.0 6.0 16.0 4.3 5.7 6.0 16.0d (e-w) 3.7 1.0 -0.7
ETC-Sup 0.7 -1.2 1.0 2.6 0.8 0.7 0.5 4.1 4.6 3.3 -0.3 1.7 4.6
Table 3 Footnotes:
Ie = expressed InclusionCe = expressed ControlAe = expressed Affection (openness)Iw = wanted InclusionCw = wanted ControlAw = wanted Affection (openness)It = total InclusionCt = total ControlAt = total Affection (openness)Te = Total expressed needTw = Total wanted needTt = Overall Total score

41
Refer to narrative on FIRO-B instrument for further description of elements.
Mean: arithmetic mean is the sum of a set of measurements divided by the number ofmeasurements in the set. For this study, arithmetic mean provides a better measure of centrallocation to estimate a population parameter than other expressions of average, such as mode,median, or geometric mean.
s.d. = standard deviation. The square root of the mean of the sum of squared variances frommean. Used as a measure of dispersion that refers to the variability or spread in the data.
d (e-w) = delta, or difference, between mean “e” (expressed) scores and mean “w” (wanted)scores.
ETC-Sup = Mean scores of participating ETCs minus the mean scores of Supervisors of ETCs.
Table 4: Comparison Trip Reduction Program (TRP) With Other Studies UsingFIRO-B
Ie Ce Ae Iw Cw Aw Te Tw Tt It Ct At TtTRP Study (n=14) 4.5 2.4 3.5 2.4 3.0 3.9 10.4 9.3 19.7 6.9 5.4 7.3 19.7Ed. Administrators (n=104) 5.9 4.7 4.4 4.6 5.5 5.1 15.0 15.2 30.2 10.5 10.2 9.5 30.2Teachers (n=677) 5.2 3.1 3.7 3.4 5.1 4.3 12.0 12.8 24.8 8.6 8.2 8.0 24.8Traveling Salesmen (n=39) 6.4 5.6 6.1 7.0 4.4 6.9 18.1 18.3 36.4 13.4 10.0 13.0 36.4Creative Architects (n=40) 2.7 5.4 2.6 1.7 3.1 4.4 10.7 9.2 19.9 4.4 8.5 7.0 19.9
Table 4 Footnotes:
Source: Will Schutz, Ph.D., “FIRO Awareness Scales Manual,” Table 4: FIRO-B Scores forOccupational Groups, Consulting Psychologists Press, Inc., Palo Alto, CA, 1978, pg. 10
Descriptive groups were selected to provide comparison with similar, small and moderate sizesamples of workplace professionals.
Ie = expressed InclusionCe = expressed ControlAe = expressed Affection (openness)Iw = wanted InclusionCw = wanted ControlAw = wanted Affection (openness)It = total InclusionCt = total ControlAt = total Affection (openness)Te = Total expressed needTw = Total wanted needTt = Overall Total scoreRefer to narrative on FIRO-B instrument for further description of elements.

42
Table 5: Overview of POC Responses(n=14)
Now All 1. a) 2. a) 3. a) 4. a) 5.a) 6.a) 7.a) 8.a) 9.a) 10.a) 11.a) 12.a) 13.a) 14.a) 15.a) 16.a)E02 5 5 6 5 2 6 5 5 6 5 4 6 5 6 3 4E04 5 7 6 7 7 7 7 6 5 3 5 5 5 5 3 7E10 5 5 5 7 7 5 5 5 5 5 4 4 6 6 5 5E11 5 6 6 6 5 4 4 5 5 4 5 5 3 5 4 4E14 5 4 4 6 5 6 7 4 6 6 5 3 3 7 7 5E17 7 4 3 7 6 6 3 3 6 1 2 2 7 7 7 5E21 5 6 7 7 6 5 6 5 6 5 5 7 1 5 5 4E22 8 8 8 7 5 5 3 5 5 5 7 5 7 5 5 3E24 5 7 5 7 5 7 7 5 7 3 7 3 5 5 5 5E25 4 5 6 3 7 5 7 4 7 6 5 5 5 5 3 5S12 7 6 7 5 5 6 7 5 5 5 5 5 5 7 3 5S20 7 7 5 7 7 6 7 6 7 7 6 7 7 7 7 6S23 4 5 4 4 3 3 3 3 5 7 5 3 1 2 3 3S26 7 7 7 7 7 5 3 7 7 7 7 5 5 7 5mean 5.6 5.9 5.6 6.0 5.5 5.6 5.4 4.6 5.9 4.9 5.1 4.8 4.6 5.5 4.8 4.7
Should All 1. b) 2. b) 3. b) 4. b) 5.b) 6.b) 7.b) 8.b) 9.b) 10.b) 11.b) 12.b) 13.b) 14.b) 15.b) 16.b)E02 7 7 7 7 5 7 7 7 7 7 7 8 7 7 7 7E04 5 7 7 7 7 7 7 8 7 7 6 7 5 7 5 7E10 5 5 5 7 7 5 7 5 7 5 5 5 6 6 6 5E11 5 7 5 7 7 6 7 7 7 7 7 7 5 7 7 6E14 6 5 5 6 5 6 7 6 6 6 7 5 5 7 7 5E17 7 5 6 7 7 7 7 7 7 8 7 7 7 7 7 6E21 5 6 7 7 7 6 7 5 7 7 5 7 5 7 6 5E22 8 8 8 7 7 7 7 7 7 7 7 5 7 5 5 7E24 3 5 5 7 5 7 3 5 7 3 7 5 5 5 7 5E25 5 5 7 7 7 6 7 5 7 7 5 5 7 7 3 5S12 7 7 7 5 7 7 7 5 7 6 6 5 5 7 3 5S20 7 7 5 7 7 7 7 7 7 7 6 7 7 7 8 6S23 5 7 5 5 5 5 6 7 7 7 5 5 5 5 7 7S26 7 7 7 7 8 8 7 8 8 8 8 7 5 8 5mean 5.9 6.3 6.1 6.6 6.4 6.5 6.7 6.3 7.0 6.6 6.3 6.1 5.9 6.4 6.1 5.8
Now-Should -0.2 -0.4 -0.5 -0.6 -0.9 -0.9 -1.3 -1.7 -1.1 -1.6 -1.1 -1.4 -1.3 -0.9 -1.4 -1.1

43
Table 5 Footnotes:
Profile of Organizational Characteristics (see questions in Attachment B)a) questions = How do you see your organization now?b) questions = How do you think your organization should be?
Summary of question topics:Leadership1. confidence and trust2. subordinates talk to superiors3. ideas of subordinates soughtMotivation4. predominant form of motivation5. responsibility for performance6. cooperative teamworkCommunication7. direction of flow of information8. communication received by lower levels9. accurate upward communication10. superiors understand problems of subordinatesDecisions11. levels decisions made12. subordinates involved in decisionsGoals13. performance goals set14. subordinates strive to achieve goalsControls15. review and control functions16. cost, productivity, and other reports used
Mean: arithmetic mean is the sum of a set of measurements divided by the number ofmeasurements in the set. For this study, arithmetic mean provides a better measure of centrallocation to estimate a population parameter than other expressions of average, such as mode,median, or geometric mean.
Now-Should = mean of each “now” questions minus mean of each “should” question.

44
Table 6: POC -- Difference between high and low performing program in how the workunit is seen now.
Now high 1. a) 2. a) 3. a) 4. a) 5.a) 6.a) 7.a) 8.a) 9.a) 10.a) 11.a) 12.a) 13.a) 14.a) 15.a) 16.a)E02 5 5 6 5 2 6 5 5 6 5 4 6 5 6 3 4E04 5 7 6 7 7 7 7 6 5 3 5 5 5 5 3 7E10 5 5 5 7 7 5 5 5 5 5 4 4 6 6 5 5E14 5 4 4 6 5 6 7 4 6 6 5 3 3 7 7 5E17 7 4 3 7 6 6 3 3 6 1 2 2 7 7 7 5S12 7 6 7 5 5 6 7 5 5 5 5 5 5 7 3 5S23 4 5 4 4 3 3 3 3 5 7 5 3 1 2 3 3Mean high 5.4 5.1 5.0 5.9 5.0 5.6 5.3 4.4 5.4 4.6 4.3 4.0 4.6 5.7 4.4 4.9
Now low 1. a) 2. a) 3. a) 4. a) 5.a) 6.a) 7.a) 8.a) 9.a) 10.a) 11.a) 12.a) 13.a) 14.a) 15.a) 16.a)E11 5 6 6 6 5 4 4 5 5 4 5 5 3 5 4 4E21 5 6 7 7 6 5 6 5 6 5 5 7 1 5 5 4E22 8 8 8 7 5 5 3 5 5 5 7 5 7 5 5 3E24 5 7 5 7 5 7 7 5 7 3 7 3 5 5 5 5E25 4 5 6 3 7 5 7 4 7 6 5 5 5 5 3 5S20 7 7 5 7 7 6 7 6 7 7 6 7 7 7 7 6S26 7 7 7 7 7 5 3 7 7 7 7 5 5 7 5Mean low 5.9 6.6 6.3 6.2 6.0 5.6 5.6 4.7 6.3 5.3 6.0 5.6 4.7 5.3 5.1 4.6
high-low -0.4 -1.4 -1.3 -0.3 -1.0 0.0 -0.3 -0.3 -0.9 -0.7 -1.7 -1.6 -0.1 0.4 -0.7 0.3
Table 6 Footnotes:
Profile of Organizational Characteristics (see questions in Attachment B)a) questions = How do you see your organization now?
Summary of question topicsLeadership1. confidence and trust2. subordinates talk to superiors3. ideas of subordinates soughtMotivation4. predominant form of motivation5. responsibility for performance6. cooperative teamworkCommunication7. direction of flow of information8. communication received by lower levels9. accurate upward communication
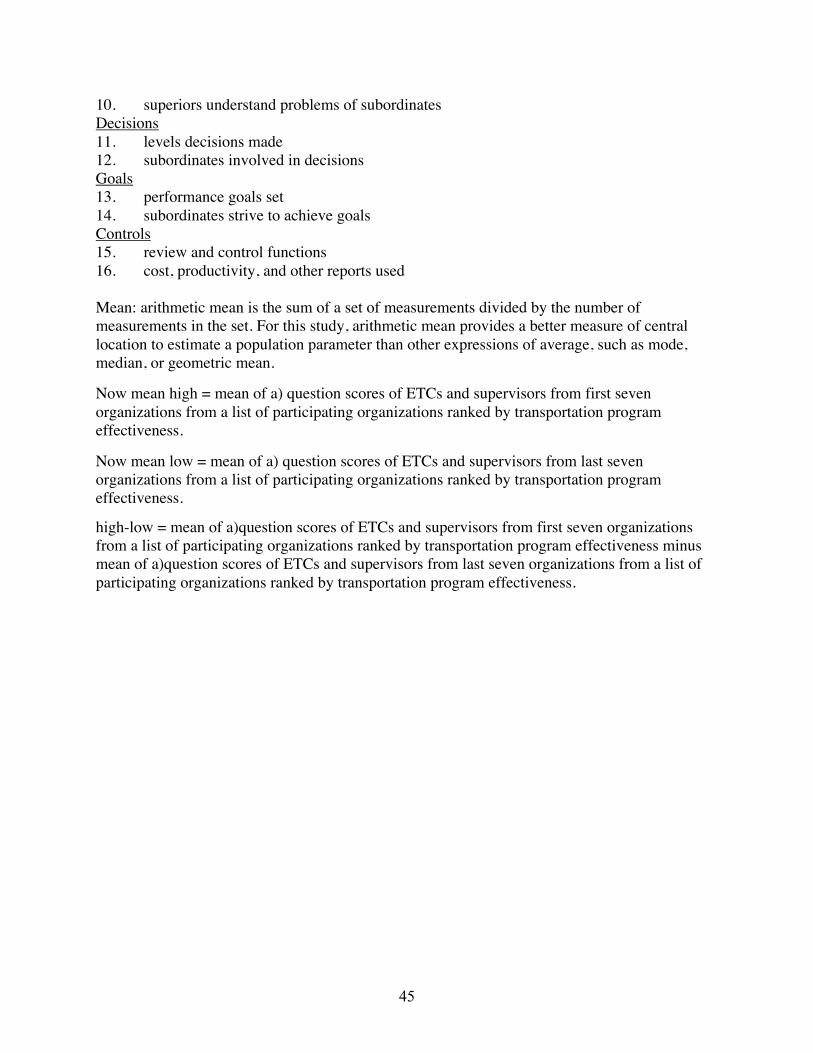
45
10. superiors understand problems of subordinatesDecisions11. levels decisions made12. subordinates involved in decisionsGoals13. performance goals set14. subordinates strive to achieve goalsControls15. review and control functions16. cost, productivity, and other reports used
Mean: arithmetic mean is the sum of a set of measurements divided by the number ofmeasurements in the set. For this study, arithmetic mean provides a better measure of centrallocation to estimate a population parameter than other expressions of average, such as mode,median, or geometric mean.
Now mean high = mean of a) question scores of ETCs and supervisors from first sevenorganizations from a list of participating organizations ranked by transportation programeffectiveness.
Now mean low = mean of a) question scores of ETCs and supervisors from last sevenorganizations from a list of participating organizations ranked by transportation programeffectiveness.
high-low = mean of a)question scores of ETCs and supervisors from first seven organizationsfrom a list of participating organizations ranked by transportation program effectiveness minusmean of a)question scores of ETCs and supervisors from last seven organizations from a list ofparticipating organizations ranked by transportation program effectiveness.

46
Table 7: POC -- Difference between high and low performing program in how the workunit should be.
Should high 1. b) 2. b) 3. b) 4. b) 5.b) 6.b) 7.b) 8.b) 9.b) 10.b) 11.b) 12.b) 13.b) 14.b) 15.b) 16.b)E02 7 7 7 7 5 7 7 7 7 7 7 8 7 7 7 7E04 5 7 7 7 7 7 7 8 7 7 6 7 5 7 5 7E10 5 5 5 7 7 5 7 5 7 5 5 5 6 6 6 5E14 6 5 5 6 5 6 7 6 6 6 7 5 5 7 7 5E17 7 5 6 7 7 7 7 7 7 8 7 7 7 7 7 6S12 7 7 7 5 7 7 7 5 7 6 6 5 5 7 3 5S23 5 7 5 5 5 5 6 7 7 7 5 5 5 5 7 7Mean high 6.0 6.1 6.0 6.3 6.1 6.3 6.9 6.4 6.9 6.6 6.1 6.0 5.7 6.6 6.0 6.0
Should low 1. b) 2. b) 3. b) 4. b) 5.b) 6.b) 7.b) 8.b) 9.b) 10.b) 11.b) 12.b) 13.b) 14.b) 15.b) 16.b)E11 5 7 5 7 7 6 7 7 7 7 7 7 5 7 7 6E21 5 6 7 7 7 6 7 5 7 7 5 7 5 7 6 5E22 8 8 8 7 7 7 7 7 7 7 7 5 7 5 5 7E24 3 5 5 7 5 7 3 5 7 3 7 5 5 5 7 5E25 5 5 7 7 7 6 7 5 7 7 5 5 7 7 3 5S20 7 7 5 7 7 7 7 7 7 7 6 7 7 7 8 6S26 7 7 7 7 8 8 7 8 8 8 8 7 5 8 5Mean low 5.7 6.4 6.3 7.0 6.7 6.7 6.6 6.1 7.1 6.6 6.4 6.3 6.1 6.1 6.3 5.6
hi-lo 0.3 -0.3 -0.3 -0.7 -0.6 -0.4 0.3 0.3 -0.3 0.0 -0.3 -0.3 -0.4 0.4 -0.3 0.4
Table 7 Footnotes:
Profile of Organizational Characteristics (see questions in Attachment B)b) questions = How do you think your organization should be?
Summary of question topicsLeadership1. confidence and trust2. subordinates talk to superiors3. ideas of subordinates soughtMotivation4. predominant form of motivation5. responsibility for performance6. cooperative teamworkCommunication7. direction of flow of information8. communication received by lower levels9. accurate upward communication10. superiors understand problems of subordinates

47
Decisions11. levels decisions made12. subordinates involved in decisionsGoals13. performance goals set14. subordinates strive to achieve goalsControls15. review and control functions16. cost, productivity, and other reports used
Mean: arithmetic mean is the sum of a set of measurements divided by the number ofmeasurements in the set. For this study, arithmetic mean provides a better measure of centrallocation to estimate a population parameter than other expressions of average, such as mode,median, or geometric mean.
Now mean high = mean of b) question scores of ETCs and supervisors from first sevenorganizations from a list of participating organizations ranked by transportation programeffectiveness.
Now mean low = mean of b) question scores of ETCs and supervisors from last sevenorganizations from a list of participating organizations ranked by transportation programeffectiveness.
High-low = mean of b) question scores of ETCs and supervisors from first seven organizationsfrom a list of participating organizations ranked by transportation program effectiveness minusmean of b) question scores of ETCs and supervisors from last seven organizations from a list ofparticipating organizations ranked by transportation program effectiveness.

48
Table 8: POC -- Difference between how ETC's and their supervisors perceive theirwork unit to be now.
ETC Now 1. b) 2. b)3. b)4. b)5.b) 6.b) 7.b)8.b) 9.b) 10.b) 11.b) 12.b) 13.b) 14.b) 15.b) 16.b)E02 5 5 6 5 2 6 5 5 6 5 4 6 5 6 3 4E04 5 7 6 7 7 7 7 6 5 3 5 5 5 5 3 7E10 5 5 5 7 7 5 5 5 5 5 4 4 6 6 5 5E11 5 6 6 6 5 4 4 5 5 4 5 5 3 5 4 4E14 5 4 4 6 5 6 7 4 6 6 5 3 3 7 7 5E17 7 4 3 7 6 6 3 3 6 1 2 2 7 7 7 5E21 5 6 7 7 6 5 6 5 6 5 5 7 1 5 5 4E22 8 8 8 7 5 5 3 5 5 5 7 5 7 5 5 3E24 5 7 5 7 5 7 7 5 7 3 7 3 5 5 5 5E25 4 5 6 3 7 5 7 4 7 6 5 5 5 5 3 5Mean ETC 5.4 5.7 5.6 6.2 5.5 5.6 5.4 4.7 5.8 4.3 4.9 4.5 4.7 5.6 4.7 4.7
Supv Now 1. b) 2. b)3. b)4. b)5.b) 6.b) 7.b)8.b) 9.b) 10.b) 11.b) 12.b) 13.b) 14.b) 15.b) 16.b)S12 7 6 7 5 5 6 7 5 5 5 5 5 5 7 3 5S20 7 7 5 7 7 6 7 6 7 7 6 7 7 7 7 6S23 4 5 4 4 3 3 3 3 5 7 5 3 1 2 3 3S26 7 7 7 7 7 5 3 7 7 7 7 5 5 7 5Mean Supv 6.3 6.3 5.8 5.3 5.5 5.5 5.5 4.3 6.0 6.5 5.8 5.5 4.5 5.3 5.0 4.8
ETC-Supv -0.9 -0.6 -0.2 0.9 0.0 0.1 -0.1 0.5 -0.2 -2.2 -0.9 -1.0 0.2 0.4 -0.3 0.0
Table 8 Footnotes:
Profile of Organizational Characteristics (see questions in Attachment B)
a) questions = How do you see your organization now?
Summary of question topics:Leadership1. confidence and trust2. subordinates talk to superiors3. ideas of subordinates soughtMotivation4. predominant form of motivation5. responsibility for performance6. cooperative teamworkCommunication7. direction of flow of information8. communication received by lower levels9. accurate upward communication10. superiors understand problems of subordinates

49
Decisions11. levels decisions made12. subordinates involved in decisionsGoals13. performance goals set14. subordinates strive to achieve goalsControls15. review and control functions16. cost, productivity, and other reports used
Mean: arithmetic mean is the sum of a set of measurements divided by the number ofmeasurements in the set. For this study, arithmetic mean provides a better measure of centrallocation to estimate a population parameter than other expressions of average, such as mode,median, or geometric mean.
ETC Now = mean of a) question scores of ETCs.
Supv Now = mean of a) question scores supervisors of ETCs.
ETC-Supv = mean of a) question scores of ETCs minus mean of a) question scores ofsupervisors of ETCs.
Table 9: POC -- Difference between how ETC's and their supervisors think their work unitshould be.
ETC Should 1. b) 2. b) 3. b) 4. b) 5.b) 6.b) 7.b) 8.b) 9.b) 10.b) 11.b) 12.b) 13.b) 14.b) 15.b) 16.b)E02 3 5 5 7 5 7 3 5 7 3 7 5 5 5 7 5E04 5 7 5 7 7 6 7 7 7 7 7 7 5 7 7 6E10 5 5 7 7 7 6 7 5 7 7 5 5 7 7 3 5E11 5 7 7 7 7 7 7 8 7 7 6 7 5 7 5 7E14 5 6 7 7 7 6 7 5 7 7 5 7 5 7 6 5E17 8 8 8 7 7 7 7 7 7 7 7 5 7 5 5 7E21 6 5 5 6 5 6 7 6 6 6 7 5 5 7 7 5E22 7 5 6 7 7 7 7 7 7 8 7 7 7 7 7 6E24 7 7 7 7 5 7 7 7 7 7 7 8 7 7 7 7E25 5 5 5 7 7 5 7 5 7 5 5 5 6 6 6 5Mean ETC 5.6 6.0 6.2 6.9 6.4 6.4 6.6 6.2 6.9 6.4 6.3 6.1 5.9 6.5 6.0 5.8
Supv. Should 1. b) 2. b) 3. b) 4. b) 5.b) 6.b) 7.b) 8.b) 9.b) 10.b) 11.b) 12.b) 13.b) 14.b) 15.b) 16.b)S12 7 7 7 5 7 7 7 5 7 6 6 5 5 7 3 5S20 7 7 5 7 7 7 7 7 7 7 6 7 7 7 8 6S23 5 7 5 5 5 5 6 7 7 7 5 5 5 5 7 7S26 7 7 7 7 8 8 7 8 8 8 8 7 5 8 5Mean Supv. 6.5 7.0 6.0 5.7 6.5 6.8 7.0 6.5 7.3 7.0 6.3 6.3 6.0 6.0 6.5 5.8ETC-Supv. -0.9 -1.0 0.2 1.2 -0.1 -0.4 -0.4 -0.3 -0.4 -0.6 0.0 -0.2 -0.1 0.5 -0.5 0.0

50
Table 9 Footnotes:Profile of Organizational Characteristics (see questions in Attachment B)
b) questions = How do you think your organization should be?
Summary of question topicsLeadership1. confidence and trust2. subordinates talk to superiors3. ideas of subordinates soughtMotivation4. predominant form of motivation5. responsibility for performance6. cooperative teamworkCommunication7. direction of flow of information8. communication received by lower levels9. accurate upward communication10. superiors understand problems of subordinatesDecisions11. levels decisions made12. subordinates involved in decisionsGoals13. performance goals set14. subordinates strive to achieve goalsControls15. review and control functions16. cost, productivity, and other reports used
Mean: arithmetic mean is the sum of a set of measurements divided by the number ofmeasurements in the set. For this study, arithmetic mean provides a better measure of centrallocation to estimate a population parameter than other expressions of average, such as, mode,median, or geometric mean.
ETC Should = mean of b) question scores of ETCs.
Supv Should = mean of b) question scores supervisors of ETCs.
ETC-Supv = mean of b) question scores of ETCs minus mean of b) question scores ofsupervisors of ETCs.

51
Table 10: Overview of responses to demographicquestions
Client Age Coll. Educ. Work Yrs. in Yrs. as Organizational Question NumbersCode Range Level area Exp. org ETC Function 8 9 10 11 12 13 14E02 2 C 1 17 17 2.5Operations 1 1 1 1 1 1 2E04 3 C 1 16 10 10Exec Asst 2 2 2 2 2 2 2E10 4 M 2 35 5 3Cust Svs 2 2 2 2 2 2 2E11 2 B 3 4 4 3Health & Saf 1 2 2 2 2 2 2E14 2 C 1 15 4 2Human Resc. 2 2 2 2 2 2 2E17 2 B 1 8 2 1.5Human Resc. 3 3 3 4 4 2 1E21 4 M 1 30 7 7Facilities 1 1 2 1 2 2 2E22 3 M 1 22 7 3Consulting 2 2 2 3 1 2 3E24 4 C 4 30 11 2.5Acct/Finance 2 1 2 2 2 2 2E25 3 B 4 23 5 2.4Quality 2 2 2 2 2 2 1S12 3 B 1 20 20 6Administration 1 1 2 1 2 2 2S20 5 B 1 31 9 3Operations 1 2 2 2 3 2 2S23 5 M 6 37 27 2.4Operations 1 1 1 1 1 1 1S26 5 M 3 30 12 10Pur./Warehse. 2 1 2 2 2 2 2
Responses to questions 8 - 14: 1 = Strongly Agree, 2 = Agree, 3 = Disagree, 4 = Strongly Disagree
8. The Employee Transportation Program at this location satisfies the intent of the program.
9. Local managers support this program in a way that contributes to its success.
10. It is clear that top managers believe this program is important.
11. There is adequate funding for the success of this program.
12. Employees consider the purpose of this program to be important.
13. Local managers and supervisors consider this program to be important.
14. My other work priorities are such that I have an appropriate amount of time for this program.
Table 10 Footnotes:
Profile of Organizational Characteristics (see questions in Attachment A)
Age Range:1 = under 25 3 = 36–45 5 = over 552 = 26–35 4 = 46–55

52
College Level:N = No collegeC = Some college with no degree, or 2-year degreeB = Bachelor-level degree (four year)M = Master-level degree or above
Educ. Area1 = Business/Economics2 = Education/History/Social Science3 = Engineering4 = General Education6 = Political Science/Law
Work Experience (stated in years)
Yrs. in org = Number of years experience in the organization
Yrs. as ETC = Number of years experience as an ETC or supervisor of ETC.
Table 11: Overview of CVAT Part 1 Responses on PersonalValues (PC) (n=14)
Work Relations Control ThoughtPV As Bs Cs Ds Es Fs Gs Hs Is Js Ks Ls Ms Ns Os Ps s.d. PVE02 20 17 11 19 10 14 13 16 13 15 7 9 8 11 10 7 3.95E04 12 13 10 15 19 17 14 20 12 10 6 12 5 17 10 8 4.23E10 17 16 11 13 11 16 15 15 14 9 6 10 12 9 16 10 3.12E11 13 15 11 17 18 17 9 16 10 16 5 8 18 11 8 8 4.12S12 14 11 15 18 13 15 10 19 11 10 10 7 10 17 12 8 3.43E14 16 17 9 11 14 17 14 20 12 9 6 9 7 14 16 9 3.97E17 8 10 8 14 17 13 11 12 15 14 8 11 15 15 13 16 2.83S20 15 17 13 17 8 16 10 16 11 6 6 18 10 15 13 9 3.87E21 17 17 14 20 10 14 10 13 13 13 6 10 14 14 7 8 3.69E22 13 11 6 11 14 16 14 15 14 8 8 16 16 11 14 13 2.98S23 11 18 11 19 12 8 8 16 11 10 10 12 13 14 13 14 3.06E24 18 16 16 17 14 13 12 20 12 11 6 11 7 11 9 7 4.00E25 15 12 13 17 6 18 8 17 10 9 10 11 12 14 18 10 3.59S26 15 10 17 16 6 8 8 9 13 9 10 20 14 16 15 14 3.86Mean 14.6 14.3 11.8 16.0 12.3 14.4 11.1 16.0 12.2 10.6 7.4 11.7 11.5 13.5 12.4 10.1Sum 56.6 53.9 42.0 47.5
Table 11 Footnotes:
CVAT = Culture and Values Analysis ToolPV = Personal ValuesSee Attachment C for description of dimensions

53
WORK As = Effort as a value for self Bs = Time as a value for self Cs = Finish Job as a value for self Ds = Quality as a value for self
RELATIONS Es = Affect as a value for self Fs = Empathy as a value for self Gs = Sociability as a value for self Hs = Loyalty as a value for self
CONTROL Is = Dominance as a value for self Js = Status as a value for self Ks = Political as a value for self Ls = Leader as a value for self
THOUGHT Ms = Abstract as a value for self Ns = Plan/Organize as a value for self Os = Exposition as a value for self Ps = Flexibility as a value for self
s.d. PV = standard deviation of Personal Values. The square root of the mean of the sum ofsquared variances from mean. Used as a measure of dispersion that refers to the variability orspread in the data. A lower s.d. implies that the participant has a consistent perception ofexpressed values and does not elevate a particular value over another. A higher s.d. implies thatthe participant has a more marked opinion of particular values and can more easily express theimportance of one value over another.
Mean: arithmetic mean is the sum of a set of measurements divided by the number ofmeasurements in the set. For this study, arithmetic mean provides a better measure of centrallocation to estimate a population parameter than other expressions of average, such as mode,median, or geometric mean.
Sum = the sum of the means for each set of four Personal Values dimensions that compose aValues category.
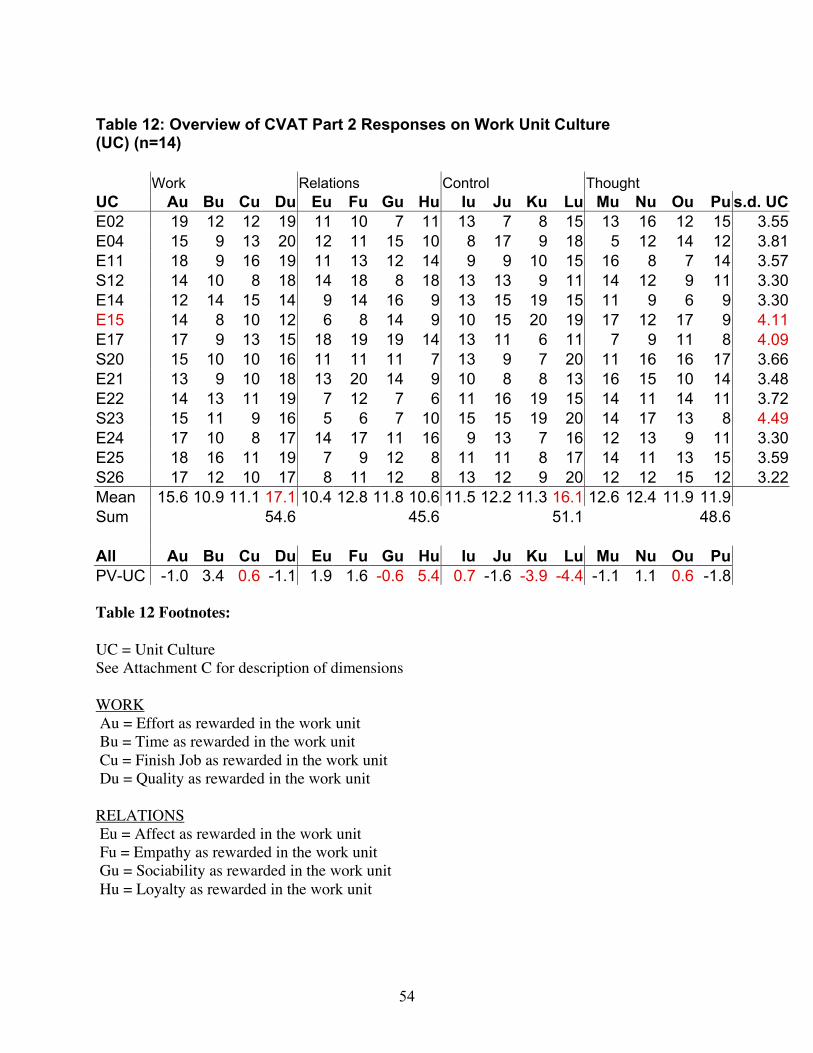
54
Table 12: Overview of CVAT Part 2 Responses on Work Unit Culture(UC) (n=14)
Work Relations Control ThoughtUC Au Bu Cu Du Eu Fu Gu Hu Iu Ju Ku Lu Mu Nu Ou Pu s.d. UCE02 19 12 12 19 11 10 7 11 13 7 8 15 13 16 12 15 3.55E04 15 9 13 20 12 11 15 10 8 17 9 18 5 12 14 12 3.81E11 18 9 16 19 11 13 12 14 9 9 10 15 16 8 7 14 3.57S12 14 10 8 18 14 18 8 18 13 13 9 11 14 12 9 11 3.30E14 12 14 15 14 9 14 16 9 13 15 19 15 11 9 6 9 3.30E15 14 8 10 12 6 8 14 9 10 15 20 19 17 12 17 9 4.11E17 17 9 13 15 18 19 19 14 13 11 6 11 7 9 11 8 4.09S20 15 10 10 16 11 11 11 7 13 9 7 20 11 16 16 17 3.66E21 13 9 10 18 13 20 14 9 10 8 8 13 16 15 10 14 3.48E22 14 13 11 19 7 12 7 6 11 16 19 15 14 11 14 11 3.72S23 15 11 9 16 5 6 7 10 15 15 19 20 14 17 13 8 4.49E24 17 10 8 17 14 17 11 16 9 13 7 16 12 13 9 11 3.30E25 18 16 11 19 7 9 12 8 11 11 8 17 14 11 13 15 3.59S26 17 12 10 17 8 11 12 8 13 12 9 20 12 12 15 12 3.22Mean 15.6 10.9 11.1 17.1 10.4 12.8 11.8 10.6 11.5 12.2 11.3 16.1 12.6 12.4 11.9 11.9Sum 54.6 45.6 51.1 48.6 All Au Bu Cu Du Eu Fu Gu Hu Iu Ju Ku Lu Mu Nu Ou PuPV-UC -1.0 3.4 0.6 -1.1 1.9 1.6 -0.6 5.4 0.7 -1.6 -3.9 -4.4 -1.1 1.1 0.6 -1.8
Table 12 Footnotes:
UC = Unit CultureSee Attachment C for description of dimensions
WORK Au = Effort as rewarded in the work unit Bu = Time as rewarded in the work unit Cu = Finish Job as rewarded in the work unit Du = Quality as rewarded in the work unit
RELATIONS Eu = Affect as rewarded in the work unit Fu = Empathy as rewarded in the work unit Gu = Sociability as rewarded in the work unit Hu = Loyalty as rewarded in the work unit

55
CONTROL Iu = Dominance as rewarded in the work unit Ju = Status as rewarded in the work unit Ku = Political as rewarded in the work unit Lu = Leader as rewarded in the work unit
THOUGHT Mu = Abstract as rewarded in the work unit Nu = Plan/Organize as rewarded in the work unit Ou = Exposition as rewarded in the work unit Pu = Flexibility as rewarded in the work unit
s.d. UC = standard deviation of Unit Culture. The square root of the mean of the sum of squaredvariances from mean. Used as a measure of dispersion that refers to the variability or spread inthe data. A lower s.d. implies that the participant has a consistent perception of expressedrewards and does not perceive a particular reward over another. A higher s.d. implies that theparticipant has a more marked opinion of what is rewarded and can more easily express theperception that one form of reward has more value in the work place than another.
Mean: arithmetic mean is the sum of a set of measurements divided by the number ofmeasurements in the set. For this study, arithmetic mean provides a better measure of centrallocation to estimate a population parameter than other expressions of average, such as mode,median, or geometric mean.
Sum = the sum of the means for each set of four Unit Culture dimensions that compose a Culturecategory.
PV-UC = mean Personal Value minus mean Unit Culture

56
Table 13: CVAT -- Difference between ETC and Supervisor perception ofpersonal values.
Work Relations Control ThoughtPV-E As Bs Cs Ds Es Fs Gs Hs Is Js Ks Ls Ms Ns Os Ps s.d. PVE02 20 17 11 19 10 14 13 16 13 15 7 9 8 11 10 7 3.95E04 12 13 10 15 19 17 14 20 12 10 6 12 5 17 10 8 4.23E10 17 16 11 13 11 16 15 15 14 9 6 10 12 9 16 10 3.12E11 13 15 11 17 18 17 9 16 10 16 5 8 18 11 8 8 4.12E14 16 17 9 11 14 17 14 20 12 9 6 9 7 14 16 9 3.97E17 8 10 8 14 17 13 11 12 15 14 8 11 15 15 13 16 2.83E21 17 17 14 20 10 14 10 13 13 13 6 10 14 14 7 8 3.69E22 13 11 6 11 14 16 14 15 14 8 8 16 16 11 14 13 2.98E24 18 16 16 17 14 13 12 20 12 11 6 11 7 11 9 7 4.00E25 15 12 13 17 6 18 8 17 10 9 10 11 12 14 18 10 3.59Mean 15 14 11 15 13 16 12 16 13 11 6.8 11 11 13 12 9.6Sum 56 57 41 46PV-S As Bs Cs Ds Es Fs Gs Hs Is Js Ks Ls Ms Ns Os Ps s.d. PVS12 14 11 15 18 13 15 10 19 11 10 10 7 10 17 12 8 3.43S20 15 17 13 17 8 16 10 16 11 6 6 18 10 15 13 9 3.87S23 11 18 11 19 12 8 8 16 11 10 10 12 13 14 13 14 3.06S26 15 10 17 16 6 8 8 9 13 9 10 20 14 16 15 14 3.86Mean 13.8 14.0 14.0 17.5 9.8 11.8 9.0 15.0 11.5 8.8 9.0 14.3 11.8 15.5 13.3 11.3Sum 59.3 45.5 43.5 51.8 PV As Bs Cs Ds Es Fs Gs Hs Is Js Ks Ls Ms Ns Os PsE-S 1.2 0.4 -3.1 -2.1 3.6 3.8 3.0 1.4 1.0 2.7 -2.2 -3.6 -0.4 -2.8 -1.2 -1.7
Table 13 Footnotes:
CVAT = Culture and Values Analysis ToolPV-E = Personal Values of ETCsPV-S = Personal Values of Supervisors of ETCsSee Attachment C for description of dimensions
WORK As = Effort as a value for self Bs = Time as a value for self Cs = Finish Job as a value for self Ds = Quality as a value for self

57
RELATIONS Es = Affect as a value for self Fs = Empathy as a value for self Gs = Sociability as a value for self Hs = Loyalty as a value for self
CONTROL Is = Dominance as a value for self Js = Status as a value for self Ks = Political as a value for self Ls = Leader as a value for self
THOUGHT Ms = Abstract as a value for self Ns = Plan/Organize as a value for self Os = Exposition as a value for self Ps = Flexibility as a value for self
s.d. PV = standard deviation of Personal Values. The square root of the mean of the sum ofsquared variances from mean. Used as a measure of dispersion that refers to the variability orspread in the data. A lower s.d. implies that the participant has a consistent perception ofexpressed values and does not elevate a particular value over another. A higher s.d. implies thatthe participant has a more marked opinion of particular values and can more easily express theimportance of one value over another.
Mean: arithmetic mean is the sum of a set of measurements divided by the number ofmeasurements in the set. For this study, arithmetic mean provides a better measure of centrallocation to estimate a population parameter than other expressions of average, such as mode,median, or geometric mean.
Sum = the sum of the means for each set of four Personal Values dimensions that compose aValues category.
PV E-S = the mean of Personal Values of ETCs minus the mean of Personal Values ofSupervisors of ETCs.

58
Table 14: CVAT -- Difference between ETC and Supervisor perception ofwork unit culture.
Work Relations Control ThoughtUC-E Au Bu Cu Du Eu Fu Gu Hu Iu Ju Ku Lu Mu Nu Ou Pu s.d. UCE02 19 12 12 19 11 10 7 11 13 7 8 15 13 16 12 15 3.55E04 15 9 13 20 12 11 15 10 8 17 9 18 5 12 14 12 3.81E11 18 9 16 19 11 13 12 14 9 9 10 15 16 8 7 14 3.57E14 12 14 15 14 9 14 16 9 13 15 19 15 11 9 6 9 3.30E15 14 8 10 12 6 8 14 9 10 15 20 19 17 12 17 9 4.11E17 17 9 13 15 18 19 19 14 13 11 6 11 7 9 11 8 4.09E21 13 9 10 18 13 20 14 9 10 8 8 13 16 15 10 14 3.48E22 14 13 11 19 7 12 7 6 11 16 19 15 14 11 14 11 3.72E24 17 10 8 17 14 17 11 16 9 13 7 16 12 13 9 11 3.30E25 18 16 11 19 7 9 12 8 11 11 8 17 14 11 13 15 3.59Mean 16 11 12 17 11 13 13 11 11 12 11 15 13 12 11 12Sum 55.7 47.4 49.7 47.2UC-S Au Bu Cu Du Eu Fu Gu Hu Iu Ju Ku Lu Mu Nu Ou Pu s.d. UCS12 14 10 8 18 14 18 8 18 13 13 9 11 14 12 9 11 3.30S20 15 10 10 16 11 11 11 7 13 9 7 20 11 16 16 17 3.66S23 15 11 9 16 5 6 7 10 15 15 19 20 14 17 13 8 4.49S26 17 12 10 17 8 11 12 8 13 12 9 20 12 12 15 12 3.22Mean 15.3 10.8 9.3 16.8 9.5 11.5 9.5 10.8 13.5 12.3 11.0 17.8 12.8 14.3 13.3 12.0Sum 52.0 41.3 54.5 52.3 UC Au Bu Cu Du Eu Fu Gu Hu Iu Ju Ku Lu Mu Nu Ou PuE-S 0.4 0.2 2.7 0.4 1.3 1.8 3.2 -0.2 -2.8 -0.1 0.4 -2.4 -0.3 -2.7 -2.0 -0.2
Table 14 Footnotes:CVAT = Culture and Values Analysis ToolUC-E = perception of Unit Culture of ETCsUC-S = perception of Unit Culture of Supervisors of ETCsSee Attachment C for description of dimensions
WORK Au = Effort as rewarded in the work unit Bu = Time as rewarded in the work unit Cu = Finish Job as rewarded in the work unit Du = Quality as rewarded in the work unit

59
RELATIONS Eu = Affect as rewarded in the work unit Fu = Empathy as rewarded in the work unit Gu = Sociability as rewarded in the work unit Hu = Loyalty as rewarded in the work unit
CONTROL Iu = Dominance as rewarded in the work unit Ju = Status as rewarded in the work unit Ku = Political as rewarded in the work unit Lu = Leader as rewarded in the work unit
THOUGHT Mu = Abstract as rewarded in the work unit Nu = Plan/Organize as rewarded in the work unit Ou = Exposition as rewarded in the work unit Pu = Flexibility as rewarded in the work unit
s.d. UC = standard deviation of Unit Culture.
The square root of the mean of the sum of squared variances from mean. Used as a measure ofdispersion that refers to the variability or spread in the data. A lower s.d. implies that theparticipant has a consistent perception of expressed rewards and does not perceive a particularreward over another. A higher s.d. implies that the participant has a more marked opinion ofwhat is rewarded and can more easily express the perception that one form of reward has morevalue in the work place than another.
Mean: arithmetic mean is the sum of a set of measurements divided by the number ofmeasurements in the set. For this study, arithmetic mean provides a better measure of centrallocation to estimate a population parameter than other expressions of average, such as mode,median, or geometric mean.
Sum = the sum of the means for each set of four Unit Culture dimensions that compose a Culturecategory.
UC E-S = the mean of perceived Unit Culture of ETCs minus the mean of perceived UnitCulture of Supervisors of ETCs.

60
Table 15: CVAT -- Difference in perception of personal values between high and lowperforming programs.
Work Relations Control Thought
PV-hi As Bs Cs Ds Es Fs Gs Hs Is Js Ks Ls Ms Ns Os Ps s.d. PV2 14 11 15 18 13 15 10 19 11 10 10 7 10 17 12 8 3.432 8 10 8 14 17 13 11 12 15 14 8 11 15 15 13 16 2.833 16 17 9 11 14 17 14 20 12 9 6 9 7 14 16 9 3.975 12 13 10 15 19 17 14 20 12 10 6 12 5 17 10 8 4.237 20 17 11 19 10 14 13 16 13 15 7 9 8 11 10 7 3.957 11 18 11 19 12 8 8 16 11 10 10 12 13 14 13 14 3.068 17 16 11 13 11 16 15 15 14 9 6 10 12 9 16 10 3.12
Mean 14 15 11 16 14 14 12 17 13 11 7.6 10 10 14 13 10Sum 54.9 57.0 41.1 47.0
PV-lo As Bs Cs Ds Es Fs Gs Hs Is Js Ks Ls Ms Ns Os Ps s.d. PV9 13 11 6 11 14 16 14 15 14 8 8 16 16 11 14 13 2.98
10 17 17 14 20 10 14 10 13 13 13 6 10 14 14 7 8 3.6910 15 10 17 16 6 8 8 9 13 9 10 20 14 16 15 14 3.8611 13 15 11 17 18 17 9 16 10 16 5 8 18 11 8 8 4.1212 15 17 13 17 8 16 10 16 11 6 6 18 10 15 13 9 3.8712 18 16 16 17 14 13 12 20 12 11 6 11 7 11 9 7 4.0013 15 12 13 17 6 18 8 17 10 9 10 11 12 14 18 10 3.59
Mean 15.1 14.0 12.9 16.4 10.9 14.6 10.1 15.1 11.9 10.3 7.3 13.4 13.0 13.1 12.0 9.9Sum 58.4 50.7 42.9 48.0
PV As Bs Cs Ds Es Fs Gs Hs Is Js Ks Ls Ms Ns Os Pshi-lo -1.1 0.6 -2.1 -0.9 2.9 -0.3 2.0 1.7 0.7 0.7 0.3 -3.4 -3.0 0.7 0.9 0.4
Table 15 Footnotes:
CVAT = Culture and Values Analysis Tool
PV-hi = Personal Value scores of ETCs and supervisors from first seven organizations from a listof participating organizations ranked by transportation program effectiveness.
PV-lo = Personal Value scores of ETCs and supervisors from last seven organizations from a listof participating organizations ranked by transportation program effectiveness.
See Attachment C for description of dimensions

61
WORK As = Effort as a value for self Bs = Time as a value for self Cs = Finish Job as a value for self Ds = Quality as a value for self
RELATIONS Es = Affect as a value for self Fs = Empathy as a value for self Gs = Sociability as a value for self Hs = Loyalty as a value for self
CONTROL Is = Dominance as a value for self Js = Status as a value for self Ks = Political as a value for self Ls = Leader as a value for self
THOUGHT Ms = Abstract as a value for self Ns = Plan/Organize as a value for self Os = Exposition as a value for self Ps = Flexibility as a value for self
s.d. PV = standard deviation of Personal Values. The square root of the mean of the sum ofsquared variances from mean. Used as a measure of dispersion that refers to the variability orspread in the data. A lower s.d. implies that the participant has a consistent perception ofexpressed values and does not elevate a particular value over another. A higher s.d. implies thatthe participant has a more marked opinion of particular values and can more easily express theimportance of one value over another.
Mean: arithmetic mean is the sum of a set of measurements divided by the number ofmeasurements in the set. For this study, arithmetic mean provides a better measure of centrallocation to estimate a population parameter than other expressions of average, such as mode,median, or geometric mean.
Sum = the sum of the means for each set of four Personal Values dimensions that compose aValues category.
PV hi-lo = mean of Personal Value scores of ETCs and supervisors from first sevenorganizations from a list of participating organizations ranked by transportation programeffectiveness minus mean of Personal Value scores of ETCs and supervisors from last sevenorganizations from a list of participating organizations ranked by transportation programeffectiveness.

62
Table 16: CVAT -- Difference in perception of work unit culture between high and lowperforming programs.
Work Relations Control ThoughtUC-hi Au Bu Cu Du Eu Fu Gu Hu Iu Ju Ku Lu Mu Nu Ou Pu s.d. UC
2 14 10 8 18 14 18 8 18 13 13 9 11 14 12 9 11 3.302 17 9 13 15 18 19 19 14 13 11 6 11 7 9 11 8 4.093 12 14 15 14 9 14 16 9 13 15 19 15 11 9 6 9 3.305 15 9 13 20 12 11 15 10 8 17 9 18 5 12 14 12 3.816 14 8 10 12 6 8 14 9 10 15 20 19 17 12 17 9 4.117 19 12 12 19 11 10 7 11 13 7 8 15 13 16 12 15 3.557 15 11 9 16 5 6 7 10 15 15 19 20 14 17 13 8 4.49
Mean 15 10 11 16 11 12 12 12 12 13 13 16 12 12 12 10Sum 53.3 46.9 53.9 46.0
UC-lo Au Bu Cu Du Eu Fu Gu Hu Iu Ju Ku Lu Mu Nu Ou Pu s.d. UC9 14 13 11 19 7 12 7 6 11 16 19 15 14 11 14 11 3.72
10 13 9 10 18 13 20 14 9 10 8 8 13 16 15 10 14 3.4810 17 12 10 17 8 11 12 8 13 12 9 20 12 12 15 12 3.2211 18 9 16 19 11 13 12 14 9 9 10 15 16 8 7 14 3.5712 15 10 10 16 11 11 11 7 13 9 7 20 11 16 16 17 3.6612 17 10 8 17 14 17 11 16 9 13 7 16 12 13 9 11 3.3013 18 16 11 19 7 9 12 8 11 11 8 17 14 11 13 15 3.59
Mean 16.0 11.3 10.9 17.9 10.1 13.3 11.3 9.7 10.9 11.1 9.7 16.6 13.6 12.3 12.0 13.4Sum 56.0 44.4 48.3 51.3 UC Au Bu Cu Du Eu Fu Gu Hu Iu Ju Ku Lu Mu Nu Ou Puhi-lo -0.9 -0.9 0.6 -1.6 0.6 -1.0 1.0 1.9 1.3 2.1 3.1 -1.0 -2.0 0.1 -0.3 -3.1
Table 16 Footnotes:
CVAT = Culture and Values Analysis Tool
UC-hi = perception of Unit Culture scores of ETCs and supervisors from first sevenorganizations from a list of participating organizations ranked by transportation programeffectiveness.
UC-lo = perception of Unit Culture scores of ETCs and supervisors from last seven organizationsfrom a list of participating organizations ranked by transportation program effectiveness.
See Attachment C for description of dimensions

63
WORK Au = Effort as rewarded in the work unit Bu = Time as rewarded in the work unit Cu = Finish Job as rewarded in the work unit Du = Quality as rewarded in the work unit
RELATIONS Eu = Affect as rewarded in the work unit Fu = Empathy as rewarded in the work unit Gu = Sociability as rewarded in the work unit Hu = Loyalty as rewarded in the work unit
CONTROL Iu = Dominance as rewarded in the work unit Ju = Status as rewarded in the work unit Ku = Political as rewarded in the work unit Lu = Leader as rewarded in the work unit
THOUGHT Mu = Abstract as rewarded in the work unit Nu = Plan/Organize as rewarded in the work unit Ou = Exposition as rewarded in the work unit Pu = Flexibility as rewarded in the work unit
s.d. UC = standard deviation of Unit Culture: the square root of the mean of the sum of squaredvariances from mean. Used as a measure of dispersion that refers to the variability or spread inthe data. A lower s.d. implies that the participant has a consistent perception of expressedrewards and does not perceive a particular reward over another. A higher s.d. implies that theparticipant has a more marked opinion of what is rewarded and can more easily express theperception that one form of reward has more value in the work place than another.
Mean: arithmetic mean is the sum of a set of measurements divided by the number ofmeasurements in the set. For this study, arithmetic mean provides a better measure of centrallocation to estimate a population parameter than other expressions of average, such as mode,median, or geometric mean.
Sum = the sum of the means for each set of four Unit Culture dimensions that compose a Culturecategory.
UC hi-lo = mean perceived Unit Culture scores of ETCs and supervisors from first sevenorganizations from a list of participating organizations ranked by transportation programeffectiveness minus mean of perceived Unit Culture scores of ETCs and supervisors from lastseven organizations from a list of participating organizations ranked by transportation programeffectiveness.

64
Table 17: Chart III from DiSC -- the official report
SegmentNumbers
from Graph III
IntensityNumber from
Graph IIICode Rank D i S C Pattern Name D i S CETCRespondents E02 7 2 5 3 7 Appraiser 7 17 12 25E04 5 6 5 5 1 Result-Oriented 21 17 20 2E08 1 3 5 3 6 Appraiser 12 19 10 22E09 4 4 4 3 5 Objective Thinker 16 14 10 19E10 8 2 6 5 4 Counselor 7 21 20 14E11 11 1 2 7 6 Perfectionist 2 8 27 22E14 3 4 7 4 2 Promoter 14 27 15 5E15 6 2 1 7 6 Perfectionist 8 2 27 23E17 2 1 7 7 5 Practitioner 2 23 25 17E21 10 5 1 6 4 Achiever 20 3 23 14E22 5 3 2 6 5 Perfectionist 11 8 21 18E24 12 5 2 5 5 Investigator 18 5 20 18E25 13 3 6 5 2 Counselor 11 23 20 8
SupervisorRespondents S05 11 3 6 4 5 Practitioner 9 21 14 17S12 2 3 4 5 4 Specialist 11 14 20 16S20 12 5 5 3 3 Inspirational 18 17 12 11S23 7 6 7 2 1 Inspirational 21 27 6 3S26 10 7 2 1 5 Creative 27 5 2 18
Table 17 Footnotes:
Rank indicates the highest performing organizations (1) to the lowest (13) in the study.
Pattern name is one of the 13 classical profile patterns established by the DiSC researchers.
Most persons have only one or two behavioral traits at or above the midline, and these can beviewed in combination to interpret the greatest needs-driven behaviors of an individual,including Directing, Influencing, Steadiness and Conscientiousness. The number of respondentsto this study was not such that any conclusions can be drawn from the Classical profile pattern.

65
Table 18: Chart I and II from DiSC -- anecdotal observations
Chart I: projected behaviors Chart II: response under pressureSegmentNumbers
from Graph IMost
(Intermediate)
SegmentNumbers
from Graph IILeast
(Intermediate)D i S C Pattern D i S C Pattern3 4 3 7 Objective Thinker 1 6 4 6 Practitioner4 5 6 2 Agent 6 4 5 1 Achiever3 6 3 6 Appraiser 3 4 3 5 Objective Thinker4 5 3 5 Appraiser 4 3 3 6 Objective Thinker2 6 6 4 Counselor 2 6 5 4 Counselor2 2 7 4 Specialist 1 3 7 7 Perfectionist3 7 5 2 Counselor 5 5 4 2 Inspirational2 3 7 4 Specialist 3 1 7 7 Perfectionist1 6 7 4 Agent 1 7 7 6 Practitioner5 3 6 4 Achiever 6 1 7 4 Achiever3 3 5 6 Perfectionist 3 3 7 4 Specialist6 1 5 5 Investigator 3 3 6 5 Perfectionist3 6 6 2 Counselor 3 6 4 3 Promoter3 6 5 4 Counselor 2 6 3 6 Appraiser3 4 5 6 Perfectionist 3 3 7 3 Specialist5 4 5 3 Achiever 5 5 2 4 Inspirational4 7 3 1 Promoter 6 6 2 1 Inspirational7 1 2 6 Creative 7 3 1 4 Developer
Table 18 Footnotes:
As explained previously, long-term users of this instrument have found very strong anecdotalevidence that the Chart I, where respondents indicate how they are “Most” within a given jobfocus correspond most highly to the way people intend to project their behaviors. In this case,they were given the specific focus of “my job as an ETC” or “supervising my ETC.”Similarly, the creator of the instrument found that Chart II, wherein respondents indicate howthey are “Least” within the same focus, is often more closely aligned with the instinctiveresponse to pressure. Only Chart III results have been validated and reliability tested, asexplained in the section concerning validity and reliability of instruments (see Table 17).However, the insight provided by how people project their behavior MOST (Graph1) andLEAST (Graph II) lend insight in a small sample size such as this.