Characterising New Zealand’s underutilised workforce ...
41
CHARACTERISING NEW ZEALAND’S UNDERUTILISED WORKFORCE EVIDENCE FROM THE HOUSEHOLD LABOUR FORCE SURVEY August 2019
Transcript of Characterising New Zealand’s underutilised workforce ...

C H A R A C T E R I S I N G N E W Z E A L A N D ’ SU N D E R U T I L I S E D
W O R K F O R C E
E V I D E N C E F R O M T H E
H O U S E H O L D L A B O U R
F O R C E S U R V E Y
August 2019
Page 2
AUTHORS
Christopher Erwin, Kabir Dasgupta and Gail Pacheco
ACKNOWLEDGEMENTS
We would like to acknowledge the funding received from the Ministry of Business, Innovation, and
Employment (MBIE), which made this research possible. We also need to thank seminar participants from
MBIE for their constructive comments and questions. We thank Sharon Cox for her leadership in
arranging meetings and directing communication between the NZWRI and MBIE teams. We also owe
thanks to Deb Potter for her excellent work as an external reviewer of the report. We would also like to
thank Livvy Mitchell and Alexandra Turcu for their assistance throughout this project.
PUBLISHED
New Zealand Work Research Institute, Auckland, New Zealand
ISBN (PDF): 978-1-927184-60-8
2019
Suggested citation: Erwin, C., Dasgupta, K., & Pacheco, G. (2019). Characterising New Zealand’s
underutilised workforce: Evidence from the Household Labour Force Survey. Auckland.
Level 10, 42 Wakefield Street, Auckland
Phone: +64 9 921 5056
Email: [email protected]
Website: www.workresearch.aut.ac.nz

Page 3
DISCLAIMER
The results in this paper are not official statistics. They have been
created for research purposes from the Integrated Data
Infrastructure (IDI) managed by Statistics NZ.
The opinions, findings, recommendations, and conclusions
expressed in this paper are those of the authors, not Statistics NZ.
Access to the anonymised data used in this study was provided
by Statistics NZ in accordance with security and confidentiality
provisions of the Statistics Act 1975. Only people authorised by
the Statistics Act 1975 are allowed to see data about a particular
person, household, business, or organisation. The results in this
paper have been confidentialised to protect these groups from
identification.
Careful consideration has been given to the privacy, security, and
confidentiality issues associated with using administrative and
survey data in the IDI. Further detail can be found in the Privacy
impact assessment for the Integrated Data Infrastructure
available from www.stats.govt.nz.
Note: Labour force figures presented in the appendix of this
paper have been rounded to the nearest hundred to protect
confidentiality.
Page 3
1. INTRODUCTION ..................................................................................................................................... 5
2. MOTIVATION ......................................................................................................................................... 6
3. DATA ..................................................................................................................................................... 7
4. RESULTS FOR AIM 1 ............................................................................................................................ 11
4.1 Individual and household characteristics .................................................................................... 11
4.2 Work characteristics ................................................................................................................... 15
5. RESULTS FOR AIM 2 ............................................................................................................................ 19
5.1 Transience of underutilised workers ........................................................................................... 19
5.2 Intensity of underutilisation over time ....................................................................................... 21
6. RESULTS FOR AIM 3 ............................................................................................................................ 23
6.1 Regression analysis of underutilisation intensity ........................................................................ 23
6.2 Regression analysis of unemployment duration ......................................................................... 26
7. CONCLUSION ...................................................................................................................................... 28
REFERENCES ................................................................................................................................................ 29
APPENDICES ................................................................................................................................................ 31
Page 4
List of Figures Figure 1. Trends in underutilisation rates in NZ ............................................................................................ 8
List of Tables Table 1. Variable definitions.......................................................................................................................... 9
Table 2. Individual and household characteristics ...................................................................................... 12
Table 3. Work characteristics ...................................................................................................................... 16
Table 4. Reason for underemployment by gender and age ........................................................................ 18
Table 5. One -quarter transition matrix ...................................................................................................... 20
Table 6. One-year transition matrix ............................................................................................................ 21
Table 7. Underutilisation intensity over time .............................................................................................. 22
Table 8. Overview of regression analysis samples ...................................................................................... 23
Table 9. Multinomial logistic model of underutilisation intensity ............................................................... 25
Table 10. Multinomial logistic model of unemployment duration .............................................................. 27
Appendix Tables Table A 1. Underutilisation rates in NZ ....................................................................................................... 32
Table B 1. Individual and household characteristics (rows sum to one) ..................................................... 33
Table B 2. Work characteristics (rows sum to one) ..................................................................................... 36
Table C 1. Previous employment status ...................................................................................................... 38
Table C 2. Previous level 1 main occupation ............................................................................................... 38
Table C 3. Previous level 1 main industry .................................................................................................... 39
Page 5
1. INTRODUCTION
The primary research objective of this study is to provide a detailed understanding of the underutilised
workforce in New Zealand (NZ). The International Labour Organisation (see Mehran et al., 2008; Statistics
New Zealand, 2016a)1 considers workers to be underutilised if they are unemployed, time-related
underemployed (referred to as underemployed hereinafter) or belong to the potential labour force (all
three groups are explicitly defined in Section 3). To better understand NZ’s underutilised population, we
classify our analysis into three research aims:
Aim 1: Understand social, economic, demographic, and work-related characteristics of underutilised
workers in NZ. This involves a descriptive analysis comparing underutilised workers to those that are fully
utilised.2
Aim 2: Explore the transience of underutilisation. Leveraging the longitudinal nature of the Household
Labour Force Survey data, we examine persistence in experiencing underutilisation.
Aim 3: Identify potential drivers of the duration of underutilisation and unemployment. We estimate non-
linear regressions of underutilisation intensity to examine which household and work characteristics are
associated with underemployment and unemployment.
Our primary data source is the Household Labour Force Survey (HLFS), which documents a wide range of
individual, household, and work characteristics for a representative sample of NZ’s working age
population aged 15 and above. Introduced in December 1985, the HLFS is conducted on a quarterly basis
and individuals can be included in the survey for a maximum of eight consecutive quarters. We focus on
the period June 2016 through June 2018 to take advantage of survey modifications introduced in the
redevelopment of the HLFS in 2016 (Statistics New Zealand, 2016b). The modifications were aimed at
enhancing the quality and relevance of NZ’s labour market information by incorporating new variables
such as employer-employee relationship, duration of unemployment spells, and worker preferences for
changes to their current employment. Most relevant to our research objective, one of the major changes
was the introduction of information to identify the underutilised workforce in NZ. From June 2016
onwards, the survey identifies respondents in three underutilised categories (underemployed,
unemployed, and potential labour force) in accordance with the International Labour Organisation (ILO)
definition described above.
The remainder of the report proceeds as follows. Section 2 provides the motivation for our research
aims. Section 3 describes the HLFS as the primary data source of this study. Sections 4, 5 and 6 present
the findings for Aims 1, 2 and 3, respectively. In particular, Section 4.1 provides preliminary findings of
the individual and household characteristics of the underutilised workforce in NZ, including an
examination of how characteristics vary across different sub-groups of underutilised workers; and Section
4.2 presents a similar analysis focusing on employed individuals’ work characteristics. Section 5.1
examines the transience of the underutilised workforce through transition probability matrices, which
estimate the likelihood of moving from one employment state to another over time (e.g., moving from
underemployed to fully utilised); and Section 5.2 examines the intensity of underutilisation over time.
Finally, Section 6 presents multinomial logistic regression results, which identify significant associations
between individual characteristics and underutilisation intensity (Section 6.1), as well as unemployment
duration (Section 6.2). Section 7 concludes.
1 See https://www.ilo.org/global/statistics-and-databases/statistics-overview-and-topics/WCMS_470306/lang--en/index.htm; Accessed on June 4, 2019. 2 This is defined as employed at time of survey and not wanting additional hours of work.
Page 6
2. MOTIVATION
Labour underutilisation has large negative implications both at the micro- and macroeconomic level
resulting in a substantial loss of human capital, productivity, efficiency and overall well-being (Tsang,
1987; Prause & Dooley, 1997; Dooley, 2003; Dooley & Catalano, 2003; Baum et al., 2009; Rodríguez
Hernández, 2018). The three mutually exclusive groups of the workforce that constitute underutilisation
include the time-related underemployed, the unemployed, and the potential labour force. While time-
related underemployment represents employed individuals who are willing to work for longer hours,
potential labour force refers to the section of “extended” labour force consisting of individuals “not in
employment who express an interest in this form of work but for whom existing conditions limit their
active job search and/or their availability” (Statistics New Zealand, 2016a).3
In the academic literature, the majority of past studies have focussed on the unemployed component of
underutilisation. For example, it has been well-documented that experiencing long spells of
unemployment reduces future earnings and labour market attachment. There are three phenomena that
appear to drive this relationship. First, like many other assets, human capital depreciates over time.
When a worker is out of the labour market for an extended period, on-the-job skills may decline, as may
interviewing or networking skills (Mincer & Ofek, 1982; Acemoglu, 1995; Stratton, 1995). Second, as the
length of unemployment increases, job search intensity declines due to worker discouragement resulting
from continued failure to acquire suitable jobs (Krueger et al., 2011; Faberman & Kudlyak, 2019). Third,
large gaps in employment can send negative signals to employers and therefore adversely affects
workers’ employability. For instance, there is evidence that employers are often hesitant to hire workers
who have experienced a prolonged period of joblessness regardless of their human capital and skills
(Eriksson & Rooth, 2011; Ghayad, 2013; Kroft, Lange, & Notowidigdo, 2013). At the macroeconomic level,
high rates of unemployment have also been linked to declines in economic growth and productivity
(Machin & Manning, 1999; Eliason & Storrie, 2006; Gordo, 2006; Benigno et al., 2015).
Despite its popularity as a labour market performance indicator, estimates of unemployment rates have
been subjected to criticism on the grounds that such measures often understate the true extent of
labour market challenges and downturns. Several studies have argued that unemployment does not
accurately articulate employment hardship and disadvantage, especially for underemployed individuals
(Jensen et al., 1999; Mehran et al., 2008; Baum et al., 2009). In response to these concerns, the ILO (see
Mehran et al., 2008) discussed the advantages of a supplemental labour market indicator capturing
labour underutilisation in a broader sense than unemployment alone. Like unemployment,
underemployment also has been found to have similar socio-economic consequences. For instance, in
addition to the adverse macroeconomic implications, there is evidence that underemployment negatively
affects individuals’ mental and psychological well-being (Prause & Dooley, 1997; Dooley, 2003; Dooley &
Catalano, 2003).
Given evidence of the large social costs associated with labour underutilisation, our study provides a first
look at NZ’s underutilised workforce. We compare characteristics of underutilised and fully utilised
workers, examine how persistent experiences of underutilisation are, and which individual, household,
and work characteristics tend to increase the likelihood of being underutilised. To the best of our
knowledge, this is the first study in NZ that explores this population in detail.
3 Also see the ILO Glossary of Statistical Terms. Accessed from https://www.ilo.org/ilostat-files/Documents/Statistical%20Glossary.pdf on June 6, 2019.
Page 7
3. DATA
This study uses the HLFS, which is administered by Statistics New Zealand (Stats NZ). This is a large-scale,
nationally representative survey commonly used to estimate official labour market statistics for NZ. The
HLFS is conducted on a quarterly basis and based on a sample of individuals aged 15 and above,
belonging to approximately 16,000 households.4
The HLFS began incorporating specific details about the underutilised workforce with the redevelopment
in April 2016.5 As such, our analysis is based on nine quarters spanning from June 2016 through June
2018. Collection of income data is also built into the June quarter of the HLFS annually. We use this to
incorporate gross household information into our analysis and derive household poverty indicators.
Following the definitions provided by the ILO, an individual is classified as “underutilised” if they are:
1) Unemployed – individuals who are not in employment, and available to work, and actively
seeking employment.
2) Underemployed – individuals who are employed, but are willing to work more hours, and are
available to do so.
3) The potential labour force – unavailable jobseekers6 and available potential jobseekers7.
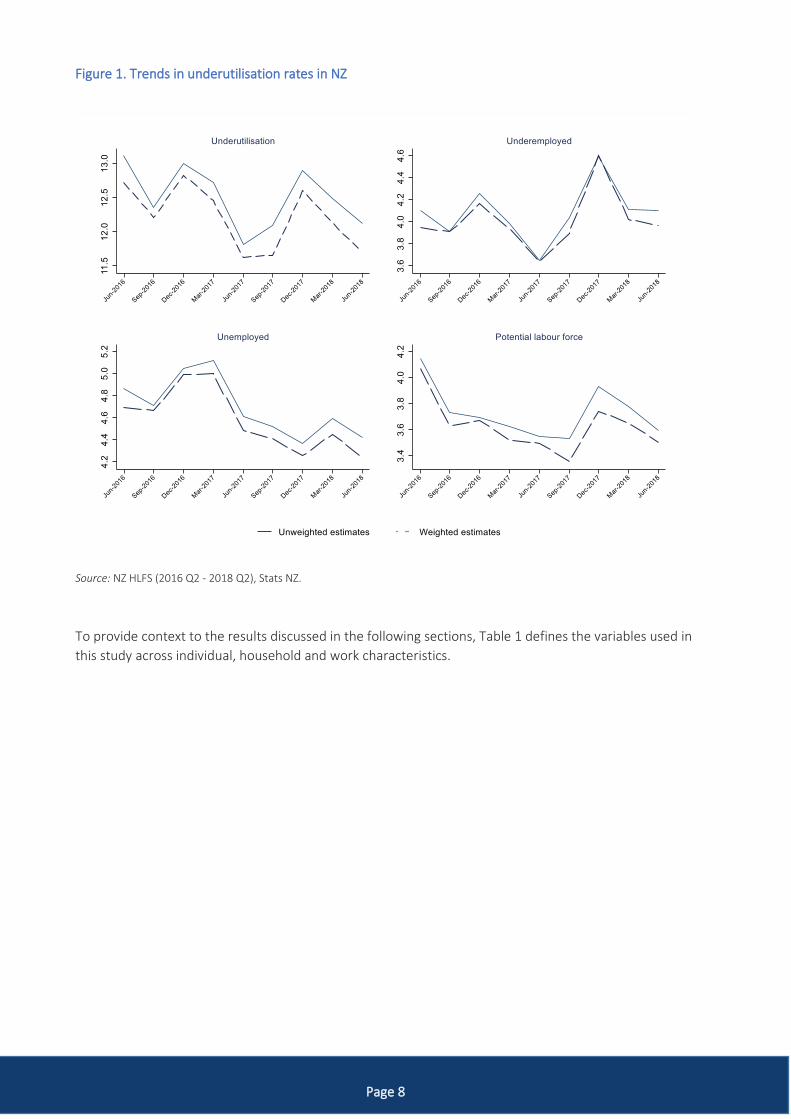
Together, these three populations form NZ’s underutilised workforce. Figure 1 provides a general
overview of recent trends in NZ’s labour underutilisation rate for the period between June 2016 and June
2018. It presents time trends of both the weighted and unweighted estimates of underutilisation, as well
as its three sub-components (unemployed, underemployed and potential labour force).8 In general,
underutilisation has fluctuated between 12 and 13 percent across the sample period, ending at 12.1
percent in June 2018 (unweighted estimate).
4 The HLFS-related details are accessed from http://archive.stats.govt.nz. Specific details have been extracted from http://archive.stats.govt.nz/survey-participants/a-z-of-our-surveys/household-labour-force-survey.aspx and http://archive.stats.govt.nz/survey-participants/survey-resources/hlfs-resource.aspx#1. 5 See ‘Overview of key changes’ summarised in the Stats NZ website. Accessed from http://archive.stats.govt.nz/browse_for_stats/income-and-work/employment_and_unemployment/improving-labour-market-statistics/hlfs-summary-of-changes-2016/section-1.aspx. 6 Individuals who are actively seeking work but were not available to have started work in the survey week, and would become available within a short subsequent period. 7 Individuals who are not actively seeking work but were available in the survey week and want a job. 8 See Table A 1 in Appendix A for the specific numbers illustrated in Figure 1, and a comparison with official statistics.
Page 8
Figure 1. Trends in underutilisation rates in NZ
Source: NZ HLFS (2016 Q2 - 2018 Q2), Stats NZ.
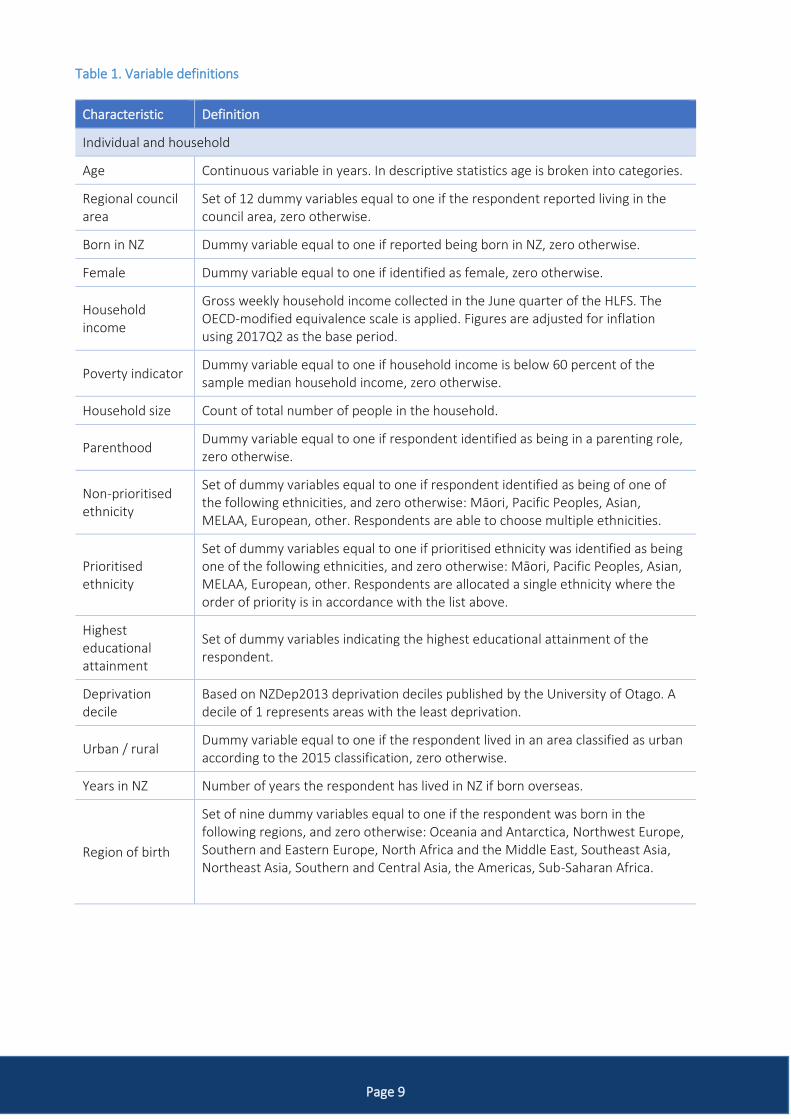
To provide context to the results discussed in the following sections, Table 1 defines the variables used in
this study across individual, household and work characteristics.
Page 9
Table 1. Variable definitions
Characteristic Definition
Individual and household
Age Continuous variable in years. In descriptive statistics age is broken into categories.
Regional council area
Set of 12 dummy variables equal to one if the respondent reported living in the council area, zero otherwise.
Born in NZ Dummy variable equal to one if reported being born in NZ, zero otherwise.
Female Dummy variable equal to one if identified as female, zero otherwise.
Household income
Gross weekly household income collected in the June quarter of the HLFS. The OECD-modified equivalence scale is applied. Figures are adjusted for inflation using 2017Q2 as the base period.
Poverty indicator Dummy variable equal to one if household income is below 60 percent of the sample median household income, zero otherwise.
Household size Count of total number of people in the household.
Parenthood Dummy variable equal to one if respondent identified as being in a parenting role, zero otherwise.
Non-prioritised ethnicity
Set of dummy variables equal to one if respondent identified as being of one of the following ethnicities, and zero otherwise: Māori, Pacific Peoples, Asian, MELAA, European, other. Respondents are able to choose multiple ethnicities.
Prioritised ethnicity
Set of dummy variables equal to one if prioritised ethnicity was identified as being one of the following ethnicities, and zero otherwise: Māori, Pacific Peoples, Asian, MELAA, European, other. Respondents are allocated a single ethnicity where the order of priority is in accordance with the list above.
Highest educational attainment
Set of dummy variables indicating the highest educational attainment of the respondent.
Deprivation decile
Based on NZDep2013 deprivation deciles published by the University of Otago. A decile of 1 represents areas with the least deprivation.
Urban / rural Dummy variable equal to one if the respondent lived in an area classified as urban according to the 2015 classification, zero otherwise.
Years in NZ Number of years the respondent has lived in NZ if born overseas.
Region of birth
Set of nine dummy variables equal to one if the respondent was born in the following regions, and zero otherwise: Oceania and Antarctica, Northwest Europe, Southern and Eastern Europe, North Africa and the Middle East, Southeast Asia, Northeast Asia, Southern and Central Asia, the Americas, Sub-Saharan Africa.
Page 10
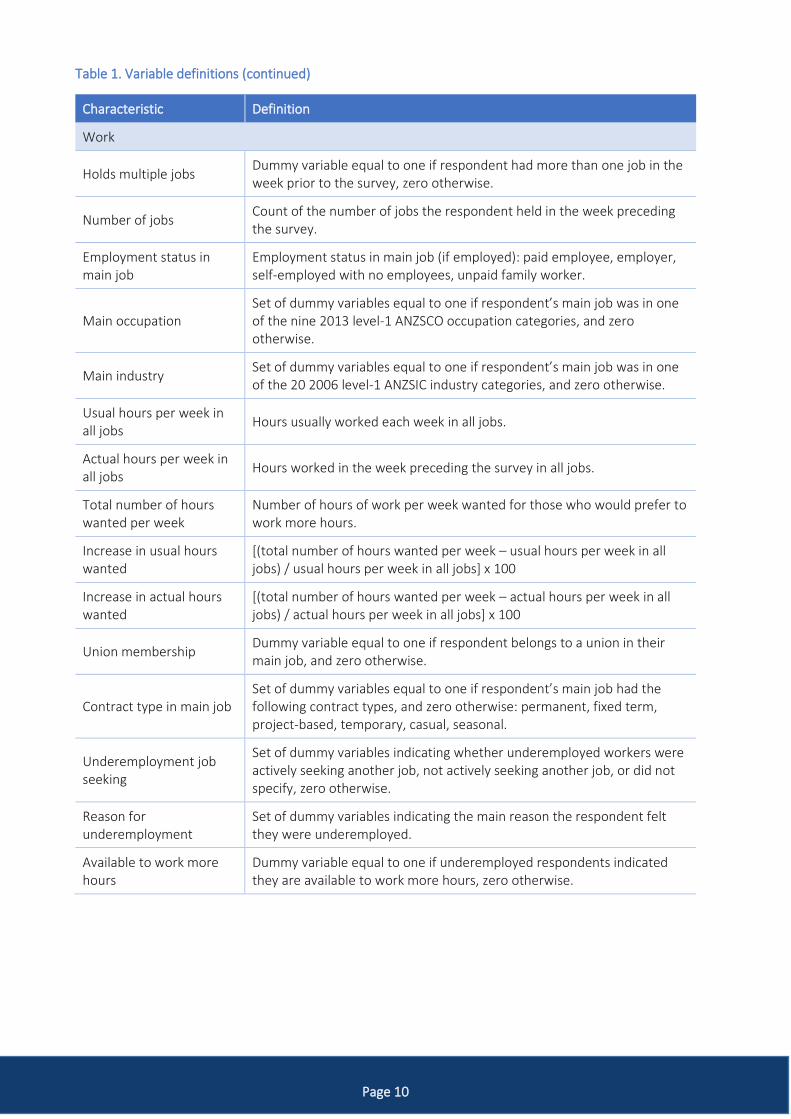
Table 1. Variable definitions (continued)
Characteristic Definition
Work
Holds multiple jobs Dummy variable equal to one if respondent had more than one job in the week prior to the survey, zero otherwise.
Number of jobs Count of the number of jobs the respondent held in the week preceding the survey.
Employment status in main job
Employment status in main job (if employed): paid employee, employer, self-employed with no employees, unpaid family worker.
Main occupation Set of dummy variables equal to one if respondent’s main job was in one of the nine 2013 level-1 ANZSCO occupation categories, and zero otherwise.
Main industry Set of dummy variables equal to one if respondent’s main job was in one of the 20 2006 level-1 ANZSIC industry categories, and zero otherwise.
Usual hours per week in all jobs
Hours usually worked each week in all jobs.
Actual hours per week in all jobs
Hours worked in the week preceding the survey in all jobs.
Total number of hours wanted per week
Number of hours of work per week wanted for those who would prefer to work more hours.
Increase in usual hours wanted
[(total number of hours wanted per week – usual hours per week in all jobs) / usual hours per week in all jobs] x 100
Increase in actual hours wanted
[(total number of hours wanted per week – actual hours per week in all jobs) / actual hours per week in all jobs] x 100
Union membership Dummy variable equal to one if respondent belongs to a union in their main job, and zero otherwise.
Contract type in main job Set of dummy variables equal to one if respondent’s main job had the following contract types, and zero otherwise: permanent, fixed term, project-based, temporary, casual, seasonal.
Underemployment job seeking
Set of dummy variables indicating whether underemployed workers were actively seeking another job, not actively seeking another job, or did not specify, zero otherwise.
Reason for underemployment
Set of dummy variables indicating the main reason the respondent felt they were underemployed.
Available to work more hours
Dummy variable equal to one if underemployed respondents indicated they are available to work more hours, zero otherwise.
Page 11
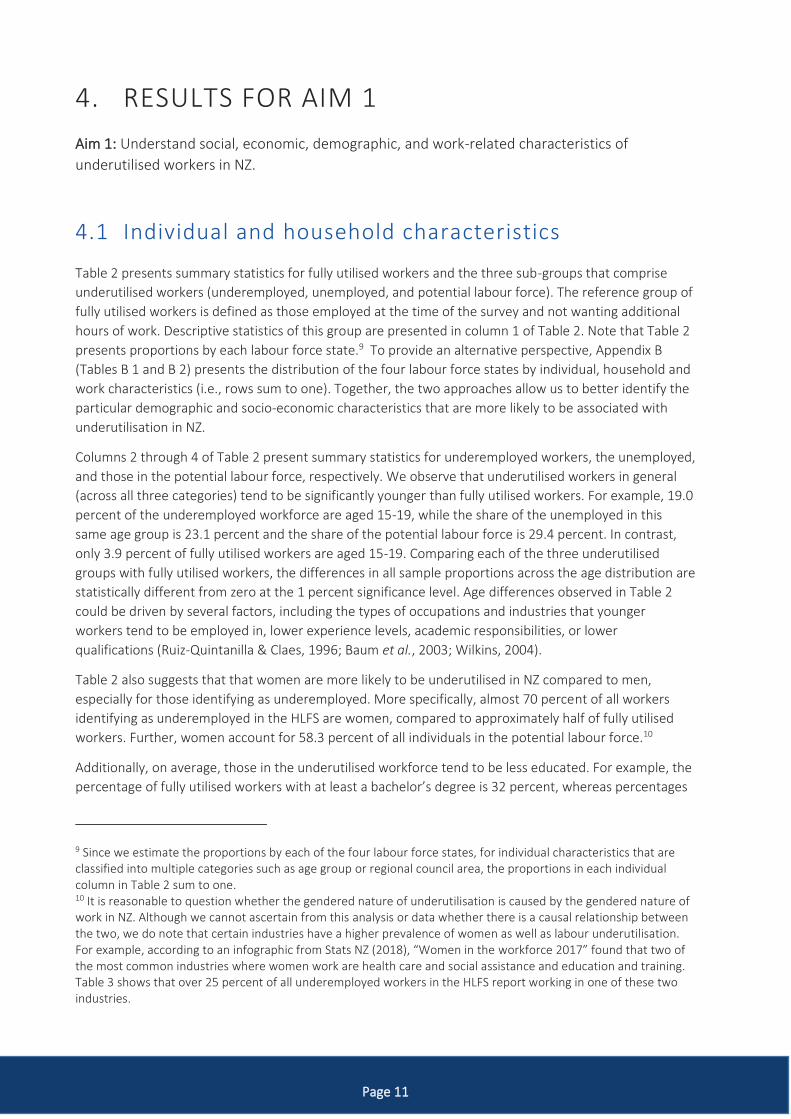
4. RESULTS FOR AIM 1
Aim 1: Understand social, economic, demographic, and work-related characteristics of
underutilised workers in NZ.
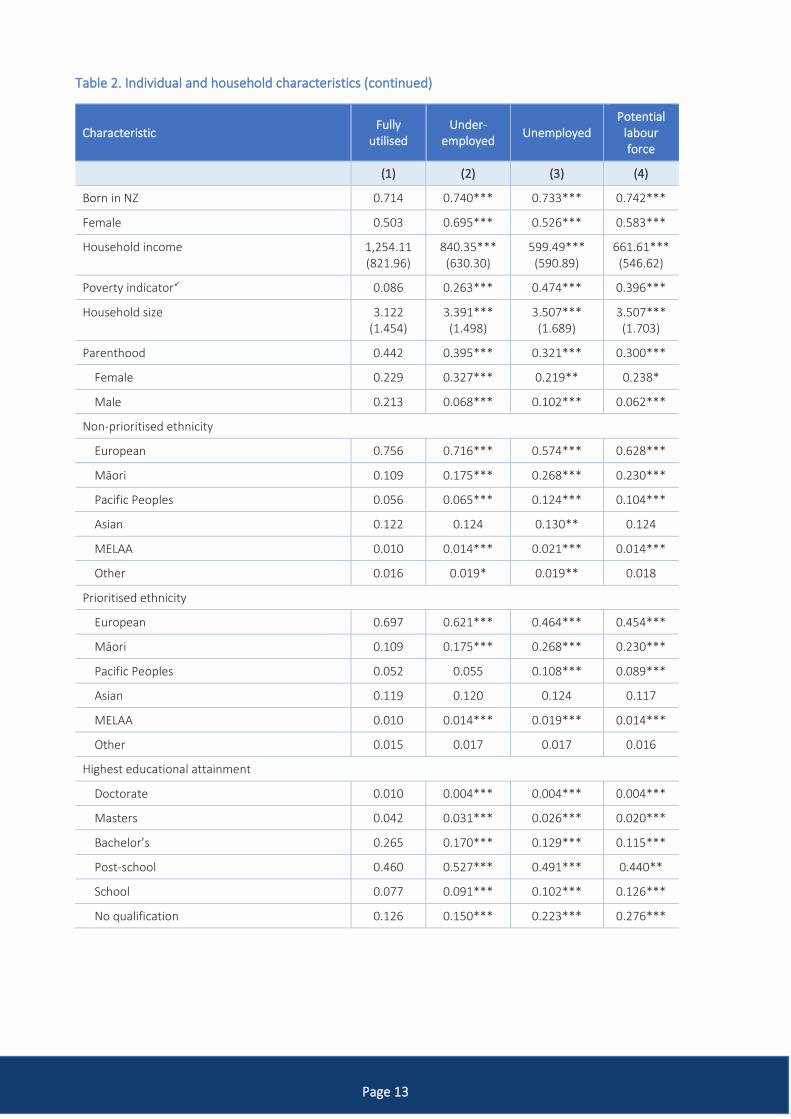
4.1 Individual and household characteristics
Table 2 presents summary statistics for fully utilised workers and the three sub-groups that comprise
underutilised workers (underemployed, unemployed, and potential labour force). The reference group of
fully utilised workers is defined as those employed at the time of the survey and not wanting additional
hours of work. Descriptive statistics of this group are presented in column 1 of Table 2. Note that Table 2
presents proportions by each labour force state.9 To provide an alternative perspective, Appendix B
(Tables B 1 and B 2) presents the distribution of the four labour force states by individual, household and
work characteristics (i.e., rows sum to one). Together, the two approaches allow us to better identify the
particular demographic and socio-economic characteristics that are more likely to be associated with
underutilisation in NZ.
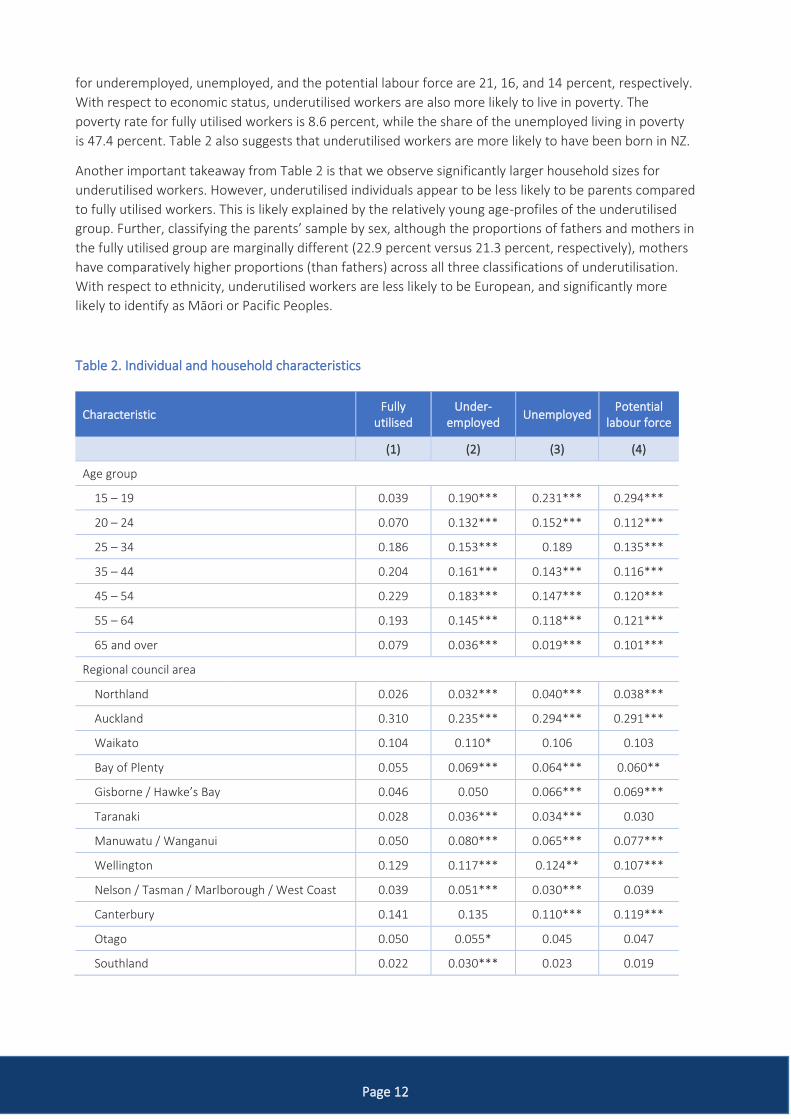
Columns 2 through 4 of Table 2 present summary statistics for underemployed workers, the unemployed,
and those in the potential labour force, respectively. We observe that underutilised workers in general
(across all three categories) tend to be significantly younger than fully utilised workers. For example, 19.0
percent of the underemployed workforce are aged 15-19, while the share of the unemployed in this
same age group is 23.1 percent and the share of the potential labour force is 29.4 percent. In contrast,
only 3.9 percent of fully utilised workers are aged 15-19. Comparing each of the three underutilised
groups with fully utilised workers, the differences in all sample proportions across the age distribution are
statistically different from zero at the 1 percent significance level. Age differences observed in Table 2
could be driven by several factors, including the types of occupations and industries that younger
workers tend to be employed in, lower experience levels, academic responsibilities, or lower
qualifications (Ruiz-Quintanilla & Claes, 1996; Baum et al., 2003; Wilkins, 2004).
Table 2 also suggests that that women are more likely to be underutilised in NZ compared to men,
especially for those identifying as underemployed. More specifically, almost 70 percent of all workers
identifying as underemployed in the HLFS are women, compared to approximately half of fully utilised
workers. Further, women account for 58.3 percent of all individuals in the potential labour force.10
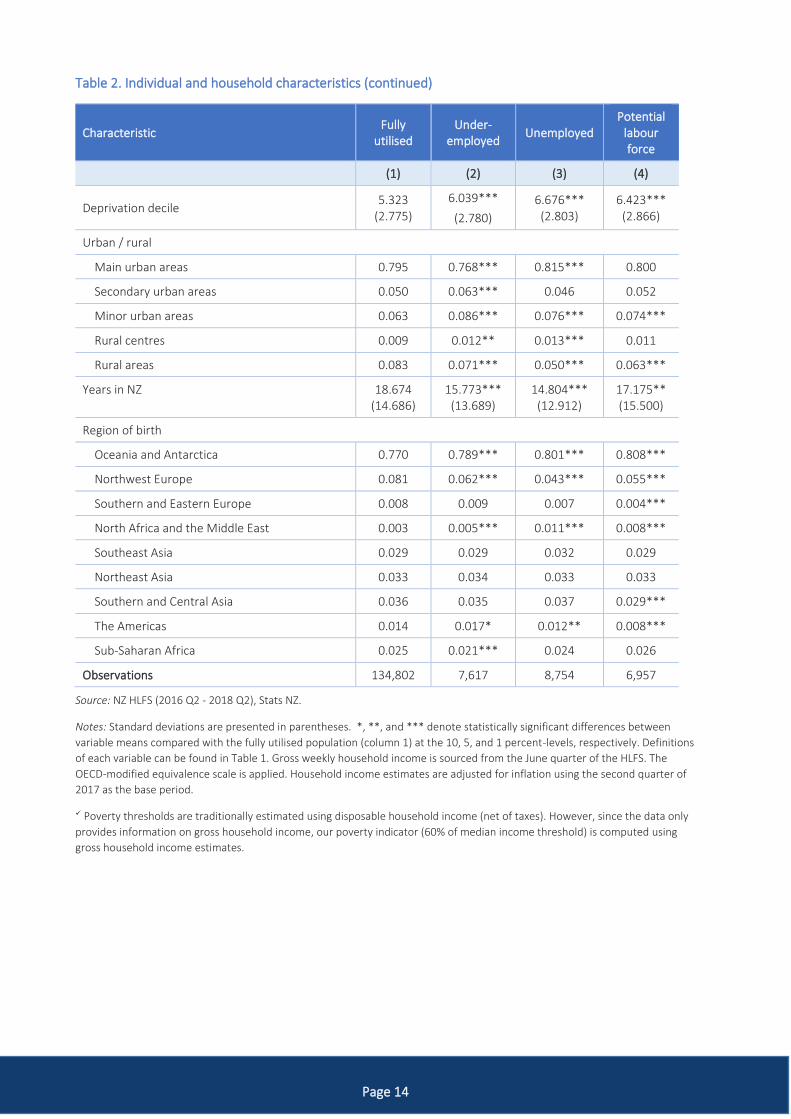
Additionally, on average, those in the underutilised workforce tend to be less educated. For example, the
percentage of fully utilised workers with at least a bachelor’s degree is 32 percent, whereas percentages
9 Since we estimate the proportions by each of the four labour force states, for individual characteristics that are classified into multiple categories such as age group or regional council area, the proportions in each individual column in Table 2 sum to one. 10 It is reasonable to question whether the gendered nature of underutilisation is caused by the gendered nature of work in NZ. Although we cannot ascertain from this analysis or data whether there is a causal relationship between the two, we do note that certain industries have a higher prevalence of women as well as labour underutilisation. For example, according to an infographic from Stats NZ (2018), “Women in the workforce 2017” found that two of the most common industries where women work are health care and social assistance and education and training. Table 3 shows that over 25 percent of all underemployed workers in the HLFS report working in one of these two industries.
Page 12
for underemployed, unemployed, and the potential labour force are 21, 16, and 14 percent, respectively.
With respect to economic status, underutilised workers are also more likely to live in poverty. The
poverty rate for fully utilised workers is 8.6 percent, while the share of the unemployed living in poverty
is 47.4 percent. Table 2 also suggests that underutilised workers are more likely to have been born in NZ.
Another important takeaway from Table 2 is that we observe significantly larger household sizes for
underutilised workers. However, underutilised individuals appear to be less likely to be parents compared
to fully utilised workers. This is likely explained by the relatively young age-profiles of the underutilised
group. Further, classifying the parents’ sample by sex, although the proportions of fathers and mothers in
the fully utilised group are marginally different (22.9 percent versus 21.3 percent, respectively), mothers
have comparatively higher proportions (than fathers) across all three classifications of underutilisation.
With respect to ethnicity, underutilised workers are less likely to be European, and significantly more
likely to identify as Māori or Pacific Peoples.
Table 2. Individual and household characteristics
Characteristic Fully
utilised Under-
employed Unemployed
Potential labour force
(1) (2) (3) (4)
Age group
15 – 19 0.039 0.190*** 0.231*** 0.294***
20 – 24 0.070 0.132*** 0.152*** 0.112***
25 – 34 0.186 0.153*** 0.189 0.135***
35 – 44 0.204 0.161*** 0.143*** 0.116***
45 – 54 0.229 0.183*** 0.147*** 0.120***
55 – 64 0.193 0.145*** 0.118*** 0.121***
65 and over 0.079 0.036*** 0.019*** 0.101***
Regional council area
Northland 0.026 0.032*** 0.040*** 0.038***
Auckland 0.310 0.235*** 0.294*** 0.291***
Waikato 0.104 0.110* 0.106 0.103
Bay of Plenty 0.055 0.069*** 0.064*** 0.060**
Gisborne / Hawke’s Bay 0.046 0.050 0.066*** 0.069***
Taranaki 0.028 0.036*** 0.034*** 0.030
Manuwatu / Wanganui 0.050 0.080*** 0.065*** 0.077***
Wellington 0.129 0.117*** 0.124** 0.107***
Nelson / Tasman / Marlborough / West Coast 0.039 0.051*** 0.030*** 0.039
Canterbury 0.141 0.135 0.110*** 0.119***
Otago 0.050 0.055* 0.045 0.047
Southland 0.022 0.030*** 0.023 0.019
Page 13
Table 2. Individual and household characteristics (continued)
Characteristic Fully
utilised Under-
employed Unemployed
Potential labour force
(1) (2) (3) (4)
Born in NZ 0.714 0.740*** 0.733*** 0.742***
Female 0.503 0.695*** 0.526*** 0.583***
Household income 1,254.11 (821.96)
840.35*** (630.30)
599.49*** (590.89)
661.61*** (546.62)
Poverty indicator✓ 0.086 0.263*** 0.474*** 0.396***
Household size 3.122 (1.454)
3.391*** (1.498)
3.507*** (1.689)
3.507*** (1.703)
Parenthood 0.442 0.395*** 0.321*** 0.300***
Female 0.229 0.327*** 0.219** 0.238*
Male 0.213 0.068*** 0.102*** 0.062***
Non-prioritised ethnicity
European 0.756 0.716*** 0.574*** 0.628***
Māori 0.109 0.175*** 0.268*** 0.230***
Pacific Peoples 0.056 0.065*** 0.124*** 0.104***
Asian 0.122 0.124 0.130** 0.124
MELAA 0.010 0.014*** 0.021*** 0.014***
Other 0.016 0.019* 0.019** 0.018
Prioritised ethnicity
European 0.697 0.621*** 0.464*** 0.454***
Māori 0.109 0.175*** 0.268*** 0.230***
Pacific Peoples 0.052 0.055 0.108*** 0.089***
Asian 0.119 0.120 0.124 0.117
MELAA 0.010 0.014*** 0.019*** 0.014***
Other 0.015 0.017 0.017 0.016
Highest educational attainment
Doctorate 0.010 0.004*** 0.004*** 0.004***
Masters 0.042 0.031*** 0.026*** 0.020***
Bachelor’s 0.265 0.170*** 0.129*** 0.115***
Post-school 0.460 0.527*** 0.491*** 0.440**
School 0.077 0.091*** 0.102*** 0.126***
No qualification 0.126 0.150*** 0.223*** 0.276***
Page 14
Table 2. Individual and household characteristics (continued)
Characteristic Fully
utilised Under-
employed Unemployed
Potential labour force
(1) (2) (3) (4)
Deprivation decile 5.323
(2.775)
6.039***
(2.780)
6.676*** (2.803)
6.423*** (2.866)
Urban / rural
Main urban areas 0.795 0.768*** 0.815*** 0.800
Secondary urban areas 0.050 0.063*** 0.046 0.052
Minor urban areas 0.063 0.086*** 0.076*** 0.074***
Rural centres 0.009 0.012** 0.013*** 0.011
Rural areas 0.083 0.071*** 0.050*** 0.063***
Years in NZ 18.674 (14.686)
15.773*** (13.689)
14.804*** (12.912)
17.175** (15.500)
Region of birth
Oceania and Antarctica 0.770 0.789*** 0.801*** 0.808***
Northwest Europe 0.081 0.062*** 0.043*** 0.055***
Southern and Eastern Europe 0.008 0.009 0.007 0.004***
North Africa and the Middle East 0.003 0.005*** 0.011*** 0.008***
Southeast Asia 0.029 0.029 0.032 0.029
Northeast Asia 0.033 0.034 0.033 0.033
Southern and Central Asia 0.036 0.035 0.037 0.029***
The Americas 0.014 0.017* 0.012** 0.008***
Sub-Saharan Africa 0.025 0.021*** 0.024 0.026
Observations 134,802 7,617 8,754 6,957
Source: NZ HLFS (2016 Q2 - 2018 Q2), Stats NZ.
Notes: Standard deviations are presented in parentheses. *, **, and *** denote statistically significant differences between
variable means compared with the fully utilised population (column 1) at the 10, 5, and 1 percent-levels, respectively. Definitions
of each variable can be found in Table 1. Gross weekly household income is sourced from the June quarter of the HLFS. The
OECD-modified equivalence scale is applied. Household income estimates are adjusted for inflation using the second quarter of
2017 as the base period.
✓ Poverty thresholds are traditionally estimated using disposable household income (net of taxes). However, since the data only
provides information on gross household income, our poverty indicator (60% of median income threshold) is computed using
gross household income estimates.
Page 15
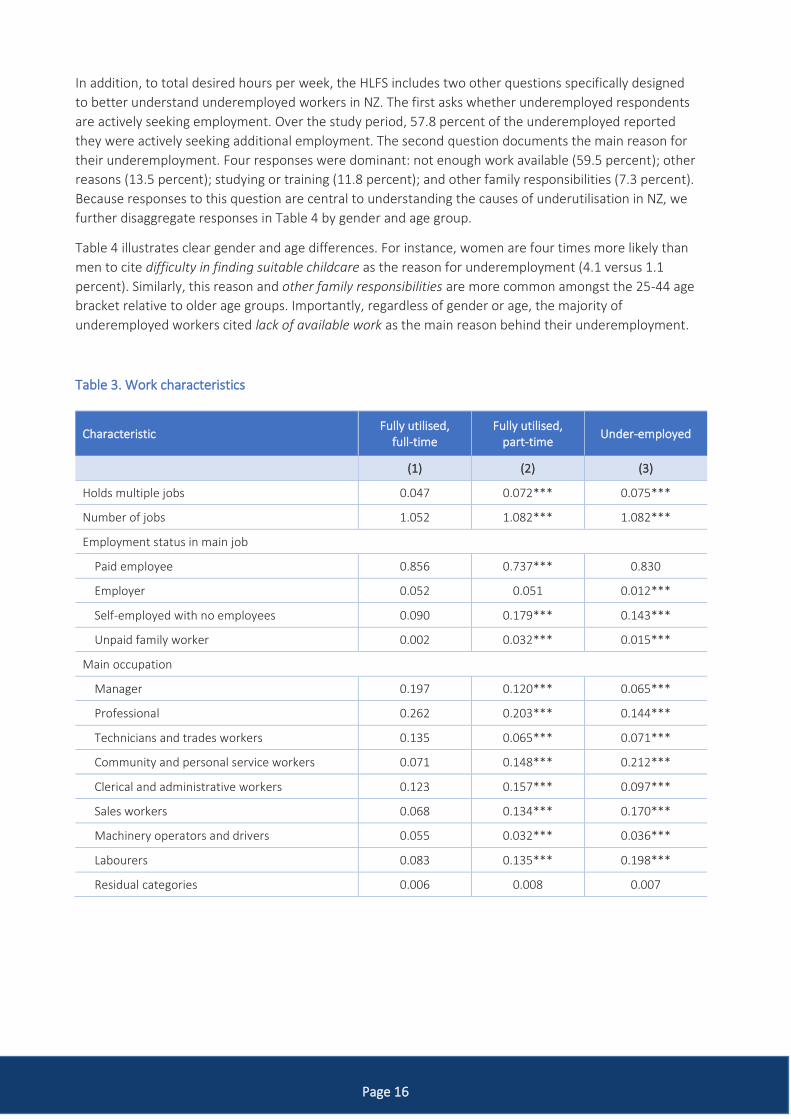
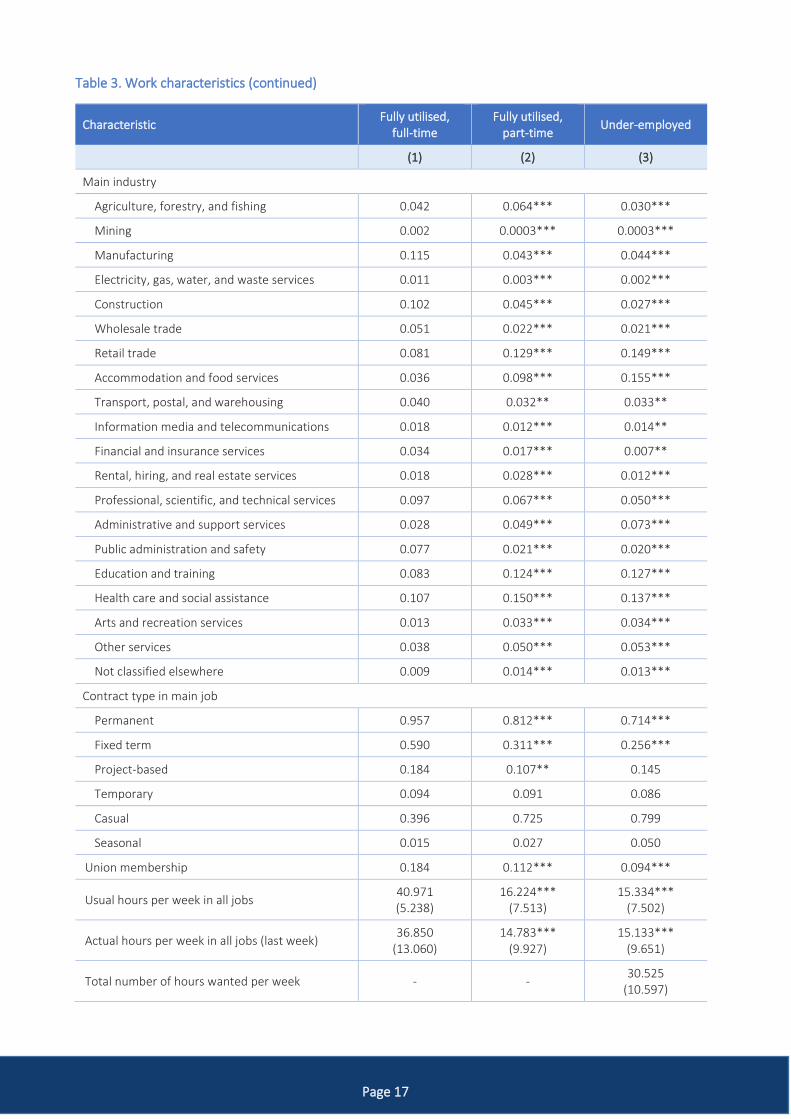
4.2 Work characteristics
Table 3 presents work characteristics of the fully utilised and underutilised survey respondents. Since, by
definition, unemployed persons and those in the potential labour force do not hold jobs at the time of
the survey, we focus on comparing job characteristics of the underemployed to fully utilised workers. For
additional insight, we classify the fully utilised workers into full-time workers and part-time workers
because work-related characteristics (such as occupations and industries) may vary between the two
groups. We also present descriptive statistics on last reported occupation and industry for all three
categories of underutilised workers in Appendix C.11
Several important differences between fully utilised and underemployed workers emerge in Table 3.
Underemployed workers (and fully utilised part-time workers) are significantly more likely to hold
multiple jobs compared to fully utilised full-time workers (7.5 percent versus 4.7 percent, respectively).
Compared to fully utilised full-time workers, underemployed individuals are more likely to be self-
employed and less likely to be employers themselves.
An important part of understanding worker underutilisation comes from analysing current occupations
and industries in main jobs. Occupations are categorised according to the one-digit Australia and New
Zealand Standard Classification of Occupations (ANZSCO) codes, while industries are categorised
according to Australia and New Zealand Standard Industrial Classification (ANZSIC) codes. Survey results
suggest that fully utilised and underemployed workers take on very different roles in New Zealand’s
labour market. Underemployed workers are significantly more likely to be community and personal
service workers, work in sales, and to be labourers relative to fully utilised full-time workers. Conversely,
fully utilised full-time workers are more prevalent in managerial, professional, and technical and trade
positions. With respect to industry characteristics, underemployed workers are substantially more likely
(relative to fully utilised full-time workers) to work in retail; accommodation and food services;
administrative and support services; education; and health care. In comparison to the reference group,
underemployed workers are also less likely to belong to a union and hold permanent or fixed term
positions.
Respondents in the HLFS are also asked how many hours they usually work in a given week and how
many hours they actually worked in the week prior to the survey. As a corollary to these questions,
workers who identified as underemployed were asked how many total hours they would like to work in a
typical week. We use these responses to compare the usual, as well as the actual, working hours of fully
utilised and underemployed workers. On average, fully utilised full-time respondents usually worked
more than two and half times as many hours as the underemployed (41 to 15 hours, respectively).
Another way to assess underemployed workers’ demand for additional hours is to consider the ratio of
total wanted hours to usual hours, and to actual hours worked. The average ratios are also reported in
Table 3. The survey indicates that underemployed workers, on average, desire 1.6 times as many hours
as they usually work in each week. This means a hypothetical underemployed respondent working 15
hours per week would, on average, prefer to work 24 hours per week. As a caveat, we point out the large
standard deviations of these measures, which occurs because of the outliers in both tails of the
distribution.
11 The tables in Appendix C are based on individuals who provided prior employment information in the HLFS, or individuals who were observed to be employed in previous HLFS waves and hence whose prior employment status can be supplemented with lagged information.
Page 16
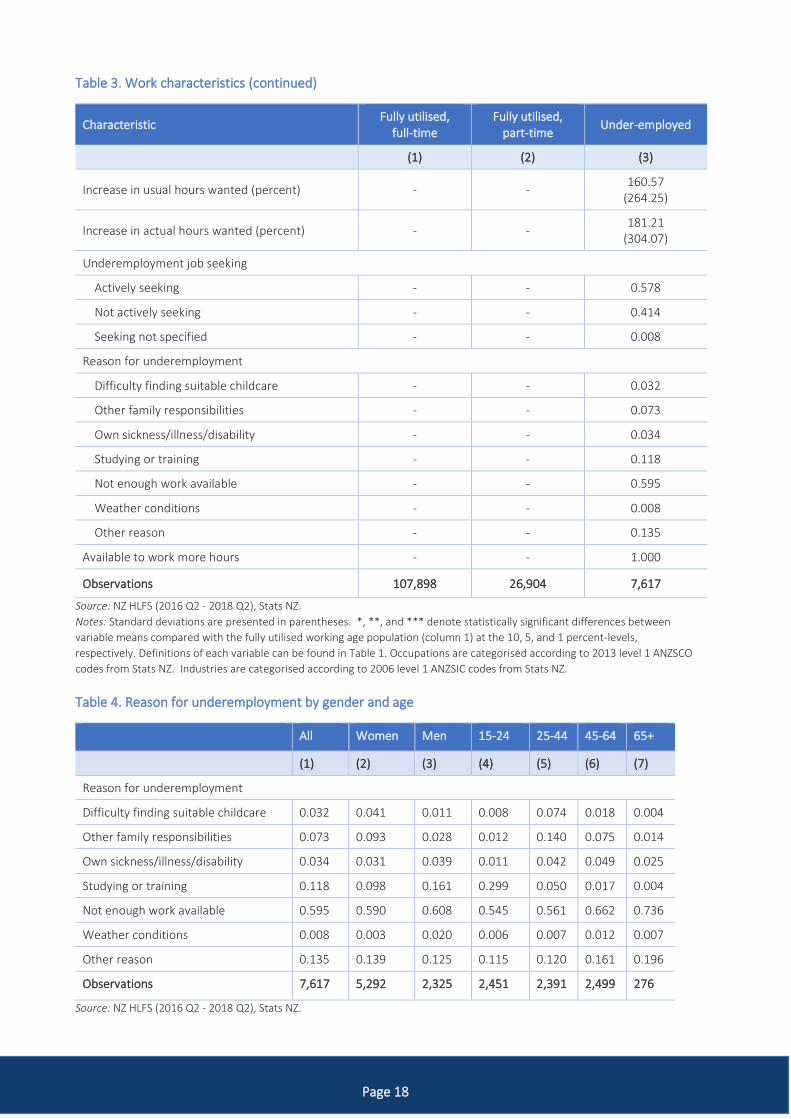
In addition, to total desired hours per week, the HLFS includes two other questions specifically designed
to better understand underemployed workers in NZ. The first asks whether underemployed respondents
are actively seeking employment. Over the study period, 57.8 percent of the underemployed reported
they were actively seeking additional employment. The second question documents the main reason for
their underemployment. Four responses were dominant: not enough work available (59.5 percent); other
reasons (13.5 percent); studying or training (11.8 percent); and other family responsibilities (7.3 percent).
Because responses to this question are central to understanding the causes of underutilisation in NZ, we
further disaggregate responses in Table 4 by gender and age group.
Table 4 illustrates clear gender and age differences. For instance, women are four times more likely than
men to cite difficulty in finding suitable childcare as the reason for underemployment (4.1 versus 1.1
percent). Similarly, this reason and other family responsibilities are more common amongst the 25-44 age
bracket relative to older age groups. Importantly, regardless of gender or age, the majority of
underemployed workers cited lack of available work as the main reason behind their underemployment.
Table 3. Work characteristics
Characteristic Fully utilised,
full-time Fully utilised,
part-time Under-employed
(1) (2) (3)
Holds multiple jobs 0.047 0.072*** 0.075***
Number of jobs 1.052 1.082*** 1.082***
Employment status in main job
Paid employee 0.856 0.737*** 0.830
Employer 0.052 0.051 0.012***
Self-employed with no employees 0.090 0.179*** 0.143***
Unpaid family worker 0.002 0.032*** 0.015***
Main occupation
Manager 0.197 0.120*** 0.065***
Professional 0.262 0.203*** 0.144***
Technicians and trades workers 0.135 0.065*** 0.071***
Community and personal service workers 0.071 0.148*** 0.212***
Clerical and administrative workers 0.123 0.157*** 0.097***
Sales workers 0.068 0.134*** 0.170***
Machinery operators and drivers 0.055 0.032*** 0.036***
Labourers 0.083 0.135*** 0.198***
Residual categories 0.006 0.008 0.007
Page 17
Table 3. Work characteristics (continued)
Characteristic Fully utilised,
full-time Fully utilised,
part-time Under-employed
(1) (2) (3)
Main industry
Agriculture, forestry, and fishing 0.042 0.064*** 0.030***
Mining 0.002 0.0003*** 0.0003***
Manufacturing 0.115 0.043*** 0.044***
Electricity, gas, water, and waste services 0.011 0.003*** 0.002***
Construction 0.102 0.045*** 0.027***
Wholesale trade 0.051 0.022*** 0.021***
Retail trade 0.081 0.129*** 0.149***
Accommodation and food services 0.036 0.098*** 0.155***
Transport, postal, and warehousing 0.040 0.032** 0.033**
Information media and telecommunications 0.018 0.012*** 0.014**
Financial and insurance services 0.034 0.017*** 0.007**
Rental, hiring, and real estate services 0.018 0.028*** 0.012***
Professional, scientific, and technical services 0.097 0.067*** 0.050***
Administrative and support services 0.028 0.049*** 0.073***
Public administration and safety 0.077 0.021*** 0.020***
Education and training 0.083 0.124*** 0.127***
Health care and social assistance 0.107 0.150*** 0.137***
Arts and recreation services 0.013 0.033*** 0.034***
Other services 0.038 0.050*** 0.053***
Not classified elsewhere 0.009 0.014*** 0.013***
Contract type in main job
Permanent 0.957 0.812*** 0.714***
Fixed term 0.590 0.311*** 0.256***
Project-based 0.184 0.107** 0.145
Temporary 0.094 0.091 0.086
Casual 0.396 0.725 0.799
Seasonal 0.015 0.027 0.050
Union membership 0.184 0.112*** 0.094***
Usual hours per week in all jobs 40.971 (5.238)
16.224*** (7.513)
15.334*** (7.502)
Actual hours per week in all jobs (last week) 36.850
(13.060) 14.783***
(9.927) 15.133***
(9.651)
Total number of hours wanted per week - - 30.525
(10.597)
Page 18
Table 3. Work characteristics (continued)
Characteristic Fully utilised,
full-time Fully utilised,
part-time Under-employed
(1) (2) (3)
Increase in usual hours wanted (percent) - - 160.57
(264.25)
Increase in actual hours wanted (percent) - - 181.21
(304.07)
Underemployment job seeking
Actively seeking - - 0.578
Not actively seeking - - 0.414
Seeking not specified - - 0.008
Reason for underemployment
Difficulty finding suitable childcare - - 0.032
Other family responsibilities - - 0.073
Own sickness/illness/disability - - 0.034
Studying or training - - 0.118
Not enough work available - - 0.595
Weather conditions - - 0.008
Other reason - - 0.135
Available to work more hours - - 1.000
Observations 107,898 26,904 7,617
Source: NZ HLFS (2016 Q2 - 2018 Q2), Stats NZ.
Notes: Standard deviations are presented in parentheses. *, **, and *** denote statistically significant differences between
variable means compared with the fully utilised working age population (column 1) at the 10, 5, and 1 percent-levels,
respectively. Definitions of each variable can be found in Table 1. Occupations are categorised according to 2013 level 1 ANZSCO
codes from Stats NZ. Industries are categorised according to 2006 level 1 ANZSIC codes from Stats NZ.
Table 4. Reason for underemployment by gender and age
All Women Men 15-24 25-44 45-64 65+
(1) (2) (3) (4) (5) (6) (7)
Reason for underemployment
Difficulty finding suitable childcare 0.032 0.041 0.011 0.008 0.074 0.018 0.004
Other family responsibilities 0.073 0.093 0.028 0.012 0.140 0.075 0.014
Own sickness/illness/disability 0.034 0.031 0.039 0.011 0.042 0.049 0.025
Studying or training 0.118 0.098 0.161 0.299 0.050 0.017 0.004
Not enough work available 0.595 0.590 0.608 0.545 0.561 0.662 0.736
Weather conditions 0.008 0.003 0.020 0.006 0.007 0.012 0.007
Other reason 0.135 0.139 0.125 0.115 0.120 0.161 0.196
Observations 7,617 5,292 2,325 2,451 2,391 2,499 276
Source: NZ HLFS (2016 Q2 - 2018 Q2), Stats NZ.
Page 19
5. RESULTS FOR AIM 2
Aim 2: Explore the transience of underutilisation.
5.1 Transience of underutilised workers
Next, we explore how transient the underutilised workforce is. Specifically, we attempt to answer the
following questions:
1) Do workers frequently move in and out of underemployment?
2) How likely are fully utilised workers to still be fully utilised the next time they are observed?
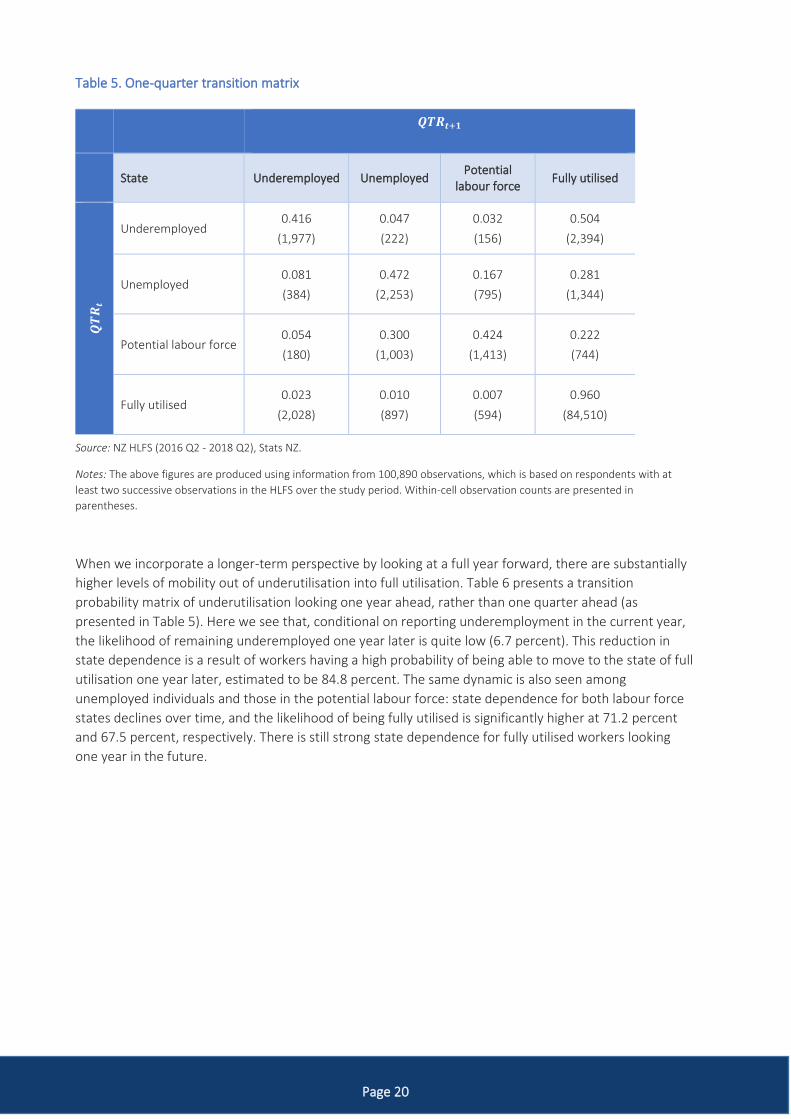
To provide insights into these queries, we construct a transition probability matrix. In particular, Table 5
presents the proportions of individuals in each of the four labour market states (i.e., underemployed,
unemployed, potential labour force, or fully utilised) in quarter QTRt+1, given the respondent’s labour
market state in the previous quarter, QTRt. The matrix is constructed using 100,890 observations, which
is based on respondents with at least two successive observations in the HLFS over the study period.
Of particular interest in Table 5 are the estimates on the downward diagonal. These proportions can be
interpreted as approximate measures of state dependence, i.e., the likelihood of remaining in a particular
labour market state in the successive quarter. As shown in Table 5, NZ workers exhibit strong quarter-to-
quarter state dependence. Workers reporting underemployment in a given quarter have a 41.6 percent
likelihood of remaining so in the following quarter. The proportions for the unemployed and the potential
labour force are similar in magnitude (47.2 percent and 42.4 percent, respectively). Fully utilised workers
are highly stable from quarter-to-quarter, experiencing a 96.0 percent likelihood of remaining fully
utilised in the next quarter, conditional on currently being fully utilised.
Despite strong quarter-to-quarter state dependence, Table 5 indicates there is a higher probability of
underutilised workers moving to a state of being fully utilised in the short-run. Around half of the
individuals who reported to be underemployed in a particular quarter became fully utilised in the
subsequent quarter. Additionally, 28.1 percent of the unemployed become fully utilised in the following
quarter.
Further, unemployed persons in the current quarter have an 8.1 percent likelihood of being
underemployed by the next quarter (which may be considered an overall improvement in their labour
force status). For those in the potential labour force, there is a 30.0 percent probability they join the
labour force in the next quarter but are unable to find work, and a 22.2 percent likelihood of being fully
utilised in the next quarter.
Page 20
Table 5. One-quarter transition matrix
𝑸𝑻𝑹𝒕+𝟏
State Underemployed Unemployed Potential
labour force Fully utilised
𝑸𝑻
𝑹𝒕
Underemployed 0.416
(1,977)
0.047
(222)
0.032
(156)
0.504
(2,394)
Unemployed 0.081
(384)
0.472
(2,253)
0.167
(795)
0.281
(1,344)
Potential labour force 0.054
(180)
0.300
(1,003)
0.424
(1,413)
0.222
(744)
Fully utilised 0.023
(2,028)
0.010
(897)
0.007
(594)
0.960
(84,510)
Source: NZ HLFS (2016 Q2 - 2018 Q2), Stats NZ.
Notes: The above figures are produced using information from 100,890 observations, which is based on respondents with at
least two successive observations in the HLFS over the study period. Within-cell observation counts are presented in
parentheses.
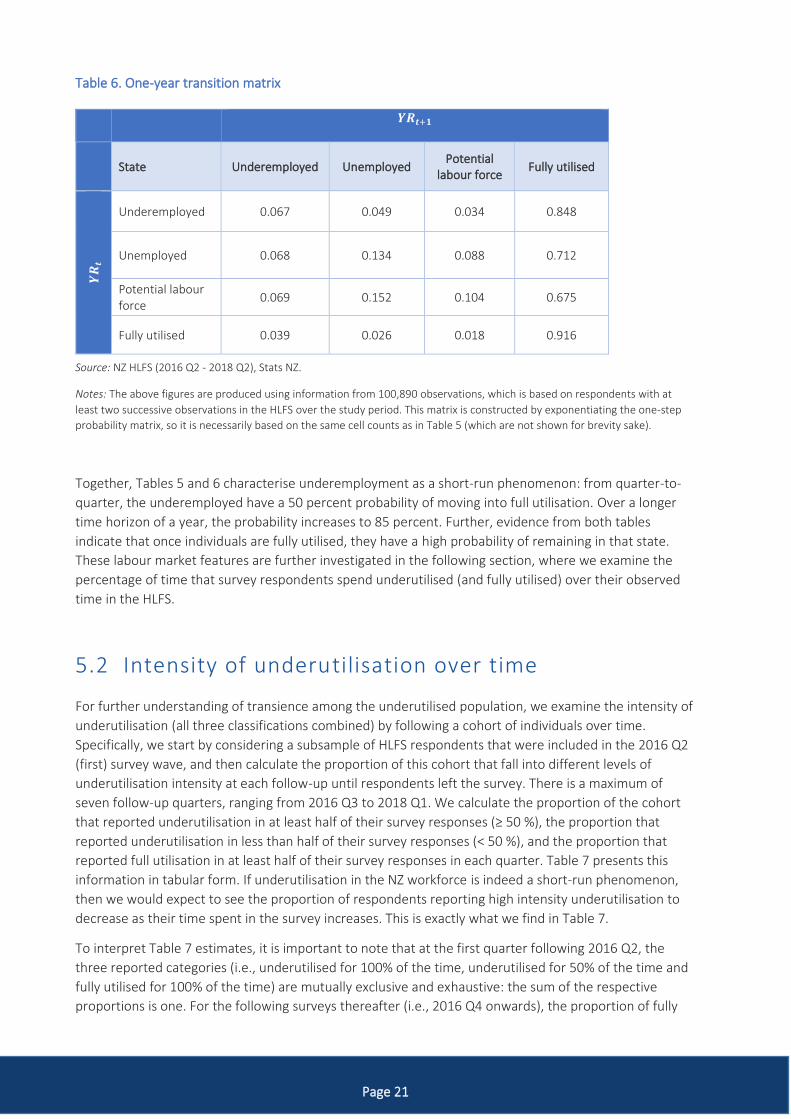
When we incorporate a longer-term perspective by looking at a full year forward, there are substantially
higher levels of mobility out of underutilisation into full utilisation. Table 6 presents a transition
probability matrix of underutilisation looking one year ahead, rather than one quarter ahead (as
presented in Table 5). Here we see that, conditional on reporting underemployment in the current year,
the likelihood of remaining underemployed one year later is quite low (6.7 percent). This reduction in
state dependence is a result of workers having a high probability of being able to move to the state of full
utilisation one year later, estimated to be 84.8 percent. The same dynamic is also seen among
unemployed individuals and those in the potential labour force: state dependence for both labour force
states declines over time, and the likelihood of being fully utilised is significantly higher at 71.2 percent
and 67.5 percent, respectively. There is still strong state dependence for fully utilised workers looking
one year in the future.
Page 21
Table 6. One-year transition matrix
𝒀𝑹𝒕+𝟏
State Underemployed Unemployed Potential
labour force Fully utilised
𝒀𝑹
𝒕
Underemployed 0.067 0.049 0.034 0.848
Unemployed 0.068 0.134 0.088 0.712
Potential labour force
0.069 0.152 0.104 0.675
Fully utilised 0.039 0.026 0.018 0.916
Source: NZ HLFS (2016 Q2 - 2018 Q2), Stats NZ.
Notes: The above figures are produced using information from 100,890 observations, which is based on respondents with at
least two successive observations in the HLFS over the study period. This matrix is constructed by exponentiating the one-step
probability matrix, so it is necessarily based on the same cell counts as in Table 5 (which are not shown for brevity sake).
Together, Tables 5 and 6 characterise underemployment as a short-run phenomenon: from quarter-to-
quarter, the underemployed have a 50 percent probability of moving into full utilisation. Over a longer
time horizon of a year, the probability increases to 85 percent. Further, evidence from both tables
indicate that once individuals are fully utilised, they have a high probability of remaining in that state.
These labour market features are further investigated in the following section, where we examine the
percentage of time that survey respondents spend underutilised (and fully utilised) over their observed
time in the HLFS.
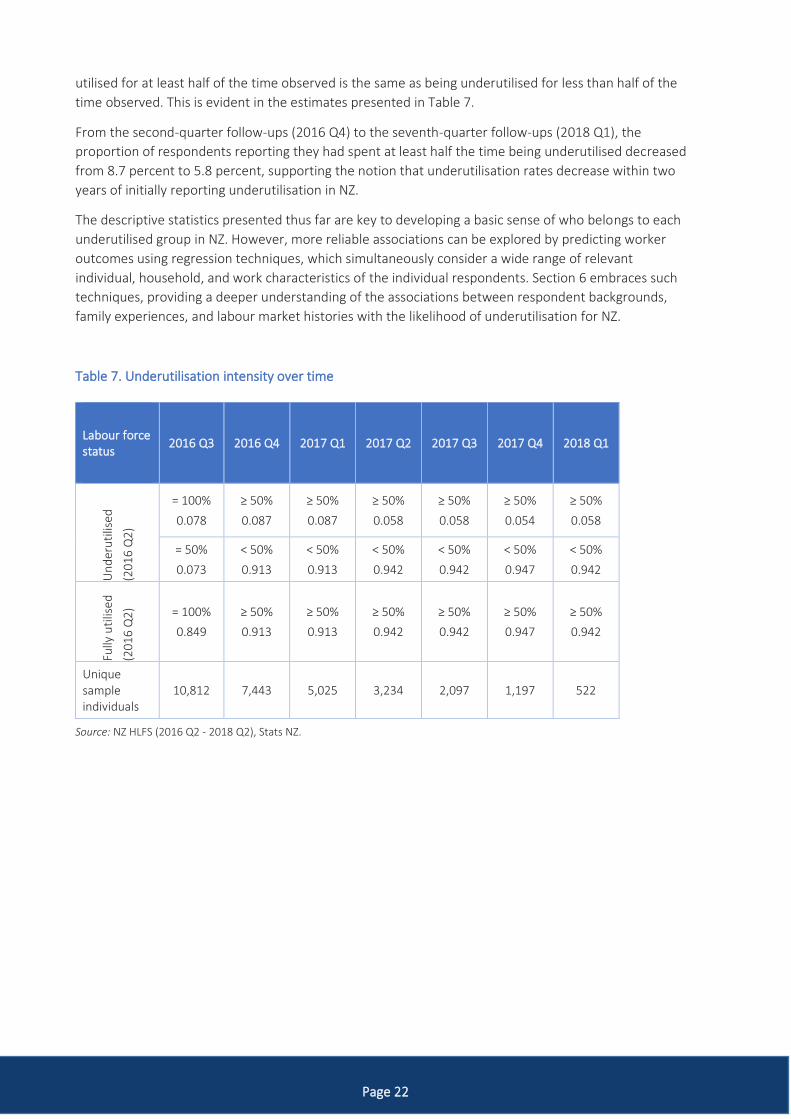
5.2 Intensity of underutilisation over time
For further understanding of transience among the underutilised population, we examine the intensity of
underutilisation (all three classifications combined) by following a cohort of individuals over time.
Specifically, we start by considering a subsample of HLFS respondents that were included in the 2016 Q2
(first) survey wave, and then calculate the proportion of this cohort that fall into different levels of
underutilisation intensity at each follow-up until respondents left the survey. There is a maximum of
seven follow-up quarters, ranging from 2016 Q3 to 2018 Q1. We calculate the proportion of the cohort
that reported underutilisation in at least half of their survey responses (≥ 50 %), the proportion that
reported underutilisation in less than half of their survey responses (< 50 %), and the proportion that
reported full utilisation in at least half of their survey responses in each quarter. Table 7 presents this
information in tabular form. If underutilisation in the NZ workforce is indeed a short-run phenomenon,
then we would expect to see the proportion of respondents reporting high intensity underutilisation to
decrease as their time spent in the survey increases. This is exactly what we find in Table 7.
To interpret Table 7 estimates, it is important to note that at the first quarter following 2016 Q2, the
three reported categories (i.e., underutilised for 100% of the time, underutilised for 50% of the time and
fully utilised for 100% of the time) are mutually exclusive and exhaustive: the sum of the respective
proportions is one. For the following surveys thereafter (i.e., 2016 Q4 onwards), the proportion of fully
Page 22
utilised for at least half of the time observed is the same as being underutilised for less than half of the
time observed. This is evident in the estimates presented in Table 7.
From the second-quarter follow-ups (2016 Q4) to the seventh-quarter follow-ups (2018 Q1), the
proportion of respondents reporting they had spent at least half the time being underutilised decreased
from 8.7 percent to 5.8 percent, supporting the notion that underutilisation rates decrease within two
years of initially reporting underutilisation in NZ.
The descriptive statistics presented thus far are key to developing a basic sense of who belongs to each
underutilised group in NZ. However, more reliable associations can be explored by predicting worker
outcomes using regression techniques, which simultaneously consider a wide range of relevant
individual, household, and work characteristics of the individual respondents. Section 6 embraces such
techniques, providing a deeper understanding of the associations between respondent backgrounds,
family experiences, and labour market histories with the likelihood of underutilisation for NZ.
Table 7. Underutilisation intensity over time
Labour force status
2016 Q3 2016 Q4 2017 Q1 2017 Q2 2017 Q3 2017 Q4 2018 Q1
Un
der
uti
lised
(20
16
Q2
)
= 100%
0.078
≥ 50%
0.087
≥ 50%
0.087
≥ 50%
0.058
≥ 50%
0.058
≥ 50%
0.054
≥ 50%
0.058
= 50%
0.073
< 50%
0.913
< 50%
0.913
< 50%
0.942
< 50%
0.942
< 50%
0.947
< 50%
0.942
Fully
uti
lise
d
(20
16
Q2
) = 100%
0.849
≥ 50%
0.913
≥ 50%
0.913
≥ 50%
0.942
≥ 50%
0.942
≥ 50%
0.947
≥ 50%
0.942
Unique sample individuals
10,812 7,443 5,025 3,234 2,097 1,197 522
Source: NZ HLFS (2016 Q2 - 2018 Q2), Stats NZ.
Page 23
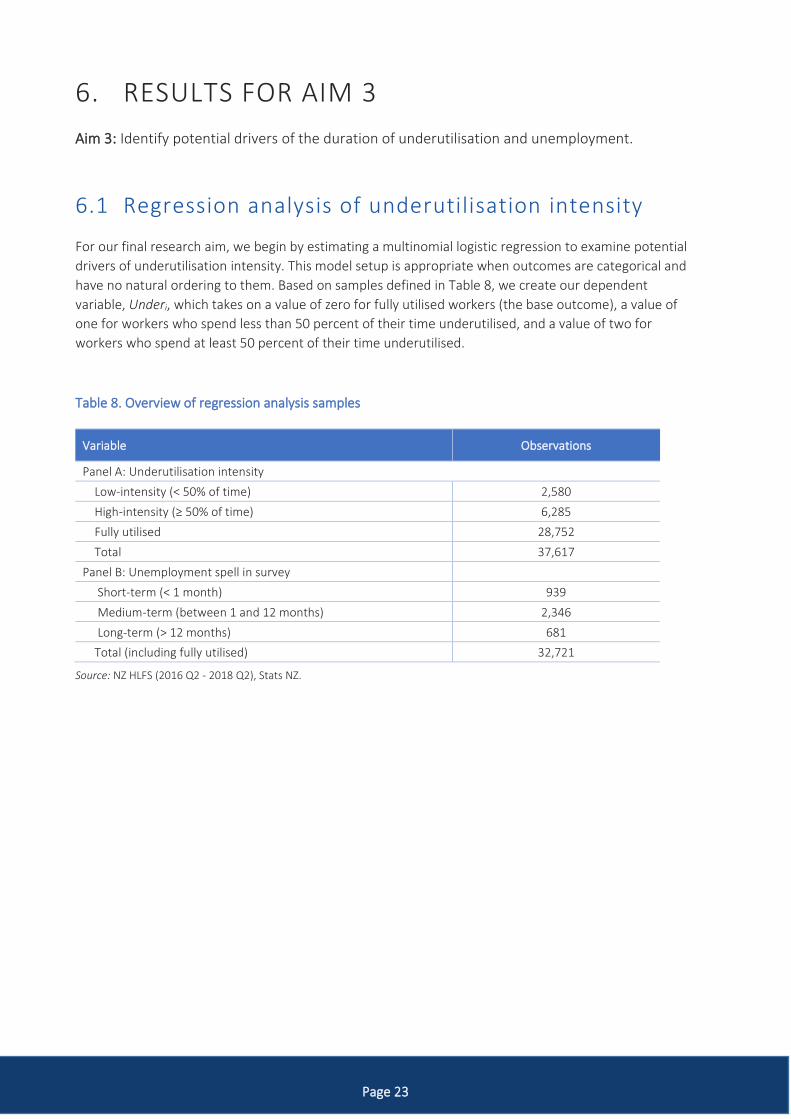
6. RESULTS FOR AIM 3
Aim 3: Identify potential drivers of the duration of underutilisation and unemployment.
6.1 Regression analysis of underutilisation intensity
For our final research aim, we begin by estimating a multinomial logistic regression to examine potential
drivers of underutilisation intensity. This model setup is appropriate when outcomes are categorical and
have no natural ordering to them. Based on samples defined in Table 8, we create our dependent
variable, Underi, which takes on a value of zero for fully utilised workers (the base outcome), a value of
one for workers who spend less than 50 percent of their time underutilised, and a value of two for
workers who spend at least 50 percent of their time underutilised.
Table 8. Overview of regression analysis samples
Variable Observations
Panel A: Underutilisation intensity
Low-intensity (< 50% of time) 2,580
High-intensity (≥ 50% of time) 6,285
Fully utilised 28,752
Total 37,617
Panel B: Unemployment spell in survey
Short-term (< 1 month) 939
Medium-term (between 1 and 12 months) 2,346
Long-term (> 12 months) 681
Total (including fully utilised) 32,721
Source: NZ HLFS (2016 Q2 - 2018 Q2), Stats NZ.
Page 24
The model set-up is as follows:
𝑃(𝑢𝑛𝑑𝑒𝑟𝑖 = 𝑢𝑛𝑑𝑒𝑟𝑢𝑡𝑖𝑙𝑖𝑠𝑒𝑑 < 50% 𝑜𝑓 𝑡𝑖𝑚𝑒)
𝑃(𝑢𝑛𝑑𝑒𝑟𝑖 = 𝑓𝑢𝑙𝑙𝑦 𝑢𝑡𝑖𝑙𝑖𝑠𝑒𝑑)= (𝑿𝒊 = 𝑥𝑖)𝜷 (1)
𝑃(𝑢𝑛𝑑𝑒𝑟𝑖 = 𝑢𝑛𝑑𝑒𝑟𝑢𝑡𝑖𝑙𝑖𝑠𝑒𝑑 ≥ 50% 𝑜𝑓 𝑡𝑖𝑚𝑒)
𝑃(𝑢𝑛𝑑𝑒𝑟𝑖 = 𝑓𝑢𝑙𝑙𝑦 𝑢𝑡𝑖𝑙𝑖𝑠𝑒𝑑)= (𝑿𝒊 = 𝑥𝑖)𝜷 (2)
where Xi is a vector of individual characteristics (including socio-demographic, economic and household
attributes), xi is the value characteristics take on, and β is a vector of estimated coefficients.
Associations between characteristics and underutilisation intensity outcomes are presented as relative risk ratios. To interpret these findings: Relative risk ratios greater than 1 reflect a factor that is associated with an increase in the likelihood of being in a certain intensity-specific category of underutilised relative to being fully utilised. For instance, in the low-intensity underutilisation model (equation 1), female has a relative risk ratio of 1.871 – this indicates that females are 87.1 percent more likely to experience low-intensity underutilisation than their male counterparts, holding all other factors constant. This result is relative to being fully utilised. Relative risk ratios below 1 reflect a factor that is associated with a decline in the likelihood of being in a certain intensity-specific category of underutilised relative to being fully utilised. For instance, in the high-intensity underutilisation model (equation 2), holding a bachelor’s degree has a relative risk ratio of 0.365 – this indicates that degree-holders are 36.5 percent as likely as non-degree-holders to experience high-intensity underutilisation, holding all other factors constant. This result is relative to being fully utilised. Asterisks provided next to each risk ratio indicate the statistical significance of the result, with ***, **, and * denoting significance at the 1%, 5%, and 10% levels, respectively.
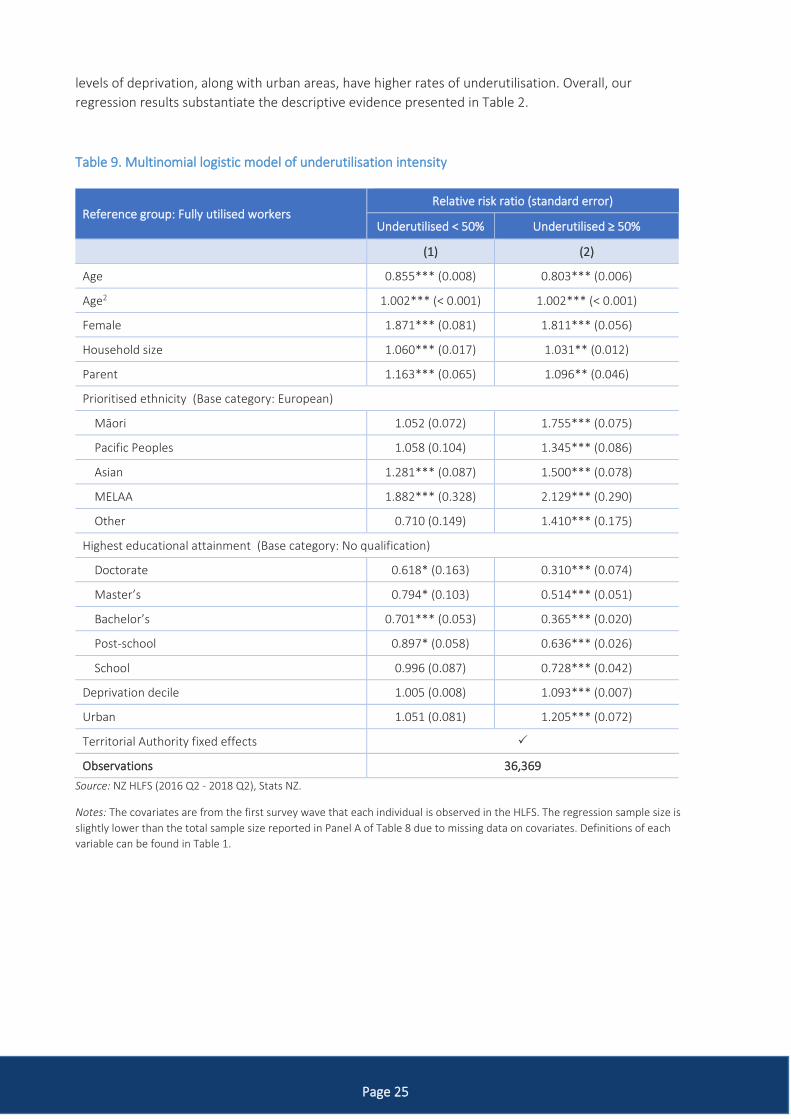
Table 9 presents regression results for underutilisation intensity outcomes.12 Note that all results are
interpreted relative to the base outcome of full utilisation.13 Results show a U-shaped relationship
between age and underutilisation: the likelihood of underutilisation initially decreases with age, before
increasing at later years. Being a woman is positively and significantly associated with the likelihood of
being underutilised relative to men. Workers in larger households are more likely to experience both low-
and high-intensity underutilisation. Respondents identifying as Māori are 75.5 percent more likely to
experience high-intensity underutilisation compared to Europeans. For Pacific Peoples, this increase is
estimated to be 34.5 percent. Education and neighbourhood characteristics are also found to be strong
predictors of underutilisation. For example, compared to no schooling, having school-level or higher
educational attainment is associated with a lower likelihood of underutilisation, and areas with higher
12 Note that the inclusion of age-squared in addition to the age variable is in accordance with the Mincer earnings equation which models labour market earnings as a quadratic function of experience/age (see Heckman, Lochner, & Todd, 2006). Age is commonly treated as an indicator of labour market experience. The economic intuition behind this is that although earnings are positively related to individuals' experience, during initial labour market years earnings increase at an increasing rate and at a decreasing rate after a certain point in time as workers grow older. Going by the standard approach, we expect that underutilisation (another labour market outcome) is likely to follow a similar trajectory to that of labour market earnings. 13 Table 9 results are for underutilisation in general, see Appendix D for results focussed on underemployment.
Page 25
levels of deprivation, along with urban areas, have higher rates of underutilisation. Overall, our
regression results substantiate the descriptive evidence presented in Table 2.
Table 9. Multinomial logistic model of underutilisation intensity
Reference group: Fully utilised workers Relative risk ratio (standard error)
Underutilised < 50% Underutilised ≥ 50%
(1) (2)
Age 0.855*** (0.008) 0.803*** (0.006)
Age2 1.002*** (< 0.001) 1.002*** (< 0.001)
Female 1.871*** (0.081) 1.811*** (0.056)
Household size 1.060*** (0.017) 1.031** (0.012)
Parent 1.163*** (0.065) 1.096** (0.046)
Prioritised ethnicity (Base category: European)
Māori 1.052 (0.072) 1.755*** (0.075)
Pacific Peoples 1.058 (0.104) 1.345*** (0.086)
Asian 1.281*** (0.087) 1.500*** (0.078)
MELAA 1.882*** (0.328) 2.129*** (0.290)
Other 0.710 (0.149) 1.410*** (0.175)
Highest educational attainment (Base category: No qualification)
Doctorate 0.618* (0.163) 0.310*** (0.074)
Master’s 0.794* (0.103) 0.514*** (0.051)
Bachelor’s 0.701*** (0.053) 0.365*** (0.020)
Post-school 0.897* (0.058) 0.636*** (0.026)
School 0.996 (0.087) 0.728*** (0.042)
Deprivation decile 1.005 (0.008) 1.093*** (0.007)
Urban 1.051 (0.081) 1.205*** (0.072)
Territorial Authority fixed effects
Observations 36,369
Source: NZ HLFS (2016 Q2 - 2018 Q2), Stats NZ.
Notes: The covariates are from the first survey wave that each individual is observed in the HLFS. The regression sample size is
slightly lower than the total sample size reported in Panel A of Table 8 due to missing data on covariates. Definitions of each
variable can be found in Table 1.
Page 26
6.2 Regression analysis of unemployment duration
To examine the potential drivers of unemployment, classified by durations of joblessness, we estimate an
additional multinomial logistic regression. This model is similar to that represented by equations (1) and
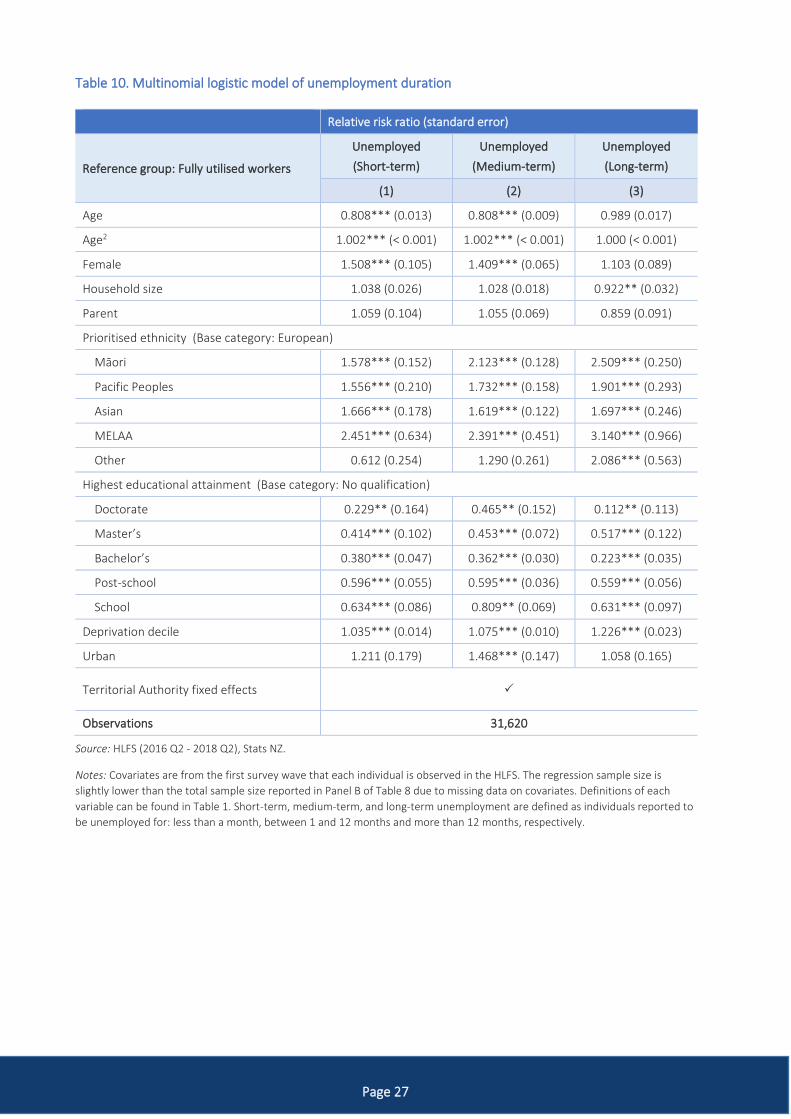
(2), and again uses the fully utilised workforce as the base outcome. Table 10 presents regression results
for three categories of unemployment duration (short-, medium- and long-term). Consistent with ILO’s
classification (ILO, 2012), short-term and long-term unemployment are defined as unemployment for less
than a month and for a year or more, respectively. Medium-term unemployment pertains to
unemployment for a period between 1 and 12 months.
Similar to the results for underutilisation (Table 9), Table 10 shows a negative and non-linear relationship
between age and short- and medium-term unemployment. However, there is no evidence of a significant
relationship between long-term unemployment and age. Women are between 40.9 and 50.8 percent
more likely to experience an unemployment spell of a year or less, relative to men. Estimates indicate no
statistically significant relationship between gender and long-term unemployment. Additionally, with
respect to parenting roles, we do not observe statistically significant association with any of the three
unemployment categories. However, larger households are less likely to experience an unemployment
spell lasting longer than one year. The point estimate on household size suggests that for each additional
member added to the household, the likelihood of experiencing long-term unemployment decreases by
approximately 8.5 percent.14
We note strong relationships between ethnicity, education, and unemployment spells. Compared to
Europeans, every prioritised ethnicity has a higher likelihood of experiencing unemployment of any
duration. Māori are 2.5 times as likely than Europeans to experience an unemployment spell longer than
one year. For Pacific Peoples, the increased risk of long-term unemployment is 90.1 percent. Those
reported as being Middle Eastern, Latin American, or African (MELAA) are over three times as likely to
experience long-term unemployment relative to Europeans. Asian respondents are 69.7 percent more
likely to experience long-term unemployment relative to Europeans.
Schooling is also highly predictive of unemployment spells, with higher levels of education generally
reducing the risk of unemployment. The odds of experiencing long-term unemployment decrease
significantly when any type of education qualification is held. For example, workers holding a bachelor’s
degree are estimated to be 22.3 percent as likely to experience long-term unemployment compared to a
worker with no credential.
Neighbourhood characteristics are strongly associated with unemployment spells. A one-unit increase in
the deprivation decile increases the risk of a long-term unemployment spell by 22.6 percent. Those living
in urban environments have a 46.8 percent higher risk of medium-term unemployment compared to
those living in rural areas. However, the models detect no statistically significant relationship between
urbanicity and short- or long-term unemployment.
14 This number is found by taking the inverse of the relative risk ratio (1 / .922 = 1.0846).
Page 27
Table 10. Multinomial logistic model of unemployment duration
Relative risk ratio (standard error)
Reference group: Fully utilised workers
Unemployed
(Short-term)
Unemployed
(Medium-term)
Unemployed
(Long-term)
(1) (2) (3)
Age 0.808*** (0.013) 0.808*** (0.009) 0.989 (0.017)
Age2 1.002*** (< 0.001) 1.002*** (< 0.001) 1.000 (< 0.001)
Female 1.508*** (0.105) 1.409*** (0.065) 1.103 (0.089)
Household size 1.038 (0.026) 1.028 (0.018) 0.922** (0.032)
Parent 1.059 (0.104) 1.055 (0.069) 0.859 (0.091)
Prioritised ethnicity (Base category: European)
Māori 1.578*** (0.152) 2.123*** (0.128) 2.509*** (0.250)
Pacific Peoples 1.556*** (0.210) 1.732*** (0.158) 1.901*** (0.293)
Asian 1.666*** (0.178) 1.619*** (0.122) 1.697*** (0.246)
MELAA 2.451*** (0.634) 2.391*** (0.451) 3.140*** (0.966)
Other 0.612 (0.254) 1.290 (0.261) 2.086*** (0.563)
Highest educational attainment (Base category: No qualification)
Doctorate 0.229** (0.164) 0.465** (0.152) 0.112** (0.113)
Master’s 0.414*** (0.102) 0.453*** (0.072) 0.517*** (0.122)
Bachelor’s 0.380*** (0.047) 0.362*** (0.030) 0.223*** (0.035)
Post-school 0.596*** (0.055) 0.595*** (0.036) 0.559*** (0.056)
School 0.634*** (0.086) 0.809** (0.069) 0.631*** (0.097)
Deprivation decile 1.035*** (0.014) 1.075*** (0.010) 1.226*** (0.023)
Urban 1.211 (0.179) 1.468*** (0.147) 1.058 (0.165)
Territorial Authority fixed effects
Observations 31,620
Source: HLFS (2016 Q2 - 2018 Q2), Stats NZ.
Notes: Covariates are from the first survey wave that each individual is observed in the HLFS. The regression sample size is
slightly lower than the total sample size reported in Panel B of Table 8 due to missing data on covariates. Definitions of each
variable can be found in Table 1. Short-term, medium-term, and long-term unemployment are defined as individuals reported to
be unemployed for: less than a month, between 1 and 12 months and more than 12 months, respectively.
Page 28
7. CONCLUSION
This study uses HLFS data (over the period June 2016 – 2018) to provide a detailed examination of the
underutilised workforce in NZ. We employ the ILO definition of underutilisation, which includes
individuals who are unemployed, time-related underemployed and those who belong to the potential
labour force. We address three research aims: to understand the socio-economic and work-related
characteristics of underutilised workers; to explore the transience of underutilisation; and to identify
potential drivers of underutilisation intensity and unemployment duration.
With respect to our first research aim, we find significant differences between fully utilised and
underutilised workers. We observe that underutilised workers (across all three sub-groups) tend to be
significantly younger and female. For example, close to one-third of underemployed are aged 15-24; and
nearly 70 percent of the underemployed are women (53 percent of unemployed and 58 percent of the
potential labour force). Other characteristics that were linked with being more likely to be underutilised
included low educational attainment, ethnic minorities, and large household size.
Underemployed workers are most likely to be community and personal service workers or labourers; and
most likely to be found in accommodation and food services or retail trade. The average underemployed
worker desires 30 hours per week, but currently has 15 hours per week. The primary reason provided
their underemployment was not enough work available (59.5 percent). Additional reasons given included
studying or training (11.8 percent) and other family responsibilities (7.3 percent). Of note, when reasons
for underemployment were broken down by age and gender, we found women to be four times more
likely than men to cite difficulty in finding suitable childcare as their reason (4.1 versus 1.1 percent).
For the second research aim, we find evidence to indicate that underutilisation is a short-term
phenomenon. For those who are underemployed, there is a 50.4 percent probability they will be fully
utilised in the next quarter they are observed in the HLFS. When we extend the time horizon to a year
out, this probability rises to 84.8 percent. Furthermore, there is high state dependence in full utilisation
(96 percent probability of remaining in this state one quarter later, and 91.6 percent one year later).
For the final research aim, we use multinomial logit models to identify potential risk factors associated
with underutilisation intensity, as well as unemployment duration. Our findings largely corroborate the
results found in the descriptive statistics in the first research aim. Specifically, females, ethnic minorities,
low education and neighbourhood deprivation appear to be associated with greater risk of high-intensity
underutilisation (i.e., ≥ 50 percent underutilisation). Similar patterns are found for long-term
unemployment (> 12 months), excluding gender.
While this study provides a detailed exploration of the landscape for underutilised workers in NZ, there
are several avenues for potential future research. For example, it would be worthwhile to link the HLFS
with administrative data records (the Integrated Data Infrastructure) to permit analysis of aspects that
are not provided in the current survey. Such aspects include immigration data (to understand the role of
visa restrictions, as well as labour market assimilation of new migrants to NZ), drivers licence records (to
investigate whether lack of access to transport plays a part), and address data (to examine the
relationship between residential mobility and underutilisation).
Page 29
REFERENCES
Acemoglu, D. (1995). Reward structures and the allocation of talent. European Economic Review, 39(1),
17-33.
Baum, S., Bill, A., & Mitchell, W. F. (2009). Employability and labour under-utilization in non-metropolitan
labour markets. Regional Studies, 43(8), 1091-1103.
Benigno, P., Ricci, L. A., & Surico, P. (2015). Unemployment and productivity in the long run: the role of
macroeconomic volatility. Review of Economics and Statistics, 97(3), 698-709.
Dooley, D. (2003). Unemployment, underemployment, and mental health: Conceptualizing employment
status as a continuum. American Journal of Community Psychology, 32(1-2), 9-20.
Dooley, D., & Catalano, R. (2003). Introduction to underemployment and its social costs. American
Journal of Community Psychology, 32(1), 1-7.
Eliason, M., & Storrie, D. (2006). Lasting or latent scars? Swedish evidence on the long-term effects of job
displacement. Journal of Labor Economics, 24(4), 831-856.
Eriksson, S., & Rooth, D. O. (2014). Do employers use unemployment as a sorting criterion when hiring?
Evidence from a field experiment. American Economic Review, 104(3), 1014-39.
Faberman, R. J., & Kudlyak, M. (2019). The intensity of job search and search duration. American
Economic Journal: Macroeconomics, 11(3), 327-57.
Ghayad, R. (2013). The jobless trap. Unpublished working paper. Northeastern University.
Gordo, L. R. (2006). Effects of short-and long-term unemployment on health satisfaction: evidence from
German data. Applied Economics, 38(20), 2335-2350.
Heckman, J. J., Lochner, L. J., & Todd, P. E. (2006). Earnings functions, rates of return and treatment
effects: The Mincer equation and beyond. Handbook of the Economics of Education, 1, 307-458.
International Labour Organisation. (2013, 2-7 October). Resolution concerning statistics of work,
employment and labour underutilization (Adopted) ILO. Symposium conducted at the meeting of the
19th International Conference of Labour Statisticians Geneva, Switzerland. Retrieved from
https://www.ilo.org/wcmsp5/groups/public/---dgreports/---
stat/documents/normativeinstrument/wcms_230304.pdf
International Labour Organisation. (2012) Key indicators of the labour market, 7th edn. Geneva:
International Labour Organization, 2012.
Jensen, L., Findeis, J. L., Hsu, W. L., & Schachter, J. P. (1999). Slipping Into and Out of Underemployment:
Another Disadvantage for Nonmetropolitan Workers? 1. Rural Sociology, 64(3), 417-438.
Kroft, K., Lange, F., & Notowidigdo, M. J. (2013). Duration dependence and labor market conditions:
Evidence from a field experiment. The Quarterly Journal of Economics, 128(3), 1123-1167.
Krueger, A. B., Mueller, A., Davis, S. J., & Şahin, A. (2011). Job search, emotional well-being, and job
finding in a period of mass unemployment: Evidence from high frequency longitudinal data [with
comments and discussion]. Brookings Papers on Economic Activity, 1-81.
Machin, S., & Manning, A. (1999). The causes and consequences of longterm unemployment in Europe.
Handbook of Labor Economics, 3(Part C), 3085-3139.
Page 30
Mehran, F., Bescond, D., Hussmanns, R., & E. Benes. (2008). Beyond unemployment: measurement of
other forms of labour underutilization. ILO Bureau of Statistics. Proceedings from the 18th International
Conference of Labour Statisticians.
Mincer, J., & Ofek, H. (1982). Interrupted work careers: Depreciation and restoration of human capital.
Journal of Human Resources, 3-24.
Prause, J., & Dooley, D. (1997). Effect of underemployment on school-leavers' self-esteem. Journal of
Adolescence, 20(3), 243-260.
Rodríguez Hernández, J. E. (2018). Factors determining labor underutilization in Spain by gender before
and after the economic crisis. Economic and Industrial Democracy. Economic and Industrial Democracy,
1-24. https://doi.org/https://doi.org/10.1177/0143831X17752266
Ruiz-Quintanilla, S. A., & Claes, R. (1996). Determinants of underemployment of young adults: A multi-
country study. International Labour Review, 49(3), 424-438.
Statistics New Zealand. (2016a). Introducing underutilisation in the labour market. Retrieved 5 June, 2019,
from http://stats,govt.nz
Statistics New Zealand. (2016b). Household Labour Force Survey–summary of 2016 redevelopment.
Retrieved 5 June, 2019, from http://www.stats.govt
Statistics New Zealand. (2017). Household Labour Force Survey sources and methods: 2016. Retrieved 7
June, 2019, from www.stats.govt.nz
Statistics New Zealand. (2018). Women in the workforce 2017. Retrieved 21 August, 2019, from
https://www.stats.govt.nz/infographics/women-in-the-workforce-2017
Stratton, L. S. (1995). The effect interruptions in work experience have on wages. Southern Economic
Journal, 955-970.
Tsang, M. C. (1987). The impact of underutilization of education on productivity: A case study of the US
Bell companies. Economics of Education Review, 6(3), 239-254.
Wilkins, R. (2004). The extent and consequences of underemployment in Australia. Working Paper,
Melbourne Institute of Applied Economic and Social Research, 16(04).
Page 31
APPENDICES Appendix A.
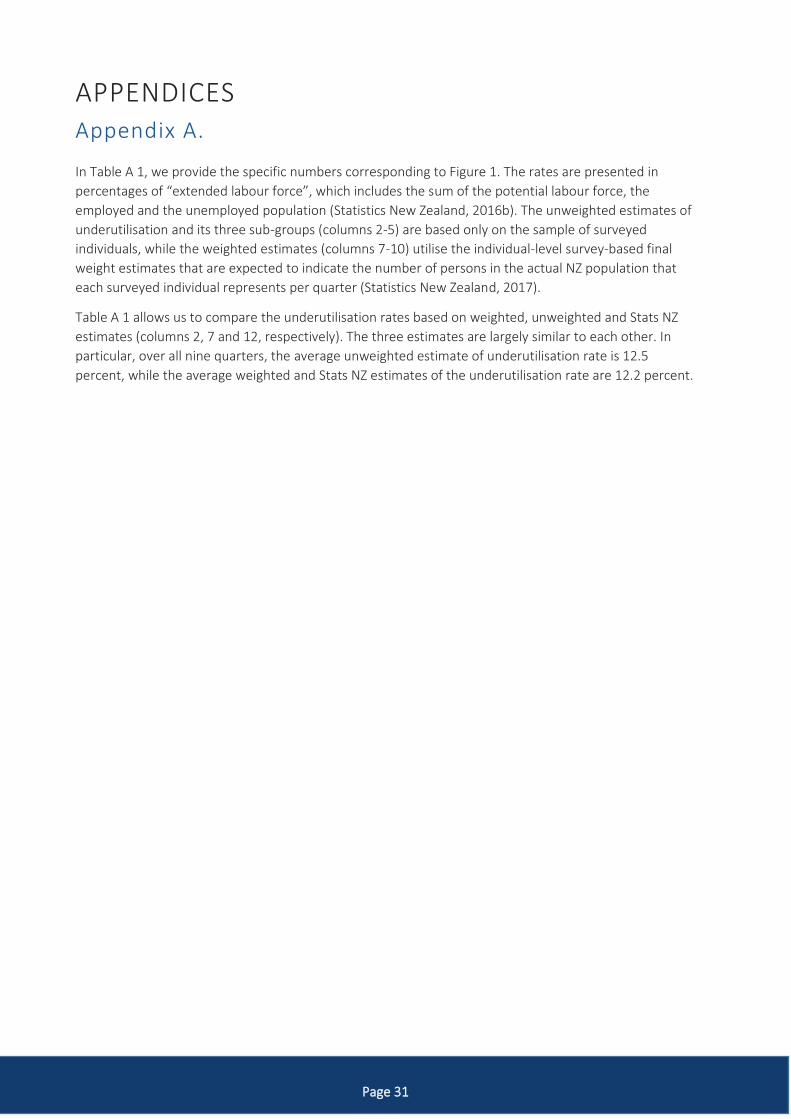
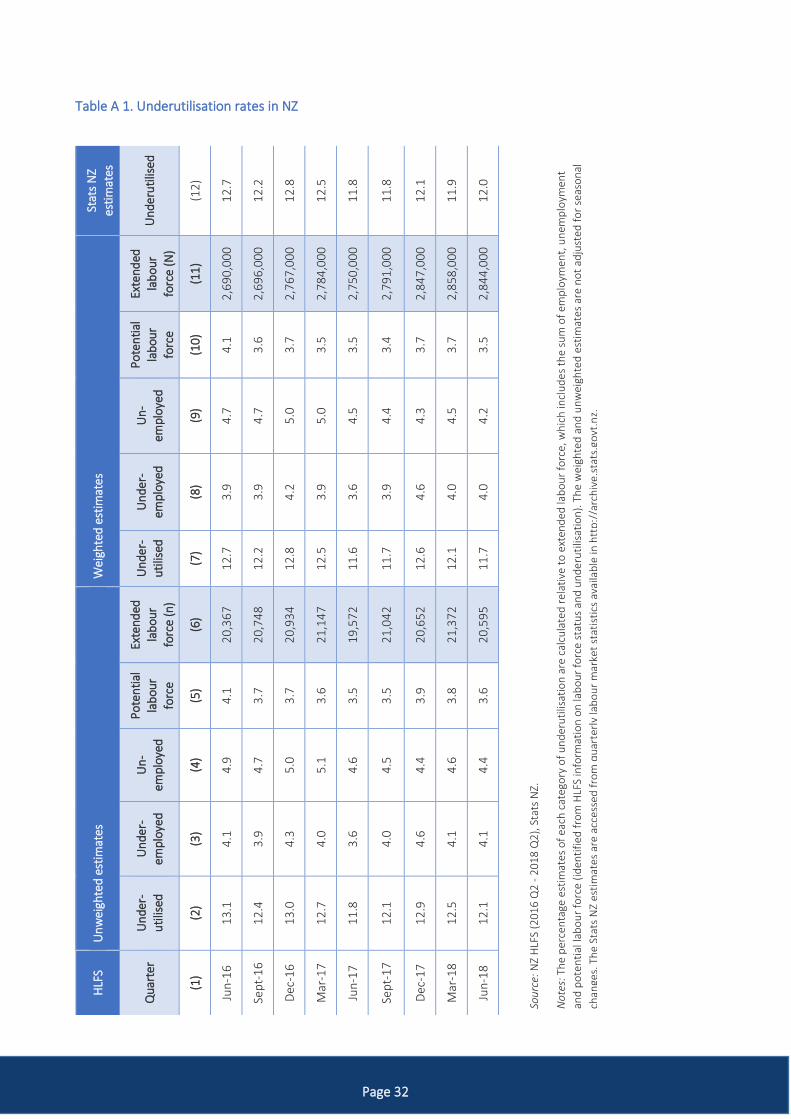
In Table A 1, we provide the specific numbers corresponding to Figure 1. The rates are presented in
percentages of “extended labour force”, which includes the sum of the potential labour force, the
employed and the unemployed population (Statistics New Zealand, 2016b). The unweighted estimates of
underutilisation and its three sub-groups (columns 2-5) are based only on the sample of surveyed
individuals, while the weighted estimates (columns 7-10) utilise the individual-level survey-based final
weight estimates that are expected to indicate the number of persons in the actual NZ population that
each surveyed individual represents per quarter (Statistics New Zealand, 2017).
Table A 1 allows us to compare the underutilisation rates based on weighted, unweighted and Stats NZ
estimates (columns 2, 7 and 12, respectively). The three estimates are largely similar to each other. In
particular, over all nine quarters, the average unweighted estimate of underutilisation rate is 12.5
percent, while the average weighted and Stats NZ estimates of the underutilisation rate are 12.2 percent.
Page 32
Table A 1. Underutilisation rates in NZ
Stat
s N
Z
esti
mat
es
Un
der
uti
lised
(12
)
12
.7
12
.2
12
.8
12
.5
11
.8
11
.8
12
.1
11
.9
12
.0
Wei
ghte
d e
stim
ates
Exte
nd
ed
lab
ou
r
forc
e (N
)
(11
)
2,6
90
,00
0
2,6
96
,00
0
2,7
67
,00
0
2,7
84
,00
0
2,7
50
,00
0
2,7
91
,00
0
2,8
47
,00
0
2,8
58
,00
0
2,8
44
,00
0
Po
ten
tial
lab
ou
r
forc
e
(10
)
4.1
3.6
3.7
3.5
3.5
3.4
3.7
3.7
3.5
Un
-
emp
loye
d
(9)
4.7
4.7
5.0
5.0
4.5
4.4
4.3
4.5
4.2
Un
der
-
emp
loye
d
(8)
3.9
3.9
4.2
3.9
3.6
3.9
4.6
4.0
4.0
Un
der
-
uti
lised
(7)
12
.7
12
.2
12
.8
12
.5
11
.6
11
.7
12
.6
12
.1
11
.7
Un
wei
ghte
d e
stim
ates
Exte
nd
ed
lab
ou
r
forc
e (n
)
(6)
20
,36
7
20
,74
8
20
,93
4
21
,14
7
19
,57
2
21
,04
2
20
,65
2
21
,37
2
20
,59
5
Po
ten
tial
lab
ou
r
forc
e
(5)
4.1
3.7
3.7
3.6
3.5
3.5
3.9
3.8
3.6
Un
-
emp
loye
d
(4)
4.9
4.7
5.0
5.1
4.6
4.5
4.4
4.6
4.4
Un
der
-
emp
loye
d
(3)
4.1
3.9
4.3
4.0
3.6
4.0
4.6
4.1
4.1
Un
der
-
uti
lised
(2)
13
.1
12
.4
13
.0
12
.7
11
.8
12
.1
12
.9
12
.5
12
.1
HLF
S
Qu
arte
r
(1)
Jun
-16
Sep
t-1
6
Dec
-16
Mar
-17
Jun
-17
Sep
t-1
7
Dec
-17
Mar
-18
Jun
-18
Sou
rce:
NZ
HLF
S (2
01
6 Q
2 -
20
18
Q2
), S
tats
NZ.
No
tes:
Th
e p
erce
nta
ge e
stim
ates
of
each
cat
ego
ry o
f u
nd
eru
tilis
atio
n a
re c
alcu
late
d r
elat
ive
to e
xten
ded
lab
ou
r fo
rce,
wh
ich
incl
ud
es
the
sum
of
emp
loym
ent,
un
emp
loym
ent
and
po
ten
tial
lab
ou
r fo
rce
(id
enti
fied
fro
m H
LFS
info
rmat
ion
on
lab
ou
r fo
rce
stat
us
and
un
de
ruti
lisat
ion
). T
he
wei
ghte
d a
nd
un
wei
ghte
d e
stim
ates
are
no
t ad
just
ed f
or
seas
on
al
chan
ges.
Th
e St
ats
NZ
esti
mat
es a
re a
cces
sed
fro
m q
uar
terl
y la
bo
ur
mar
ket
stat
isti
cs a
vaila
ble
in h
ttp
://a
rch
ive.
stat
s.go
vt.n
z.
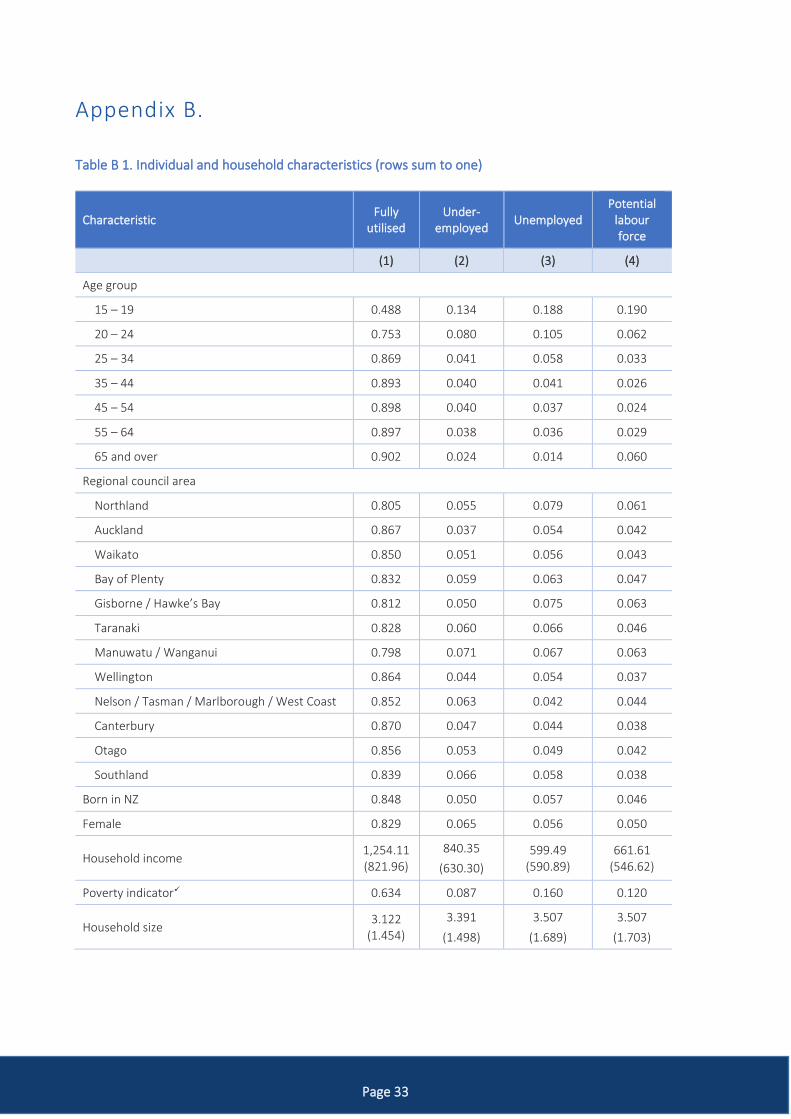
Page 33
Appendix B.
Table B 1. Individual and household characteristics (rows sum to one)
Characteristic Fully
utilised Under-
employed Unemployed
Potential labour force
(1) (2) (3) (4)
Age group
15 – 19 0.488 0.134 0.188 0.190
20 – 24 0.753 0.080 0.105 0.062
25 – 34 0.869 0.041 0.058 0.033
35 – 44 0.893 0.040 0.041 0.026
45 – 54 0.898 0.040 0.037 0.024
55 – 64 0.897 0.038 0.036 0.029
65 and over 0.902 0.024 0.014 0.060
Regional council area
Northland 0.805 0.055 0.079 0.061
Auckland 0.867 0.037 0.054 0.042
Waikato 0.850 0.051 0.056 0.043
Bay of Plenty 0.832 0.059 0.063 0.047
Gisborne / Hawke’s Bay 0.812 0.050 0.075 0.063
Taranaki 0.828 0.060 0.066 0.046
Manuwatu / Wanganui 0.798 0.071 0.067 0.063
Wellington 0.864 0.044 0.054 0.037
Nelson / Tasman / Marlborough / West Coast 0.852 0.063 0.042 0.044
Canterbury 0.870 0.047 0.044 0.038
Otago 0.856 0.053 0.049 0.042
Southland 0.839 0.066 0.058 0.038
Born in NZ 0.848 0.050 0.057 0.046
Female 0.829 0.065 0.056 0.050
Household income 1,254.11 (821.96)
840.35
(630.30)
599.49 (590.89)
661.61 (546.62)
Poverty indicator✓ 0.634 0.087 0.160 0.120
Household size 3.122
(1.454)
3.391
(1.498)
3.507
(1.689)
3.507
(1.703)
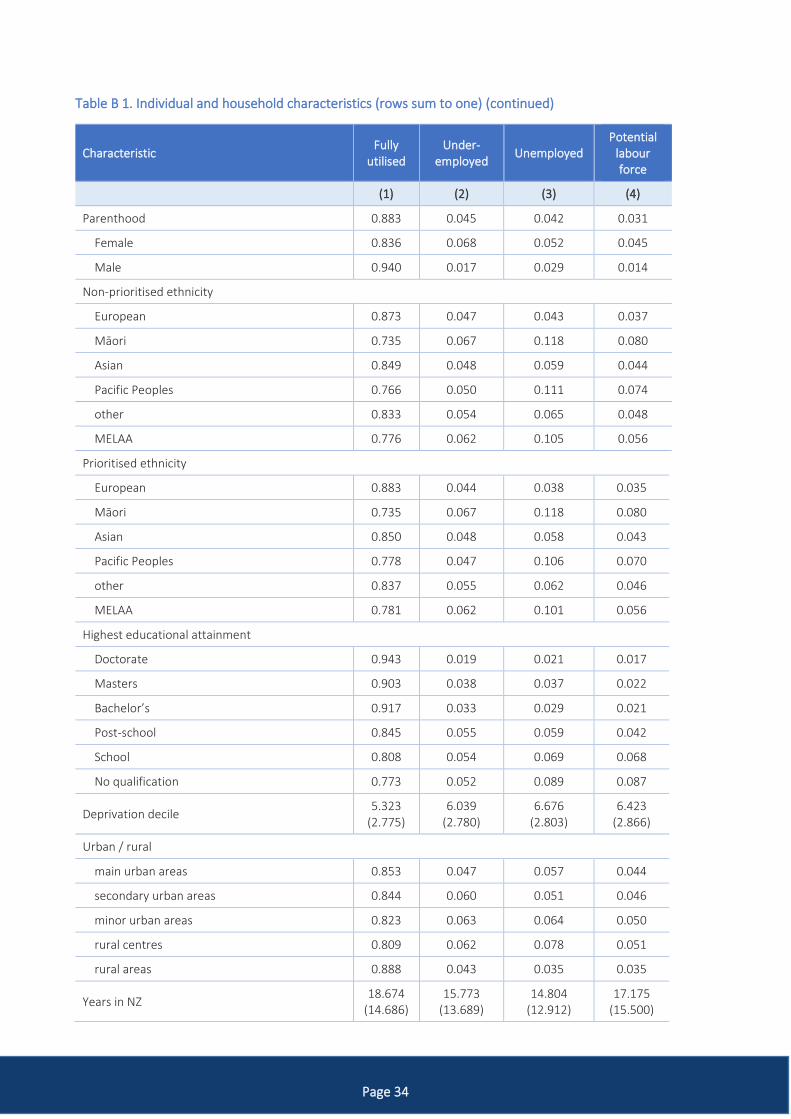
Page 34
Table B 1. Individual and household characteristics (rows sum to one) (continued)
Characteristic Fully
utilised Under-
employed Unemployed
Potential labour force
(1) (2) (3) (4)
Parenthood 0.883 0.045 0.042 0.031
Female 0.836 0.068 0.052 0.045
Male 0.940 0.017 0.029 0.014
Non-prioritised ethnicity
European 0.873 0.047 0.043 0.037
Māori 0.735 0.067 0.118 0.080
Asian 0.849 0.048 0.059 0.044
Pacific Peoples 0.766 0.050 0.111 0.074
other 0.833 0.054 0.065 0.048
MELAA 0.776 0.062 0.105 0.056
Prioritised ethnicity
European 0.883 0.044 0.038 0.035
Māori 0.735 0.067 0.118 0.080
Asian 0.850 0.048 0.058 0.043
Pacific Peoples 0.778 0.047 0.106 0.070
other 0.837 0.055 0.062 0.046
MELAA 0.781 0.062 0.101 0.056
Highest educational attainment
Doctorate 0.943 0.019 0.021 0.017
Masters 0.903 0.038 0.037 0.022
Bachelor’s 0.917 0.033 0.029 0.021
Post-school 0.845 0.055 0.059 0.042
School 0.808 0.054 0.069 0.068
No qualification 0.773 0.052 0.089 0.087
Deprivation decile 5.323
(2.775) 6.039
(2.780) 6.676
(2.803) 6.423
(2.866)
Urban / rural
main urban areas 0.853 0.047 0.057 0.044
secondary urban areas 0.844 0.060 0.051 0.046
minor urban areas 0.823 0.063 0.064 0.050
rural centres 0.809 0.062 0.078 0.051
rural areas 0.888 0.043 0.035 0.035
Years in NZ 18.674
(14.686) 15.773
(13.689) 14.804
(12.912) 17.175
(15.500)
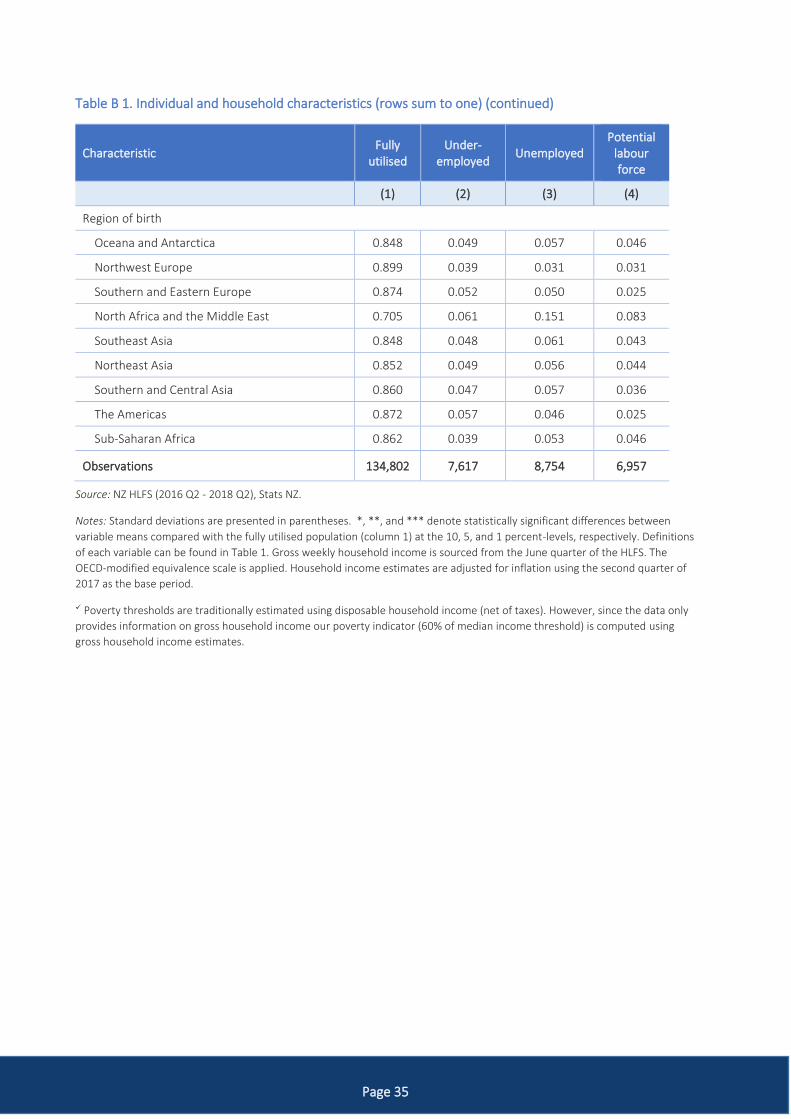
Page 35
Table B 1. Individual and household characteristics (rows sum to one) (continued)
Characteristic Fully
utilised Under-
employed Unemployed
Potential labour force
(1) (2) (3) (4)
Region of birth
Oceana and Antarctica 0.848 0.049 0.057 0.046
Northwest Europe 0.899 0.039 0.031 0.031
Southern and Eastern Europe 0.874 0.052 0.050 0.025
North Africa and the Middle East 0.705 0.061 0.151 0.083
Southeast Asia 0.848 0.048 0.061 0.043
Northeast Asia 0.852 0.049 0.056 0.044
Southern and Central Asia 0.860 0.047 0.057 0.036
The Americas 0.872 0.057 0.046 0.025
Sub-Saharan Africa 0.862 0.039 0.053 0.046
Observations 134,802 7,617 8,754 6,957
Source: NZ HLFS (2016 Q2 - 2018 Q2), Stats NZ.
Notes: Standard deviations are presented in parentheses. *, **, and *** denote statistically significant differences between
variable means compared with the fully utilised population (column 1) at the 10, 5, and 1 percent-levels, respectively. Definitions
of each variable can be found in Table 1. Gross weekly household income is sourced from the June quarter of the HLFS. The
OECD-modified equivalence scale is applied. Household income estimates are adjusted for inflation using the second quarter of
2017 as the base period.
✓ Poverty thresholds are traditionally estimated using disposable household income (net of taxes). However, since the data only
provides information on gross household income our poverty indicator (60% of median income threshold) is computed using
gross household income estimates.
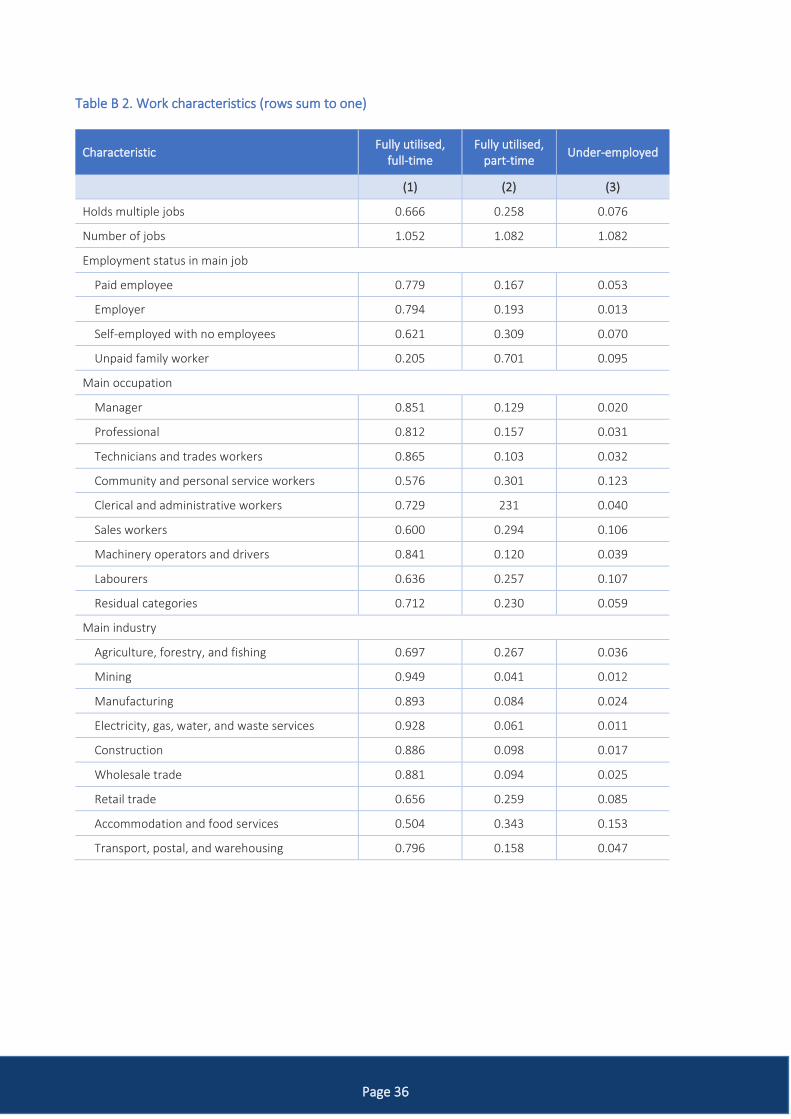
Page 36
Table B 2. Work characteristics (rows sum to one)
Characteristic Fully utilised,
full-time Fully utilised,
part-time Under-employed
(1) (2) (3)
Holds multiple jobs 0.666 0.258 0.076
Number of jobs 1.052 1.082 1.082
Employment status in main job
Paid employee 0.779 0.167 0.053
Employer 0.794 0.193 0.013
Self-employed with no employees 0.621 0.309 0.070
Unpaid family worker 0.205 0.701 0.095
Main occupation
Manager 0.851 0.129 0.020
Professional 0.812 0.157 0.031
Technicians and trades workers 0.865 0.103 0.032
Community and personal service workers 0.576 0.301 0.123
Clerical and administrative workers 0.729 231 0.040
Sales workers 0.600 0.294 0.106
Machinery operators and drivers 0.841 0.120 0.039
Labourers 0.636 0.257 0.107
Residual categories 0.712 0.230 0.059
Main industry
Agriculture, forestry, and fishing 0.697 0.267 0.036
Mining 0.949 0.041 0.012
Manufacturing 0.893 0.084 0.024
Electricity, gas, water, and waste services 0.928 0.061 0.011
Construction 0.886 0.098 0.017
Wholesale trade 0.881 0.094 0.025
Retail trade 0.656 0.259 0.085
Accommodation and food services 0.504 0.343 0.153
Transport, postal, and warehousing 0.796 0.158 0.047
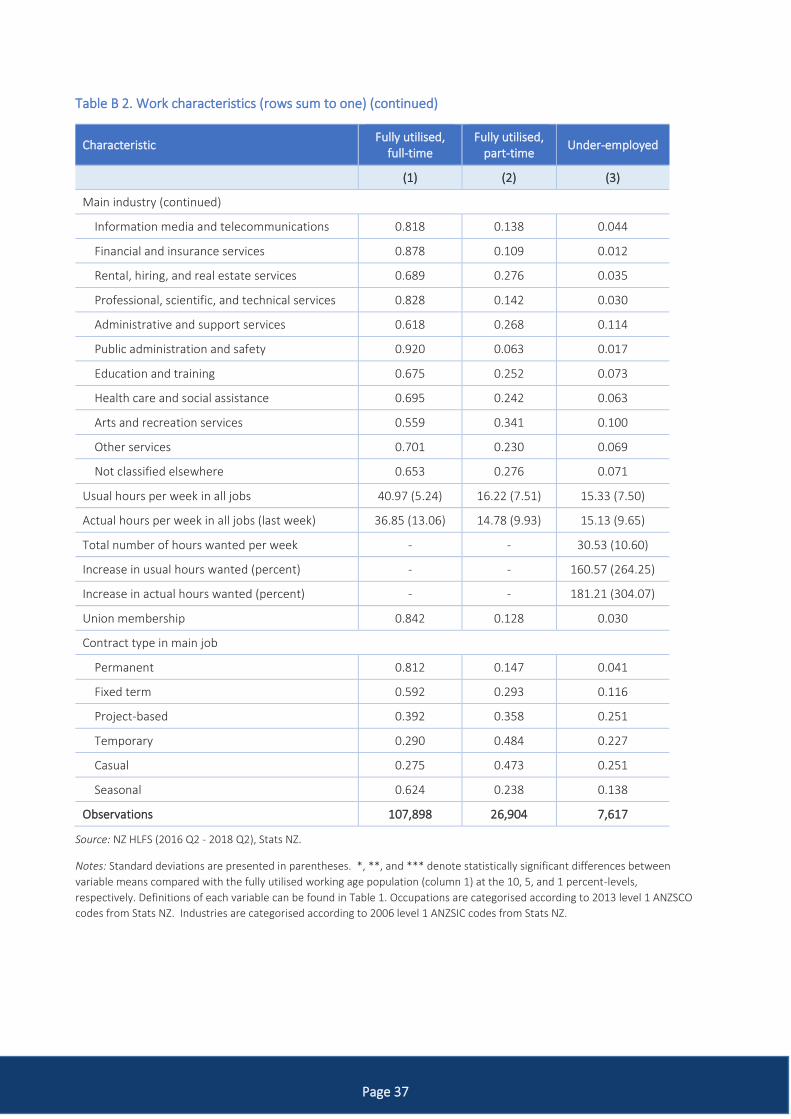
Page 37
Table B 2. Work characteristics (rows sum to one) (continued)
Characteristic Fully utilised,
full-time Fully utilised,
part-time Under-employed
(1) (2) (3)
Main industry (continued)
Information media and telecommunications 0.818 0.138 0.044
Financial and insurance services 0.878 0.109 0.012
Rental, hiring, and real estate services 0.689 0.276 0.035
Professional, scientific, and technical services 0.828 0.142 0.030
Administrative and support services 0.618 0.268 0.114
Public administration and safety 0.920 0.063 0.017
Education and training 0.675 0.252 0.073
Health care and social assistance 0.695 0.242 0.063
Arts and recreation services 0.559 0.341 0.100
Other services 0.701 0.230 0.069
Not classified elsewhere 0.653 0.276 0.071
Usual hours per week in all jobs 40.97 (5.24) 16.22 (7.51) 15.33 (7.50)
Actual hours per week in all jobs (last week) 36.85 (13.06) 14.78 (9.93) 15.13 (9.65)
Total number of hours wanted per week - - 30.53 (10.60)
Increase in usual hours wanted (percent) - - 160.57 (264.25)
Increase in actual hours wanted (percent) - - 181.21 (304.07)
Union membership 0.842 0.128 0.030
Contract type in main job
Permanent 0.812 0.147 0.041
Fixed term 0.592 0.293 0.116
Project-based 0.392 0.358 0.251
Temporary 0.290 0.484 0.227
Casual 0.275 0.473 0.251
Seasonal 0.624 0.238 0.138
Observations 107,898 26,904 7,617
Source: NZ HLFS (2016 Q2 - 2018 Q2), Stats NZ.
Notes: Standard deviations are presented in parentheses. *, **, and *** denote statistically significant differences between
variable means compared with the fully utilised working age population (column 1) at the 10, 5, and 1 percent-levels,
respectively. Definitions of each variable can be found in Table 1. Occupations are categorised according to 2013 level 1 ANZSCO
codes from Stats NZ. Industries are categorised according to 2006 level 1 ANZSIC codes from Stats NZ.
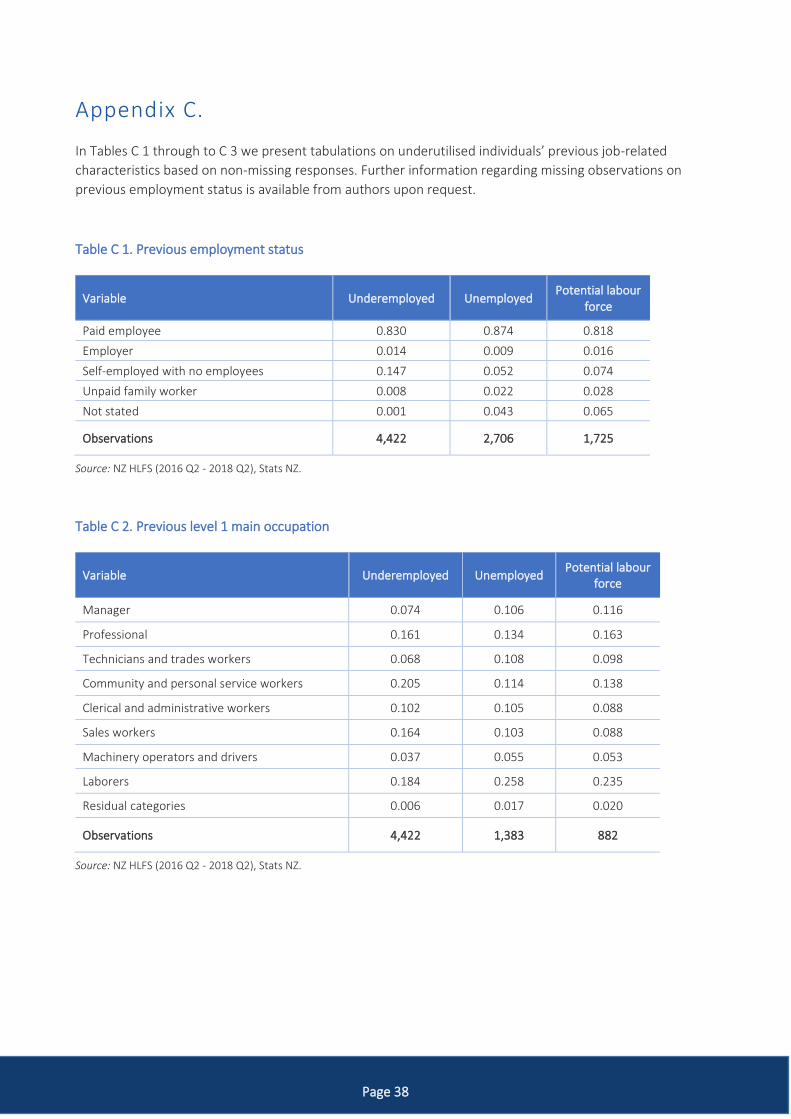
Page 38
Appendix C.
In Tables C 1 through to C 3 we present tabulations on underutilised individuals’ previous job-related
characteristics based on non-missing responses. Further information regarding missing observations on
previous employment status is available from authors upon request.
Table C 1. Previous employment status
Variable Underemployed Unemployed Potential labour
force
Paid employee 0.830 0.874 0.818
Employer 0.014 0.009 0.016
Self-employed with no employees 0.147 0.052 0.074
Unpaid family worker 0.008 0.022 0.028
Not stated 0.001 0.043 0.065
Observations 4,422 2,706 1,725
Source: NZ HLFS (2016 Q2 - 2018 Q2), Stats NZ.
Table C 2. Previous level 1 main occupation
Variable Underemployed Unemployed Potential labour
force
Manager 0.074 0.106 0.116
Professional 0.161 0.134 0.163
Technicians and trades workers 0.068 0.108 0.098
Community and personal service workers 0.205 0.114 0.138
Clerical and administrative workers 0.102 0.105 0.088
Sales workers 0.164 0.103 0.088
Machinery operators and drivers 0.037 0.055 0.053
Laborers 0.184 0.258 0.235
Residual categories 0.006 0.017 0.020
Observations 4,422 1,383 882
Source: NZ HLFS (2016 Q2 - 2018 Q2), Stats NZ.
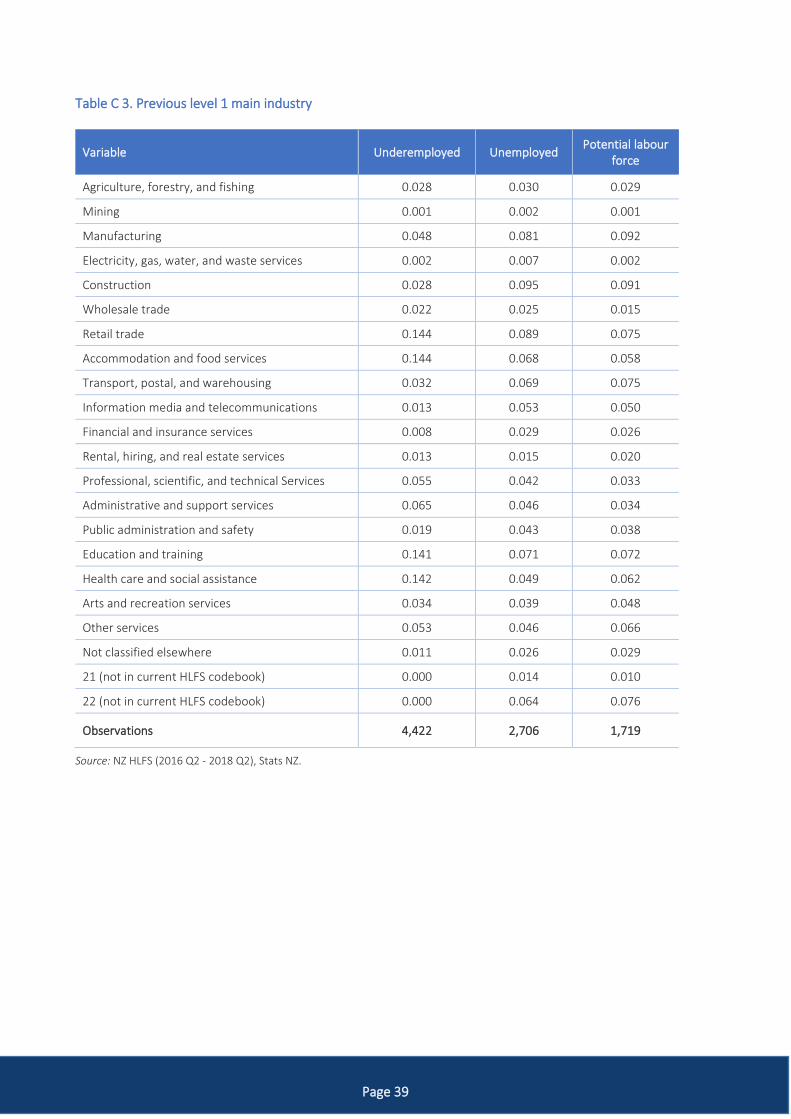
Page 39
Table C 3. Previous level 1 main industry
Variable Underemployed Unemployed Potential labour
force
Agriculture, forestry, and fishing 0.028 0.030 0.029
Mining 0.001 0.002 0.001
Manufacturing 0.048 0.081 0.092
Electricity, gas, water, and waste services 0.002 0.007 0.002
Construction 0.028 0.095 0.091
Wholesale trade 0.022 0.025 0.015
Retail trade 0.144 0.089 0.075
Accommodation and food services 0.144 0.068 0.058
Transport, postal, and warehousing 0.032 0.069 0.075
Information media and telecommunications 0.013 0.053 0.050
Financial and insurance services 0.008 0.029 0.026
Rental, hiring, and real estate services 0.013 0.015 0.020
Professional, scientific, and technical Services 0.055 0.042 0.033
Administrative and support services 0.065 0.046 0.034
Public administration and safety 0.019 0.043 0.038
Education and training 0.141 0.071 0.072
Health care and social assistance 0.142 0.049 0.062
Arts and recreation services 0.034 0.039 0.048
Other services 0.053 0.046 0.066
Not classified elsewhere 0.011 0.026 0.029
21 (not in current HLFS codebook) 0.000 0.014 0.010
22 (not in current HLFS codebook) 0.000 0.064 0.076
Observations 4,422 2,706 1,719
Source: NZ HLFS (2016 Q2 - 2018 Q2), Stats NZ.

w o r k . r e s e a r c h @ a u t . a c . n z
@NZWorkResearch NZ Work Research Institute
w w w . w o r k r e s e a r c h . a u t . a c . n z