Water Based Intumescent Steel Coating - Fireproofing Steel Canada | Fireproofing Spray
Characterisation of intumescent coating
performance for performance-based design
Yong Zhang
Prof. Yong.C. Wang
20-04-10
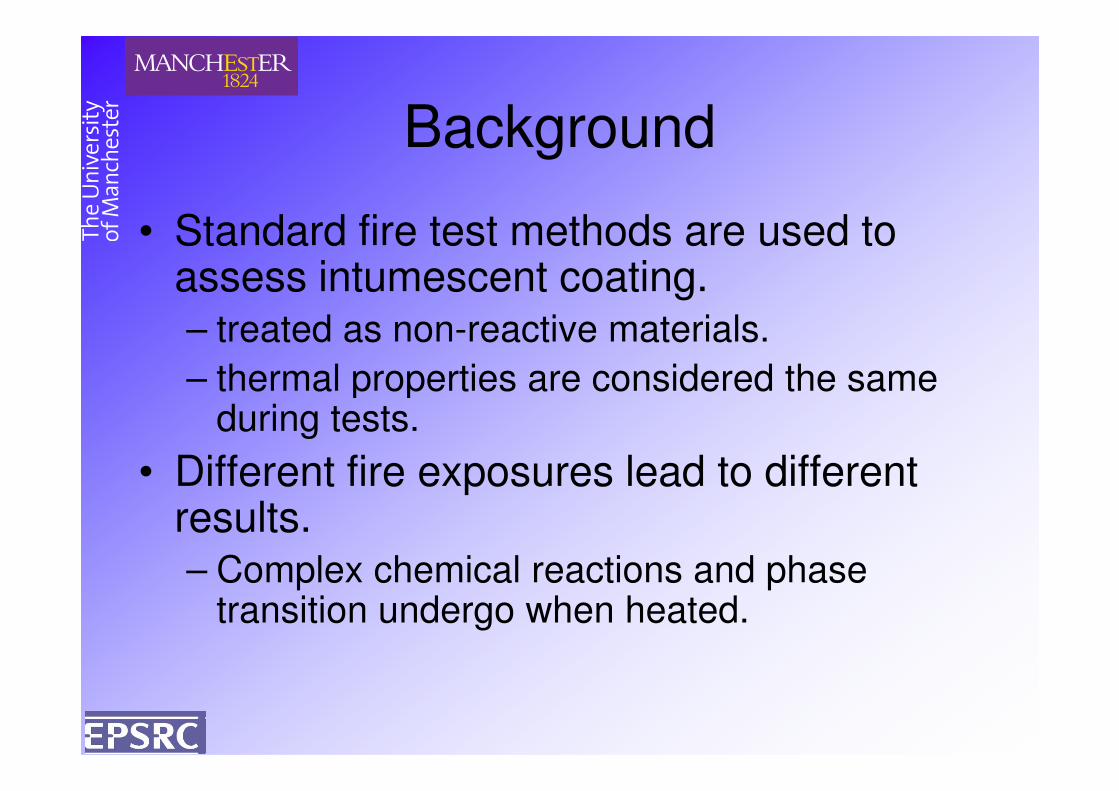
Background
• Standard fire test methods are used to assess intumescent coating.– treated as non-reactive materials.
– thermal properties are considered the same – thermal properties are considered the same during tests.
• Different fire exposures lead to different results.– Complex chemical reactions and phase
transition undergo when heated.
Background
• There is a strong demand for new, performance based assessing method.
– A model to predict the performance of
intumescent coatings under different fire intumescent coatings under different fire
scenarios.
• Steel temperature-time relationship
• Effective thermal conductivity.
– New, practical test methods.
Modelling
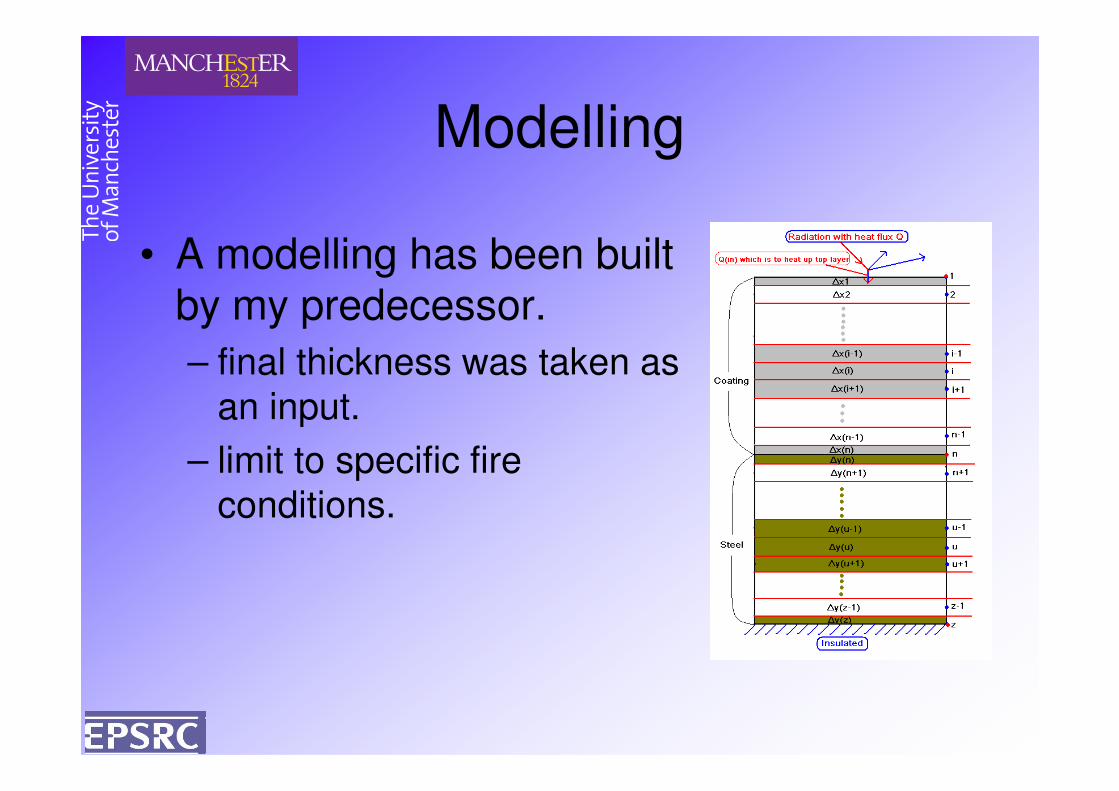
• A modelling has been built by my predecessor.
– final thickness was taken as
an input. an input.
– limit to specific fire
conditions.
Key Parameters
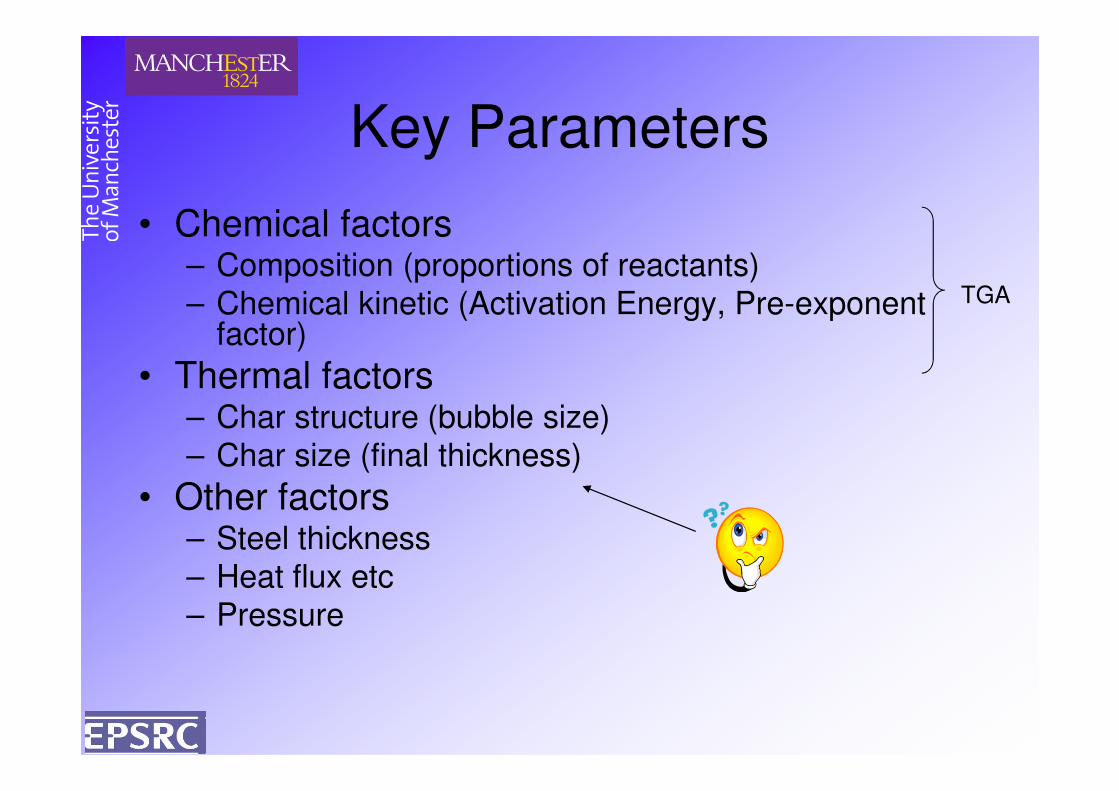
• Chemical factors– Composition (proportions of reactants)
– Chemical kinetic (Activation Energy, Pre-exponent factor)
• Thermal factors
TGA
• Thermal factors– Char structure (bubble size)
– Char size (final thickness)
• Other factors– Steel thickness
– Heat flux etc
– Pressure
Modelling
0.1
1
1.5
2
2.5
3
3.5
4
4.5
5
Ap
pare
nt
therm
al co
nd
ucti
vit
y (
W/m
.K)
Td
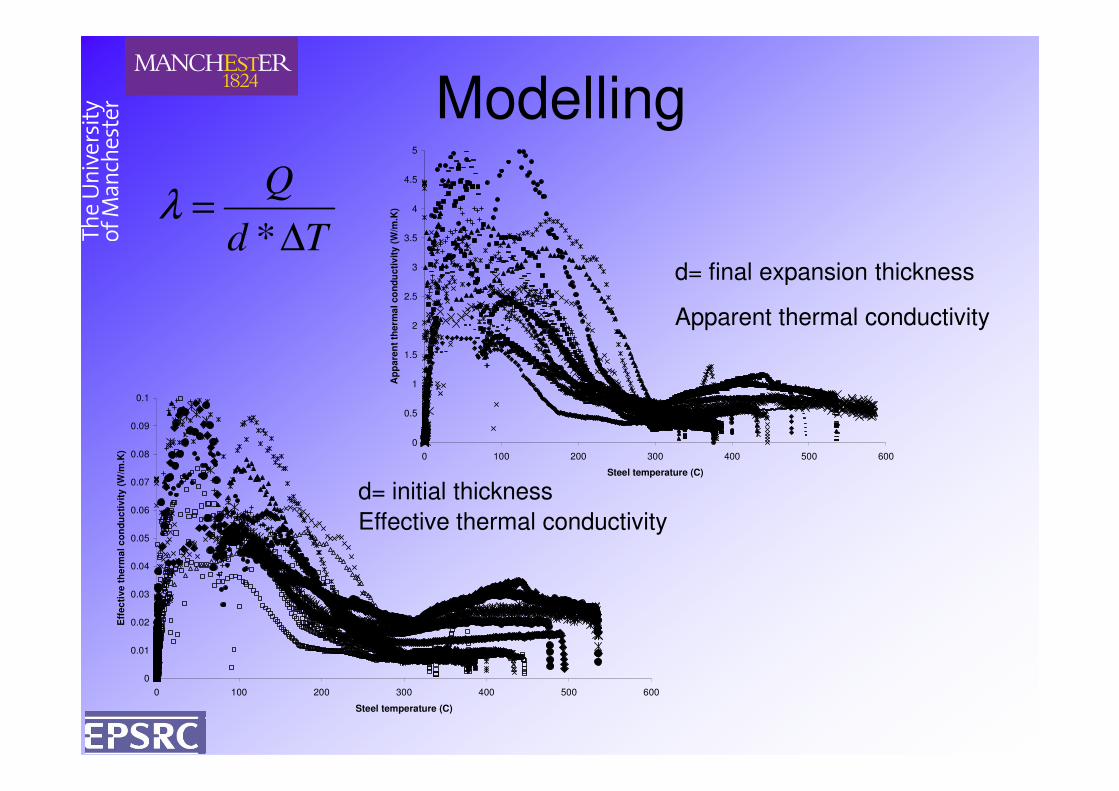
Q
∆=
*λ
d= final expansion thickness
Apparent thermal conductivity
0
0.01
0.02
0.03
0.04
0.05
0.06
0.07
0.08
0.09
0.1
0 100 200 300 400 500 600
Steel temperature (C)
Eff
ec
tive
th
erm
al c
on
du
cti
vit
y (
W/m
.K)
0
0.5
0 100 200 300 400 500 600
Steel temperature (C)
d= initial thickness
Effective thermal conductivity
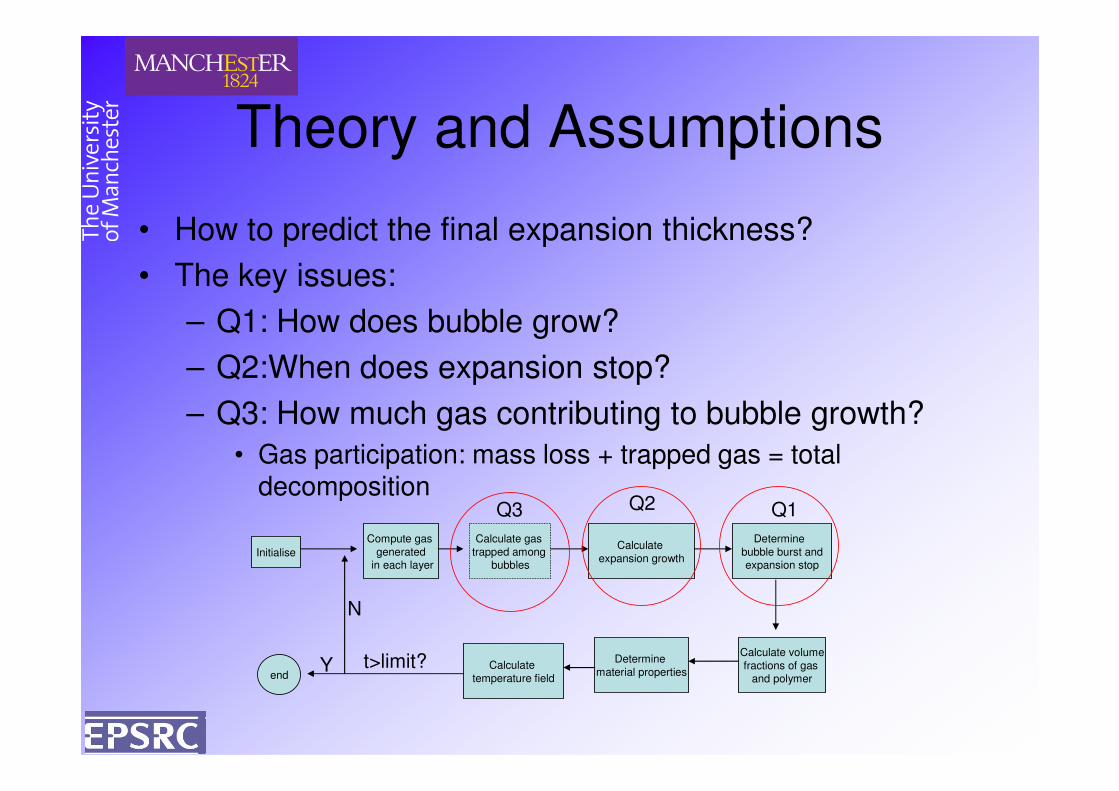
Theory and Assumptions
• How to predict the final expansion thickness?
• The key issues:
– Q1: How does bubble grow?
– Q2:When does expansion stop?
– Q3: How much gas contributing to bubble growth?– Q3: How much gas contributing to bubble growth?
• Gas participation: mass loss + trapped gas = total decomposition
Initialise
Compute gas
generatedin each layer
Calculate gas
trapped among bubbles
Calculate
expansion growth
Determine
bubble burst andexpansion stop
Calculate volume
fractions of gas and polymer
Determine
material propertiesCalculate
temperature fieldendt>limit?Y
N
Q1Q2Q3
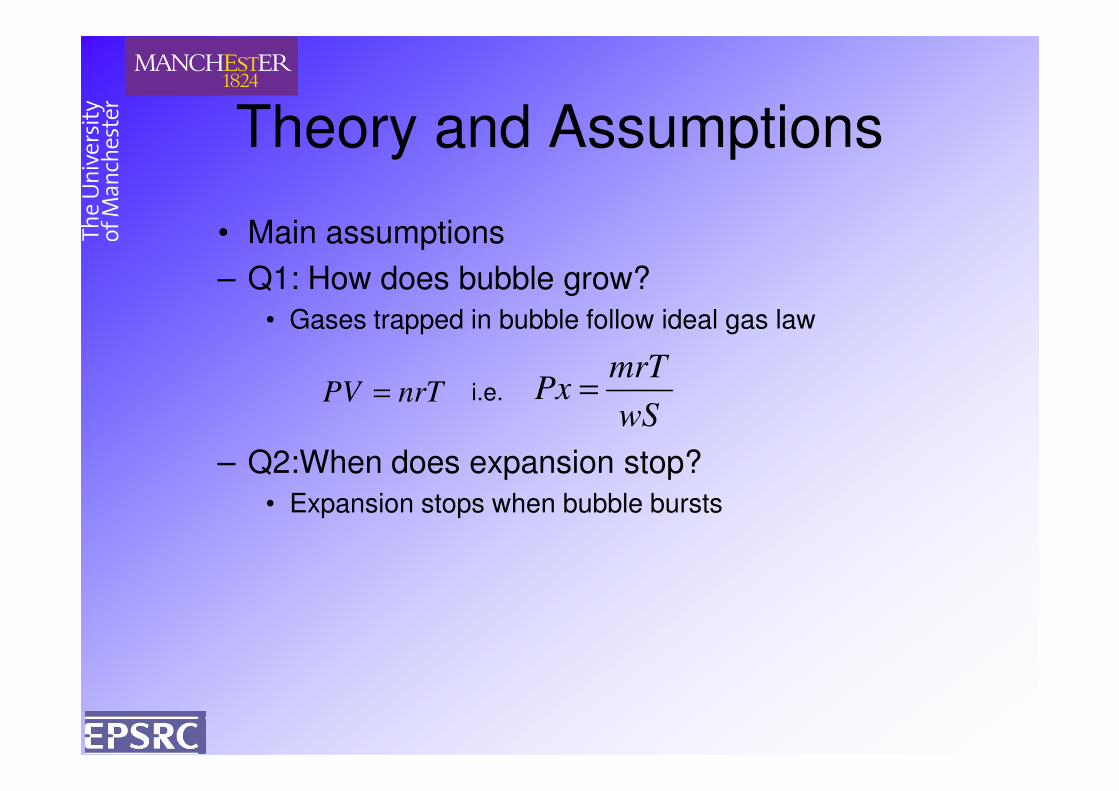
Theory and Assumptions
• Main assumptions
– Q1: How does bubble grow?
• Gases trapped in bubble follow ideal gas law
nrTPV =wS
mrTPx =i.e.
– Q2:When does expansion stop?
• Expansion stops when bubble bursts
nrTPV =wS
Px =i.e.
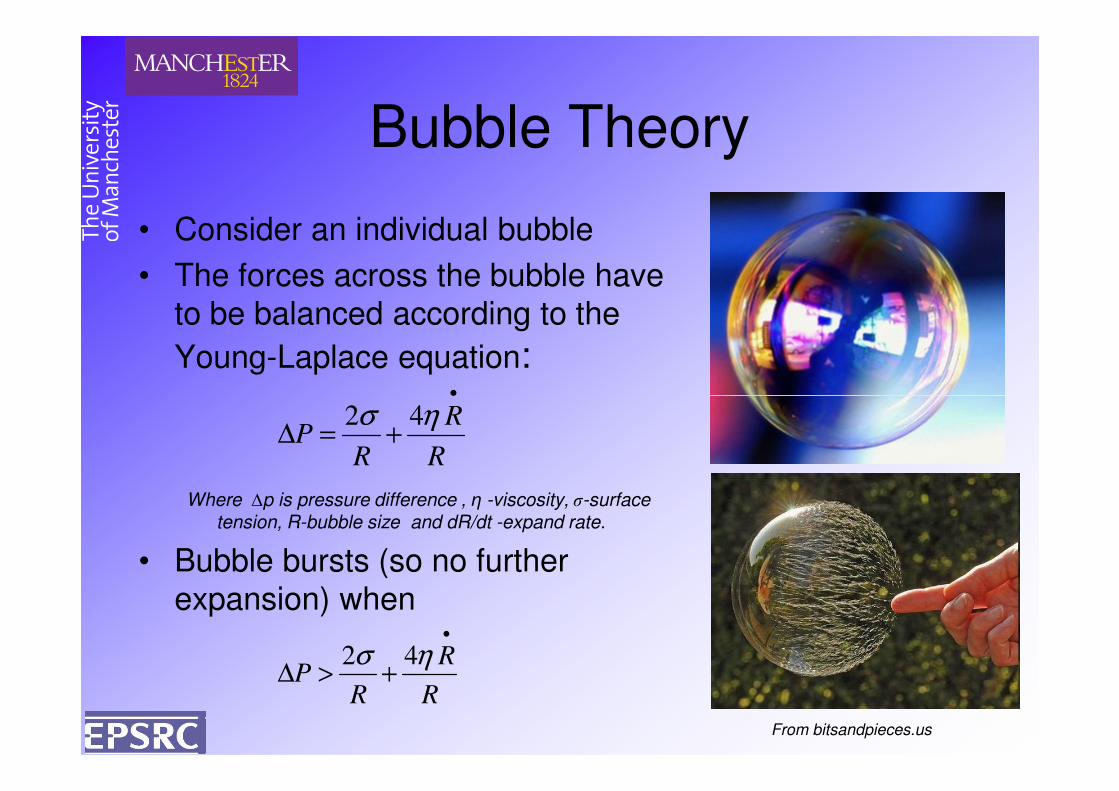
Bubble Theory
• Consider an individual bubble
• The forces across the bubble have
to be balanced according to the
Young-Laplace equation:•
Where ∆p is pressure difference , η -viscosity, σ-surface tension, R-bubble size and dR/dt -expand rate.
• Bubble bursts (so no further
expansion) when
R
R
RP
•
+=∆ησ 42
R
R
RP
•
+>∆ησ 42
From bitsandpieces.us
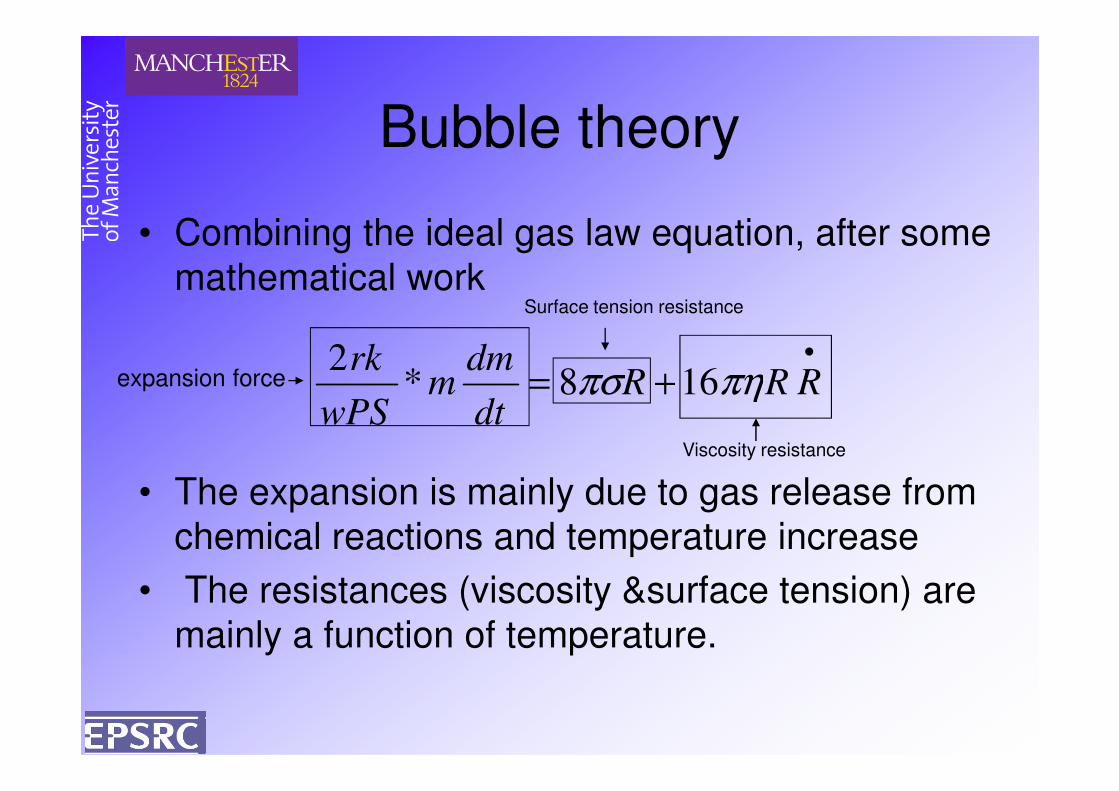
Bubble theory
• Combining the ideal gas law equation, after some
mathematical work
•
+= RRRdt
dmm
wPS
rkπηπσ 168*
2expansion force
Surface tension resistance
• The expansion is mainly due to gas release from
chemical reactions and temperature increase
• The resistances (viscosity &surface tension) are
mainly a function of temperature.
+= RRRdt
mwPS
πηπσ 168*
Viscosity resistance
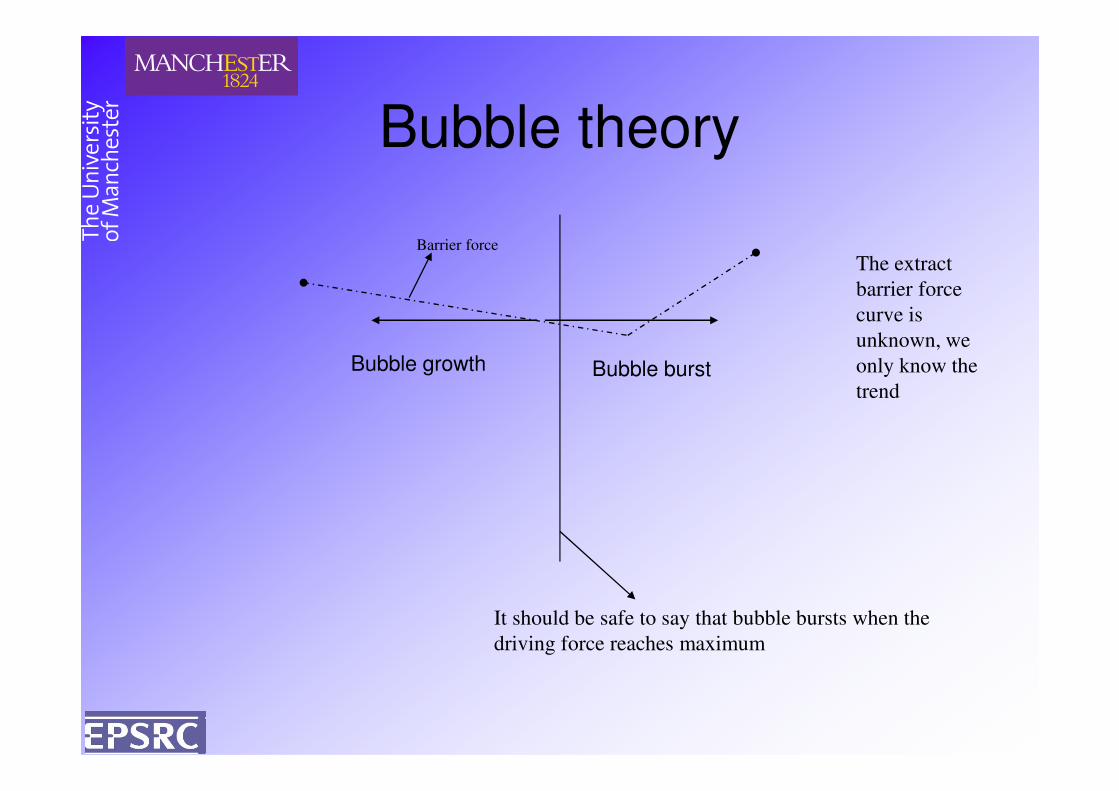
Bubble theory
Barrier force
The extract
barrier force
curve is
unknown, we
only know the
trend
Bubble growth Bubble burst
It should be safe to say that bubble bursts when the
driving force reaches maximum
trend
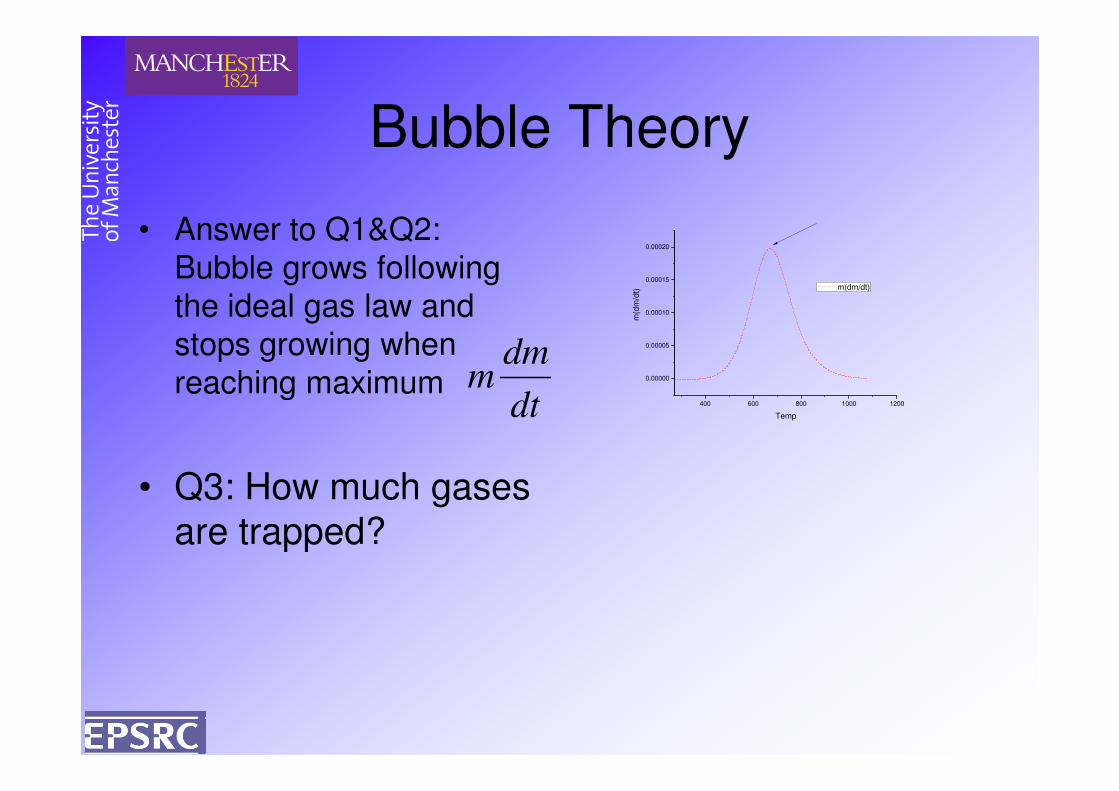
Bubble Theory
• Answer to Q1&Q2:
Bubble grows following
the ideal gas law and
stops growing when
reaching maximum 0.00000
0.00005
0.00010
0.00015
0.00020
m(d
m/d
t) m(dm/dt)
dt
dmmreaching maximum
• Q3: How much gases
are trapped?
400 600 800 1000 1200
Tempdtm
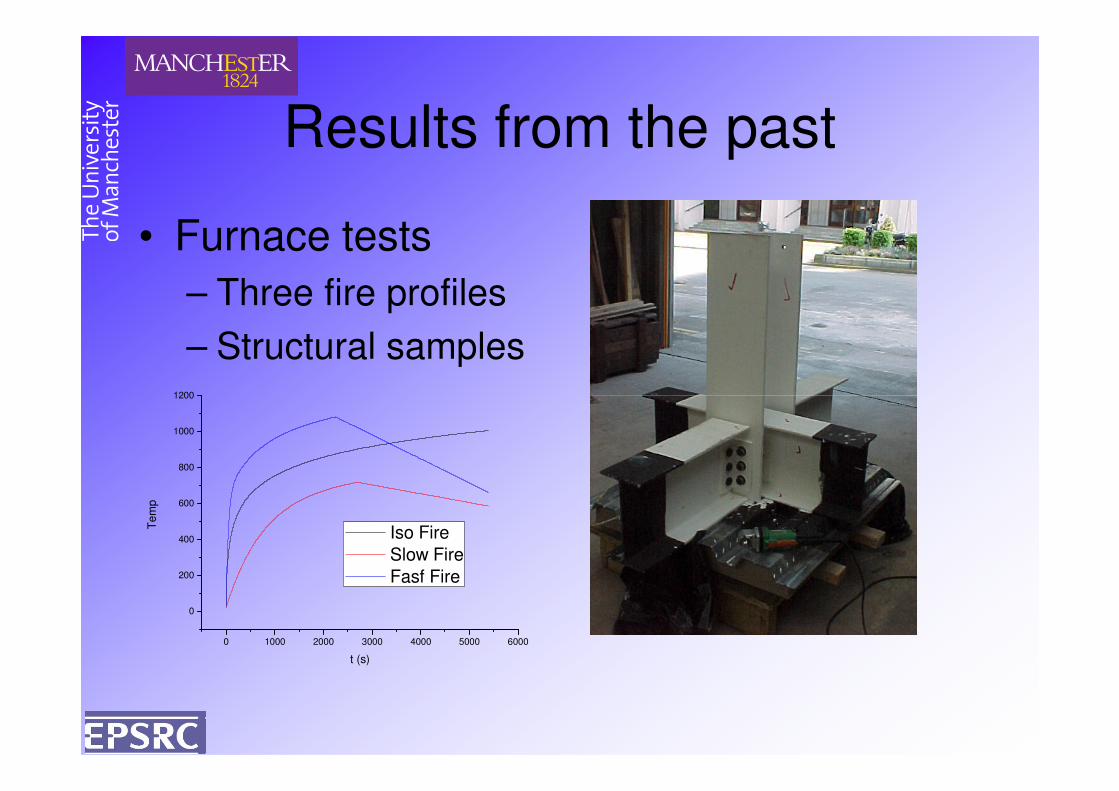
Results from the past
• Furnace tests
– Three fire profiles
– Structural samples1200
0 1000 2000 3000 4000 5000 6000
0
200
400
600
800
1000
1200
Tem
p
t (s)
Iso Fire
Slow Fire
Fasf Fire
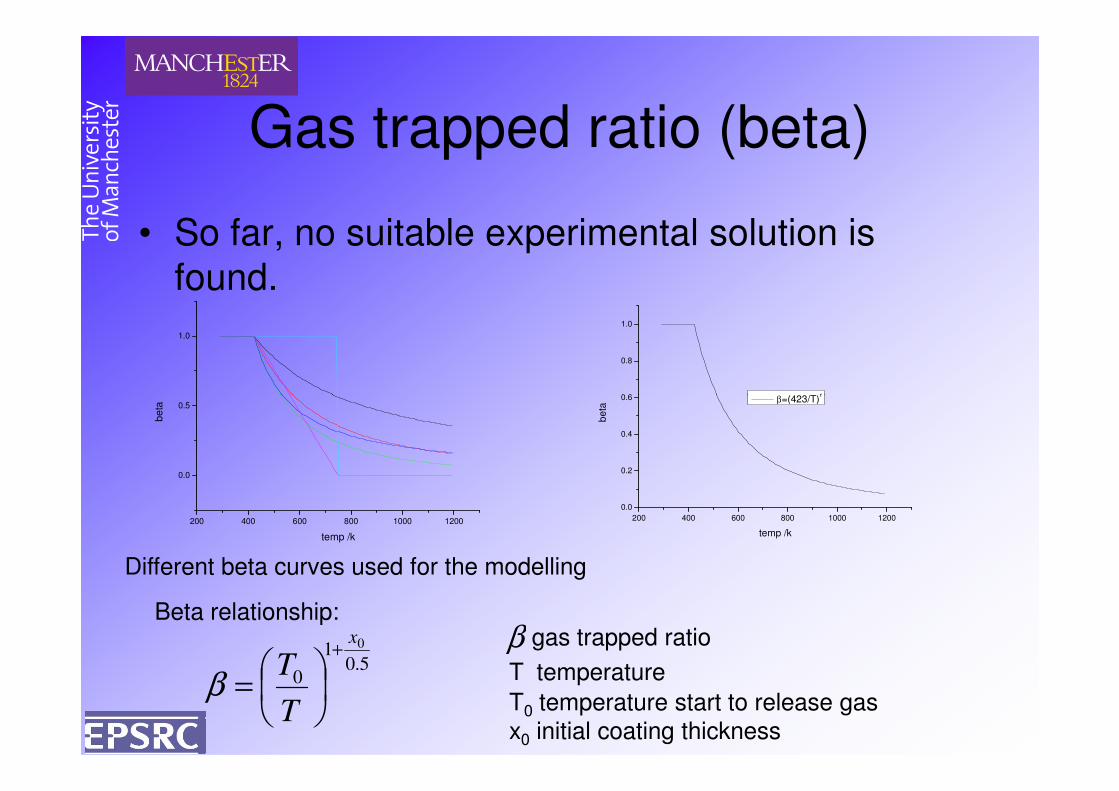
Gas trapped ratio (beta)
• So far, no suitable experimental solution is
found.
1.0
0.6
0.8
1.0
β=(423/T)n
200 400 600 800 1000 1200
0.0
0.5
be
ta
temp /k
β
200 400 600 800 1000 1200
0.0
0.2
0.4
0.6
be
ta
temp /k
β=(423/T)n
Beta relationship:gas trapped ratio
T temperature5.01
0
0x
T
T+
=β
T0 temperature start to release gas
x0 initial coating thickness
Different beta curves used for the modelling
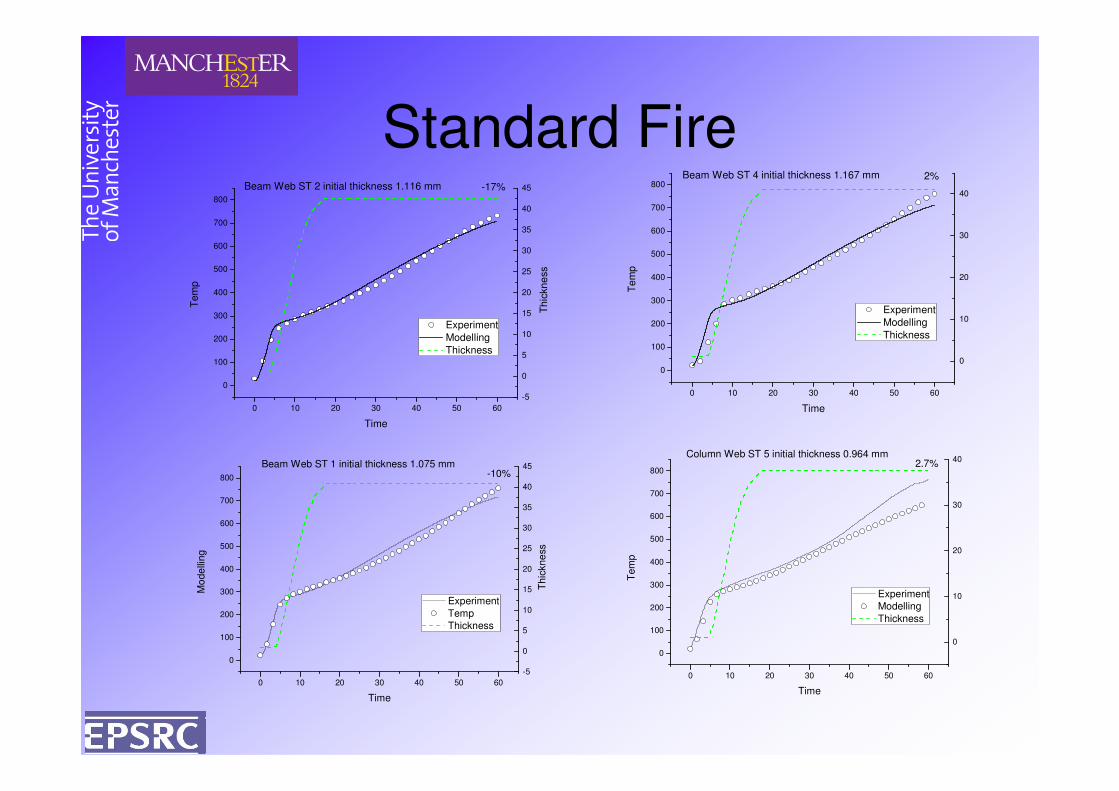
Standard Fire
0
100
200
300
400
500
600
700
800
Th
ickn
ess
Te
mp
Experiment
Modelling
Thickness
Beam Web ST 2 initial thickness 1.116 mm
-5
0
5
10
15
20
25
30
35
40
45-17%
0 10 20 30 40 50 60
0
100
200
300
400
500
600
700
800
Te
mp
Experiment
Modelling
Thickness
Beam Web ST 4 initial thickness 1.167 mm
0
10
20
30
40
2%
0 10 20 30 40 50 60
Time
-5 0 10 20 30 40 50 60
Time
0 10 20 30 40 50 60
0
100
200
300
400
500
600
700
800
Thic
kne
ss
Mo
de
lling
Time
Experiment
Temp
Thickness
Beam Web ST 1 initial thickness 1.075 mm-10%
-5
0
5
10
15
20
25
30
35
40
45
0 10 20 30 40 50 60
0
100
200
300
400
500
600
700
800
Tem
p
Time
Experiment
Modelling
Thickness
Column Web ST 5 initial thickness 0.964 mm
0
10
20
30
402.7%
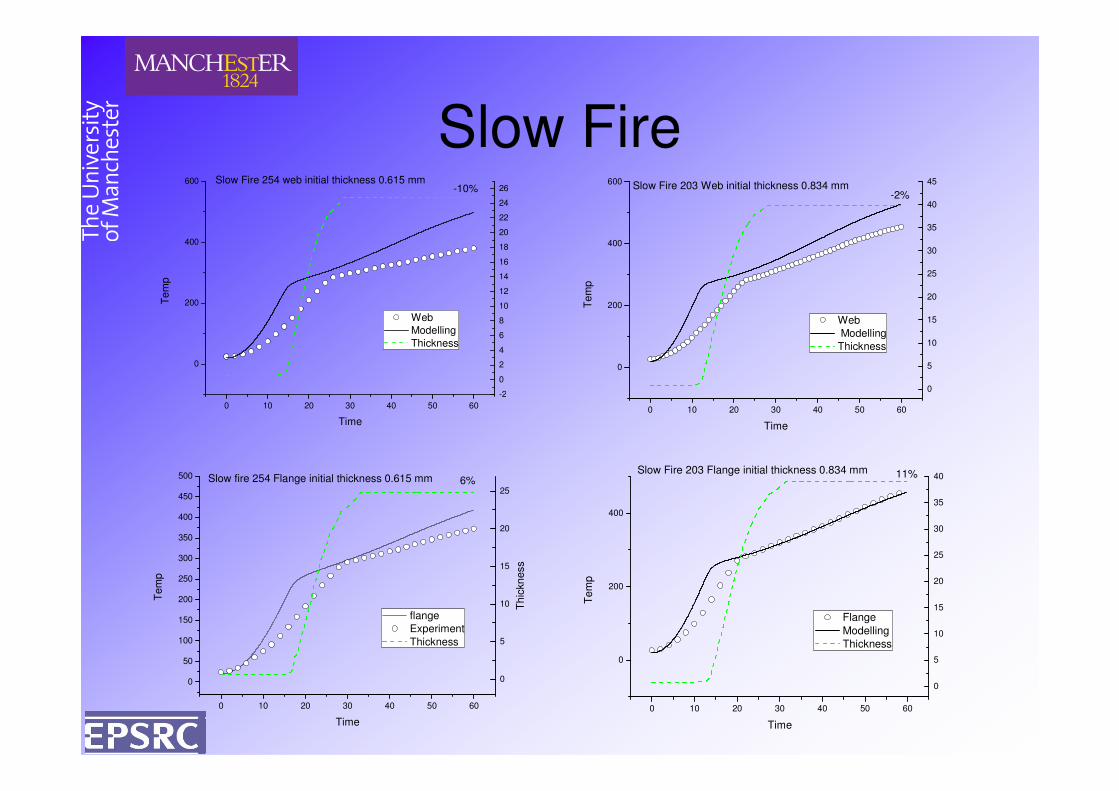
Slow Fire
0
200
400
600
Te
mp
Web
Modelling
Thickness
Slow Fire 254 web initial thickness 0.615 mm-10%
-2
0
2
4
6
8
10
12
14
16
18
20
22
24
26
0
200
400
600
Te
mp
Web
Modelling
Thickness
Slow Fire 203 Web initial thickness 0.834 mm
0
5
10
15
20
25
30
35
40
45
-2%
0 10 20 30 40 50 60
Time
-2
0 10 20 30 40 50 60
0
200
400
Te
mp
Time
Flange
Modelling
Thickness
Slow Fire 203 Flange initial thickness 0.834 mm 11%
0
5
10
15
20
25
30
35
40
0 10 20 30 40 50 60
0
50
100
150
200
250
300
350
400
450
500
Th
ickn
ess
Tem
p
Time
flange
Experiment
Thickness
Slow fire 254 Flange initial thickness 0.615 mm
0
5
10
15
20
256%
0 10 20 30 40 50 60
Time
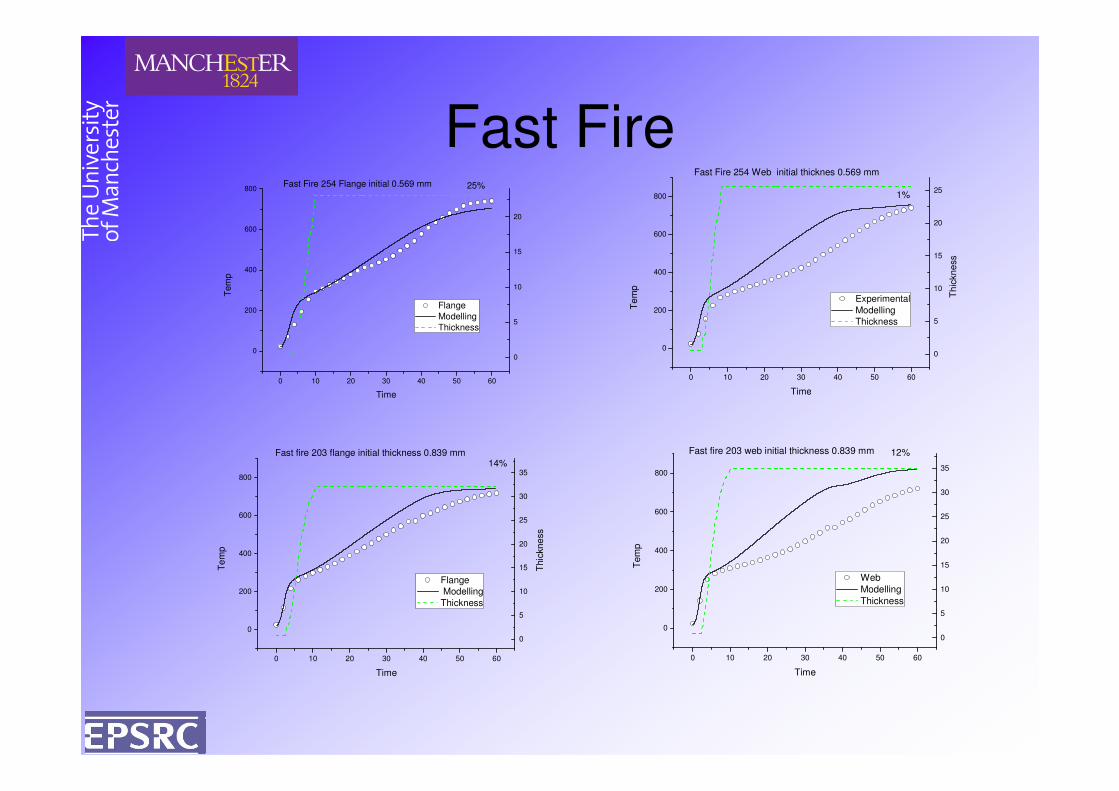
Fast Fire
0 10 20 30 40 50 60
0
200
400
600
800
Th
ickn
ess
Te
mp
Time
Experimental
Modelling
Thickness
Fast Fire 254 Web initial thicknes 0.569 mm
1%
0
5
10
15
20
25
0 10 20 30 40 50 60
0
200
400
600
800
Tem
p
Time
Flange
Modelling
Thickness
Fast Fire 254 Flange initial 0.569 mm 25%
0
5
10
15
20
TimeTime
0 10 20 30 40 50 60
0
200
400
600
800
Thic
kn
ess
Te
mp
Time
Flange
Modelling
Thickness
Fast fire 203 flange initial thickness 0.839 mm14%
0
5
10
15
20
25
30
35
0 10 20 30 40 50 60
0
200
400
600
800
Tem
p
Time
Web
Modelling
Thickness
Fast fire 203 web initial thickness 0.839 mm
0
5
10
15
20
25
30
35
12%
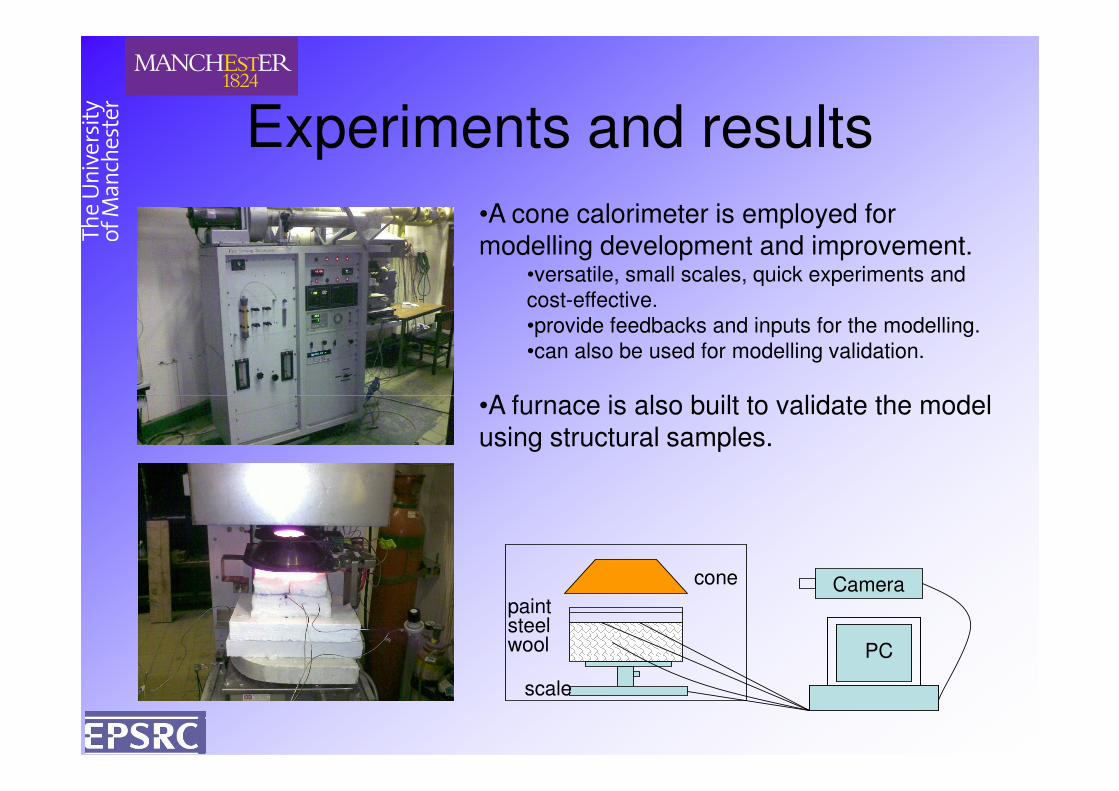
Experiments and results
•A cone calorimeter is employed for modelling development and improvement.
•versatile, small scales, quick experiments and
cost-effective.
•provide feedbacks and inputs for the modelling.
•can also be used for modelling validation.
•A furnace is also built to validate the model
Camera
PC
cone
steelpaint
scale
wool
•A furnace is also built to validate the model using structural samples.
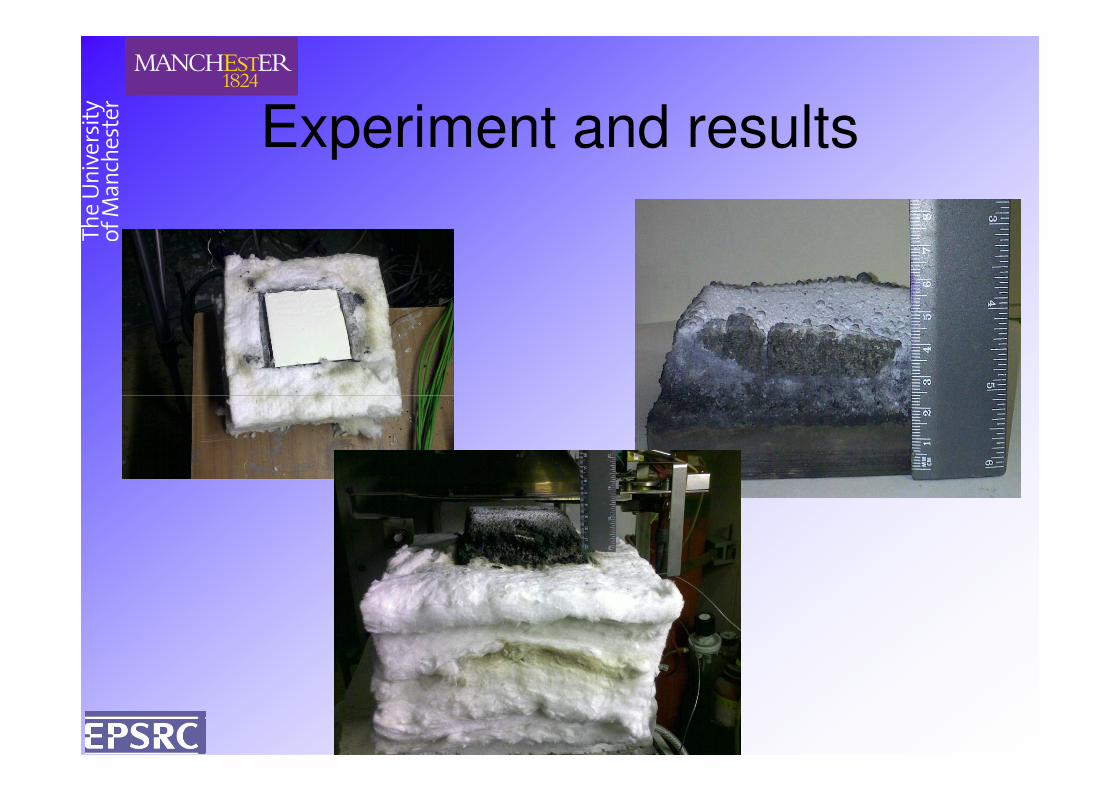
Experiment and results
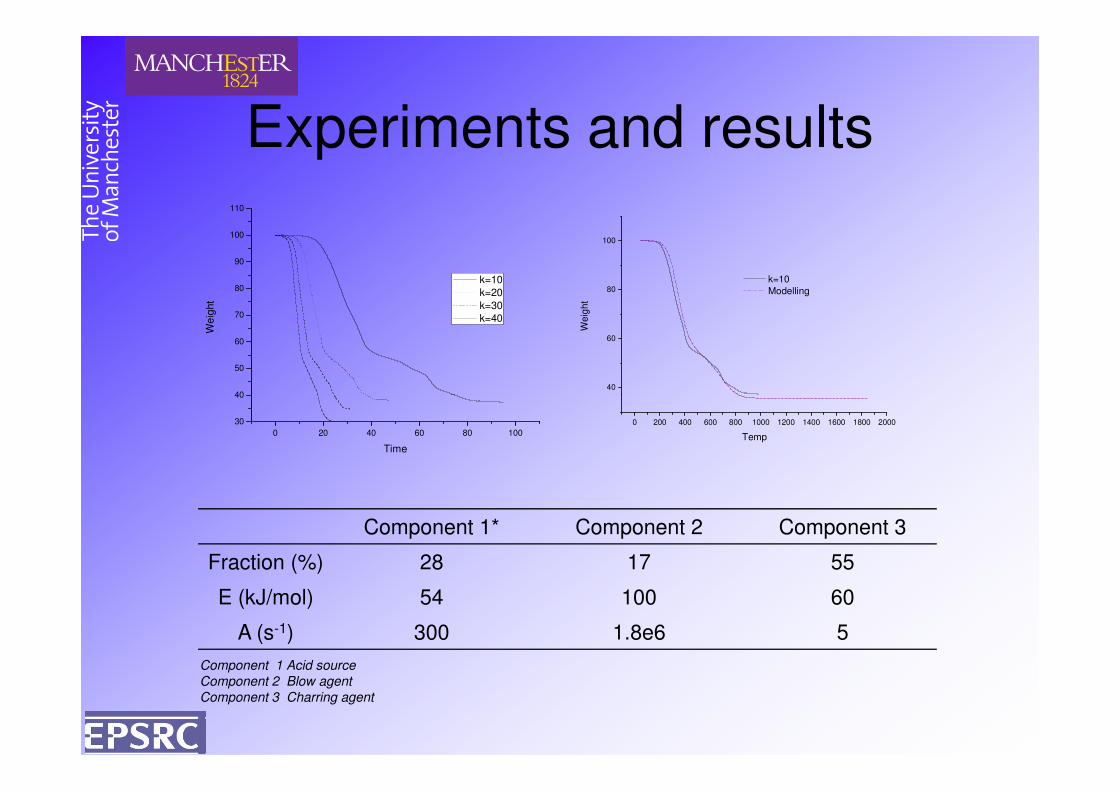
Experiments and results
40
50
60
70
80
90
100
110W
eig
ht
k=10
k=20
k=30
k=40
40
60
80
100
k=10
Modelling
Weig
ht
0 20 40 60 80 100
30
40
Time
0 200 400 600 800 1000 1200 1400 1600 1800 2000
Temp
Component 1* Component 2 Component 3
Fraction (%) 28 17 55
E (kJ/mol) 54 100 60
A (s-1) 300 1.8e6 5
Component 1 Acid source
Component 2 Blow agent
Component 3 Charring agent
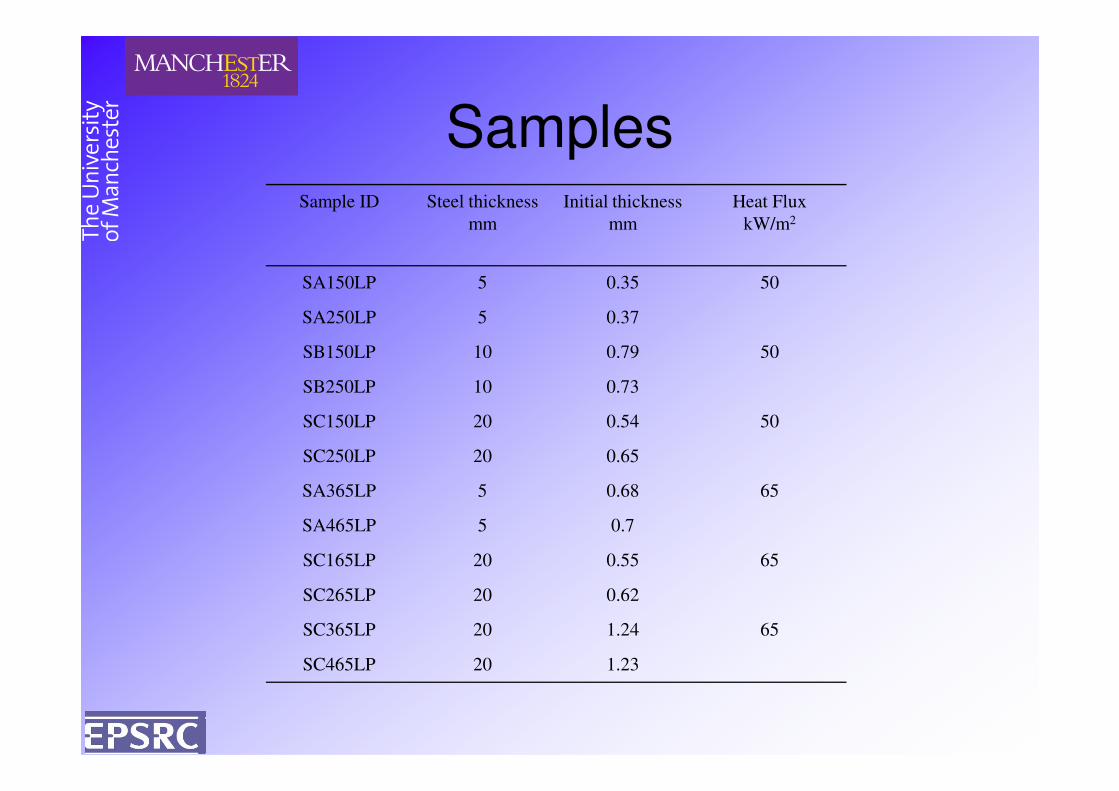
SamplesSample ID Steel thickness
mm
Initial thickness
mm
Heat Flux
kW/m2
SA150LP 5 0.35 50
SA250LP 5 0.37
SB150LP 10 0.79 50
SB250LP 10 0.73SB250LP 10 0.73
SC150LP 20 0.54 50
SC250LP 20 0.65
SA365LP 5 0.68 65
SA465LP 5 0.7
SC165LP 20 0.55 65
SC265LP 20 0.62
SC365LP 20 1.24 65
SC465LP 20 1.23
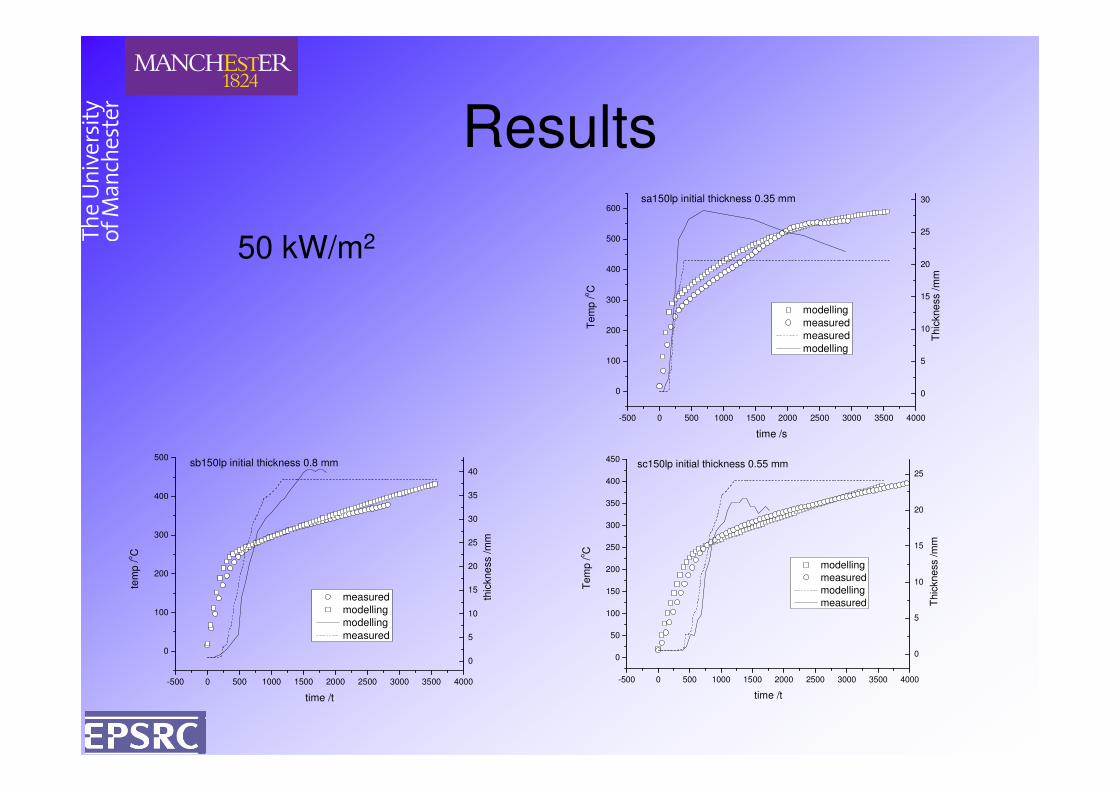
Results
0
100
200
300
400
500
600
Te
mp
/oC
modelling
measured
measured
modelling
sa150lp initial thickness 0.35 mm
0
5
10
15
20
25
30
Th
ickne
ss /m
m
50 kW/m2
-500 0 500 1000 1500 2000 2500 3000 3500 4000
0
time /s
0
-500 0 500 1000 1500 2000 2500 3000 3500 4000
0
100
200
300
400
500
thic
kne
ss /m
m
tem
p /
oC
time /t
measured
modelling
modelling
measured
0
5
10
15
20
25
30
35
40sb150lp initial thickness 0.8 mm
-500 0 500 1000 1500 2000 2500 3000 3500 4000
0
50
100
150
200
250
300
350
400
450
Th
ickn
ess /m
m
Te
mp
/oC
time /t
modelling
measured
modelling
measured
sc150lp initial thickness 0.55 mm
0
5
10
15
20
25
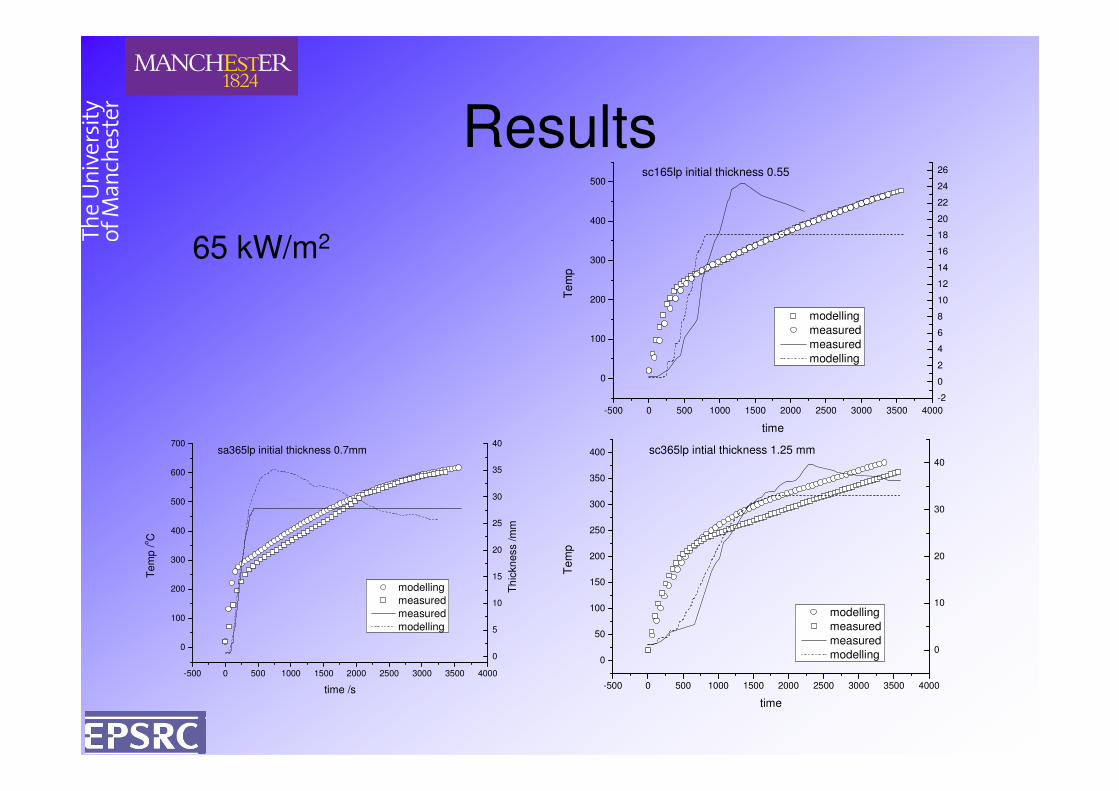
Results
0
100
200
300
400
500
Te
mp
modelling
measured
measured
modelling
sc165lp initial thickness 0.55
-2
0
2
4
6
8
10
12
14
16
18
20
22
24
26
65 kW/m2
-500 0 500 1000 1500 2000 2500 3000 3500 4000
0
50
100
150
200
250
300
350
400
Tem
p
time
modelling
measured
measured
modelling0
10
20
30
40
sc365lp intial thickness 1.25 mm
-500 0 500 1000 1500 2000 2500 3000 3500 4000
time
-2
-500 0 500 1000 1500 2000 2500 3000 3500 4000
0
100
200
300
400
500
600
700
Th
ickn
ess /m
m
Te
mp /
oC
time /s
modelling
measured
measured
modelling
sa365lp initial thickness 0.7mm
0
5
10
15
20
25
30
35
40
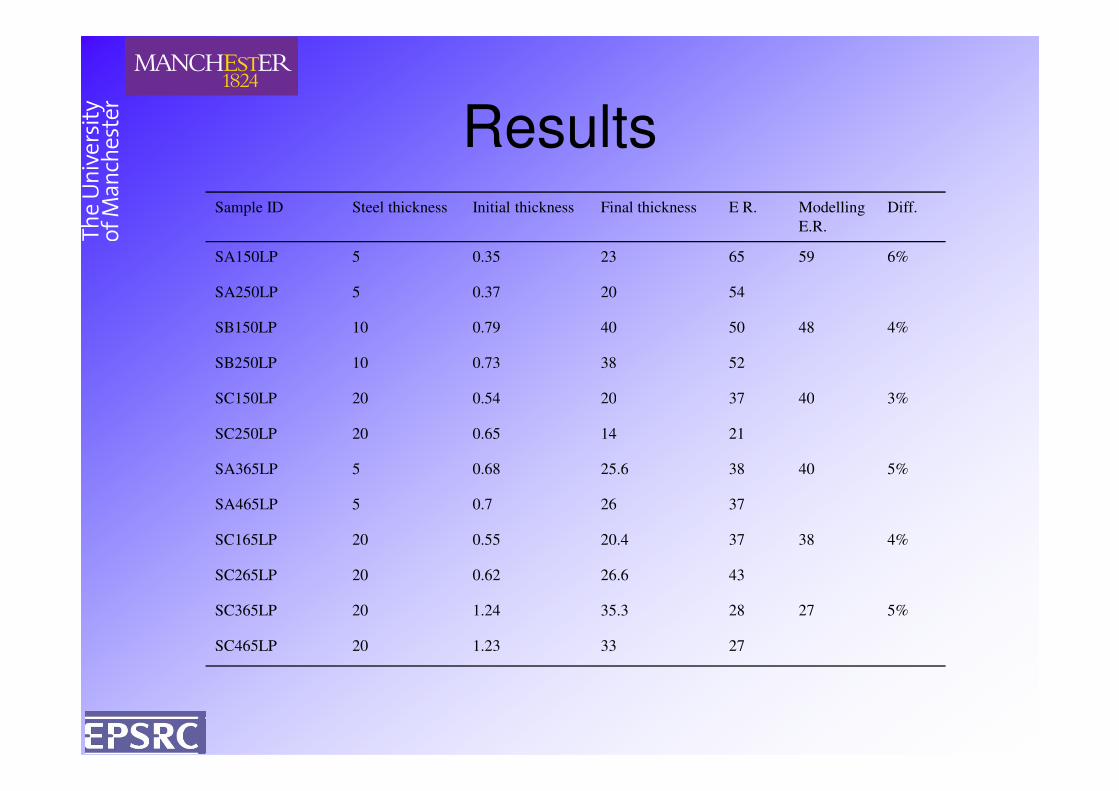
ResultsSample ID Steel thickness Initial thickness Final thickness E R. Modelling
E.R.
Diff.
SA150LP 5 0.35 23 65 59 6%
SA250LP 5 0.37 20 54
SB150LP 10 0.79 40 50 48 4%
SB250LP 10 0.73 38 52
SC150LP 20 0.54 20 37 40 3%SC150LP 20 0.54 20 37 40 3%
SC250LP 20 0.65 14 21
SA365LP 5 0.68 25.6 38 40 5%
SA465LP 5 0.7 26 37
SC165LP 20 0.55 20.4 37 38 4%
SC265LP 20 0.62 26.6 43
SC365LP 20 1.24 35.3 28 27 5%
SC465LP 20 1.23 33 27
Summary
• New assessing method based on this model
– Inputs for the model
• TGA tests (Reactant fractions, chemical kinetic, T0)
• Mean bubble size• Mean bubble size
• Cone Tests for a beta relationship
– the model can be used to predict
• Steel-temperature relationship
• Effective thermal conductivity
Future works
• More cone and furnace tests to validate and improve the model.
– Different affecting parameters
• More products from the market• More products from the market
– Leigths Paint
– Nullifire Fire