CHARACTERISATION OF ESSENTIAL PROTEINS IN...
16
Journal of Quality Measurement and Analysis Jurnal Pengukuran Kualiti dan Analisis JQMA 9(2) 2013, 11-26 CHARACTERISATION OF ESSENTIAL PROTEINS IN PROTEINS INTERACTION NETWORKS (Pencirian Protein-protein Utama dalam Rangkaian Interaksi Protein) SAKHINAH ABU BAKAR 1 , JAVID TAHERI 2 & ALBERT Y ZOMAYA 2 ABSTRACT The identification of essential proteins is theoretically and practically important as it is essential to understand the minimal surviving requirements for cellular lives, and it is fundamental of drug development. As conducting experimental studies to identify essential proteins are both time and resource consuming, here we present a computational approach in predicting them based on network topology properties from protein-protein interaction networks of Saccharomyces cerevisiae, Escherichia coli and Drosophila melanogaster. The proposed method, namely EP 3 NN (Essential Proteins Prediction using Probabilistic Neural Network), employed a machine learning algorithm called Probabilistic Neural Network as a classifier to identify essential proteins of the organism of interest. EP 3 NN uses degree centrality, closeness centrality, local assortativity and local clustering coefficient of each protein in the network for such predictions. Results show that EP 3 NN managed to successfully predict essential proteins with an average accuracy of 95% for our studied organisms. Results also show that most of the essential proteins are close to other proteins, have assortativity behaviour and form clusters/ sub-graph in the network. Keywords: essential protein; machine learning algorithms; neural networks; protein interaction networks ABSTRAK Pengenalpastian protein utama adalah penting secara teori dan praktikal kerana ia penting untuk memahami keperluan minimum bagi kehidupan sel, dan ia menyediakan asas untuk pembangunan dadah/ubat. Memandangkan kajian untuk mengenal pasti protein utama yang dijalankan secara eksperimen memerlukan tempoh atau masa yang lama serta sumber yang terhad, di sini dibentangkan pendekatan pengkomputeran dalam meramal protein-protein utama berdasarkan sifat-sifat topologi rangkaian daripada rangkaian interaksi protein bagi Saccharomyces cerevisiae, Escherichia coli dan Drosophila melanogaster. Kaedah yang dicadangkan, iaitu EP 3 NN (Ramalan Protein Utama menggunakan Rangkaian Neural Berkebarangkalian), menggunakan al-Khwarizmi pembelajaran mesin, iaitu rangkaian neural berkebarangkalian sebagai pengelas untuk mengenal pasti protein utama organisma-organisma tersebut. EP 3 NN menggunakan kepusatan darjah, kepusatan keakraban, assortativiti tempatan dan pekali kelompok tempatan bagi setiap protein dalam rangkaian tersebut. Hasil kajian menunjukkan bahawa EP 3 NN berjaya meramal protein utama dengan purata ketepatan 95 % bagi organisma-organisma yang dikaji. Keputusan juga menunjukkan bahawa sebahagian besar protein utama berkedudukan dekat dengan protein lain, mempunyai tingkah laku assortativiti dan membentuk kelompok/subgraf dalam rangkaian. Kata kunci: protein utama; al-Khwarizmi pembelajaran mesin; rangkaian neural; rangkaian interaksi protein
Transcript of CHARACTERISATION OF ESSENTIAL PROTEINS IN...

Journal of Quality Measurement and Analysis Jurnal Pengukuran Kualiti dan Analisis
JQMA 9(2) 2013, 11-26
CHARACTERISATION OF ESSENTIAL PROTEINS IN PROTEINS INTERACTION NETWORKS
(Pencirian Protein-protein Utama dalam Rangkaian Interaksi Protein)
SAKHINAH ABU BAKAR1, JAVID TAHERI2 & ALBERT Y ZOMAYA2
ABSTRACT
The identification of essential proteins is theoretically and practically important as it is essential to understand the minimal surviving requirements for cellular lives, and it is fundamental of drug development. As conducting experimental studies to identify essential proteins are both time and resource consuming, here we present a computational approach in predicting them based on network topology properties from protein-protein interaction networks of Saccharomyces cerevisiae, Escherichia coli and Drosophila melanogaster. The proposed method, namely EP3NN (Essential Proteins Prediction using Probabilistic Neural Network), employed a machine learning algorithm called Probabilistic Neural Network as a classifier to identify essential proteins of the organism of interest. EP3NN uses degree centrality, closeness centrality, local assortativity and local clustering coefficient of each protein in the network for such predictions. Results show that EP3NN managed to successfully predict essential proteins with an average accuracy of 95% for our studied organisms. Results also show that most of the essential proteins are close to other proteins, have assortativity behaviour and form clusters/sub-graph in the network.
Keywords: essential protein; machine learning algorithms; neural networks; protein interaction networks
ABSTRAK
Pengenalpastian protein utama adalah penting secara teori dan praktikal kerana ia penting untuk memahami keperluan minimum bagi kehidupan sel, dan ia menyediakan asas untuk pembangunan dadah/ubat. Memandangkan kajian untuk mengenal pasti protein utama yang dijalankan secara eksperimen memerlukan tempoh atau masa yang lama serta sumber yang terhad, di sini dibentangkan pendekatan pengkomputeran dalam meramal protein-protein utama berdasarkan sifat-sifat topologi rangkaian daripada rangkaian interaksi protein bagi Saccharomyces cerevisiae, Escherichia coli dan Drosophila melanogaster. Kaedah yang dicadangkan, iaitu EP3NN (Ramalan Protein Utama menggunakan Rangkaian Neural Berkebarangkalian), menggunakan al-Khwarizmi pembelajaran mesin, iaitu rangkaian neural berkebarangkalian sebagai pengelas untuk mengenal pasti protein utama organisma-organisma tersebut. EP3NN menggunakan kepusatan darjah, kepusatan keakraban, assortativiti tempatan dan pekali kelompok tempatan bagi setiap protein dalam rangkaian tersebut. Hasil kajian menunjukkan bahawa EP3NN berjaya meramal protein utama dengan purata ketepatan 95 % bagi organisma-organisma yang dikaji. Keputusan juga menunjukkan bahawa sebahagian besar protein utama berkedudukan dekat dengan protein lain, mempunyai tingkah laku assortativiti dan membentuk kelompok/subgraf dalam rangkaian.
Kata kunci: protein utama; al-Khwarizmi pembelajaran mesin; rangkaian neural; rangkaian interaksi protein
12
Sakhinah Abu Bakar, Javid Taheri & Albert Y Zomaya
1. Introduction
Essential proteins are proteins that are indispensable to support cellular life. These proteins constitute a minimal protein set in rich medium containing all nutrients required for a living cell. If the essential proteins are absent, it is sufficient to confer a lethal phenotype upon an organism (Cole 2002; Zhang et al. 2004). Therefore, the functions encoded by these proteins are crucial for survival and a foundation of life. The identification of essential proteins is important not only for understanding minimal requirement for cellular life, but also for practical purposes. For example, in drug development, the essential proteins make excellent potential new drugs and vaccines to treat and prevent diseases, and improved diagnostic tools to detect infection more reliably (Cole 2002).
Predictions of essential proteins have been performed experimentally since 2002 by various procedures such as single protein knockouts (Giaever et al. 2002), Ribonucleic Acid (RNA) interference (Cullen & Arndt 2005), conditional knockouts (Roemer et al. 2003), and proteintic footprint technique (Gerdes et al. 2003). These challenging procedures are however very time and resources consuming – even in well studied organisms. Therefore, computational approaches to accurately predict protein essentiality would have great values. Essential proteins in Saccharmoyces cerevisiae (baker’s yeast) and Escherichia coli have been predicted by implementing Naïve Bayes as a classifier based on features obtainable directly from sequence data such as, experimental characteristics, genomic characteristics, and protein characteristic (Gustafson et al. 2006). Seringhaus et al. (2006) has proposed a new hybrid classifier that combined the output of diverse classification schemes including decision trees, Naïve Bayes, and a logistic regression model to predict the essential protein in baker’s yeast using exclusively on sequence features of proteins (Seringhaus et al. 2006).
Besides using sequence features of protein, several studies have also taken advantage of the abundance of experimental data available for protein interaction networks (PIN) to understand major characteristics of essential proteins. Parameters of PIN topology such as clustering coefficient, closeness, and average degree are also considered to identify essential proteins (Estrada 2006; Silva et al. 2008; Acencio & Lemke 2009). Centrality measures based on graph spectral properties of the network show that protein indispensability does not depend on how close a protein is to many other proteins, but related on how much a protein implicated in clusters of protein forming a large number of sub graph in the network (Estrada 2006).
Network Topology-based Prediction of Protein Essentiality (NTPGE) has been proposed to predict essential proteins in integrated molecular networks comprising proteins’ physical, metabolic and transcriptional regulation interactions (Silva et al. 2008). This proposed classifier relied mostly on proteins’ physical and metabolic interactions, and is only applicable for organisms whose corresponding integrated molecular network has been already constructed. Combination of network topology features, cellular compartments and biological process gave better prediction performance where the number of protein physical interactions, the nuclear localisation of proteins and the number of regulating transcription factors are the most important factors determining protein essentiality (Acencio & Lemke 2009). These findings disagree with Coulomb’s statement: i.e., protein essentiality is largely unrelated to many parameters of protein network topology including clustering coefficient and the average degree of the nearest neighbours (Coulomb et al. 2005).
In this study, we identify essential proteins in three different organisms based on selected features of protein networks topology. The features are degree centrality, closeness centrality, local assortativity and local clustering coefficient for every protein in a network. From our knowledge, the combination of these features has not been considered in this problem yet. These topological features successfully identify essential proteins and provide more information

13
Characterisation of essential proteins in proteins interaction networks
in order to understand essential proteins in Saccharmoyces cerevisiae, Escherichia coli and Drosophila melanogaster. We chose these organisms in our study because they are important model organisms in most biological area. Saccharmoyces cerevisiae –also known as baker’s yeast – is a completely sequenced organism and one of the most intensively studied eukaryotic model organisms in molecular and cell biology. Baker’s yeast has developed as a model organism because it is small with short protein ration time and can be easily cultured (Gofieau et al. 1996). Escherichia coli also completely sequenced prokaryote model organism. Its strains are harmless but can cause serious food poisoning in humans (Hudault et al. 2001; Vogt & Dippold 2005). Therefore, it is important to understand proteins activities in this organism in identifying essential proteins. Besides these two model organisms, we also considered other eukaryotic model organism, Drosophila melanogaster, also known as fruit fly. Drosophila melanogaster was among the first organisms used for proteintic analysis in understanding proteins behaviour in other eukaryotes, including humans (Celniker & Rubin 2003; Adams et al. 2000). It is important to study the proteins functionality in this organism as it leads to more information in human’s network.
Our study focuses on predicting essential proteins in these organisms and identifying the characterisation of predicted essential proteins based on their networks topological properties. This paper is organised into six sections. Section 1 introduces the essential proteins and research background on essential proteins prediction. Section 2 described our problem statement, followed by details on the prediction method in Section 3. Results and discussion are presented in Sections 4 and 5, respectively, before conclusion in Section 6.
2. Problem Statement
Prediction of essential proteins in protein network can be formulated as follows: Given an
undirected graph G = (V ,E) where V = v1,v2,v3,…,vN( ) is a set of nodes and E = eij | i, j = 1,2,3,…,N{ } is a set of edges in a graph with number of nodes, N. A graph G represents protein network with protein and interaction between two proteins represented as node and edge, respectively. Find any nodes in the given graph that play roles of essential node with respect to unknown relations among features in a set of network topology features, F = f1, f2,…, fM( ) where M is the number of considered features.
3. Method
EP3NN consists of three main stages: (1) datasets preparation, (2) defining network topological properties, and (3) classifier development. We developed the datasets by filtering and mapping the data from two databases for protein networks and essential proteins information. Then, we defined the four network topological properties by modifying their formulas to be suitable/applicable to our considered networks. All these properties were computed and applied as a set of features to the enhanced classifier.
3.1 Datasets Preparation
Three well-studied organisms are considered in predicting essential proteins (Saccharmoyces cerevisiae, Escherichia coli and Drosophila melanogaster). Protein-protein physical interaction networks for each organism were downloaded from Database of Interacting Protein (DIP) (Xenatios 2000). DIP combines experimentally determined protein-protein interactions information from various sources and it is updated in regular basis (Xenarios 2000). In this study, we assume that protein networks as undirected networks with similar number of in- and

14
Sakhinah Abu Bakar, Javid Taheri & Albert Y Zomaya
out-degrees. Dataset of protein networks for each organism contains a set of nodes and a set of links to represent proteins and their interactions, respectively. Here, if protein x is connected to protein y through link a, and protein y is connected to protein x through link b; then, datasets are filtered by following assumptions:
• If both links are exists in dataset, both linked are replaced with average of a and b.• If either link a or link b is exist in dataset, the link are assumed to be bi-directional.
Overall information of these networks is shown in Table 1. Information of essential proteins for each organism obtained from the Database of Essential Gene (DEG) (Zhang et al. 2004). DEG consists of all the essential proteins currently available from various experimental procedures such as antisense RNA technique, transposon mutaproteinsis, high density transposon mutaproteinsis and comparative genomics (Zhang et al. 2004). The essential proteins datasets for each organism were mapped four times based on the DEG id. Since there are no specific tools for id mapping, we mapped the DEG id to DIP id using four id mapping processes. After the id mapping, our datasets consist of 1110 of Baker’s yeast’s, 713 of Escherichia coli’s and 339 of Drosophila melanogaster’s known – broadly accepted – essential proteins. The information of essential proteins for each organism is used as positive examples in predicting essential proteins.
Table 1: Number of proteins and interactions for every organism in DIP
Organisms # Proteins # InteractionsSaccharmoyces cerevisiae 4941 17566Escherichia coli 1848 6964Drosophila melanogaster 528 706
3.2 Network Topological Features
In this study, we are not considering all possible network topological features in predicting essential proteins as in Silva (2008) and Acencio (2009). There are four selected features namely degree centrality, closeness centrality, local assortativity and local clustering coefficient for every proteins in the network. Even though betweeness centrality always been considered in network analysis together with degree centrality and closeness centrality, it has been proven in Estrada (2006) that essential proteins are not influenced by betweeness centrality measurement. These features have been chosen and modified (degree centrality and closeness centrality) based on their original definition in networks/graphs. We strongly believe that these characteristic could significantly influence the prediction process and characterisation of essential proteins.
3.2.1. Degree Centrality (DC)
Let G = (V ,E)with N nodes be an undirected graph where V and E is a set of nodes and edges, respectively. The degree centrality for every node, v, is defined as follows:
DC(v) = deg(v)N −1
where deg(v) := e | e ∈E ∧ v ∈V{ } is a number of links for v. Degree centrality value increases linearly to the number of edges. Therefore, nodes with higher degree centrality values are more likely to be main connectors in a network (Junker & Schreiber 2008), as shown in Figure 1.

15
Characterisation of essential proteins in proteins interaction networks
Figure 1: An example network with highest degree is 9 (black node) and the lowest degree is 3 (grey node)
3.2.2. Closeness Centrality (CC)
The closeness centrality of node v is defined as:
CC(v) =Nd(v,vi )i∈v
∑
Where ( ).d is the shortest path from node v to vi for all nodes in the network. The closeness centrality value represents the communication of node v to all reachable nodes in the network. Nodes with higher closeness centrality values are more important as they are closer to more nodes in a network compared with others (Junker & Schreiber 2008).
3.2.3. Local Assortativity (LA)
Assortativity is the tendency in networks where nodes mostly connected with similar nodes based on degree of nodes. In other words, highly-connected nodes have connection with other highly-connected nodes in the network, and vice versa, as shown in Figure 2.
Figure 2: A network with assortativity nodes. Both highly connected black nodes are connected each other as shown in thicker lines, as well as connections between low degree nodes (white nodes)
Local assortativity value for every node in the network can be defined as:
LA v( ) =j j +1( ) k − µq( )
2Mσ q2

16
Sakhinah Abu Bakar, Javid Taheri & Albert Y Zomaya
where j, M and k are degree of v, number of links in the network and the average degree of
node vs. neighbours, respectively; µq and σ q are mean and standard deviation of the remaining degree distribution, q(k), respectively. q(k),is defined as:
q k( ) = p k +1( )2jp j( )
1≤ j≤N∑
where p(k) is network degree distribution (Newman 2002; Piraveenan 2009; 2012).
3.2.4. Local Clustering Coefficient (LCC)
Local clustering coefficient measures the probability that two nodes with common neighbours are connected. Local clustering coefficient can be computed as:
LCC v( ) = 2E v( )kv kv −1( )
where kv is degree of v and E .( ) is the number of edges between neighbours of v. If a node has high local clustering coefficient value, this node indicates local cohesiveness and a high tendency to form groups (Junker & Schreiber 2008), as shown in Figure 3.
Figure 3: An example of local clustered nodes in the network. Dashed circles in the network show the clustered black nodes with higher value LCC compare to other nodes in the network
3.3 The Enhanced Probabilistic Neural Network
In this paper, we implement an artificial neural network (ANN) as the classifier; ANNs are computational models to simulate structure of neural networks. Such networks typically consist of interconnected neurons and processes information. ANN is usually deployed to model complex or unknown relationships among input and outputs (Taheri & Zomaya 2006a;2006b).
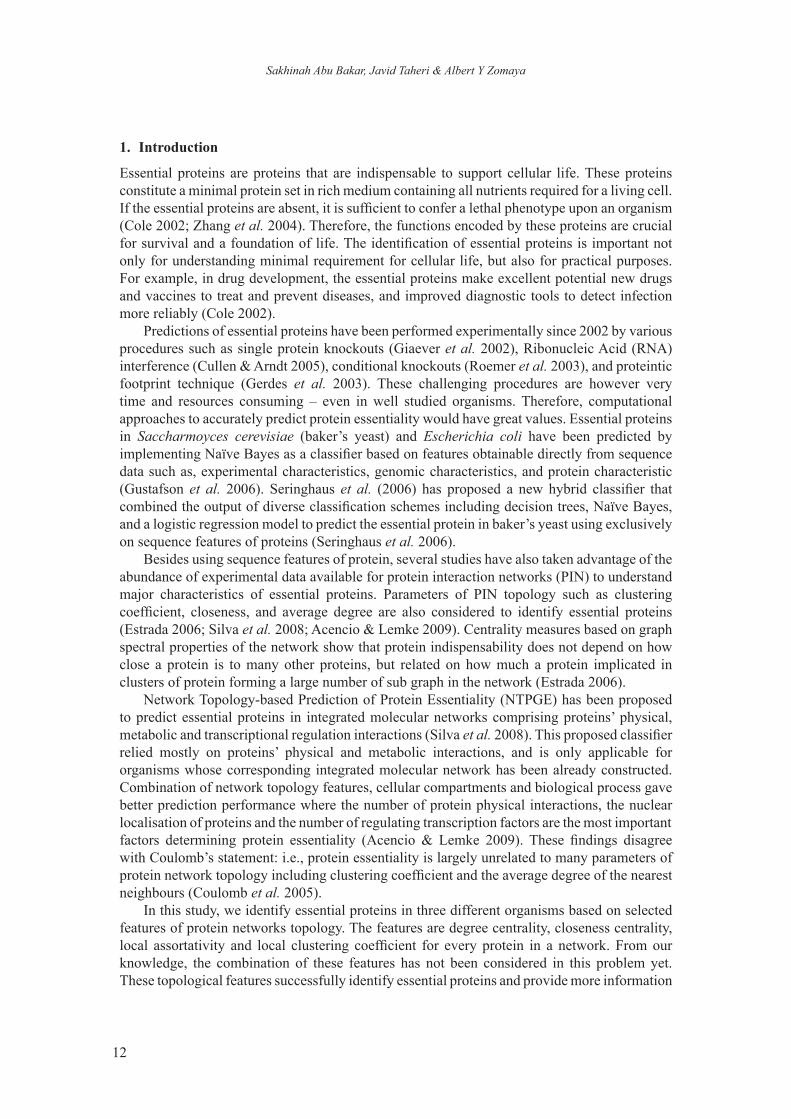
The radial basis networks called probabilistic neural networks (PNN) have been introduced by Specht (Specht 1988;1990). The three-layer-PNN, as shown in Figure 4, is developed to
solve the classification problems where the radial basis function, e− x2is chosen as the transfer
function for neurons in the hidden layer (radial basis layer). The first layer of PNN receives an input vector and computes its distances from the input vector to all training input vectors; the second layer sums these contributions for each class of inputs and produces a vector of values between [0 1]. The output layer classifies the vector by selecting the maximum value of the
17
Characterisation of essential proteins in proteins interaction networks
vector elements and produces a ‘1’ for the chosen class and ‘0’ for the others. In this study, the final output of PNN has two classes for essential and non-essential proteins.
In order to develop an efficient design of PNN, our classifier iteratively creates one radial basis neuron at a time. This procedure is repeated until either the final sum-squared error falls beneath a predefined error goal or a predefined maximum number of neurons is reached. In this case, the error goal is 0 and the maximum number of neurons is the number of proteins in the protein network.
Figure 4: Probabilistic neural network architecture
4. Results
The EP3NN has been tested on three different organisms: Saccharmoyces cerevisiae, Escherichia coli and Drosophila melanogaster by considering their network topology properties (DC, CC, LA, and LCC). We assumed that protein networks for all considered organisms have a power
law (P d( )∝ d−α ) or scale free of degree distributions as proven in (Wagner 2003; Lee et al. 2005; Hakes et al. 2008; Ng & Huang 2004; Bhan et al. 2002; Colizza et al. 2005). The average values of α for Saccharmoyces cerevisiae, Escherichia coli and Drosophila melanogaster are empirically set to 2.0, 1.7 and 1.9, respectively. While calculating the closeness centrality, CC, for every protein, we employed Djisktra algorithm (Masters 1995) to compute shortest paths in the network.
The classifier, PNN has been trained by a gradient descent algorithm with adaptive learning rate back-propagation and tested using 10-fold cross validation for each organism. As a result, PNN have different number of neurons in radial basis layer for each organism. PNN for Saccharmoyces cerevisiae consists of 1776 neurons, Escherichia coli has 271 neurons, and Drosophila melanogaster has 86 neurons. EP3NN successfully determined essential proteins and non-essential proteins for every organism based on their network topology properties.
18
Sakhinah Abu Bakar, Javid Taheri & Albert Y Zomaya
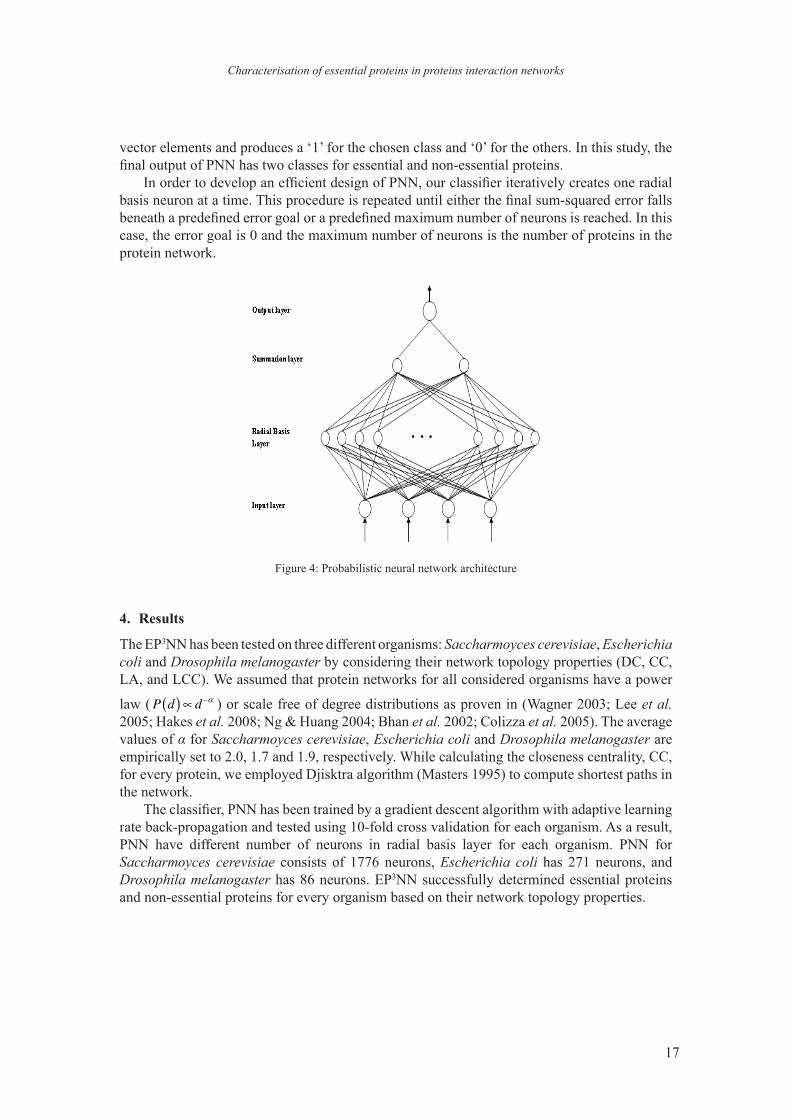
Figure 5: Performance of EP3NN compared to other methods
5. Discussion
5.1. Essential Proteins Prediction
In this study, we chose the best three available prediction methods namely Ref1 in Gustafson et al. (2006), Ref2 in Silva et al. (2008), and Ref3 in Seringhaus et al. (2008) to compare our results with. Here we compared EP3NN performance with other methods on benchmark organism, baker’s yeast. The EP3NN achieved 95% of accuracy with perfect sensitivity of 1, and specificity of 0.92. Figure 5 shows that EP3NN performance is the best among the three methods based on the Receiver Operating Characteristic (ROC) curve. Both Ref1 and Ref2 used the combination information of protein network topology properties and genomic features, with TPR of 0.70 and 0.82, respectively.
The hybrid prediction method in Ref3 predicts essential proteins with 0.69 of true positive rate (TPR) but very low FPR of 0.19. This method was unable to determine the non-essential proteins probably due to the lack of information about the proteins’ network topology –only genomic features have been considered to date. However, if only network topology properties have been considered in the essential proteins prediction, higher TPR and FPR can be achieved as proven in this paper and in Gustafson et al. (2006).
As shown in Table 2, EP3NN successfully classify essential proteins and non-essential proteins for other two organisms, Escherichia coli and Drosophila melanogaster. These two organisms have never been tested for essential proteins prediction before. It is shown that EP3NN is able to achieve consistent performance for other than baker’s yeast with various sizes of protein networks.
Table 2: Prediction performances for all organisms
Organisms Sens. Spec. Acc.Saccharmoyces cerevisiae 1.0 0.9189 0.9595Escherichia coli 1.0 0.9007 0.9503Drosophila melanogaster 1.0 0.8958 0.9479

19
Characterisation of essential proteins in proteins interaction networks
5.2. Centrality of Essential Proteins
In this study, we considered two types of centralities: degree centrality and closeness centrality. Both centralities are important to verify the functionality of every node in a network. Since proteins with the same degree can have various degree centrality, closeness centrality, local assortativity and local clustering coefficient values, one degree can be represented for them; e.g., the average value for all protein with a given degree k.
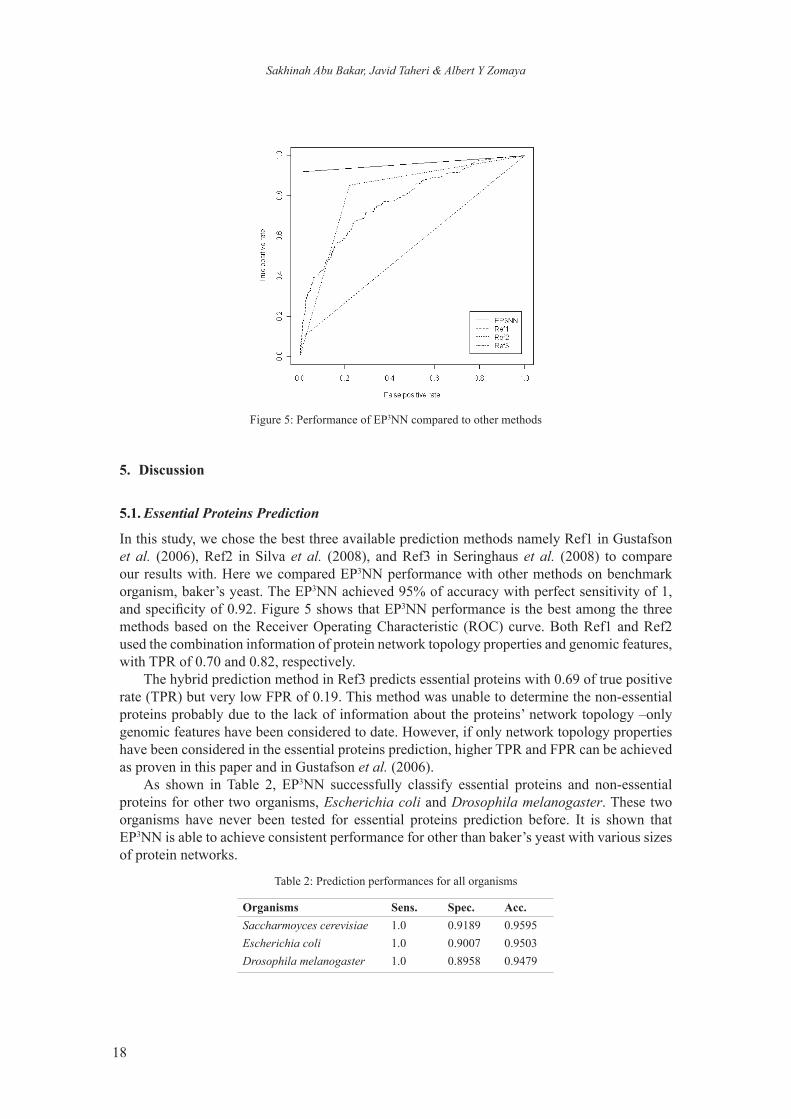
Degree centrality of a network increases linearly to number of degree as shown in Figures 6, 7, and 8. In Figure 6, almost all predicted essential proteins in baker’s yeast have number of degrees less than 75. Even though only less than 1% of essential proteins have degree more than 100 (minor case), EP3NN was still able to recognise them as desired essential proteins. Escherichia coli network shows similar pattern as baker’s yeast where most of the essential proteins have a degree less than 80 and a few proteins with degrees greater than 100 (Figure 7). However, most of essential proteins in Drosophila melanogaster have degrees less than 10 (Figure 8). This is due to small proteins networks consists of only 502 proteins and 706 interactions with maximum number of degree is 19.
Figure 6: Degree centrality of essential proteins in Saccharmoyces cerevisiae
Figure 7: Degree centrality of essential proteins in Escherichia coli
20
Sakhinah Abu Bakar, Javid Taheri & Albert Y Zomaya
Figure 8: Degree centrality of essential proteins in Drosophila melanogaster
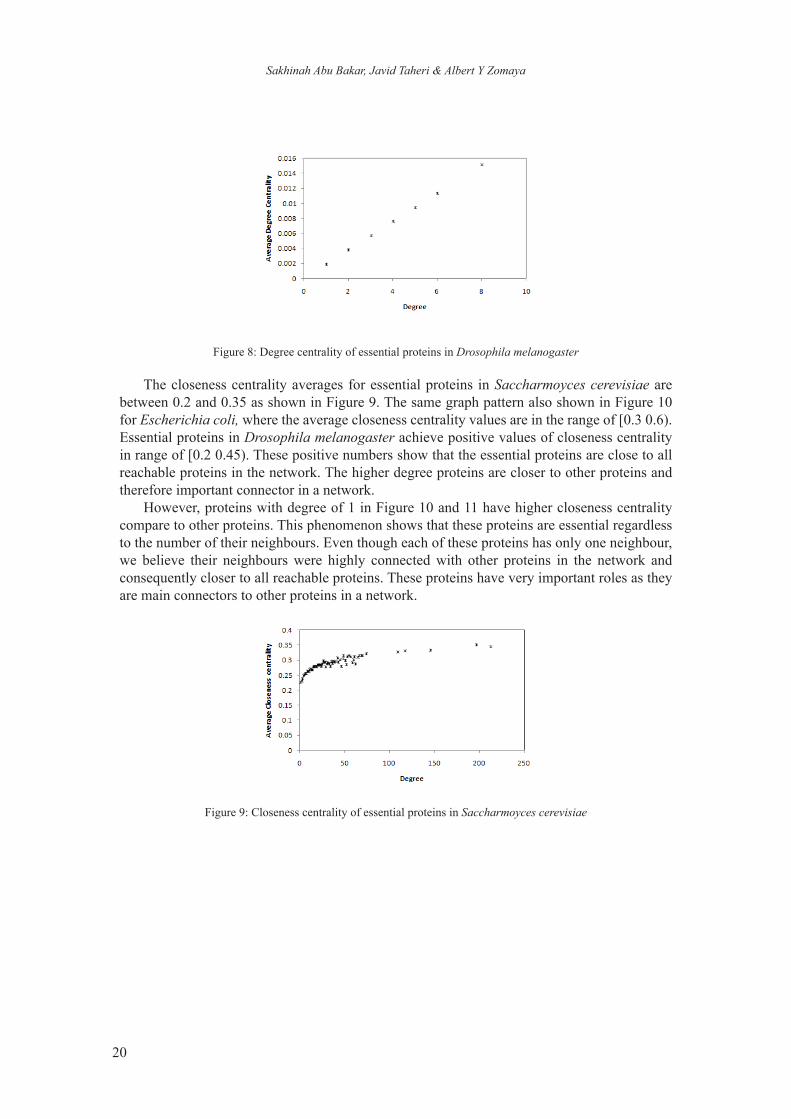
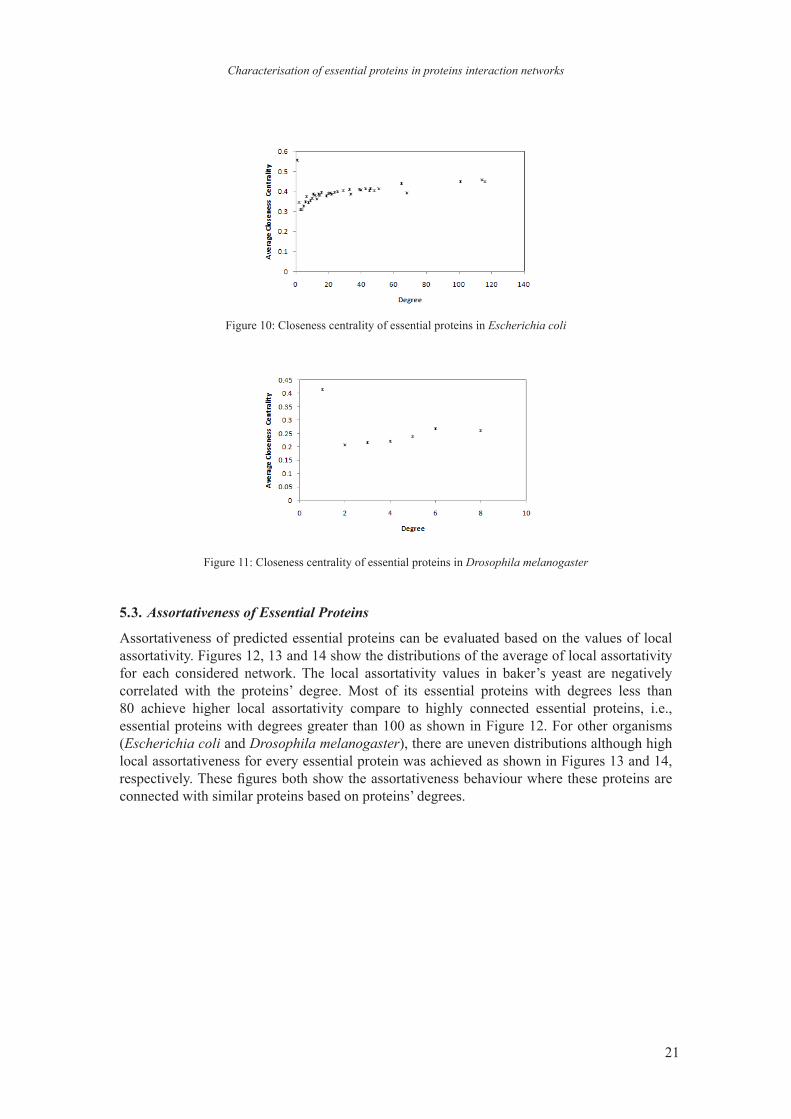
The closeness centrality averages for essential proteins in Saccharmoyces cerevisiae are between 0.2 and 0.35 as shown in Figure 9. The same graph pattern also shown in Figure 10 for Escherichia coli, where the average closeness centrality values are in the range of [0.3 0.6). Essential proteins in Drosophila melanogaster achieve positive values of closeness centrality in range of [0.2 0.45). These positive numbers show that the essential proteins are close to all reachable proteins in the network. The higher degree proteins are closer to other proteins and therefore important connector in a network.
However, proteins with degree of 1 in Figure 10 and 11 have higher closeness centrality compare to other proteins. This phenomenon shows that these proteins are essential regardless to the number of their neighbours. Even though each of these proteins has only one neighbour, we believe their neighbours were highly connected with other proteins in the network and consequently closer to all reachable proteins. These proteins have very important roles as they are main connectors to other proteins in a network.
Figure 9: Closeness centrality of essential proteins in Saccharmoyces cerevisiae
21
Characterisation of essential proteins in proteins interaction networks
Figure 10: Closeness centrality of essential proteins in Escherichia coli
Figure 11: Closeness centrality of essential proteins in Drosophila melanogaster
5.3. Assortativeness of Essential Proteins
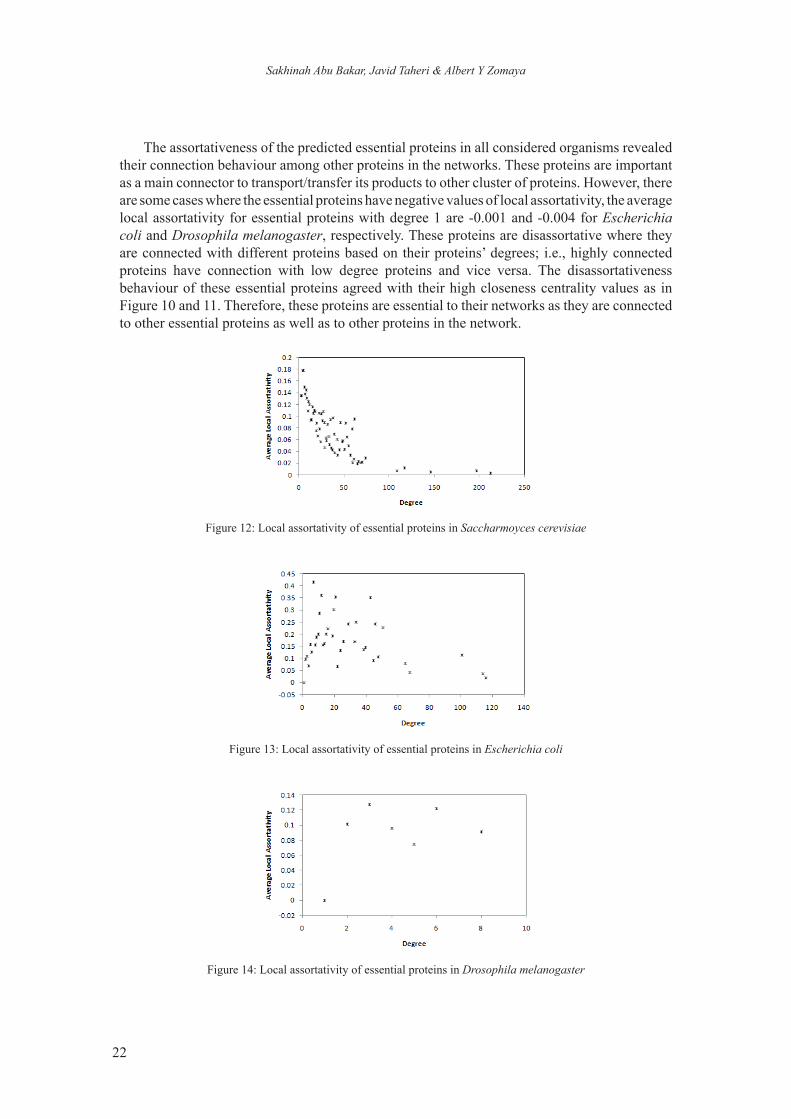
Assortativeness of predicted essential proteins can be evaluated based on the values of local assortativity. Figures 12, 13 and 14 show the distributions of the average of local assortativity for each considered network. The local assortativity values in baker’s yeast are negatively correlated with the proteins’ degree. Most of its essential proteins with degrees less than 80 achieve higher local assortativity compare to highly connected essential proteins, i.e., essential proteins with degrees greater than 100 as shown in Figure 12. For other organisms (Escherichia coli and Drosophila melanogaster), there are uneven distributions although high local assortativeness for every essential protein was achieved as shown in Figures 13 and 14, respectively. These figures both show the assortativeness behaviour where these proteins are connected with similar proteins based on proteins’ degrees.
22
Sakhinah Abu Bakar, Javid Taheri & Albert Y Zomaya
The assortativeness of the predicted essential proteins in all considered organisms revealed their connection behaviour among other proteins in the networks. These proteins are important as a main connector to transport/transfer its products to other cluster of proteins. However, there are some cases where the essential proteins have negative values of local assortativity, the average local assortativity for essential proteins with degree 1 are -0.001 and -0.004 for Escherichia coli and Drosophila melanogaster, respectively. These proteins are disassortative where they are connected with different proteins based on their proteins’ degrees; i.e., highly connected proteins have connection with low degree proteins and vice versa. The disassortativeness behaviour of these essential proteins agreed with their high closeness centrality values as in Figure 10 and 11. Therefore, these proteins are essential to their networks as they are connected to other essential proteins as well as to other proteins in the network.
Figure 12: Local assortativity of essential proteins in Saccharmoyces cerevisiae
Figure 13: Local assortativity of essential proteins in Escherichia coli
Figure 14: Local assortativity of essential proteins in Drosophila melanogaster

23
Characterisation of essential proteins in proteins interaction networks
5.4. Cohesiveness of Essential Proteins
In this section, we try to study the relation between nodes’ degrees and their tendencies to form clusters – either weak or strong. Our study shows that the essential proteins in baker’s yeast achieve less than 0.5 of cohesiveness probability. The distribution of local clustering coefficient of this organism shows almost similar pattern of its distribution of assortativeness as shown in Figure 15. These values are negatively correlated to the degree of protein. Proteins with less than 50 degree have higher probability to form clusters where most of the neighbours are connected to each other. If not all higher degree proteins’ neighbours are connected to each other; weak clusters would be formed instead.
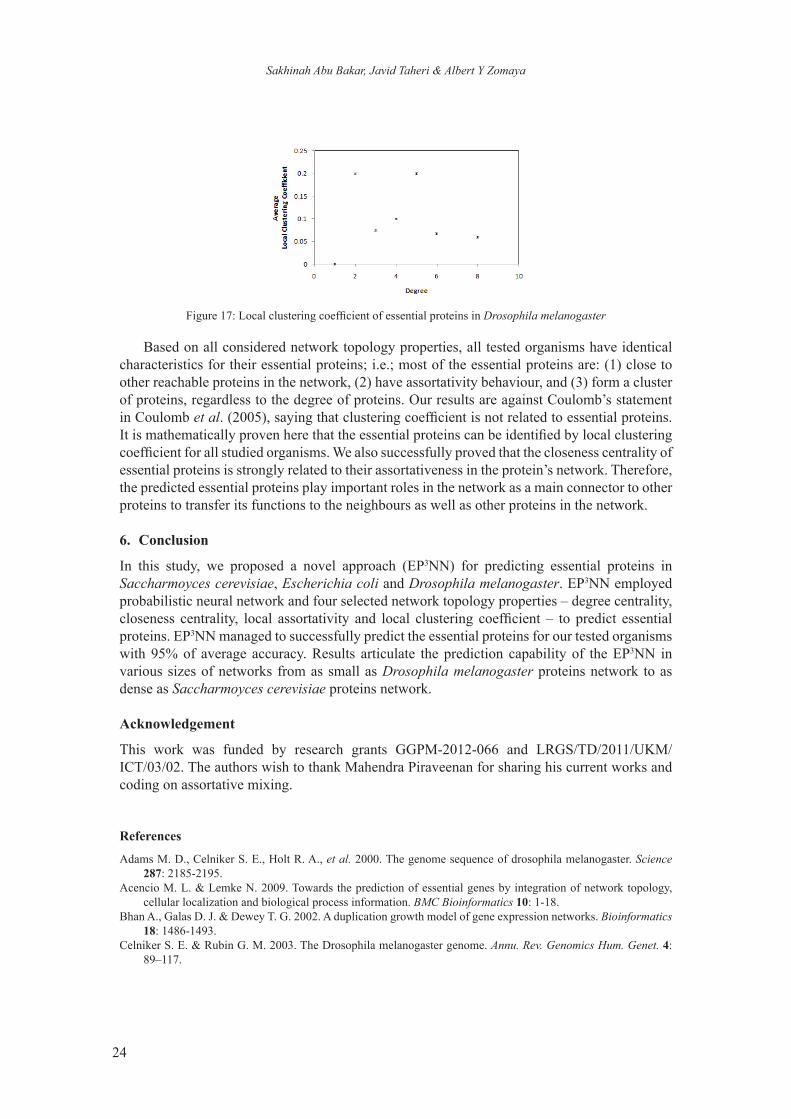
Figure 16 shows the distribution of local clustering coefficient of essential proteins in Escherichia coli. This organism consists of cohesiveness proteins with degree less than 80. More than 50% of the proteins have clustering coefficient greater than 0.5 and therefore form stronger clusters compared to other proteins regardless to the degree of proteins. Drosophila melanogaster have uneven distribution of local clustering coefficient of its essential proteins as shown in Figure 17. The probability of these proteins to form groups in the network is less than 0.25, which is relatively low cohesiveness behaviour. As a result, groups formed by essential proteins in this organism have fairly weak connections among their neighbours, i.e., not all neighbours are connected to each other in the same group.
Figure 15: Local clustering coefficient of essential proteins in Saccharmoyces cerevisiae
Figure 16: Local clustering coefficient of essential proteins in Escherichia coli
24
Sakhinah Abu Bakar, Javid Taheri & Albert Y Zomaya
Figure 17: Local clustering coefficient of essential proteins in Drosophila melanogaster
Based on all considered network topology properties, all tested organisms have identical characteristics for their essential proteins; i.e.; most of the essential proteins are: (1) close to other reachable proteins in the network, (2) have assortativity behaviour, and (3) form a cluster of proteins, regardless to the degree of proteins. Our results are against Coulomb’s statement in Coulomb et al. (2005), saying that clustering coefficient is not related to essential proteins. It is mathematically proven here that the essential proteins can be identified by local clustering coefficient for all studied organisms. We also successfully proved that the closeness centrality of essential proteins is strongly related to their assortativeness in the protein’s network. Therefore, the predicted essential proteins play important roles in the network as a main connector to other proteins to transfer its functions to the neighbours as well as other proteins in the network.
6. Conclusion
In this study, we proposed a novel approach (EP3NN) for predicting essential proteins in Saccharmoyces cerevisiae, Escherichia coli and Drosophila melanogaster. EP3NN employed probabilistic neural network and four selected network topology properties – degree centrality, closeness centrality, local assortativity and local clustering coefficient – to predict essential proteins. EP3NN managed to successfully predict the essential proteins for our tested organisms with 95% of average accuracy. Results articulate the prediction capability of the EP3NN in various sizes of networks from as small as Drosophila melanogaster proteins network to as dense as Saccharmoyces cerevisiae proteins network.
Acknowledgement
This work was funded by research grants GGPM-2012-066 and LRGS/TD/2011/UKM/ICT/03/02. The authors wish to thank Mahendra Piraveenan for sharing his current works and coding on assortative mixing.
References
Adams M. D., Celniker S. E., Holt R. A., et al. 2000. The genome sequence of drosophila melanogaster. Science 287: 2185-2195.
Acencio M. L. & Lemke N. 2009. Towards the prediction of essential genes by integration of network topology, cellular localization and biological process information. BMC Bioinformatics 10: 1-18.
Bhan A., Galas D. J. & Dewey T. G. 2002. A duplication growth model of gene expression networks. Bioinformatics 18: 1486-1493.
Celniker S. E. & Rubin G. M. 2003. The Drosophila melanogaster genome. Annu. Rev. Genomics Hum. Genet. 4: 89–117.

25
Characterisation of essential proteins in proteins interaction networks
Cole S. T. 2002. Comparative mycobacterial genomics as a tool for drug target and antigen discovery. European Respiratory Journal 20: 78-86
Colizza V., Flammini A., Maritan A. & Vespignanim A. 2005. Characterization and modeling of protein-protein interaction networks. Physica A 352: 1-27.
Coulomb S., Bauer M., Bernard D. & Marsolier-Kergoat M. C. 2005. Gene essentiality and the topology of protein interaction networks. Proc. R. Soc. B 272: 1721-1725.
Cullen L. M. & Arndt G. M. 2005. Genome-wide screening for gene function using rnai in mammalian cells. Immunology and Cell Biology 83: 217-223.
Estrada E. 2006. Virtual identification of essential proteins within the protein interaction network of yeast. Proteomic 6: 35-40.
Gerdes S. Y., Scholle M. D., Campbell J. W., et al. 2003. Experimental determination and system level analysis of essential genes in Escherichia coli MG1655. Journal of Bacteriology 185: 5673–5684.
Giaever G., Chu A. M., Ni L., et al. 2002. Functional profiling of the Saccharomyces cerevisiae genome. Nature 419: 387-391.
Gofieau A., Barrell B. G., Bussey H., Davis, R. W., Dujon, B. et al. 1996. Life with 6000 genes. Science 274(5287): 546, 563-567.
Gustafson A. M., Snitkin E. S., Parker S. C., DeLisi C. & Kasif S. 2006. Towards the identification of essential genes using targeted genome sequencing and comparative analysis. BMC Genomics 7: 1-16.
Hakes L., Pinney J. W., Robertson D. L. & Lovell S. C. 2008. Protein-protein interaction networks and biology - what’s the connection? Nature Biotechnology 26: 69-72.
Hudault S., Guignot J. & Servin A. L. 2001. Escherichia coli strains colonising the gastrointestinal tract protect germfree mice against Salmonella typhimurium infection. Gut 49: 47–55.
Junker B. H. & Schreiber F. 2008. Analysis of biological networks. Hoboken, NJ: John Wiley & Sons, Inc.Lee P. H., Tsai J. J. P., Fand J. F. & Ng K. L. 2005. Study of protein-protein interaction networks via random graph
approach. Fourth IEEE Conference of Cognitive Informatics pp. 110-119.Masters T. 1995. Advanced algorithms for neural networks: A C++ sourcebook. New York: John Wiley & Sons, Inc.Newman M. E. J. 2002. Assortative mixing in networks. Physical Review Letters 89: 208701-1-208701-4.Ng K. L. & Huang C.-H. 2004. A cross-species study of the protein-protein interaction networks via the random
graph approach. Fourth IEEE Symposium on Bioinformatics and Bioengineering, pp. 561-567.Piraveenan M., Prokopenko M. & Zomaya A. Y. 2009. Local assortativity and growth of internet. The European
Physical Journal B 70: 275-285.Piraveenan M., Prokopenko M. & Zomaya A. Y. 2012. Assortative mixing in directed biological networks. IEEE
Transactions on Computational Biology and Bioinformatics 9: 66–78.Roemer T., Jiang B., Davison J., Ketela, T., Veillette, K. et al. 2003. Large-scale essential gene identification in
candida albicans and applications to antifungal drug discovery. Molecular Microbiology 50: 167–181.Seringhaus M., Paccanaro A., Borneman A., Snyder M. & Gerstein M. 2006. Predicting essential genes in fungal
genomes. Genome Research 12: 1126-1135.Silva J. P. M. D., Acencio M. L., Mombach J. C. M., et al. 2008. In silico network topology-based prediction of gene
essentiality. Physica A 387: 1049-1055.Specht D. F. 1988. Probability neural networks for classification, mapping or associative memory. Proc. IEEE
International Conference on Neural Networks, pp. 525 - 532.Specht D. F. 1990. Probabilistic neural networks and the polynomial adaline as complementary techniques for
classification. IEEE Transactions on Neural Networks 1: 111-121.Taheri J. & Zomaya A. Y. 2006a. An overview of neural network models. Handbook of Bioinspired Algorithms and
Applications. Boca Raton, Florida: Chapman & Hall/CRC Press.Taheri J. & Zomaya A. Y. 2006b. Artificial neural networks. Handbook of Nature-Inspired and Innovative Computing.
New York: Springer Science + Business Media Inc.Vogt R. L. & Dippold L. 2005. Escherichia coli O157:H7 outbreak associated with consumption of ground beef,
June–July 2002. Public Health Reports 120: 174-178.Wagner A. 2003. How the global structure of protein interaction networks evolves. Proc. R. Soc. Lond. B Biol. Sci.
270: 457–466.Xenarios I., Rice D. W., Salwinski L., et al. 2000. DIP: the database of interacting proteins. Nucleic Acids Research
28: 289-291.Zhang R., Ou H.-Y. & Zhang C.T. 2004. DEG: A database of essential genes. Nucleic Acids Research 32: D271-D272.

26
Sakhinah Abu Bakar, Javid Taheri & Albert Y Zomaya
1Pusat Pengajian Sains MatematikFakulti Sains dan TeknologiUniversiti Kebangsaan Malaysia43600 UKM BangiSelangor DE, MALAYSIAE-mail: [email protected]*
2School of Information TechnologiesFaculty of Engineering and ITThe University of SydneyNSW 2006, AUSTRALIAE-mail: [email protected], [email protected]
___________________*Corresponding author