Chapters 4 and 5 “Demand, Supply, and Market Equilibrium”
138
Chapters 4 and 5 “Demand, Supply, and Market Equilibrium”
-
Upload
albert-tucker -
Category
Documents
-
view
219 -
download
0
Transcript of Chapters 4 and 5 “Demand, Supply, and Market Equilibrium”

Chapters 4 and 5
“Demand, Supply, and Market Equilibrium”

Introduction to Demand• In the United States, the forces of supply
and demand work together to set prices. • Demand is the desire, willingness, and
ability to buy a good or service.– Demand refers to individual consumers or
the total demand of all consumers in the market (market demand).
• Based on that definition, which of the following do you have a demand for?
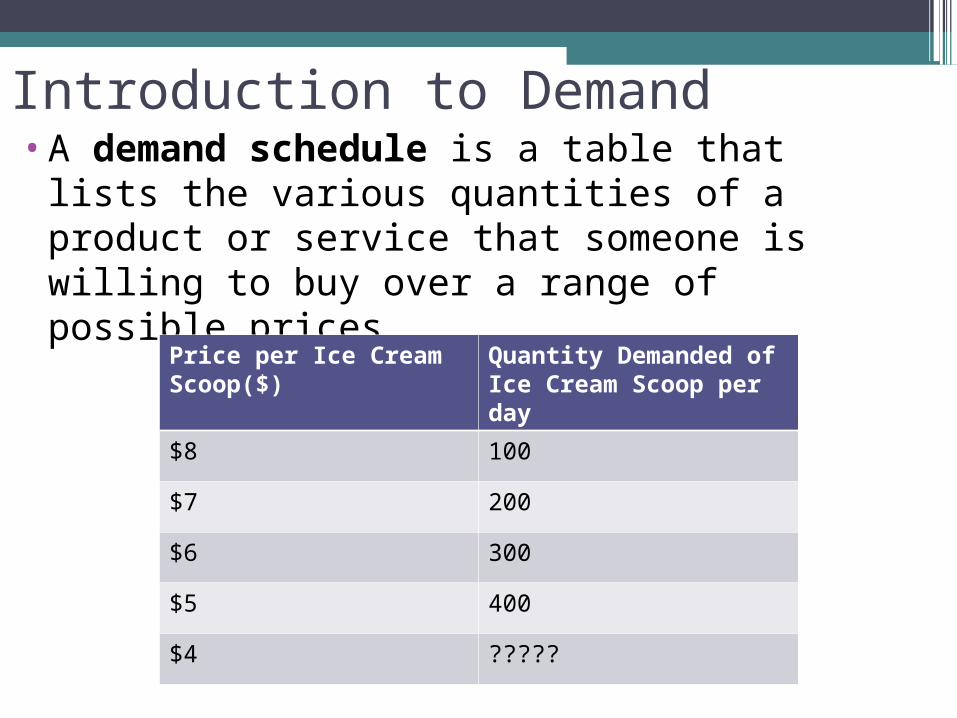
Introduction to Demand•A demand schedule is a table that lists
the various quantities of a product or service that someone is willing to buy over a range of possible prices.
Price per Ice Cream Scoop($)
Quantity Demanded of Ice Cream Scoop per day
$8 100
$7 200
$6 300
$5 400
$4 ?????
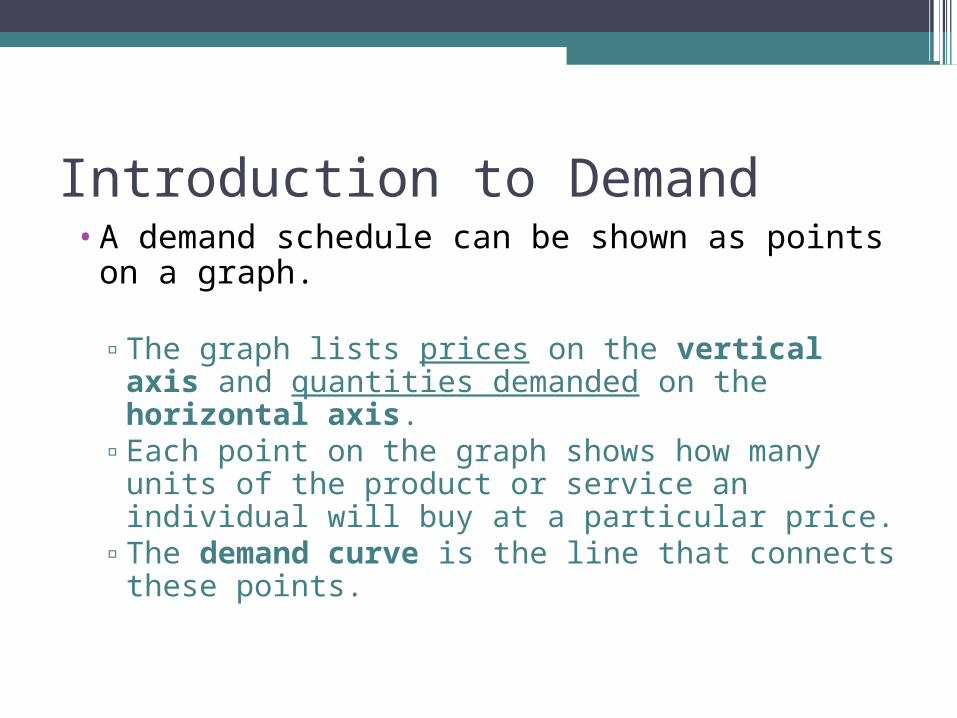
Introduction to Demand•A demand schedule can be shown as points
on a graph.
▫The graph lists prices on the vertical axis and quantities demanded on the horizontal axis.
▫Each point on the graph shows how many units of the product or service an individual will buy at a particular price.
▫The demand curve is the line that connects these points.
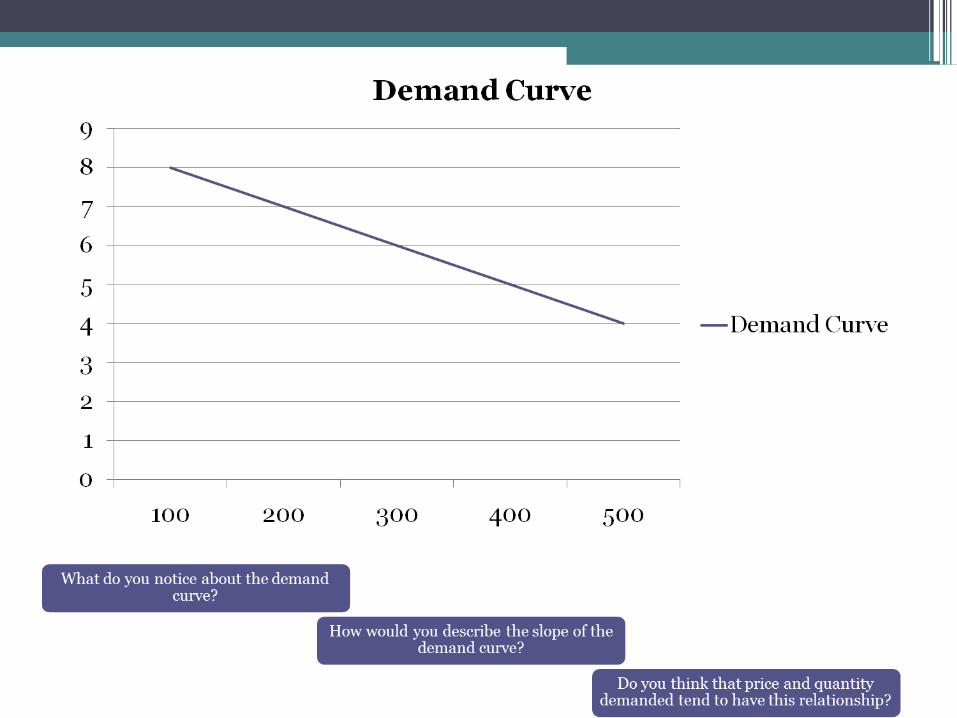
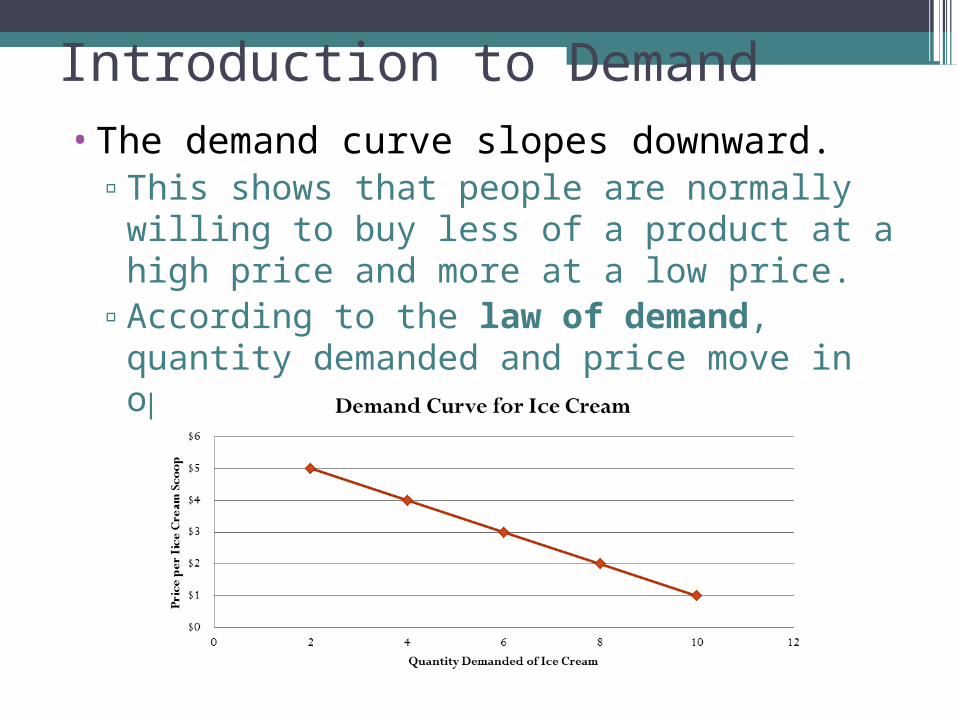
Introduction to Demand•The demand curve slopes downward.
▫This shows that people are normally willing to buy less of a product at a high price and more at a low price.
▫According to the law of demand, quantity demanded and price move in opposite directions.

Introduction to Demand• We buy products for their utility- the
pleasure, usefulness, or satisfaction they give us.
• What is your utility for the following products? (Measure your utility by the maximum amount you would be willing to pay for this product)
• White boards


Introduction to Demand• One reason the demand curve slopes
downward is due to diminish marginal utility
– The principle of diminishing marginal utility says that our additional satisfaction tends to go down as we consume more and more units.
• To make a buying decision, we consider whether the satisfaction we expect to gain is worth the money we must give up. (Opportunity cost)

Changes in Demand•Change in the quantity demanded due to
a price change occurs ALONG the demand curve
•An increase in the Price of Ice Cream from $3 to $4 will lead to a decrease in the Quantity Demanded of scoops from 6 to 4.

A Penny Costs Almost Twice Its Value To MakeDaily News Article: December 16, 2014
The US Mint cut the cost of making the penny by nearly a third over the past two years, but the copper coated coin still costs more that a cent to produce.A new report shows the cost to produce a penny was 1.7 cents in the 2014 fiscal year. That’s down from 2.4 cents in 2011 but still more than face value. The nickel, too, is dead weight for taxpayers. Production costs stood at 8 cents last year, down from 11 cents. The lower cost per coin is largely a result of rising production and reduced metal costs.Other coins turn a profit. A dime costs 3.9 cents to make and a quarter 9 cents. The Mint suggest changing the metallic content of the coins. This would save taxpayers $5 million to $57 million a year. Owners of vending machines, amusement, laundry, and other group with coin operated machines warn that it could cost them billions to reconfigure machinery and make adjustments.The Mint could save $52.9 million if it simply eliminated the penny. That’s what Canada and the United Kingdom and other countries have done.What do you think the United States should do?

Demand
1. If the demand is high for a product what happens to prices? Supply?
2. Why is the Iphone 6 in such high demand? Explain.
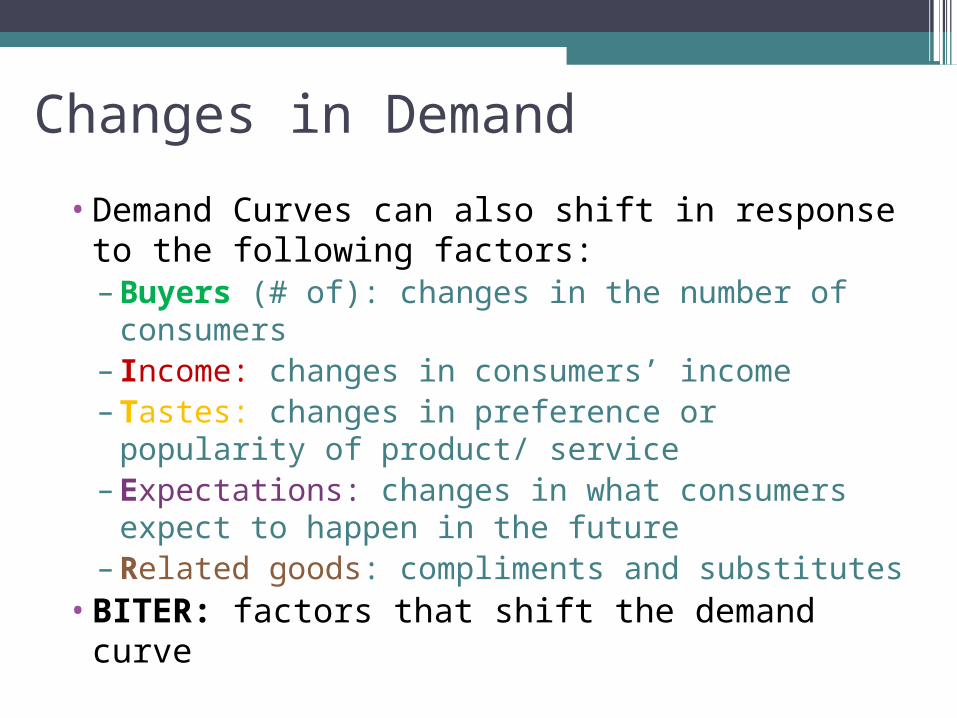
Changes in Demand
• Demand Curves can also shift in response to the following factors:– Buyers (# of): changes in the number of
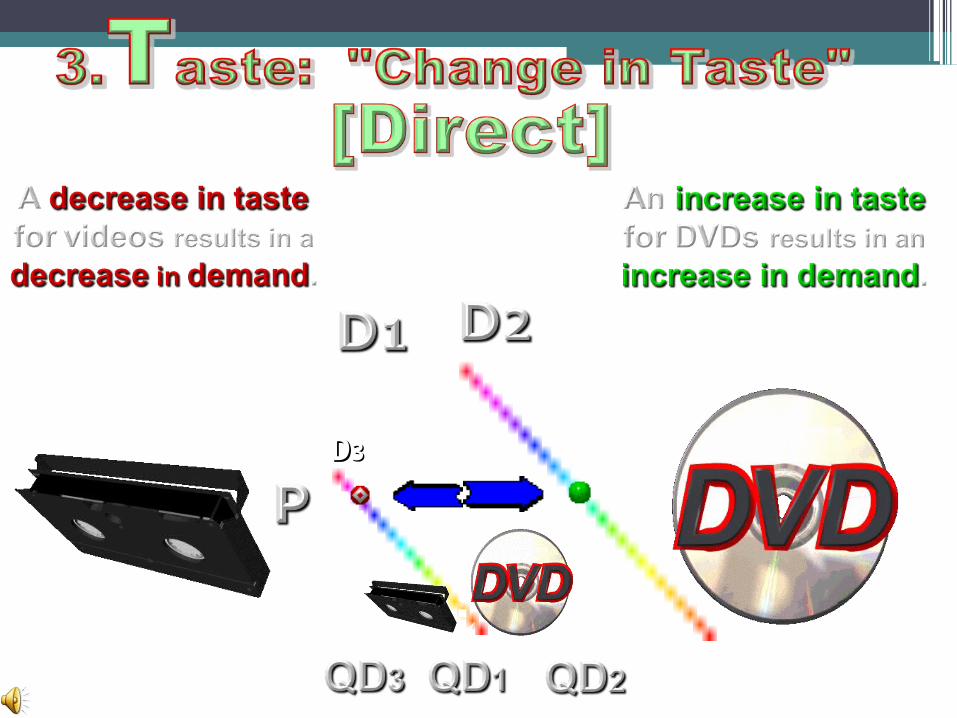
consumers– Income: changes in consumers’ income– Tastes: changes in preference or popularity
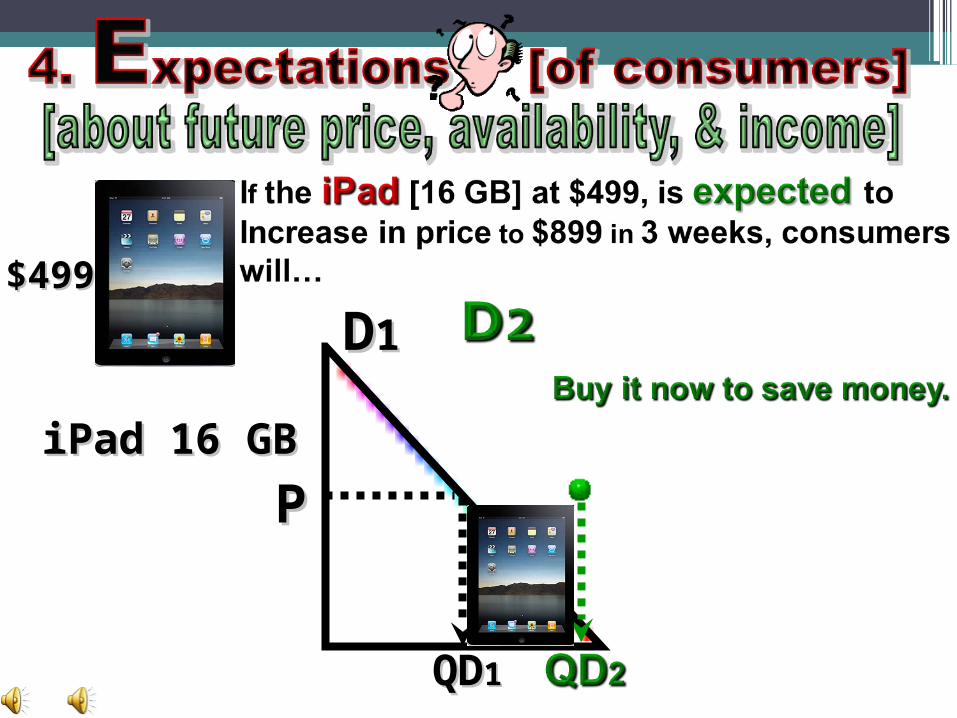
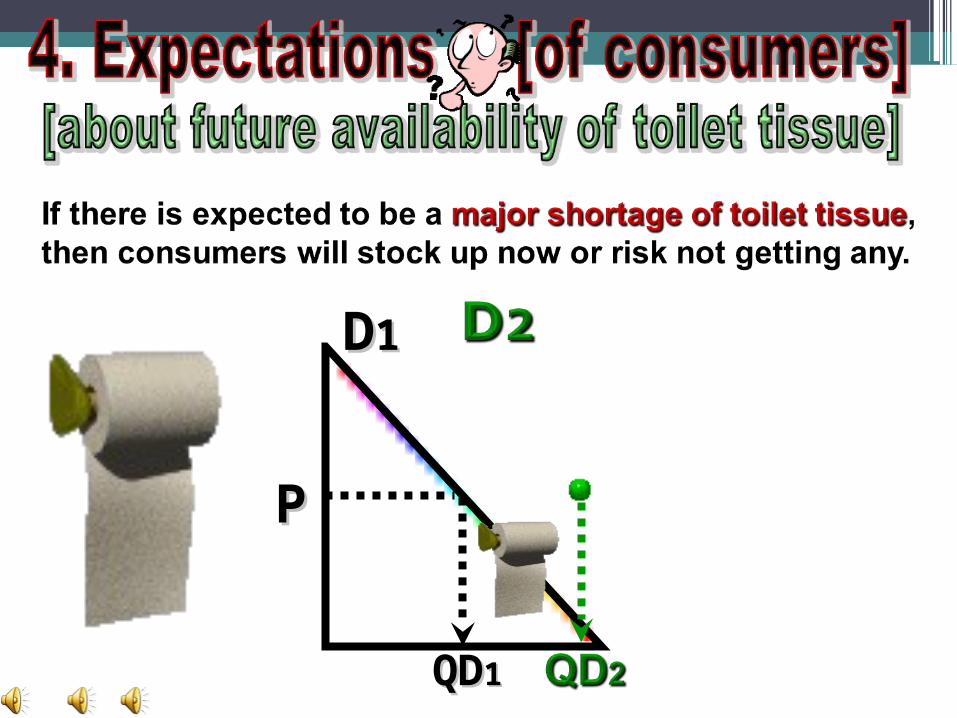
of product/ service– Expectations: changes in what consumers
expect to happen in the future– Related goods: compliments and substitutes
• BITER: factors that shift the demand curve

Changes in Demand• Prices of related goods affect on demand
– Substitute goods a substitute is a product that can be used in the place of another. • The price of the substitute good and demand for the
other good are directly related• For example, Coke Price Pepsi Demand
– Complementary goods a compliment is a good that goes well with another good.• When goods are complements, there is an inverse
relationship between the price of one and the demand for the other
• For example, Computers Software

DD11 DD22
PP
QDQD11 QDQD22
More demandMore demandfor both normalfor both normal& & inferior goodsinferior goods
New CarsNew Cars
Used CarsUsed Cars

PPMore incomeMore income
results inresults inmore demandmore demandfor new cars;for new cars;less demandless demandfor used cars.for used cars.
New CarsNew Cars Used CarsUsed Cars
Less incomeLess incomeresults inresults in
more demandmore demandfor used cars;for used cars;less demandless demandfor new cars.for new cars.
DD33

DD11
PP
Dark Chocolate: Half A Bar Per Week May Keep Heart Attack Risk At Bay.
DD11
PP
QDQD11
iPad 16 GBiPad 16 GB
$499$499
DD11
PP
QDQD11

DD11
PP
QDQD11

DD11
DD22
PP
QDQD11
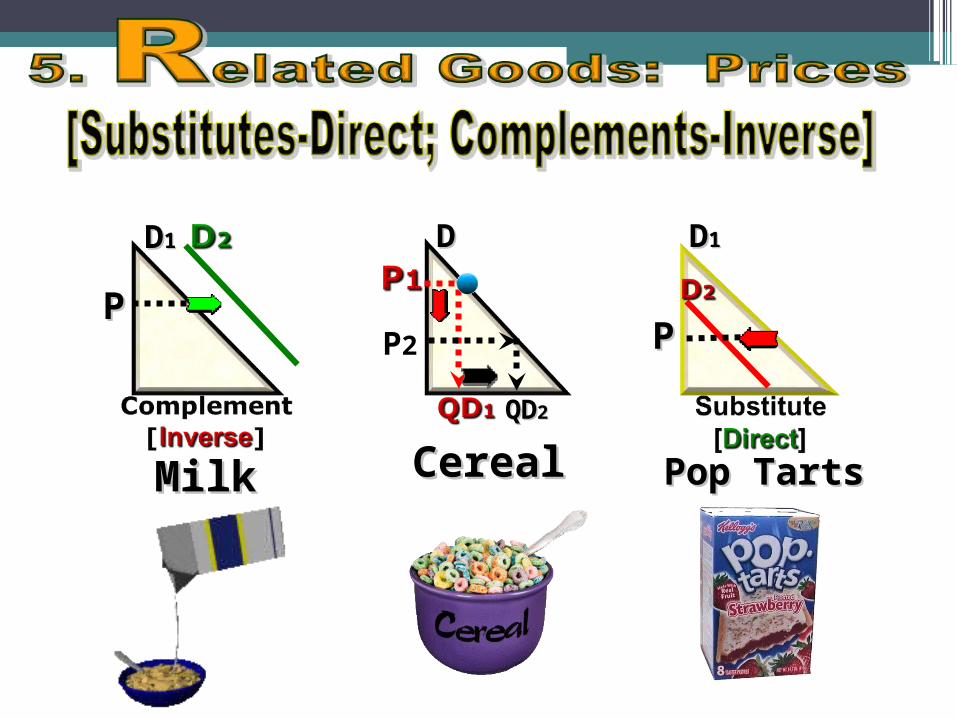
MilkMilk CerealCereal Pop TartsPop Tarts
DD11
PPP2
DD11DD
PP
QDQD22
What is Quantity Demanded?
•The amount of goods which would be demanded at a particular price. If non-price factors that could influence demand are removed, then the higher the price of a good the lower the quantity of that good will be demanded.

What is Quantity?
• refers to the entire relationship between prices and the quantity of this product or service that people want at each of these prices. • should be thought of as "the demand curve."

Review:
How do the following newspaper headlines cause a change in the demand for BEEF? Use a non price determinant (BITER) to help you answer each questions.
“The Price of Beef Set To Rise In June”Will the quantity demanded of beef increase or decrease? Why?

“Millions of Aliens Swell US Population”Will the quantity demanded of beef increase or decrease? Why? “Pork Prices Drop”Will the quantity demanded of beef increase or decrease? Why? “Charcoal shortage threatens Memorial Day Cookouts”Will the quantity demanded of beef increase or decrease? Why?

“Minimum Wage Set To Increase To $8.00 Per Hour.”Will the quantity demanded of beef increase or decrease? Why?
“Beef is Proven To Cause Alzheimer’s Disease”Will the quantity demanded of beef increase or decrease? Why?

Changes in Demand
Changes in any of the factors other than price causes the demand curve to shift either:
•Decrease in Demand shifts to the Left (Less demanded at each price)
OR•Increase in Demand shifts to the Right
(More demanded at each price)
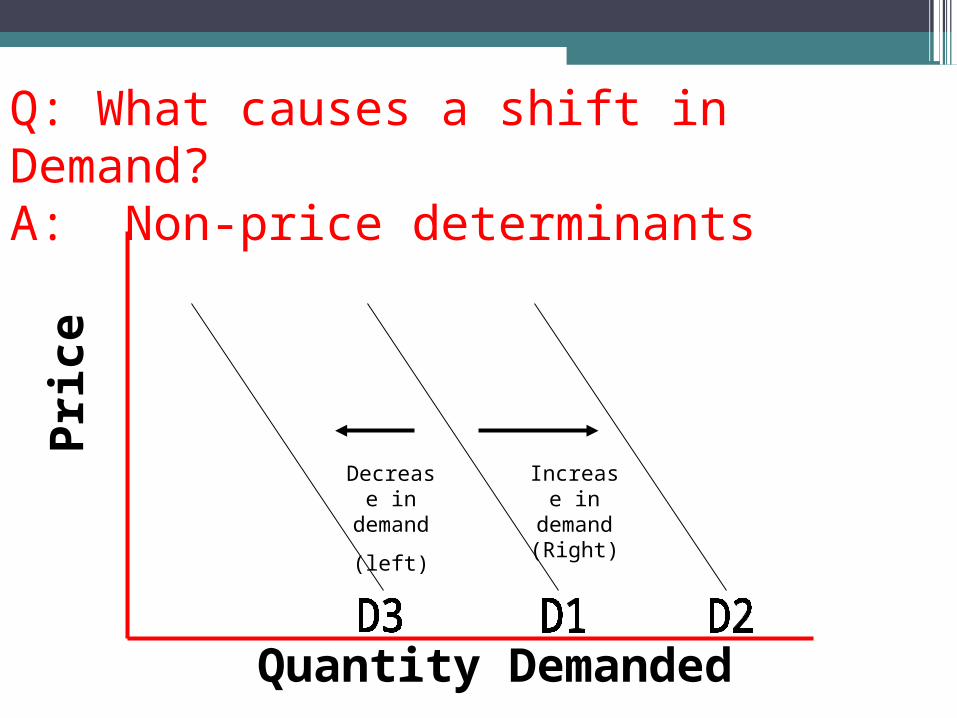
Q: What causes a shift in Demand?A: Non-price determinants
Pri
ce
Quantity Demanded
Decrease in
demand
(left)
Increase in
demand (Right)

1. The income of the Pago-Pagans declines after a typhoon hits the island. The people on this island make boomerangs.
Quantity
Price
DD1

2. Pago-Pagan is named one of the most beautiful islands in the world and tourism to the island doubles.
Quantity
Price
DD1

3. The price of Frisbees decreases. (Frisbees are a substitute good for boomerangs) What happens to the sale of boomerangs?
Quantity
Price
DD1
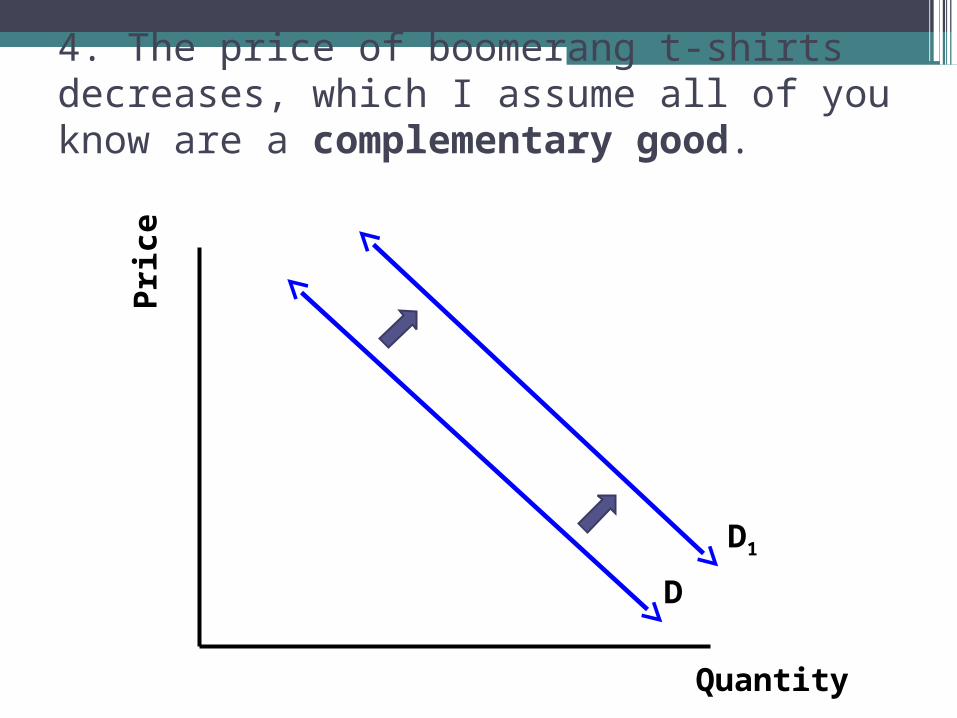
4. The price of boomerang t-shirts decreases, which I assume all of you know are a complementary good.
Quantity
Price
D
D1

5. The Boomerang Manufactures decide to add a money back guarantee on their product, which increases the popularity for them.
Quantity
Price
D
D1

6. Many Pago-pagans begin to believe that they may lose their jobs in the near future. (Think expectations!)
Quantity
Price
DD1

7. Come up with your own story about boomerangs and the Pago-Pagans. Write down the story, draw the change in demand based on the story, and explain why demand changed.
Quantity
Price
D
Economics in the News
•Cuba and The Interview

Demand Review:
Demand is an inverse relationship:Low Price = High DemandHigh Price = Low Demand

Change in Price is a Change in Quantity Demanded

Non price determinant can shift the demand curve. BITER

Law Of Diminishing Marginal Utility• A law of economics stating that as a person
increases consumption of a product - while keeping consumption of other products constant - there is a decline in the marginal utility that person derives from consuming each additional unit of that product.
Ex: It is lunch time and you are starving. The first bite of food tastes sooo good. Every bite after the utility or satisfaction becomes less and less. At the end you are stuffed and the last bite has little utility of satisfaction.

Demand Video

Worksheets

Elasticity of Demand

The law of demand tells us that consumers will respond to a decline in
a product’s price by buying more of that product.
But how much more of it will they But how much more of it will they purchase?purchase?
That amount can vary considerably by product and over different price ranges for the same product.

The responsiveness, or sensitivity, of quantity
demanded to a change in the price of a product is
measured by the concept of
PRICE ELASTICITY OF PRICE ELASTICITY OF DEMAND.DEMAND.
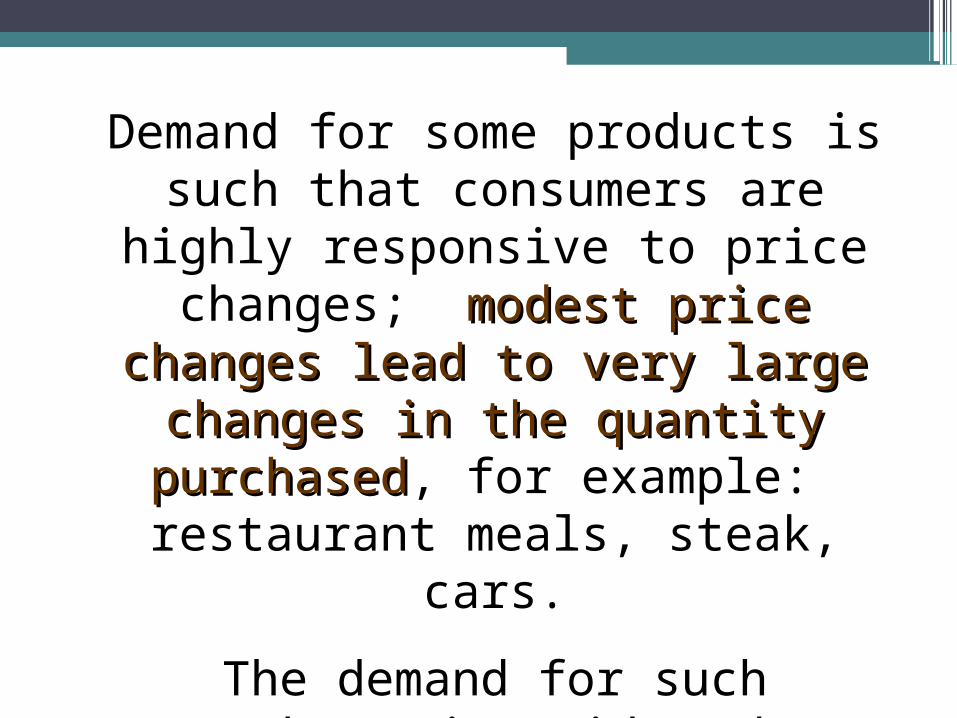
Demand for some products is such that consumers are highly responsive
to price changes; modest price modest price changes lead to very large changes changes lead to very large changes
in the quantity purchasedin the quantity purchased, for example: restaurant meals, steak,
cars.
The demand for such products is said to be relatively elastic, or simply
ELASTICELASTIC.

For other products, consumers are quite unresponsive to price
changes; substantial price substantial price changes result in only small changes result in only small
changes in the amount changes in the amount purchasedpurchased, for example: salt, milk,
soap.
For such products, demand is relatively inelastic or simply
INELASTICINELASTIC.
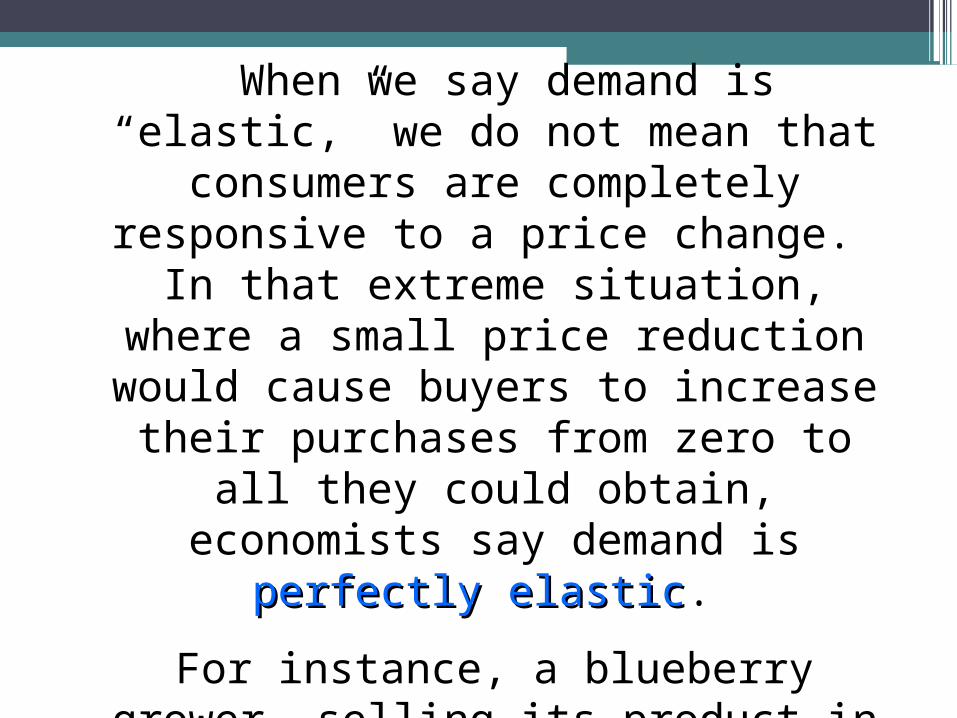
When we say demand is “elastic,” we do not mean that consumers are completely
responsive to a price change. In that extreme situation, where a small price
reduction would cause buyers to increase their purchases from zero to all they could
obtain, economists say demand is perfectly elasticperfectly elastic.
For instance, a blueberry grower, selling its product in a purely competitive market.

When we say demand is “inelastic,” we do not mean that consumers are
completely unresponsive to a price change. In that extreme situation, where a price change results in no change whatsoever in the quantity
demanded, economist say that demand is perfectly inelasticperfectly inelastic.
Examples include an acute diabetic’s demand for insulin

Determinants of Demand Elasticity1. Can the purchase be delayed?A. Are adequate substitutes available?B. Does purchase use a large portion of
income?
If you say yes to two or more, the good is elastic.
Take a look at the chart on page 106

2.Are there available Substitutes?2.Are there available Substitutes?
The largerlarger the number of close substitutes, the greater the elasticitygreater the elasticity. If
the price increases, consumers may select a relatively lower-priced substitute
instead.
Examples may include:
•Butter => Margarine
•Pepsi => Coca Cola
•Texaco gasoline => BP gasoline

3.Luxuries vs Necessities3.Luxuries vs Necessities
Dependent on incomeDependent on income
The demand for “necessities” tends to be price-inelastic; that for “luxuries” price-elastic. A price increase will not significantly affect the amount of
a necessity consumed. If the price of a luxury rises, an individual need not buy them and will
suffer no great hardship without them.
Examples (necessities):
•Bread
•Electricity
•Appendectomy
Examples (Luxuries):
•Caribbean cruise
•Emerald ring
•Lexus

The Amount of Time Since the Price The Amount of Time Since the Price ChangeChange
The moremore time that people have to adapt to a new price change, the greater its greater its
elasticity of demandelasticity of demand. Immediately after a price change, consumers may be unable
to locate good alternatives or easily change their consumption patterns.

Elastic or Inelastic demand?
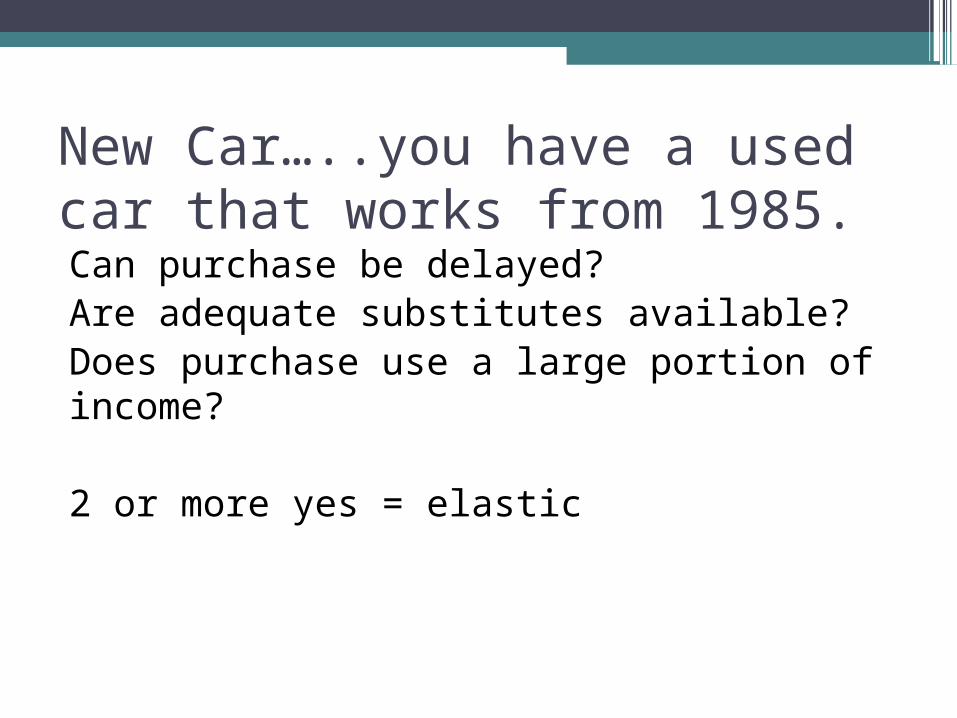
New Car…..you have a used car that works from 1985. Can purchase be delayed?Are adequate substitutes available?Does purchase use a large portion of income?
2 or more yes = elastic

Gas to heat your home
Can purchase be delayed?Are adequate substitutes available?Does purchase use a large portion of income?
2 or more yes = elastic

Vacation to Italy
Can purchase be delayed?Are adequate substitutes available?Does purchase use a large portion of income?
2 or more yes = elastic
Which of the following will cause an “Increase in Demand” for digital cameras?•A. Decrease in price of the cameras
B. Increase in IncomesC. Decrease in IncomesD. Increase in Price of the Cameras

Which of the following will cause an “increase in Quantity Demanded”?
•A. Increase in price of cameras•B. Decrease in price of cameras•C. Increase in Incomes•D. Decrease in price of camcorders

Which of the following will cause a “decrease in demand” for scanners?•A. Increase in price of scanners•B. Decrease in price of scanners•C. Decrease in number of consumers
Which of the following will cause a “decrease in Quantity Demanded” for scanners?•A. Decrease in price of scanners•B. Increase in price of scanners•C. Decrease in number of consumers

Which of the following will not cause the demand for Snickers to change (shift)?
•A. A change in price of Snickers.•B. A change in price of Hershey Bars•C. An increase in consumer incomes•D. A decrease in consumer incomes

Which of the following will not shift the demand curve for beef?
•A. A widely publicized study which indicates beef increases one’s cholesterol
•B. A reduction in the price of beef•C. An effective advertising campaign by
pork producers•D. A change in the incomes of beef
consumers

“When the price of product falls, the purchasing power of our money income rises and thus permits us to purchase more of the product”
•1. An inferior good•2. The income effect•3. The substitution effect•4. The law of supply
If the price of Coke increases, the demand curve for Pepsi will?•A. Shift to the right•B. Decrease•C. Shift to the left•D. Remain unchanged
An decrease in demand means that•1. given supply, the price of the product
can be expected to decline•2. the demand curve has shifted to the
left•3. Price has declined a consumers
therefore want to purchase more of the product
•4. The demand curve has shifted to the right.

An increase in Quantity Demanded means that…•1. Given supply, the price of the product
can be expected to decline•2. Price has declined and consumers
therefore want to purchase more of the product
•3. The demand curve has shifted to the right

Elasticity of Demand
•The degree to which changes in price cause changes in demand
or•If we change the price, will demand
change a lot or a little?
Elastic Demand•If Demand for a good is very sensitive to changes in price, the demand is ELASTIC
Or•If prices changes a little bit, demand will
change a lot!

Example of Elastic Demand
•Price of pizza goes up even a little bit, demand goes down a lot.
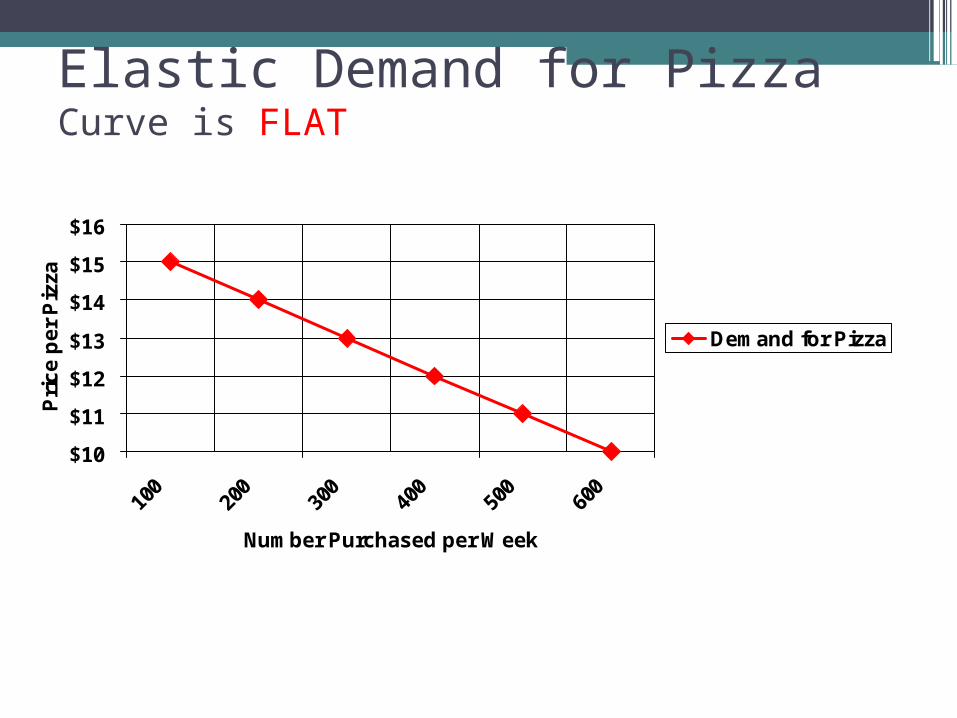
Elastic Demand for PizzaCurve is FLAT
$10
$11
$12
$13
$14
$15
$16
100
200
300
400
500
600
Number Purchased per Week
Pri
ce
pe
r P
izza
Demand for Pizza

Inelastic Demand
•Demand for a good that consumers will continue to buy despite a price increase is INELASTIC
OR•Even if price changes a lot, demand
changes very little

Example of Inelastic Demand
•The price of soap goes up a lot, the demand stays almost the same.

Inelastic Demand for SoapCurve is STEEP
$0.00
$0.50
$1.00
$1.50
$2.00
$2.50
$3.00
$3.50
0 10 20 30 40 50
Quantity Demanded (In Thousands)
Pri
ce p
er B
ar o
f S
oap
Soap

Factors Affecting Elasticity• Several different factors can affect the
elasticity of demand for a certain good.1. Availability of Substitutes
If there are few substitutes for a good, the demand will not likely decrease as price increases (inelastic), the opposite (lots of substitutes) is also usually true (elastic)
Ex. Gasoline has no substitutes- inelastic McDonalds has many (Burger King, etc)- elastic
Factors Affecting Elasticity (Cont.)2. Relative Importance
Another factor determining elasticity of demand is how much of your budget you spend on the good.
Ex. Mortgage payment must be paid (inelastic) Entertainment (movies, etc.) are elastic

Factors Affecting Elasticity (Cont.)3. Necessities vs. Luxuries
Whether a person considers a good to be a necessity or luxury has a great impact on the good’s elasticity of demand for that person.
Ex. Food (inelastic) Jewelry (elastic)
Factors Affecting Elasticity (Cont.)4. Change over Time
Demand sometimes becomes more elastic over time because people can eventually find substitutes.
Ex. Blockbuster used to be the only place to rent videos (inelastic)
Netflix, Video on Demand, Pay Per View, are substitutes for Blockbuster (elastic)

Partner up…Develop review anchor charts on Demand•Be sure to include graphs•Charts•Pictures•All vocabulary including quantity
demanded and demand curve•BITER•Graphs showing an increase in demand and
a decrease in demand.•Inelastic and Elastic Demand graphs and
examples

Smart Start
•What is the economic definition for the word supply?

Introduction to Supply
• Supply refers to the various quantities of a good or service that producers are willing to sell at all possible market prices.
• Supply can refer to the output of one producer or to the total output of all producers in the market (market supply).

Based on….
•Voluntary decisions made by producers

Introduction to Supply
•A supply schedule is a table that shows the quantities producers are willing to supply at various prices
Price per Widget ($) Quantity Supplied of Widget per day
$5 10
$4 8
$3 6
$2 4
$1 2

Vocabulary
•Quantity supplied- amount that producers bring to market at any given price
•Change in quantity supplied- change in the amount offered for sale in response to a change in price.
•Example on page 114
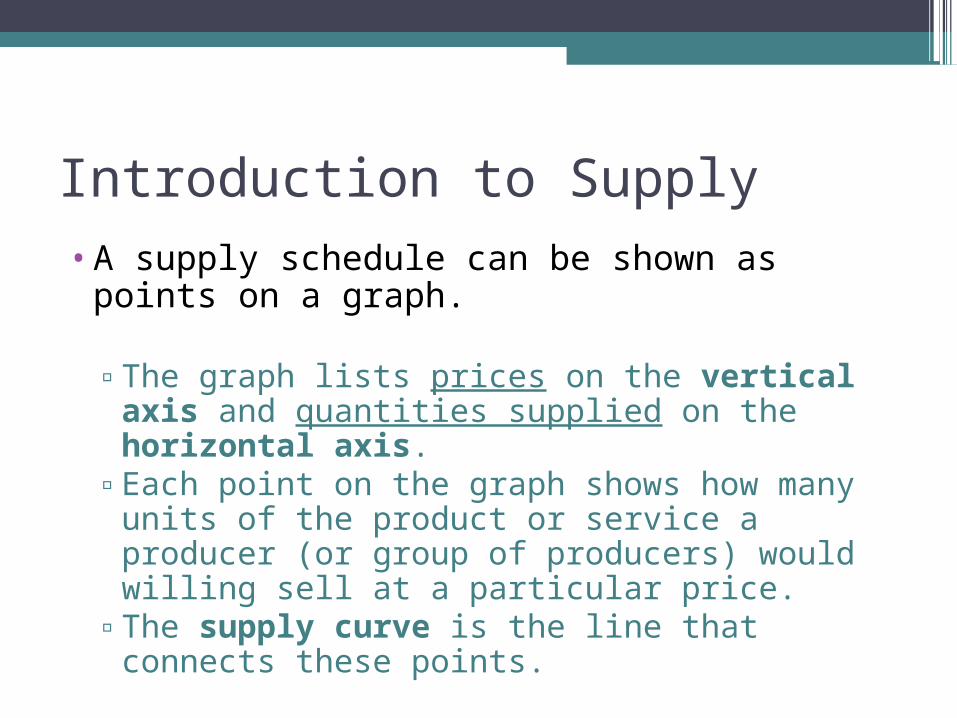
Introduction to Supply•A supply schedule can be shown as points
on a graph.
▫The graph lists prices on the vertical axis and quantities supplied on the horizontal axis.
▫Each point on the graph shows how many units of the product or service a producer (or group of producers) would willing sell at a particular price.
▫The supply curve is the line that connects these points.
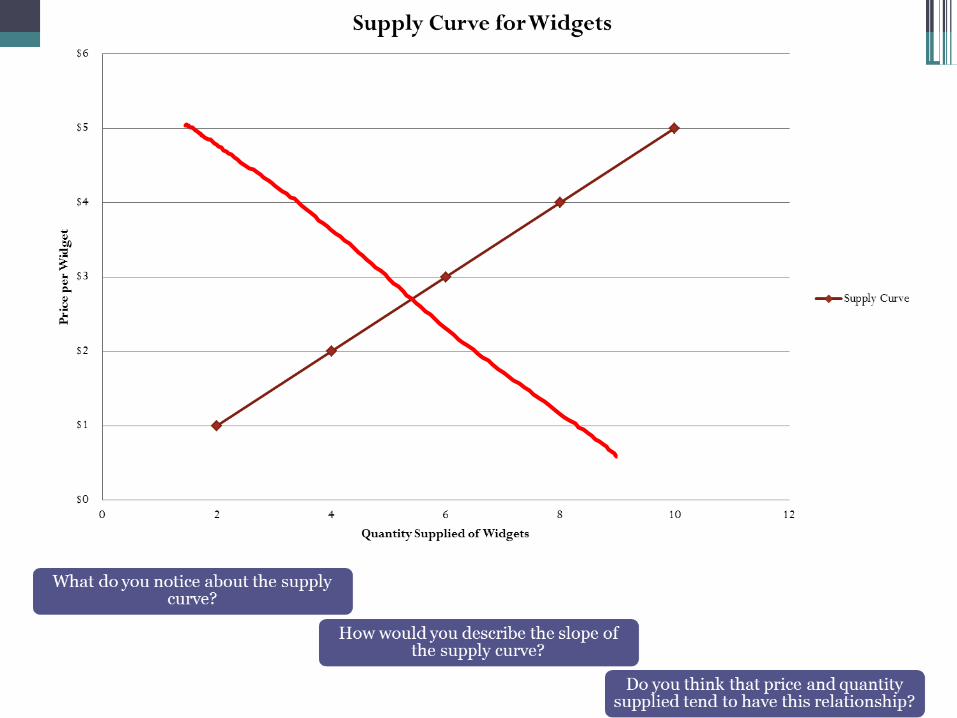

Introduction to Supply
• As the price for a good rises, the quantity supplied rises and the quantity demanded falls. As the price falls, the quantity supplied falls and the quantity demanded rises.
• The law of supply holds that producers will normally offer more for sale at higher prices and less at lower prices.

Introduction to Supply•The reason the supply curve slopes
upward is due to costs and profit. •Producers purchase resources and use
them to produce output.▫Producers will incur costs as they bid
resources away from their alternative uses.

Introduction to Supply
•Businesses provide goods and services hoping to make a profit. ▫ Profit is the money a business has left
over after it covers its costs.▫ Businesses try to sell at prices high
enough to cover their costs with some profit left over.
▫ The higher the price for a good, the more profit a business will make after paying the cost for resources.

Changes in Supply
•If the price of Widgets fell to $2, then the Quantity Supplied would fall to 4 Widgets.
•Change in the quantity supplied due to a price change occurs ALONG the supply curve

Seven Supply Shifters… RATNEST1. Resource Costs….wages and raw materials; if resource costs
decrease, then supply will increase. If resource costs increase, then supply will decrease.
2. Alternative Output Price Change; Supply might increase because there is a decrease in the cost of inputs, such as labor and packaging.
3. Technology Improvements; because cows produce more milk not as many cows are needed.
4. Number of suppliers
5. Expectations about the future price of a product. Producers think the price of their product will go up, they may withhold some of it.
6. Subsidies from government. Free money will encourage suppliers to produce more.
7. Taxes placed on businesses by the government or other countries.
It is a burden and can decrease production which will decrease supply.

Changes in Supply
Changes in any of the factors other than price causes the supply curve to shift either:
•Decrease in Supply shifts to the Left (Less supplied at each price)
OR•Increase in Supply shifts to the Right
(More supplied at each price)

Changes in Supply•Several factors will change the demand for the good (shift the entire demand curve)
•As an example, suppose that there is an improvement in the technology used to produce widgets.
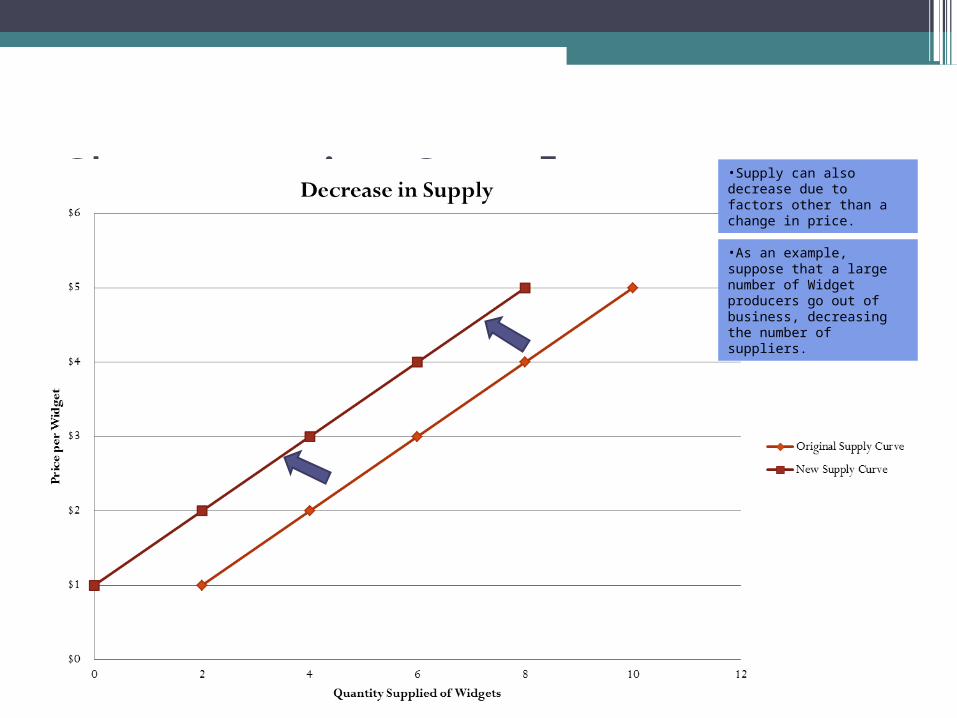
Changes in Supply •Supply can also decrease due to factors other than a change in price.
•As an example, suppose that a large number of Widget producers go out of business, decreasing the number of suppliers.
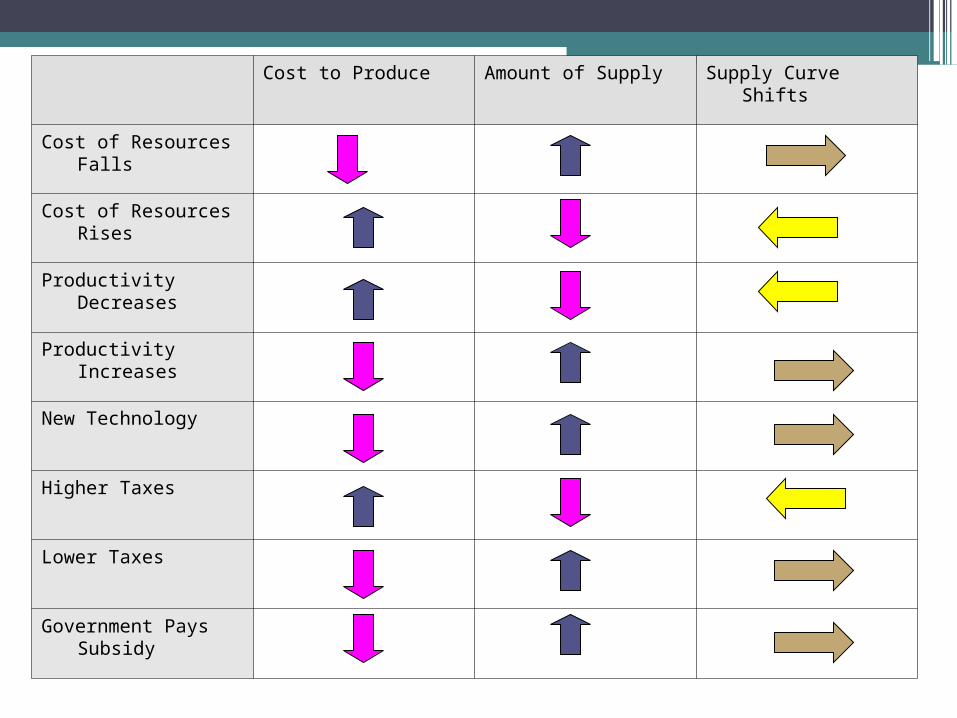
Cost to Produce Amount of Supply Supply Curve Shifts
Cost of Resources Falls
Cost of Resources Rises
Productivity Decreases
Productivity Increases
New Technology
Higher Taxes
Lower Taxes
Government Pays Subsidy

Supply Practice

1. The government of Pago-Paga adds a subsidy to boomerang production.
Quantity
Price
SS1

2. Boomerang producers also produce Frisbees. The price of Frisbees goes up.
Quantity
Price
SS1
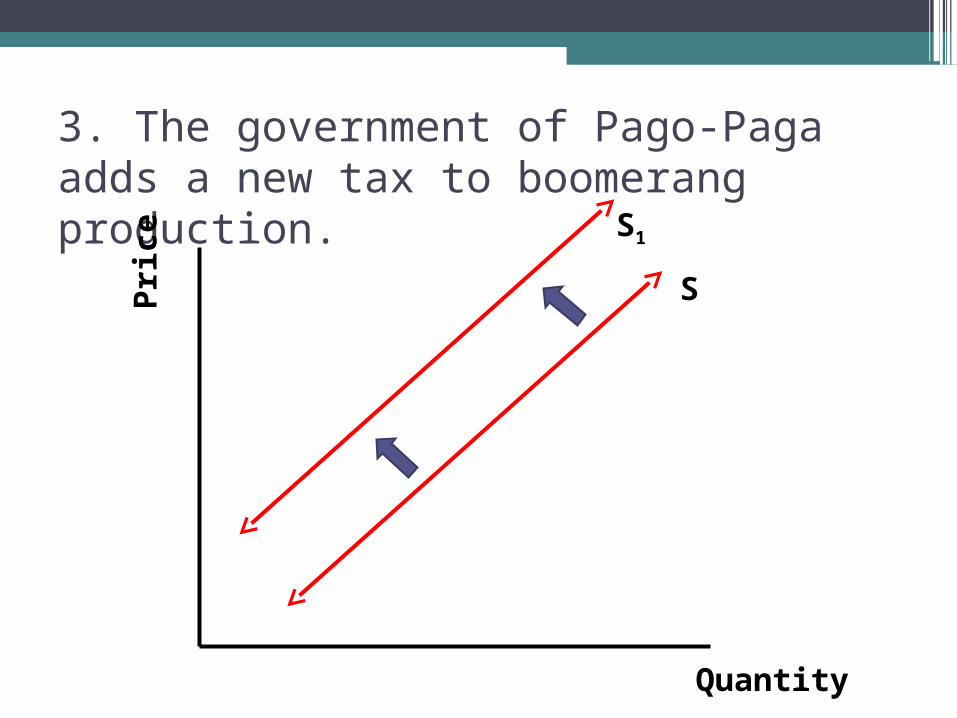
3. The government of Pago-Paga adds a new tax to boomerang production.
Quantity
Price
S
S1
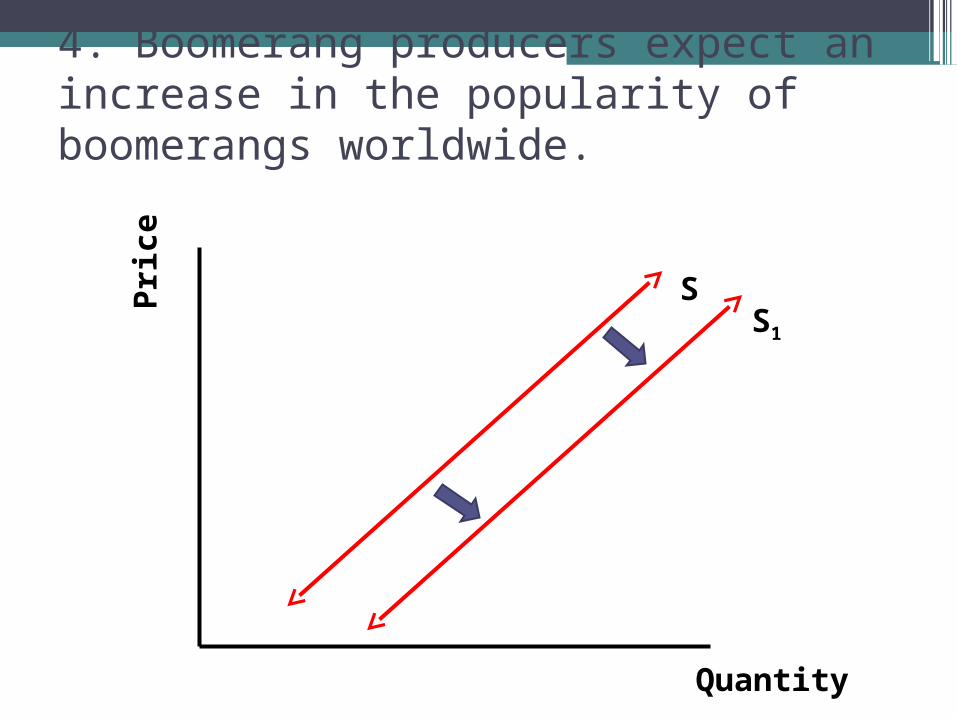
4. Boomerang producers expect an increase in the popularity of boomerangs worldwide.
Quantity
Price
SS1
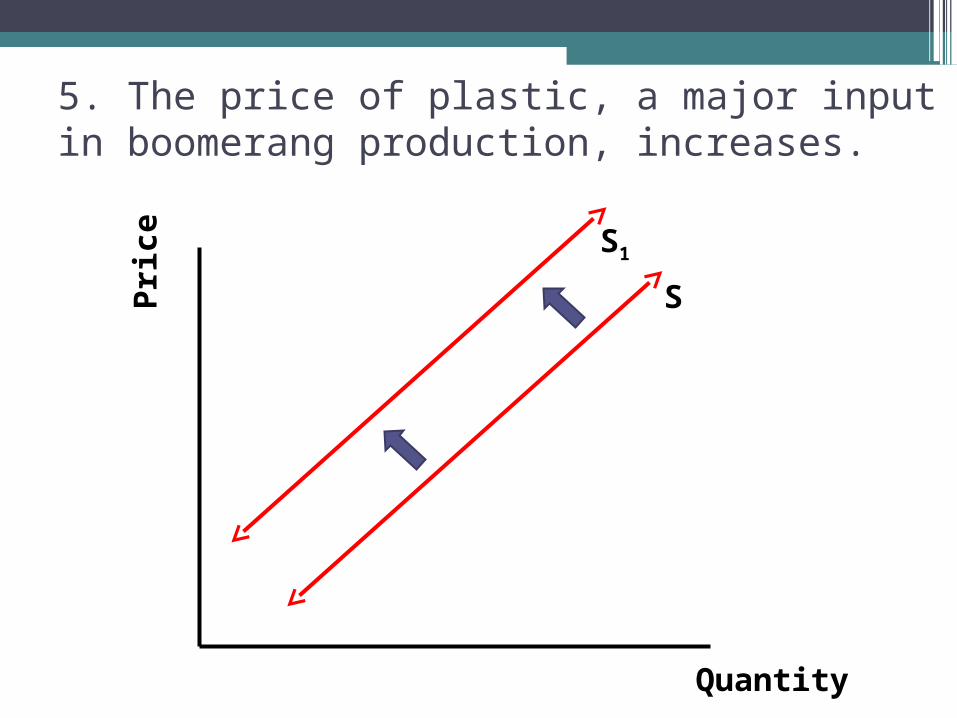
5. The price of plastic, a major input in boomerang production, increases.
Quantity
Price
S
S1

6. Pago-Pagan workers are introduced to coffee as Pago-Paga become integrated into the world market and their productivity increases drastically.
Quantity
Price
SS1
Supply Elasticity •Measure of the way in which quantity
supplied responds to a change in price.•An elastic good is a good that is not
needed. Price is too high, people will not buy the good…..large supply and low demand.

Supply Inelasticity
Supply Inelasticity•A good that is always needed. Supply does not change based on price. Gasoline, soap, milk
Supply and Demand are based on the theory of production.•Factor of production are:
▫Land▫Captial▫Labor▫Entrepreneurship

Factors of Production
•Captial, Labor, Land, and Entrepreneurship are related to the amount of goods and service that are produced.

Short Run
•Short Run: Short production period.•The time is so short that only one variable
input changes. •Variable input: Type of input that can be
changed, such as labor, supply of materials, and amount of money that can be spent on new machinery.
Long Run
•Long run is a production period that is long enough to adjust the amounts of all its resources, including capital goods.
Law of Variable Proportions• The Law of Variable Proportions states that in
the short run, the amount of a product that is produced will change if one kind of input changes while the other kinds of input stay the same.
• For example: A farmer will use this law to find out how crop production will be affected if different amounts of fertilizer are added, but the farm machinery and the size of the field stay the same.
Law of Variable Proportions
•How could a factory manager use the Law of Variable Proportions?

Production Function
•Production Function is the relationship between changes in output and changes in a single input.
Will production at a factory change if you add another worker?
•Example: Worker A produces 7 units of output, Worker A and B produce 20 units. All other input including raw materials stay the same.
Production Function
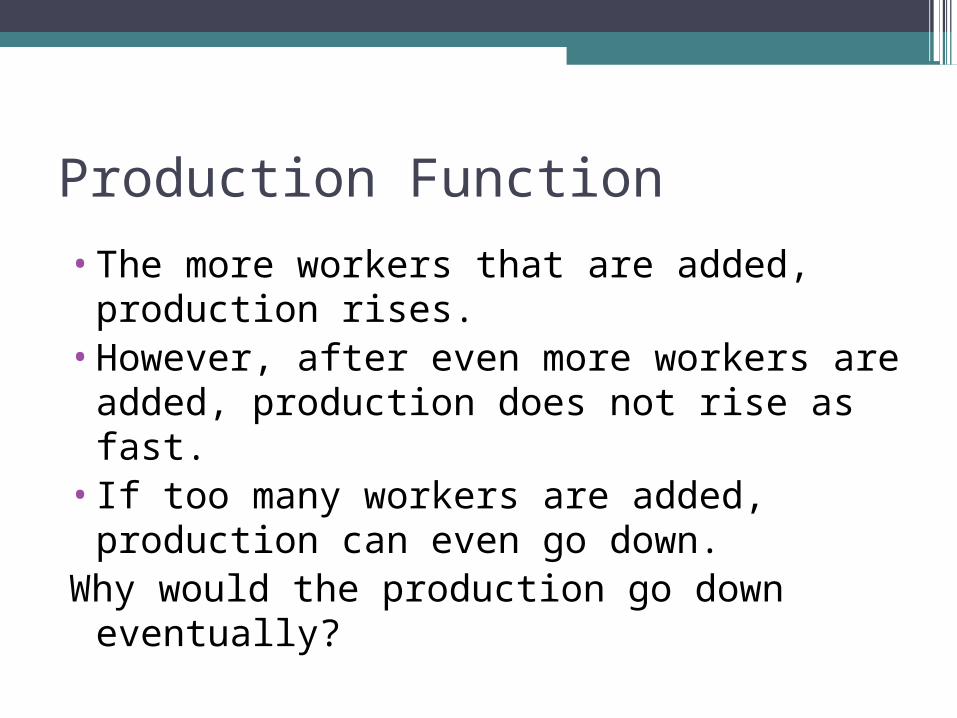
•The more workers that are added, production rises.
•However, after even more workers are added, production does not rise as fast.
• If too many workers are added, production can even go down.
Why would the production go down eventually?

Production Function
•The two most important measures of output are total product and marginal product.
•Total product is the total amount of a product that is produced by a business.
•Marginal product is the extra output produced when one input, such as one more worker or one new machine is added.

Production Function
Based on this example: Worker A produces 7 units of output, Worker A and B produce 20 units. All other input including raw materials stay the same.What would the marginal output be because a second worker was added?

Three Stages of Production• Read pages 125• Create a Chart in your notebook with three columns.• Write a description of each and what variables need to be present
for each to happen.
Increasing Returns
Diminishing Returns
Negative Returns

Stage One: Increasing Returns
•Workers hired cannot work efficiently because there are too many resources per worker.
•As the number of workers increases, they make better use of their machinery and resources.
•This results in increasing returns

Stage Two: Diminishing Returns•Total production keeps growing but by
smaller and smaller amounts. •Any additional workers hired may stock
shelves, package parts, and do other jobs that leave the machine operators free to do their jobs.
•The rate of increase in total production is now starting to slow down.
•Each additional worker, then, is making a diminishing but still positive contribution to total output.

# of Workers
Total Product
Marginal Product
Stages of Production
0 0 0 Stage 1
1 7 7
2 20 13
3 38 18
4 62 24
5 90 28
6 110 20 Stage 2
7 129 19
8 138 9
9 144 6
10 148 4
11 145 -3 Stage 3

Figure 5.5bFigure 5.5b
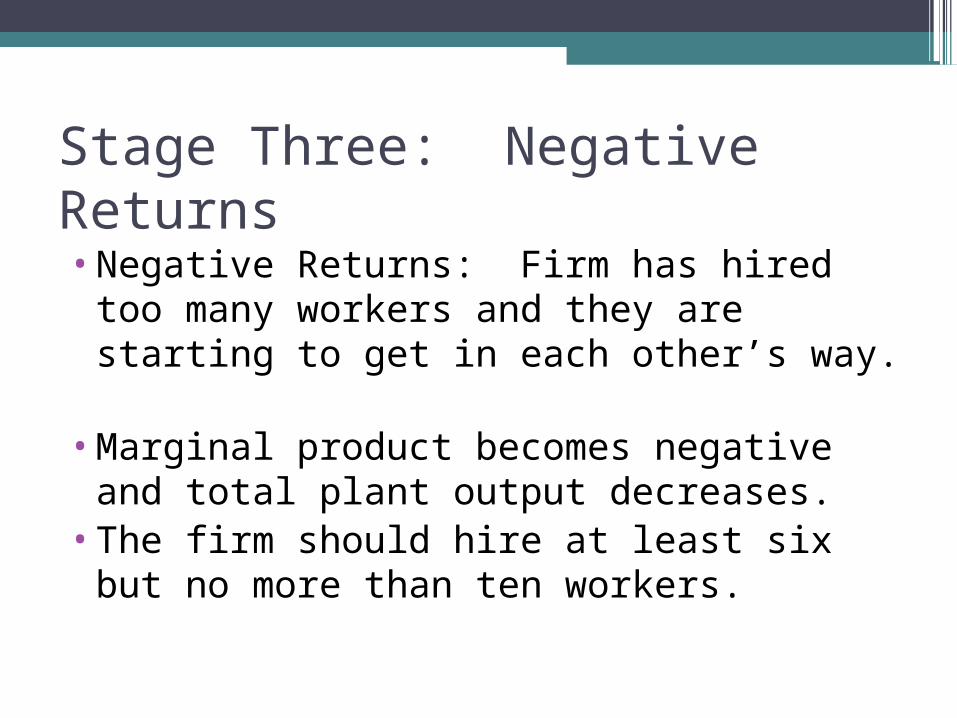
Stage Three: Negative Returns
•Negative Returns: Firm has hired too many workers and they are starting to get in each other’s way.
•Marginal product becomes negative and total plant output decreases.
•The firm should hire at least six but no more than ten workers.
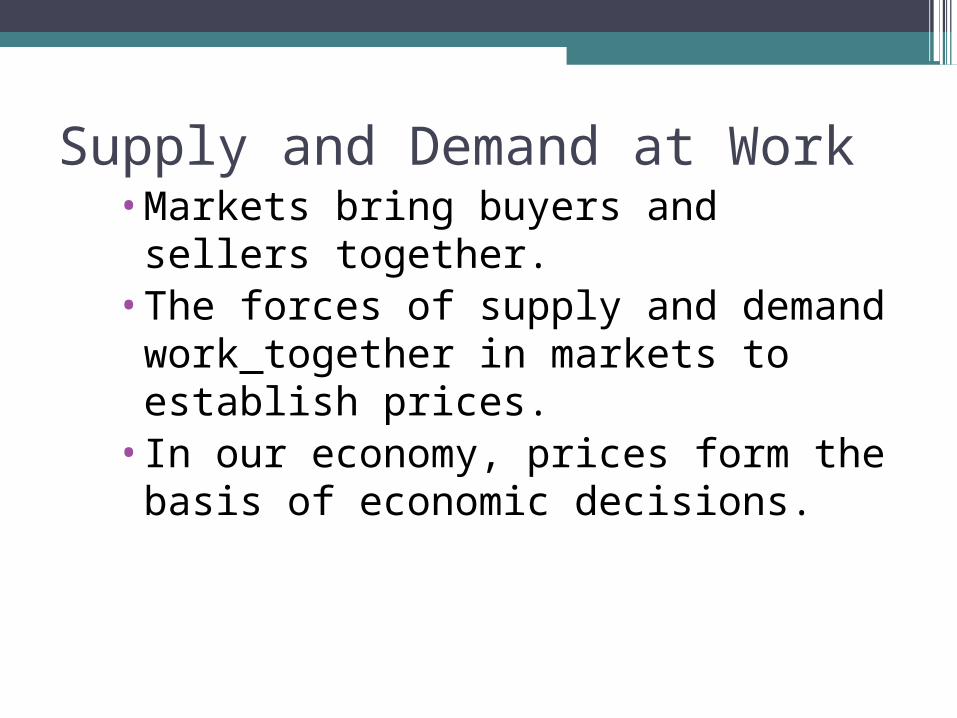
Supply and Demand at Work•Markets bring buyers and sellers
together.•The forces of supply and demand
work together in markets to establish prices.
•In our economy, prices form the basis of economic decisions.

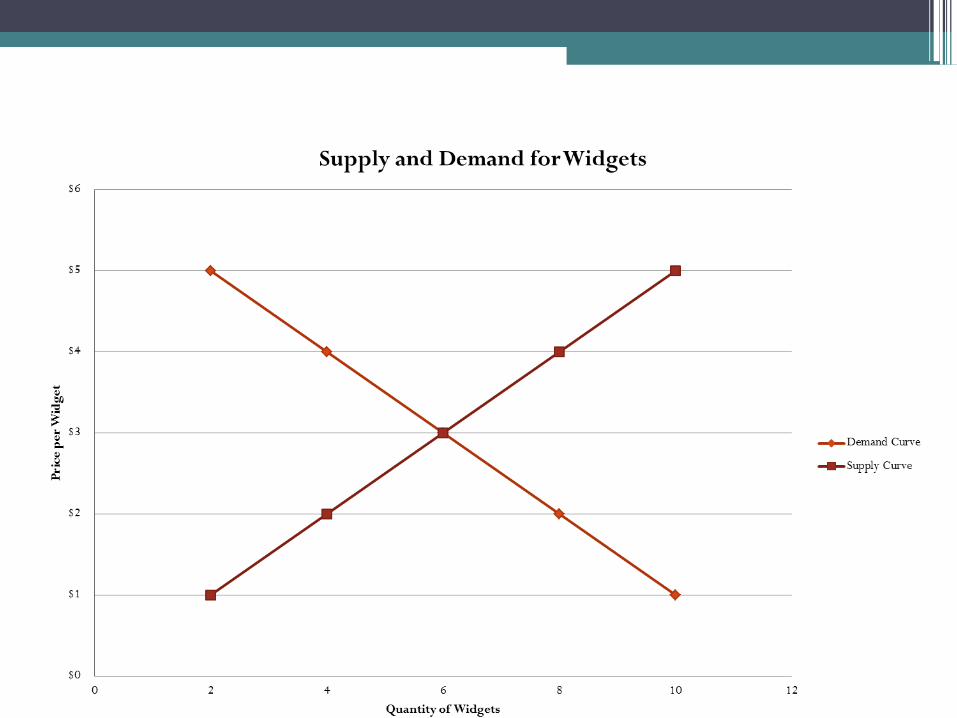
Supply and Demand at Work•Supply and Demand Schedule can be
combined into one chart.
Price per Widget ($)
Quantity Demanded of Widget per day
Quantity Supplied of Widget per day
$5 2 10
$4 4 8
$3 6 6
$2 8 4
$1 10 2
Supply and Demand at Work

Supply and Demand at Work
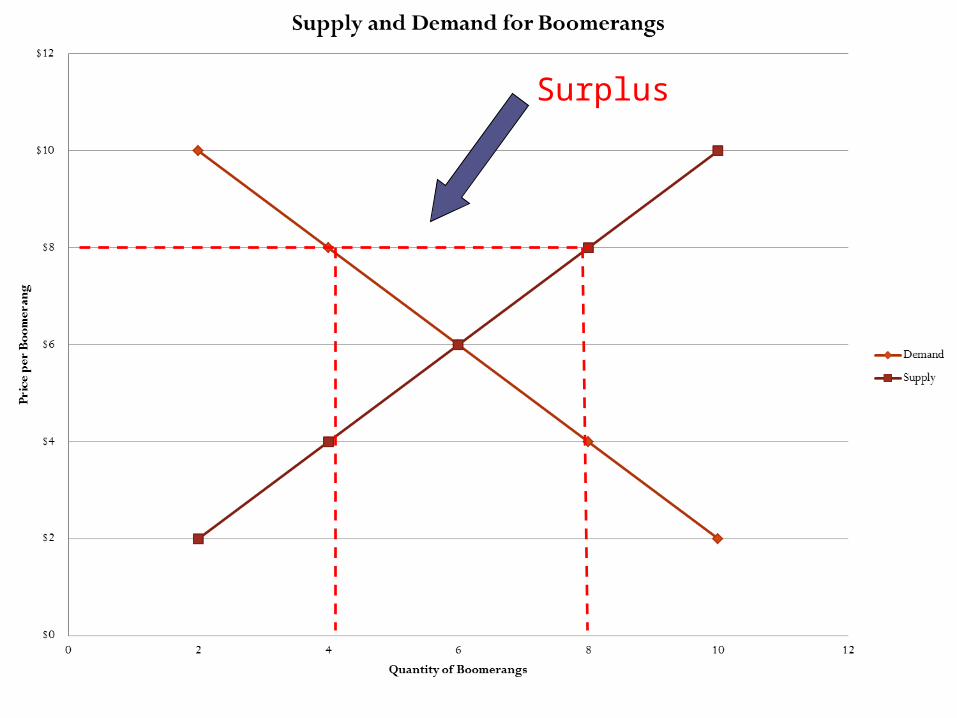
• A surplus is the amount by which the quantity supplied is higher than the quantity demanded.– A surplus signals that the price is too high. – At that price, consumers will not buy all of
the product that suppliers are willing to supply.
– In a competitive market, a surplus will not last. Sellers will lower their price to sell their goods.

Supply and Demand at Work•Suppose that the price in the Widget market is $4.
•At $4, Quantity demanded will be 4 Widgets
•At $4, Quantity supplied will be 8 Widgets.
•At $4, there will be a surplus of 4 Widgets.
Surplus

Supply and Demand at Work
•A shortage is the amount by which the quantity demanded is higher than the quantity supplied
▫A shortage signals that the price is too low. ▫At that price, suppliers will not supply all of
the product that consumers are willing to buy.
▫In a competitive market, a shortage will not last. Sellers will raise their price.

Supply and Demand at Work•Suppose that the price in the Widget market is $2.
•At $2, Quantity supplied will be 4 Widgets
•At $2, Quantity demanded will be 8 Widgets.
•At $2, there will be a shortage of 4 Widgets.
Shortage

Supply and Demand at Work• When operating without restriction, our
market economy eliminates shortages and surpluses. – Over time, a surplus forces the price down and a
shortage forces the price up until supply and demand are balanced.
– The point where they achieve balance is the equilibrium price. At this price, neither a surplus nor a shortage exists.
• Once the market price reaches equilibrium, it tends to stay there until either supply or demand changes. – When that happens, a temporary surplus or
shortage occurs until the price adjusts to reach a new equilibrium price.

Supply and Demand at Work•Suppose that the price in the Widget market is $3.
•At $3, Quantity supplied will be 6 Widgets
•At $3, Quantity demanded will be 6 Widgets.
•At $3, there will be neither a surplus or a shortage.

Supply and Demand Practice Answers
Surplus

Shortage

6
Market Equilibrium