Chapter WATER RESOURCES...
51
Chapter 2 : WATER RESOURCES DEWZOPMENT
Transcript of Chapter WATER RESOURCES...

Chapter 2 : WATER RESOURCES DEWZOPMENT

Fm- 2
Hpso Million
( i ) Drainage and Reclamation . . * . e o 6,630
(ii) Investigations . . . . a a . . 270
(iv) Irrigatioa (CRBC) . . . - . . a o
(v) Reservoirs (Hub, Khanpur, 'Ibal Manchher 660 and Chotiari). - --
Sub-totd , . 9,2 54
(c) Food & AgricultureDivision . . . . . . . . o o 7 1
(d) FATA, AK, W.A. & Other Divisions
k?) Tarbela/lBP . . e o B e
(f) Miscellaneous . .. . Total.
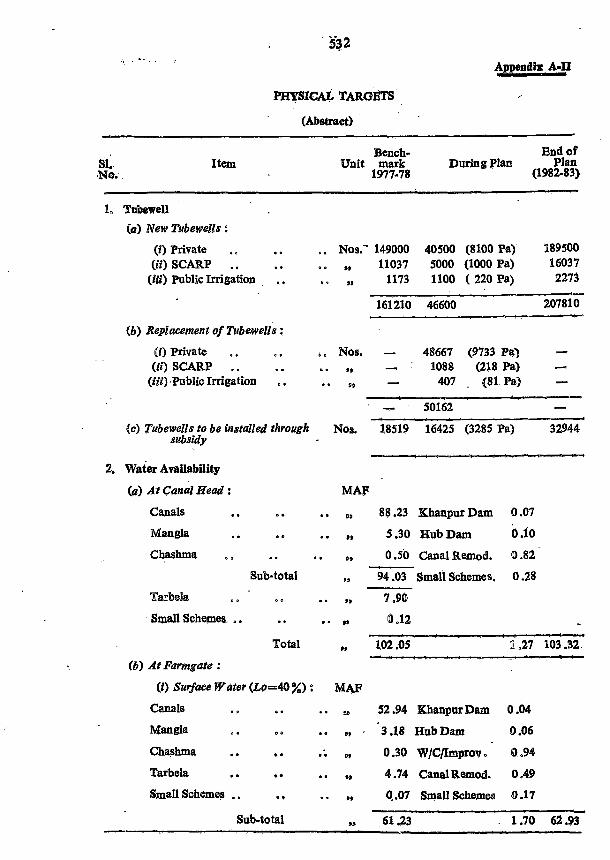
(Abstract)
Item Bench- End of
Unit mark During Plan Plan 1977-78 (1982-83)
I, TrnFDewell
(Q) New Tubewells :
(i) Private . . .* . . Nos.' 149000 40500 (8100 Pa) 189500 (it) SCARP . . . . .. ,, 11037 5000 (1000 Pa) 16037
(iii) Public Irrigation . . ,, 1173 1100 ( 220 Pa) 2273 1-
161210 46600 207810
(b) Replacement of Tubwells :
( 8 ) Private . . O m Nos. - 48667 (9733 Pa) - (ii) SCARP . . . . a 0 s9 - 1088 (218 Pa) - (iff) *Public Irrigation . . • 09 - 407 , (81 Pa) -
-- (c) Tubewells to be i~stalled th~ough Nos. i8519 16425 (3285 Pa) 32944
srabsidy
2. water Availability
(a) At Canal Head : M e
Canals . . o . .. ,, 88.23 Khanpur Dam 0.07
Mangla . . 0 0 .. ,, 5.30 Hub Dam 0 .i0
ChasPMa .. . . . . 9, 0.50 Canal Remod. 0.82 7
Subtotal ,, 94.03 Small Schemes. 0.28 - Tmbek a s a e .. 9, 1 .90
Small Schema . . . . . . s* 0 -12
Total ,, I02 ,05 1.27 103.32
{b) At Farmgate :
(f) Sugace Water (Lo=40 %) : MAP
Chashma . . . . . ,, 0.30 W/C/zmp~v. 0 -94
Tarbela . . . . . . 4.74 CanalRemod. 8.49
Small Scheme . . m . . . ,, 0.07 Small Schemes 0.17
Sub-total - sr 61.23 , 1.70 6293

S1. No.
Item Bench- End of
Unit mark During Plsn Plan 1977-78 (igsas3)
- [ii) Grobnd Water :
MAF (a) Private Tubewells
(q- 1.05, f=20w LO= 5 % ,, 21.64 5.87 27 A8 (b) SCARP T/w.
(q=2.O,f=5O%)L0-15% ,, 8.41 3.07 11.48 (c) Public Irrigation T/W
(q=1.5,f-SO%)L0=15% ,, 0 -50 0 .$1 P .OP
Sub-Total 30.52 ' 9.45 39.97
(Hi) Total Scnface & G/WU& . . 91 $75 11 .I5 102.90 --- ---_1-
(c) Seasonal Water RvaiIabtESly at Fmm gate :
(21) Rabi .. - . . . , 37.14 5 -29 42 043
Total . . .. 91.75 11 -15 102 -90
(d) Water Availability from Persian Wheels and Tanks : . .
tq=O.1, ff=12%, L0=10% MAP 0.80 ' -4 -70 6.10
3. Water Requirement fog Mrml:@J and in- urn. . . - r '
(a) Municipal and Industrial Water Uses NIAF 3 ~ 5 5 0.75 " 4 030
- 4. Cultivated Mgated Area . . . . 36 054 0 -46 37 -00
5. Csnal Cultareable C o d e d & MA 34.50 - 34 050 (CCA).
6. Q o H M (a) RhBfif . . o . . . . . MA 17.24 1 052 18 096 (b) Rabi . . o . . . . 18-51 3 -05 Pf '62
Total 35 -81 4 077 40 -58
7. Cropping bDtensftO ta Im&ted Giltbated % 98 12 110 Am.
QAMual Crop Acreage counted once onl~l*
8. Delta (Dqth of Water deMvered at Farm- W e per Croaped Acre).
(a) gharif .. . . . . .. Ft. 3 -17 3 -41 3 -19 (6) Rabi . . . . e a .. ,, 2-00 1 -73 1 -96 (c) Total .. a . . . .. , 2.56- 2 -34 2 *54

]Bench- End ,of S1. Item Unit mark During Plan PIm N 0. 1977-78 (1982-83)
9* New CMntteL
(a) Length . . . . .- . . .Mi les - 586 - (b) Earthwork . . . q . . Mcf. - 1037 -
10, Canal Remodelling
(a) Lamgth . .. -. . . . .Miles - 1387 - (b) Earthwork . . . p . . Mcf. - 921 -
11. P~ovincaall Srufkace Drains
(4) Lewzth . . n a s s . . Miles - 136 - (b) Earthwork . . . . . . Md. - 182 - (c) Area Protected . . m e . . MA - 0 -12 -
(a] UGW TOW. . . e o . . Nos. 11037 WOO 16037
(b) SGW T.W. . . * a .. Nos. 817 1177 1994
(c) Surface Drains . . o o . . Miles 3700 1805 5509
(d) Tile Drains . . . . . . Milee - 9400 9400
(e) T.W. Replacement a s .. Nos. 855 1088 1943
0 Area Protected .. a O ,.MA 16.0 7 -1 23 9 1
14. Water Management
(a) WID improv~m6nb - USAID . . Nos. 40 1460 1500
-aha. .. - - 2857 2857
( 1 hdsion/Lmd Hwvehg . . .. Acres 11320 413180 4WW
q-- Av. discharge in cusm. fa Annual utilization factor-

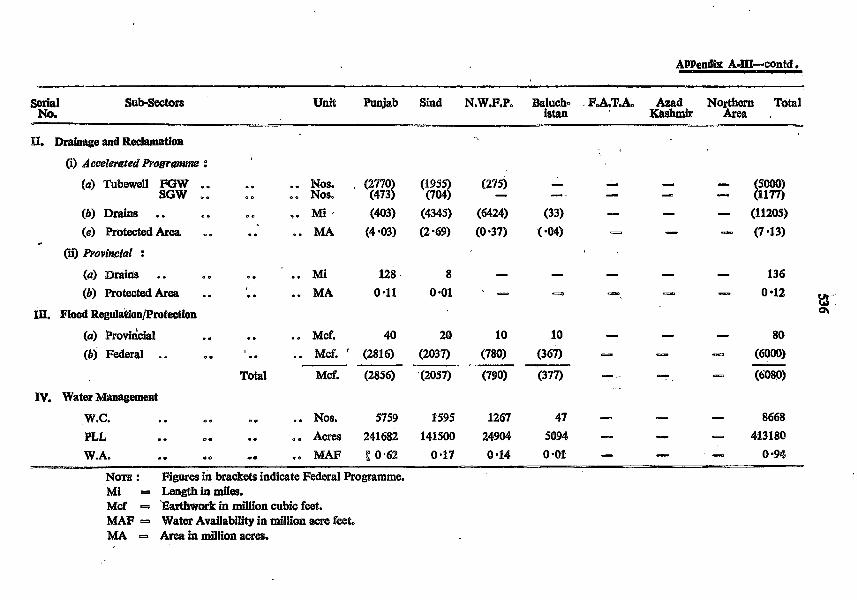
Appendix A-III PHYSICAL TARGETS AGENCY-WISE
( A b s t r a c t )
SubSeetors , , I Unit Punjab] Sid NWFP Baluchis- F.A.T.A. Azad Northern Total tan hshmir Area
1. higation
I. Surface Irrigation : (i) New Canals ' . . a a a . .. Mi 189 197 197 3 - - - 586
Mcf 283 374 374 6 - - - 1037 (ii) Canal Remodelling . . . . .. Mi 328 600 94 365 - - - 1387
Mcf 217 402 63 245 - - - 927 MAF 0.18 0.35 0.07 0 .22 - - - 0.82
(iii) SmalI Irrigation Schemes, Small Dams & Lift Irrigation :
(a) Small Dams . . . . . . Nos. 7 - - 10 - - - 17 a UI
(b) SmaU Irrigation Scheme . . .. Nos. 34 ~24 34 35 15 2 2 146 (c) Lift Irrigation . . . . .. Nos. 1 1 2 - - - - 4 (4 Water Availability . . . . .. MAF 0.04 0.02 0.01 0.04 0.13 0 *01 0 -03 0 -28
2. Groundwater Irrigation : (i) Public Tubewells :
(a) SCARPS . . . . . . . . Nos. (2770) (1955) (275) - - - - (900s) MAF (1 -7) (1 -2) (0.17) - - - - (3-07)
(b) Other . . a a . . .. Nos. 100 - 15 485 500 - - 1100 MAF 0.05 - 0 -01 0 2 2 0 a23 - - 0 -51 -
(ii) Private Tubewells : (a) Subsidized o o o .. NOS. 12000 1000 2625 800 - - - 16425 (b) Total . . .. Nos.
With & ~ ~ h o u t s&sidy) MAF
40500 ( 4-48667 Rep I.)
5 -87
Serial Sub-Seutors No.
Unit Punjab Sind N.W.F.P. B@uch- . FAT& Azad Northern Total wtan Ktwhmir Area ,
.I.& ~~e and Reclam8~on
(a) Tubewell FGW .. .- .. Nos. (295) - - - - # (::;!] (!;3 - SGW ,. o o .. Nos. - - - - {El
(b) Drains . . *. s a .. M i , (403) (4345) (6424) (33) - - - (11205)
(e) P r o t d Area - a . . . . MA (4 -03) (2.69) (0.37) (004) - - - (7.13)
(a) Brains . . - e * . . . Mi 128 , 8 - - - - - 136
(b) Protected Area .. I . . .. MA 0 .ll 0.01 - - - - - 0.12
Ill. Flood R~ulation/PFotection 8 ai
(a) @rovidcial . . . . .. Mcf. 40 20 10 10 - - - 80
(b) Federal . . e . . . .. Mcf.' (2816) (2037) (780) (367) - - - ----- (6000) - Total Mcf. (2856) (2057) (790) (377) - - - (6080)
IV. Water Management
W.C. W e o e 0 0 .. NOS. 5759 1595 1267 47 - - - 8668
PLL -. D I .. .. Acres 241682 141500 24904 5094 - - - 413180
W.A. . . . 0 0- .. MAF & 0.62 0.17 0.14 0.01 - - - 0 -91 - - - -.- NOTE : Figures in brackets indicate Federal Programme. Mi -- Lengthin miles. Mcf Bwthvork in million cubic feet. MAF = Water Availability in d k n m e feet. MA -- Areainmillionacres,
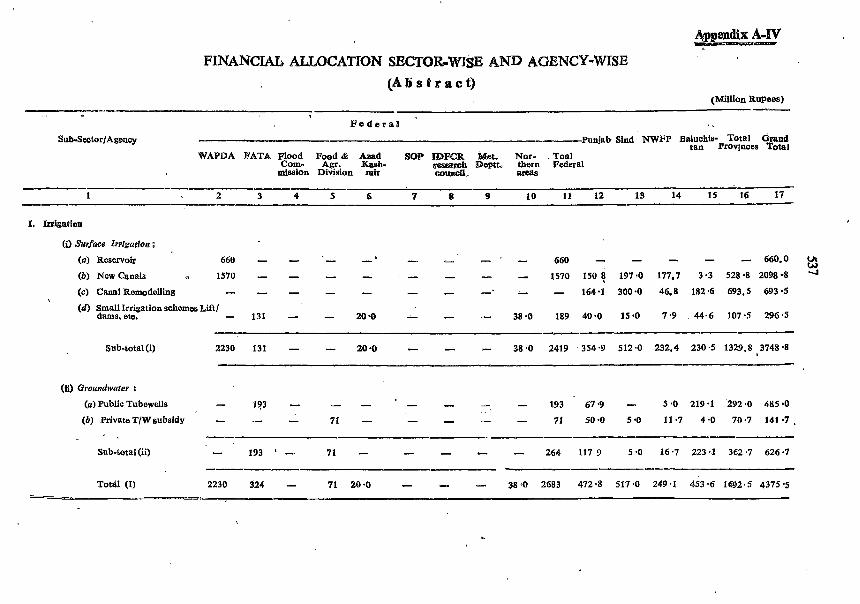
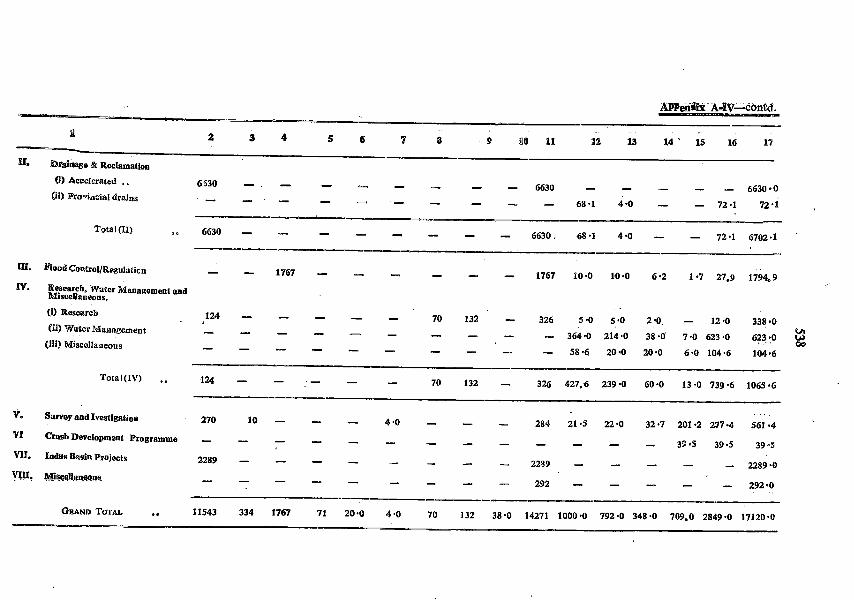
FINANCIAL ALLOCATION SECTOR-Wm AND AGENCY-WISE
(Million Rupees) --- - F e d e r a t . .
Sub-SeotorlAgenoy Punjab Sind NWFP Baluchis- Total Cfrand tan Provjnoes Total
WAPDA FATA Flood Food & d4zad SOB mFCR Mat. Nor- . Toal Com- A q . a+- aaseamh Depth thern Federal
mission Div~sion rmr councfl, area
I. Irrigation
(i) Surface Iv~tgattoa : (a) Reservoir 660 - - ' - - - - ' - 660 - - - - - 660.0
(b) New Canals 1570 - - - - - - - - 1570 150 ? 197.0 177.7 3.3 528.8 2098.8
( c ) Canal Remodelling - - - - - - - - - - 164.1 300.0 46.8 182.6 693.5 693.5
(dl Small Irrigation schemes Lift1 &tuns, ete. - 131 - - 20.0 - - - 38 -0 189 40.0 15.0 7.9 44.6 107 .5 296.5
- Sub-total (i) 2230 131 - - 20.0 - - - 38.0 2419 354.9 512.0 232.4 230.5 1329.8 ,3748-8
(a) Ground~vater :
(a) Public Tubewells - 123 - - - - - - - 193 67 9 - 5 -0 219.1 292.0 485.0
(6) Private T/W subsidy - - - 71 - - - - - 71 50.0 5 *O 11 -7 4.0 70.7 141 -7 , --
Sub-total(ii) - 193 ' - 71 - - - - - 264 117 9 5 .O 16.7 223.1 362.7 626.7
Totdl (I) 2230 324 - 71 20.0 - - - 38 -0 2683 472.8 517.0 249 +I 453 -6 1692.5 4375 -5 ? --- - - --

Appendix A-V
FINANCIAL PROGRAMME ( A b s t r a c t )
~ O V I N C I A L GOVERNMENT AND FEDERAL AGENCIES \ , (Million Rs.)
ANNUAL PHASING A g e n c y - I s
1978-79; 1979-80 -t980-81 1981-82 1982-83 Total
Provincial ' r (E] 'punjab . . o . o o
, (ti) Sind . . . . 0 0
(iii) N. W . F. P. . . o - (bj ~aluchistii; . . O I
' Sub-total . . Federal
(2) WAPDA . . -. (ii) FATA . . . .- *.
(iii) Flood Commission . . (y) h d ' K a s W . . o e
(v) Northern Areas . . o - (vi) IDFC ~esearch 'Council . .
(vit) Survey of Pakistan . . (viii) Meteorological Department
(ix) Food & Agriculture Division (x ) MisceIlaneous . . o q
Sub-total . . - * . . 2896 -0 2483 -3 2516.1 3011.8 3363 -8 14271
GRAND TOTAL . . o o 3269 -9 3017 SO 3104 -5 3647.8 4080.8 17120 d

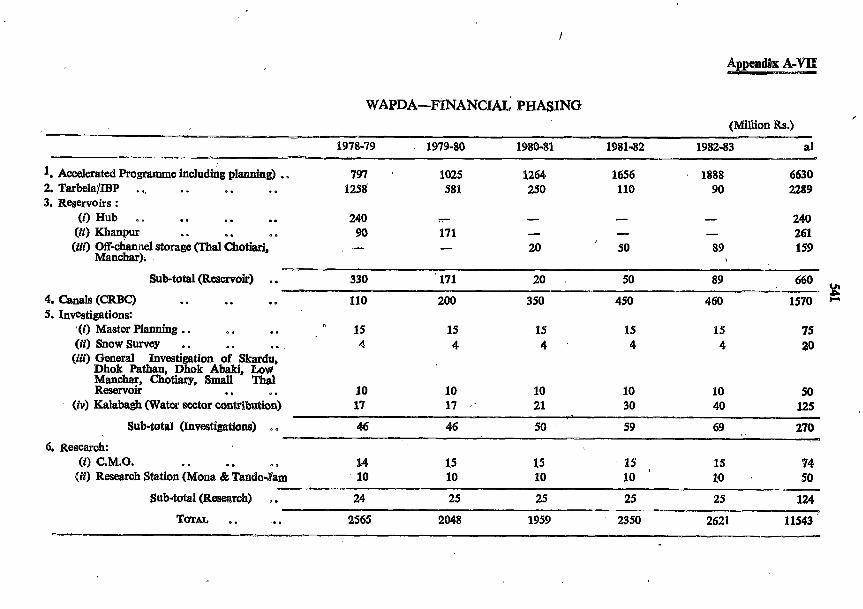
WAPDA-FINANCJA~ PHASING /
(Million Rs.)
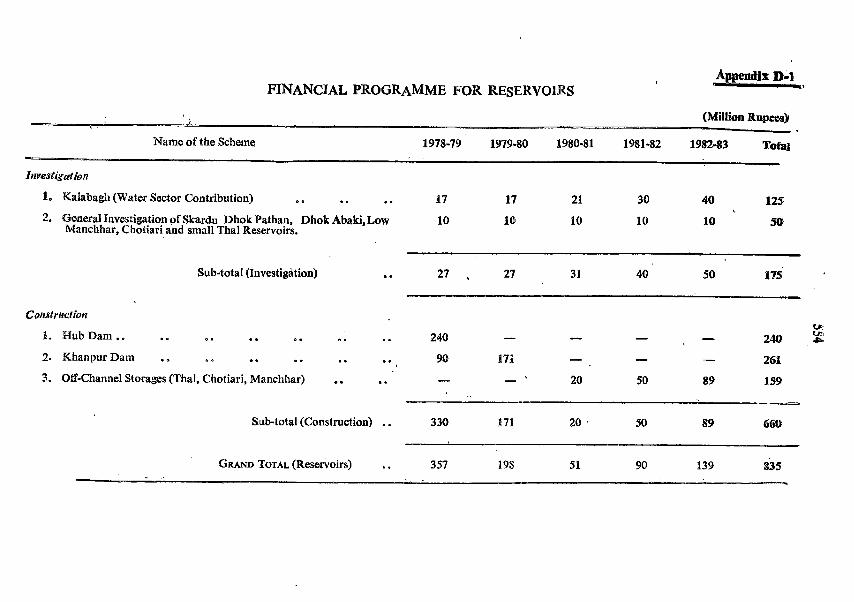
1978-79 1979-80 1980-81 1981-82 1982-83 a1 - - 1. Accelerated Programme including planning) . . 791 1025 1264 1656 1888 6630 2. Tarbela/IBP . ., o . * . . . 1258 581 250 110 90 2289 3. Reservoirs :
(i) Hub . . . * m a -. 240 - - - - 240 (dl) Khanpur . . . . o e 90 171 - - - 261 (iii) Off-ohanuel storage (Thal Chotiari, - - 20 ' 50 89 159
Manchar). j
Sub-total (Rwemir) . . 330 ' 171 20 50 89 660 "a
4. Canals (CRBC) . . . . . o 110 200 350 450 460 1570 8 5. Investigations:
(i) Master Planning . . -. . . "5 15 15 15 15 75 (it) snow survey . . . . . . 4 4 4 4 4 20 (if) General Investigation of Skardu,
Dhok Pathan, Dhok Abakt, Low Manchar, Chotiary, Small Thai Reservoir . . . - 10 10 10 10 10 50
(iv) Kalabagh (Water sector contsibntion) 17 17 . 21 30 40 125
Sub-total Chvmtigatiom) . . 46 46 50 59 69 270
6. Research: ( i ) C.M.O. . . . - e o 14 15 1s 15 15 74 (8) Research Station (Mom 8& Tmdo-Jam 10 10 10 10 10 50 - -
Sub-total (Research) *.. 24 25 25 25 25 - - -- 124
TOT& .. . . 2565 2048 1959 2350 2621 11543 -

Appendix A-WlI WATER RESOUmS DEVELOPMENT ACCELERATED PROGRAMME
* -.
3 0 ' ; t v . * r l . . I . Fbncial (Rs. Million)
P -- Expdt. Total ~ b o b -
Serial Name of Prajeot Satus Total ( up to Balanoe 1978- 1979- 1980- 1981- 1982- during forward Remarks No. Cost 1978 1979 1980 1981 1982 1983 Plan
F. G. W. Projecfs
1. Panjnati Abbasia (Unit I) . . .. On-gojng 195 168 27 27 - - - - 27 - 2. shah&+ ' ' . . S o s s S o .. 125 99 26 26 - - - - 26 - 3. ~oidwah Sadiqia (Pilot) -. . . .. 61 56 5 5 - - - - 5 - 4. ~nti-wiierlbgging bong TP. CJ, TS Links.. ., 188 79 101 75 26 - - - 101 - 5. kepi&e&ent of Tubewe~s . . .. ., 375 - 375 75 75 75 75 75 375 -
8 ,
6. ~&jnad"~bbasia (Remaining) . . .. .. 1683 - 1683 35 230 260 355 375 1255 428 3 L O
7. Shorkot Kamalia (Remaining) . . .. .. 367 - 367 10 72 80 90 367 - --- 115 I I
-- 2988 404 2584 253 403 415 520 565 2156 428 - ----
S.G. W. Projects /
1. SCARP 11 . . . . . . .. On-going 287 222 65 65 - - - - 65
2. SCARP^ .. o a .. .. ,. 49 46 3 3 - - - - 3 - I /
- 336 ' 268 68 68 - - - - 68 - ---
Drainage Project
1. Pharang Drain . . a. .. On-going 56 41 15 15 - - - - 15 - - 20 60 80 100 260 2. SukhBias .. . . . . .. New 811 - 811 551
Project Planning
--- On-xoing and New 100 - PO0 20 a 20 20 20 20 100 - (50 % each). -
Total (Punjab) 4491 713 3778 356 447 499 624 689. 2615 1163

11. Ssnd
F.G. W. Projects
1. RohriNorth . . .. a o .. On-goins 500 421 79 39 40 - - - 79 - 2. Sukkur Right Bank e o . . n. 171 74 97 30 37 30 - - 97 - 3. Rohri South (ZonwA) . . . . . . ,. 708. 50 658 30 - 47 100 - 179 242 572 86
4. Ghotki . . o o - a . . 10 427 60 3 67 30 40 80 100 117 367 - 5. Replaoement of T.W. . . . . . . .. 60 - 60 5 10 15 1 5 15 60 - - ----. - -
----I - _--- ------------ - - S.G. W.Ptoject
1. North Rohri (Nawab $hah) . . . . Now 370 - 370 - 10 SO 90 120 270 100
2. Larkana Shilfarpur III . . .o . . .S 32 - 32 5 7 10 10 - 32 - 2 - W
3. SouthDadu . . . . . . .O SD - 99 - 20 20 25 34 99 - 9? -------- - - 501 - 501 5 37 80 125 154 401 100
- - - - - - Drain Proiects
1. Kotri Surface Drain . . 2. LBOD (Phase I) . . 3. East Khairpur Tile Drain
4. Norb%Dadu . . S o
5. RBOD . . .-
Project Planning . . e 0 On-going 20 - 20 4 4 4 4 4 20 and New
(50% -h) - n < .- .,,
Total(Shd) .. 5786 8157 4629 318 454 613 845 983 3213 1416
---- ~
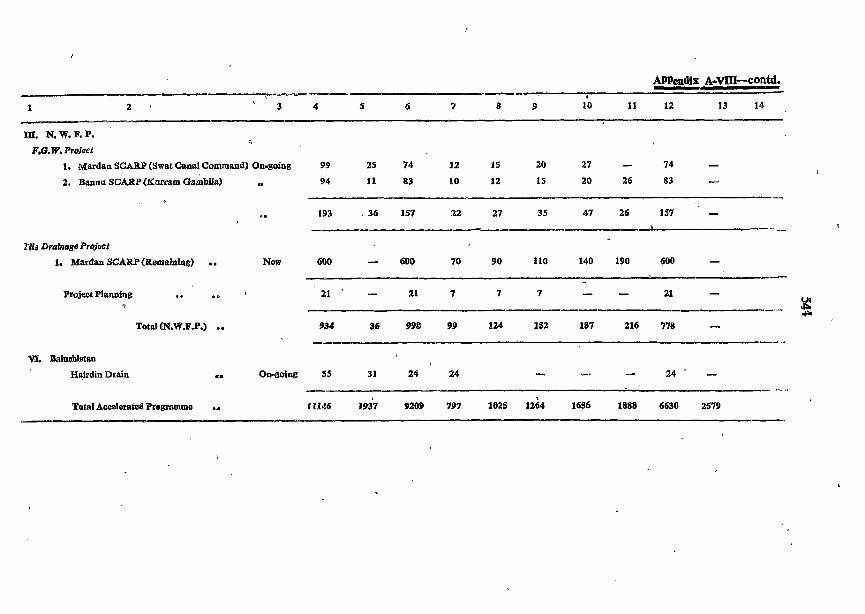
m. N. w. F. P. F.Q.W. Project
1. Mardan SCARP (Swat Canal Command) On-going 99 25 74 12 15 20 27 - 74 - 2. Banna SCARP (Kurrsm ~ h b i l a ) SI 94 11 83 10 12 15 20 26 83 -
Tlfa Drainage Project
I. Mardan SCARP (Remaining) . . New 600 - 600 70 90 110 140 190 600 -
PFoject Planning .. .. 21 ' - 21 7 7 7 - - W - 0 -----
Total (N.W.P.P.) . . 934 36 998 99 124 152 187 216 778 - --- - --
VI. Balwbistaa
H@rdin Drain w On-going 55 31 24 24 - - - 2 4 - - - - -. ..
Total Accelerated Programme .. 11146 1937 9209 797 1025 12k4 1656 1888 6630 2579

RNANcIAL PROGRAMME Special Area
(FATA, Azad ~~ and Northern Area)
Total Expdt. Total Throw- Name of Scheme Status Cost up to Balance Phasing during the 5th Plan for forward7
June - the £or 6@ 1978' 1978-79 1979-80 1980-81 1981-82 1982-43 Plaq. P k -
1 2 3 4 5 6 7 8 9 10 11 I2
A FATA I. SURVEY, INVESTIGATTON & PROJECT PLANNING :
1. ~ ~ e ~ & I n v e s t i g a t i o n o f Irrigation Schemes.inTdba1 On-going . 5 40 1 -2 3.8 1 *2 1 .3 P -3 - - 3.8 - Areas.
2. roundw water Investigation in T r i a l Areas Do. 32-3 26.1 6 6 0-8 0.7 0.7 2.0 2.0 6 . 2 - * e Total h e y . Investigation, etc. ss 37.3 , 27.3 10.0 2.0 2.0 2.0 2.0 2.0 10.0 -
(i) SmPaQa *nd&n " (a) SpMN Dmns, Small Irrigation Schemes
1. sat? Irrigation Scheme (Ku118m Agency) . . New l i 8
2. SWofr=SrnallIrrigation Schemes in F.R.Bannu, Do. Waanstan,Kurram and Bajaur Agency.
3. KltmanIrrigation Scheme(I(urram Agency) . . Do.
4. Karram Tongi Irrigation Scheme (S. Wadriatan Do. Agemy).
5. Kabul ~~ver1rri~ationScheme (Mohmand Agency) Do.
6. 3 Nos. Small Irrigation Schemm .. Do.

Appendix A-IX-wntd. - 1 2 3 4 5 6 7 8 9 10 11 12
Gzoan&atan
(a) Public m e w &
1. Installation of150 T/W(Bajaur Agency) . . On.going 56.6 16.1 40 -5 7 -0 7.0 7.0 7 -0 7 SO 35 .O 5.5
2. Inst. of 110 T/W (Mohmand Apencg) .. New 38.5 - 38 -5 1 -0 1.0 1.5 1.5 2.0 7.0 31-5
3. Tat. of 30 T/Wh P.R. Pt.sbaw@r & FA. Kohat NEW 10.5 - 10.5 1.5 1.5 2.0 2.0 2.0 9.0 1.9
4. In!it.of 50 T/W io F.R. D.I. Kban .. New 17.5 - 17.5 2.0 1 2 . 5 3.0 3-0 3.5 14.0 3.5
5. Other Tubewell P r o (317 T/W) .. New 128.0 - 128 40 4.0 16.0 30.0 35.0 43.0 1284 - Sub-total (Groundwater) . . 251 -1 16.1 235 -0 15.5 28 *O 43.5 48 -5 57 -5 193 .O 42.0
C. NORTHERNAREA
GRAND TOTAL PATA . . 665.4 43.4 622.0 32.0 50.0 71 a0 83 .O 98 .O 334 .O 288.0
New 20 .O - 20.0 1 .O 2 .O 4 -0 6 -0 7 a0 20 SO - on-going 48 -0, 10.0 38 SO 5 .O 6.0 8.0 9.0 10.0 38.0 -

v!%T . Q 0 m e 0
L9LT LLV OZV OSE OLZ OSZ fiQN UO!WIamr03 POOM Prnped 'v
OL £2 OZ 0-ZP 0.8 0. e- l~IO$-WS
VN VN . . . . *. ES EZ OZ S. 9 0- Z So P VN fiaN


Appendix B-I WATER BUDGET
Water AvaiIabiIity at Farmgate (Abstract) ,
Benchmark Water availhbility at the end of Increase in Water available AnnualPeraenta~e Inoreme Plan (MAF) at the end of Plan (MAS?) (%) - - . . .. -
Source
1. Surface Water 39.35 21 -88 61.23 40 -49 22.44 62.93 1 .I4 0.56 1-70 0.56 0.50 0.54
2. Ground WateV o 15 26 15.26 30 -52 19.98 19.99 39-97 4-72 4.73 9.45 6.18 6.18 6-18
Aawmpfien
1. Canal Water ( I ) ConvzyanCelosses k anal and distrlbntatfes - 25 % of Canal head
( i f ) Conveyancelossesin watercourse up to farmmte 15 % .. .. ,. (Nukka)
(iif) Totallosses upto farmgate (Nykka) - 40% .. ss ,. -
Type '(Cusec Eflciency ('4 Losses in (%) Anwd Pumpage (AF) cvatercourse --
(I) Private 1-05 20 5 145
(ii) SCARP 2.0 50 15 . 615
(tit) Other Pablic 1.5 50 15 461

Appendix %IT
CANAL WITHDRAWALS (1 966-67-1 974-75) AT CANAL HEAD
WAF) - -
Year Kharif Rabi Total
- -
1966-67 . . . . -. e m 66 -37 29 *59 95 -96
1967-68 . . . . a q o a 61.72 32 -98 94 -70
1968-69 .. . e # . o a 66 -73 31 -58 98 -3 1
1969-70 .. . . . . . * 69 -19 30.66 99 45
1970-71 . . . . * . . . 60 43 26 ~53 87 3 6
1971-72 .. . . -. . . 60 -60 26 -05 86 -65
1972-73 . . . . p .- 68 067 32.23 100 -90
Average
Tarbela
Small krigation Scheme 0 -08 0 44 6 *12
NOTE : (I) Water availability &om Tarbela
Live storage at Tarbela . . . . v a . * . 9.30 MAF
Less 15 % losses in rivers . . * . n - . . . . 1 40 MAF -
Water available at canal head a , e e . . . . 7.90 MAF
kcss 40% losses in canals and watercourse . . . q .- 3.16 MAF
Water available at farmgate . . a . m n u - . . 4.74 MAF
(ii) Utilization of Tarbela water
For supplementing Rabi Shortages o . 0 a o Q 4.00 MM?
For supplementing Kharif shortages . . - . o o o 0.60 M U
For increasing Rabi Acream . . $ a . . . . 0 -14 MAF
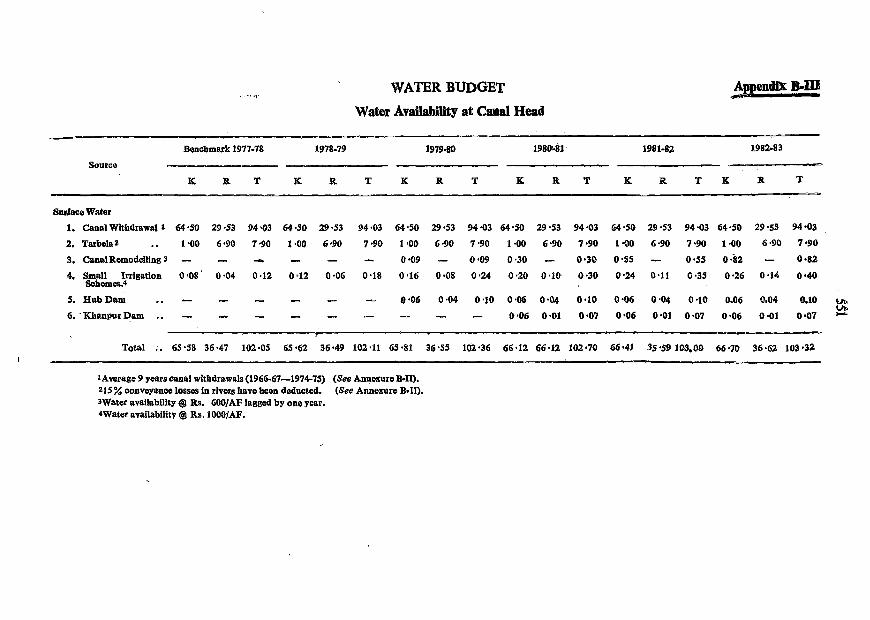
WATER BUDGET
Water Avdab"1ty at Cam1 Head
Source
K R T K R T K R T K R T I C B T K R T
M a c e Water
1. Canal Withdrawal 1 64 5 0 29 4 3 94 ~ 0 3 64 .SO 29 -53 94.03 64 -50 29 -53 94 -03 64 -50 29 -53 94 so3 64 -50 29 -53 94.03 64.50 29 5 3 94 4 3
2. Tarbelea .. 1 q00 6.90 7.90 1.00 6.90 7 .PO 1.00 6 ~ 9 0 7.90 1 a00 6.90 7.90 1.00 6-90 7.90 1.00 6.90 7.90
3. CanalRemodelling 3 - - - - - - 0.09 - 0.09 0.30 - 0.30 0.55 - 0.55 0.82 - 0.82
4, Small Irrigation 0.08 0.04 0.12 0.12 0.06 0.18 0.16 0.08 0.24 0.20 0.10 0.30 0.24 0.11 0.35 0.26 0.14 0.40 Schemes.4
5. Hub Dam .. - - - - - - 0 -06 0.04 0 -10 0 46 0.04 0 -10 0.06 0 44 0 e l 0 0.06 0.04 @.lo u,
6. ' Khanpur Dam . . - - - - - - - - - 0-06 0.01 0.01 0.06 0.01 0.07 0.06 0.01 0.07
1Averag.a 9 years canal withdrawals (1966-67-1977 (See Annexure BID. 215 % wnvegance losses in rivers have barn deducted. (See h e m r e B.11). 3Water availability @ Rs. 6001AF lagged by one y w . ,Water availability $ Rs. 10001AiP.
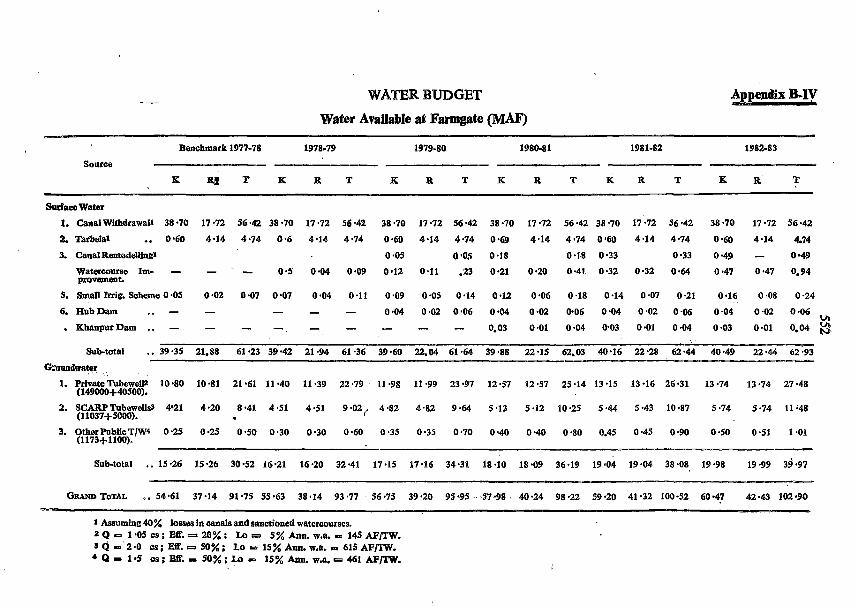
WATER BTJDGET
Water Avaf able at Farmgate (MU)
Appendix B-IV
Benchmark 1977-78 1978.79 1979-80 1980.81
Source __-___- ___I_C_ C---C--- p p
K R f T K R T K R T K R T K R T T K R . -
SarPuee Water
1. Canal WithdrawaIl 38 970
2. Tarbefa1 .. 0.68
3. Canal RemodeWngP
Watercome Im- - provement.
5. Small Inig. Scheme 0 a05
6. Hub Dam .. - . Khanpur Dam . . -
Sub-total . . 39.35 21.88 61 -23 39 -42 21 -94 61 -36 39 40 22.04 61 44 39.88 22 .I5 62.03 40.16 22.28 62.44 40.49 22.44 62I93
Subtotal .. 15-26 15.26 30.52 16.21 16-20 32.41 17.15 17.16 34.31 18.10 18.09 36.19 19-04 19.04 38.08, 19.98 19.99 34.97
1 ABsumiog 40% losses in oanals and -oned wateraourses. a Q - 1 *O5 os ; Eff. 5 20% : Lo = 5% Ann. w.a. - 145 A F m . 8 d = 2.0 as; Eff. e, 50%; Lo c. 15% Ann. w.a. - 615 APm. ' - 1.5 48; EE. - 50%; Lo = 15% Ann. w.&= 461 AFjTW.

NEW CROPPED AREA DURING FIFT tX PLi\N Appendix C-I - Source-wise
(WEfen acres)
Water K : R Avail- (Water 1978-79 1979-80 1980-8 1 1981-82 1982.83 able Avail- , -
atend able) K R K . R K R K R K R of Plan ( M A E )
P fahh Avail.
E or rian ( M A E ) ' (At .
farmgate)
& Canal Remodelling . . o e .. 0.49 1:0 - - 0 s o 1 - 0.50 - 0.90 - 0.14 - .3. I C h m ~ r D a m . . a s o . . . 0.04 - - - - - 0-02 0.01 0.02 0.01 0.02 0.01
-4. HmbDam . . . . a * .. 0,06 - - - 0.01 0.04 091 0.04 0.01 0.04 0.01 0.04
5. Small Caad Irrigation Schemes . . .. 0.19 2: 1 0 -01 0.01 0 a 0 1 0 4 1 0.02 0.02 0.03 0.02 0 -03 0.03
6. Tarbela . . e .. .. - @:I - 0.08 - 0.08 - 0.08 - 0.08 - 0.08 3 W
7. SCAWPTubewells . q e e .. 3.07 1:l 0.09 0.17 0.1% 0.34 0.27 0.51 0-34 0.68 0.44 0.86
8. Other Public Tubewells . . m s .. 0.51 1 :1 0-01 0.03 0 a03 0.06 0.04 0.08 0.06 0.11 0.07 0.14
9. Private Tubewells *. o o .. 5.87 1 : l 0.17 0.33 0.33 0.63 0.51 0.99 0.67 1.31 0.84 1 -63
- Total .. 11.15 - 0.29 0.64 (Y.60 1-24 0.98 1.84 P -34 2.43 1-72 3.05
New croppedirrigated area increased during the Plan -4 -77 WA.
Nom-(i) Delta for Kharif (at farmgate) - 3 -5 f<. (11) DeltaforRabi(atfarmgate) = 1 -8 ft. (lii) Area benefitad is within and outside CC!. . i l v ) Utilization of Tarbela wrtor see Anname B-11,

Appendix b-a (u)
NEW CANALS
Punjab 1. On-going schemes or constructing, extensio~l and related works of csthals/distributarieI,
otc. (8 schemes).
2. New schemes
New Canals.
Construction of Small Irrigation Channels. L
Shd
1. Kotri Barrage Irrigation Scheme.
2. Guddu Barrage Irrigation Scheme.
3. Link Canals.
4. Cons. new channels supplementing tailcl~aunels (6 Scl.emes)
N. W. P. P.
Oregoing Schemes
1. Pehur High Level Canal.
2. Extension of Siran Canal.
3. bnstruction of Minor hlarwwt Canal.
New Schemes
~ e w cinals.
Balachlsbn :
1. Utilization of Hub Dam Water.
2. N m Canals.
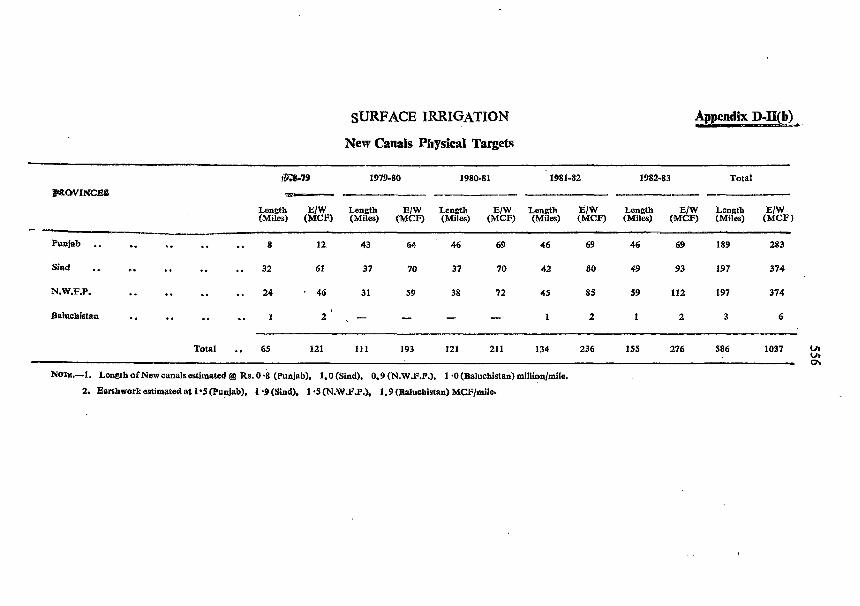
SURFACE IRRIGATION
New Canals Physical Targets
Appendix D-II(b) -
13%-19 1979-80 1980-81 1981-82 1982-83 Total
Length E/W Leqgth E/W Length E/W Length E/W Length E/W Length E/W (Miles) (MCF) (Miles) (MCF) (Miles) (MCF) (Miles) (MCF) (Miles) (MCF) (Miles) (MCP) -
Punjab .. . . . . . . .. 8 12 43 64 46 69 46 69 46 69 189 283
Total .. 65 121 111 193 121 21 1 134 236 155 216 586 1037 2
NOTE.-1. Len& of Newcanalsustimated @ Rs. 0 -8 (Punjab), 1.0 (Sind), 0.9 (N.W.F.P.), 1 -0 (Baluchistan) million/milc.
2. Wrthwcrk estimated at 1.5 (Pupjab). 1 -9 (Sind), 1 -5 (M.W.F.P.), 1.9 (Baluchistan) MCFImiIe
557 Appendix D-IB(a)
I CANAL REMODELLING
Punjab
1. On-going schemes of Remodelling/Rehabilitation canals/dislributsries, etc. (56 schemes).
2. New Schemes of remodelling and rehabilitation of Irrigation Channels.
Sind
I. Reconditioning of banks of canal/distributories (10 schemes).
2. Remodelling/reconditioning of'Irrigation channels.
N. W. F. P.
New Schemes
Remodelling and rehabilitation of Irrigation channels
Baluchistan
1. Widening of Patfeeder canal.
2. Remodelling and Improvement of existing channels.

SURFACE IRRIGATION
Canal Remodelling Physical Targets
PROVINCES lepgth Em Water Length E/W Water Length E/W Water Length E/W Water Length E/W Water Lcngth E/ IV Water M11a MCF Increase M~les MCF Inorease Miles MCF Increase Mila MCF Increase Mlles MCF Increase Miles MCF Iocreane t
(MAP) (MAE) (MAW ( m F ) (MAW!
N.W.F.P. &. 6 24 .- 28 19 0.03 10 6 -0.02 1 0 , 7 0.01 10 7 0.01 94 63 0.07 yr
I V, 00
da~ucbitan .. 81 21 - 61 41 0.03 81 5 0 .05 90 60 0.06 102 68 0.08 415 245 0 42
- - - Tota l , -.. 132 75 - 264 177 0.09 311 208 0.21 328 219 0.25 371 250 0.27 1367 929 0.82
---.. No%-I. Lonelb of remodelling estimated @ Rs. 0.5 million/mile.
1. Earthwork estimated aa 0.67 MCF/rniIeC 3. Cost per AF of wqter assumed as Rs. 600 at canal head beneblting next year.

559
Appendix DdV
SMALL DAMS/L1FT [RBI GATION AND SMALL IRRIGATION SCHEMES
1. On-going Small DamslLift Irrigation and Small Irrigation Sbhernes (18 schemes).
2. New Small Dams/Lift Irrigation and Small Irrigation Schemes.
Sind
1. Other works (KO&, Guddu, Sukkur).
2. Treatment of Arches of Sukkur Barrage.
3. Lift Irrigation L. B. of Nara Canal.
4. New Small Schemes.
N. W. P.P.
On-going Schemes
1. Bahawalnagar Lift Irrigation Scheme, Attani Irrigation Schen:e etc.
New Selrernes
1. Small Dams, pick up weirs and Lift Irrigation Schemes.
Balucbistan
1. Small Irrigation Schemes (41 Schemes).
2. Restoration of NarrilHeadworks.
3. Small Irrigation Schemes and Extension of Karezes.
4. Construction of series or Check Dams, Bunds, Delayed Action Dams ctc. other than Eolzn . Dam (11 S~hemes).
Append; x M(a)
PUBLIC TUBEWELLS
1. On-going Schemes on Installation, reboring tubewell and rehabilitation of damaged tube- wells (14 Schemes).
2. New tubewell schemes.
Sind
Nil.
N. W. p- Pa
1. New Public Schemes.
Balachistan
1. Rela Plain Groundwater Project.
2. Installation of 30 Tubewells by WAPDA and I t P.
3. Jnstallation of Turbines on 4 Tubewells and 6 Diese: Engines in Rakhshan Valley.
4. ~ t h e r ~ u b l i c ~ / ~ ~chdnles~lanned andlnv~tigated under GeneralInvestigations.(Ra'kh&m Velley, Kila Salfullah, Gumbaz, Nul, Gr~shak etc.)
F.A.T.A.
1. Installation of 150 Tubewells (Bajaur Agency).
2. Installation of 110 Tubewells (Mohmand Agency).
3. Installation of 30 Tubewells in F.R. Peshawar and F.R. Kohat.
4. Installation of 50 Tub:wells in F.R. D.I. Khan. ,
5. Other tubewell schemes to instal 320 tubewells,

Physical and Financial Targets
1978.79 1979-80 1980-81 1981-82 1982-83 Total
~ i n c i a l (Rs. Million1
Punjab* .. . . 15'2 R5+0 13 -1 12.6 12.0 67.9
Sind . C . . - - - - - - N.W.F.P. .. o e n -0 1 -0 -1 -0 1 .o I s o 5 00
Baluchistan .. . . 41.7 45.6 45.0 45.0 41 -8 219.1
F.A-T.A. . . . . 15.5 28.0 43.5 48.5 57:s 193.0
- - -
PAKISTAN .. 73.4 89.6 102.6 107.1 112.3 485-0
??bydeal ** (Nos.)
Punjab . . Q o 20 20 20 , 20 20 100
PAKISTAN .. 220 220 220 220 220 1100 ---
* Including Replacement. ** 1 iev; T~be,vells.
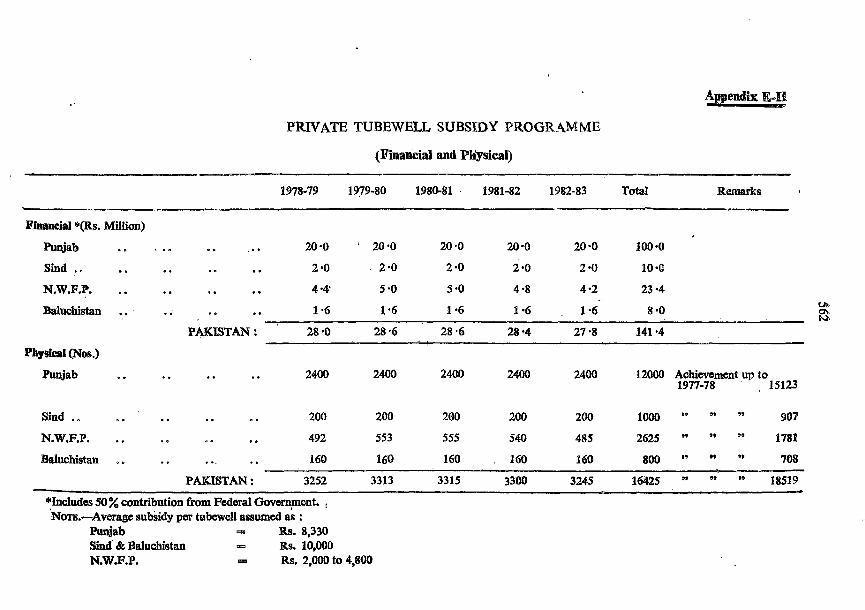
PRIVATE TUBEWELL SUBSIDY PROGRA4MME
(Financial and Physical)
1978-99 1979-80 1980.81 . 1981-82 1982-83 Total Renwks
Fbncipl *(Rs. Million)
W a b v - s .- q e . . 20.0 ' 20.0 20 SO 20 .O 20 -0 100 -0
Sind . . * . . . - s . . 2 -0 2.0 2 -0 2 SO 2 SO 10.0
1.6 1 -6 1.6 P -6 1.6 8 *O M Baluohistan . . . . . . . . ob m
PAKISTAN : 28 -0 28.6 28.6 28 -4 27.8 141 -4
Physical (Nos.)
Sind . . m. . . . . a 200 200 200 200 200 1000 O9 *' OD 907
N.W.F.P. . . *. s m . . 492 553 555 540 485 2625 ' ' *' 1781
Baluchistan . . . - . .. . . P 60 160 160 160 160 800 SY 9s 09 908
PAKISTAN : 3252 3313 3315 33M) 3245 16425 *' OD 18519
*Inchdm 50% contribution from Federal Govcrqmmt. NOTE.-Average subsidy par tubewell assumed as :
Punjab = Rs. 8,330 Sind & Balachistan - Rs. 10.000 N.W.F.P. - Rs. 2,000 to 4,800

TUBEWELE SUBSIDY PROGRAMMB-PUNJAB (Physical and Financial)
p m ~ i o a of Subsidy for sinkin! of private Diesel Tubewell in Sallaba Bararni. and Canal Commanded Area in Punjab. 3259 442 2610 15$1 6051 1200 15123 2400 %@@ 2,MM 2&@0 92QW
Mo~a.-Figures in brackets denote financial allocations in Million Rupees catculated g ~ s . $330 per khwe& (As indicated by Agricultural Engineering Directorate, Punja b).
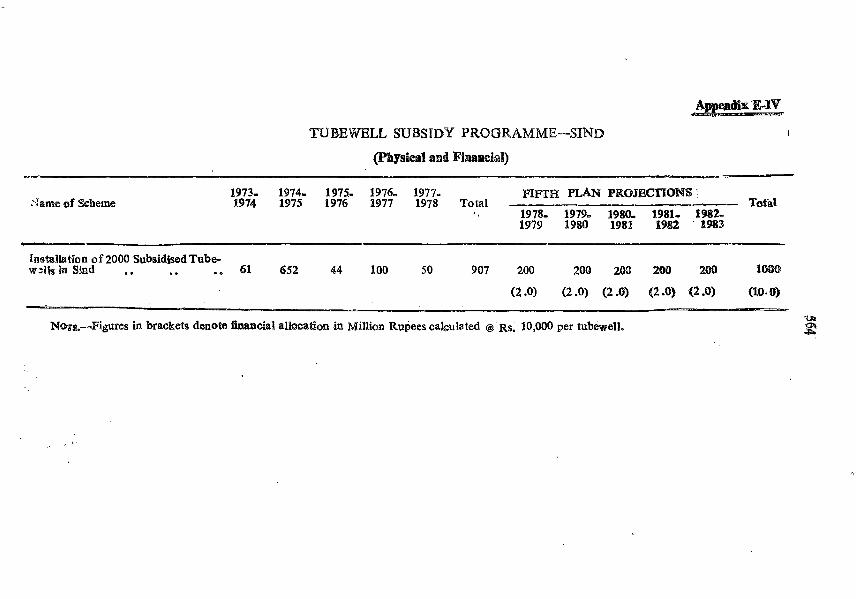
?:am of Scheme 1973- 1974- 1975- 1976.. 1977- FIFTH PLAN PROJBCTIOBIS ' 6974 1975 1976 1977 1978 Total - - Tdal
1978- 1979- 1980- 1981- 198% 1979 1980 1981 1982 8983
drpetalbtion of 2000 Subsidised Tube- w 2lfs in Sind . . . . .. 61 652 44 100 50 807 200 200 200 200 2W f@VO
Wa-Figures in brackets denote financial allcation in Million Rupees cakulated @ RS. 10,000 per tubewell.

9 ~ 9 ~ w wo SSS ESS z6v OLE €82 LSZ IL 86E SL1 821 612 plQ& __ - _ _ _ - __----------- 60~9b 62-5) bz. I) tz. nB (2. r) (2. r )
SZ 52 EZ - - - - - - szs EZ n EZ sz <WA!)eretl003
$&ST$ bbz> (t. 8 [+ 0 6- E ) (8.Z)
PPSI BBZ %eE QVE WE 082 ozz 091 LOT - OSZ - - - z.(sn@yqn& o o o ~ ) ~ ~ ~ s q - ~ ~ a w l n . t

TUBEWELL SUBSIDY PROGRAMME-BALUCHISTAN
(Physical and Financial)
Name of Scheme
Fitb Pbn Projecthns 1972- 1973. 1974- 1975- 1976- 1977- Total Total 1973 1974 1975 1976 1977 1978 1978- 1979- 1988- 4981- 1982-
1979 1980 1981 a982 gJ$3
Installation of Tube&ll on subsidized rates (pumpslengines and periimwbeels). 200 220 160 190 NA 60 830 160 160 160 a60 1160 800
(2 .O) (2 .2) (1 .6) (1 .9) , (0.6) (8.3) (1 -6) (1 -6) (1 -Q (1.6) ($6) (8 .O) tn ' m
Nme: Figures in brackets denote financial allocation in million rupees calculated @I Rs. 10,0001well. a
.

Appendix &'-I
' DRAINAGE AND RECLAMATION
Accelerated Programme
[ (Am to be protected dmhg Fifth P h (1978-79-1982-83)] Milljon aqes (MA)
Drainage mode Puajab Sind N.W.F.P. Bgu- Total ch~stan
- - - - - - -
UseabIe G. W. Tubewells . . . .. 3.13 , 1.41 (1 ~ 2 9 - 4.83
Saline G. W. 'I'ubewells . . . . 0.42 0.70. - - 1.12
, Surface Drains . . . . . . 0 ~ 4 8 0 -54 - 0.04 1.06
Tile Drains . . . . . . - 0.04 0.08 - 0.12
Total : 4.03 2.69 0.37 0.04 7-13 *

DRAINAGE AND RECLAMATION
Annual Phasing PROVINCES
1978-79 1979-80 1980-81 1981-82 B82-83 Total
FGW Tubeweb (Nos.) . . 554 554 554 554 . 554 2770
Surface Drains (Miles) . . 21 33 89 116 144 403
R/R of Tubewells (Nos.) 187 187 188 188 1.88 938
Water Availability (M.A.F.)
FGW Tubewells (Nos.) . . 391 391 391 391 391 1955
SWG Tubewells (~0s . j . . 140 141 141 141 141 704
Surface Drains (Miles) . . 181 226 297 - 317 348 1369
Tile Drains (Miles) . . RJR of Tubewells (Nos.) - 37 37 38 38 150
Water Availability (MAF) 0 -24 0.24 0 -24 0 -24 0.24 8.20
POW Tubewells (Nos.) . . 55 55 55 55 55 275
Tile Drains (Miles) . . 729 964 11.78 ' 1499 2034 6424
Water Availability (MAF) 0.03 0.04 0.03 0.04 0.03 0.17
Surface Drains (Miles) . . 33 - - - - 33
Water Availability (MAF) - - - - - - TOTAL
FGW Tubewells (Nos.) . . 1000 1000 1000 1000 1000 5000 SWG Tubewells (Nos.) . . 235 235 235 236 286 1177 Surface Drains (Miles) . . 235 259 386 433 392 8 805 Tile Drains (Miles) . . 1284 1767 1992 2323 2034 9400 R/R of Tubewells (Nos.) 187 224 225 226 226 1088 Water Availability (MAF) 0.61 0.62 0.61 0.62 0.61 3 -87
No~~.-Water availability from a SCARP trtbewell (FGW) calculated on following assumptions I- Discharge (Q) = 2 -0 cusecs. Annual Utilization Factor = 50% Losses in Watercourses = 15% Annual Water availability at
farmgate. = 665 AF.

dp~eadix P-HBH
DRA1NAGE AND RECLAMATION
(Million Areas)
Fresh1 Salille. Total
Total area to be protected
Noseh
South
Sub-total (A)
Aveaprotected up to 1978
North
South
Sub-total (B)
Area to be ley? to private development :
North (Bari Doab)
South
Sub-total 02.1
4-0 Nil, 4.0
Nil Nil, Nil,
-F
4.00 Nil, 4 4
-- - Sub-total (B) 12 02 5.8 16.0
Balance to beprotected (A-D)
North 7 -8 5 02 13 -0
South 1-9 11.3 83.2
Sub-total (El 9.7 16.5 26.2
* Fresh + mixing.

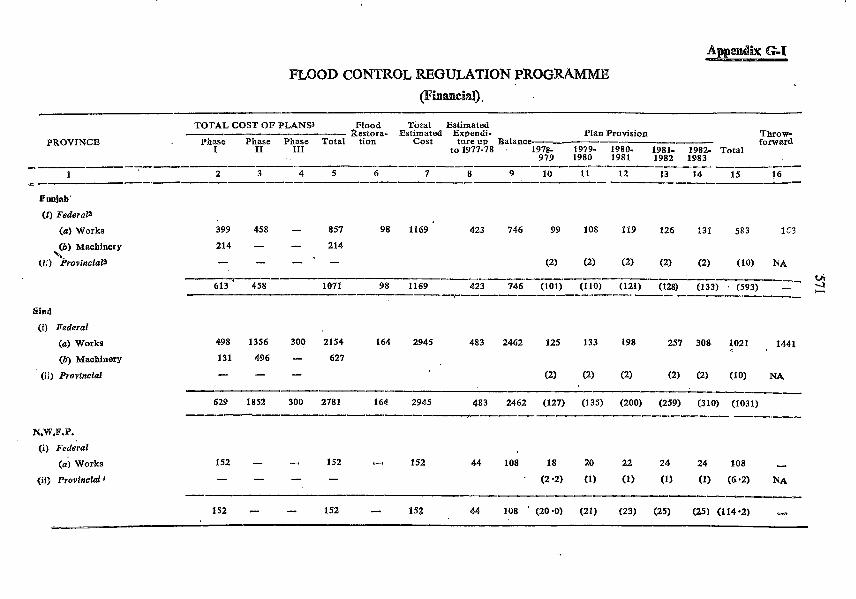
Appe~dix G-I
FLOOD CONTROL REGULATION PROGRAMME (1FbmrciaI).
TOTAL COST OF PLAIIJS3 Flood Total Estimated --- Restora- Estimated Expendi- Plan Provision Throw- PROVINCE Phase Phase Phase Total tion Cost tore up Balance--------- -- forward
I I1 I11 to 1977-78 . 1978- 1979- 1980- 1981- 1 9 8 2 Total 979 1980 1981 1982 1983 - ll_-d--------- --------- ------ --4
1 2 3 4 5 6 7 8 9 10 11 12 I3 I 4 15 16 b - - . - s - - I - - - - - - - - - - - - - - - - - - - - - -
Puujab'
( i ) Federal2
(a) Worka
(b) Machinery b*.
(li) Provincial3
Sind
(i) Federal
(a) Works
(b) Machinery
(ii) Provincial
N.W.F.P.
(i) ~edebal
(a) Works
(ii) Provincfa! 1
Balnchiatan
(i) Federal
(a) Works
(ii) Proviitcial
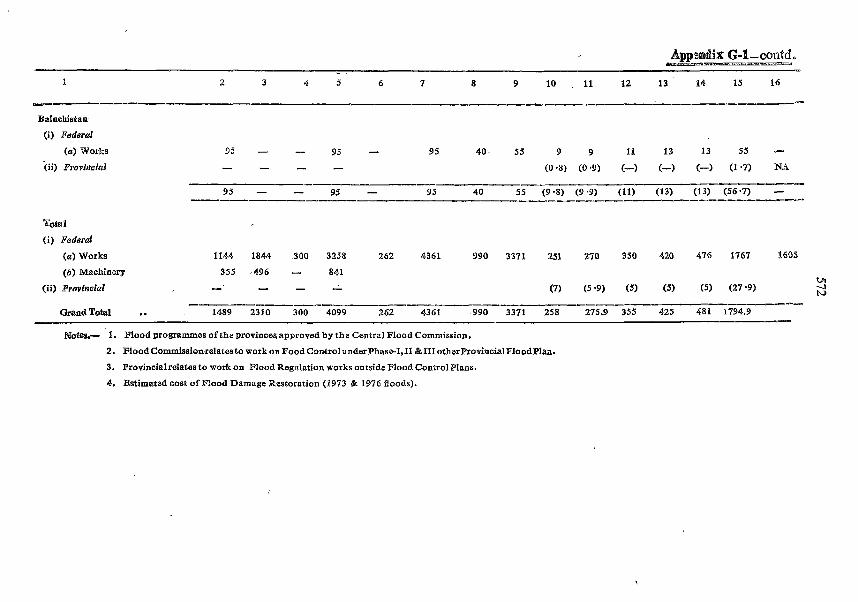
Tots 1
( i) Federd
(a) Works 1144 1844 300 3258 262 4361 990 3371 251 270 350 420 476 1767 1605
( I ) Machinery 355 496 - 841 th
(ii) Provincial - - - - (7) (5 -9) (5) (5) (5) (27.9) -4 N --- ---...-.-- -- -- -
Grand Total .. 1489 2310 300 4099 262 4361 990 3371 258 275.9 355 425 481 1794.9 -- -
Notes.- 1. Flood programmes ofthe province8 approved by the Central Flood Commission.
2. FloodCommissionrelatesto work on FoodControl underphase-1.11 I111 otherProvincialFloodPlail.
3. Provincial relates to work on Flood Regulation works outside Flood ControlPlans.
4. Estimated cost of Flood Damage Restoration (1973 & 1976 floods).

Province Achievement ugto 77-78
Punjab . . .. 1800 3350 5150 630 798 6578 1148 1228 2576 4002 478 522 574 609 633 2816 1186
Bind .. . . .. 2140 3410 5550 250 1246 7046 1320 1496 2817 4229 250 265 395 513 614 2037 2192
N.W.F.P. .. .. 719 - 719 - 161 880 NA NA 100 780 130 145 159 173 173 780 - Baluchistan . . .. 500 - 500 - 15 515 NA NA 148 367 60 60 73 87 87 367 -
-- --------- ---- Total 5159 6760 11919 880 2220 15019 2488 2924 5641 9378 918 992 1201 1382 1507 6000 3373 2
- NOTE: Rate of work in terms of Earthwork assumed as follows :-
Province Total Total Rate of Earth- Cost of work in
work work terms of E/W. (MCF) (M.Rs). Rs/CFT
Punjab .. .. 5150 1071 0.207
Sind o a .. 9550 2781 0.501
N.W.F.P. .. . . 1520 152 0.138
Baluohiatan . . .. 900 95 0.148
- Total 13120 4099 P --
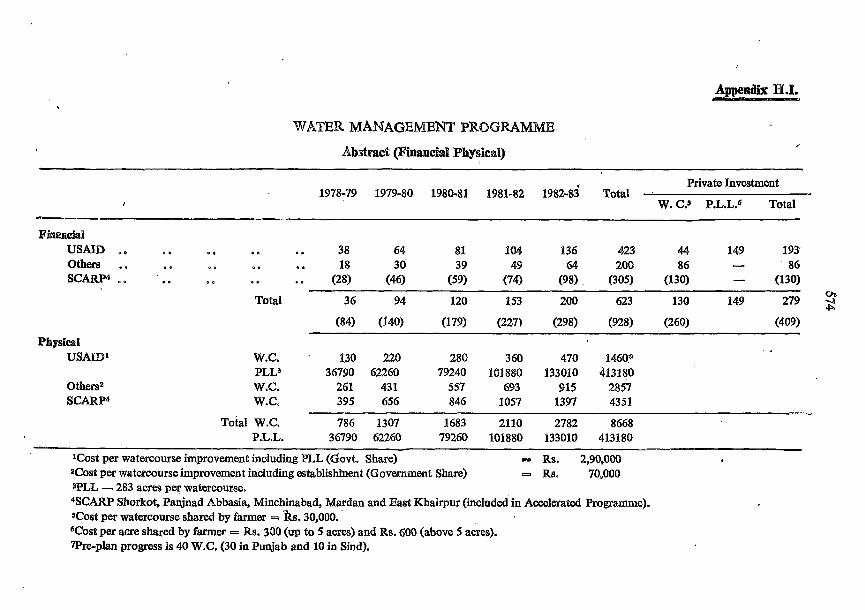
Appendix H.T.
WATER MANAGEMENT PROGUMME
Abstract (Financial Physicd)
Private Investment 1978-79 1979-80 1980-81 1981-82 1982-83' Total
W. C.5 P.L.L.6 Tot J
Binancia1 USAID .. a , a o a + . . 38 64 81 104 136 423 44 149 193 Others . . @ o Q o n - . . 18 30 39 49 64 200 86 - 86 S C W . . . . Q a . * . . (28) (46) (59) (74) (98) (305) (130) - (130)
Total 36 94 120 153 200 623 130 149 Vt
279 2
8 .
W.C. 130 220 280 360 470 1460tp J?LL3 36790 62260 79240 101880 133010 413180 W.C. 261 431 557 693 915 2857 W.C. 395 656 846 1057 1397 4351
Tokl W.C. 786 1307 11683 2110 2782 8668 P.L.L. 36790 62260 79260 101880 133010 413180
'Cost per watercourse improvement including PLL (Govt. Share) - Rs. 2,90,000 z&st per watercourse improvement including establishtnent (Government Share) 0 Rs. 70,000 VLL - 283 acres per watercourse. 4SC?ARP Shorkot, Panjnad Abbasia, Minchinabad, Mardan and East Khairpur (included in Accelerated Rogame) ) . SCost per watercourse shared by farmer - ks. 30,000. West per acre shared by farmer = Rs. 300 (up to 5 acres) and Rs. 600 (above 5 acres). 7Pre-plan progress is 40 W.C. (30 in Punjab and 10 in Sind).

WATER MANAGEMENT PROGRAMME ' @ha~sial (~zrovhse-wise)
197879 1979-80 1980-81 1981-82 1982-83 Tcta l
--+ ( - - - - ---- Total 32 -9 55 .O 70 .I 89.4 116.8 364 -0
0 thm 6 5 10 -5 13 .4 16.5 22.1 69 .O
SCARP f0 -7) (1.2) (1.5) (1 .9) (2.5) (7.8)

Appendix H-II-contd.
Total 3.4 5 07 7.4 9.3 12.2 38 .0
W SAD3
Other
SCARP
Total
USAID
0 ther
SCARP
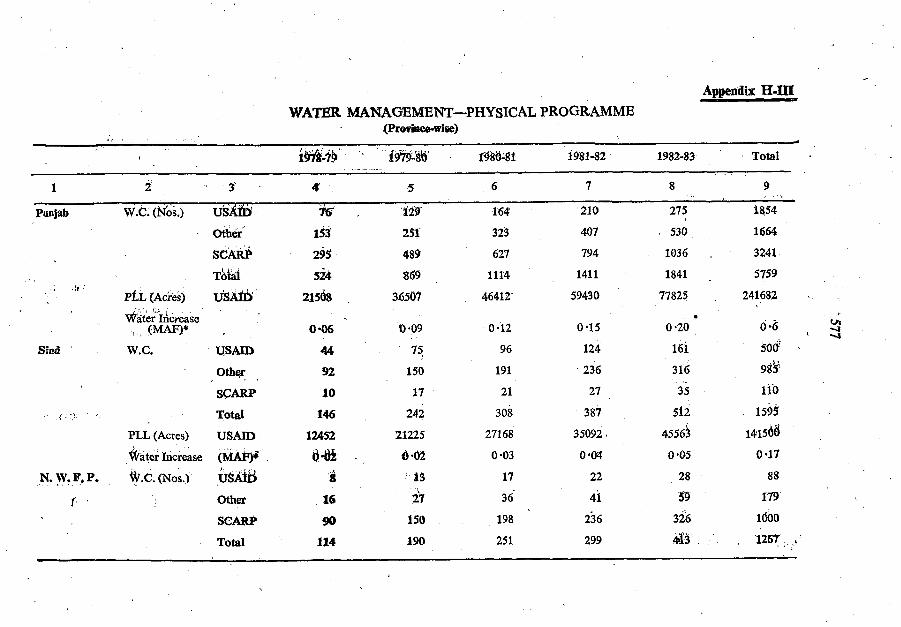
Appendix H-III WATER MANACZlMENT-PHYSICAL PROGRAMME
<Proviwewise) . , &$&'
1 ~ 9 W b I&@-81 1981-82 1982-83 Total . - ..
1 2 3 4 5 6 7 8 9
Punjab W.C. (Nos.) US& 7 ' 6 , $29' 164 210 275 I854
Other 133 251 323 407 530 1664
. :a
PLL (Ac'res) US& 21568 36507 46412 59430 77825 241682 . dcite;~ricrease
WAF)* 0.06 0.09 0.12 O el5 0.20 0.6 , y ul
Siad W.C. USAID 44 75 96 124 161 500: ,
Other 92 150 191 236 316 9& . ,
S a m ' 10 17 21 27 35 1 10
. .. Total 146 242 308 3 87 512 1593
PLL (Acres) USAID 12452 21225 27168 35092 45563 1415d6
@ater Increase (w &a . - 4 -02 0 -03 0.04 0 -05 0 -17
N.W.F.P. V.c.(Nos.) US& d ' 13 17 22 28 88
I. . Other 16 27 36 4i 3 179
SCARP 90 150 198 23 6 326 ldoo Total 114 I90 251 299 441 1267 ,
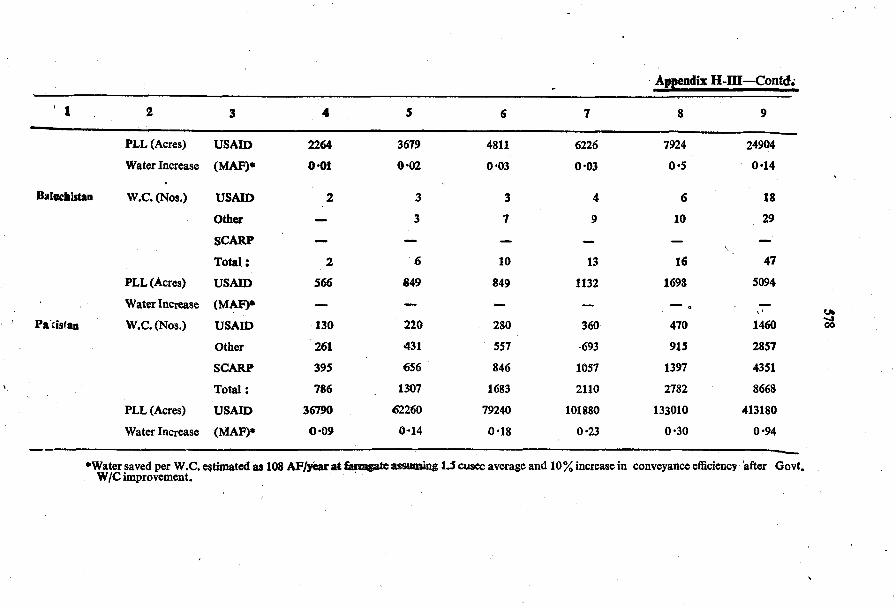
Appendix H-III-Contd;
PLL (Acres) USAID 2264 3619 4811 6226 7924 24904
Water Increase ( M m * 0 -01 0 -02 0 a03 0.03 0 -5 0 -14
Balachiistnn W.C. (Nos.) USAID 2 3 3 4 6 18
Other - 3 7 9 10 29
SCARP - - - - - - \
Total : 2 6 10 13 16 47
PLL (Acres) USAID 565 849 849 1132 1698 5094
Water Increase (MAW - - - - - . - \
' Pa'iisfan W.C. (Nos.) USAID 130 220 280 360 470 1460
Other 261 431 557 - 693 91 5 2857
SCARP 395 656 846 1057 1397 4351 , Total : 786 1307 1683 2110 2782 8668
PLL (Acres) USAID 36790 62260 79240 101880 133010 413180
Water Increase (MAP)* 0 009 0-14 0 -18 0.23 0 030 0.94
*Water saved per W.C. estimated as 108 AFjykarrt ZBUSD@ 13 CUS~C average and 10% increase in conveyance efficiency 'after Govt. WIC improvement.

579 - Appenerx 1-1
COST INDICATORS
REGIONS
systems Unit - I-_Y_-_
Punjab Sind N.W.F.P. Balu- FATA chistan
I. Irrigation . , (a) Irrigation Channel :
1 Cost l~ i le of Irrigation Channel M. Rs. 0.80 1 .00 0 -90 1 .w - 2. Cost of EarthworklMile of irri- Do. 0 .I5 0.19 0 .IS 0.19 -
gation Channels.
3. Quantity of EarthworklMile of MCF 1 .SO 1.90 1.5 1.90 - Channel.
4. Rateof Earthwork per 1000 Cft. Rs. 100 125 100 125 - 5. Cos t/Milefor planning and iro'ect
Preparation of new canal/ex- tension Schemes.
(b) Irrigation Tubewells :
1. Cost12 cusec TIW. .. .. M.Rs. 0.10 0.15 0.20 - - 2. Cost11 cusec TIWell . . .. Do. - - - 0.3 0.3
to to 0.5 0.5
(c) Channal Enlargement and Remodelling :
1. CosflA: F. increase in water Rs. 600 600 600 600 - availability.
r
2. Cost per Mile . . . M R . 0.5 0.5 0.5 0.5 0.5
3. CostlMile for Planning and 50- ject preparation of remodelllrlg Schemes
11. Drainage -& Reclamation
Rupees
1. Cost per Tubewell . . . . . . . . . . ' 5,70,000
2. Cost per Mile : . . (I) Surface Drains other than Outfalls . . . . . . 7,23,000
(ti) Outfall Drains . . . . . . . . . 11 ,OO,oO~
3. Cost per Mile (Tile Drainage) . . . . . . . . 93,400
4. Cost per MCF :
( I ) Surface Drains other than Outfall's . . . . .. 5,36,000
(if) Outfall Drains . . . . . . . . . . 6,20,000 -

COST INDICATORS --~ontd.
Systems Unit - Punjab Sind N.WbF.P. Balu- FATA
chistan
5. Cost per acre Protected (CCA) (vertical Drainage)
(i) North Zone . . . . . . . . 778 (FGW) 57&- (3c4-w)
(ii) South Zone . . . . . . . . 1096- 1267. (FGW) 570 (SGW) -
6. Co@ p g acqp~otecte4 CCCAJ Surface dxains'oiher 600 than outfalls.
7. Costper acre potected (QCA) (Tile Drainage) 7,500
8. Cost Per Planning/Project PreParStion Per acre (CCA)
(i) Vertical Bminage (FGW) - . . . . 20
(ii) Vertical Drainage (SGW) . . .., 30
9. Cost of Planning & Project preparation per acre (CCA) (Surface Drainage).
10 - 10. Cost of Planning & Project Preparation per acre 5 0
(CCA) (Tile DrBinBeb. .
11. FEC as hrcentage of Capttal CostVertical Dralimge (FGW)
35 %
12. FEC as percentage of capital cost-vertical 40% Drainage (SGW)
13. FEC as peFentage of Capital Cost (Surface , 25% Drainage Outfafl~ralnsJ:
I C F W as pereeatage of Capital Cost (Surface Drainage -Others)
15. FEC as percentage of Capital Cost (Tile Drains3 20%
16. . F G ~ area protected per tubewell (2 cusecs capacity) :
(i) North Zone . . . . . . . . (ii)' Sooth Zone . . . . . . . .
733 acres.
4503550 acres. -
17. SGW area pratected per tubewell (3 cusecs capacity) :
North & South . . . . . . . . *. 6 1,000 apes,
18. Replacement Cost D£ Tubewell . . . .: ~ , O O , ~ O Q
111. Subsitly fsiJbstaUation Private Irrigation Tubewells
Barad-Area .. . . . . . . .a e 12,000.
SailabaArea .. . . . . . . . . 10,000