Chapter Vii Fs
29
CHAPTER VII FINANCIAL STUDY The financial aspect of the project feasibility study quantifies the result of all the phase of the project study and expresses in peso terms the potable outcome of operating the project. Basically, project studies consist of the skillful coordination of various information on all factors in the form of financial projections. It covers all the factors that are pertinent to an intended venture having established the existence of a sample market and the feasibility of the production facilities to supply the market, the investigation move on the study of finance cost. What remains is to study the result of the market and technical studies. Objectives: a. To make a realistic, complete, and conservative estimate of the total cost to put up a project of its capital requirements, b. To determine the amount of capital financing available and borrowings needed, including possible source and terms, c. To make complete, safe, and realistic projections of operating cost and revenues, d. To determine the necessary financial arrangements to insure that the project will have the cash it needs when required,
-
Upload
kagami-elie -
Category
Documents
-
view
8 -
download
1
Transcript of Chapter Vii Fs

CHAPTER VII
FINANCIAL STUDY
The financial aspect of the project feasibility study quantifies the result of all the
phase of the project study and expresses in peso terms the potable outcome of
operating the project.
Basically, project studies consist of the skillful coordination of various information
on all factors in the form of financial projections. It covers all the factors that are
pertinent to an intended venture having established the existence of a sample market
and the feasibility of the production facilities to supply the market, the investigation
move on the study of finance cost. What remains is to study the result of the market
and technical studies.
Objectives:
a. To make a realistic, complete, and conservative estimate of the total cost to put up a
project of its capital requirements,
b. To determine the amount of capital financing available and borrowings needed,
including possible source and terms,
c. To make complete, safe, and realistic projections of operating cost and revenues,
d. To determine the necessary financial arrangements to insure that the project will
have the cash it needs when required,
e. To determine the company’s earnings performance and the soundness and liquidity
of its financial positions.

MAJOR ASSUMPTIONS

Exhibit A
ISKOLARS' TAMBAYAN ENTERTAINMENT HUB
Projected Statement of Financial Position
As of the Year Ended December 31, 2013-2017
SCHEDULE 2013 2014 2015 2016 2017
ASSET
Current Assets
Cash on Hand 275,491.83 364,847.56 441,338.65 498,099.42 535,253.64
Cash in Bank 150,000.00 250,000.00 350,000.00 450,000.00 550,000.00
Office Supplies 725.94 544.45 408.34 306.25 229.69
Store Supplies 704.55 457.96 297.67 193.49 125.77
Prepaid Rent 75,000.00 75,000.00 75,000.00 75,000.00 75,000.00
Total Current Assets 501,922.31 690,849.97 867,044.66 1,023,599.16 1,160,609.10
Non-Current Assets
Audio-Visual Equipments 299,840.50 257,006.14 214,171.79 171,337.43 128,503.07
Less: Accumulated Depreciation-Audio-Visual Equipments 42,834.36 42,834.36 42,834.36 42,834.36 42,834.36
Furniture and Fixtures 39,899.00 31,919.20 23,939.40 15,959.60 7,979.80
Less: Accumulated Depreciation- Furnitures and Fixtures 7,979.80 7,979.80 7,979.80 7,979.80 7,979.80
Leasehold Improvements 166,900.00 150,210.00 133,520.00 116,830.00 100,140.00
Less: Accumulated Depreciation- Leasehold improvements 16,690.00 16,690.00 16,690.00 16,690.00 16,690.00
Total Non-Current Assets 439,135.34 371,631.19 304,127.03 236,622.87 169,118.71
Total Assets 941,057.66 1,062,481.15 1,171,171.69 1,260,222.03 1,329,727.82
LIABILITIES AND CAPITAL
SSS Payable 4,044.00 4,044.00 4,044.00 4,200.00 4,200.00
PhilHealth Payable 950.00 950.00 950.00 950.00 950.00
Pag-ibig Payable 1,545.60 1,545.60 1,545.60 1,616.64 1,616.64
Utilities Payable 10,500.00 10,911.60 11,339.33 11,783.84 12,245.76
Witholding Tax Payable 950.33 950.33 950.33 950.33 950.33
Income Tax Payable 5,062.68 7,795.68 10,898.57 13,768.19 16,648.69

Witholding Tax Payable for Rent 1,250.00 1,250.00 1,250.00 1,250.00 1,250.00
Non Refundable Security Deposit 75,000.00 75,000.00 75,000.00 75,000.00 75,000.00
Total Liabilities 99,302.61 102,447.21 105,977.83 109,518.99 112,861.42
PARTNER'S EQUITY
Culata, Zaileen's Capital 175,000.00 210,438.76 240,008.49 266,298.46 287,675.76
Lucero, Avegail's Capital 175,000.00 210,438.76 240,008.49 266,298.46 287,675.76
Pineda III, Tito's Capital 175,000.00 210,438.76 240,008.49 266,298.46 287,675.76
Velasco, Pauline Agnes' Capital 175,000.00 210,438.76 240,008.49 266,298.46 287,675.76
Net Income 141,755.05 218,278.90 305,159.91 385,509.18 466,163.35
Less: Withdrawal 100,000.00 200,000.00 300,000.00 400,000.00
Total Capital 841,755.05 960,033.95 1,065,193.86 1,150,703.04 1,216,866.39
Total Liabilities and Capital 941,057.66 1,062,481.15 1,171,171.69 1,260,222.03 1,329,727.82
EXHIBIT B
ISKOLARS’ TAMBAYAN ENTERTAINMENT HUB

STATEMENT OF REVENUES AND EXPENSES
FOR THE YEAR ENDED DECEMBER 31, 2013-3017
SCHEDULE 2013 2014 2015 2016 2017
Service Revenue 1,267,260.11 1,381,248.61 1,507,151.00 1,646,152.43 1,765,523.93
Less: Operating Expenses
Salaries Expense 446,174.04 446,174.04 446,174.04 463,626.84 463,626.84
SSS ER Contribution 33,128.40 33,128.40 33,128.40 34,399.20 34,399.20
PhilHealth ER Contribution 5,700.00 5,700.00 5,700.00 5,700.00 5,700.00
Pag-IBIG ER Contribution 9,273.60 9,273.60 9,273.60 9,273.60 9,699.84
13th Month Pay 38,640.00 38,640.00 38,640.00 40,185.60 40,185.60
Office Supplies 2,903.74 2,177.81 1,633.35 1,225.02 918.76
Store Supplies 2,013.00 1,308.45 850.49 552.82 359.33
Advertising Expenses 17,500.00 14,375.00 12,031.25 10,273.44 8,955.08
Utilities Expense 126,000.00 130,939.20 136,072.02 141,406.04 146,949.16
Rent Expenses 285,000.00 285,000.00 285,000.00 285,000.00 285,000.00
Depreciation Expense 67,504.16 67,504.16 67,504.16 67,504.16 67,504.16
Repairs and Maintenance Cost - 5,000.00 5,000.00 5,000.00 5,000.00
Organizational Costs 1,215.00 500.00 500.00 500.00 500.00
Withholding Tax Expense-Employee 11,403.96 11,403.96 11,403.96 12,481.32 12,481.32
Withholding Tax Expense-Rent 15,000.00 15,000.00 15,000.00 15,000.00 15,000.00
Permits and Licenses 3,297.00 3,297.00 3,297.00 3,297.00 3,297.00
Total Operating Expenses 1,064,752.90 1,069,421.61 1,071,208.27 1,095,425.03 1,099,576.29
Income Before Tax 202,507.21 311,827.00 435,942.73 550,727.40 665,947.65
Income Tax (30%) 60,752.16 93,548.10 130,782.82 165,218.22 199,784.29
NET INCOME (LOSS) 141,755.05 218,278.90 305,159.91 385,509.18 466,163.35
EXHIBIT C
ISKOLARS’ TAMBAYAN ENTERTAINMENT HUB
PROJECTED STATEMENT OF PARTNER'S CAPITAL

FOR THE YEAR ENDED DECEMBER 31, 2013-3017
2013 2014 2015 2016 2017
Culata, Capital
Beginning Balance 175,000.00 210,438.76 240,008.49 266,298.46 287,675.76
Add: Income (Loss) 35,438.76 54,569.73 76,289.98 96,377.30 116,540.84
Less: Withdrawals - 25,000.00 50,000.00 75,000.00 100,000.00
Ending Balance 210,438.76 240,008.49 266,298.46 287,675.76 304,216.60
Lucero, Capital
Beginning Balance 175,000.00 210,438.76 240,008.49 266,298.46 287,675.76
Add: Income (Loss) 35,438.76 54,569.73 76,289.98 96,377.30 116,540.84
Less: Withdrawals - 25,000.00 50,000.00 75,000.00 100,000.00
Ending Balance 210,438.76 240,008.49 266,298.46 287,675.76 304,216.60
Pineda, Capital
Beginning Balance 175,000.00 210,438.76 240,008.49 266,298.46 287,675.76
Add: Income (Loss) 35,438.76 54,569.73 76,289.98 96,377.30 116,540.84
Less: Withdrawals - 25,000.00 50,000.00 75,000.00 100,000.00
Ending Balance 210,438.76 240,008.49 266,298.46 287,675.76 304,216.60
Velasco, Capital
Beginning Balance 175,000.00 210,438.76 240,008.49 266,298.46 287,675.76
Add: Income (Loss) 35,438.76 54,569.73 76,289.98 96,377.30 116,540.84
Less: Withdrawals - 25,000.00 50,000.00 75,000.00 100,000.00
Ending Balance 210,438.76 240,008.49 266,298.46 287,675.76 304,216.60
EXHIBIT D
ISKOLARS' TAMBAYAN ENTERTAINMENT HUB
STATEMENT OF CASH FLOWS

FOR THE YEAR ENDED DECEMBER 31, 2013-3017
2013 2014 2015 2016 2017
NET INCOME 141,755.05 218,278.90 305,159.91 385,509.18 466,163.35
Collections from Bank 3,187.50 5,312.50 7,437.50 9,562.50
Add: Depreciation 67,504.16 67,504.16 67,504.16 67,504.16 67,504.16
TOTAL 209,259.20 285,783.06 372,664.06 453,013.34 533,667.51
Initial cash investment 700,000.00
SSS Payable 4,044.00 - - 156.00 -
PhilHealth Payable 950.00 - - - -
Pag-ibig Payable 1,545.60 - - 71.04 -
Utilities Payable 10,500.00 411.60 427.73 444.50 461.93
Witholding Tax Payable 950.33 - - - -
Income Tax Payable 5,062.68 2,732.99 3,102.89 2,869.62 2,880.51
Witholding Tax Payable for Rent 1,250.00 - - - -
TOTAL 724,302.61 3,144.59 3,530.63 3,541.16 3,342.43
TOTAL SOURCES AVAILABLE FOR USE 933,561.81 288,927.65 376,194.69 456,554.50 537,009.94
USES OF FUNDS:
Acquisition of Audio-visual Equipment 299,840.50 - - - -
Acquisitions for Furniture 39,899.00
Acquisition for Leasehold Equipment 166,900.00
Acquisition for Supplies 725.94 (181.48) (136.11) (102.08) (76.56)
Acquisition for Supplies 704.55 (246.59) (160.29) (104.19) (67.72)
Withdrawals - 100,000.00 200,000.00 300,000.00 400,000.00
Investments in Bank 150,000.00 100,000.00 100,000.00 100,000.00 100,000.00
TOTAL USES DEDUCTIONS TO SOURCE 658,069.99 199,571.92 299,703.60 399,793.73 499,855.72
TOTAL INCREASE IN CASH 275,491.83 89,355.73 76,491.09 56,760.77 37,154.23
Cash Beginning of Year 0 275,491.83 364,847.56 441,338.65 498,099.42
Cash, End of Year 275,491.83 364,847.56 441,338.65 498,099.42 535,253.64

CHAPTER VIII
SCHEDULES


SCHEDULE 2.1
ISKOLARS' TAMBAYAN ENTERTAINMENT HUB
Staffing and Costing
Monthly Salaries For the Years 2013-2015
PositionBasic
Monthly SSS Phil Health PagIbigWithholdin
g Monthly 13th
Net Annua
l
Pay ER EE EC ER EE ER EE TaxNet
SalaryMonth
PayPaym
ent
Manager 12,000.00 848.00 400.00 10.00 150.00 150.00 240.00 240.00 950.33 10,259.67 12,000.00135,11
6.04
Bookkeeper (On-call) 3,500.00 - - - - - - - - 3,500.00 -
42,000.00
Cashier 9,120.00 636.00 300.00 10.00 112.50 112.50 182.40 182.40 - 8,525.10 9,120.00111,42
1.20
Attendant 1 9,120.00 636.00 300.00 10.00 112.50 112.50 182.40 182.40 - 8,525.10 9,120.00111,42
1.20
Security Guard 8,400.00 600.70 283.30 10.00 100.00 100.00 168.00 168.00 - 7,848.70 8,400.00102,58
4.40
Total (monthly) 42,140.00 2,720.70 1,283.30 40.00 475.00 475.00 772.80 772.80 950.33 38,658.57
Total (annually) 505,680.00 32,648.40 15,399.60480.0
0 5,700.005,700.0
0 9,273.60 9,273.60 11,403.96463,902.8
4 38,640.00502,54
2.84

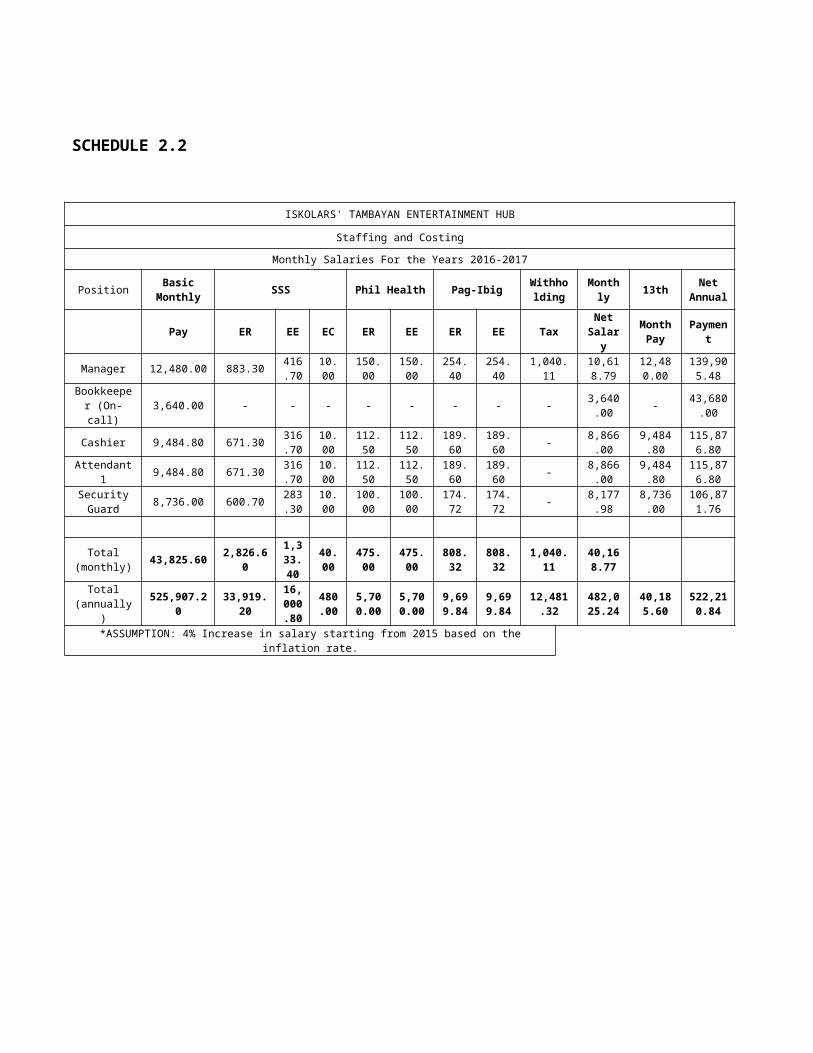
SCHEDULE 2.2
ISKOLARS' TAMBAYAN ENTERTAINMENT HUB
Staffing and Costing
Monthly Salaries For the Years 2016-2017
PositionBasic
MonthlySSS Phil Health Pag-Ibig
Withholding
Monthly
13thNet
Annual
Pay ER EE EC ER EE ER EE TaxNet
SalaryMonth
PayPayme
nt
Manager 12,480.00 883.30416.70
10.00
150.00
150.00
254.40
254.40
1,040.1110,618.
7912,480.
00139,905
.48Bookkeeper
(On-call)3,640.00 - - - - - - - -
3,640.00
-43,680.
00
Cashier 9,484.80 671.30316.70
10.00
112.50
112.50
189.60
189.60
-8,866.0
09,484.8
0115,876
.80
Attendant 1 9,484.80 671.30316.70
10.00
112.50
112.50
189.60
189.60
-8,866.0
09,484.8
0115,876
.80Security Guard
8,736.00 600.70283.30
10.00
100.00
100.00
174.72
174.72
-8,177.9
88,736.0
0106,871
.76
Total (monthly)
43,825.60 2,826.601,333.40
40.00
475.00
475.00
808.32
808.32
1,040.1140,168.
77
Total (annually)
525,907.2033,919.2
0
16,000.80
480.00
5,700.00
5,700.00
9,699.84
9,699.84
12,481.32
482,025.24
40,185.60
522,210.84
*ASSUMPTION: 4% Increase in salary starting from 2015 based on the inflation rate.
SCHEDULE NO. 3
SSS PAYABLE 2013 2014 2015 2016 2017
BEGINNING 2,760.70 2,760.70 2,760.70 2,760.70
ADD: AMOUNT TO BE REMITTED33,128.4
033,128.4
033,128.4
034,399.2
034,399.2
0
TOTAL33,128.4
035,889.1
035,889.1
037,159.9
037,159.9
0LESS: REMITTED SSS CONTRIBUTIONS
30,367.70
33,128.40
33,128.40
34,399.20
34,399.20
ENDING 2,760.70 2,760.70 2,760.70 2,760.70 2,760.70

SCHEDULE NO.4
SSS CONTRIBUTIONS
Position
2013 2014 2015 2016
ER EC EE ER EC EE ER EC EE ER EC EE
Manager 848.
00 10.0
0 400.0
0 848.
00 10.0
0 400.0
0 848.
00 10.0
0 400.0
0 883.
30 10.0
0 416.70
Cashier636.0
010.0
0 300.00
636.00
10.00
300.00636.0
010.0
0 300.00
671.30
10.00
316.70
Attendant 1636.0
010.0
0 300.00
636.00
10.00
300.00636.0
010.0
0 300.00
671.30
10.00
316.70
Security Guard
600.70
10.00
283.30600.7
010.0
0 283.30
600.70
10.00
283.30600.7
010.0
0 283.30
Total (monthly)
2,760.70
1,283.30 2,760.70 1,283.30 2,760.70 1,283.30 2,866.
60 1,333.40
Total (annually)
33,128.4015,399.6
0 33,128.
40 15,399.6
0 33,128.
40 15,399.6
034,399.20
16,000.80
SCHEDULE NO.5
PHILHEALTH PAYABLE
2013 2014 2015 2016 2017
BEGINNING 475.00 475.00 475.00 475.00
ADD: AMOUNT TO BE REMITTED 5,700.00 5,700.00 5,700.00 5,700.00 5,700.00
TOTAL 5,700.00 6,175.00 6,175.00 6,175.00 6,175.00
LESS: REMITTED SSS CONTRIBUTIONS 5,225.00 5,700.00 5,700.00 5,700.00 5,700.00
ENDING 475.00 475.00 475.00 475.00 475.00
SCHEDULE NO. 6

PHILHEALTH CONTRIBUTIONS
Position 2013 2014 2015 2016
ER EE ER EE ER EE ER EE
Manager 150.00
150.00
150.00
150.00
150.00
150.00
150.00
150.00
150.00
Cashier 112.50 112.50 112.50 112.50 112.50 112.50 112.50 112.50
Attendant 1 112.50 112.50 112.50 112.50 112.50 112.50 112.50 112.50
Security Guard 100.00 100.00 100.00 100.00 100.00 100.00 100.00 100.00
Total (Monthly) 475.0
0 475.0
0 475.0
0 475.0
0 475.0
0 475.0
0 475.0
0 475.0
0
Total (Annually) 5,700.0
0 5,700.0
0 5,700.00 5,700.00 5,700.00 5,700.00 5,700.00 5,700.00
SCHEDULE NO. 7
PAG-IBIG PAYABLE
2013 2014 2015 2016 2017
BEGINNING 772.80 772.80 772.80 772.80
ADD: AMOUNT TO BE REMITTED9,273.60 9,273.60 19,399.68
19,399.68 19,399.68
TOTAL9,273.60
10,046.40 20,172.48
20,172.48 20,172.48
LESS: REMITTED SSS CONTRIBUTIONS8,500.80 9,273.60 19,399.68
19,399.68 19,399.68
ENDING772.80 772.80 772.80 772.80 772.80
SCHEDULE NO. 8
PAG-IBIG CONTRIBUTIONS
Position 2013 2014 2015 2016
ER EE ER EE ER EE ER EE ER
Manager 240.00
240.00 240.00 240.00 254.40 254.40 254.40 254.40 254.40
Cashier 182.40 182.40 182.40 182.40 189.60 189.60 189.60 189.60 189.60
Attendant 1 182.40 182.40 182.40 182.40 189.60 189.60 189.60 189.60 189.60
Security Guard 168.00 168.00 168.00 168.00 174.72 174.72 174.72 174.72 174.72
Total (Monthly) 772.8
0 772.80 772.80 772.80
808.32
808.32
808.32
808.32
808.3
Total (Annually) 9,273.60 9,273.60 9,273.60 9,273.60 9,699.8
4 9,699.8
4 9,699.8
4 9,699.8
4 9,699.8
SCHEDULE NO. 9.1
SCHEDULE NO.9.2
SCHEDULE NO. 9.3
WITHHOLDING TAX EXPENSE - EMPLOYEE
Position 2013 2014 2015 2016 2017
Manager 11,403.96
11,403.96
11,403.96
12,481.32
12,481.32
TOTAL 10,453.63
11,403.96
11,403.96
12,481.32
12,481.32
WITHHOLDING TAX PAYABLE - RENT (5%)
2013 2014 2015 2016 2017
Beginning Balance
-
3,750.00
3,750.00
3,750.00
3,750.00
Withholding Tax 15,000.00
15,000.00
15,000.00
15,000.00
15,000.00
Total Balance 15,000.00
18,750.00
18,750.00
18,750.00
18,750.00
Less: Payment 11,250.00
15,000.00
15,000.00
15,000.00
15,000.00
Ending Balance 3,750.00
3,750.00
3,750.00
3,750.00
3,750.00

WITHHOLDING TAX CONTRIBUTIONS
2013 2014 2015 2016 2017
Yearly Withholding tax
10,453.63
11,403.96
11,403.96
12,481.32
12,481.32
Less: Year-end Payable
950.33
950.33
950.33
950.33
950.33
Payment 9,503.30
10,453.63
10,453.63
11,530.99
11,530.99
Add: Previous Payable
-
950.33
950.33
950.33
950.33
Payment 9,503.30
11,403.96
11,403.96
12,481.32
12,481.32
SCHEDULE NO. 10
INCOME TAX (30%)
2013 2014 2015201
6201
7
Beginning Balance -
(12,311.73)
1,057.51
Income tax for the year
(792.91)
25,001.81
Total (792.91)
12,690.07
Less: Payment 11,518.82
11,632.57
Ending Balance (12,311.73)
1,057.51
SCHEDULE NO. 11
AUDIO-VISUAL EQUIPMENTS
Description Quantity Unit CostDepreciable
CostUseful Life Annual Depreciation
Videoke-Karaoke 7 20,600.00 144,200.00 7 20,600.00

machine
Playstation3 500gb 2 13,500.00 27,000.00 7 3,857.14
Nintendo Wii Console 2 9,800.00 19,600.00 7 2,800.00
Xbox 360 4gb 2 12,800.00 25,600.00 7 3,657.14
Games Software 9 944.50 8,500.50 7 1,214.30
32 LCD TV 6 9,990.00 59,940.00 7 8,562.86
Computer Set 1 15, 000.00 15,000.00 7 2,142.86
TOTAL
299,840.50 42,834.30
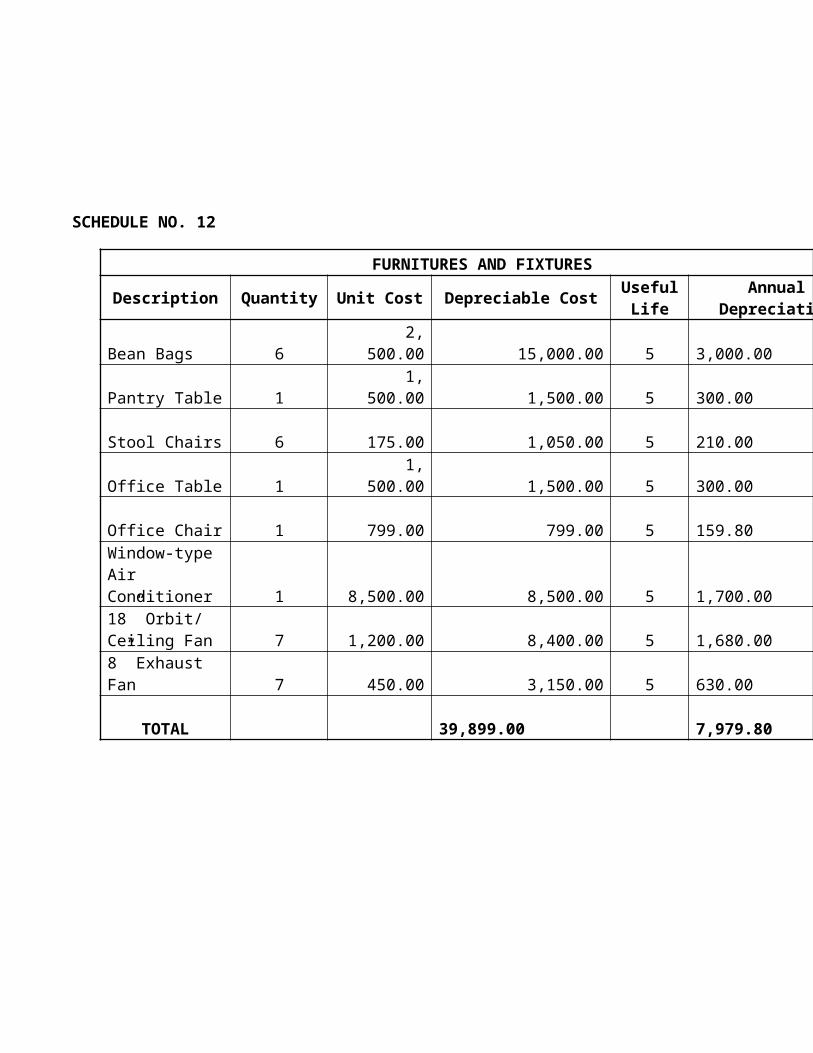
SCHEDULE NO. 12
FURNITURES AND FIXTURES
Description Quantity Unit Cost Depreciable CostUseful
LifeAnnual Depreciation
Bean Bags 6 2, 500.00 15,000.00 5 3,000.00
Pantry Table 1 1, 500.00 1,500.00 5 300.00
Stool Chairs 6 175.00 1,050.00 5 210.00
Office Table 1 1, 500.00 1,500.00 5 300.00
Office Chair 1 799.00 799.00 5 159.80 Window-type Air Conditioner 1 8,500.00 8,500.00 5 1,700.00

18” Orbit/ Ceiling Fan 7 1,200.00 8,400.00 5 1,680.00
8” Exhaust Fan 7 450.00 3,150.00 5 630.00
TOTAL 39,899.00 7,979.80
SCHEDULE NO.13
LEASEHOLD IMPROVEMENTS
Description Depreciable Cost Useful Life Annual Depreciation
Woodworks 50,800.00 10 5,080.00
Electrical 50,000.00 10 5,000.00
Flooring 22,400.00 10 2,240.00
Glass Panels 21,000.00 10 2,100.00
Paintworks 12,500.00 10 1,250.00
Others 10,200.00 10 1,020.00
TOTAL 166,900.00 16,690.00

SCHEDULE NO. 14
OFFICE SUPPLIES
Items Price No. of Units Total
Log Book 49.75 5 pcs. 248.75
Ball pen 35.00 2 dozen 70.00
Columnar 20.00 5 pcs. 100.00
Folder 78.25 2 packs 156.50
Fastener 35.00 2 boxes 70.00
Stapler 49.95 2 pcs. 99.90
Staple Wire 15.00 5 boxes 75.00
Scotch Utility Tape 40.00 3 pcs. 120.00
Calculator 250.00 2 pcs. 500.00

Payroll Envelope 17.75 4 packs 71.00
Puncher 180.00 1 pc. 180.00
Paper clip 8.25 5 boxes 41.25
Cutter 18.00 3 pcs. 54.00
Glue 34.75 2 pcs. 69.50
Scissors 39.75 3 pcs. 119.25
Sharpener 15.00 2 pcs. 30.00
Cash box 300.00 2 pcs. 600.00
Long Bond Papers 126.00 1 ream 126.00
Short Bond Papers 105.00 1 ream 105.00
Pencil 24.00 1 pack 24.00
Receipt Paper 14.53 3 pcs. 43.59
Total 2,903.74
SCHEDULE NO. 15
OFFICE SUPPLIES EXPENSEParticulars 2013 2014 2015 2016
Office Supplies, Beginning
-
725.94
544.45
408.34
Purchases 2,903.74
2,177.81
1,633.35
1,225.02
Less: Office Supplies, End
725.94
544.45
408.34
306.25
Office Supplies Expense
2,177.81
2,359.29
1,769.47
1,327.10
*ASSUMPTION: Office Supplies, end will be 25% of Purchases
SCHEDULE NO. 16
STORE SUPPLIESParticulars Unit Cost No. Of Units
Floor Mop 105 1Pail 30 1Rags 25 10Broom 55 2
Trash Bin 75 2
Dipper 19 1
Toilet Deodorizer 28 3
Detergent 480 1
Dust Pan 35 1Wall clock 250 1Attendants' Uniform 250 2Total
SCHEDULE NO. 17
STORE SUPPLIES EXPENSE
Particulars 2013 2014 2015 2016
Store Supplies, Beginning - 704.55 457.96 297.67
Purchases 2,013.00 1,308.45 850.49 552.82
Less:Store Supplies, End 704.55 457.96 297.67 193.49
Store Supplies Expense 1,308.45 1,555.04 1,010.78 657.01
*ASSUMPTION: Store Supplies, end will be 35% of Purchases
SCHEDULE NO. 18
DEPRECIATION EXPENSES
Items Depreciable Cost Useful Life Annual Depreciation
Audio-Visual Equipment 299,840.50 7 42,834.36
Furniture and Fixtures 39,899.00 5
Leasehold Improvements 166,900.00 10 16,690.00
TOTAL 506,639.50 67,504.16

SCHEDULE NO. 19
SCHEDULE NO.20
ORGANIZATIONAL COST
Particulars 2013 2014 2015 2016 2017
SEC 550.00 - - - -
BIR 500.00 500.00 500.00 500.00 500.00
SSS 165.00 - - - -
TOTAL 1,215.00 500.00 500.00 500.00 500.00
SCHEDULE NO. 21
LICENSES AND PERMITS
Particulars 2013 2014 2015 2016
Repairs and Maintenance Expense
Particulars 2013 2014 2015 2016 2017Maintenance Cost
5,000
5,000
5,000
5,000
TOTAL -
5,000
5,000
5,000
5,000

Mayor's Permit 600.00
600.00
600.00
600.00
Barangay Clearance 1,000.00
1,000.00
1,000.00
1,000.00
Building Plumbing and Electricity Inspection 175.00
175.00
175.00
175.00
Garbage Fee 384.00
384.00
384.00
384.00
Sanitary Fee 36.00
36.00
36.00
36.00
Signboard Fee 50.00
50.00
50.00
50.00
Business Sticker 50.00
50.00
50.00
50.00
Fire Clearance 102.00
102.00
102.00
102.00
Location Clearance 600.00
600.00
600.00
600.00
Business Plate 300.00
300.00
300.00
300.00
TOTAL 3,297.00
3,297.00
3,297.00
3,297.00
Note: Fire Clearance is equal to 10% of Mayors Permit, Garbage Fee and Sanitary FeeSCHEDULE NO. 22
Utilies Expense
Utility Monthly 2013 2014 2015 2016
Electricity 10,000.00 120,000.00 124,704.00 129,592.40 134,672.42
Water 500.00 6,000.00 6,235.20 6,479.62 6,733.62
Total 10,500.00 126,000.00 130,939.20 136,072.02 141,406.04
ASSUMPTION: Increase annually by 3.92%
SCHEDULE NO. 23

Utilities Payable
2013 2014 2015 2016
Yearly Utilities expense 126,000.00 130,939.20 136,072.02 141,406.04
Less: Year-end Payable 10,500.00 10,911.60 11,339.33 11,783.84
Payment 115,500.00 120,027.60 124,732.68 129,622.20
Add: Previous Payable - 10,500.00 10,911.60 11,339.33
Payment 115,500.00 130,527.60 135,644.28 140,961.54
SCHEDULE NO. 24.1
Advertising Expense
ParticularsQuantity Unit Cost Total Cost
Posters 250 pcs. 10/ Colored print 2,500.00
Flyers 1000 pcs. 10/ Colored print 10,000.00
Sound System 1 Set 5000/ day 5,000.00
Total 17,500.00
SCHEDULE NO. 24.2
ADVERTISING EXPENSES
Particulars 2013 2014 2015 2016
Posters 2,500.00 1,875.00 1,406.25 1,054.69
Flyers 10,000.00 7,500.00 5,625.00 4,218.75
Sound System 5,000.00 5,000.00 5,000.00 5,000.00
TOTAL 17,500.00 14,375.00 12,031.25 10,273.44 8,955.08

*ASSUMPTION: Advertising Expense will decrease by 25% every year
SCHEDULE NO.25
Rent Expense
2013 2014 2015 2016 2017
Rent Expense 300,000.00 300,000.00 300,000.00 300,000.00 300,000.00
TOTAL 300,000.00 300,000.00 300,000.00 300,000.00 300,000.00
SCHEDULE NO. 26
PREPAID RENT
Particulars 2013 2014 2015 2016 2017
2 Months Advance 50,000.00 - - - -
1 Month Deposit 25,000.00 - - - -
TOTAL 75,000.00 - - - -