CHAPTER-V SPATIAL PATTERNS OF LITERACY OF MAJOR RELIGIOUS GROUPS...
47
143 CHAPTER-V SPATIAL PATTERNS OF LITERACY OF MAJOR RELIGIOUS GROUPS IN INDIA Literacy is one of the qualitative aspects of human life and it mirrors the level of development of a country. The Indian Census follows the commonly applied definition of literacy as an ability to read and write with understanding. Although literacy is not the same as education, it is nevertheless the first indispensable step towards it (Saini, 1975). As such, literacy rate itself is a good indicator of the socio-economic progress of a country as also of a religious group. India being a welfare state all its citizens enjoy equal economic, cultural and educational opportunities to grow and progress. But different religious communities show inequality in the level of literacy consequent upon diverse socio-cultural and economic status which causes human group disparities (Hussain and Siddiqui, 2010). Realising non-dominant status and as a mark of acceptance of the distinct identities of different religious groups, some special provisions such as articles 25, 29, 30 and 350 have been made in the Constitution of India to safeguard their educational interests (Masih, 2007). In 2001, the literacy rate for the population aged 7 years and above for the country as a whole stood at 64.8 per cent. Among major religious groups, the literacy rate of the Jain population was the highest at 94.1 per cent, followed by the Christians at 80.3 per cent and the Buddhists at 72.7 per cent. The literacy rate among the Hindus (65.1 per cent) was slightly higher than the national average (64.8 per cent) but lower than that of the Jains, the Christians, the Buddhists and the Sikhs (Figure 5.1). A high proportion of the Hindu population (30.6 per cent) was concentrated in the states of Uttar Pradesh, Bihar and Rajasthan and these states were poor on the socio-economic front. Moreover, Hinduism like Islam tends to be more gender restrictive than either Christianity or Buddhism regarding social norms. For instance, the traditional laws of Manu make women non-eligible for all scholastic activities (Stromquist, 1992).
Transcript of CHAPTER-V SPATIAL PATTERNS OF LITERACY OF MAJOR RELIGIOUS GROUPS...
143
CHAPTER-V
SPATIAL PATTERNS OF LITERACY OF MAJOR RELIGIOUS GROUPS IN INDIA
Literacy is one of the qualitative aspects of human life and it mirrors the
level of development of a country. The Indian Census follows the commonly
applied definition of literacy as an ability to read and write with understanding.
Although literacy is not the same as education, it is nevertheless the first
indispensable step towards it (Saini, 1975). As such, literacy rate itself is a good
indicator of the socio-economic progress of a country as also of a religious group.
India being a welfare state all its citizens enjoy equal economic, cultural
and educational opportunities to grow and progress. But different religious
communities show inequality in the level of literacy consequent upon diverse
socio-cultural and economic status which causes human group disparities
(Hussain and Siddiqui, 2010). Realising non-dominant status and as a mark of
acceptance of the distinct identities of different religious groups, some special
provisions such as articles 25, 29, 30 and 350 have been made in the
Constitution of India to safeguard their educational interests (Masih, 2007). In
2001, the literacy rate for the population aged 7 years and above for the country
as a whole stood at 64.8 per cent. Among major religious groups, the literacy rate
of the Jain population was the highest at 94.1 per cent, followed by the Christians
at 80.3 per cent and the Buddhists at 72.7 per cent. The literacy rate among the
Hindus (65.1 per cent) was slightly higher than the national average (64.8 per
cent) but lower than that of the Jains, the Christians, the Buddhists and the Sikhs
(Figure 5.1).
A high proportion of the Hindu population (30.6 per cent) was
concentrated in the states of Uttar Pradesh, Bihar and Rajasthan and these
states were poor on the socio-economic front. Moreover, Hinduism like Islam
tends to be more gender restrictive than either Christianity or Buddhism
regarding social norms. For instance, the traditional laws of Manu make women
non-eligible for all scholastic activities (Stromquist, 1992).

144
Figure 5.1
Literacy Rate among Major Religious Groups in India: 2001
65.1
59.1
80.3
69.472.7
94.1
64.8
0
10
20
30
40
50
60
70
80
90
100P
erc
enta
ge
Hindus Muslims Christians Sikhs Buddhists Jains All
Religious
Groups
Religious Groups
Source: Computed from Census of India, 2001, Religion Data on CD- ROM.
Literacy among the Jains had deeper roots as they were exposed to the
preaching of their wandering monks who would deliver lectures on religious
scriptures wherever they stayed. Hence, as a community the Jains had enough
incentive to read and write (Gopal, 2010). Moreover, the Jains were wealthy and
were one of the first religious groups to take advantage of western education.
Furthermore, a high proportion of Jains (76.1 per cent) resided in the urban area
and a high percentage of their total population (12.4 per cent) was concentrated
in Gujarat, which was the first state in the country to have introduced compulsory
education more than a century ago (Ojha, 1966). The high literacy rate of the
Christians was largely due to the role played by the Christian missionaries for the

145
spread of literacy. Besides this, the Christians spent higher amount of their
household income on education than did the Muslims and the Hindus, thus,
signifying that Christians were well aware of the benefits of education (Singh,
2003).
The high literacy rate among the Buddhists was largely due to the social
reform movement (Neo-Buddhist Movement) that increased the functional value
of education. The high literacy rate among the Sikhs could be traced back to the
historical factors such as an early exposure to education, large scale recruitment
of the Sikhs in the British army, social reform movements (like the Arya Samaj
Movement and the Singh Sabha Movement) and the formation of the Chief
Khalsa Diwan. Moreover, a high proportion of Sikhs (75.9 per cent) were
concentrated in the state of Punjab that not only allowed but also encouraged the
Christian missionaries to undertake educational projects in the state
(Government of Punjab, 2004) and was characterised by a widespread network
of educational institutions, high rural connectivity, large scale emigration that
enhanced the value of education and high per capita income (an outcome of
Green Revolution).
Interestingly, the Muslims were the only religious group which had a
literacy rate lower than the Hindus (Figure 5.1). The reasons usually suggested
for the educational backwardness of Indian Muslims could be broadly grouped
under three main heads: (i) religious traditionalism and backwardness of those
professing Islam, (ii) partition of India and the psychological crisis of identity it
created for Indian Muslims, and (iii) the deliberate neglect and discrimination
against the Muslims by the majority (Hindu) society which professed to be
secular but was, in fact, discriminatory whether in education or employment
(Kamat, 1981). Moreover, the traditional Islamic injunction restricting girls to go in
for education in public places or institutions-especially higher coeducational
institutions-still seem to guide the minds of most of the Muslim parents (Ruhela,
1998). The Hindu, the Christian and the Sikh communities had set up a network
of good educational institutions which provided general and professional
education. The Muslim community had failed to set up such institutions in large

146
numbers to provide its youth with modern education (Halan, 2007). Over 70 per
cent of the Muslims in India are living in rural areas and are marginal and small
farmers or self-employed artisans and of the remaining 30 per cent who are living
in the towns roughly 80 to 85 per cent are skilled workers, tailors, retailers and in
such other professions which do not require a person to be literate (Saxena,
1983).
However, educational backwardness of Indian Muslims should be
attributed not to any 'religious fanaticism' or 'minority complex' but to the small
size of the middle class whose members can be expected to seek educational
opportunities (Ahmed, 1981). Lack of an adequate number of schools and
infrastructural facilities in the Muslim dominated areas was a major cause of
educational backwardness of this community (GOI, 2006).
There were wide inter-state variations in the literacy rates of the six
major religious groups (Table 5.1). Among the states, the Hindus recorded their
highest literacy rate (90.2 per cent) in Kerala and the lowest (47.9 per cent) in
Bihar. In Bihar, more than half of the Hindu population aged 7 and above was
illiterate. The highest literacy rate among the Muslims (89.4 per cent) was in
Kerala and the lowest in Haryana (40.0 per cent). More than half of the Muslims
were illiterate in the Muslim majority state of Jammu & Kashmir. Similarly, in the
states of Haryana, Uttar Pradesh, Bihar, Nagaland, Meghalaya and Assam also,
the Muslim literacy rates were below 50 per cent. Contrastingly, their literacy rate
was above 70 per cent in the southern states. Majority of the Muslims residing in
the southern states were engaged in tertiary activities that enhanced the need for
acquiring education.
The literacy scenario of the Christian population was quite bright as in 16
of the 35 states and union territories, their literacy rates were above 80 per cent.

147
Table 5.1
Literacy Rate by Major Religious Groups in India: 2001
India/States/Union Territories
Hindus Muslims Christians Sikhs Buddhists Jains All Religious
Groups
India 65.1 59.1 80.3 69.4 72.7 94.1 64.8
States
Andhra Pradesh 59.4 68.0 75.3 78.7 54.8 93.2 60.5
Arunachal Pradesh 64.6 57.7 47.0 92.4 44.9 85.2 54.3
Assam 70.0 48.4 56.4 90.4 69.9 95.3 63.3
Bihar 47.9 42.0 71.1 79.4 59.0 93.3 47.0
Chhattisgarh 63.9 82.5 75.3 89.0 84.9 96.8 64.7
Goa 81.9 75.4 83.8 95.5 82.8 95.7 82.0
Gujarat 68.3 73.5 77.7 85.1 66.9 96.0 69.1
Haryana 69.4 40.0 85.3 68.9 67.4 94.2 67.9
Himachal Pradesh 76.8 57.5 82.8 83.0 73.7 96.3 76.5
Jammu & Kashmir 71.2 47.3 74.8 85.4 59.7 86.5 55.5
Jharkhand 54.6 55.6 69.7 87.2 74.7 92.8 53.6
Karnataka 65.6 70.1 87.4 83.7 54.8 84.3 66.6
Kerala 90.2 89.4 94.8 92.4 92.1 95.5 90.9
Madhya Pradesh 62.8 70.3 85.8 82.9 74.4 96.2 63.7
Maharashtra 76.2 78.1 91.0 88.9 76.2 95.4 76.9
Manipur 75.3 58.6 65.6 88.5 53.3 94.5 70.5
Meghalaya 69.3 42.7 65.3 74.7 70.8 69.9 62.6
Mizoram 79.3 74.7 93.1 91.8 45.8 61.7 88.8
Nagaland 74.9 48.2 66.2 82.8 74.6 94.5 66.6
Orissa 63.3 71.3 54.9 90.5 71.0 93.3 63.1
Punjab 74.6 51.2 54.6 67.3 72.7 95.9 69.7
Rajasthan 60.2 56.6 83.0 64.7 71.4 94.0 60.4
Sikkim 69.4 57.8 72.4 97.2 67.3 90.7 68.8
Tamil Nadu 72.0 82.9 85.8 83.7 86.3 92.2 73.5
Tripura 75.3 60.9 67.9 98.4 49.2 82.9 73.2
Uttar Pradesh 58.0 47.8 72.8 71.9 56.2 93.2 56.3
Uttaranchal 74.1 51.1 87.9 73.1 76.3 96.3 71.6
West Bengal 72.4 57.5 69.7 87.2 74.7 92.8 68.6
Union Territories
Andaman & Nicobar Islands
81.7 89.8 77.0 94.1 91.4 100.0 81.3
Chandigarh 80.5 64.1 88.5 92.0 91.7 97.3 81.9
Dadra & Nagar Haveli
56.5 80.4 64.6 91.7 63.4 94.4 57.6
Daman & Diu 77.7 80.3 88.2 93.0 84.4 94.6 78.2
Delhi 82.8 66.6 94.0 92.1 83.8 96.8 81.7
Lakshadweep 96.4 86.1 97.4 100.0 100.0 0.0 86.7
Pondicherry 80.3 87.8 87.3 90.9 92.8 96.3 81.2
Source: Computed from Census of India, 2001, Religion Data on CD- ROM.
Note: Population figures for India and Manipur exclude those of Mao Maram, Paomata
and Purul sub-divisions of Senapati district of Manipur.

148
In fact, the literacy rates among the Christians were above 90 per cent in
the states of Kerala, Mizoram and Maharashtra and in the union territories of
Delhi and Lakshadweep. Education had always been a priority for the Christians
in India. Arunachal Pradesh was the only state which displayed a literacy rate of
below 50 per cent among the Christians.
The Sikhs recorded the highest literacy rate in Tripura (98.4 per cent) and
lowest in Rajasthan (64.7 per cent) among the states. The literacy rates among
the Sikhs were above their national average (69.4 per cent) in a whooping 32 of
the 35 states and union territories. Surprisingly, in Punjab the literacy rate among
the Sikhs (67.3 per cent) was well below their national average. In Haryana and
Rajasthan too (the states with sizeable Sikh population), the literacy rates of the
Sikhs were below their national average.
The literacy rate among the Buddhists was the highest in Kerala (92.1 per
cent) and the lowest in Arunachal Pradesh (44.9 per cent). Arunachal Pradesh is
a tribal infested and highly inaccessible area with the traditional Buddhist
population. The literacy rates among the Buddhists were above 90 per cent in
the union territories of Chandigarh, Lakshadweep, Pondicherry and Andaman &
Nicobar Islands; and the state of Kerala. The Jains recorded a remarkably high
literacy rate of 94.1 per cent at the national level. Interestingly, in 19 of the 35
states and union territories, their literacy rate was even above their national
average (94.1 per cent). Most of the Jain population lived in urban areas and its
main economic activities were in the field of business, industry, commerce and
professionals (Gupta and Gupta, 2006). The Jains recorded the highest literacy
rate among the states in Chhattisgarh (96.8 per cent) and the lowest in Mizoram
(61.7 per cent). About two-third of Jains living in Mizoram were cultivators and
literary skills were not much required in this profession.
Further analysis of Table 5.1 reveals that all the six major religious groups
recorded very high literacy rates of above 95 per cent in Kerala. This could be
seen in the light of infrastructural facilities for schooling and other supporting
facilities which were more adequately and better distributed among regions and
social groups in Kerala than in many other states in India (Gasper, 2003). Thus,

149
the state-wise analysis of literacy rate of the religious groups suggested that
there was a close relationship between literacy and the economic activity of the
religious group. Higher the proportion of a religious group in tertiary activity,
higher is its literacy rate. Conversely, higher the proportion of a religious group in
primary activity, lower is its literacy rate. The foregoing analysis indicated that
certain socio-economic characteristics of the population belonging to different
religious groups were closely related to their level of literacy.
Urban-Rural Differential in Literacy
All the major religious groups showed wide gap in their urban-rural literacy
rates (Table 5.2). The urban-rural difference in literacy was found by using the
urban-rural differential index as used by Krishan and Shyam (1978). The literacy
rate was higher in the urban areas than in the rural among all the religious
groups. Literacy, like other innovations, originates in urban places and diffuses
subsequently into the countryside; the process of literacy begins in the town and
trickles down to the village (Krishan and Shyam, 1978). However, the Hindus
recorded the widest gap between their urban and rural literacy rates and the
narrowest was among the Jains.
Table 5.2
Urban-Rural Differential in Literacy Rate by Major Religious Groups in
India: 2001
Religious Groups Total Urban Rural Urban-Rural Differential
Index*
Hindus 65.09 81.32 59.06 0.34 Muslims 59.13 70.07 52.73 0.29 Christians 80.25 90.90 74.55 0.20 Sikhs 69.45 83.56 64.21 0.28 Buddhists 72.66 81.60 66.93 0.20 Jains 94.08 96.13 87.47 0.09 All Religious Groups 64.84 79.92 58.74 0.33
Source: Computed from Census of India 2001, Religion Data on CD- ROM. * Urban-Rural Differential was calculated by using the formula:
LiteracyTotal
LiteracyRuralLiteracyUrban

150
This could partly be explained in context to the need for education in rural
areas being the greatest among the Jains and the least among the Hindus.
Moreover, it seemed that the Jains residing in rural areas were economically
more capable as compared to their Hindu counterparts in imparting education to
their children. The Christians and the Buddhists both had an urban-rural
differential index of 0.20. Similarly, the Muslims and the Sikhs too had almost the
same urban-rural differential in literacy. A very high literacy rate in urban areas
and not corresponding literacy rate in rural areas explained the wide urban-rural
gap in the literacy of the Christians, the Buddhists and the Sikhs. The Muslims
were the worst performers in terms of urban and rural literacy rates, while the
Jains were the best performers.
Table 5.3 points out that all the religious groups recorded small urban-
rural differential in their literacy rates in the union territories. Union territory being
chiefly an urban area is far better equipped with educational facilities and has a
high demand for education. Likewise, all the religious groups recorded low urban-
rural difference in their literacy rates in Kerala. The state has an extensive
availability of schools in rural areas accounting for more than three-fourths of the
total schools of the state (Planning Commission, 2008). Contrary to this, a high
urban-rural differential index was noticed for all the religious groups in ‘Bimaru’
and the north-eastern states. Subsistence agriculture and low level of economic
development in these states hindered the spread of education to rural areas.
GENDER GAP IN LITERACY
Gender display in literacy is present in almost every country and it can be
explained in terms of: (a) the sexual division of labour that assigns women many
domestic tasks, especially among poor and rural families, time-consuming
chores, and (b) men's control of women's sexuality, which creates both physical
and psychological constraints in women's lives (Stromquist, 1992).

151
Table 5.3
Urban-Rural Differential in Literacy among Major Religious Groups in India: 2001
India/States/Union Territories
Hindus Muslims Christians Sikhs Buddhists Jains All Religious
Groups
India 0.34 0.29 0.20 0.28 0.20 0.09 0.33
States
Andhra Pradesh 0.38 0.19 0.23 0.28 0.15 0.12 0.36
Arunachal Pradesh 0.36 0.19 0.68 0.04 0.79 0.30 0.56
Assam 0.30 0.53 0.61 0.08 0.33 0.09 0.41
Bihar 0.60 0.61 0.55 0.41 0.29 0.16 0.60
Chhattisgarh 0.30 0.12 0.28 0.16 0.07 0.03 0.31
Goa 0.07 0.05 0.07 0.02 0.19 0.02 0.06
Gujarat 0.31 0.09 0.42 0.14 -0.03 0.09 0.30
Haryana 0.21 0.38 0.20 0.27 0.21 0.10 0.24
Himachal Pradesh 0.18 0.32 0.20 0.15 0.04 0.06 0.18
Jammu & Kashmir 0.28 0.43 0.11 0.09 0.36 0.31 0.40
Jharkhand 0.61 0.55 0.40 0.30 0.69 0.23 0.62
Karnataka 0.34 0.20 0.13 0.19 0.38 0.19 0.32
Kerala 0.05 0.02 0.01 0.07 0.02 0.04 0.03
Madhya Pradesh 0.35 0.14 0.29 0.30 0.03 0.03 0.34
Maharashtra 0.21 0.09 0.14 0.19 0.14 0.06 0.20
Manipur 0.12 0.20 0.25 0.07 0.56 0.21 0.17
Meghalaya 0.41 0.87 0.42 -0.11 0.42 0.93 0.48
Mizoram 0.32 0.50 0.09 0.05 0.92 0.79 0.17
Nagaland 0.09 0.41 0.40 0.12 0.21 0.26 0.33
Orissa 0.33 0.06 0.61 0.10 0.27 0.09 0.33
Punjab 0.15 0.15 0.37 0.23 0.04 0.06 0.21
Rajasthan 0.37 0.24 0.32 0.31 0.32 0.06 0.35
Sikkim 0.26 -0.02 0.22 0.03 0.29 0.18 0.25
Tamil Nadu 0.23 0.06 0.11 0.27 0.18 0.04 0.22
Tripura 0.24 0.15 0.43 0.02 0.80 0.37 0.27
Uttar Pradesh 0.38 0.23 0.41 0.37 0.28 0.11 0.31
Uttaranchal 0.21 0.27 0.12 0.30 0.18 0.07 0.19
West Bengal 0.23 0.19 0.37 0.14 0.23 0.19 0.26
Union Territories
Andaman & Nicobar Islands
0.07 0.00 0.21 0.03 0.14 0.00 0.10
Chandigarh 0.07 0.09 0.06 0.14 0.09 0.03 0.09
Dadra & Nagar Haveli
0.63 0.07 0.66 0.08 -0.06 0.10 0.61
Daman & Diu 0.08 0.03 -0.02 -0.06 0.04 -0.05 0.08
Delhi 0.05 0.09 0.02 0.13 0.02 0.00 0.05
Lakshadweep 0.04 0.04 -0.01 1.00 1.00 - 0.04
Pondicherry 0.13 0.04 0.10 0.13 -0.09 0.01 0.13
Source: Computed from Census of India, 2001, Religion Data on CD-ROM. Note: Urban-Rural differential was calculated by using Urban-Rural differential index:
LiteracyTotal
LiteracyRuralLiterayUrban

152
Education of females enhances their capabilities, such as the freedom to
participate in political and economic processes, protect oneself against
exploitation, exercise personal mobility, attain high social status and increase
child and maternal well-being and at the heart of the gender gap is the fact that
many of the benefits of female education are societal such as a more productive
workforce, lower fertility and lower infant mortality, whereas the costs are private
which include tuition fees, uniforms, transport and most importantly, opportunity
costs in the shape of foregone child labour (King and Hill, 1993).
Even after more than sixty years of Indian independence, gender disparity
in literacy continues and the situation varied from state to state and even within a
state from district to district and from one religious group to another. As per the
Census 2001, the gender gap in literacy in India was 21.6. In all the religious
groups, female literacy rate was lower than male literacy rate. Cultural
prejudices, government apathy, lack of political and community will, illiteracy and
the negative attitude of parents towards the education of the girl child, cost of
education, etc. were some of the factors which had deprived girls and women of
their right to education (Planning Commission, 2005). India being largely a
patriarchal society, the ideology underlying patriarchy defined women as inferior
and subordinate to men and this ultimately got manifested in a wide gender gap
in literacy.
At the national level the gender gap in literacy was less than 10
percentage point only among the Jains and the Christians. Contrary to this, the
gender gap in literacy was the largest (23.0 per cent) among the Hindus (Table
5.4).
This spells out economic and social inequality for many women belonging
to this religious group. The Hindus were followed by the Muslims which too
depicted a large gender gap of 17.5 per cent, thus, bringing out that gender
disparity in literacy was more pronounced among the Hindus and the Muslims.
The large gender gap in literacy among the Hindus and the Muslims was an
outcome of their low female literacy rates. The Muslims recorded the lowest
female literacy rate (50.1 per cent), preceded by the Hindus at 53.2 per cent. The

153
low female literacy among the Muslims has been due to the socio-economic
reasons rather than the religious one. Poverty and illiteracy went together and it
was a fact that Muslims in India were relatively poor (Engineer, 1994).
Table 5.4
Gender Gap in Literacy among Major Religious Groups in India: 2001
Religious Groups Male Literacy Female Literacy Gender Gap*
Hindus 76.2 53.2 23.0
Muslims 67.6 50.1 17.5
Christians 84.4 76.2 8.2
Sikhs 75.2 63.1 12.1
Buddhists 83.1 61.7 21.4
Jains 97.4 90.6 6.8
All Religious Groups 75.3 53.7 21.6 Source: Computed from Census of India 2001, Religion Data on CD-ROM. Note: *Gender Gap=Male literacy-Female literacy.
Apart from wide variations in gender gap across the religious groups,
there were large inter-state differences in male-female literacy rates of the
religious groups. The gender gap in literacy among the Hindus was higher than
their national average in the ‘Bimaru States’, the hill state of Uttaranchal and the
rural union territory (Dadra & Nagar Haveli). Surprisingly, the Hindus recorded a
relatively small gender gap in their literacy rate in the states where they were in
minority. The Muslims recorded above their national average gender gap in
literacy in the Muslim majority state of Jammu & Kashmir; in north-western parts
of Himachal Pradesh and Uttaranchal states and in the north-eastern states of
Arunachal Pradesh, Nagaland, Manipur and Mizoram ; in ‘Bimaru States’ and in
relatively developed states of Haryana and Gujarat. Strangely, the gender gap in
literacy among the Christians was larger than their national average in 24 states
and union territories of the country. But interestingly, gender gap in literacy was
smaller than their national average in the Christian dominated states of the north-
eastern region, in the hill states of Uttaranchal and Himachal Pradesh and in the
southern states of Maharashtra, Karnataka and Kerala.

154
Table 5.5
Gender Gap in Literacy Rate by Major Religious Groups in India: 2001 India/States/Union Territories
Hindus Muslims Christians Sikhs Buddhists Jains All Religious
Groups
India 23.0 17.5 8.2 12.1 21.4 6.8 21.6
States
Andhra Pradesh 20.3 17.4 11.2 10.7 27.1 6.9 19.9
Arunachal Pradesh 20.9 20.1 18.5 16.3 20.2 16.0 20.3
Assam 17.0 15.8 16.6 10.9 18.4 4.3 16.7
Bihar 27.8 20.4 9.2 12.3 30.5 4.9 26.6
Chhattisgarh 26.1 16.5 14.5 8.3 16.2 3.9 25.5
Goa 14.7 9.8 10.5 1.1 13.1 1.1 13.0
Gujarat 22.4 19.4 13.0 9.9 25.1 4.9 21.9
Haryana 22.8 34.3 6.8 13.0 22.1 6.8 22.8
Himachal Pradesh 18.1 19.5 5.9 12.9 17.5 2.9 17.9
Jammu & Kashmir 22.1 23.7 21.8 14.1 20.8 5.8 23.6
Jharkhand 29.5 24.9 16.4 10.1 26.3 9.6 28.4
Karnataka 20.3 13.9 6.9 11.0 24.4 13.7 19.2
Kerala 7.1 8.2 2.6 5.5 6.9 4.2 6.5
Madhya Pradesh 26.5 19.7 8.6 11.7 22.9 4.9 25.8
Maharashtra 19.9 13.7 7.2 8.0 21.5 6.0 19.0
Manipur 21.0 33.4 14.8 13.0 28.4 1.8 19.8
Meghalaya 16.3 14.0 3.9 18.0 12.1 8.8 5.8
Mizoram 2.5 21.1 3.5 3.8 21.8 10.2 4.0
Nagaland 14.3 23.2 8.9 14.6 8.1 4.4 9.7
Orissa 25.0 17.4 21.9 8.2 23.2 7.0 24.8
Punjab 11.8 13.9 14.4 11.7 15.6 3.1 11.8
Rajasthan 32.5 30.6 10.6 20.7 29.2 9.3 31.8
Sikkim 16.4 8.0 14.3 11.1 14.5 7.7 15.6
Tamil Nadu 19.0 13.5 8.6 11.3 10.5 7.4 18.0
Tripura 15.5 18.3 20.4 9.6 23.0 8.5 16.1
Uttar Pradesh 28.2 19.9 10.8 15.4 30.1 5.6 26.6
Uttaranchal 24.8 20.1 5.3 17.0 14.8 3.8 23.7
West Bengal 18.0 14.9 14.9 9.4 16.9 7.6 17.4
Union Territories
Andaman & Nicobar Islands
12.0 5.6 10.2 6.2 11.3 0.0 11.1
Daman & Diu 22.3 14.0 10.9 5.8 28.5 5.9 21.2
Dadra & Nagar Haveli 31.7 12.5 25.8 -13.5 32.3 7.0 31.0
Pondicherry 15.5 11.2 9.4 18.3 -1.0 5.3 14.7
Lakshadweep 0.7 12.0 1.2 100.0 -100 0.0 12.0
Delhi 13.4 13.2 4.6 5.9 14.8 3.5 12.6
Chandigarh 11.0 12.5 6.6 6.6 4.8 2.9 9.6
Source: Computed from Census of India, 2001, Religion Data on CD-ROM. Note: Population figures for India and Manipur exclude those of Mao Maram, Paomata and Purul sub-
divisions of Senapati district of Manipur.
155
It is evident from Table 5.5 that the gender gap in literacy among the
Sikhs, mainly in the only Sikh majority state of Punjab stood at 11.7 which was
smaller than their national average. Similarly, the Buddhists recorded smaller
gender gap in literacy than their average gender gap in literacy in the states
which had sizeable Buddhist population (Sikkim and Arunachal Pradesh). The
gender gap in literacy among the Jains was also smaller in the states which had
a relatively high proportion of their population (Maharashtra, Madhya Pradesh
and Gujarat). Thus, one of the important findings that had come out from this
table was that there was a negative correlation between gender gap in literacy
and majority status of a religious group in the state. Largely, the gender gap in
literacy among the minority religious groups was smaller than their national
average in the states where they formed the majority or were in high proportion.
Conversely, the Hindus depicted larger gender gap in literacy than their national
average in the states where they formed a minority religious group. Does it instil
a sense of insecurity and lead to a wider gender gap?
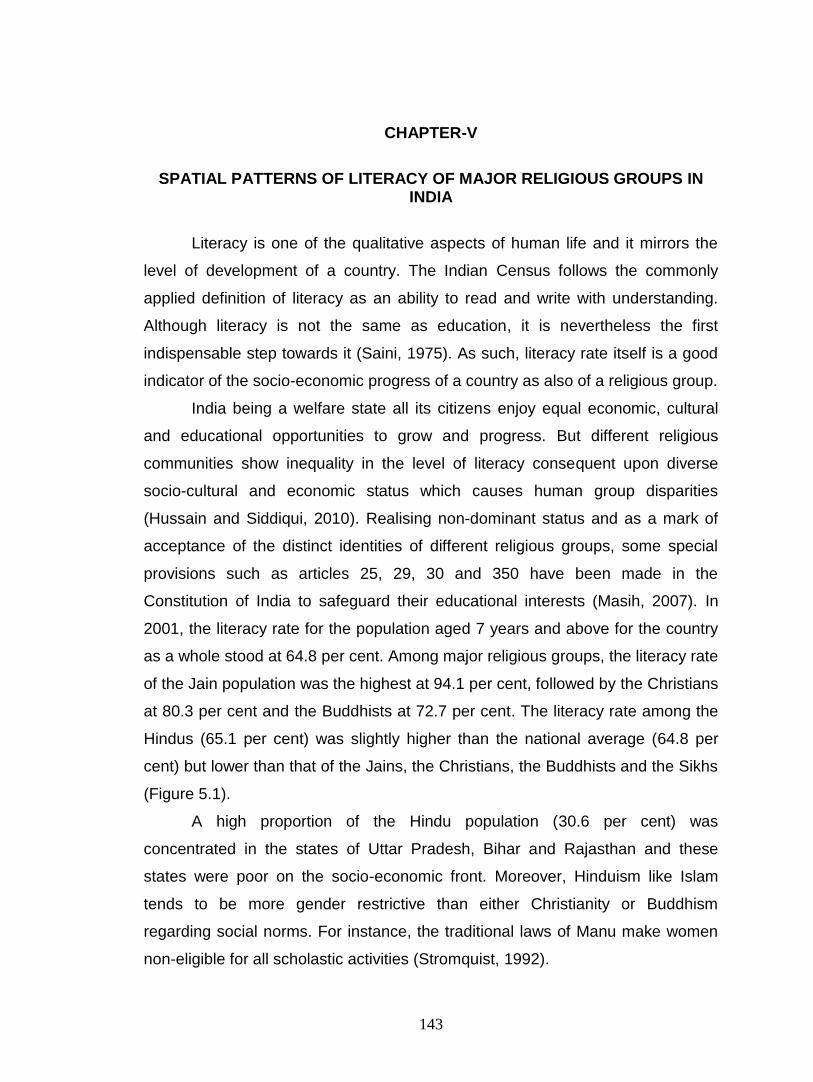
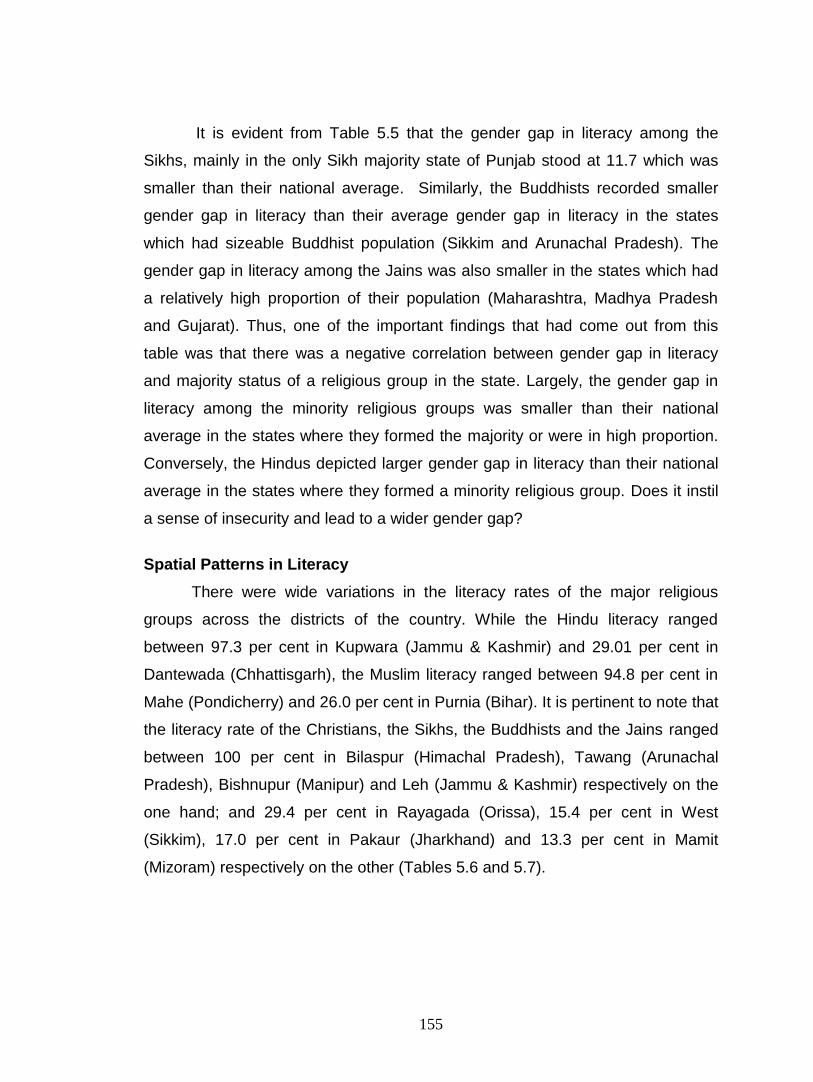
Spatial Patterns in Literacy
There were wide variations in the literacy rates of the major religious
groups across the districts of the country. While the Hindu literacy ranged
between 97.3 per cent in Kupwara (Jammu & Kashmir) and 29.01 per cent in
Dantewada (Chhattisgarh), the Muslim literacy ranged between 94.8 per cent in
Mahe (Pondicherry) and 26.0 per cent in Purnia (Bihar). It is pertinent to note that
the literacy rate of the Christians, the Sikhs, the Buddhists and the Jains ranged
between 100 per cent in Bilaspur (Himachal Pradesh), Tawang (Arunachal
Pradesh), Bishnupur (Manipur) and Leh (Jammu & Kashmir) respectively on the
one hand; and 29.4 per cent in Rayagada (Orissa), 15.4 per cent in West
(Sikkim), 17.0 per cent in Pakaur (Jharkhand) and 13.3 per cent in Mamit
(Mizoram) respectively on the other (Tables 5.6 and 5.7).

156
Table 5.6
Top Ten Districts by Literacy among Major Religious Groups in India: 2001
Hindus Muslims Christians Sikhs Buddhists Jains
Kupwara (Jammu & Kashmir)
(97.3)
Mahe (Pondicherry)
(94.8)
Bilaspur (Himachal Pradesh) (100.0)
Tawang (Arunachal Pradesh)
(100.0)
Bishnupur (Manipur) (100.0)
Leh (Jammu & Kashmir) (100.0)
Lakshadweep (Lakshadweep
) (96.4)
Kottayam (Kerala) (93.8)
Kargil (Jammu & Kashmir) (100.0)
Champhai (Mizoram)
(100.0)
Bhadrak (Orissa) (100.0)
Kargil (Jammu & Kashmir) (100.0)
Srinagar (Jammu & Kashmir)
(96.0)
Pathanamthitta (Kerala)
(92.4)
Kupwara (Jammu & Kashmir) (100.0)
Serchhip (Mizoram)
(100.0)
Kendrapara (Orissa) (100.0)
Rajauri (Jammu & Kashmir) (100.0)
Mahe (Pondicherry)
(96.0)
Kozhikode (Kerala) (91.3)
Srinagar (Jammu & Kashmir) (100.0)
Saiha (Mizoram)
(100.0)
Baudh (Orissa) (100.0)
Lahul & Spiti (Himachal Pradesh) (100.0)
Kottayam (Kerala) (95.0)
Kanniyakumari (Tamil Nadu)
(91.1)
Gandhinagar (Gujarat) (100.0)
Goalpara (Assam) (100.0)
Sonapur (Orissa) (100.0)
Una (Himachal Pradesh) (100.0)
Baramula (Jammu & Kashmir)
(94.4)
Bhandara (Maharashtra)
(91.0)
Kozhikode (Kerala) (100.0)
Nayagarh (Orissa) (100.0)
Sabar Kantha (Gujarat) (100.0)
Bilaspur (Himachal Pradesh) (100.0)
Pathanamthitta (Kerala) (93.6)
Kannur (Kerala) (90.8)
Lakshadweep (Lakshadweep
) (100.0)
Gajapati (Orissa) (100.0)
Diu (Daman & Diu)
(100.0)
Kinnaur (Himachal Pradesh) (100.0)
Alappuzha (Kerala) (93.4)
Andamans (Andaman &
Nicobar Islands) (90.2)
Sirohi (Madhya Pradesh) (100.0)
Baudh (Orissa) (100.0)
Lakshadweep (Lakshadweep
) (100.0)
Champawat (Uttaranchal
) (100.0)
Badgam (Jammu & Kashmir)
(93.0)
Thoothukkudi (Tamil Nadu)
(90.1)
Mahe (Pondicherry)
(100.0)
Sonapur (Orissa) (100.0)
Perambalur (Tamil Nadu)
(100.0)
Pashchim Champaran
(Bihar) (100.0)
Kannur (Kerala) (92.7)
Thrissur (Kerala) (90.1)
Malappuram (Kerala) (100.0)
Diu (Daman &
Diu) (100.0)
Karaikal (Pondicherry)
(100.0)
Saran (Bihar) (100.0)
Source: Computed from Census of India 2001, Religion Data on CD-ROM.
157
Table 5.7
Bottom Ten Districts by Literacy among Major Religious Groups in India: 2001
Hindus Muslims Christians Sikhs Buddhists Jains
Dantewada (Chhattisgarh)
(29.01)
Purnia (Bihar) (26.0)
Rayagada (Orissa) (29.4)
West (Sikkim) (15.4)
Pakaur (Jharkhand)
(17.0)
Mamit (Mizoram)
(13.3)
Malkangiri (Orissa) (30.1)
Shrawasti (Uttar
Pradesh) (26.1)
Tirap (Arunachal Pradesh)
(29.8)
Sheohar (Bihar) (24.4)
Samastipur (Bihar) (22.8)
Gajapati (Orissa) (14.3)
Nabarangapur (Orissa) (32.9)
Madhepura (Bihar) (26.8)
Shrawasti (Uttar Pradesh)
(31.7)
Kaushambi (Uttar
Pradesh) (38.2)
Khagaria (Bihar) (23.2)
Lakhisarai (Bihar) (14.3)
Pakaur (Jharkhand)
(33.5)
Katihar (Bihar) (26.8)
Gajapati (Orissa) (34.3)
Banka (Bihar) (38.7)
Mamit (Mizoram)
(26.8)
West Khasi Hills
(Meghalaya) (18.3)
Balrampur (Uttar
Pradesh) (34.4)
Kishanganj (Bihar) (27.0)
East Kameng (Arunachal Pradesh)
(37.7)
Ariyalur (Tamil Nadu) (41.4)
Kurukshetra (Haryana)
(26.8)
Zunheboto (Nagaland)
(20.0)
Koraput (Orissa) (34.6)
Araria (Bihar) (27.6)
Araria (Bihar) (38.0)
Raichur (Karnataka)
(41.8)
Tamenglong (Manipur)
(28.6)
Debagarh (Orissa) (28.6)
Jhabua (Madhya Pradesh)
(34.8)
Pakaur (Jharkhand)
(29.7)
Balrampur (Uttar Pradesh)
(39.2)
Garhwa (Jharkhand)
(42.5)
Balrampur (Uttar
Pradesh) (29.8)
Godda (Jharkhand)
(29.2)
Sheohar (Bihar) (36.0)
Sheohar (Bihar) (31.3)
Kishanganj (Bihar) (39.4)
Sheikhpura (Bihar) (43.3)
Baramula (Jammu & Kashmir)
(33.1)
Shrawasti (Uttar
Pradesh) (30.4)
Bahraich (Uttar
Pradesh) (36.3)
Supaul (Bihar) (32.2)
Mon (Nagaland)
(40.6)
Godda (Jharkhand)
(45.1)
Thiruvarur (Tamil Nadu) (33.3)
Garhwa (Jharkhand)
(37.3)
Shrawasti (Uttar
Pradesh) (36.4)
Jaisalmer (Rajasthan)
(32.4)
Sahibganj (Jharkhand)
(41.3)
Bagalkot (Karnataka)
(47.0)
Malkangiri (Orissa) (33.3)
Sheohar (Bihar) (40.0)
Source: Computed from Census of India 2001, Religion Data on CD-ROM.
158
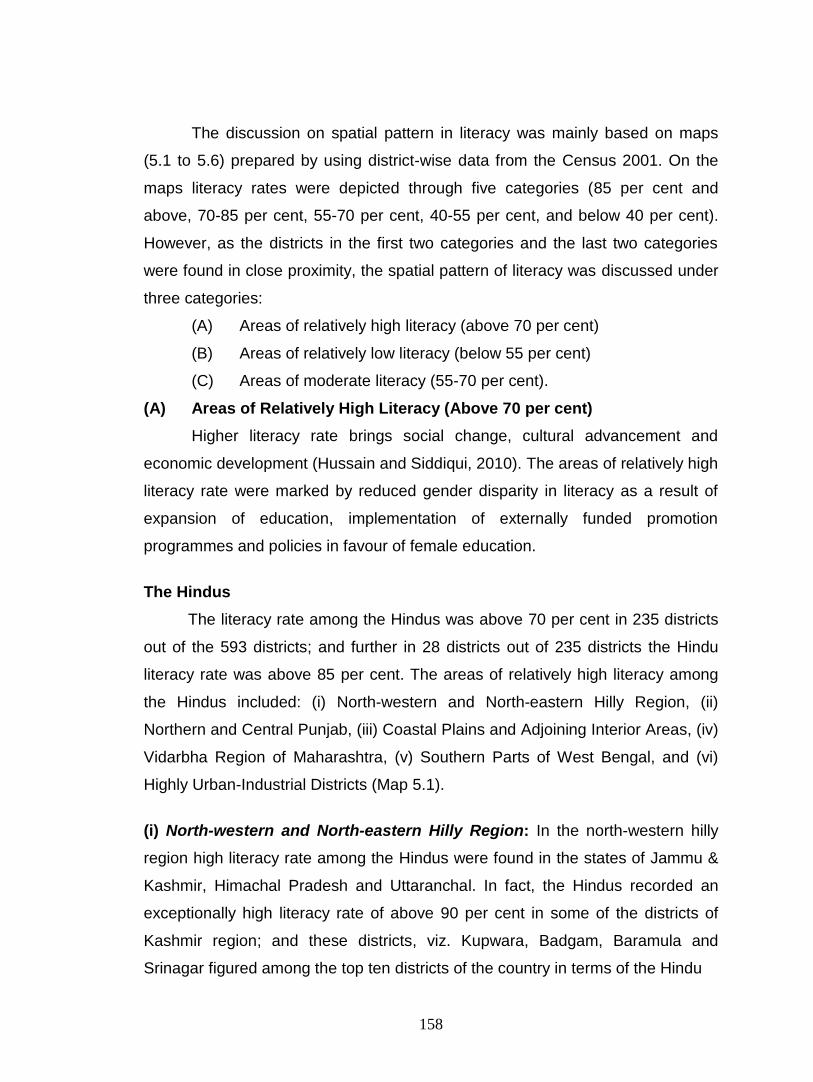
The discussion on spatial pattern in literacy was mainly based on maps
(5.1 to 5.6) prepared by using district-wise data from the Census 2001. On the
maps literacy rates were depicted through five categories (85 per cent and
above, 70-85 per cent, 55-70 per cent, 40-55 per cent, and below 40 per cent).
However, as the districts in the first two categories and the last two categories
were found in close proximity, the spatial pattern of literacy was discussed under
three categories:
(A) Areas of relatively high literacy (above 70 per cent)
(B) Areas of relatively low literacy (below 55 per cent)
(C) Areas of moderate literacy (55-70 per cent).
(A) Areas of Relatively High Literacy (Above 70 per cent)
Higher literacy rate brings social change, cultural advancement and
economic development (Hussain and Siddiqui, 2010). The areas of relatively high
literacy rate were marked by reduced gender disparity in literacy as a result of
expansion of education, implementation of externally funded promotion
programmes and policies in favour of female education.
The Hindus
The literacy rate among the Hindus was above 70 per cent in 235 districts
out of the 593 districts; and further in 28 districts out of 235 districts the Hindu
literacy rate was above 85 per cent. The areas of relatively high literacy among
the Hindus included: (i) North-western and North-eastern Hilly Region, (ii)
Northern and Central Punjab, (iii) Coastal Plains and Adjoining Interior Areas, (iv)
Vidarbha Region of Maharashtra, (v) Southern Parts of West Bengal, and (vi)
Highly Urban-Industrial Districts (Map 5.1).
(i) North-western and North-eastern Hilly Region: In the north-western hilly
region high literacy rate among the Hindus were found in the states of Jammu &
Kashmir, Himachal Pradesh and Uttaranchal. In fact, the Hindus recorded an
exceptionally high literacy rate of above 90 per cent in some of the districts of
Kashmir region; and these districts, viz. Kupwara, Badgam, Baramula and
Srinagar figured among the top ten districts of the country in terms of the Hindu

159
D.N .A.
Delhi
Percentage
85 and Above
70 - 85
55 - 70
40 - 55
Below 40
INDIA
Literacy Among Hindus: 2001
MAP 5 .1
D. N . A. = D ata Not Av ailab le
National Avera ge 6 5.1
0 500
Kms

160
literacy. These districts had small Hindu population and among them a high
proportion was those deployed in the paramilitary forces. In contrast to the
Kashmir region, Himachal Pradesh and Uttaranchal were the Hindu dominated
states marked by the Schooling Revolution that had raised the literacy status in
general and that of women in particular. Early expansion of the educational
institutions, increased state supply of social services, greater socio-economic
aspirations and female independence as a result of male out-migration were the
main reasons that increased literacy in general and female literacy in particular
(Mc Dougall, 2000).
Likewise, the Hindus registered high literacy in a number of districts of the
northeast hills region. The region too supported small proportion of Hindu
population and a large segment of those were deployed in the paramilitary
forces.
(ii) Northern and Central Punjab: High economic status of the Hindus and high
literacy rate of the Hindu females as a result of social reform movements like
Arya Samaj movement, with focus on education of women could be reasons for
high literacy of above 75 per cent among the Hindus in this region.
(iii) Coastal Plains and Adjoining Interior Areas: The literacy among the
Hindus was high in the coastal plains and adjoining interior areas of the west
coast, the Coromandel and the Orissa coast. The coastal areas of India had
historically been experiencing high rate of literacy due to the long and continuous
exposure of the Hindus of this region to outside world. Nonetheless, the factors
that contributed to high literacy in this compact area varied from state to state.
For instance, the population in the Konkan saw education as a means to social
mobility and migration away from their impoverished regions to Greater Bombay
(Saldanha, 1999a). In Malabar region, the Hindu literacy rate was above 90 per
cent. Various agencies contributed to the spread of literacy and development of
school education in this region during the pre-independence and independence
periods. Moreover, the west coastal plains and the adjoining interior area
consisted of a number of major urban industrial regions (Ahmadabad-Vadodara

161
and Mumbai-Pune) as also minor industrial clusters (Sholapur, Kolhapur,
Gandhinagar, Belgaum and Kochi) that had well developed infrastructure for
education.
In the Coromandel plains and adjoining interior area of Tamil Nadu, the
high literacy was chiefly the result of high functional value of literacy as a result of
long history of exposure to the outside world, urban-industrial development, role
of the Christian missionaries and successive state governments in the spread of
education. In coastal areas of Orissa, comparatively better economic conditions
of rural population, high degree of rural-urban interaction (Calcutta-Puri rail-road
link), high percentage of urban population and early exposure to external
influences (Krishan and Shyam, 1978) were the factors responsible for high
literacy rates.
(iv) Vidarbha Region of Maharashtra: The Hindus had a high literacy in
Jalgaon, Buldana, Akola, Amravati, Wardha, Nagpur and Bhandara districts of
the Vidarbha region of Maharashtra. These districts were fairly urbanised;
agriculturally and industrially developed; and were located on the corridor of
development, such as, Calcutta-Bombay rail route (Gosal, 1979).
(v) Southern Parts of West Bengal: This region included the districts of
Kolkata, Haora, Nadia, North and South Twenty-Four Parganas, Hugli and
Barddhaman of West Bengal. Kolkata, being the administrative seat of British
India and present state capital, had maintained the tradition of literacy and
education. Rapid urban-industrial development in the region had not only created
job opportunities for males and females but also had led to the expansion of
educational facilities in general (Sagar, 1990).
(vi) Highly Urban-Industrial Districts: These districts included Delhi and the
adjoining area; a cluster consisting of Jaipur, Sikar and Jhunjhunun; Bhopal-
Jabalpur belt and the highly urbanised districts of Hyderabad, Bangalore, Yanam,
Pondicherry, Kanpur, Lucknow, Bhopal, Indore and Jabalpur. Besides the above
mentioned districts the literacy rate among the Hindus was also high in Kota,

162
Raigarh, Jharsuguda, Datia, Bhind, Etawah, Shajapur, West Godavari and
Darjeeling. Many of these districts being the seat of governance had a long
association with the spread of education. The functional value of literacy was
high in these districts owing to high degree of urbanisation, diversified agriculture
and industrial economy.
The Muslims
The Muslims recorded a relatively high literacy (70 per cent and above) in
247 districts of the country. In 53 districts of these high literacy districts, the
Muslims displayed literacy rates of 85 per cent and above. The areas of high
literacy among the Muslims consisted of: (i) Coastal Plains and Adjoining Interior
Parts, (ii) Central Region, (iii) Pockets Located in the North-eastern Region, and
(iv) Kumaun Himalayas (Map 5.2).
(i) Coastal Plains and Adjoining Interior Parts: The Muslims of the Gujarat
and Konkan coastal plains as well as in the adjoining interior parts were mostly
tradesmen and had greater access to educational facilities. The adjoining interior
parts formed industrial sub centres and were the first to promote literacy
(Omvedt, 1994). Moreover, the Konkani Muslims and Momins (a Muslim
subclass) dominating the region, were economically well off, and thus, enjoyed
high literacy rates (Momin, 2004).
It is pertinent to note that the Muslim literacy rate in Kottayam,
Pattanamthitta, Kozhikode, Kannur and Thrissur districts of Malabar, and interior
parts of Kerala was above 90 per cent. High economic status, social reform
movements, such as Izhavas movement that led to removal of disparity in
educational opportunities and large number of Muslim schools partly accounted
for high literacy among the Muslims of this region (Rao, 1979).
Similarly, the literacy among the Muslims was relatively high in the east
coastal plains (Coromandel region, northern Andhra coastal plains and Orissa
coastal plains) and in the adjoining interior areas (Tamil Nadu upland, north-
central Andhra Pradesh and eastern Orissa). The Muslims of this region were
consistently exposed to external influences. In fact, the Muslims in Tamil Nadu

163
Literacy Among Muslims: 2001
INDIA
D.N .A.
Delhi
Percentage
85 and Above
70 - 85
55 - 70
40 - 55
Below 40
D. N . A. = D ata Not Av ailab le
MAP 5 .2
National Avera ge 5 9.1
0 500
Kms

164
were much more prosperous through their association with trade and many other
diverse activities. In district Thoothukkudi, the Muslim literacy rate was above 90
per cent. Likewise, the Muslim literacy rate was high in the coastal districts of
East and West Godavari and Visakhapatnam of Andhra Pradesh. The East and
the West Godavari districts are the regions of commercial agriculture, while
Visakhapatnam is an important urban- industrial centre.
(ii) Central Region: The Muslims recorded high literacy in large parts of Madhya
Pradesh and Chhattisgarh, adjoining areas of Orissa and some parts of
Rajasthan, Maharashtra and Gujarat states. The region had significant number of
Dawoodi Bohras, a sub sect of Muslims from Gujarat, who were mostly
businessmen by profession and were socially and economically well placed
(http://en.wikipedia.org /wiki/malwa-madhya-pradesh).
(iii) Pockets Located in the North-eastern Region: High literacy among the
Muslims was also recorded in most of the districts of Mizoram and Nagaland, and
in some of the districts of Arunachal Pradesh and in the upper Brahmaputra
valley of Assam. The Muslims of these areas were mainly engaged in tertiary
activities that partly explained their high literacy. It goes to the credit of Christian
missionaries, who propagated education even among the poorest in the
countryside of this tribal belt. Besides, the state governments had also
contributed a lot by providing funds liberally for the propagation of education
(Tilak, 1986).
(iv) Kumaun Himalayas: The literacy rates of Muslims ranged between 73.9 per
cent in Chamoli district (Uttaranchal) and 79.0 per cent in Pithoragarh district
(Uttaranchal). Both male and female literacy was high. It was well above 75 per
cent among males. In the case of females, it ranged between 64 per cent in
Chamoli district and 77.2 per cent in Pithoragarh district. Even in the rural areas
the literacy rate of the Muslim females was above 50 per cent. An early
expansion of education, diffusion of education in the rural areas, high state

165
expenditure on education and greater functional value of literacy were some of
the reasons that explained the high literacy among the Muslims of the region.
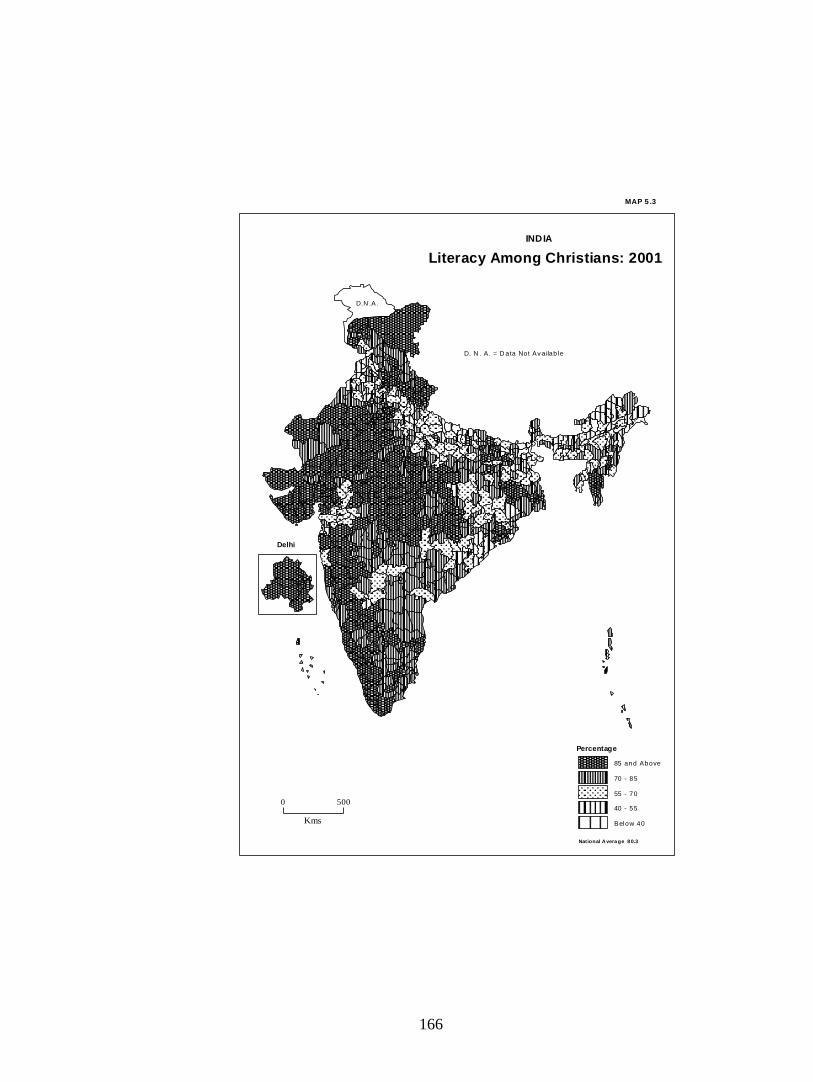
The Christians
The literacy rate among the Christians was above 70 per cent in 412
districts out of the 593 districts of the country. In fact, in 233 districts the Christian
literacy rate was 85 and above per cent. The areas in which the literacy among
the Christians was high included: (i) North-western Hilly Region, (ii) Mizoram and
Large Parts of Nagaland and Manipur States, (iii) Peninsular Region, (iv)
Western and Central Region, (v) Bihar Plains and Adjoining Parts of Uttar
Pradesh, (vi) Southern Parts of West Bengal and Adjoining Interior Areas and
Coastal Orissa, and (vii) Scattered Districts (Map 5.3).
(i) North-western Hilly Region: The base of the Christian population in the
three north-western hill states was small (Jammu & Kashmir-20299, Himachal
Pradesh-7687 and Uttaranchal-27116) with a high proportion of the Christians
residing in urban areas (Jammu & Kashmir-66.1, Himachal Pradesh-43.2 and
Uttaranchal-58.0). Hence, their literacy rate was exceptionally high (above 97 per
cent) in Kargil, Kupwara and Srinagar districts. A large segment of the Christians
were literate in-migrants chiefly engaged in tertiary activities. In Uttaranchal and
Himachal Pradesh, the tradition of army service and resultant presence of ex-
servicemen in the region had contributed to the spread of education (Sagar,
1990).
(ii) Mizoram and Large Parts of Nagaland and Manipur States: These states
had a sizeable Christian population. With India’s independence, both the central
and state governments introduced considerable schemes to provide more
opportunities for primary education. Apart from this, a number of Christian
missionaries, Non-Government organisations and some private organisations
continued to render their services for the cause of education in the region
(Shimray and Usha Devi, 2009). For instance, the high literacy rate in the states
of Mizoram was attributed to the influence of the Church, as Mizos were
166
INDIA
Literacy Among Christians: 2001
D.N .A.
Delhi
Percentage
85 and Above
70 - 85
55 - 70
40 - 55
Below 40
D. N . A. = D ata Not Av ailab le
MAP 5 .3
National Avera ge 8 0.3
0 500
Kms

167
encouraged to read the Bible from a young age (Chugh, 2009). The state was a
classical example of the spread of literacy due to the missionary zeal of the
Christian missions and the Christians accounted for 87 per cent of the total
population.
(iii) Peninsular Region: An early spread of education by the Christian
missionaries in this part of the country accounted for high literacy rate among the
Christians. Moreover, the Christians of South India were economically better than
their northern counterparts. For instance, the Nadars (a Christian caste) of Tamil
Nadu were known for their industry and zeal for education (Mandelbaum, 1972).
(iv) Western and Central Region: The Christians recorded high literacy in most
parts of Gujarat, Madhya Pradesh and Rajasthan. High degree of urban-
industrial development along with a well developed schooling infrastructure, were
some of the reasons for high literacy among the Christians of Gujarat. However,
the literacy rate of above 85 per cent in most of the districts of the
demographically sick states of Madhya Pradesh and Rajasthan could be
explained in terms of the fact that more than half of the Christian population
resided in urban areas and two-third of the total Christian population was
engaged in tertiary activities. Spread of education by Christian missionaries and
urban concentration of the Christian population in many of the districts of this
region accounted for high literacy rates among the Christians.
(v) Bihar Plains and Adjoining Parts of Uttar Pradesh: The region supported
very small base of the Christian population. Among them the literacy rates were
above 90 per cent in the districts of Begusarai, Munger, Patna, Bhojpur and
Gaya. This high literacy rate seemed to be the outcome of in-migration of the
literate Christians.
(vi) Southern Parts of West Bengal and Adjoining Interior Areas and
Coastal Orissa: Relatively high Christian literacy could be seen in context to an
early start of modern education, the Christian missionary activities, a well

168
developed system of rail-road routes (Calcutta-Delhi, Calcutta-Puri, Calcutta-
Bombay, etc.), high degree of urban-industrial development and rich agriculture
of deltaic areas of Hooghly, Damodar, Subernarekha and Mahanadi (Sagar,
1990).
(vii) Scattered Districts: High literacy rates among the Christians were also
observed in certain scattered districts all over the country particularly located in
Punjab plains (Jalandhar, Ludhiana, Patiala and Bathinda), western and central
Uttar Pradesh plains (Bareilly, Kanpur Nagar, Lucknow and Faizabad) and north-
eastern region (Tawang, Dibang Valley, West Tripura, East Khasi Hills,
Goalpara, Kamrup and North Cachar Hills districts). Diversified economy, long
history of urbanisation, urban infrastructure, an early start of education,
contributions of the Christian missionaries in the spread of education and strong
rural-urban linkage were some of the factors that led to high literacy rate among
the Christians.
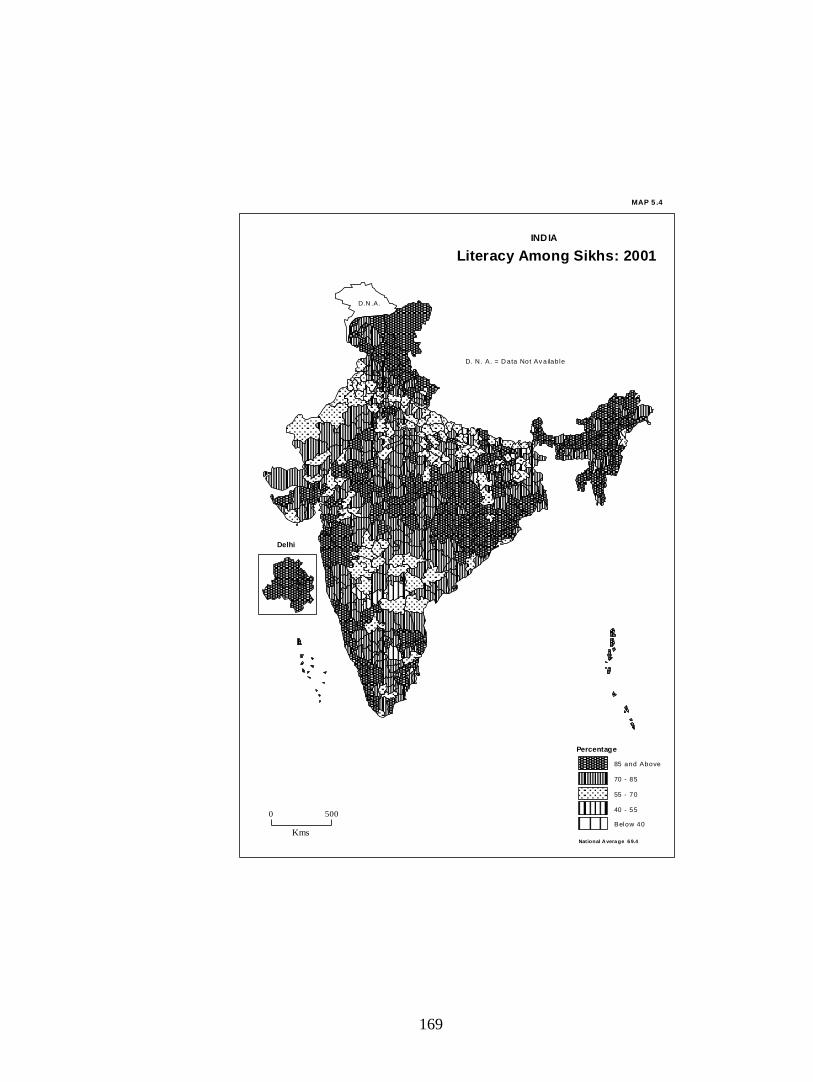
The Sikhs
The Sikhs displayed literacy rate of 70 per cent and above in 465 districts
out of the 593 districts of the country. The areas that recorded relatively high
literacy among the Sikhs included: (i) North-western and North-eastern Hilly
Region, (ii) Central and Eastern Region, (iii) Doaba Region of Punjab, (iv)
Ahmadabad-Vadodara and Mumbai-Pune Industrial Belts, (v) Tamil Nadu and
Adjoining Area of Andhra Pradesh, and (vi) Industrial Clusters (Map 5.4).
(i) North-western and North-eastern Hilly Region: The literacy rate of the
Sikhs was higher than 85 per cent in most of the districts of the north-western
and the north-eastern hill states. In Jammu & Kashmir, high literacy among the
Sikhs was largely the result of the involvement of about three-fourths of the Sikh
population in tertiary activities which enhanced the need for education. However,
in Uttaranchal and Himachal Pradesh the reason lied in a well developed
education infrastructure and diversification of education to the rural areas. A high
169
Literacy Among Sikhs: 2001
INDIA
D.N .A.
Delhi
Percentage
85 and Above
70 - 85
55 - 70
40 - 55
Below 40
D. N . A. = D ata Not Av a ilab le
MAP 5 .4
National Avera ge 6 9.4
0 500
Kms

170
proportion of the Sikh population (71 per cent in Himachal Pradesh and 74.6 per
cent in Uttaranchal) resided in the rural areas of these states.
In the north-eastern hilly region except the state of Assam, the number of
Sikhs was very small and varied from a few hundreds to three thousand
(Mizoram-326, Nagaland-1152, Sikkim-1176, Tripura-1182, Manipur-1653,
Arunachal Pradesh-1865 and Meghalaya-3110) and a large number were
migrants either deployed in the paramilitary forces or in tertiary sector. Moreover,
the state government and the Christian missionaries had significantly contributed
in the spread of education and creation of educational infrastructure.
(ii) Central and Eastern Region: A relatively high literacy was registered among
the Sikhs in the eastern part of the central tribal belt. The Sikhs recorded
universal literacy (100 per cent) in Nayagarh, Gajapati, Baudh and Sonapur
districts of Orissa. In-migration of a small stream of literate Sikhs for economic
opportunities well explained this scenario.
(iii) Doaba Region of Punjab: The Sikhs recorded relatively high literacy rate in
the districts of Hoshiarpur (84 per cent), Jalandhar (80.2 per cent) and
Nawanshahr (79.7 per cent). High incidence of emigration of Sikhs to foreign
lands helped in improving literacy rates by enhancing the value of education and
by improving the schooling infrastructure through the remittances.
(iv) Ahmadabad-Vadodara and Mumbai-Pune Industrial Belts: These were
traditional areas of high literacy. The region encompassed the major industrial
clusters (Ahmadabad-Vadodara and Mumbai-Pune) as also a number of
industrial centres such as Sholapur, Kolhapur and Belgaum. Urban-industrial
development, well developed educational infrastructure, high functional value of
literacy and employment opportunities that had attracted the literate Sikh
migrants were some of the reasons responsible for high literacy rates among the
Sikhs of this region. More than three-fourths of the Sikhs lived in urban areas and
were engaged into tertiary activities.

171
(v) Tamil Nadu and Adjoining Area of Andhra Pradesh: The Sikhs have high
literacy in all the coastal as well as in most of the interior districts of Tamil Nadu.
It is a traditional area of high literacy resulting from eternal influence and spread
of education by the pre-independence rulers and post-independence state
government. Likewise, the Sikhs recorded high literacy in Chittoor, Cuddapah
and Nellore districts of the otherwise less developed Rayalseema region of
Andhra Pradesh. Most of the Sikhs lived in urban areas and were engaged in
tertiary activities.
(vi) Industrial Clusters: The high literacy rate among the Sikhs was also found
in the industrial clusters of the country such as in Ambala-Delhi-Agra-Gwalior
belt, Kolkata-Asansol, Chhotanagpur, Bangalore-Coimbatore-Madurai as also in
a number of scattered industrial districts. Employment opportunities had attracted
many literate Sikhs to these areas. These regions had well developed
educational infrastructure and high functional value of literacy.
The Buddhists
The literacy rate of the Buddhists was 70 per cent and above in 332
districts out of the 593 districts of the country. The areas of relatively high literacy
among the Buddhists included: (i) North-western Hilly Region, (ii) Rajasthan and
Gujarat, (iii) Tribal Belt of Central India and Adjoining Vidarbha Region of
Maharashtra, (iv) Coastal Plains and Adjoining Interior Districts, and (v)
Scattered Districts of the Country (Map 5.5).
(i) North-western Hilly Region: The literacy rate among the Buddhists was high
in most of the districts of Himachal Pradesh, Uttaranchal and also in some of the
districts of Jammu & Kashmir states. These regions were well endowed with
educational facilities.
(ii) Rajasthan and Gujarat: The literacy among the Buddhists was high in most
of the districts of Rajasthan and Gujarat states; and 83.9 per cent of the
Buddhists in the state of Gujarat lived in urban areas, the corresponding figure in

172
Literacy Among Buddhists: 2001
INDIA
D.N .A.
Delhi
Percentage
85 and Above
70 - 85
55 - 70
40 - 55
Below 40
D. N . A. = D ata Not Av ailab le
MAP 5 .5
National Avera ge 7 2.7
0 500
Kms
173
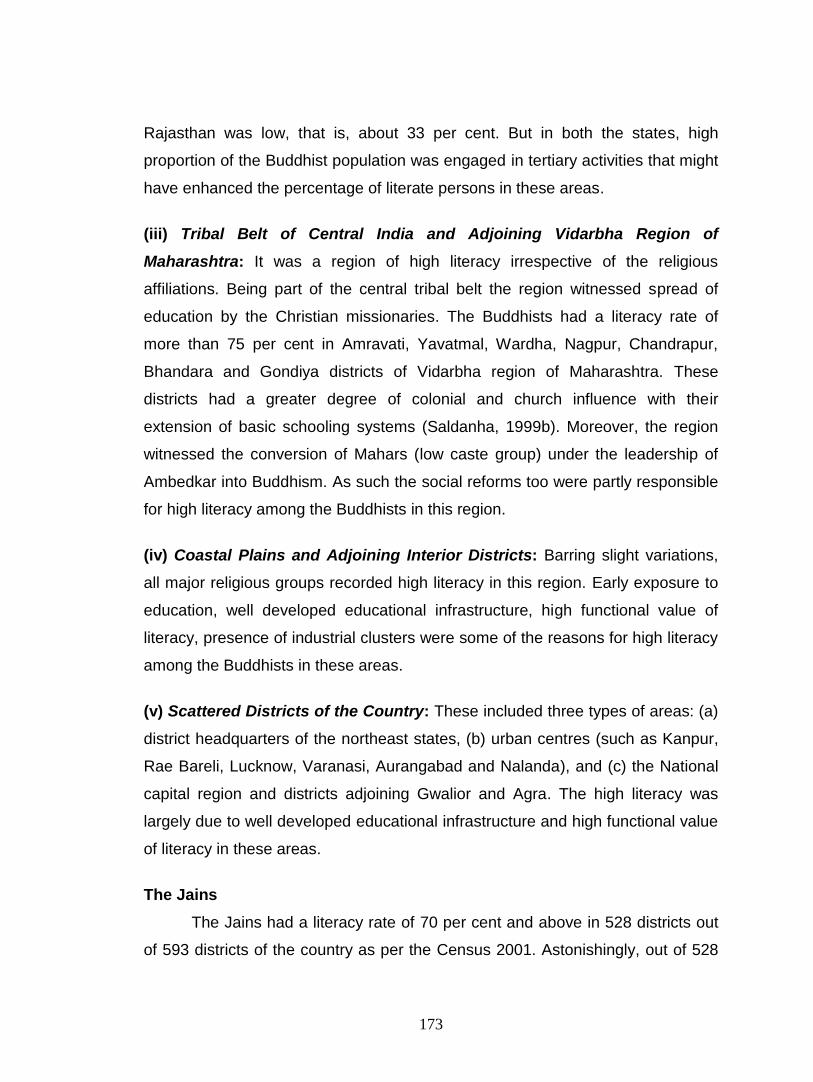
Rajasthan was low, that is, about 33 per cent. But in both the states, high
proportion of the Buddhist population was engaged in tertiary activities that might
have enhanced the percentage of literate persons in these areas.
(iii) Tribal Belt of Central India and Adjoining Vidarbha Region of
Maharashtra: It was a region of high literacy irrespective of the religious
affiliations. Being part of the central tribal belt the region witnessed spread of
education by the Christian missionaries. The Buddhists had a literacy rate of
more than 75 per cent in Amravati, Yavatmal, Wardha, Nagpur, Chandrapur,
Bhandara and Gondiya districts of Vidarbha region of Maharashtra. These
districts had a greater degree of colonial and church influence with their
extension of basic schooling systems (Saldanha, 1999b). Moreover, the region
witnessed the conversion of Mahars (low caste group) under the leadership of
Ambedkar into Buddhism. As such the social reforms too were partly responsible
for high literacy among the Buddhists in this region.
(iv) Coastal Plains and Adjoining Interior Districts: Barring slight variations,
all major religious groups recorded high literacy in this region. Early exposure to
education, well developed educational infrastructure, high functional value of
literacy, presence of industrial clusters were some of the reasons for high literacy
among the Buddhists in these areas.
(v) Scattered Districts of the Country: These included three types of areas: (a)
district headquarters of the northeast states, (b) urban centres (such as Kanpur,
Rae Bareli, Lucknow, Varanasi, Aurangabad and Nalanda), and (c) the National
capital region and districts adjoining Gwalior and Agra. The high literacy was
largely due to well developed educational infrastructure and high functional value
of literacy in these areas.
The Jains
The Jains had a literacy rate of 70 per cent and above in 528 districts out
of 593 districts of the country as per the Census 2001. Astonishingly, out of 528

174
districts in 452 districts the literacy rate of the Jains was 85 per cent and above.
There was no distinct region of high Jain literacy. In fact, the high literacy districts
were well distributed throughout the length and breadth of the country (Map 5.6).
One of the reasons for high literacy among the Jains in these districts was their
profession, which was chiefly trade and commerce. Consequently, the functional
value of literacy was great among the Jains as they were engaged in business.
Moreover, a high proportion of Jains lived in urban areas of these districts and
had better access to the educational facilities.
(B) Areas of Relatively Low Literacy (Below 55 per cent)
These were the areas in which either the population was unaware of the
benefits of education, especially for the girls or the areas reeled under poverty
and as such engagement of all family members in some kind of productive
activity forced them to push aside education of children. Areas where less than
55 per cent of the population (aged 7 and above) belonging to the major religious
groups was literate represented below their national average condition in literacy.
Hence, these areas lagged behind rest of the country on socio-economic front
and had to go a long way to achieve universal literacy.
The Hindus
The literacy rate among the Hindus was below 55 per cent in 117 districts
of the country and these were mostly concentrated in: (i) Gangetic Plains, (ii)
Mewar Region of Rajasthan, (iii) Baghelkhand and Adjoining Northern Parts of
Chhattisgarh and Western Part of Jharkhand, and (iv) Dandakaranya and
Telengana Plateau Region (Map 5.1).
(i) Gangetic Plains: These plains were marked by subsistence nature of
agriculture, poor schooling facilities, high poverty and low level of economic
development. Furthermore, the prevalent culture was against female education.
For instance, the Mithila culture restricted female mobility and detested female
literacy. Moreover, a predominantly agricultural character of the rural economy
based on backward base and technology made formal education of little practical

175
Literacy Among Jains: 2001
INDIA
D.N .A.
Delhi
Percentage
85 and Above
70 - 85
55 - 70
40 - 55
Below 40
D. N . A. = D ata Not Av a ilab le
MAP 5 .6
National Avera ge 9 4.1
0 500
Kms

176
value (Das, 2005). As such, nearly half of the Hindu population aged 7 years and
above was illiterate.
(ii) Mewar Region of Rajasthan: Majority of the Hindus were cultivators and
lived in rural areas. Poor educational infrastructure in the rural areas had given
way to low literacy level among the Hindus. Furthermore, subsistence nature of
agricultural economy, strong prejudices against female education and their
mobility and the high ratio of the socially and economically backward sections
and non-Christian tribes (Sagar, 1990) were equally responsible for low literacy
among the Hindus.
(iii) Baghelkhand and Adjoining Northern Parts of Chhattisgarh and
Western Part of Jharkhand: Very large non-Christian tribal population, poor
schooling infrastructure, subsistence agriculture, high poverty, restriction on
female education and low functional value of education were some of the factors
responsible for low literacy among the Hindus. The female literacy rates were
below 40 per cent and the situation was still worse in rural areas. The literacy
rate among the Hindu females in the rural areas of the districts of Garhwa (20.8
per cent), Sonbhadra (23.8 per cent), Chatra (25.5 per cent) and Palamu (25.7
per cent) was dismal.
(iv) Dandakaranya and Telengana Plateau Region: Illiteracy was pronounced
among the Hindus of this region. It comprised south western Orissa, southern
Chhattisgarh, western Andhra Pradesh and north-eastern Karnataka. High
poverty and physical isolation that led to insufficient number of schools and low
road connectivity were some of the factors that caused low literacy among the
Hindus. Furthermore, western Andhra Pradesh and north-eastern Karnataka
were part of the erstwhile princely state of Hyderabad whose rulers did little for
the spread of education.
The Muslims
The Muslims recorded a relatively low literacy rate of below 55 per cent in
169 districts of the country. In 41 of these districts, less than 40 per cent of the
177
Muslim population aged 7 and above was literate. The literacy rate among the
Muslims was relatively low in: (i) Jammu & Kashmir Region, (ii) Northern Plains
and Mewat Region, and (iii) Western Rajasthan and Kachchh Region (Map 5.2).
(i) Jammu & Kashmir Region: Barring the districts of Srinagar, Jammu, Kargil
and Leh, the Muslims displayed low literacy rates that ranged between 36.4 per
cent in Udhampur district and 48.8 per cent in Pulwama district. The region
presented dismal picture in terms of female literacy. The literacy rates of Muslim
females were abysmally low in Udhampur (22.5 per cent), Doda (26.5 per cent)
and Kupwara (28.6 per cent) districts. The low female literacy rates in Jammu &
Kashmir region were mainly due to continued terrorism activities, which excluded
women from educational achievement (Dutta, 2006). Furthermore, the traditional
prejudice of the Muslims against female education and the highly dispersed
nature of population distribution in this mountainous state too were the reasons
for low level of literacy (Krishan and Shyam, 1978). The very low literacy was a
legacy of the past and the cumulative effect of several factors, i.e., the dearth of
educational institutions, the economic backwardness of the people to finance the
cost of educating their children and, above all, the preaching of religious leaders
(GOI, 2008).
(ii) Northern Plains and Mewat Region: The Muslims recorded literacy rates of
below 55 per cent in the Indo-Gangetic plains and the plains of Brahmaputra.
The Muslim population of this region was mostly backward, agrarian and
extremely poor. In Mewat region (north-east Rajasthan), most of the Muslims
were Meo Muslims and they were quite backward (The Hindu, 2005). Moreover,
the region lacked schooling infrastructure. The schools were located at such a
distance that parents chose not to send their daughters to school (Alam and
Raju, 2007). Furthermore, the plains of Uttar Pradesh were the citadel of Muslim
orthodoxy.
(iii) Western Rajasthan and Kachchh Region: The Muslim literacy rates
ranged between 32.4 per cent in the district of Jaisalmer and 50.8 per cent in

178
Hanumangarh. The literacy rates of Muslim males were low (less than 65 per
cent) and among the Muslim females it was much lower than males. In the
districts of Jaisalmer, Barmer, Bikaner and Jalor the female literacy rates among
the Muslims were less than 30 per cent in 2001. The feudal structure and social
taboos against female education were the main reasons for low female literacy.
The region lacked in schooling infrastructure and most of the Muslims were
nomadic pastoralists.
The Christians
The Christians had a low literacy rate of below 55 per cent in only 51
districts of the country and which were mainly located in: (i) South-eastern
Orissa, and (ii) Scattered Districts of the Country (Map 5.3).
(i) South-eastern Orissa: The Christians had low literacy rate in Koraput,
Rayagada, Kandhamal, Ganjam and Gajapati districts of Orissa. The literacy rate
among the Christians ranged between 29.4 per cent in Rayagada and 54.2 per
cent in Koraput districts. While the male literacy rates in these districts varied
from 40.6 per cent in Rayagada to 66.6 per cent in Koraput but the female
literacy rate was very low. These varied from 19.1 per cent in Rayagada to 21.5
per cent in Gajapati. It is a tribal dominated non-industrial region marked by very
low level of economic development.
(ii) Scattered Districts of the Country: These districts were mostly: (a) districts
of Punjab along international border with Pakistan, (b) districts lying in Terai
region, and (c) districts of north-eastern states with large tribal population. The
Christian population of the former two categories shared the socio-economic
level of the Dalits. Contrastingly, the Christian population of the latter category
shared the tribal background. Backwardness especially in the rural areas and
poverty among the Christians of these districts were some of the reasons
responsible for their low literacy.
179
The Sikhs
Interestingly, the Sikhs recorded a literacy rate of below 55 per cent only in
21 districts (barring Mahe district which did not hold any Sikh population) out of
the 593 districts of India and most of these districts support a small population of
Sikhs. Sikhism encourages every individual to be literate and many Gurduwaras
offer formal educational facilities through schools and colleges (Singh, 2004a).
These districts did not form a contiguous belt but were found scattered
throughout the length and breadth of the country (Map 5.4). The literacy rates
among the Sikhs in these districts ranged between 15.4 per cent in West Sikkim
district of Sikkim and 54.6 per cent in Nawada district of Bihar. This category
included mostly the backward districts of the northern plains and the districts of
peninsular region marked by expansion of agriculture such as Raichur, Bagalkot,
Koppal, Mahbubnagar and Dharmapuri.
The Buddhists
The Buddhists had a literacy rate of less than 55 per cent in 96 districts of
the country. The areas marked by low literacy rate among the Buddhists
included: (i) Kashmir Himalayas, (ii) Uttar Pradesh and Northern Bihar, (iii)
Arunachal Pradesh, (iv) Erstwhile State of Hyderabad, and (v) Scattered Districts
of the Country (Map 5.5).
(i) Kashmir Himalayas: More than half of the Buddhist population aged 7 years
and above were illiterate in the districts of Kupwara, Doda, Baramula, Kargil and
Punch. Low female literacy as well as rural concentration of the Buddhist
population in this region partly explained their low literacy rate.
(ii) Uttar Pradesh and Northern Bihar: It was a traditional area of low literacy.
The Buddhist population chiefly comprised of the Neo-Buddhists who shared the
economic backwardness of the Dalits.
(iii) Arunachal Pradesh: Being an area of traditional Buddhism, the state
supported sizeable Buddhist population. Majority of the Buddhists were illiterate

180
so much so that in the district of Tawang (noted for the world famous Buddhist
monasteries) only one-third of the Buddhists were literate. Low literacy could
partly be accounted for by the fact that majority of the Buddhists (92.5 per cent)
resided in rural areas and about three-fourths were cultivators. Prolonged
physical inaccessibility and the long spell of social isolation also resulted into low
rates of literacy (Krishan, 1984).
(iv) Erstwhile State of Hyderabad: More than half of the Buddhist population
was illiterate in Adilabad and Nizamabad districts of Andhra Pradesh as well as
in Medak, Gulbarga, Raichur, Bagalkot and Bellary districts of Karnataka. These
districts were part of the erstwhile state of Hyderabad and not much was done in
the field of education as such the region lacked educational facilities.
(v) Scattered Districts of the Country: These included two types of areas: (a)
tribal districts of north-eastern states and central region, and (b) districts of Tamil
Nadu with sizeable scheduled caste population. The low literacy was largely the
result of backwardness of the economy.
The Jains
The Jains had a literacy rate of less than 55 per cent only in 27 districts
out of the 593 districts of India (barring 8 districts that had no Jain population).
Most of these districts with the exception of some districts (Baramula, Badgam,
Punch and Kupwara) which formed a distinct belt were found scattered in the
Gangetic plains and the north-eastern region (Map 5.6). All these districts
supported a very low Jain population. Poor infrastructure for education was partly
responsible for low literacy among the Jains of these districts.
(C) Areas of Moderate Literacy (55-70 per cent)
These areas represented diverse conditions in terms of socio-economic
and cultural context and were the transitional areas between areas of high and
low literacy rates.

181
The Hindus
The literacy rate of the Hindus ranged between 55 and 70 per cent in 241
districts of the country which were part of: (i) Western Rajasthan and Adjoining
Area, (ii) Ganga-Yamuna Doab Region, (iii) Madhya Pradesh and Adjoining Area
of Eastern Uttar Pradesh, (iv) Kachchh and Kathiawar, (v) Northern Orissa and
Adjoining Area of Jharkhand and Chhattisgarh, (vi) Interior Peninsular Plateau
and Coastal Andhra Pradesh, and (vii) Scattered Districts of the Country (Map
5.1).
(i) Western Rajasthan and Adjoining Area: The Hindus displayed moderate
literacy in a large compact area that consisted of western Rajasthan, western
and northern parts of Haryana and large parts of Malwa plain of Punjab. The
Hindu literacy in this area ranged between 56.4 per cent in Jaisalmer and 69.9
per cent in Mahendragarh districts. The gender gap in literacy among the Hindus
was very wide. In Jaisalmer, the gender gap was 35.6 per cent. The adjoining
region was an area of commercial agriculture marked with feudalism. However,
the Hindus were mostly engaged in tertiary activities and had an urban base
more so in the Malwa region of Punjab. But the low level of economic
development, poor infrastructure, traditional prejudices against female education
and their outside employment were some of the reasons for moderate literacy
among the Hindus in this region.
(ii) Ganga-Yamuna Doab Region: Although the Ganga-Yamuna Doab region is
a prosperous region of Uttar Pradesh with relatively better educational
infrastructure, a high degree of rural-urban interaction as well as affinity to the
national capital and a number of existing and upcoming urban centres yet the
literacy rates among the Hindus in this region were moderate. The moderate
literacy rate could be the result of low female literacy and influx of illiterate
migrants.
(iii) Madhya Pradesh and Adjoining Area of Eastern Uttar Pradesh: The
moderate literacy rate of the Hindus in Madhya Pradesh was largely the outcome

182
of an early start of education, positive role played by the princely states and
successive state governments, dense road network and commercial agriculture.
Contrastingly, eastern Uttar Pradesh presented a classic case of a backward
economic region with low income level, predominance of the agricultural sector,
extremely low level of urbanisation and inadequately developed infrastructure
(Singh, 2004b). The resultant male selective out-migration to relatively more
progressive states had enhanced the level of education and the money sent back
homes had facilitated education.
(iv) Kachchh and Kathiawar: Half of the Hindu population in Gujarat was in
primary occupation with two-thirds concentrated in rural areas. The factors that
might have arrested the progress of literacy in this area included general
backwardness of rural areas, limited educational facilities, especially for females
and in rural areas (Sagar, 1990).
(v) Northern Orissa and Adjoining Area of Jharkhand and Chhattisgarh: It
was an inaccessible area with large tribal population and marked by abject
poverty, lack of educational infrastructure in rural areas, primitive cultural values
that did not endorse modern education and long history of administrative neglect.
The literacy would have been much lower but for the region being a mineral
based industrial area that attracted literate migrants and spread of education by
Christian missionaries.
(vi) Interior Peninsular Plateau and Coastal Andhra Pradesh: Barring coastal
districts of Andhra Pradesh, the region was a drought prone area marked by
backward economy and acute poverty in rural areas. However, moderate literacy
among the Hindus could be seen in the light of recent developmental activities,
presence of a number of industrial clusters (Belgaum, Mysore, Bangalore,
Salem, Madurai, etc.) and the literacy schemes launched by the government for
drought prone areas.

183
In coastal districts of Andhra Pradesh, the high per capita income as a
result of commercialisation of agriculture explained moderate literacy rates
among the Hindus. .
(vii) Scattered Districts of the Country: Two-thirds of the Hindu population was
literate in Tehri Garhwal and Rudraprayag districts of Uttaranchal. In spite of
harsh terrain, poor infrastructure and high poverty levels, moderate literacy rate
of Hindus could be seen in context to male selective out-migration in search of
employment, which had enhanced the level of education in these regions.
The Muslims
The literacy rate of the Muslims ranged between 55 and 70 per cent in 177
districts of the country found in: (i) Ladakh region, Himachal Himalayas and
Adjoining Garhwal Region, (ii) Eastern Rajasthan, North-central Madhya
Pradesh, Southern and Eastern Parts of Uttar Pradesh and Central Bihar, (iii)
Southern Parts of West Bengal, (iv) Tripura and Adjoining Cachar Region, (v)
Erstwhile State of Hyderabad, and (vi) Scattered Districts of the Country (Map
5.2).
(i) Ladakh Region, Himachal Himalayas and Adjoining Garhwal Region:
More than two-thirds of the Muslim population was literate in Leh district. The
Muslim literacy rates in the urban and rural areas were 79.6 per cent and 64.1
per cent respectively. The gender gap in literacy (29.1 per cent) among the
Muslims was wider than their national average of 17.5 per cent in this region. The
region is part of the Muslim majority state of Jammu & Kashmir but is dominated
by the Buddhist population.
Although, in Himachal Pradesh and Uttaranchal, the State had been
committed towards education for all, yet the moderate literacy among the
Muslims could be explained in the light of the fact that a large segment of the
Muslim population consisted of the Van Gujjars (tribal) for whom literacy held no
functional value.

184
(ii) Eastern Rajasthan, North-central Madhya Pradesh, Southern and
Eastern Parts of Uttar Pradesh and Central Bihar: This compact area formed
a transition zone between the low literacy region on the one hand and high
literacy region on the other. Moderate literacy could be seen in the light of the
fact that the region housed a number of industrial centres such as Jaipur,
Gwalior, Patna and Gorakhpur which spearheaded the diffusion of literacy. But
the feudal structure and resultant social taboos hindered female literacy. Thus,
while the male literacy rates of Muslims were above 65 per cent (barring Kanpur
Dehat, Sikar and Etawah districts), the literacy rates of the Muslim females
ranged between 35.9 per cent in Sawai Madhopur and 58.6 per cent in Datia
districts.
(iii) Southern Parts of West Bengal: The region was marked by the Muslim
concentrated districts. Owing to an early start of education, urban-industrial base,
a well developed rail-road network and rich agricultural tract it is one of the high
literacy regions of the country. Unfortunately, the literacy among the Muslim
population was relatively lower than the general population and ranged between
59.8 per cent in South Twenty Four Parganas and 68.8 per cent in Barddhaman
district. The literacy rate among the Muslims would have been still higher but for
Government lacunae in addressing the educational needs of the Muslims,
deficiencies in infrastructural facilities in Muslim-concentrated districts (Husain
and Chatterjee, 2009) as also high poverty and deprivation among the Muslims
of the region.
(iv) Tripura and Adjoining Cachar Region: The Muslims in the Cachar region
(consisting of the southern districts of Assam) and the adjoining districts of
Manipur and Tripura had moderate rate of literacy. Although, majority of the
Muslims were living in rural area but they were engaged into tertiary activities.
(v) Erstwhile State of Hyderabad: Being part of the princely Muslim state of
Hyderabad, the region had experienced low female and overall literacy. These
were mostly the districts of Andhra Pradesh and eastern part of Karnataka. Lack

185
of impetus given to education by the Nizams of Hyderabad and also by the state
government had made this region as an area of low to moderate literacy rates.
(vi) Scattered Districts of the Country: Most of these included four types of
areas: (a) state capitals (Srinagar and Jammu) of Muslim majority state, (b) seats
of princely states (Kapurthala, Patiala, Faridkot and Junagadh), (c) plantation
areas (Jalpaiguri and Koch Bihar), and (d) backward districts (Kandhamal,
Rayagada and Malkangiri). Thus, while the moderate literacy in the first three
categories was the result of better educational infrastructure that in the last
category was largely due to in-migration of literate male Muslim population.
The Christians
The Christians had moderate literacy rate of 55 to 75 per cent in 130
districts concentrated in: (i) Northern Orissa and Adjoining Parts of Chhattisgarh
and Jharkhand, (ii) Avadh Plains, and (iii) Scattered Districts of the Country (Map
5.3).
(i) Northern Orissa and Adjoining Parts of Chhattisgarh and Jharkhand: The
region was marked by large tribal population, extreme poverty and low level of
economic development. However, moderate literacy among the Christians of this
area could be seen in the light of the role played by the Christian missionaries in
the spread of education.
(ii) Avadh Plains: More than 90 per cent of the Christians of this region shared
the background of either scheduled castes or scheduled tribes. As such, they
shared most of the disabilities of their counterparts in other religion and were
backward like them in literacy (Vempeny, 2003). Although the region was known
for illiteracy, the Christians of this region had moderate rate of literacy. Nearly
half of the Christian population lives in urban areas with two-thirds engaged in
tertiary activities.
(iii) Scattered Districts of the Country: A large number of these districts
especially those found in central region of the country were backward. The

186
Christian literacy rates could have been much lower but for the spread of
education by the Christian missionaries literacy rates became higher in these
areas.
The Sikhs
The Sikhs had moderate literacy rate ranging between 55 and 70 per cent
in 106 districts in India located in: (i) Western Rajasthan and Malwa Plains of
Punjab, (ii) Large Parts of Uttar Pradesh and Northern Madhya Pradesh, (iii)
Erstwhile State of Hyderabad, and (iv) Scattered Districts of the Country (Map
5.4).
(i) Western Rajasthan and Malwa Plains of Punjab: The Sikhs had a moderate
literacy rate in Ganganagar, Bikaner, Hanumangarh and Jaisalmer districts of the
western Rajasthan and also in the Malwa plains of Punjab. The Sikhs were
mainly cultivators and agriculture labourers residing in the rural areas of this
region. Larger landholdings in the Malwa region with agriculture being the
primary occupation lessened the need for education. Moreover, the Sikhs of
these two regions tended to be more patriarchal and feudal resulting in neglect of
female education.
(ii) Large Parts of Uttar Pradesh and Northern Madhya Pradesh: The Sikhs
displayed moderate literacy rate in most of the districts of Uttar Pradesh and in
the northern districts of Madhya Pradesh. The Sikhs of this region were
economically better placed and had an access to educational facilities.
(iii) Erstwhile State of Hyderabad: The Sikhs like other religious groups
displayed moderate literacy rates in the western districts of Andhra Pradesh and
the adjoining parts of the states of Maharashtra and Karnataka. The region was
part of the former state of Hyderabad and suffered neglect at the hands of
Nizams and successive state governments. The literacy rates of the Sikhs varied
from 55.8 per cent in Nalgonda to 69.9 per cent in Osmanabad.

187
(iv) Scattered Districts of the Country: These mainly included the districts
which either registered considerable tribal population such as Tuensang, Mon,
Hailakandi, Palamu, Dungarpur, Sahibganj, Pakaur, Gumla, Dumka and Jhabua
districts or those which were nodal part of a princely state such as Junagadh and
Patan districts.
The Buddhists
The Buddhists had a moderate literacy rate of 55 to 70 per cent in 162
districts of the country that included: (i) Ladakh Region, (ii) Ganga-Yamuna
Doab, Bundelkhand, Baghelkhand and Central Bihar, (iii) Marathwada Region of
Maharashtra, (iv) Southern Karnataka and Adjoining Part of Rayalseema Region
of Andhra Pradesh, and (v) Other Areas (Map 5.5).
(i) Ladakh Region: Ladakh is a region of traditional Buddhism and supported
sizeable Buddhist population. Nearly 62 per cent of the Buddhists aged 7 and
above were literate in Leh district. In the rural areas, 58 per cent of the Buddhist
population was literate and the corresponding figure in urban areas was 77.1 per
cent. The gender gap in literacy (18.9 per cent) among the Buddhists was
narrower than their national average of 21.4 per cent. Thus, in this inhospitable
region, the moderate literacy owed much to the relatively higher female literacy of
the Buddhist females. Moreover, Ladakh is not only an area of difficult terrain but
is also a tribal and a border district. However, moderate literacy was also the
result of enormous funding for education by various sources.
(ii) Ganga-Yamuna Doab, Bundelkhand, Baghelkhand and Central Bihar:
The Buddhists recorded moderate literacy in this compact area that consisted of
the north-western, southern and eastern parts of Uttar Pradesh as also the
adjoining northern parts of Madhya Pradesh and central parts of Bihar state. With
the exception of Ganga-Yamuna Doab, the region was marked by subsistence
rainfed agriculture, poverty, low level of urban-industrial development and feudal
culture. The literacy rates of the Buddhist population ranged between 55.1 per
cent in Chandauli and Jamui district and 69.9 per cent in Rewa district. Barring a
188
few districts the male literacy rates among the Buddhists were above 70 per cent.
Contrary to this, the female literacy rates were less than 50 per cent in a large
number of districts. The literacy would have been much lower but for the various
schemes launched by the state governments for the weaker sections especially
the Neo-Buddhists raised the proportion of literacy in the region.
(iii) Marathwada Region of Maharashtra: It is a semi-arid, underdeveloped
area deprived of industrialisation and characterised by feudal structure and low
status of women. While the male literacy rates (except for Jalna district) were
above 77 per cent, the literacy rates of the Buddhist females were below 56 per
cent. In the rural areas, the female literacy was still lower and ranged between
40.5 per cent (Jalna district) and 52.9 per cent (Buldana district). The relatively
lower literacy among the Buddhist females was largely an outcome of social
taboos against female mobility and their education that could be seen in the light
of feudal backwardness of Hyderabad State of which Marathwada was a part.
Besides, social movements spearheaded by the Dalits did not take off in the rural
areas of this region as a result, the Buddhists of this region by virtue of their
socially, economically and deprived status could not possibly attain much
literacy, particularly that of their women (Biswas and Raju, 2002).
(iv) Southern Karnataka and Adjoining Part of Rayalseema Region of
Andhra Pradesh: The region was engulfed by high literacy areas and marked by
plantation agriculture (Chikmagalur), mining (Kolar), agro industries (Mandya)
and well developed road-rail network due to the presence of urban-industrial
clusters such as Bangalore and Mysore. In fact, literacy could have been higher
but for acute poverty in the rural areas.
(v) Other Areas: These included: (a) prosperous agricultural areas (such as
districts of Malwa plains of Punjab and eastern parts of Haryana), (b) areas with
high tribal population (such as districts of Dohad, Jhabua, Dungarpur, Barwani,
Gajapati and Srikakulam), (c) areas associated with mining and industrial activity
(such as district of Koraput, Vishakhapatnam, Surat, Navsari, Rangareddi,

189
Namakkal and Madurai), and (d) areas of the north-east region associated with
trading (such as the districts of Lohit, Papum Pare and Imphal East). Being
marked by diverse economic activities, a complex set of factors seem to have
caused moderate literacy among the Buddhist population.
The Jains
The Jains had a moderate literacy rate ranging between 55 and 70 per
cent only in 30 districts of India. A large number of these districts were extremely
backward marked by high incidence of poverty and a very high gender gap.
These districts were largely the part of eastern Uttar Pradesh, Jharkhand and
Orissa (Map 5.6).
Thus, it can be concluded that regionally, the Indo-Gangetic plains and the
interior peninsular plateau emerged out as areas where all the religious groups
with some slight variations recorded relatively lower rates of literacy. Conversely,
the literacy rates among all the religious groups during the study period were
relatively higher in the coastal plains; Himachal, Garhwal and Kumaun Himalayas
and in the central upland region. Besides that, all the major religious groups
displayed very high literacy rates in the urban-industrial clusters of the country. In
fact, it is interesting to note that there were regions which had high or a low
literacy, across all the religious groups.