
CHAPTER V ANALYSIS OF INVESTMENT...
109
155 CHAPTER – V ANALYSIS OF INVESTMENT BEHAVIOUR 5.1 Introduction 5.2 Descriptive Analysis 5.3 Analysis of the Investment Particulars 5.4 An Analysis of the Preferences of the Investors Based on the Weighted Mean Values 5.5 An Analysis of Different Behaviour in Investing 5.6 Differential Analysis 5.7 Association Between Gender and Various Behavioural Issues 5.8 Association Between Demographic Factors and Investment Preferences 5.9 Association Between Savings and Demographic Factors 5.10 Association Between Average Rate of Return and Other Variables 5.11 Association Between Demographic Factors Investment Characteristics 5.12 Relational Analysis
Transcript of CHAPTER V ANALYSIS OF INVESTMENT...
155
CHAPTER – V
ANALYSIS OF INVESTMENT BEHAVIOUR
5.1 Introduction
5.2 Descriptive Analysis
5.3 Analysis of the Investment Particulars
5.4 An Analysis of the Preferences of the Investors Based on
the Weighted Mean Values
5.5 An Analysis of Different Behaviour in Investing
5.6 Differential Analysis
5.7 Association Between Gender and Various Behavioural Issues
5.8 Association Between Demographic Factors and Investment
Preferences
5.9 Association Between Savings and Demographic Factors
5.10 Association Between Average Rate of Return and
Other Variables
5.11 Association Between Demographic Factors Investment
Characteristics
5.12 Relational Analysis

156
CHAPTER – V
ANALYSIS OF INVESTMENT BEHAVIOUR
5.1 INTRODUCTION
The investment behaviour of the individual investors are analysed in
this chapter using the data collected from the respondents. Data analysis is a
vital component in any research study. The collected data are to be
processed carefully, classified systematically and tabulated scientifically.
Appropriate treatment is possible only if the data is analysed rationally. The
collected data were analysed in realization of the objectives.
The data are studied from as many dimensions as possible to draw
new insights into the investor behaviour. The data obtained on the variables
were subjected to statistical analysis. The analysis was categorized under
- Descriptive Analysis
- Differential Analysis
- Relational Analysis

157
5.2 DESCRIPTIVE ANALYSIS
It provides information about the nature of a particular group of
individuals. Mean, Median and percentages are used for the purpose of the
analysis.
In this research the investigator assessed the respondents by their
demographic characteristics, investments owned, investment features,
returns, diversifications of the portfolio, time spent for investing activity,
leveraging in investment and experience in stock market. The percentages
were found and the analysis was done as under
Following are the tables provided for analysis of demographics:
Table – 5.1 Details of Individual Investors
Table – 5.2 Marital Status and Number of Dependents
Table – 5.3 Annual Income and Annual Savings in Rupees
158
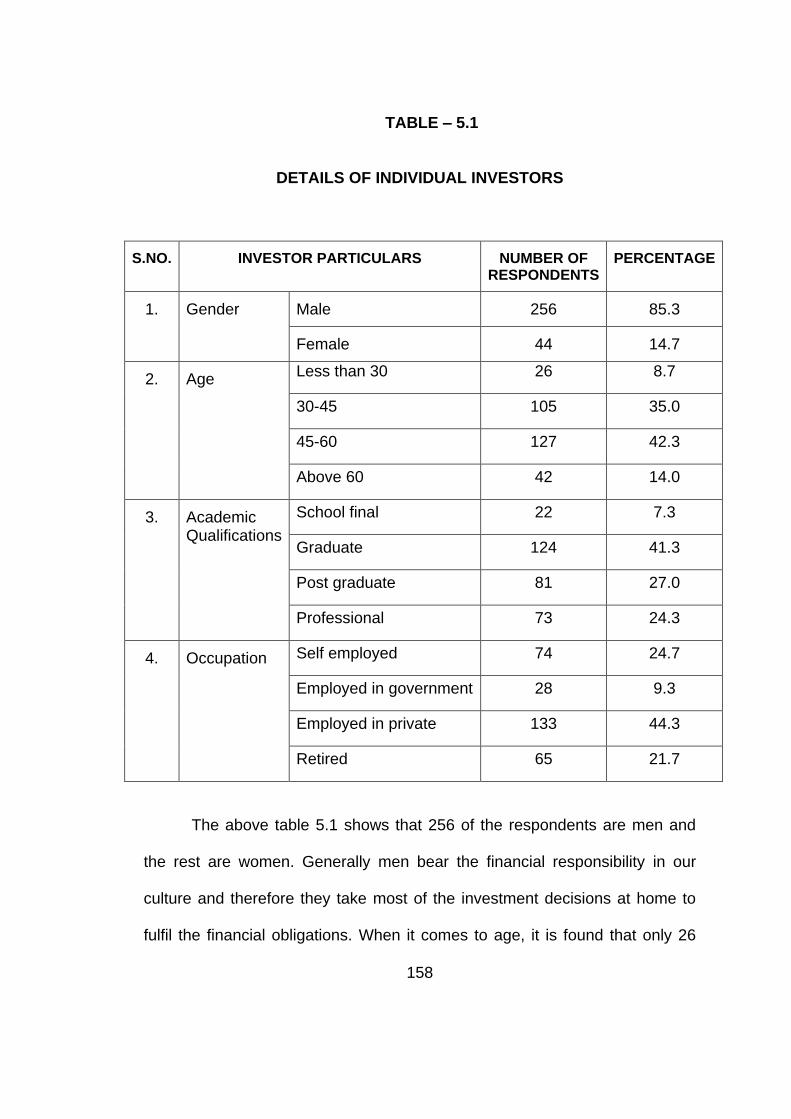
TABLE – 5.1
DETAILS OF INDIVIDUAL INVESTORS
S.NO. INVESTOR PARTICULARS NUMBER OF RESPONDENTS
PERCENTAGE
1. Gender Male 256 85.3
Female 44 14.7
2. Age Less than 30 26 8.7
30-45 105 35.0
45-60 127 42.3
Above 60 42 14.0
3. Academic Qualifications
School final 22 7.3
Graduate 124 41.3
Post graduate 81 27.0
Professional 73 24.3
4. Occupation Self employed 74 24.7
Employed in government 28 9.3
Employed in private 133 44.3
Retired 65 21.7
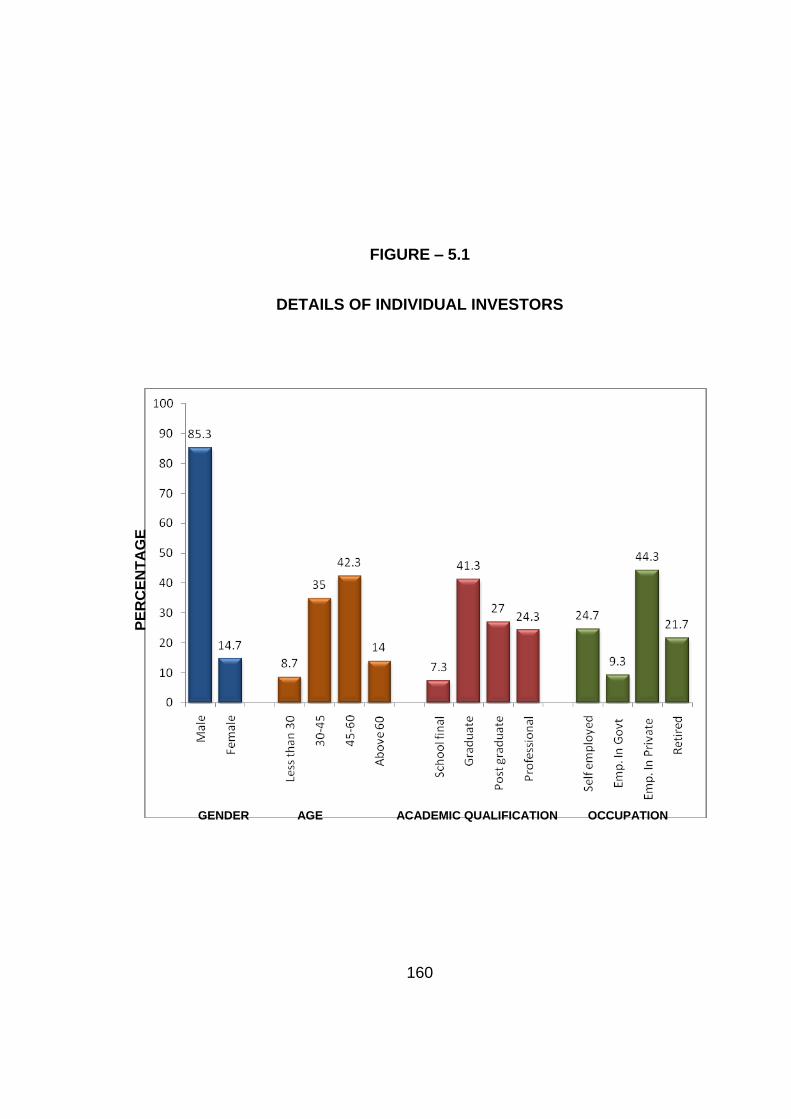
The above table 5.1 shows that 256 of the respondents are men and
the rest are women. Generally men bear the financial responsibility in our
culture and therefore they take most of the investment decisions at home to
fulfil the financial obligations. When it comes to age, it is found that only 26

159
investors (8.7%) belong to the age group of less than 30.Hence it can be
inferred that the younger generation do not think of savings and investments
in their early phase of employment or business. Investors in the age group of
30-45 are 105 in number constituting 35%. Similarly investors in the age
group of 45 to 60 also save and invest. An interesting finding is that 14% of
investors are above the age of 60. Among the respondents, 22 respondents
(7.3%) are investors with a High School or Matriculation diploma, whereas the
majority of the investors are graduates having the maximum number of
representation (41.3%) followed by Post graduates and Professionals
constituting 27% and 24.3 % respectively. As regards occupation, 44.3% of
the investors are employed in the private sector; 24.7% are self employed;
9.3% are employed in Government and the rest of the 21.7% are retired. Even
retired people invest in shares and mutual funds.
160
FIGURE – 5.1
DETAILS OF INDIVIDUAL INVESTORS
GENDER AGE ACADEMIC QUALIFICATION OCCUPATION
PE
RC
EN
TA
GE

161
TABLE – 5.2
MARITAL STATUS AND NUMBER OF DEPENDENTS
S.NO. INVESTOR PARTICULARS NUMBER OF RESPONDENTS
PERCENTAGE
1. Marital Status Married 267 89.0
Unmarried 33 11.0
2. Number of dependents
2 and below 155 51.7
3and above 145 48.3
A majority of the respondents are married. Married investors constitute
89 per cent and unmarried investors constitute 11 percent. As regards
number of dependents, 51.7% of them have 2 or less than 2 dependents and
48.3 percent of the respondents have more than 2 dependents

162
FIGURE – 5.2
MARITAL STATUS AND NUMBER OF DEPENDENTS
MARITAL STATUS NUMBER OF DEPENDENTS
PE
RC
EN
TA
GE
163
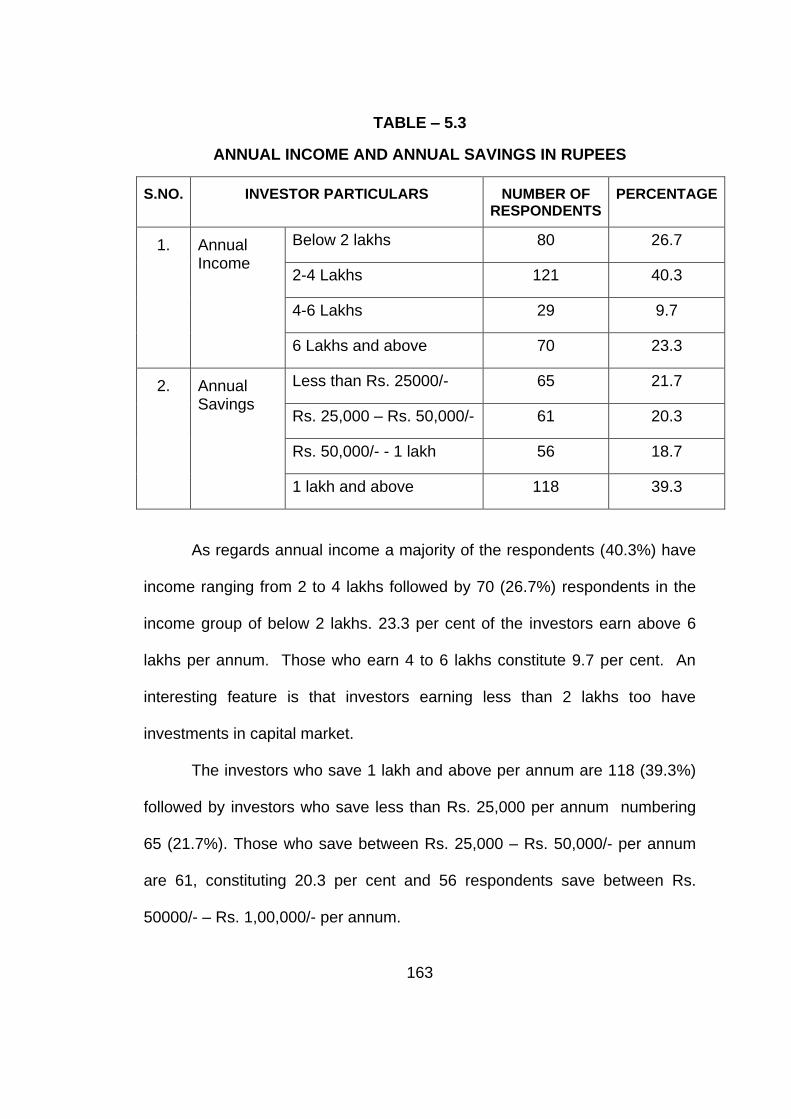
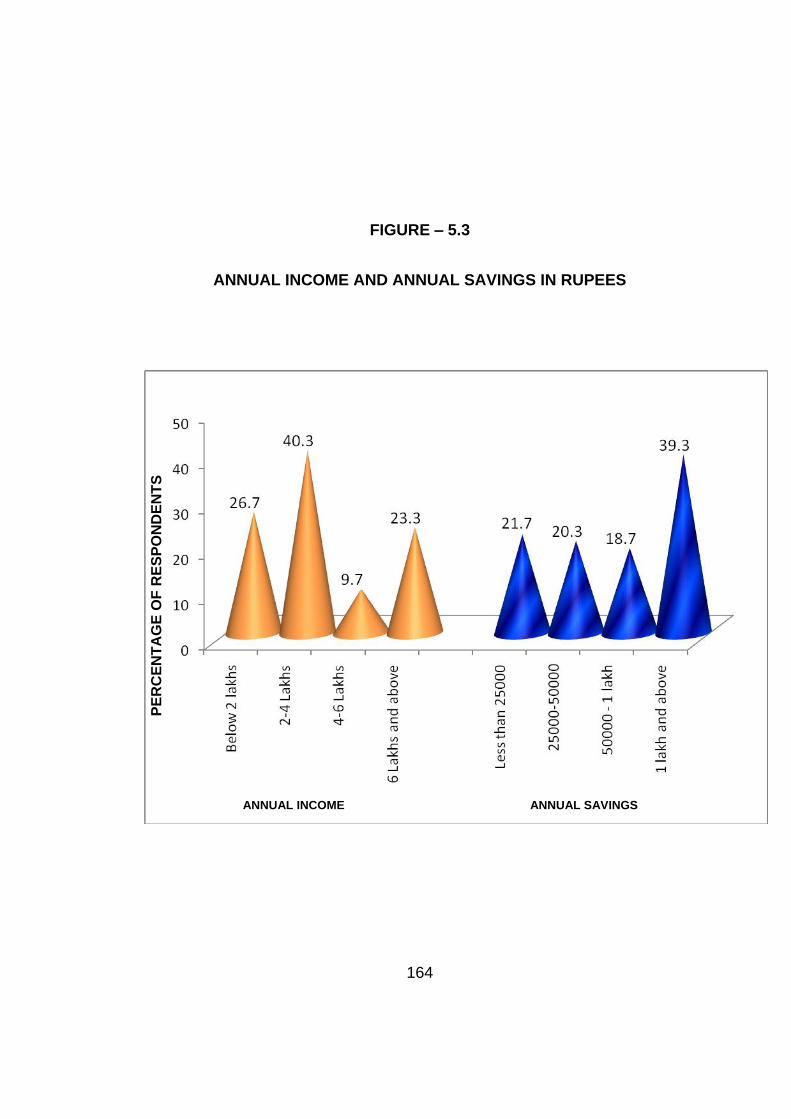
TABLE – 5.3
ANNUAL INCOME AND ANNUAL SAVINGS IN RUPEES
S.NO. INVESTOR PARTICULARS NUMBER OF RESPONDENTS
PERCENTAGE
1. Annual Income
Below 2 lakhs 80 26.7
2-4 Lakhs 121 40.3
4-6 Lakhs 29 9.7
6 Lakhs and above 70 23.3
2. Annual Savings
Less than Rs. 25000/- 65 21.7
Rs. 25,000 – Rs. 50,000/- 61 20.3
Rs. 50,000/- - 1 lakh 56 18.7
1 lakh and above 118 39.3
As regards annual income a majority of the respondents (40.3%) have
income ranging from 2 to 4 lakhs followed by 70 (26.7%) respondents in the
income group of below 2 lakhs. 23.3 per cent of the investors earn above 6
lakhs per annum. Those who earn 4 to 6 lakhs constitute 9.7 per cent. An
interesting feature is that investors earning less than 2 lakhs too have
investments in capital market.
The investors who save 1 lakh and above per annum are 118 (39.3%)
followed by investors who save less than Rs. 25,000 per annum numbering
65 (21.7%). Those who save between Rs. 25,000 – Rs. 50,000/- per annum
are 61, constituting 20.3 per cent and 56 respondents save between Rs.
50000/- – Rs. 1,00,000/- per annum.
164
FIGURE – 5.3
ANNUAL INCOME AND ANNUAL SAVINGS IN RUPEES
ANNUAL INCOME ANNUAL SAVINGS
PE
RC
EN
TA
GE
OF
RE
SP
ON
DE
NT
S

165
5.3 ANALYSIS OF THE INVESTMENT PARTICULARS
In this part of the study the details relating to the investment are
analysed using simple percentages for assessing the respondents with
respect to their preferences for various types of assets, rate of returns earned
and other details.
The following tables are provided under this analysis.
Table – 5.4 Ownership of Assets
Table – 5.5 Details about Investments
Table – 5.6 Time Spent for Investing Activities
Table – 5.7 Leverage in Investing
Table – 5.8 Shares in Delisted Companies
Table – 5.9 Rate of Return and Experience in Stock Market
Table – 5.10 Diversification of Portfolio
166
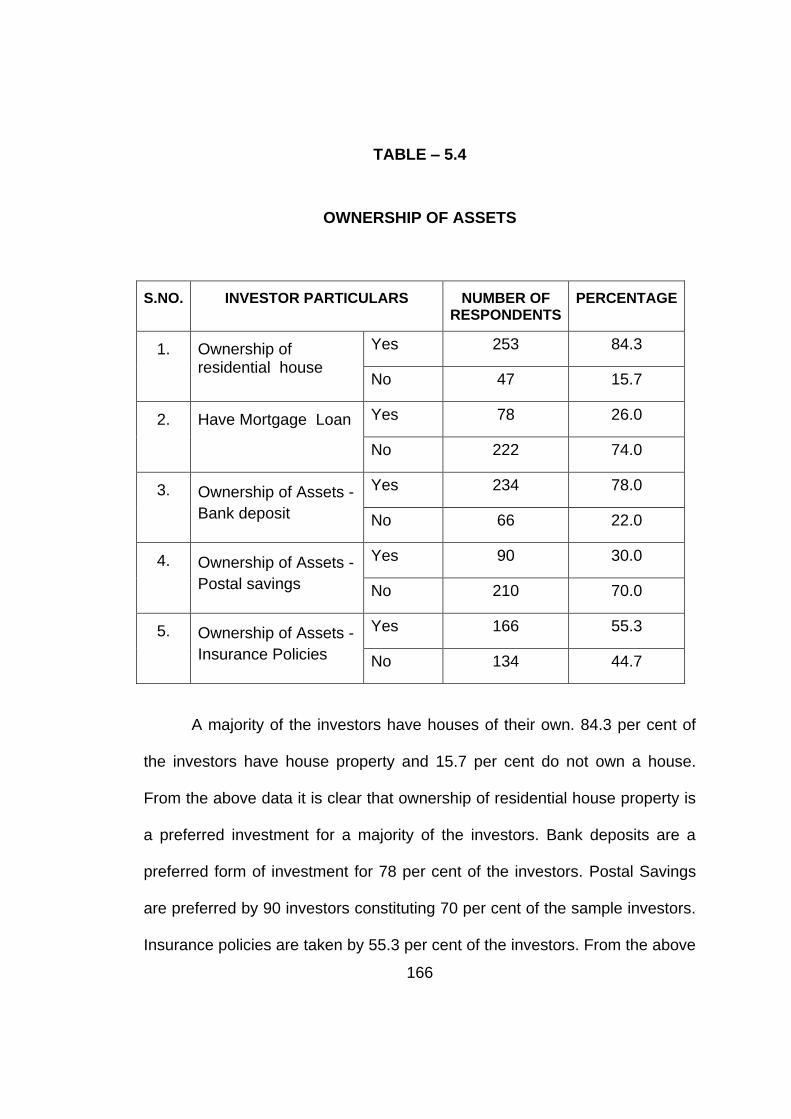
TABLE – 5.4
OWNERSHIP OF ASSETS
S.NO. INVESTOR PARTICULARS NUMBER OF RESPONDENTS
PERCENTAGE
1. Ownership of residential house
Yes 253 84.3
No 47 15.7
2. Have Mortgage Loan Yes 78 26.0
No 222 74.0
3. Ownership of Assets -
Bank deposit
Yes 234 78.0
No 66 22.0
4. Ownership of Assets -
Postal savings
Yes 90 30.0
No 210 70.0
5. Ownership of Assets -
Insurance Policies
Yes 166 55.3
No 134 44.7
A majority of the investors have houses of their own. 84.3 per cent of
the investors have house property and 15.7 per cent do not own a house.
From the above data it is clear that ownership of residential house property is
a preferred investment for a majority of the investors. Bank deposits are a
preferred form of investment for 78 per cent of the investors. Postal Savings
are preferred by 90 investors constituting 70 per cent of the sample investors.
Insurance policies are taken by 55.3 per cent of the investors. From the above

167
it is clear that investment in house property is the most preferred asset of the
sample investors. Savings in Post office is not preferred much as shown by
the above table compared to Bank deposits. 26 percent of the investors have
mortgage loan. The above details relating to the assets owned by individual
investors in capital market prove the theory of Behavioural Portfolio of
Investors suggested by Hersh Shefrin and Meir Statman. According to them
the psychological tendencies of investors prod them to build their portfolios as
a pyramid. It explains the several goals an investor has such as safety,
income, and growth and hence he/she invests in house property, bank
deposits and insurance products along with their investments in capital
market.

168
FIGURE – 5.4
OWNERSHIP OF ASSETS
Yes No
Residential House Mortage Loan Bank Deposits Postal Savings Insurance Policies
PE
RC
EN
TA
GE
169
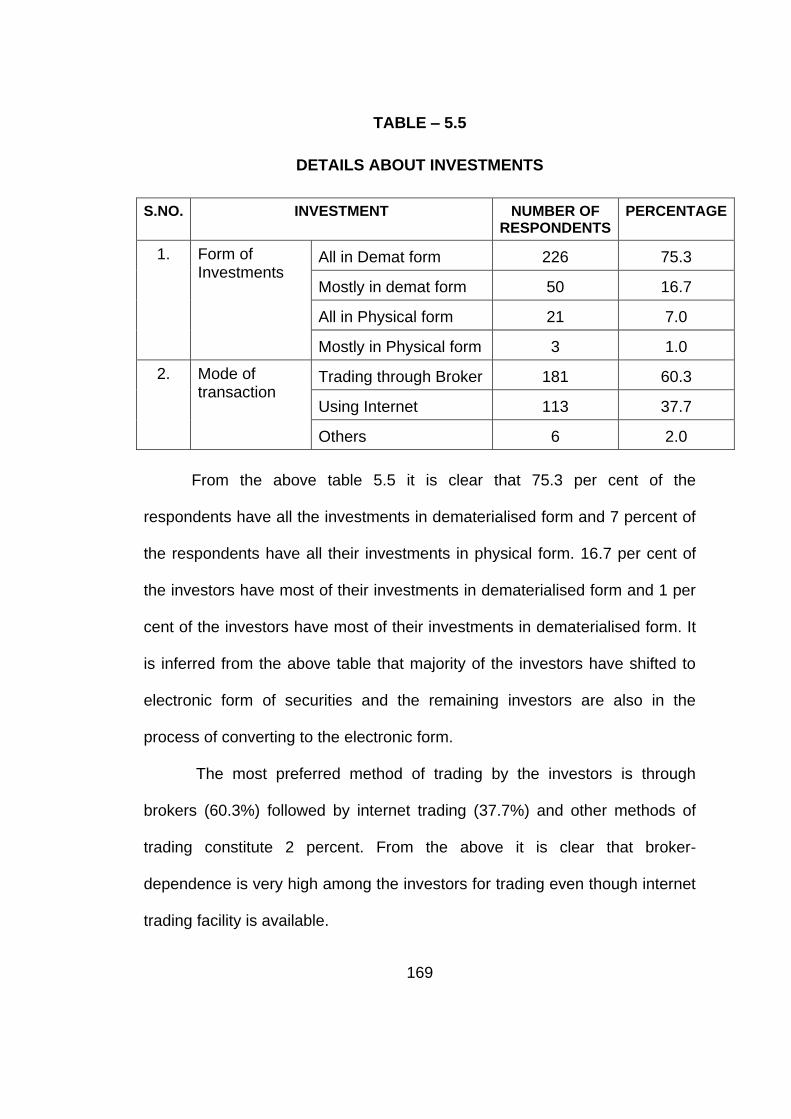
TABLE – 5.5
DETAILS ABOUT INVESTMENTS
S.NO. INVESTMENT NUMBER OF RESPONDENTS
PERCENTAGE
1. Form of Investments
All in Demat form 226 75.3
Mostly in demat form 50 16.7
All in Physical form 21 7.0
Mostly in Physical form 3 1.0
2. Mode of transaction
Trading through Broker 181 60.3
Using Internet 113 37.7
Others 6 2.0
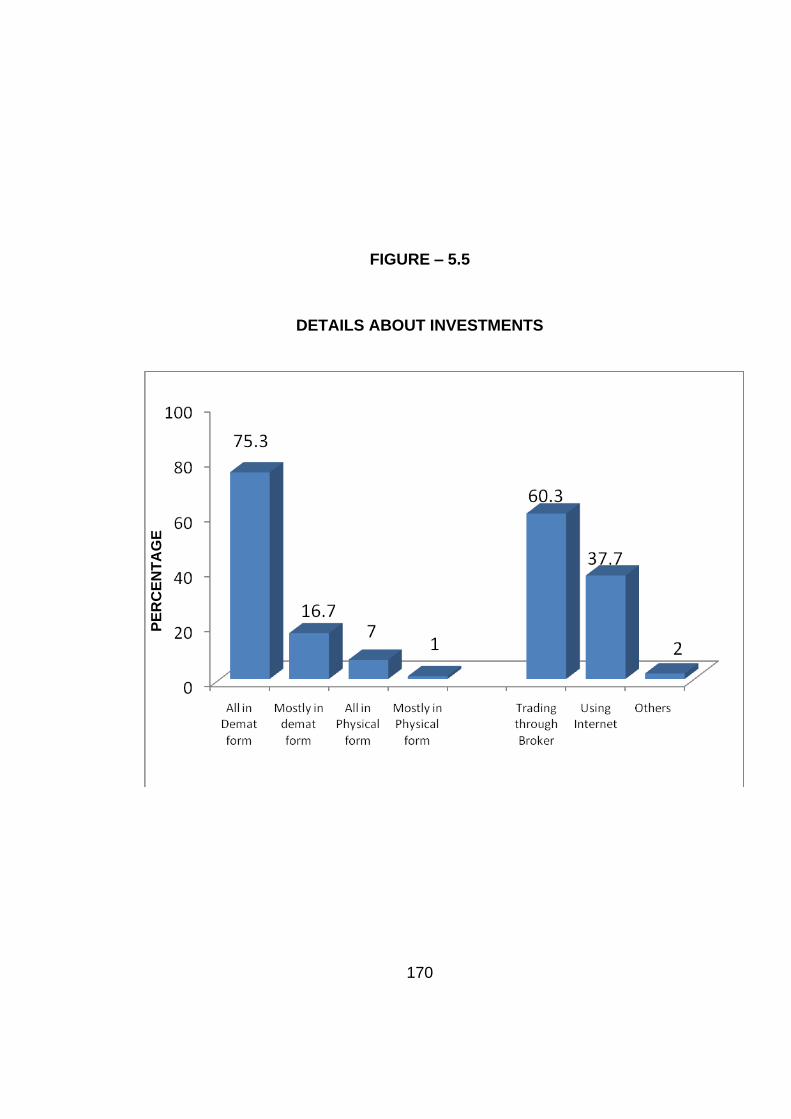
From the above table 5.5 it is clear that 75.3 per cent of the
respondents have all the investments in dematerialised form and 7 percent of
the respondents have all their investments in physical form. 16.7 per cent of
the investors have most of their investments in dematerialised form and 1 per
cent of the investors have most of their investments in dematerialised form. It
is inferred from the above table that majority of the investors have shifted to
electronic form of securities and the remaining investors are also in the
process of converting to the electronic form.
The most preferred method of trading by the investors is through
brokers (60.3%) followed by internet trading (37.7%) and other methods of
trading constitute 2 percent. From the above it is clear that broker-
dependence is very high among the investors for trading even though internet
trading facility is available.
170
FIGURE – 5.5
DETAILS ABOUT INVESTMENTS
PE
RC
EN
TA
GE

171
TABLE – 5.6
TIME SPENT FOR INVESTING ACTIVITIES
S.NO. INVESTOR PARTICULARS NUMBER OF RESPONDENTS
PERCENTAGE
1. Time spend for investing activities
2-5 hours per week 57 19.0
2-5 hours per month 83 27.7
2-5 hours per year 5 1.7
Most of my spare
time
21 7.0
Every day at least
some time
134 44.7
The above table 5.6 shows that 19 per cent of the investors spend 2-5
hours per week for investment activities; 27.7 per cent spend 2-5 hours per
month and 1.7 per cent spend 2-5 hours per year and a majority of the
investors spend some time every day for investment related activities. It is a
positive aspect of the investors since the time spent for knowing the different
types of investments and other details will help increase the financial literacy
of the respondents.

172
FIGURE – 5.6
TIME SPENT FOR INVESTING ACTIVITIES
TIME SPENT IN HOURS
173
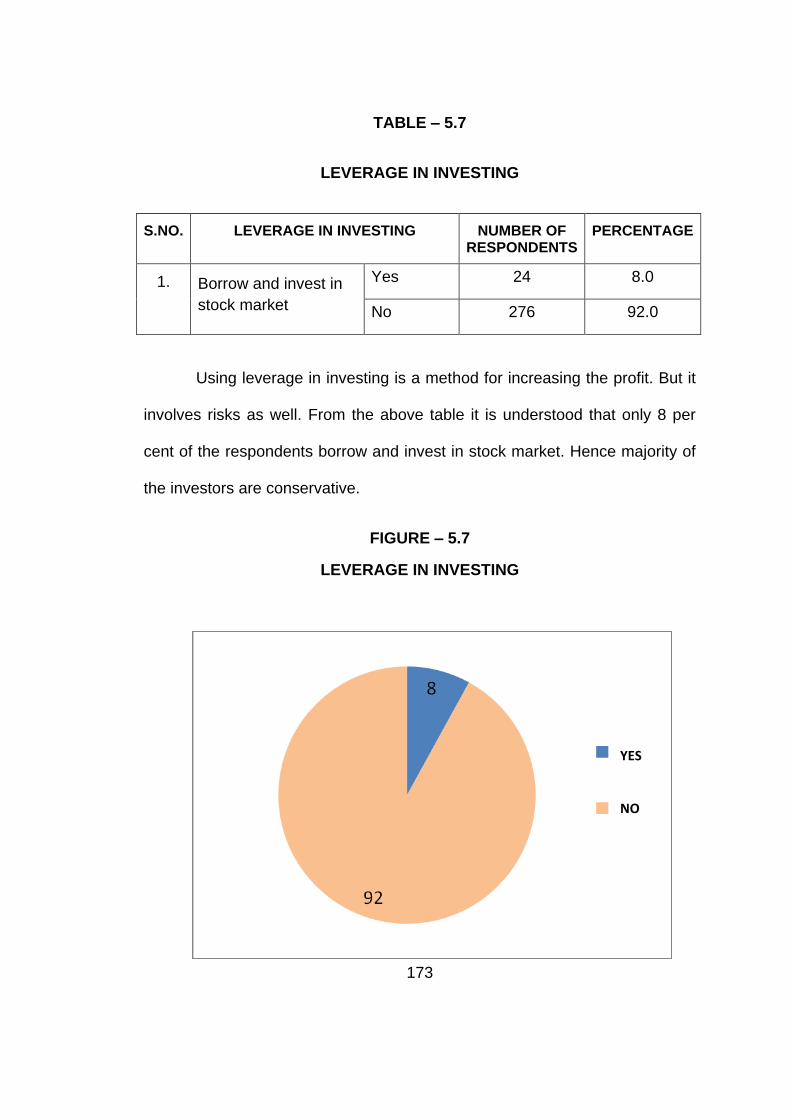
TABLE – 5.7
LEVERAGE IN INVESTING
S.NO. LEVERAGE IN INVESTING NUMBER OF RESPONDENTS
PERCENTAGE
1. Borrow and invest in
stock market
Yes 24 8.0
No 276 92.0
Using leverage in investing is a method for increasing the profit. But it
involves risks as well. From the above table it is understood that only 8 per
cent of the respondents borrow and invest in stock market. Hence majority of
the investors are conservative.
FIGURE – 5.7
LEVERAGE IN INVESTING
YES
NO

174
TABLE – 5.8
SHARES IN DELISTED COMPANIES
S.NO. DELISTED COMPANIES NUMBER OF RESPONDENTS
PERCENTAGE
1. Have Shares in
Delisted companies
Yes 58 19.3
No 242 80.7
The above table 5.8 shows that 19.3 per cent of the investors have
shares in delisted companies. Having shares in delisted companies (delisted
by stock exchanges for default) puts the shareholders in difficulty. From the
above table we understand that the problem of delisted companies still exists
in spite of the regulatory measures.
As per the survey conducted by L.C Gupta in 2004, 37.61 per cent of
the respondents were holding shares in delisted companies. Delisted
companies are a fit subject for further research since the retail investors have
to be protected in the future from the clutches of these companies. There
should be some mechanism by the regulatory authorities to warn the investors
of the impending danger attached to a company likely to be delisted.

175
FIGURE – 5.8
SHARES IN DELISTED COMPANIES
YES NO

176
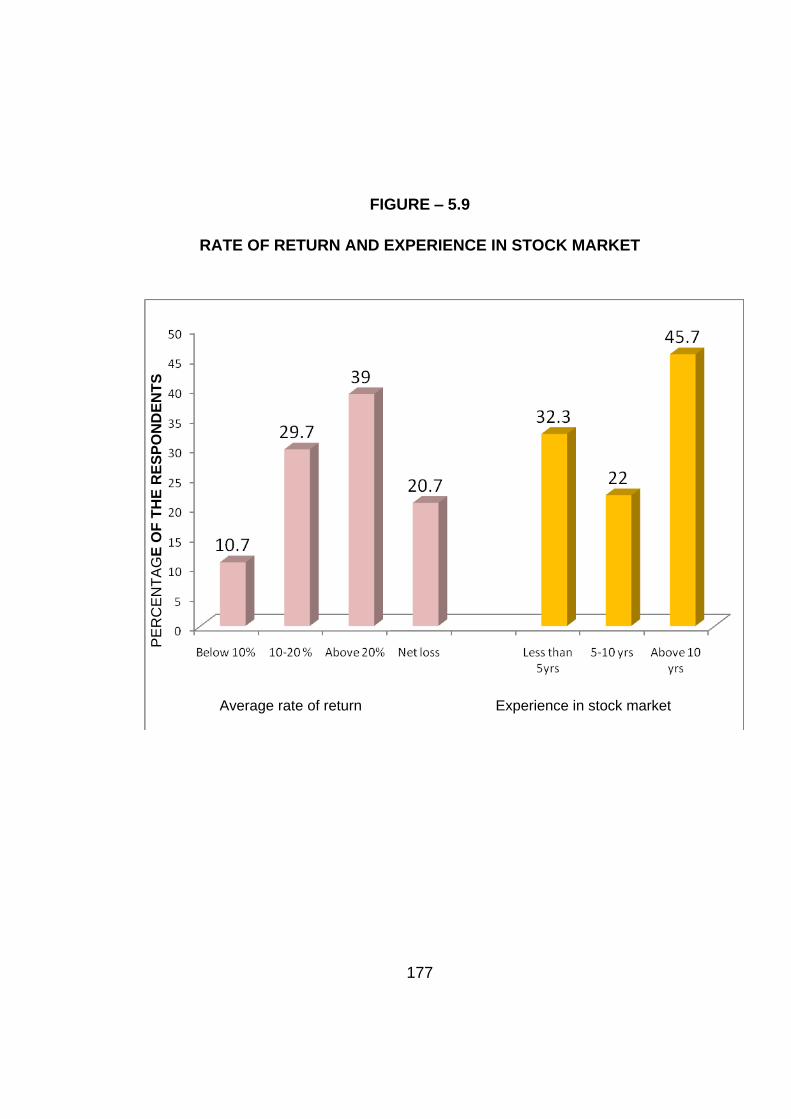
TABLE – 5.9
RATE OF RETURN AND EXPERIENCE IN STOCK MARKET
S.NO. RATE OF RETURN AND EXPERIENCE IN
STOCK MARKET
NUMBER OF RESPONDENTS
PERCENTAGE
1. Average rate of return
(Past 5 years)
Below 10% 32 10.7
10-20 % 89 29.7
Above 20% 117 39.0
Net loss 62 20.7
2. Experience in
stock market
Less than 5yrs 97 32.3
5-10 yrs 66 22.0
Above 10 yrs 137 45.7
The above table 5.9 shows that 39 per cent of the investors earn an
average rate of return of above 20 per cent; 29.7 per cent earns an average
rate of return of 10-20 per cent; 10.7 per cent earn below 10 per cent and 20.7
per cent have incurred losses. As the level of risk is high in equity investing a
layman is not inclined to invest in stock market in India. The incurring of loss
by nearly 20 percent of the investors may be a reason for the low level of
retail participation in Indian Stock market.
177
FIGURE – 5.9
RATE OF RETURN AND EXPERIENCE IN STOCK MARKET
Average rate of return Experience in stock market
PE
RC
EN
TA
GE
OF
TH
E R
ES
PO
ND
EN
TS

178
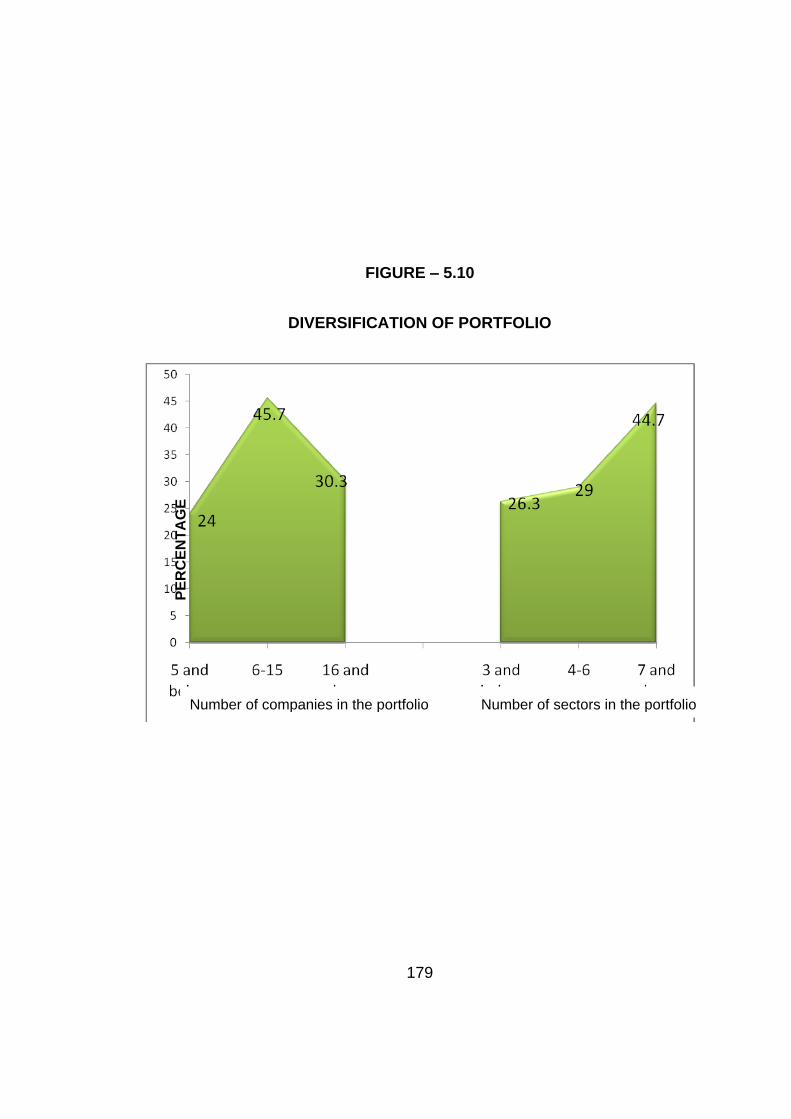
TABLE – 5.10
DIVERSIFICATION OF PORTFOLIO
S.NO. DIVERSIFICATION OF PORTFOLIO NUMBER OF RESPONDENTS
PERCENTAGE
1. Number of companies in the portfolio
5 and below 72 24.0
6-15 137 45.7
16 and above 91 30.3
2. Number of sectors in the portfolio
3 and below 79 26.3
4-6 87 29.0
7 and above 134 44.7
The number of companies in the portfolio represents the diversification
of the portfolio. The above table 5.10 shows that there is a greater degree of
diversification compared to what is suggested by Investment Gurus. Warren
Buffet says that the ideal portfolio should contain no more than 10 good
stocks. But the above table shows that 30.3 per cent of the investors have
stocks in more than 16 companies and 45.7 per cent of the investors have
stocks in 6-15 companies. And 24 per cent have shares in less than 5
companies. When the portfolio involves a large number of stocks it becomes
difficult for the investor to keep track of the prospects.
The diversification in respect of the sector shows that 44.7 per cent of
the investors have shares in 7 or more sectors; 29 per cent have shares in 4-6
sectors and 26.3 per cent has shares in 3 and less than 3 sectors. This also
shows that there is a greater degree of diversification with respect to sectors
as well.
179
FIGURE – 5.10
DIVERSIFICATION OF PORTFOLIO
Number of companies in the portfolio Number of sectors in the portfolio
PE
RC
EN
TA
GE

180
5.4 AN ANALYSIS OF THE PREFERENCES OF THE INVESTORS
BASED ON THE WEIGHTED MEAN VALUES
The preferences of the investors towards investment goals, sources of
investment information, the qualities the investors expect from their Financial
Advisers, types of mutual funds and the Qualities they expect in a scheme are
analysed and ranked based on the responses given by the investors. The
responses for various parameters are given, scored in the Likert’ Rating scale
and the cumulative weights are used for ranking. It is termed as the Weighted
Mean Values.
The following tables are given under this analysis for the purpose of ranking.
Table – 5.11 Ranking of the Objectives of Savings
Table – 5-12 Ranking of the Sources of Investment Information
Table – 5-13 Ranking of the Preference for Shares
Table – 5.14 Ranking of the Basis for Buying Shares
Table – 5.15 Ranking of the Qualities of Financial Advisers
Table – 5.16 Ranking of the Preference for Mutual Funds
Table – 5.17 Ranking of the Qualities Expected of a Mutual Fund Scheme

181
i) OBJECTIVES OF SAVINGS
India is one of the countries with a growing rate in gross domestic
savings. Indians unlike their western counterparts save for many reasons.
Irrespective of the age and economic status saving is an integral part of their
financial planning. But the objectives of their savings vary from individual to
individual. An understanding of the goals of savings is helpful both for an
investor as well as for the institutions which offer various financial products for
the investors.
TABLE – 5.11
RANKING OF THE OBJECTIVES OF SAVINGS
Objectives of Savings WMV RANK
I save for my children’s education. 3.8 I
I save for my daughter’s marriage. 3.7 II
I save to provide for my retirement. 3.7 II
I save to purchase a house. 3.3 IV
I save for tax benefits. 3.3 IV
I save for contingencies. 2 VI

182
The objectives of savings are ranked in the above table using weighted
mean values of the responses given by the investors in the questionnaire.
Saving for children’s education takes the lead with the W.M.V. of 3.8. This is
in conformity with the study conducted by NCAER and Aviva Life (2010)
which says that 48 per cent of the people save for their children’s education.
This is followed by the other two objectives namely daughter’s marriage and
providing for retirement scoring the W.M.V of 3.7 each as the second rank;
Saving for tax benefits and purchasing a house are ranked as the IV objective
and saving for contingencies is the last objective Hence it is proved that
children’s education is the prime motive behind saving.
ii) SOURCES OF INVESTMENT INFORMATION
There are many sources of investment information. The sources which
are mainly used or preferred by the investors should be identified to
communicate with the investors very effectively. Individual investors are
widely scattered and a knowledge of the best media through which investors
can be contacted would offer many advantages to the financial intermediaries
and regulatory authorities. Financial Literacy programmes can be effectively
conducted by identifying the sources of information which are mostly preferred
by the investors.

183
TABLE – 5.12
RANKING OF THE SOURCES OF INVESTMENT INFORMATION
Sources WMV RANK
Professional Advisers 4.4 I
Business News Channels like CNBC,NDTV Profit 3.7 II
Family and Friends 3.5 III
Magazine or Newspapers 3.4 IV
Investment websites 3 V
Books 2.1 VI
Among the different sources of investment information Professional
Advisers are ranked first scoring a W.M.V value of 4.4. Business News
Channels like CNBC, NDTV Profit are getting the Second place. The family
and Friends of the Investors occupy the third place followed by the others.
From the above it is clear that most of the investors are dependent on the
Professional Advisers. The Consultation Paper released by the Committee on
Investor Awareness and Protection, chaired by D.Swarup, Chairman of the
Pension Fund Regulatory and Development Authority (PFRDA) begins with
the need for regulation of the market for financial products in India and to
educate the consumer. The committee has pointed out that most of the
dissemination of information relating to financial products takes place through
the distributors or intermediaries. Hence a financial adviser does two tasks
namely disseminating the information and also undertaking financial planning.
184
These financial advisers are very often unable to do both the tasks efficiently.
Hence there is an urgent need to regulate the functioning of the Professional
advisers in order to safeguard the interests of small investors.
iii) PREFERENCE FOR VARIOUS TYPES OF SHARES
The shares in the stock market are of different kinds. One way of
classifying them is growth shares and blue chip shares. Growth shares are
shares of companies which are relatively new with very good prospects for
growth. Whereas blue chip shares are shares of established companies.
Apart from this some investors have the habit of investing in companies which
are familiar to them for example a company which is situated in the nearby
locality or a company which is known to them through their family friends, etc.
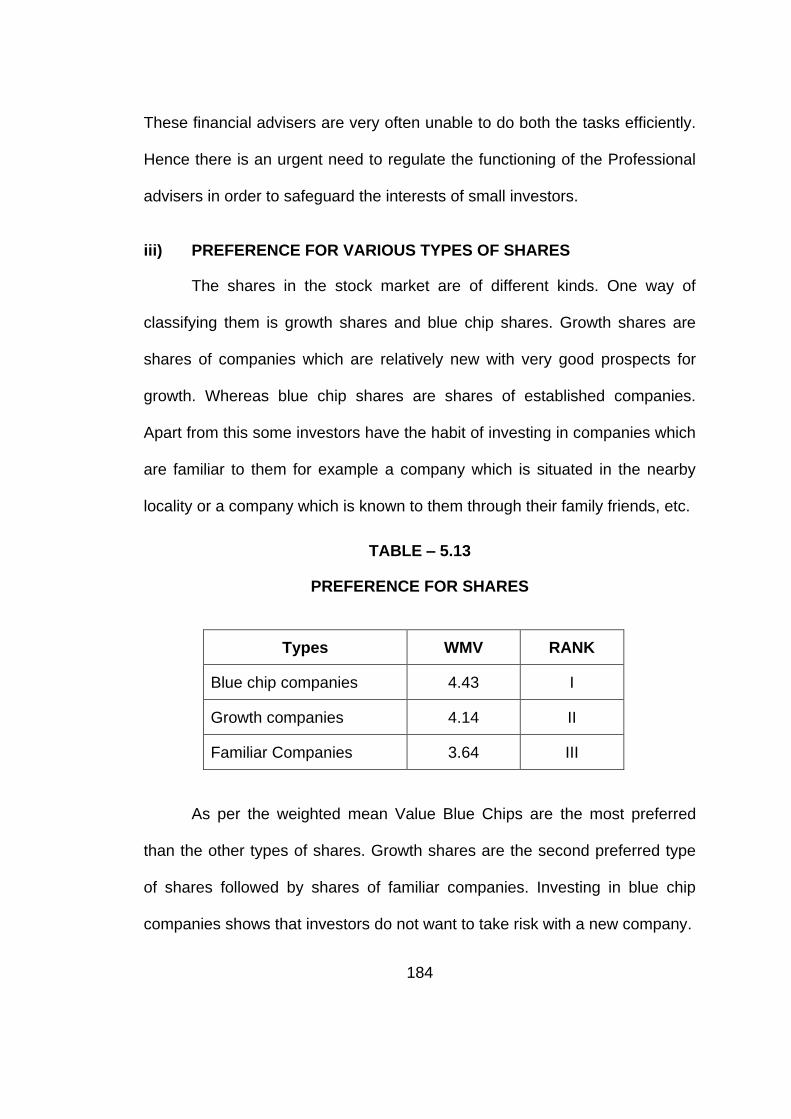
TABLE – 5.13
PREFERENCE FOR SHARES
Types WMV RANK
Blue chip companies 4.43 I
Growth companies 4.14 II
Familiar Companies 3.64 III
As per the weighted mean Value Blue Chips are the most preferred
than the other types of shares. Growth shares are the second preferred type
of shares followed by shares of familiar companies. Investing in blue chip
companies shows that investors do not want to take risk with a new company.
185
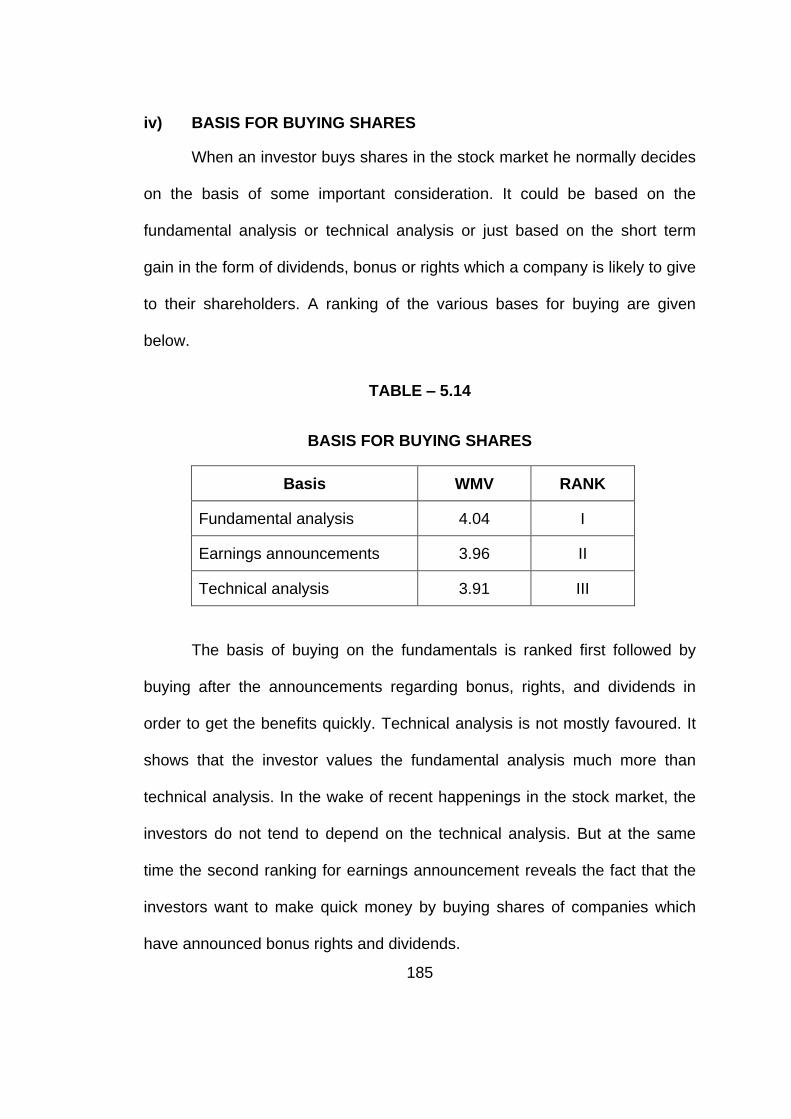
iv) BASIS FOR BUYING SHARES
When an investor buys shares in the stock market he normally decides
on the basis of some important consideration. It could be based on the
fundamental analysis or technical analysis or just based on the short term
gain in the form of dividends, bonus or rights which a company is likely to give
to their shareholders. A ranking of the various bases for buying are given
below.
TABLE – 5.14
BASIS FOR BUYING SHARES
Basis WMV RANK
Fundamental analysis 4.04 I
Earnings announcements 3.96 II
Technical analysis 3.91 III
The basis of buying on the fundamentals is ranked first followed by
buying after the announcements regarding bonus, rights, and dividends in
order to get the benefits quickly. Technical analysis is not mostly favoured. It
shows that the investor values the fundamental analysis much more than
technical analysis. In the wake of recent happenings in the stock market, the
investors do not tend to depend on the technical analysis. But at the same
time the second ranking for earnings announcement reveals the fact that the
investors want to make quick money by buying shares of companies which
have announced bonus rights and dividends.
186
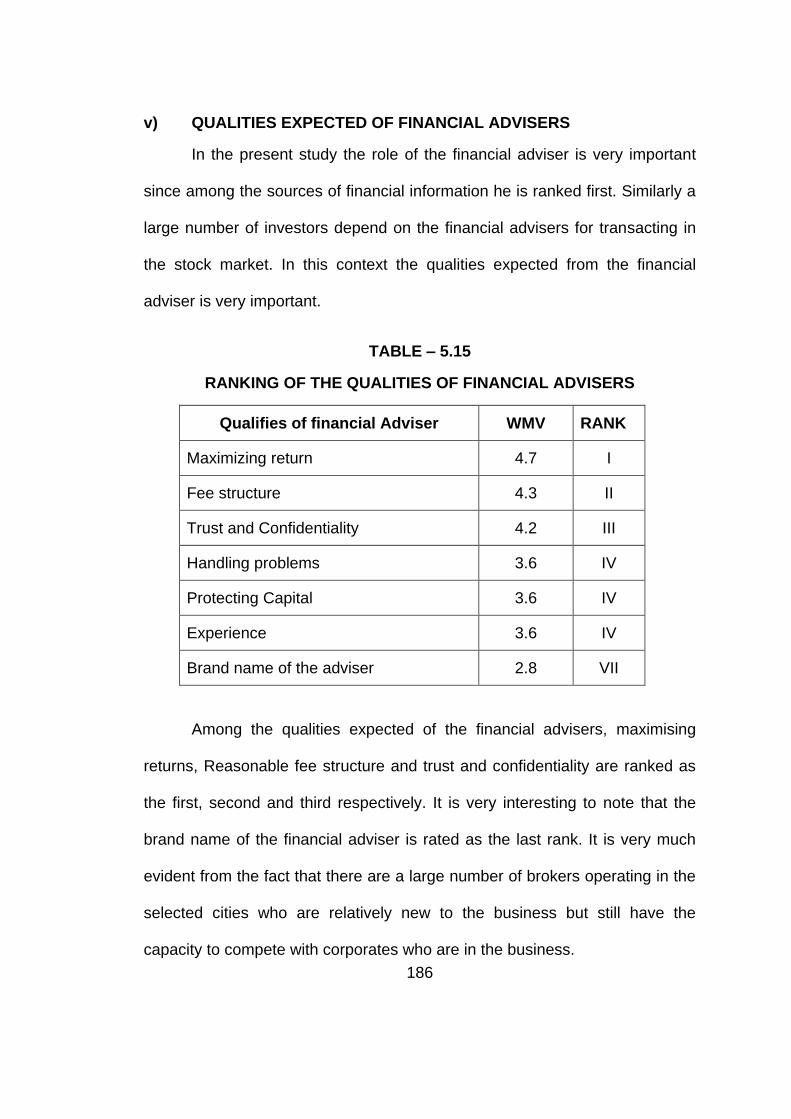
v) QUALITIES EXPECTED OF FINANCIAL ADVISERS
In the present study the role of the financial adviser is very important
since among the sources of financial information he is ranked first. Similarly a
large number of investors depend on the financial advisers for transacting in
the stock market. In this context the qualities expected from the financial
adviser is very important.
TABLE – 5.15
RANKING OF THE QUALITIES OF FINANCIAL ADVISERS
Qualifies of financial Adviser WMV RANK
Maximizing return 4.7 I
Fee structure 4.3 II
Trust and Confidentiality 4.2 III
Handling problems 3.6 IV
Protecting Capital 3.6 IV
Experience 3.6 IV
Brand name of the adviser 2.8 VII
Among the qualities expected of the financial advisers, maximising
returns, Reasonable fee structure and trust and confidentiality are ranked as
the first, second and third respectively. It is very interesting to note that the
brand name of the financial adviser is rated as the last rank. It is very much
evident from the fact that there are a large number of brokers operating in the
selected cities who are relatively new to the business but still have the
capacity to compete with corporates who are in the business.
187
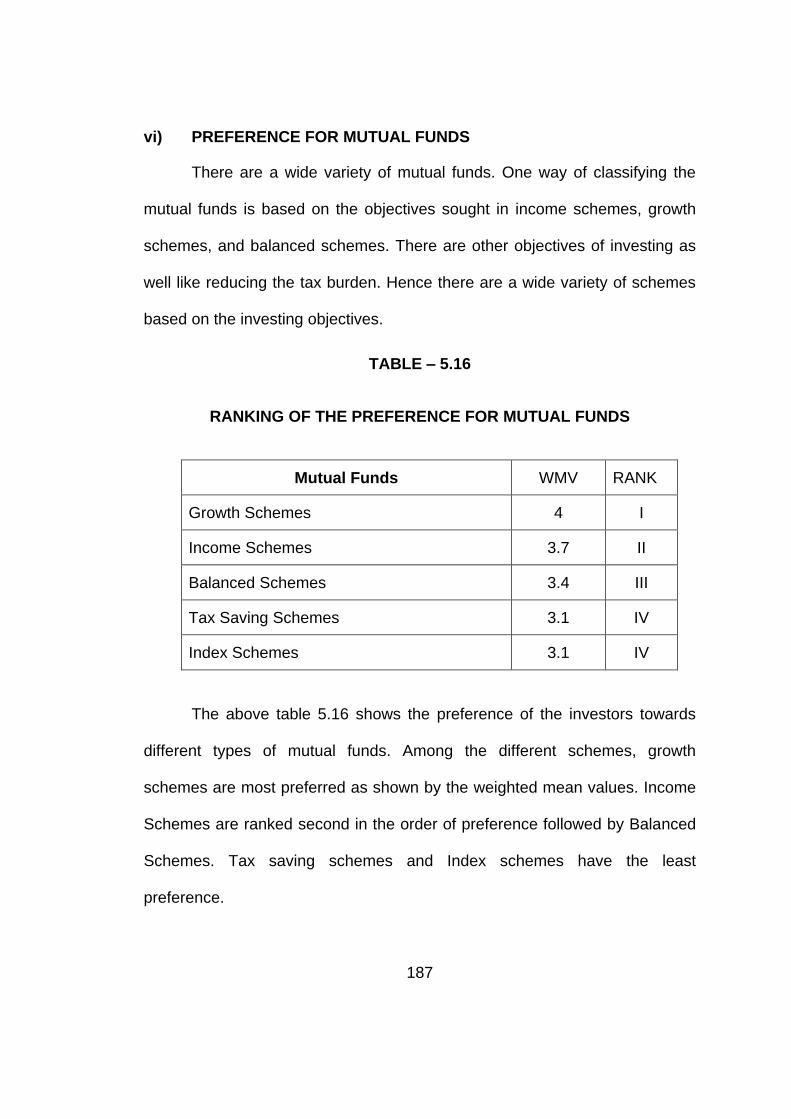
vi) PREFERENCE FOR MUTUAL FUNDS
There are a wide variety of mutual funds. One way of classifying the
mutual funds is based on the objectives sought in income schemes, growth
schemes, and balanced schemes. There are other objectives of investing as
well like reducing the tax burden. Hence there are a wide variety of schemes
based on the investing objectives.
TABLE – 5.16
RANKING OF THE PREFERENCE FOR MUTUAL FUNDS
Mutual Funds WMV RANK
Growth Schemes 4 I
Income Schemes 3.7 II
Balanced Schemes 3.4 III
Tax Saving Schemes 3.1 IV
Index Schemes 3.1 IV
The above table 5.16 shows the preference of the investors towards
different types of mutual funds. Among the different schemes, growth
schemes are most preferred as shown by the weighted mean values. Income
Schemes are ranked second in the order of preference followed by Balanced
Schemes. Tax saving schemes and Index schemes have the least
preference.
188
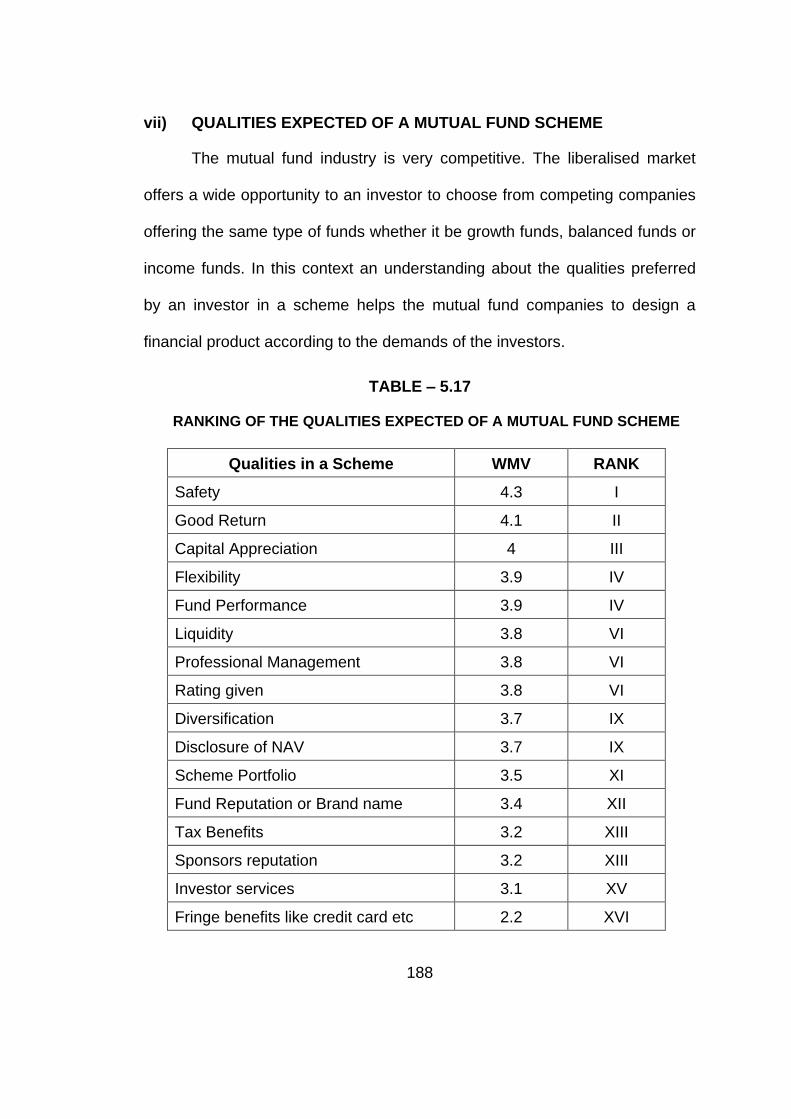
vii) QUALITIES EXPECTED OF A MUTUAL FUND SCHEME
The mutual fund industry is very competitive. The liberalised market
offers a wide opportunity to an investor to choose from competing companies
offering the same type of funds whether it be growth funds, balanced funds or
income funds. In this context an understanding about the qualities preferred
by an investor in a scheme helps the mutual fund companies to design a
financial product according to the demands of the investors.
TABLE – 5.17
RANKING OF THE QUALITIES EXPECTED OF A MUTUAL FUND SCHEME
Qualities in a Scheme WMV RANK
Safety 4.3 I
Good Return 4.1 II
Capital Appreciation 4 III
Flexibility 3.9 IV
Fund Performance 3.9 IV
Liquidity 3.8 VI
Professional Management 3.8 VI
Rating given 3.8 VI
Diversification 3.7 IX
Disclosure of NAV 3.7 IX
Scheme Portfolio 3.5 XI
Fund Reputation or Brand name 3.4 XII
Tax Benefits 3.2 XIII
Sponsors reputation 3.2 XIII
Investor services 3.1 XV
Fringe benefits like credit card etc 2.2 XVI

189
The above table 5.17 shows the rankings of the various mutual fund
schemes. Among the qualities Safety is ranked as the first quality expected
followed by good returns and capital appreciations. The other rankings are
shown above. It is very interesting to note that fringe benefits like credit card
do not influence the investor for purchasing the mutual fund units. It shows the
awareness level of the investors. Similarly sponsors reputation is ranked XIII
which signifies that investors are more concerned about the returns and
whoever gives the best returns will be preferred by the investors irrespective
of whether it is sponsored by a well known company or not.
5.5 AN ANALYSIS OF DIFFERENT BEHAVIOUR IN INVESTING
The investment behaviour and preferences of the investors are
analysed using the responses given by the investors in the five point Likert’s
Rating Scale. The respondents’ views are assigned weights and the
cumulative scores are considered for the purpose of analysis. The specific
traits that are analysed and rated are given below. Questions which test the
same traits or behaviour are grouped together and cumulative scores of the
responses are used for assessing the different kinds of behaviour. Based on
the scores, respondents are divided into different levels as high, medium and
low. The different kinds of behaviour studied under this analysis are as follows
1. Herding
Herding is a psychological behaviour of following the crowd which is
observed in the stock market. When the investors buy or sell in the

190
stock market based on what others are doing and not relying on their
own information or analysis the herding tendency is said to exist. This
tendency arises due to the human psychology which wants to belong to
a group. The investors who exhibit this tendency may buy the shares
when there is a surge in the market and sell the shares when there is a
decline in the market.
2. Preference for short term gains
Investors may have short term or long term goals in the stock market.
The preferences for short term gain is assessed by the researcher
based on the responses given by the respondents. The criteria
selected for short term preferences include the frequency of trading,
selling IPO soon after allotment among other related behaviour
included in Part III of the questionnaire.
3. Risk Tolerance
Risk Tolerance refers to the extent of risk taken by the investors.
Literature review shows that there are many methods to evaluate the
risk. One such method is adopted by Dow Jones. A variety of factors
are considered for evaluating the risk tolerance of the individual
investors such as preference for long term or short term, frequent
trading, types of shares preferred, basis of buying or selling shares and
relative weights of the different types of assets in the portfolio among
other things.

191
4. Perception about Capital Market in India
Investors’ perception about the capital market is very important for
analysing the behaviour of investors. A favourable opinion about the
capital market will boost the investor confidence and it will be helpful in
the capital market growth. Hence perception about the capital market in
India is analysed using important yardsticks such as faith in the capital
market regulation, investor protection and attitudes towards different
capital market instruments.
5. Perception about Corporate Governance
Corporate governance means the way by which corporate are
managed and controlled by company managements. In the wake of
many scams such as the Satyam debacle, the faith of the investors in
Corporate Governance may be tested. The perception of the investors
about corporate Governance is evaluated by the responses they have
given on the Likert’s Rating Scale related to Corporate Governance.
6. Investor Awareness or Financial Literacy
Financial literacy is the process by which investors improve their
understanding of financial markets, products, concepts and risks. A
widely accepted definition of financial literacy is one formulated by the
U.K. National Foundation for Education Research which describes
financial literacy as “the ability to make informed judgments and take
effective decisions regarding the use and management of money. An
evaluation of the financial literacy of respondents is very basic for a

192
proper understanding of the behaviour of investors. Financial literacy is
evaluated by 12 statements related to the fundamentals in the financial
market and the responses given by the investors in three alternatives
“yes”, “not sure” and “no” are considered with relative weights
assigned to each alternative.
7. Preference for IPOs
Individual investor’s preference for IPOs as an investment option is
analysed. IPOs are very important for the development of the economy
as a whole and the capital market in particular. In the wake of
liberalisation and privatisation. IPOs are gaining a strategic role in
mobilisation of resources through disinvestments. Moreover the new
policy of the ministry of company affairs to increase the public holding
of shares in listed companies to 25 per cent within a time frame of 5
years has made IPOs a must for many body corporates. In this context,
the opinion of the individual investors towards IPOs is an important
factor for the development of the capital market.
8. Preference for Small Lots of Shares
Many individual investors can not afford to invest in huge amounts at a
time. Hence there is a habit among the small investors to buy the blue
chip companies shares in small numbers and accumulate them. This
habit has the advantage of minimising the risk at the same time
building the portfolio in a gradual way. This is analysed in this study.

193
9. Tendency for Profit booking
The preference of the investor for profit booking is analysed here.
Many investors have the habit of buying shares with an aim of selling it
after reaching the target. This is a trend found among many investors
who have a short term perspective in investing. The desire to realise
the profit makes the investors sell the winning stocks often while
holding the losing stocks.
10. Preference for Mutual Funds to Shares
A comparison between the preference for mutual fund and shares is
analysed here. A conservative investor may prefer a mutual fund to
shares.
Following tables are given for the analysis.
Table – 5.18 Herd Behaviour
Table – 5.19 Preference for Short Term Gains
Table – 5.20 Risk Tolerance
Table – 5.21 Perception about Indian Capital Market
Table – 5.22 Perception about Corporate Governance
Table – 5.23 Investor Awareness
Table – 5.24 Preference for IPOS
Table – 5.25 Preference for Small Lots
Table – 5.26 Tendency for Profit Booking
Table – 5.27 Preference for Mutual Fund to Shares
194
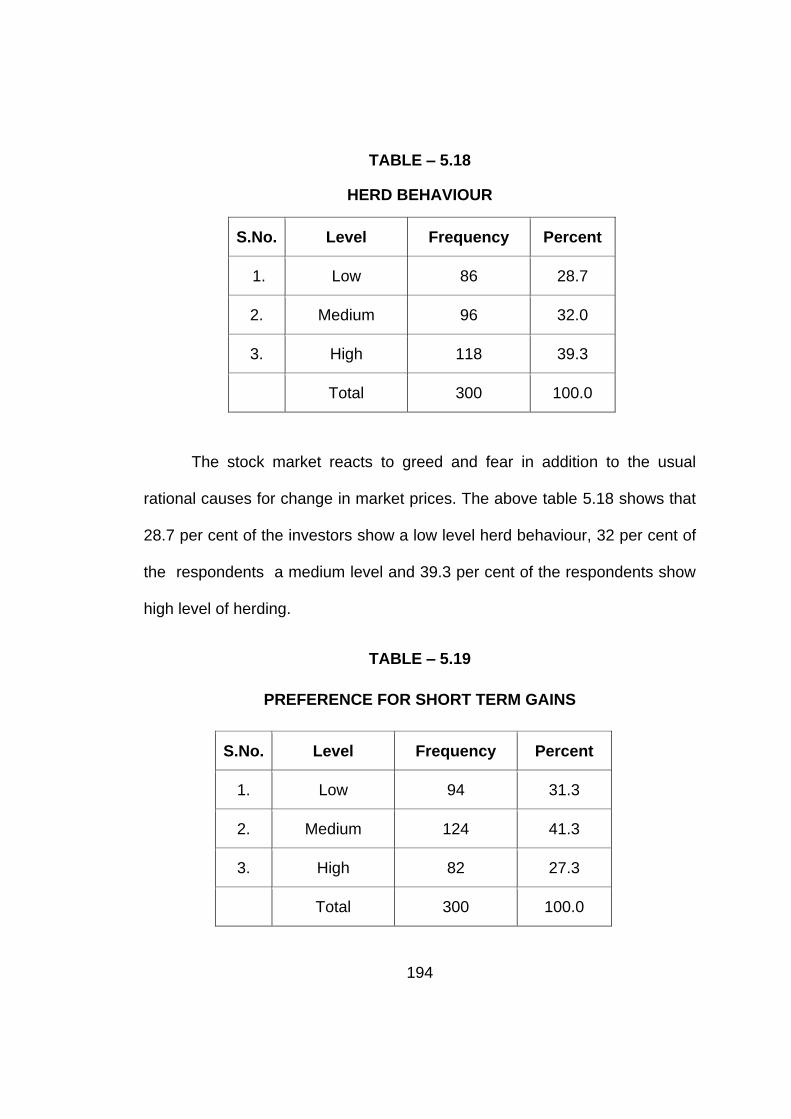
TABLE – 5.18
HERD BEHAVIOUR
S.No. Level Frequency Percent
1. Low 86 28.7
2. Medium 96 32.0
3. High 118 39.3
Total 300 100.0
The stock market reacts to greed and fear in addition to the usual
rational causes for change in market prices. The above table 5.18 shows that
28.7 per cent of the investors show a low level herd behaviour, 32 per cent of
the respondents a medium level and 39.3 per cent of the respondents show
high level of herding.
TABLE – 5.19
PREFERENCE FOR SHORT TERM GAINS
S.No. Level Frequency Percent
1. Low 94 31.3
2. Medium 124 41.3
3. High 82 27.3
Total 300 100.0

195
The respondents are divided over their preference for short term gains.
27.3% of the respondents show a high level for preference towards short term
investments and the rest show medium and low level of preference towards
short term gains. Buy and not hold for long is the new investor philosophy.
The average holding period of Nifty Shares by investors had fallen to 11
months in the year 2009 from 16 months in 2006 says a report by a financial
services company (livemint.com/articles 3/3/2010). This tendency is helped by
the reduction in the transaction cost from 2.5%-3% before the introduction of
online trading to 25% to 75%. Moreover the volatility in the market makes the
investors go for churning of shareholdings. Another probable reason for the
preference of short term gain is due to the broker dependent trading. In a
volatile market the brokers may encourage the investors to frequently buy and
sell so as to earn profits as also brokerage for them.
TABLE – 5.20
RISK TOLERANCE
S.No. Level Frequency Percent
1. Low 92 30.7
2. Medium 111 37.0
3. High 97 32.3
Total 300 100.0
The above table 5.20 shows that 30.7 percent of the respondents show
a low level for risk tolerance and 32.3 percent of the respondents show a high
degree of risk tolerance.
196
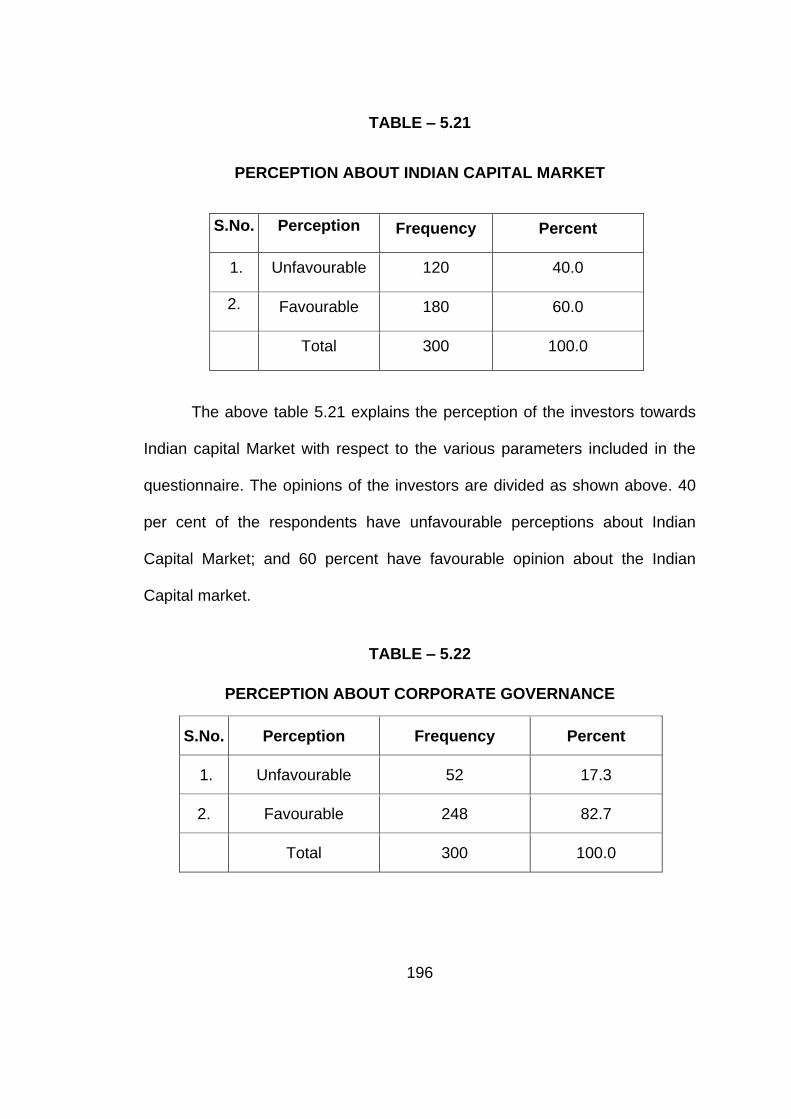
TABLE – 5.21
PERCEPTION ABOUT INDIAN CAPITAL MARKET
S.No. Perception Frequency Percent
1. Unfavourable 120 40.0
2. Favourable 180 60.0
Total 300 100.0
The above table 5.21 explains the perception of the investors towards
Indian capital Market with respect to the various parameters included in the
questionnaire. The opinions of the investors are divided as shown above. 40
per cent of the respondents have unfavourable perceptions about Indian
Capital Market; and 60 percent have favourable opinion about the Indian
Capital market.
TABLE – 5.22
PERCEPTION ABOUT CORPORATE GOVERNANCE
S.No. Perception Frequency Percent
1. Unfavourable 52 17.3
2. Favourable 248 82.7
Total 300 100.0

197
The above table 5.22 shows that 17.3 per cent of the investors have
unfavourable perception about corporate governance and a majority of the
investors (82.7) show favourable perception about corporate governance.
Opinion of the investors about corporate Governance is an important factor in
investment decisions in the capital market.
TABLE – 5-23
INVESTOR AWARENESS
S.No. Levels Frequency Percent
1. Low 52 17.4
2. Medium 124 41.3
3. High 124 41.3
Total 300 100.0
The above table 5.23 shows that 17.4 percent of the respondents are
classified as investors with low financial literacy levels. This is in conformity
with many earlier studies and the Government is bringing many measures to
improve the financial literacy levels. The SEBI has started many programmes
even at the school level to impart financial literacy to the students (Annual
Report SEBI, 2008-2009)

198
TABLE – 5.24
PREFERENCE FOR IPOS
S.No. Levels Frequency Percent
1. Low 87 29.0
2. Medium 85 28.3
3. High 128 42.7
Total 300 100.0
Table 5.24 shows the preference of the investors towards IPOs. Out of
300 respondents 128 respondents (42.7%) have a high level of preference for
IPOs, 29 % have low level of preference and 28.3 per cent have a medium
level of preference. Pricing of IPOs in the recent past is a matter of concern.
Many initial offers are listed below the issue price in the recent years. Hence
there is not a high level of preference for IPOs.

199
TABLE – 5.25
PREFERENCE FOR SMALL LOTS
S.No. Levels Frequency Percent
1. Low 103 34.3
2. Medium 34 11.3
3. High 163 54.4
Total 300 100.0
Table 5.25 shows that 54.4 per cent of the investors have the habit of
buying the shares in small lots since they do not want to take a big risk by
buying shares in large amounts. This is a better strategy than going in for
small value shares which have a high degree of risk.
TABLE – 5.26
TENDENCY FOR PROFIT BOOKING
S.No. Levels Frequency Percent
1. Low 17 5.7
2. Medium 87 29.0
3. High 196 65.3
Total 300 100.0
The tendency to book profit after the target is reached is shown by a
majority of the investors. This shows that a majority of the investors have a
short term goal in investing in stock market.

200
TABLE – 5.27
PREFERENCE FOR MUTUAL FUND TO SHARES
S.No. Levels Frequency Percent
1. Low 105 35.0
2. Medium 121 40.3
3. High 74 24.7
Total 300 100.0
Table 5.27 shows that 35 per cent shows low level of preference for
mutual funds to shares. And 24.7 per cent have a high level of preference for
mutual funds when compared with shares and 40.3 per cent are rather
undecided. This also shows the conservative approach of the investors.
5.6 DIFFERENTIAL ANALYSIS
In this part of the analysis the relationship between the demographic
factors and various investment behaviours are examined. Suitable
hypotheses are set and tested with the help of the appropriate statistical tools
and the variables are analysed.
201
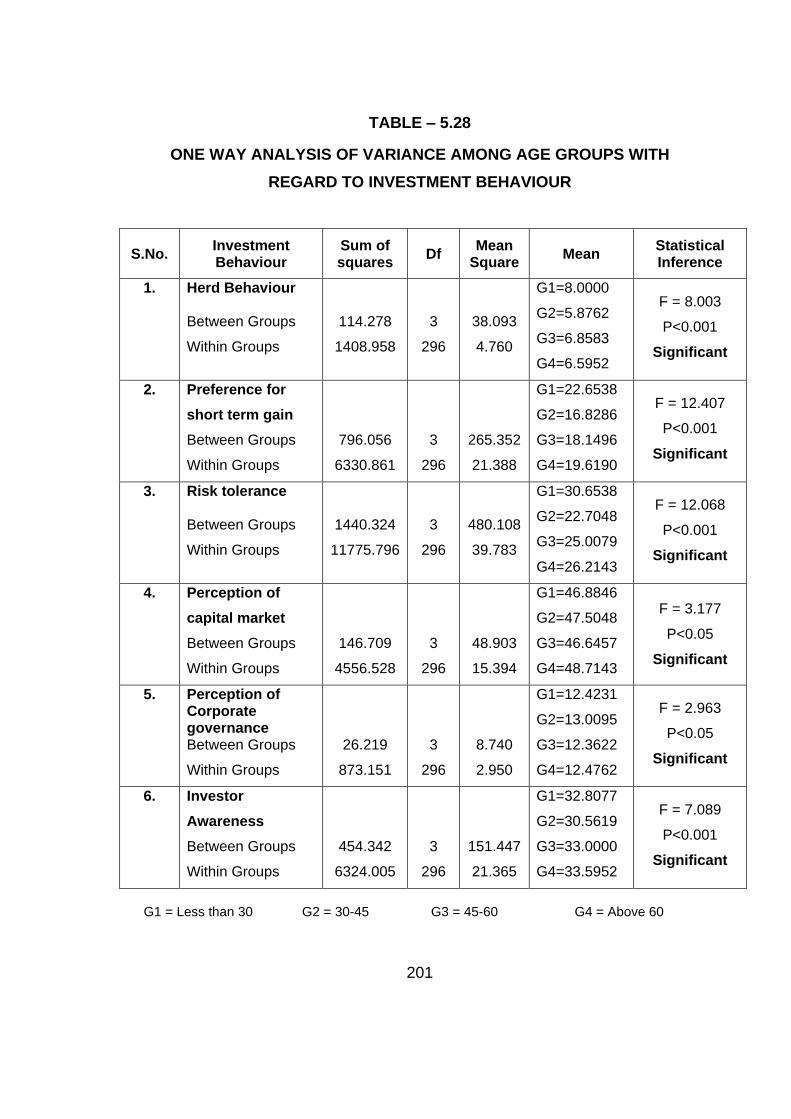
TABLE – 5.28
ONE WAY ANALYSIS OF VARIANCE AMONG AGE GROUPS WITH
REGARD TO INVESTMENT BEHAVIOUR
S.No. Investment Behaviour
Sum of squares
Df Mean
Square Mean
Statistical Inference
1. Herd Behaviour
Between Groups
Within Groups
114.278
1408.958
3
296
38.093
4.760
G1=8.0000
G2=5.8762
G3=6.8583
G4=6.5952
F = 8.003
P<0.001
Significant
2. Preference for
short term gain
Between Groups
Within Groups
796.056
6330.861
3
296
265.352
21.388
G1=22.6538
G2=16.8286
G3=18.1496
G4=19.6190
F = 12.407
P<0.001
Significant
3. Risk tolerance
Between Groups
Within Groups
1440.324
11775.796
3
296
480.108
39.783
G1=30.6538
G2=22.7048
G3=25.0079
G4=26.2143
F = 12.068
P<0.001
Significant
4. Perception of
capital market
Between Groups
Within Groups
146.709
4556.528
3
296
48.903
15.394
G1=46.8846
G2=47.5048
G3=46.6457
G4=48.7143
F = 3.177
P<0.05
Significant
5. Perception of Corporate governance Between Groups
Within Groups
26.219
873.151
3
296
8.740
2.950
G1=12.4231
G2=13.0095
G3=12.3622
G4=12.4762
F = 2.963
P<0.05
Significant
6. Investor
Awareness
Between Groups
Within Groups
454.342
6324.005
3
296
151.447
21.365
G1=32.8077
G2=30.5619
G3=33.0000
G4=33.5952
F = 7.089
P<0.001
Significant
G1 = Less than 30 G2 = 30-45 G3 = 45-60 G4 = Above 60

202
From Table 5.28, the following results are inferred
i) The herd behaviour varies significantly between different age groups
as shown by the mean values in the above table. The mean score for
the respondents with High school qualification is much higher than
other mean scores calculated for other groups. This signifies that herd
behaviour is the highest among the respondents in the first group
namely those with High school qualification.
ii) Preference for short term gain varies significantly between different
groups of investors based on their age groups. This is evident from the
mean scores given in the table for the variable namely preference for
short term gain.
iii) The risk tolerance of investors varies significantly among the groups of
respondents belonging to different age groups. The mean scores
calculated for the variable shows there is a difference among the group
with respect to risk tolerance.
iv) The perception towards capital market varies significantly among
investors belonging to different age groups. The mean scores for
perception towards capital market given in the above table signify a
significant difference among the groups.
v) The perception of the respondents about corporate governance varies
significantly among the different groups of respondents as indicated by
the mean scores.
203
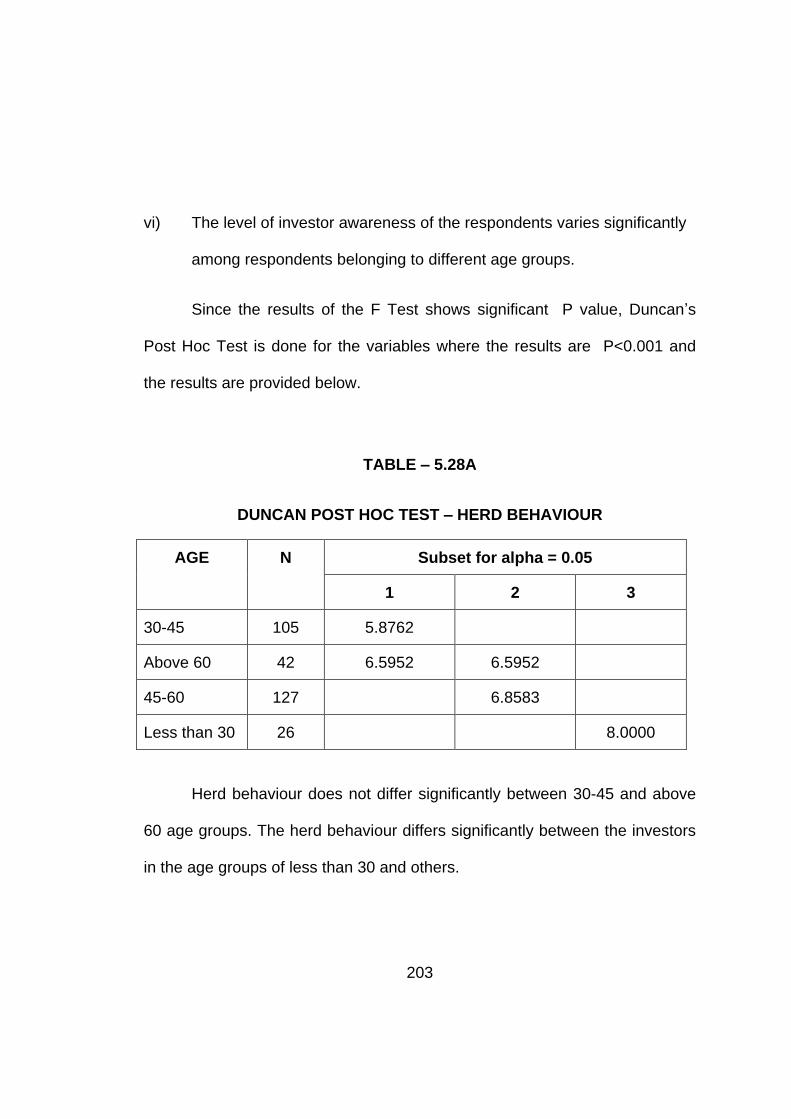
vi) The level of investor awareness of the respondents varies significantly
among respondents belonging to different age groups.
Since the results of the F Test shows significant P value, Duncan’s
Post Hoc Test is done for the variables where the results are P<0.001 and
the results are provided below.
TABLE – 5.28A
DUNCAN POST HOC TEST – HERD BEHAVIOUR
AGE N Subset for alpha = 0.05
1 2 3
30-45 105 5.8762
Above 60 42 6.5952 6.5952
45-60 127 6.8583
Less than 30 26 8.0000
Herd behaviour does not differ significantly between 30-45 and above
60 age groups. The herd behaviour differs significantly between the investors
in the age groups of less than 30 and others.

204
TABLE – 5.28B
DUNCAN POST HOC TEST – PREFERENCE FOR SHORT TERM GAIN
AGE N Subset for alpha = 0.05
1 2 3
30-45 105 16.8286
45-60 127 18.1496 18.1496
Above 60 42 19.6190
Less than 30 26 22.6538
Since table 5.28B shows the preference for short term gain varies
significantly among the respondents belonging to different age groups,
Duncan’s Post Hoc test is done. It shows the respondents in three different
groups. The preference for short term gain does not differ significantly
between the respondents in the age group of 30-45 and 45-60. Respondents
in the age group of less than 30 differ significantly from others with respect to
their preference for short term gain.
205
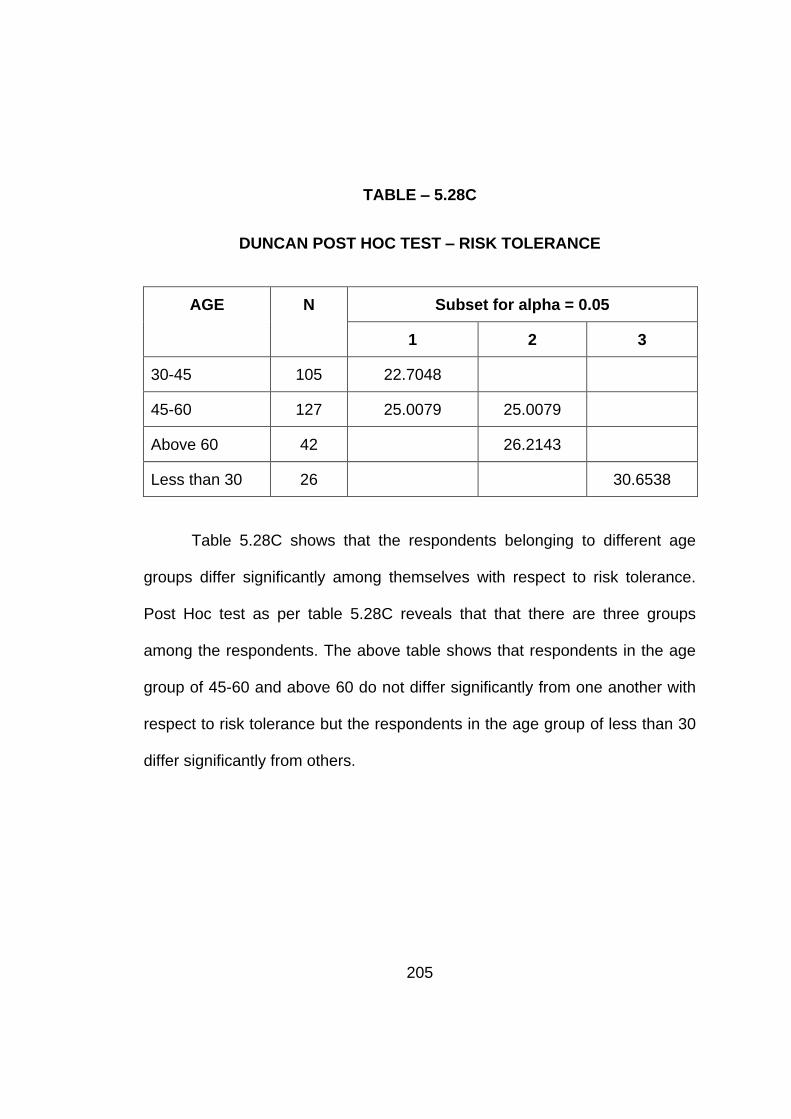
TABLE – 5.28C
DUNCAN POST HOC TEST – RISK TOLERANCE
AGE N Subset for alpha = 0.05
1 2 3
30-45 105 22.7048
45-60 127 25.0079 25.0079
Above 60 42 26.2143
Less than 30 26 30.6538
Table 5.28C shows that the respondents belonging to different age
groups differ significantly among themselves with respect to risk tolerance.
Post Hoc test as per table 5.28C reveals that that there are three groups
among the respondents. The above table shows that respondents in the age
group of 45-60 and above 60 do not differ significantly from one another with
respect to risk tolerance but the respondents in the age group of less than 30
differ significantly from others.

206
TABLE – 5.28D
DUNCAN POST HOC TEST – INVESTOR AWARENESS
AGE N Subset for alpha = 0.05
1 2
30-45 105 30.5619
Less than 30 26 32.8077
45-60 127 33.0000
Above 60 42 33.5952
Table 5.28D reveals that the level of investor awareness differs
significantly among different age groups. Hence Duncan’s test is done to
analyse the groupings. Table 5.28D reveals that the respondents in the age
group of 30-45 differ from the rest of the age groups with respect to the level
of investor awareness.
Summary
The analysis of the above variables with the age groups confirm the
fact that respondents in the age group of less than 30 differ from other groups
with respect to herd behaviour, preference for short term gain, risk tolerance.
Investors in the age group of less 30 show a higher level of herd behaviour,
risk tolerance and preference for short gain. The respondents in the age
group of 30-45 differ from the rest of the age groups with respect to investor
awareness.

207
TABLE – 5.29
ONE WAY ANALYSIS OF VARIANCE AMONG ACADEMIC
QUALIFICATION WITH REGARD TO INVESTMENT BEHAVIOUR
S.No. Investment Behaviour
Sum of squares
Df Mean
Square Mean
Statistical Inference
1. Herd Behaviour
Between Groups
Within Groups
42.945
1480.292
3
296
14.315
5.001
G1=6.6818
G2=7.0000
G3=6.2963
G4=6.1370
F = 2.862
P<0.05
Significant
2. Preference for
short term gain
Between Groups
Within Groups
191.561
6935.356
3
296
63.854
23.430
G1=19.5455
G2=18.9032
G3=18.0741
G4=17.0822
F = 2.725
P<0.05
Significant
3. Risk tolerance
Between Groups
Within Groups
392.036
12824.084
3
296
130.679
43.325
G2=25.9032
G1=26.2273
G3=24.3704
G4=23.2192
F = 3.016
P<0.05
Significant
4. Perception of
capital market
Between Groups
Within Groups
191.871
4511.366
3
296
63.957
15.241
G1=50.0000
G2=46.8710
G3=46.9753
G4=47.3973
F = 4.196
P<0.01
Significant
5. Perception of Corporate governance Between Groups
Within Groups
11.722
887.648
3
296
3.907
2.999
G1=12.0455
G2=12.6774
G3=12.7901
G4=12.4658
F = 1.303
P>0.05
Not Significant
6. Investor
Awareness
Between Groups
Within Groups
104.368
6673.979
3
296
34.789
22.547
G1=33.8182
G2=31.7984
G3=31.9383
G4=32.7397
F = 1.543
P>0.05
Not Significant
G1 = School final G2 = Graduate G3 = Post graduate G4 = Professional

208
Table 5.29 reveals the following results on the basis of the F Test
i) The herd behaviour varies significantly among the respondents
belonging to different academic qualifications. The mean scores of the
different groups as specified above signify a significant difference
among the group. Herd instincts based on the mean scores is highest
for G2 for graduates and lowest for Professionals.
ii) The preference for short term gain varies significantly among the
respondents belonging to different academic qualifications. The mean
score is the highest for respondents belonging to the group G1 - High
School qualifications.
iii) The table 5.29 reveals a significant difference among the respondents
with respect to the level of risk tolerance.
iv) The F Test above reveals that there is significant difference among
respondents with respect to perception of capital market as indicated
by the mean scores for the different groups.
v) The perception of the respondents with respect to corporate
governance does not vary significantly among the different academic
levels of the respondents.
vi) The level of investor awareness does not vary significantly among the
respondents belonging to different educational levels.
209
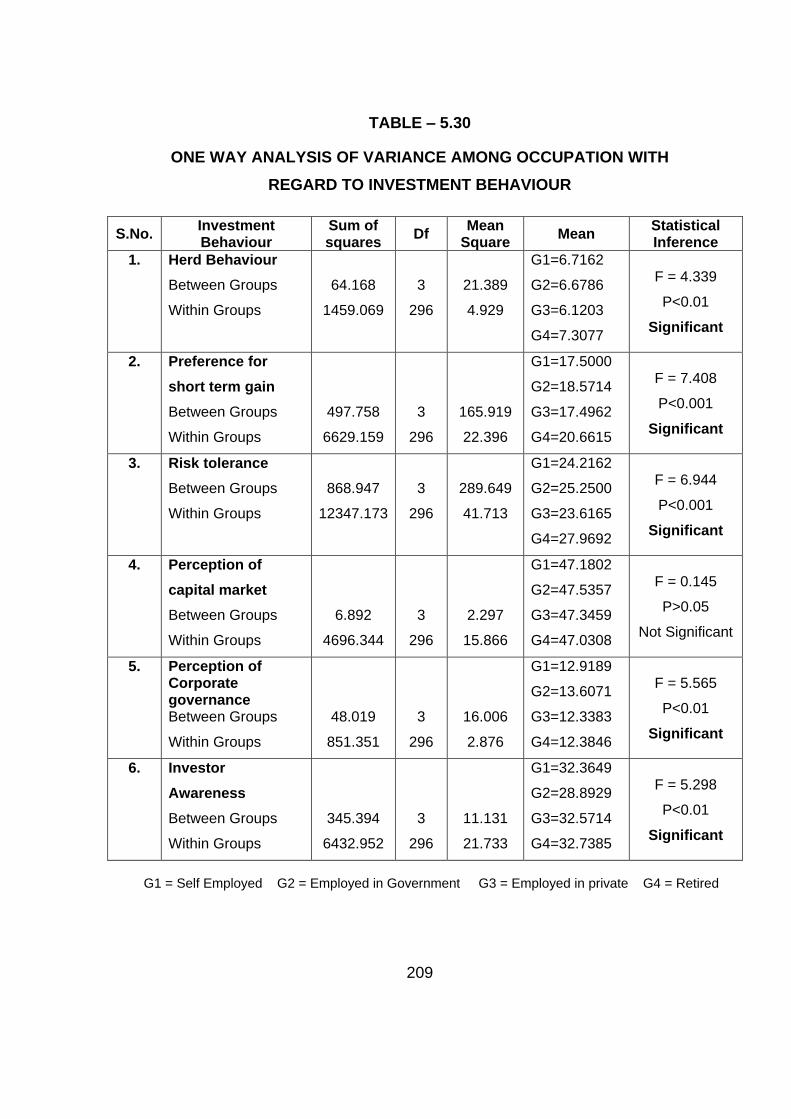
TABLE – 5.30
ONE WAY ANALYSIS OF VARIANCE AMONG OCCUPATION WITH
REGARD TO INVESTMENT BEHAVIOUR
S.No. Investment Behaviour
Sum of squares
Df Mean
Square Mean
Statistical Inference
1. Herd Behaviour
Between Groups
Within Groups
64.168
1459.069
3
296
21.389
4.929
G1=6.7162
G2=6.6786
G3=6.1203
G4=7.3077
F = 4.339
P<0.01
Significant
2. Preference for
short term gain
Between Groups
Within Groups
497.758
6629.159
3
296
165.919
22.396
G1=17.5000
G2=18.5714
G3=17.4962
G4=20.6615
F = 7.408
P<0.001
Significant
3. Risk tolerance
Between Groups
Within Groups
868.947
12347.173
3
296
289.649
41.713
G1=24.2162
G2=25.2500
G3=23.6165
G4=27.9692
F = 6.944
P<0.001
Significant
4. Perception of
capital market
Between Groups
Within Groups
6.892
4696.344
3
296
2.297
15.866
G1=47.1802
G2=47.5357
G3=47.3459
G4=47.0308
F = 0.145
P>0.05
Not Significant
5. Perception of Corporate governance Between Groups
Within Groups
48.019
851.351
3
296
16.006
2.876
G1=12.9189
G2=13.6071
G3=12.3383
G4=12.3846
F = 5.565
P<0.01
Significant
6. Investor
Awareness
Between Groups
Within Groups
345.394
6432.952
3
296
11.131
21.733
G1=32.3649
G2=28.8929
G3=32.5714
G4=32.7385
F = 5.298
P<0.01
Significant
G1 = Self Employed G2 = Employed in Government G3 = Employed in private G4 = Retired

210
One Way Analysis of Variance among Occupation with regard to Investment
Behaviour reveals the following:
i) The herd behaviour varies significantly among the respondents
belonging to different occupation. It is evident from the mean scores as
given in table 5-30 for the variable herd behaviour.
ii) The preference for short term gain of the respondents varies
significantly among the group. The mean scores given for the variable
shows there is a difference in value among the group.
iii) The level of risk tolerance of the employees varies significantly
between the groups as evident from table 5-30. The risk tolerance level
of the retired investors is much different from others.
iv) The perception towards capital market does not differ significantly
among the respondents belonging to different occupation levels. The
mean scores for the variable do not differ significantly among the
different groups.
v) The perception of the respondents towards corporate governance does
not differs significantly among the groups belonging to different
occupation.
vi) The level of investor awareness varies significantly among the
respondents belonging to different occupations. This is evident from
the mean scores.
On the basis of the results shown above, Duncan’s Post Hoc Test is
done for the variables where there is a significance level with P<0.01. The
results are presented below.

211
TABLE – 5.30A
DUNCAN POST HOC TEST – PREFERENCE FOR SHORT TERM GAIN
OCCUPATION N Subset for alpha = 0.05
1 2
Employed in private 133 17.4692
Self Employed 74 17.5000
Employed in Government 28 18.5714
Retired 65 20.6615
Table 5.30A shows that the there is significant difference in the
preference for short term gain between the retired investors and the rest of
the investors as depicted above. Similarly the table above reveals there is no
significant difference among the employed in private, self employed and
employed in government with respect to preference for short term gain.
212
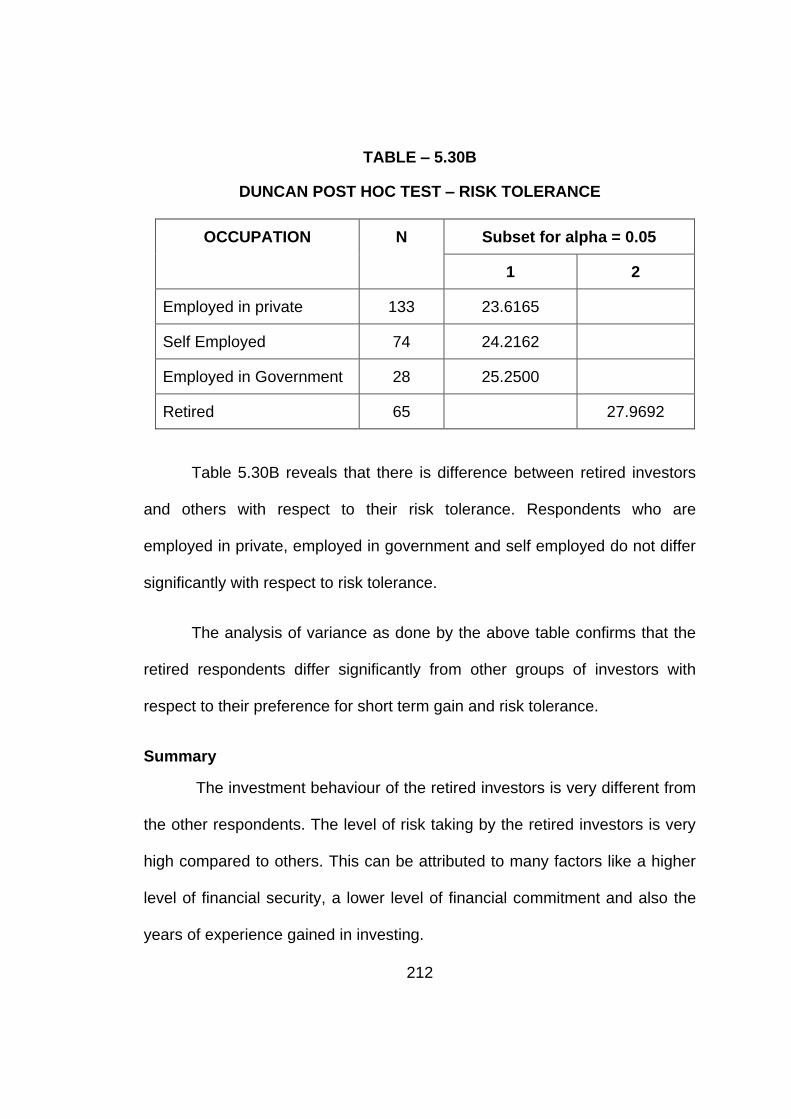
TABLE – 5.30B
DUNCAN POST HOC TEST – RISK TOLERANCE
OCCUPATION N Subset for alpha = 0.05
1 2
Employed in private 133 23.6165
Self Employed 74 24.2162
Employed in Government 28 25.2500
Retired 65 27.9692
Table 5.30B reveals that there is difference between retired investors
and others with respect to their risk tolerance. Respondents who are
employed in private, employed in government and self employed do not differ
significantly with respect to risk tolerance.
The analysis of variance as done by the above table confirms that the
retired respondents differ significantly from other groups of investors with
respect to their preference for short term gain and risk tolerance.
Summary
The investment behaviour of the retired investors is very different from
the other respondents. The level of risk taking by the retired investors is very
high compared to others. This can be attributed to many factors like a higher
level of financial security, a lower level of financial commitment and also the
years of experience gained in investing.
213
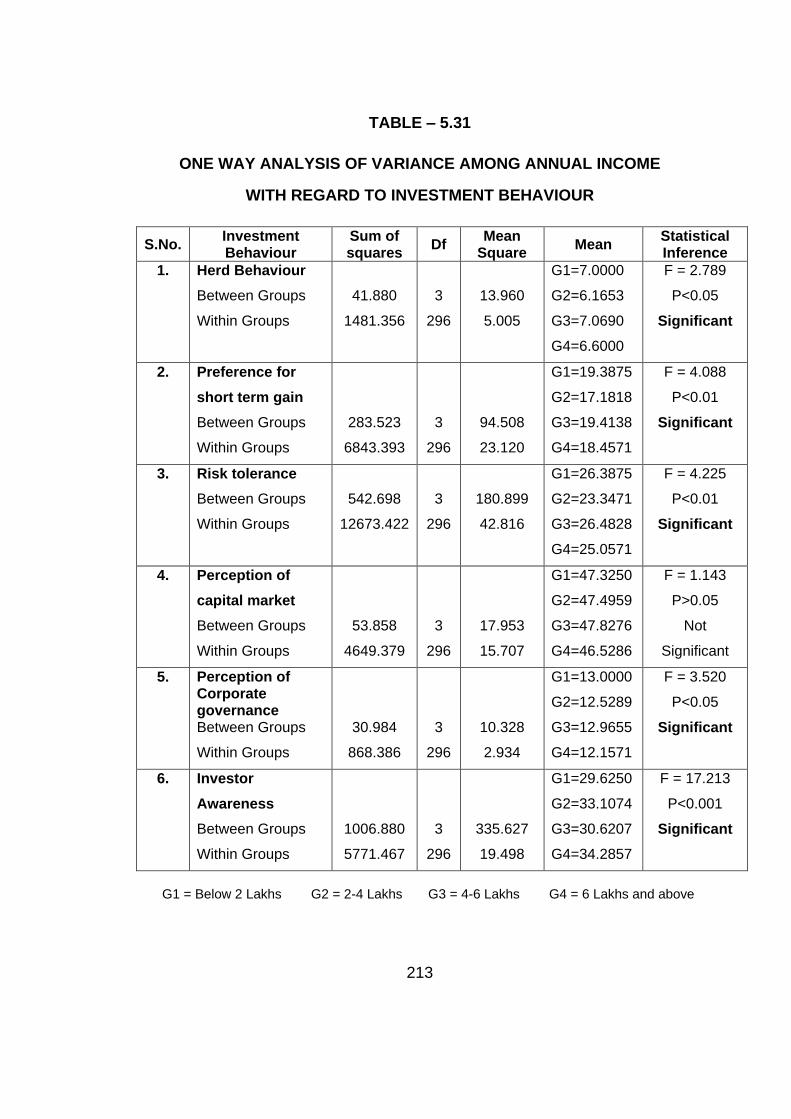
TABLE – 5.31
ONE WAY ANALYSIS OF VARIANCE AMONG ANNUAL INCOME
WITH REGARD TO INVESTMENT BEHAVIOUR
S.No. Investment Behaviour
Sum of squares
Df Mean
Square Mean
Statistical Inference
1. Herd Behaviour
Between Groups
Within Groups
41.880
1481.356
3
296
13.960
5.005
G1=7.0000
G2=6.1653
G3=7.0690
G4=6.6000
F = 2.789
P<0.05
Significant
2. Preference for
short term gain
Between Groups
Within Groups
283.523
6843.393
3
296
94.508
23.120
G1=19.3875
G2=17.1818
G3=19.4138
G4=18.4571
F = 4.088
P<0.01
Significant
3. Risk tolerance
Between Groups
Within Groups
542.698
12673.422
3
296
180.899
42.816
G1=26.3875
G2=23.3471
G3=26.4828
G4=25.0571
F = 4.225
P<0.01
Significant
4. Perception of
capital market
Between Groups
Within Groups
53.858
4649.379
3
296
17.953
15.707
G1=47.3250
G2=47.4959
G3=47.8276
G4=46.5286
F = 1.143
P>0.05
Not
Significant
5. Perception of Corporate governance Between Groups
Within Groups
30.984
868.386
3
296
10.328
2.934
G1=13.0000
G2=12.5289
G3=12.9655
G4=12.1571
F = 3.520
P<0.05
Significant
6. Investor
Awareness
Between Groups
Within Groups
1006.880
5771.467
3
296
335.627
19.498
G1=29.6250
G2=33.1074
G3=30.6207
G4=34.2857
F = 17.213
P<0.001
Significant
G1 = Below 2 Lakhs G2 = 2-4 Lakhs G3 = 4-6 Lakhs G4 = 6 Lakhs and above

214
One way analysis of variance among annual income with regard to investment
behaviour reveals the following :
i) Herd behaviour of the respondents varies significantly among different
income levels. The mean scores for the various income level given for
the variable herding shows there is a difference among the
respondents belonging to different income levels.
ii) Preference for short term gain varies significantly among the
respondents belonging to different income levels. This is evident from
the mean scores given in the table.
iii) The level of risk tolerance varies significantly among the respondents
belonging to different income groups. This is shown as per the mean
scores for the various groups.
iv) The investors’ perception of capital market does not differ among the
different income groups. The mean scores as depicted above prove
that there is no significant difference.
v) The investors’ perception of Corporate Governance varies significantly
among the respondents having different income levels as shown by the
mean scores.
vi) The level of investor awareness differs significantly among the
respondents belonging to different income levels.
215
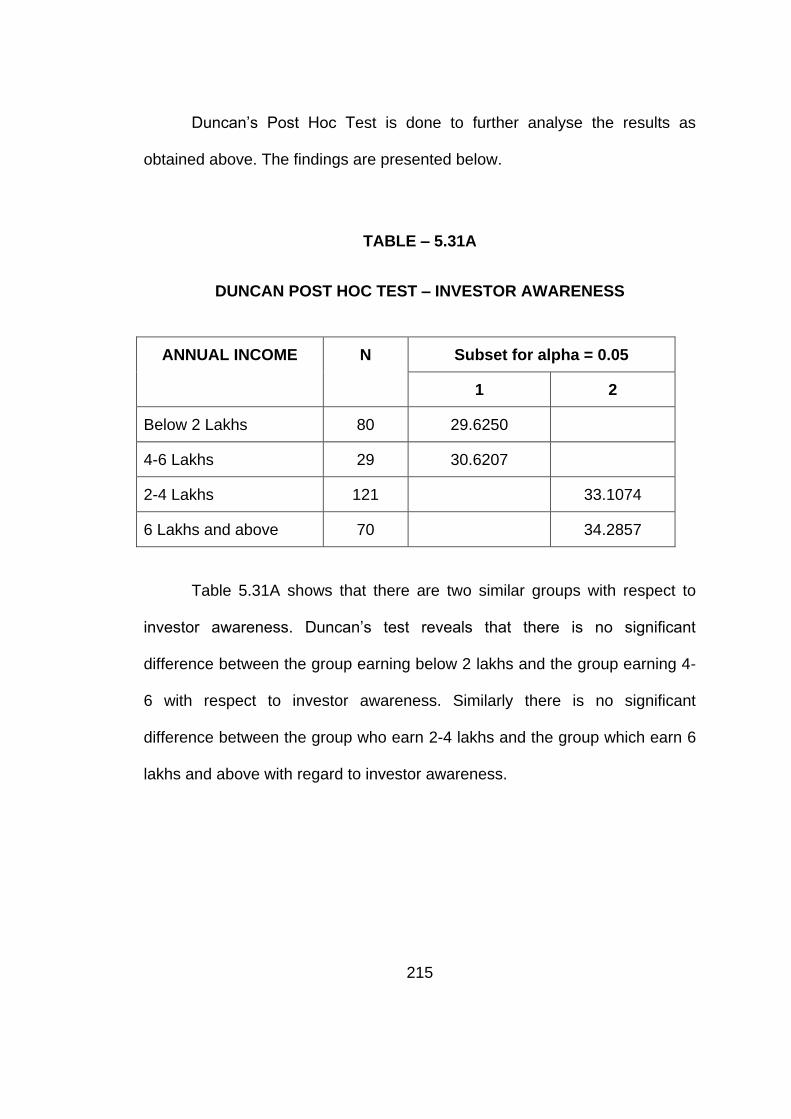
Duncan’s Post Hoc Test is done to further analyse the results as
obtained above. The findings are presented below.
TABLE – 5.31A
DUNCAN POST HOC TEST – INVESTOR AWARENESS
ANNUAL INCOME N Subset for alpha = 0.05
1 2
Below 2 Lakhs 80 29.6250
4-6 Lakhs 29 30.6207
2-4 Lakhs 121 33.1074
6 Lakhs and above 70 34.2857
Table 5.31A shows that there are two similar groups with respect to
investor awareness. Duncan’s test reveals that there is no significant
difference between the group earning below 2 lakhs and the group earning 4-
6 with respect to investor awareness. Similarly there is no significant
difference between the group who earn 2-4 lakhs and the group which earn 6
lakhs and above with regard to investor awareness.

216
5.7 ASSOCIATION BETWEEN GENDER AND VARIOUS
BEHAVIOURAL ISSUES
The relationship between demographic factors and various behavioural
issues and perceptional issues such as herding tendency, preference for short
term gain, risk tolerance and financial literacy are analysed in this study.
i) HERD BEHAVIOUR
Herd instincts are a psychological bias in investing. Instead of relying
on any analysis or basic information people tend to herd together i.e. just
follow other investors or market sentiments. This often results in irrational ups
and downs in the market not supported by any technical or fundamental
valuation. This may be due to over reaction to any market information. The
behaviour of the investors are analysed based on the responses from the
Rating scale used for the respondents. The following table V-38 is provided
for the purpose of analysis.

217
TABLE – 5.32
HERDING VS GENDER
Level Gender Total
Male Female
Low 74
(28.9)
12
(27.3)
86
(28.7)
Medium 86
(33.6)
10
(22.7)
96
(32.0)
High 96
(37.5)
22
(50)
118
(39.3)
Total 256
(100)
44
(100)
300
(100)
As per the above table 5.32, 50 per cent of female investors have a
high level of herding tendency, 22.7 per cent has medium level of herding
tendency and 27.3 per cent of the respondents have a low level. Among the
male, a high level of herding tendency is shown by 37.5 per cent of the
respondents, medium level by 33.6 per cent and low level by 28.9 per cent.
With a view to analyse the associations between the herd instincts and
gender chi square test is applied. The findings are presented below.
Chi-Square Tests
Value Df Statistical Inference
Pearson Chi-Square 2.912 2 P > 0.05
Not Significant
The results of the chi square tests revealed above prove that there is
no significant relationship between herding and the gender.

218
ii) PREFERENCE FOR SHORT TERM GAIN
The investment time frame of the investors is either short term or long
term. Short term denotes the holding period of less than one year and long
term is more than one year. Choosing between short term gain and long term
gain is a very important decision taken by every investor. Each has its own
risks and rewards associated with it. Many investment experts favour the idea
of long term gain but in a developing economy like India where the stock
markets have become very developed and exciting the tendency of the
investors to invest for a short term gain and reap the benefits is a frequently
observed phenomenon. Hence this tendency is analysed in this study. The
following table is provided for the purpose of analysis.
TABLE – 5.33
PREFERENCE FOR SHORT TERM GAIN VS GENDER
Level
Gender Total
Male Female
Low 91
(35.5)
3
(6.8)
94
(31.3)
Medium 101
(39.5)
23
(52.3)
124
(41.3)
High 64
(25.0)
18
(40.9)
82
(27.3)
Total 256
(100)
44
(100)
300
(100)

219
Among the males 25 per cent show a high level of preference for short
term gain. But among the females 40.9 per cent have shown a high level of
preference. Female investors show a higher level of preference than the male
investors. With a view to examine the association between preference for
short term gain and gender chi square test is applied. The results are given
below.
Chi-Square Test
Value Df Statistical Inference
Pearson Chi-Square 14.860 2 P < 0.01
Significant
The Pearson Chi square value signifies that there is a significant
relationship between gender and the preference for short term gain.
220
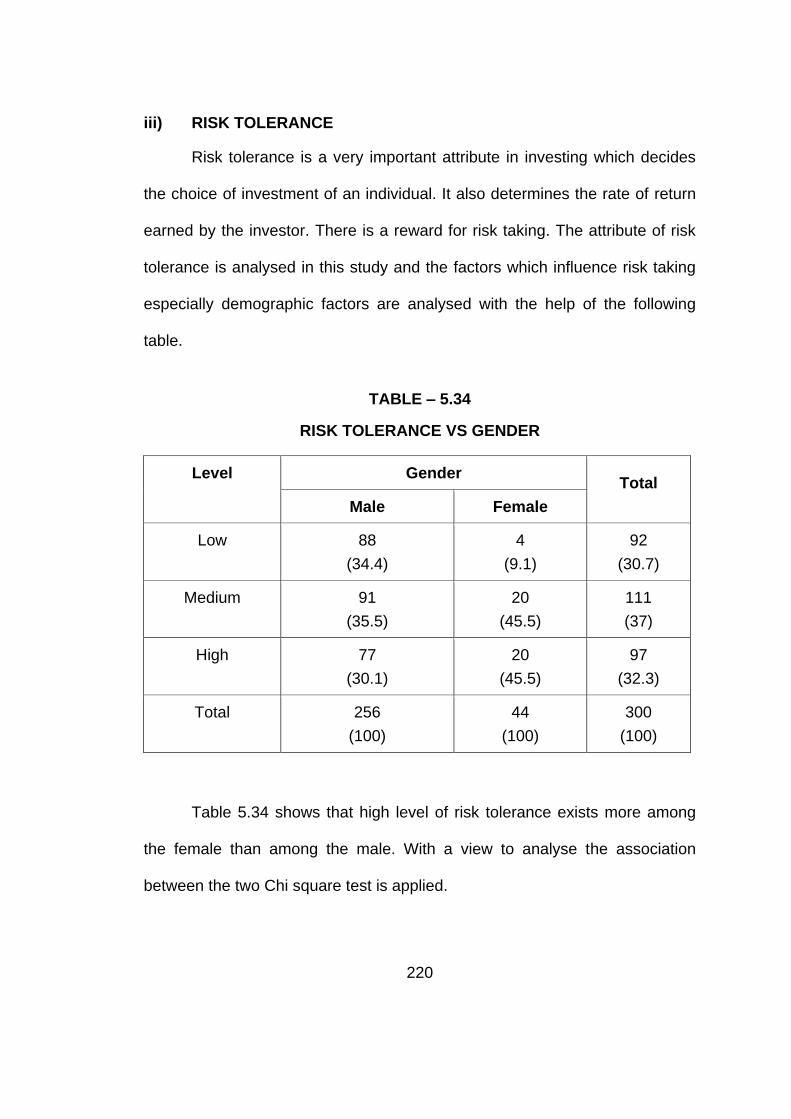
iii) RISK TOLERANCE
Risk tolerance is a very important attribute in investing which decides
the choice of investment of an individual. It also determines the rate of return
earned by the investor. There is a reward for risk taking. The attribute of risk
tolerance is analysed in this study and the factors which influence risk taking
especially demographic factors are analysed with the help of the following
table.
TABLE – 5.34
RISK TOLERANCE VS GENDER
Level Gender Total
Male Female
Low 88
(34.4)
4
(9.1)
92
(30.7)
Medium 91
(35.5)
20
(45.5)
111
(37)
High 77
(30.1)
20
(45.5)
97
(32.3)
Total 256
(100)
44
(100)
300
(100)
Table 5.34 shows that high level of risk tolerance exists more among
the female than among the male. With a view to analyse the association
between the two Chi square test is applied.

221
Chi-Square Tests
Value Df Statistical Inference
Pearson Chi-Square 11.569 2 P < 0.05
Significant
The results of the chi square test reveals that risk tolerance varies
between men and women.
iv) INVESTOR AWARENESS
Investor Awareness is the process by which investors improve their
understanding of financial markets, products, concepts and risks. Financial
literacy helps an investor to make an informed judgment about investments
keeping in mind the specific goals of investing. Financial literacy levels of the
respondents are analysed using the responses given by the respondents in
the questionnaire. It was found that a majority of them have a high level of
financial literacy. In this part of the study, the relationship between
demographic factors and financial literacy is analysed. The following table is
provided for the purpose of analysis.

222
TABLE – 5.35
INVESTOR AWARENESS VS GENDER
Level
Gender Total
Male Female
Low 37
(14.5)
15
(34.1)
52
(17.3)
Medium 106
(41.4)
18
(40.9)
124
(41.3)
High 113
(44.1)
11
(25)
124
(41.3)
Total 256
(100)
44
(100)
300
(100)
The investor awareness levels between the genders are given in table
5.35. Among the male, 44.1 per cent have high financial literacy levels.
Among the female 25 per cent have high financial literacy levels. With a view
to analyse the relationship between gender and financial literacy, chi square
test is applied.
Chi-Square Tests
Value Df Statistical Inference
Pearson Chi-Square 11.684 2 P < 0.05
Significant
The value obtained in the chi square test signifies that there is a
significant relationship between gender and the investor awareness.

223
5.8 ASSOCIATION BETWEEN DEMOGRAPHIC FACTORS AND
INVESTMENT PREFERENCES
The investors preferences for IPOs is analysed in this study.
Traditionally Indian shareholders entered the capital market through IPOs but
there is a changing trend nowadays which is evident from the poor
performance of IPOs in our country in the recent times. Similarly some
investors have the habit of buying shares in small lots (equivalent to investing
as low as possible) to minimize losses. This tendency is analysed in this
study. Another habit of the investor which is analysed in this part is the profit
booking by investors on reaching the target to realize the profit. Some
investors buy the shares with a fixed target. If the target is reached they sell
the shares and book the profits. Others do not sell the shares and continue to
hold it as a long time investment. The tendency to book profit is taken up for
analysis to study how the investors keep track of their investments. The
following tables are provided under this analysis.
224
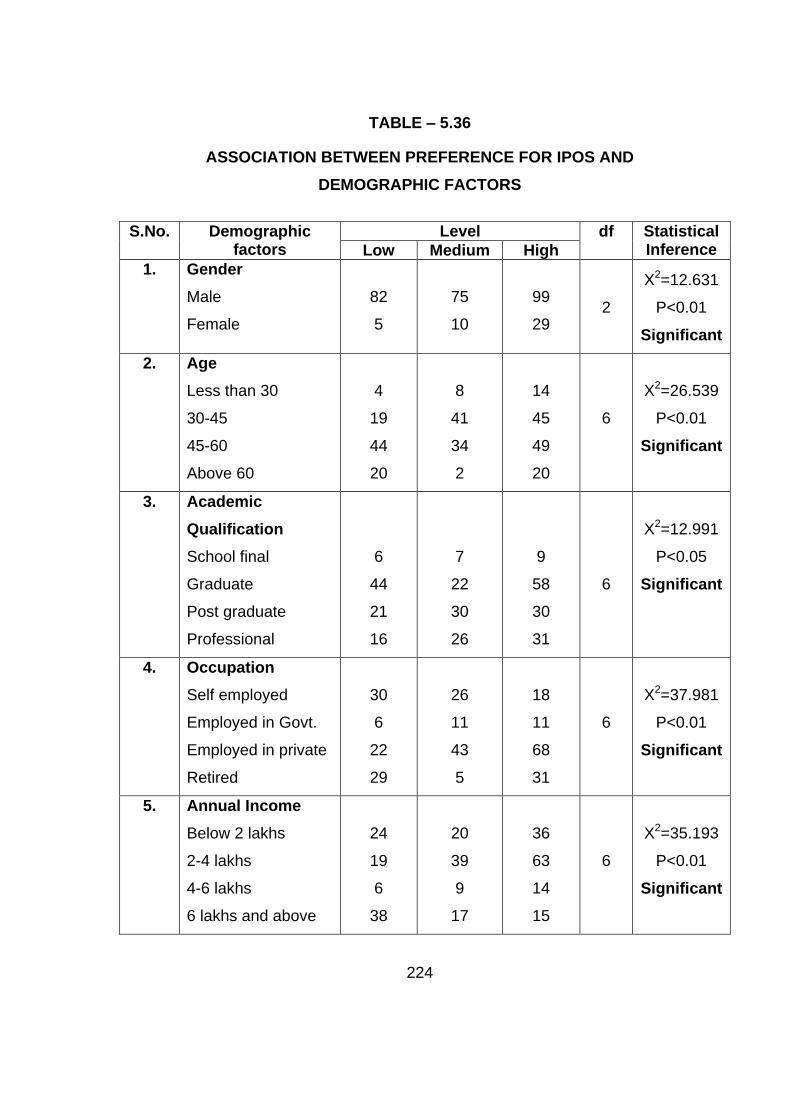
TABLE – 5.36
ASSOCIATION BETWEEN PREFERENCE FOR IPOS AND
DEMOGRAPHIC FACTORS
S.No. Demographic factors
Level df Statistical Inference Low Medium High
1. Gender
Male
Female
82
5
75
10
99
29
2
X2=12.631
P<0.01
Significant
2. Age
Less than 30
30-45
45-60
Above 60
4
19
44
20
8
41
34
2
14
45
49
20
6
X2=26.539
P<0.01
Significant
3. Academic
Qualification
School final
Graduate
Post graduate
Professional
6
44
21
16
7
22
30
26
9
58
30
31
6
X2=12.991
P<0.05
Significant
4. Occupation
Self employed
Employed in Govt.
Employed in private
Retired
30
6
22
29
26
11
43
5
18
11
68
31
6
X2=37.981
P<0.01
Significant
5. Annual Income
Below 2 lakhs
2-4 lakhs
4-6 lakhs
6 lakhs and above
24
19
6
38
20
39
9
17
36
63
14
15
6
X2=35.193
P<0.01
Significant

225
Table 5.36 shows the association between the preference for IPOs and
the demographic factors namely gender, age, academic qualification,
occupation and annual income. The chi square test reveals the following
1. There is a significant relationship between gender and the preference
for IPOs.
2. The preference for IPOs differs significantly between the different age
groups of the respondents.
3. There is a significant relationship between academic qualification of the
respondents and the preference for IPOs.
4. The preference for IPOs differs significantly between the respondents
belonging to different categories of occupation.
5. The preference for IPOs differs significantly between the respondents
belonging to different income levels.
The tendency of the investors to invest in IPOs is influenced by the
demographic factors namely gender, age, qualification, occupation and
annual Income.

226
TABLE – 5.37
ASSOCIATION BETWEEN PREFERENCE FOR SMALL LOTS AND
DEMOGRAPHIC FACTORS
S.No. Demographic factors
Level df Statistical Inference Low Medium High
1. Gender
Male
Female
93
10
28
6
135
28
2
X2=3.086
P>0.05
Not Significant
2. Age
Less than 30
30-45
45-60
Above 60
12
19
62
10
4
19
10
1
10
67
55
31
6
X2=35.877
P<0.01
Significant
3. Academic
Qualification
School final
Graduate
Post graduate
Professional
5
50
22
26
5
9
14
6
12
65
45
41
6
X2=11.051
P>0.05
Not Significant
4. Occupation
Self employed
Employed in Govt.
Employed in private
Retired
21
2
56
24
10
6
14
4
43
20
63
37
6
X2=16.672
P<0.01
Significant
5. Annual Income
Below 2 lakhs
2-4 lakhs
4-6 lakhs
6 lakhs and above
15
33
13
42
13
12
2
7
52
76
14
21
6
X2=35.411
P<0.01
Significant

227
Table 5.37 reveals the following:
1. There is no relationship between the gender of the respondents and
the preference for small lots of shares.
2. There is a significant relationship between the age of the respondents
and the preference for small lots shares.
3. The preference for small lots of shares does not vary significantly
between respondents belonging to different academic levels
4. The preference for small lots varies between different occupations.
5. The preference for small lots varies significantly between different
income levels of the respondents.

228
TABLE – 5.38
ASSOCIATION BETWEEN PREFERENCE FOR PROFIT BOOKING AND
DEMOGRAPHIC FACTORS
S.No. Demographic
factors
Level df Statistical
Inference Low Medium High
1. Gender
Male
Female
14
3
71
16
171
25
2
X2=1.657
P>0.05
Not Significant
2. Age
Less than 30
30-45
45-60
Above 60
--
7
9
1
4
43
39
1
22
55
79
40
6
X2=30.250
P<0.01
Significant
3. Academic
Qualification
School final
Graduate
Post graduate
Professional
--
10
1
6
2
27
32
26
20
87
48
41
6
X2=19.618
P<0.01
Significant
4. Occupation
Self employed
Employed in Govt.
Employed in private
Retired
8
--
4
5
15
15
49
8
51
13
80
52
6
X2=28.377
P<0.01
Significant
5. Annual Income
Below 2 lakhs
2-4 lakhs
4-6 lakhs
6 lakhs and above
1
3
5
8
21
42
5
19
58
76
19
43
6
X2=19.826
P<0.01
Significant

229
As per the table 5.38, the following inferences are made.
1. The tendency to book profits does not differ significantly between the
genders.
2. Profit booking varies significantly between different age groups.
3. There is a significant relationship between profit booking and academic
qualification.
4. The tendency to book profits vary significantly between the
respondents belonging to different occupation.
5. There is a significant relationship between tendency to book profits and
annual income of the respondents.
230
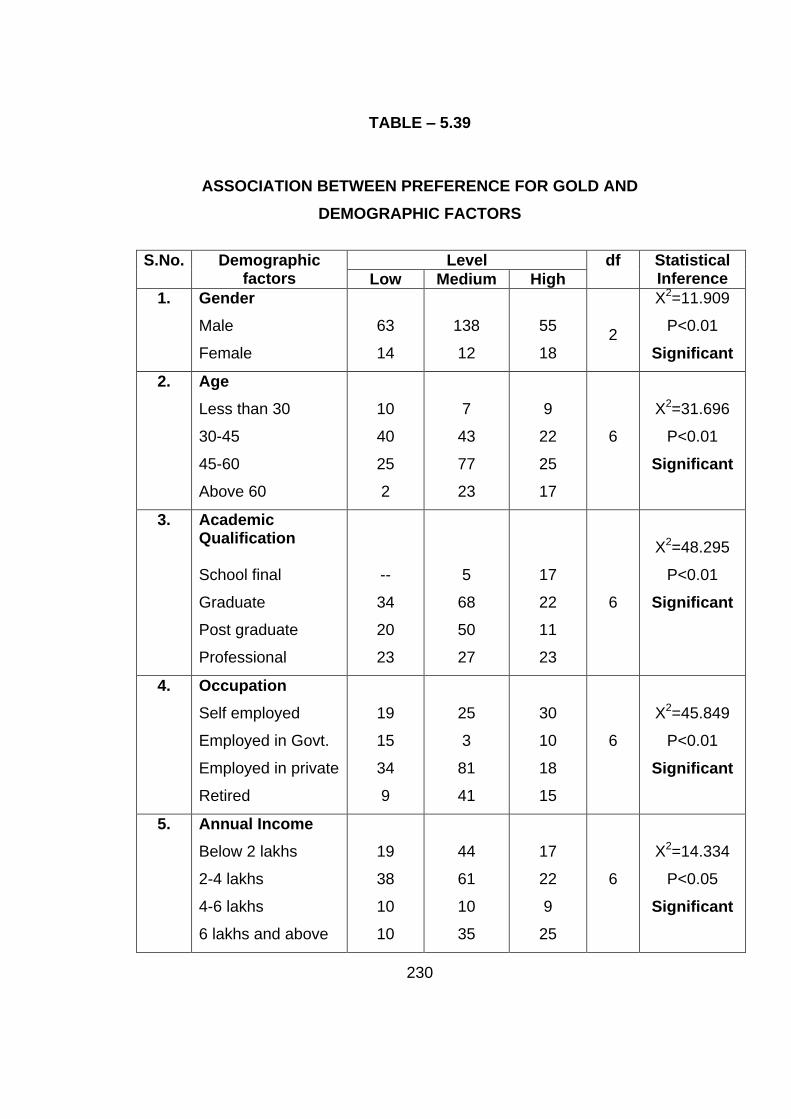
TABLE – 5.39
ASSOCIATION BETWEEN PREFERENCE FOR GOLD AND
DEMOGRAPHIC FACTORS
S.No. Demographic factors
Level df Statistical Inference Low Medium High
1. Gender
Male
Female
63
14
138
12
55
18
2
X2=11.909
P<0.01
Significant
2. Age
Less than 30
30-45
45-60
Above 60
10
40
25
2
7
43
77
23
9
22
25
17
6
X2=31.696
P<0.01
Significant
3. Academic Qualification School final
Graduate
Post graduate
Professional
--
34
20
23
5
68
50
27
17
22
11
23
6
X2=48.295
P<0.01
Significant
4. Occupation
Self employed
Employed in Govt.
Employed in private
Retired
19
15
34
9
25
3
81
41
30
10
18
15
6
X2=45.849
P<0.01
Significant
5. Annual Income
Below 2 lakhs
2-4 lakhs
4-6 lakhs
6 lakhs and above
19
38
10
10
44
61
10
35
17
22
9
25
6
X2=14.334
P<0.05
Significant

231
Table 5.39 indicates the association between the preferences for Gold
/real assets as an investment option and various demographic factors namely
gender, age academic qualification, occupation and annual savings. The
findings are presented below.
1. The chi square value indicates the preference for gold varies
significantly between genders.
2. There is a significant relationship between preference for gold and age
of the respondents.
3. There is a significant relationship between preference for gold and
academic qualification of the respondents.
4. The preference for gold varies significantly among the respondents
belonging to different occupation.
5. There is a relationship between preference for gold and annual income.
Preference for investing in gold has a significant relationship with all
the demographic factors namely gender, age, qualification, occupation and
annual income.
232
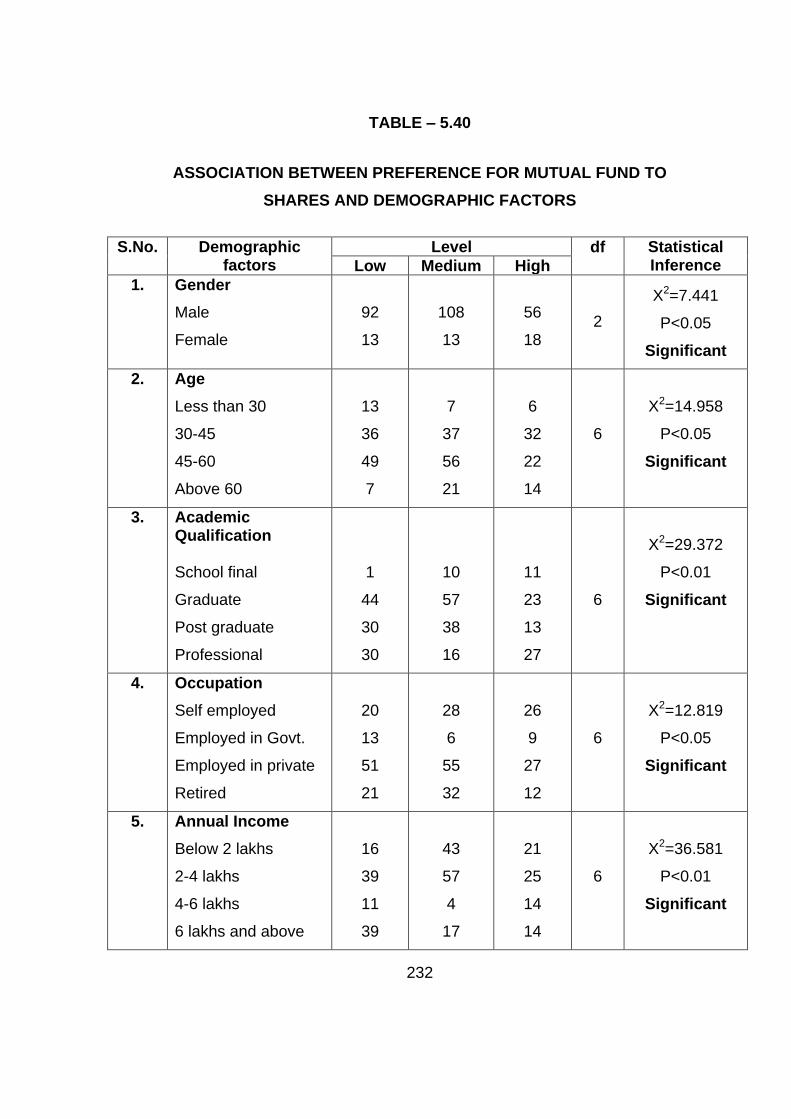
TABLE – 5.40
ASSOCIATION BETWEEN PREFERENCE FOR MUTUAL FUND TO
SHARES AND DEMOGRAPHIC FACTORS
S.No. Demographic factors
Level df Statistical Inference Low Medium High
1. Gender
Male
Female
92
13
108
13
56
18
2
X2=7.441
P<0.05
Significant
2. Age
Less than 30
30-45
45-60
Above 60
13
36
49
7
7
37
56
21
6
32
22
14
6
X2=14.958
P<0.05
Significant
3. Academic Qualification School final
Graduate
Post graduate
Professional
1
44
30
30
10
57
38
16
11
23
13
27
6
X2=29.372
P<0.01
Significant
4. Occupation
Self employed
Employed in Govt.
Employed in private
Retired
20
13
51
21
28
6
55
32
26
9
27
12
6
X2=12.819
P<0.05
Significant
5. Annual Income
Below 2 lakhs
2-4 lakhs
4-6 lakhs
6 lakhs and above
16
39
11
39
43
57
4
17
21
25
14
14
6
X2=36.581
P<0.01
Significant

233
Table 5.40 shows there is a significant relationship between preference
for mutual fund and various demographic factors namely gender, age,
academic qualification, occupation and annual income. The chi square test
proves the following
1. There is a significant relationship between gender and the preference
for mutual fund.
2. There is a significant relationship between age and the preference for
mutual funds.
3. The preference for mutual funds varies among the respondents
belonging to different educational levels.
4. There is a significant relationship between mutual funds the preference
for shares.
5. The preference for mutual funds varies significantly among
respondents belonging to different income levels.

234
5.9 ASSOCIATION BETWEEN SAVINGS AND DEMOGRAPHIC
FACTORS
The association between savings and the different demographic factors
namely age, occupation, annual income, number of dependents and
academic qualifications are analysed and the following tables are provided for
this analysis.
Table – 5.41 Association between Age and Savings
Table – 5.42 Association between Occupation and Savings
Table – 5.43 Association between Annual Income and Savings
Table – 5.44 Association between Number of Dependents and Savings
Table – 5.45 Association between Academic Qualification and Savings
TABLE – 5.41
ASSOCIATION BETWEEN AGE AND SAVINGS
Age
Savings
Total Less than
25000 25000-50000
50000 - 1 lakh
1 lakh and above
Less than 30 9
(13.8)
7
(11.5)
0
(0)
10
(8.5)
26
(8.7)
30-45 25
(38.5)
22
(36.1)
25
(44.7)
33
(28.1)
105
(35.0)
45-60 23
(35.4)
22
(36.1)
21
(37.5)
61
(51.7)
127
(42.3)
Above 60 8
(12.3)
10
(16.4)
10
(17.9)
14
(11.9)
42
(14)
Total 65
(100)
61
(100)
56
(100)
118
(100)
300
(100)

235
The above table shows that out of 300 respondents, the majority 127
i.e 42.3 per cent belong to the age group 45-60 followed by respondents in
the age group of 30-45. Like wise savings start decreasing after the age of 60
as given in the table. Savings in the age group of less than 30 is the least in
every category of savings. Hence it can be inferred that people in this age
group do not contribute to savings at all income groups. For most of the
respondents the habit of savings starts only after the age.
Chi-Square Tests
Value df Statistical Inference
Pearson Chi-Square 16.245 9 P>0.05
Not significant
The above table shows that the savings of the respondents do not vary
significantly between different age groups. The statistical inference (P>0.05)
signifies there is no relationship between the two variables.

236
TABLE – 5.42
ASSOCIATION BETWEEN OCCUPATION AND SAVINGS
Occupation
Savings
Total Less than
25000 25000-50000
50000 - 1 lakh
1 lakh and above
Self employed 7
(10.8)
11
(18.0)
19
(34.0)
37
(31.3)
74
(24.7)
Employed in government
2
(3.1)
6
(9.8)
7
(12.5)
13
(11.0)
28
(9.3)
Employed in Private
43
(66.1)
28
(46.0)
15
(26.8)
47
(40.0)
133
(44.3)
Retired 13
(20.0)
16
(26.2)
15
(26.8)
21
(17.8)
65
(21.7)
Total 65
(100)
61
(100)
56
(100)
118
(100)
300
(100)
The above table 5.42 shows the savings levels of investors from
different occupation. In terms of the amount saved the maximum number of
respondents are in the level of Rs 1 lakh and above. Investors from the
private sector constitute the maximum (133) in number. The percentage of
respondents employed in Government who save are much less than other
categories of occupation. Only 3.1 per cent save in the first category of less
than 50,000 per annum; 9.8 per cent save between 50,000-100000;12.5 per
cent save between 100000-1500000 and 11 per cent save above 150000.

237
Hence it is inferred that Government employees save much less than all other
categories of respondents. Those who are employed in private have the
highest agreement on savings in all levels of savings as inferred from the
above table. In the less than 50000 savings category 66.1 per cent belong to
the self employed group, followed by 46 per cent in the category of 50000 - 1
lakh category, 26.8 per cent in the 1lakh to 1.5 lakhs category and 40 per cent
in the category of 1.5 lakh and above. Retired people also save significantly
as shown in the table. Retired respondents constitute 21.7 per cent of the
respondents.
Chi-Square Tests
Value Df Statistical Inference
Pearson Chi-Square 27.575 9 P<0.01
Significant
The above table 5.42 shows the savings between different categories
of occupation and the statistical inference of the chi square test testing the
association between occupation and savings. The value (P<0.01) shows that
there is significant relationship between occupation and savings.
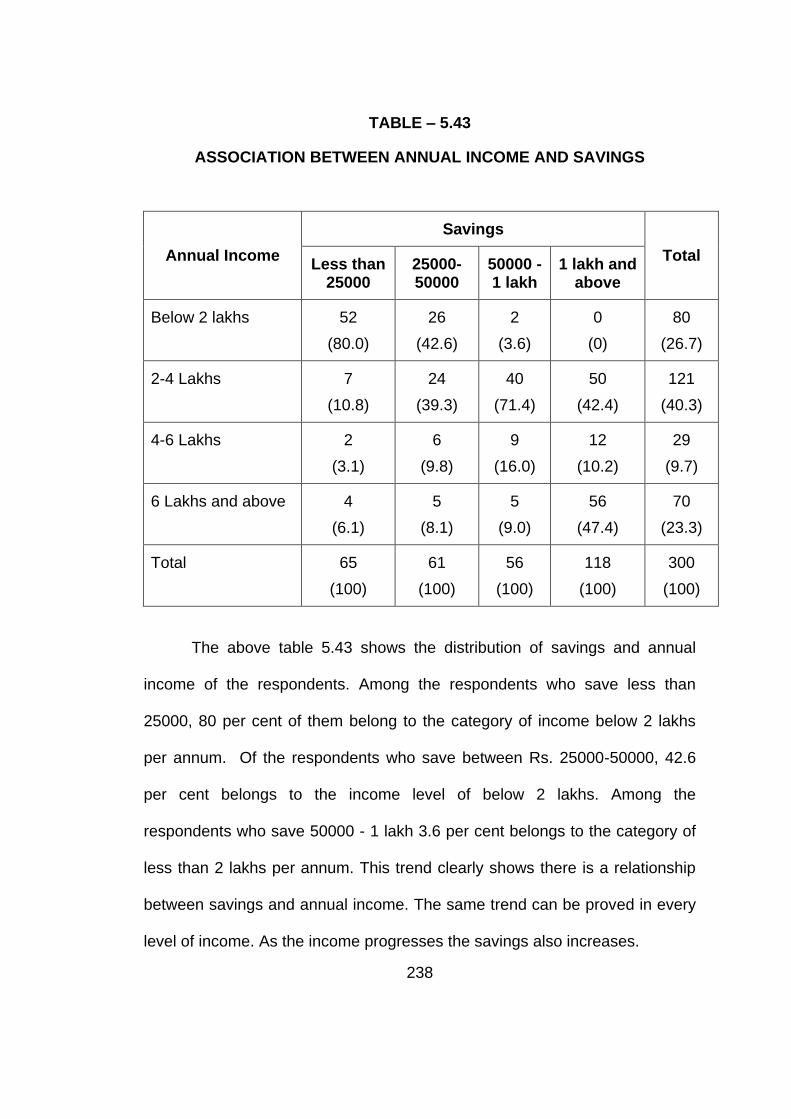
238
TABLE – 5.43
ASSOCIATION BETWEEN ANNUAL INCOME AND SAVINGS
Annual Income
Savings
Total Less than
25000 25000-50000
50000 - 1 lakh
1 lakh and above
Below 2 lakhs 52
(80.0)
26
(42.6)
2
(3.6)
0
(0)
80
(26.7)
2-4 Lakhs 7
(10.8)
24
(39.3)
40
(71.4)
50
(42.4)
121
(40.3)
4-6 Lakhs 2
(3.1)
6
(9.8)
9
(16.0)
12
(10.2)
29
(9.7)
6 Lakhs and above 4
(6.1)
5
(8.1)
5
(9.0)
56
(47.4)
70
(23.3)
Total 65
(100)
61
(100)
56
(100)
118
(100)
300
(100)
The above table 5.43 shows the distribution of savings and annual
income of the respondents. Among the respondents who save less than
25000, 80 per cent of them belong to the category of income below 2 lakhs
per annum. Of the respondents who save between Rs. 25000-50000, 42.6
per cent belongs to the income level of below 2 lakhs. Among the
respondents who save 50000 - 1 lakh 3.6 per cent belongs to the category of
less than 2 lakhs per annum. This trend clearly shows there is a relationship
between savings and annual income. The same trend can be proved in every
level of income. As the income progresses the savings also increases.

239
Chi-Square Tests
Value df Statistical Inference
Pearson Chi-Square 199.424 9 P<0.01
Significant
The association between savings and annual income is tested using
chi square test. The results above indicate (P<0.01) that that there is a
significant relationship between savings and Annual income.
ASSOCIATION BETWEEN NUMBER OF DEPENDENTS AND SAVINGS
The number of dependents in is an important consideration in the
savings of the household. The higher the number of dependents the higher
will be the economic burden and hence the savings may be lower. At the
same time the dependents’ age is a factor to be considered. If the dependents
are relatively young there could be more savings for securing their future.
Hence the effect of dependents on the savings of an individual are analysed.
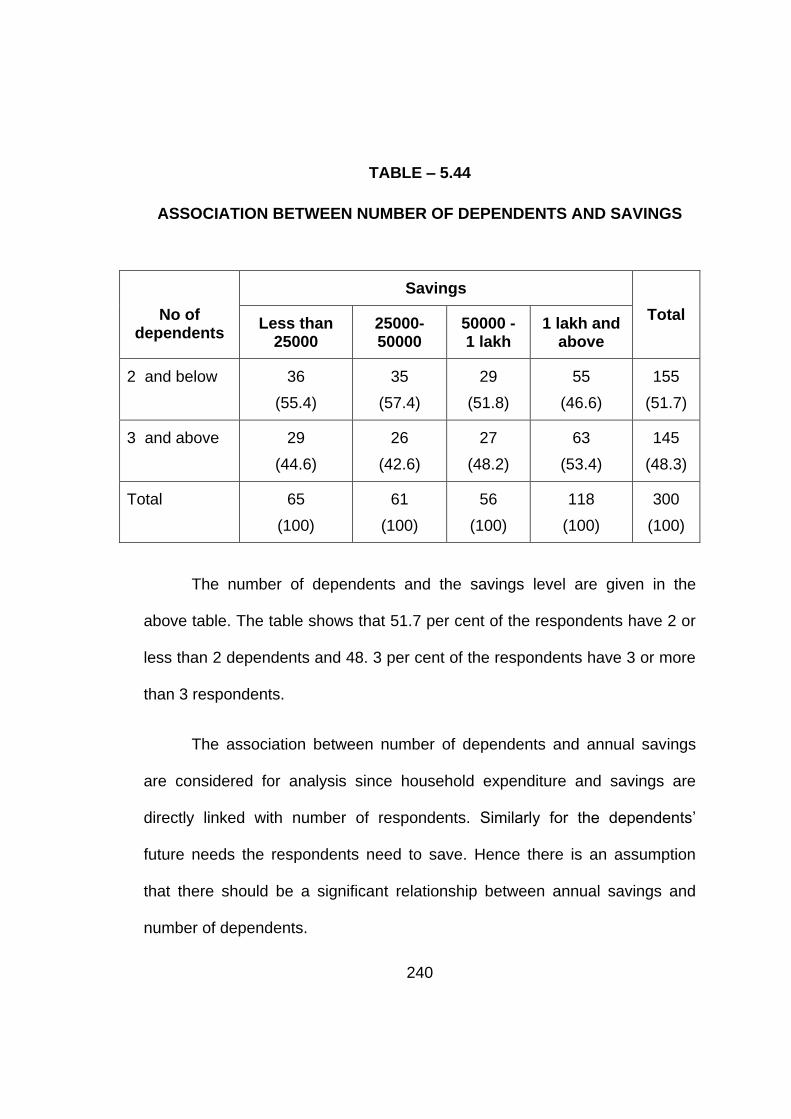
240
TABLE – 5.44
ASSOCIATION BETWEEN NUMBER OF DEPENDENTS AND SAVINGS
No of dependents
Savings
Total Less than
25000 25000-50000
50000 - 1 lakh
1 lakh and above
2 and below 36
(55.4)
35
(57.4)
29
(51.8)
55
(46.6)
155
(51.7)
3 and above 29
(44.6)
26
(42.6)
27
(48.2)
63
(53.4)
145
(48.3)
Total 65
(100)
61
(100)
56
(100)
118
(100)
300
(100)
The number of dependents and the savings level are given in the
above table. The table shows that 51.7 per cent of the respondents have 2 or
less than 2 dependents and 48. 3 per cent of the respondents have 3 or more
than 3 respondents.
The association between number of dependents and annual savings
are considered for analysis since household expenditure and savings are
directly linked with number of respondents. Similarly for the dependents’
future needs the respondents need to save. Hence there is an assumption
that there should be a significant relationship between annual savings and
number of dependents.

241
Chi-Square Tests
Value df Statistical Inference
Pearson Chi-Square 2.365 3 P>0.05
Not significant
The results of the chi square test above (P>0.05) reveals that savings
does not differ significantly between respondents having different number of
respondents.
TABLE – 5.45
ASSOCIATION BETWEEN ACADEMIC QUALIFICATION AND SAVINGS
Academic qualification
Savings
Total Less than
25000 25000-50000
50000 - 1 lakh
1 lakh and above
School final 1
(1.5)
0
(0)
5
(8.9)
16
(13.5)
22
(7.3)
Graduate 37
(57.0)
38
(62.3)
16
(28.6)
33
(28.0)
124
(41.3)
Post graduate 22
(33.8)
8
(13.1)
16
(28.6)
35
(29.7)
81
(27.0)
Professional 5
(7.7)
15
(24.6)
19
(33.9)
34
(28.8)
73
(24.4)
Total 65
(100)
61
(100)
56
(100)
118
(100)
300
(100)

242
It is evident from the above table 5.45 that out of 300 respondents, 118
are saving more than 1 lakh per annum. Out of 118 respondents who save
more than one lakh per annum 29.7 per cent are from the category of Post
Graduates, followed by 28.8 per cent of Professionals, 28 per cent graduates
and 13.5 per cent school final or metric. But the interest finding is that among
22 who are qualified only up to school final, 16 of them constituting the
majority are able to save more than a lakh per annum. Similarly among the
65 respondents who save less than 25000 per annum, a majority are
graduates followed by post graduates and professionals.
With a view to analyse the relationship between the two variables
namely qualification and savings chi square test is used.
Chi-Square Tests
Value Df Statistical Inference
Pearson Chi-Square 47.832 9 P<0.001
Significant
The above table shows that savings differ significantly between
investors belonging to the different categories of educational qualification.

243
5.10 ASSOCIATION BETWEEN AVERAGE RATE OF RETURN AND
OTHER VARIABLES
The factors which contribute to the returns of the investors are
analysed from different angles such as age of the respondents, experience in
the stock market and leverage in investing. The above three factors are
analysed using chi square test and the following tables are provided for the
purpose of analysis.
Table – 5.46 Average Rate of Return Vs Age
Table – 5.47 Average Rate of Return Vs Experience in Stock Market
Table – 5.48 Average Rate of Return Vs Borrow and Invest in Stock Market
TABLE – 5.46
AVERAGE RATE OF RETURN Vs AGE
Average Rate
Age
Total Less than 30 30-45 45-60 above 60
Below 10% 2
(7.7)
17
(16.2)
11
(8.7)
2
(4.8)
32
(10.7)
10-20 % 7
(26.9)
44
(42.0)
27
(21.3)
11
(26.2)
89
(29.7)
Above 20% 11
(42.3)
39
(37.0)
53
(41.7)
14
(33.3)
117
(39.0)
Net loss 6
(23.1)
5
(4.8)
36
(28.3)
15
(35.7)
62
(20.6)
Total 26
(100)
105
(100)
127
(100)
42
(100)
300
(100)

244
The above table 5.46 shows the average rate of return earned by
investors in different age groups. Age of the investors is an important factor to
be considered in evaluating investment behaviour. Hence age is taken for the
purpose of analyzing its influence on the investment behaviour and
particularly in the rate of return.
In the age group of less than 30, 42.3 per cent earn more than 20 per
cent and 23.1 per cent incur loss. Among the respondents in the age group of
30-45, 37 per cent earn more than 20 per cent and only 4.8 per cent incur
loss. Loss percentage is the highest among the respondents who are above
60 years old.
Chi-Square Tests
Value Df Statistical Inference
Pearson Chi-Square 35.540 9 P < 0.001
Significant
The chi square test value reveals there is a significant relationship
between age of the respondents and rate of return.
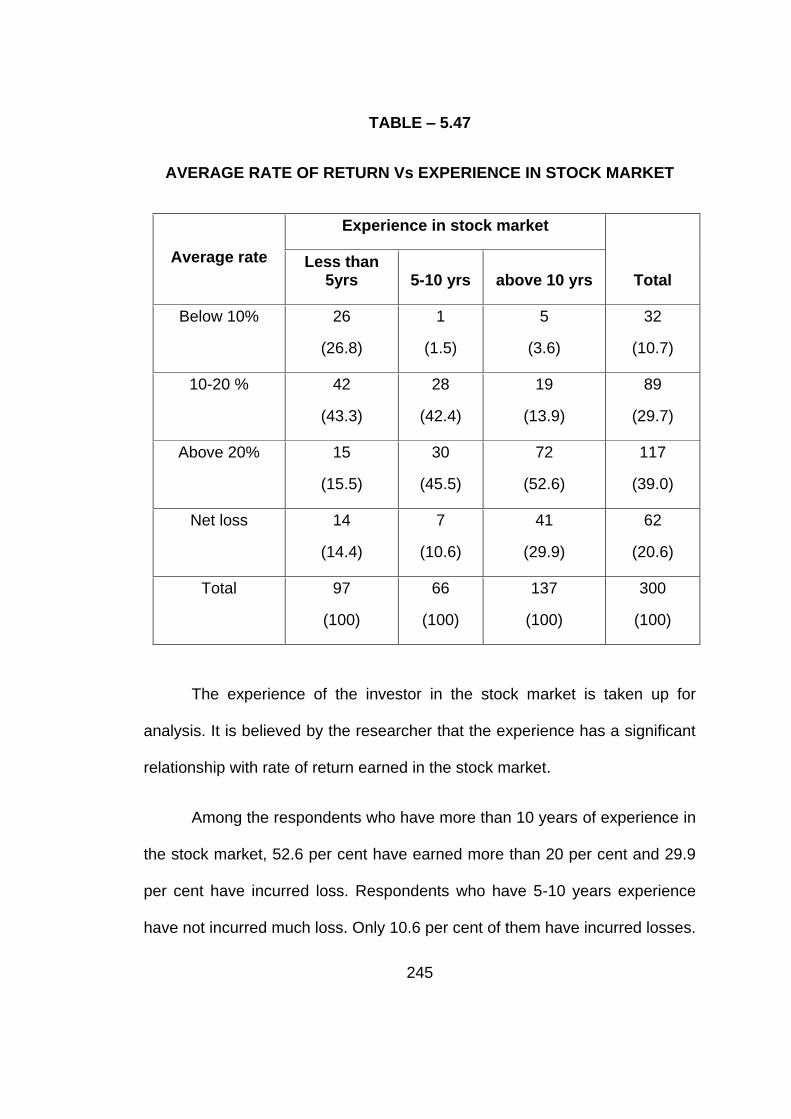
245
TABLE – 5.47
AVERAGE RATE OF RETURN Vs EXPERIENCE IN STOCK MARKET
Average rate
Experience in stock market
Total Less than
5yrs 5-10 yrs above 10 yrs
Below 10% 26
(26.8)
1
(1.5)
5
(3.6)
32
(10.7)
10-20 % 42
(43.3)
28
(42.4)
19
(13.9)
89
(29.7)
Above 20% 15
(15.5)
30
(45.5)
72
(52.6)
117
(39.0)
Net loss 14
(14.4)
7
(10.6)
41
(29.9)
62
(20.6)
Total 97
(100)
66
(100)
137
(100)
300
(100)
The experience of the investor in the stock market is taken up for
analysis. It is believed by the researcher that the experience has a significant
relationship with rate of return earned in the stock market.
Among the respondents who have more than 10 years of experience in
the stock market, 52.6 per cent have earned more than 20 per cent and 29.9
per cent have incurred loss. Respondents who have 5-10 years experience
have not incurred much loss. Only 10.6 per cent of them have incurred losses.
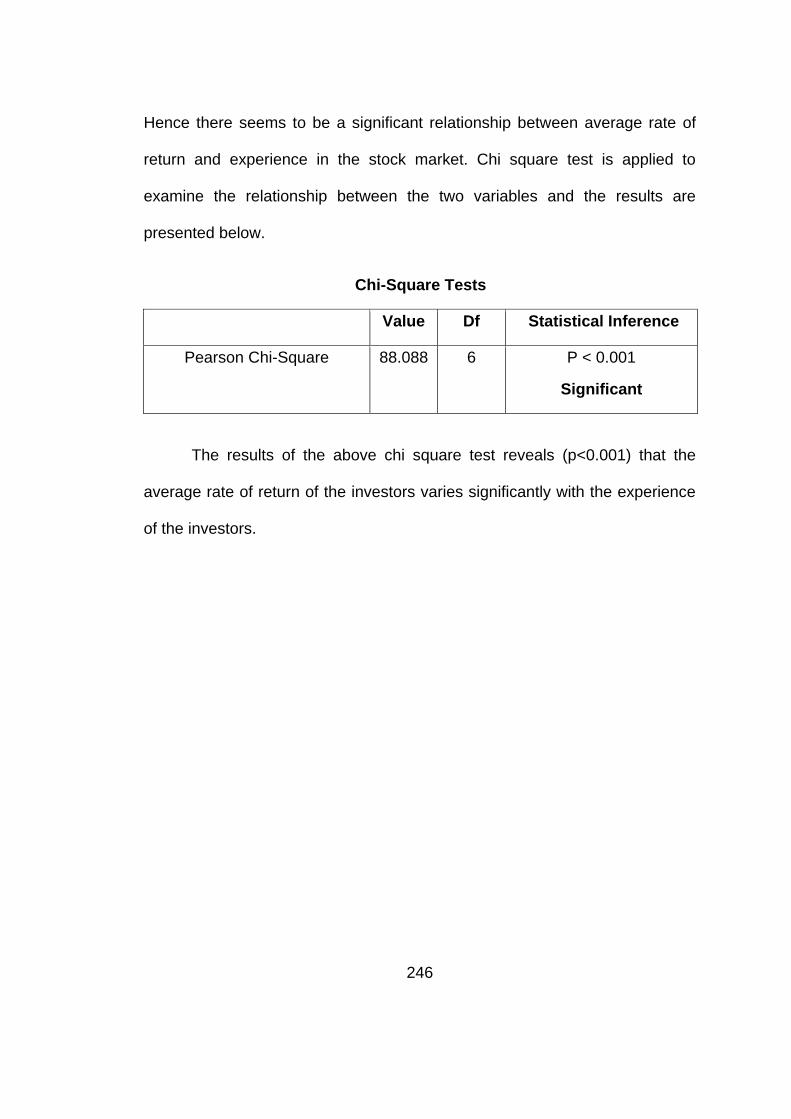
246
Hence there seems to be a significant relationship between average rate of
return and experience in the stock market. Chi square test is applied to
examine the relationship between the two variables and the results are
presented below.
Chi-Square Tests
Value Df Statistical Inference
Pearson Chi-Square 88.088 6 P < 0.001
Significant
The results of the above chi square test reveals (p<0.001) that the
average rate of return of the investors varies significantly with the experience
of the investors.

247
TABLE – 5.48
AVERAGE RATE OF RETURN Vs BORROW AND INVEST IN STOCK MARKET
Average Rate Borrow and invest in
stock market Total
Yes No
Below 10% 4
(16.7)
28
(10.1)
32
(10.7)
10-20 % 9
(37.5)
80
(29.0)
89
(29.7)
Above 20% 11
(45.8)
106
(38.4)
117
(39.0)
Net loss 0
(0)
62
(22.5)
62
(20.6)
Total 24
(100)
276
(100)
300
(100)
The above table 5.48 shows the rate of return earned by the investors
classified on the basis of their borrowing for investment in stock market. The
above table shows that out of the 276 investors who do not borrow for
investing, 106 respondents earn more than 20 per cent. Out of the 24
investors who borrow and invest none of them have incurred losses. Whereas
62 respondents belonging to the category of no – borrowing have lost in the
stock market. The average rate of return and leverage in investing is tested
for finding out any significant relationship as per the table given below.

248
Chi-Square Tests
Value df Statistical Inference
Pearson Chi-Square 7.124 3 P > 0.05
Not Significant
The results of the chi square test reveal that there is no significant
relationship between the two variables.
5.11 ASSOCIATION BETWEEN DEMOGRAPHIC FACTORS
INVESTMENT CHARACTERISTICS
The different characteristic features in the investments of the
respondents namely diversification, and leverage in investing are separately
associated with demographic factors namely age, annual income, occupation
and qualification to explore any significant relationships between them. The
following tables provide the results for the same.
Table – 5.49 Diversification of Portfolio Vs Age
Table – 5.50 Diversification of Portfolio Vs Annual Income
Table – 5.51 Diversification of Portfolio Vs Occupation
Table – 5.52 Diversification of Portfolio Vs Academic Qualification
Table – 5.53 Borrow and Invest in Stock Market Vs Age
Table – 5.54 Borrow and Invest in Stock Market Vs Annual Income
Table – 5.55 Borrow and Invest in Stock Market Vs Occupation
Table – 5.56 Borrow and Invest in Stock Market Vs Academic Qualification
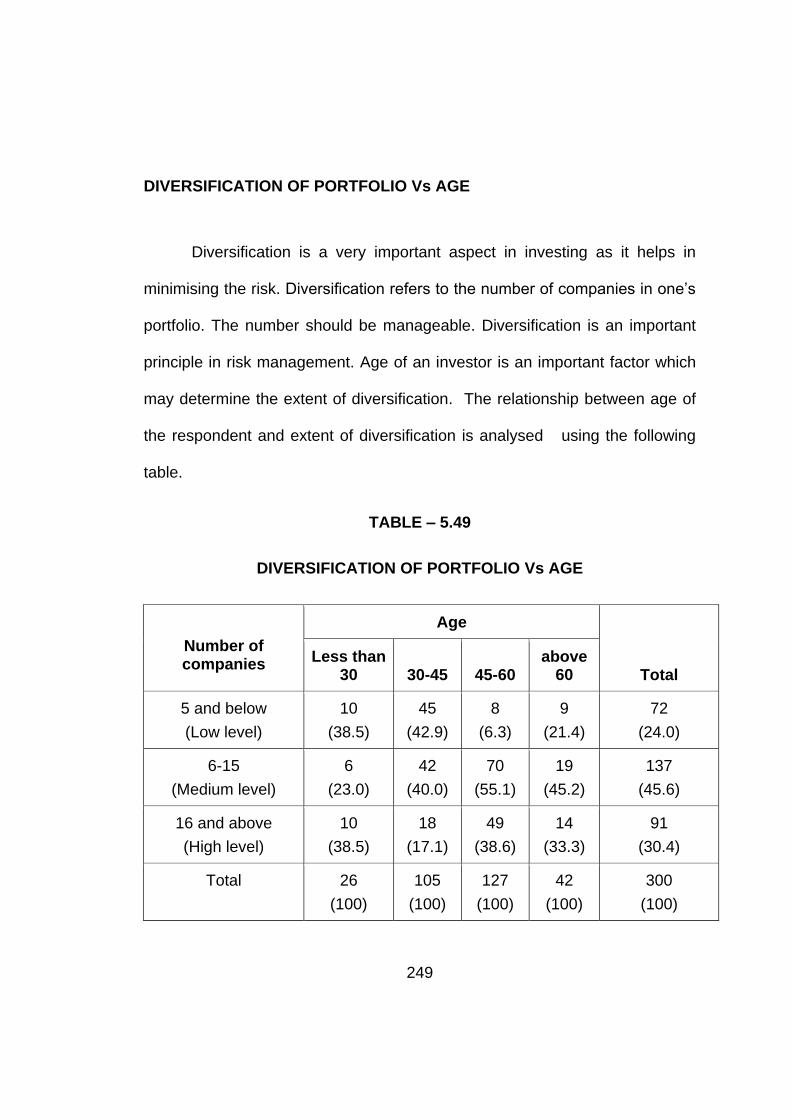
249
DIVERSIFICATION OF PORTFOLIO Vs AGE
Diversification is a very important aspect in investing as it helps in
minimising the risk. Diversification refers to the number of companies in one’s
portfolio. The number should be manageable. Diversification is an important
principle in risk management. Age of an investor is an important factor which
may determine the extent of diversification. The relationship between age of
the respondent and extent of diversification is analysed using the following
table.
TABLE – 5.49
DIVERSIFICATION OF PORTFOLIO Vs AGE
Number of companies
Age
Total Less than
30 30-45 45-60 above
60
5 and below
(Low level)
10
(38.5)
45
(42.9)
8
(6.3)
9
(21.4)
72
(24.0)
6-15
(Medium level)
6
(23.0)
42
(40.0)
70
(55.1)
19
(45.2)
137
(45.6)
16 and above
(High level)
10
(38.5)
18
(17.1)
49
(38.6)
14
(33.3)
91
(30.4)
Total 26
(100)
105
(100)
127
(100)
42
(100)
300
(100)

250
The table 5.49 shows the number of companies in the investment portfolio
of the respondents classified on the basis of their age. There is a greater degree
of diversification as indicated by the above table. In all age groups investors have
gone in for a medium to a higher degree of diversification. Out of 300
respondents, 137 respondents have gone in for a medium level of diversification.
With a view to find out the relationship between level of diversification and the
age group of the respondents, chi square analysis is done.
Chi-Square Tests
Value Df Statistical Inference
Pearson Chi-Square 50.211 6 P < 0.001 Significant
The chi square test reveals that the extent of diversification varies
between different age groups.

251
DIVERSIFICATION VS ANNUAL INCOME
Annual Income determines many important factors in investing. Hence
the relationship between annual income and diversification is tested. The
table below shows the annual income of the respondents and the degree of
diversification.
TABLE – 5.50
DIVERSIFICATION Vs ANNUAL INCOME
No of companies
Annual income
Below 2 lakhs
2-4 Lakhs
4-6 Lakhs
6 Lakhs and above Total
5 and below
(Low level)
21
(26.3)
34
(28.1)
12
(41.4)
5
(7.1)
72
(24.0)
6-15
(Medium level)
52
(65.0)
57
(47.1)
8
(27.6)
20
(28.6)
137
(45.7)
16 and above
(High level)
7
(8.7)
30
(24.8)
9
(31.0)
45
(64.3)
91
(30.3)
Total 80
(100)
121
(100)
29
(100)
70
(100)
300
(100)
Table 5.50 shows that 65 % of the respondents in the income category
of below 2 lakhs per annum have medium level of diversification. Similarly
47.1 per cent of the respondents in the income level of 2-4 lakhs have

252
medium level of diversification whereas 64.3 per cent of the respondents in
the income category of 6 lakhs and above have high level of diversification.
In order to analyse the relationship between income and the extent of
diversification, chi square test is used.
Chi-Square Tests
Value df Statistical Inference
Pearson Chi-Square 66.229 6 P < 0.001
Significant
The chi square test revealed that there is a significant relationship
between income levels of the respondents and the extent of diversification.
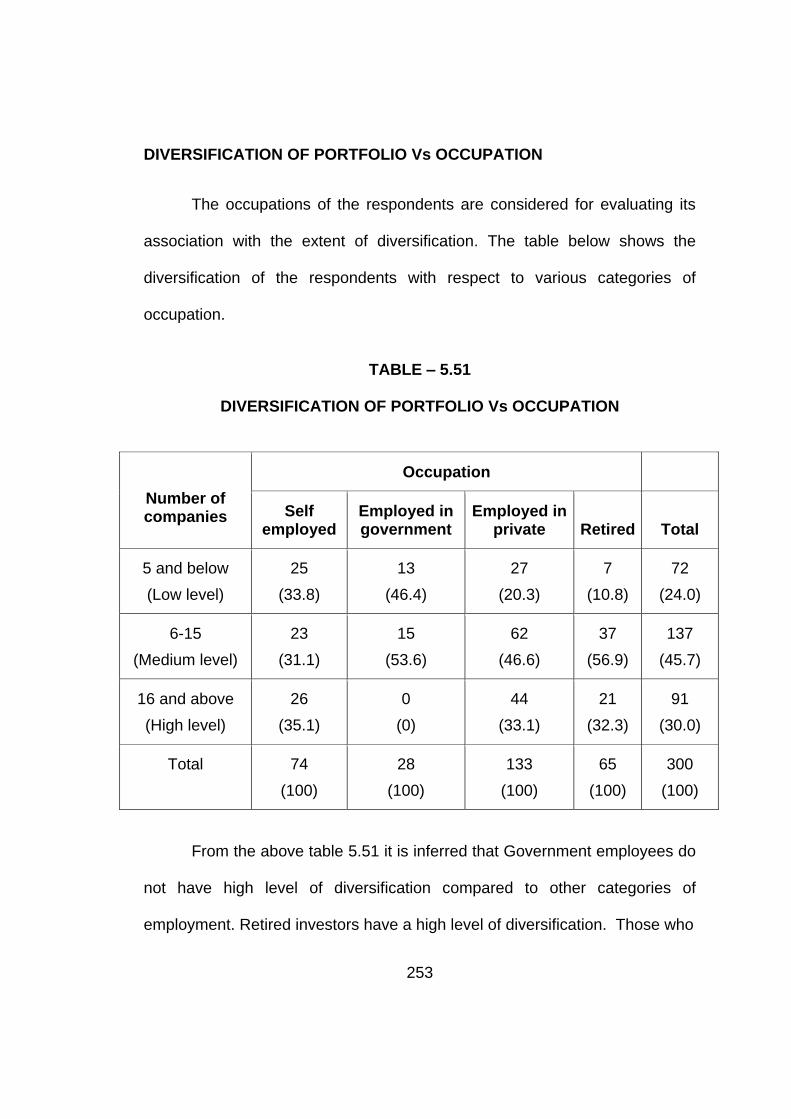
253
DIVERSIFICATION OF PORTFOLIO Vs OCCUPATION
The occupations of the respondents are considered for evaluating its
association with the extent of diversification. The table below shows the
diversification of the respondents with respect to various categories of
occupation.
TABLE – 5.51
DIVERSIFICATION OF PORTFOLIO Vs OCCUPATION
Number of companies
Occupation
Self employed
Employed in government
Employed in private Retired Total
5 and below
(Low level)
25
(33.8)
13
(46.4)
27
(20.3)
7
(10.8)
72
(24.0)
6-15
(Medium level)
23
(31.1)
15
(53.6)
62
(46.6)
37
(56.9)
137
(45.7)
16 and above
(High level)
26
(35.1)
0
(0)
44
(33.1)
21
(32.3)
91
(30.0)
Total 74
(100)
28
(100)
133
(100)
65
(100)
300
(100)
From the above table 5.51 it is inferred that Government employees do
not have high level of diversification compared to other categories of
employment. Retired investors have a high level of diversification. Those who

254
are employed in private have the maximum level of diversification. In order to
understand the relationship between occupation and diversification chi square
test is applied.
Chi-Square Tests
Value Df Statistical Inference
Pearson Chi-Square 29.451 6 P < 0.001
Significant
The chi square test above reveals that there is significant relationship
between occupation and extent of diversification.

255
DIVERSIFICATION OF PORTFOLIO Vs ACADEMIC QUALIFICATION
The number of companies in a portfolio signifies the extent of
diversification. It should be neither too low nor high. When it is high it
becomes unmanageable and when it is low it is risky. The academic level of
investors may influence the extent of diversification. Hence an analysis is
made to find out the relationship between academic qualification and the
diversification of portfolio.
TABLE – 5.52
DIVERSIFICATION OF PORTFOLIO Vs ACADEMIC QUALIFICATION
Number of companies
Academic qualification
Total School
final Graduate Post
graduate Professional
5 and below
(Low level)
7
(31.8)
14
(11.3)
21
(25.9)
30
(41.1)
72
(24.0)
6-15
(Medium level)
3
(13.6)
81
(65.3)
35
(43.2)
18
(24.7)
137
(45.7)
16 and above
(High level)
12
(54.5)
29
(23.4)
25
(30.9)
25
(34.2)
91
(30.3)
Total 22
(100)
124
(100)
81
(100)
73
(100)
300
(100)
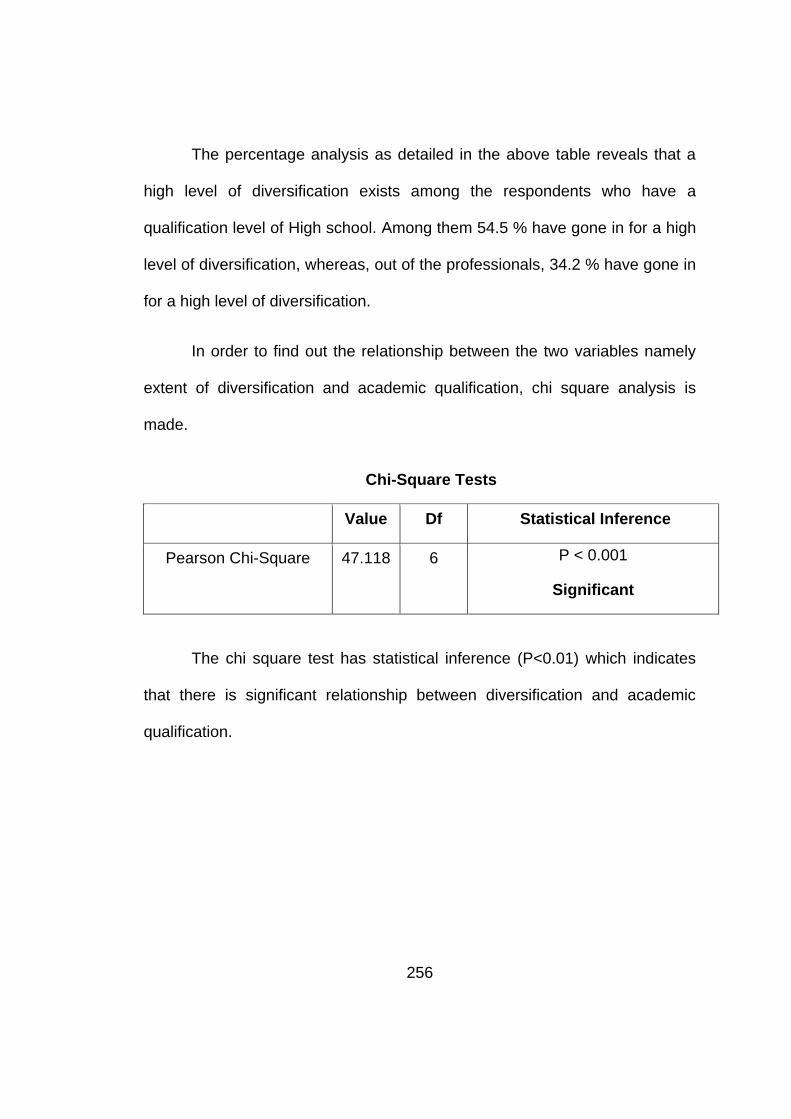
256
The percentage analysis as detailed in the above table reveals that a
high level of diversification exists among the respondents who have a
qualification level of High school. Among them 54.5 % have gone in for a high
level of diversification, whereas, out of the professionals, 34.2 % have gone in
for a high level of diversification.
In order to find out the relationship between the two variables namely
extent of diversification and academic qualification, chi square analysis is
made.
Chi-Square Tests
Value Df Statistical Inference
Pearson Chi-Square 47.118 6 P < 0.001
Significant
The chi square test has statistical inference (P<0.01) which indicates
that there is significant relationship between diversification and academic
qualification.

257
LEVERAGE (BORROW AND INVEST IN STOCK MARKET) VS AGE
Borrowing and investing in stock market i.e. making use of leveraging
shows a high degree of risk appetite in the investors. The analysis reveals
that 92 per cent of the investors do not borrow for the purpose of investing.
This variable is analysed with the demographic factors namely age, annual
income, occupation and academic qualification.
TABLE – 5.53
BORROW AND INVEST IN STOCK MARKET Vs AGE
Borrow and invest in stock market
Age
Total
Less than
30 30-45 45-60 above
60
Yes 3
(11.5)
8
(7.6)
9
(7.1)
4
(9.5)
24
(8.0)
No 23
(88.5)
97
(92.4)
118
(92.9)
38
(90.5)
276
(92.0)
Total 26
(100)
105
(100)
127
(100)
42
(100)
300
(100)
The above table 5.53 shows the number of investors in this category
based on their age. Among the respondents, the age group of less than 30
shows a high level of leverage (11.5) compared to other categories. The age
of the investors and the financial leverage is tested for finding out any
significant relationship.

258
Chi-Square Tests
Value df Statistical Inference
Pearson Chi-Square .739 3 P > 0.05
Not Significant
The results of the chi square test reveals that leverage in investing
does not vary significantly between the age groups mentioned above.
BORROW AND INVEST IN STOCK MARKET Vs ANNUAL INCOME
As the income increases the risk taking ability also increases. Hence
the association between annual income and leveraging is analysed with the
help of the following table.
TABLE – 5.54
BORROW AND INVEST IN STOCK MARKET Vs ANNUAL INCOME
Borrow and invest in stock
market
Annual income
Total Below 2
lakhs 2-4 Lakhs 4-6 Lakhs 6 Lakhs
and above
Yes 5
(6.2)
12
(9.9)
4
(13.8)
3
(4.3)
24
(8.0)
No 75
(93.8)
109
(90.1)
25
(86.2)
67
(95.7)
276
(92.0)
Total 80
(100)
121
(100)
29
(100)
70
(100)
300
(100)

259
The above table 5.54 shows the number of respondents who borrow
and invest and those who do not borrow classified on the basis of their annual
income. A higher level of leveraging (13.8 %) is found in respondents in the
category of 4-6 lakhs. The relationship between annual income and leverage
in investment is tested using chi square tests.
Chi-Square Tests
Value Df Statistical Inference
Pearson Chi-Square 3.572 3 P > 0.05
Not Significant
The results of the chi square test above (P>0.05) indicates there is no
significant relationship between the annual income and leverage in
investment.
BORROW AND INVEST IN STOCK MARKET Vs OCCUPATION
The relationship between occupation of the respondents and
leveraging is found in this analysis. The table below shows the extent of
leveraging by respondents belonging to different occupations.
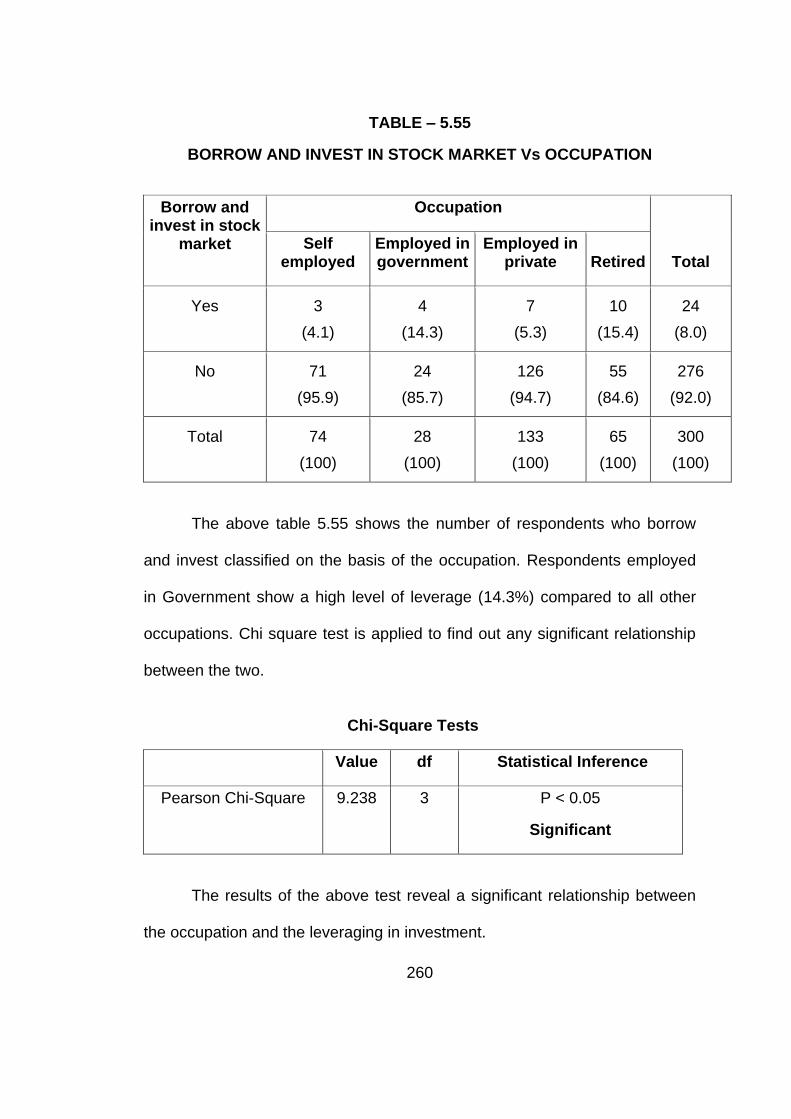
260
TABLE – 5.55
BORROW AND INVEST IN STOCK MARKET Vs OCCUPATION
Borrow and invest in stock
market
Occupation
Total Self
employed Employed in government
Employed in private Retired
Yes 3
(4.1)
4
(14.3)
7
(5.3)
10
(15.4)
24
(8.0)
No 71
(95.9)
24
(85.7)
126
(94.7)
55
(84.6)
276
(92.0)
Total 74
(100)
28
(100)
133
(100)
65
(100)
300
(100)
The above table 5.55 shows the number of respondents who borrow
and invest classified on the basis of the occupation. Respondents employed
in Government show a high level of leverage (14.3%) compared to all other
occupations. Chi square test is applied to find out any significant relationship
between the two.
Chi-Square Tests
Value df Statistical Inference
Pearson Chi-Square 9.238 3 P < 0.05
Significant
The results of the above test reveal a significant relationship between
the occupation and the leveraging in investment.

261
BORROW AND INVEST IN STOCK MARKET Vs ACADEMIC
QUALIFICATION
Academic qualification is an important demographic factor which
increases the level of awareness of the population. This variable is analysed
with leveraging in investment to find out any relationship between the two.
TABLE – 5.56
BORROW AND INVEST IN STOCK MARKET Vs ACADEMIC
QUALIFICATION
Borrow and invest in stock
market
Academic qualification
Total School
final Graduate Post
graduate Professional
Yes 3
(13.6)
14
(11.3)
5
(6.2)
2
(2.7)
24
(8.0)
No 19
(86.4)
110
(88.7)
76
(93.8)
71
(97.3)
276
(92.0)
Total 22
(100)
124
(100)
81
(100)
73
(100)
300
(100)
The above table 5.56 shows the leverage of the respondents in
different educational level. Among the different categories the respondents
who have completed up to High school take the maximum level of leverage
(13.6 %) followed by graduates (11.3%).

262
Chi square test is applied to find out any significant relationship
between the two variables and the results are given below.
Chi-Square Tests
Value Df Statistical Inference
Pearson Chi-Square 5.885 3 P > 0.05
Not Significant
The results of the chi square test mentioned above (P>0.05) reveal that
there is no significant relationship between the academic levels and
leveraging in investing.

263
5.12 RELATIONAL ANALYSIS
TABLE – 5.57
KARL PEARSON CORRELATION BETWEEN NUMBER OF DEPENDENTS
AND VARIOUS FACTORS
Correlation value Statistical
Inference
Preference for short term investing
-.240** P<0.01
Significant
Risk Tolerance -.199** P<0.01
Significant
Preference for short term investing: The above table 5.57 shows that there
is a negative correlation between number of dependents and preference for
short term investments i.e. the higher the number of dependents lower is the
preference for short term investing.
Risk tolerance: The above table shows that there is a negative correlation
between Risk tolerance and number of dependents i.e. the more the number
of dependents the lesser the risk tolerance.
*****************


![A6Ž5. OASg'2'. -k Jll -M' A49 ass:03-5216-4833 VEGETABLE ... · Jil 931. 5ffi No 7k - No 11 -Jil ,3U5. 8 25 A422]7 -27 26 S'.È4Sg._6 33 fi \ A6Ž5. OASg'2'. -k Jll -M' A49 ass:03-5216-4833](https://static.fdocuments.net/doc/165x107/5dd0dbf0d6be591ccb630c16/a65-oasg2-k-jll-m-a49-ass03-5216-4833-vegetable-jil-931-5ffi-no-7k.jpg)


