Chapter The Influence of Monetary and Fiscal Policy on Aggregate Demand 21.
37
Chapter The Influence of Monetary and Fiscal Policy on Aggregate Demand 21
-
Upload
joan-osborne -
Category
Documents
-
view
236 -
download
6
Transcript of Chapter The Influence of Monetary and Fiscal Policy on Aggregate Demand 21.

Chapter
The Influence of Monetaryand Fiscal Policy onAggregate Demand
21
Monetary Policy Influences Aggregate Demand
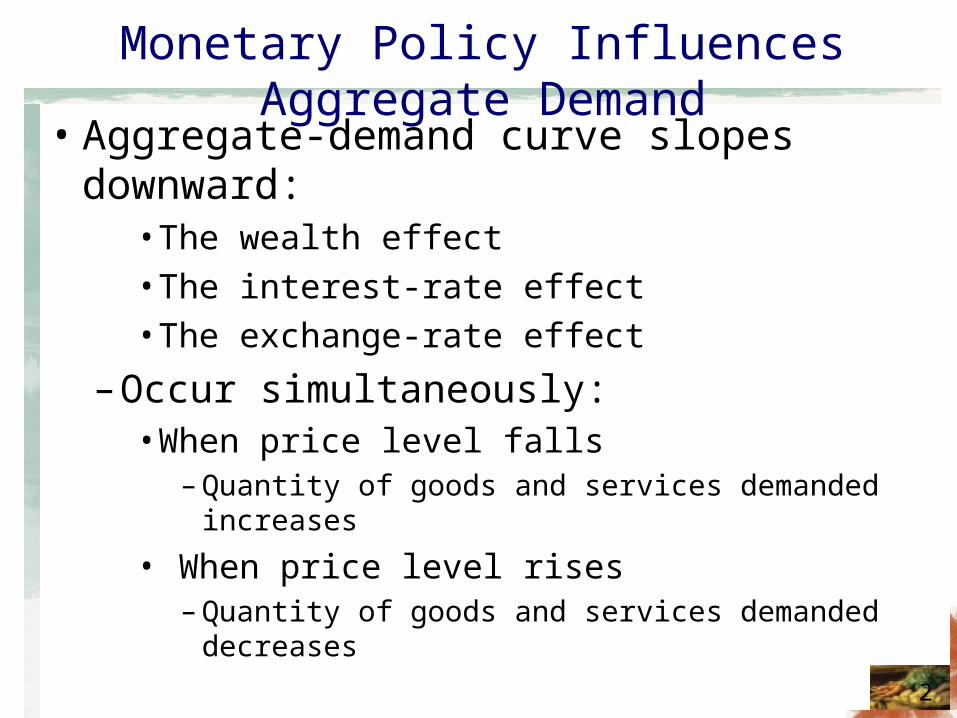
• Aggregate-demand curve slopes downward:• The wealth effect• The interest-rate effect• The exchange-rate effect
– Occur simultaneously:• When price level falls
– Quantity of goods and services demanded increases
• When price level rises– Quantity of goods and services demanded decreases
2
Monetary Policy Influences Aggregate Demand
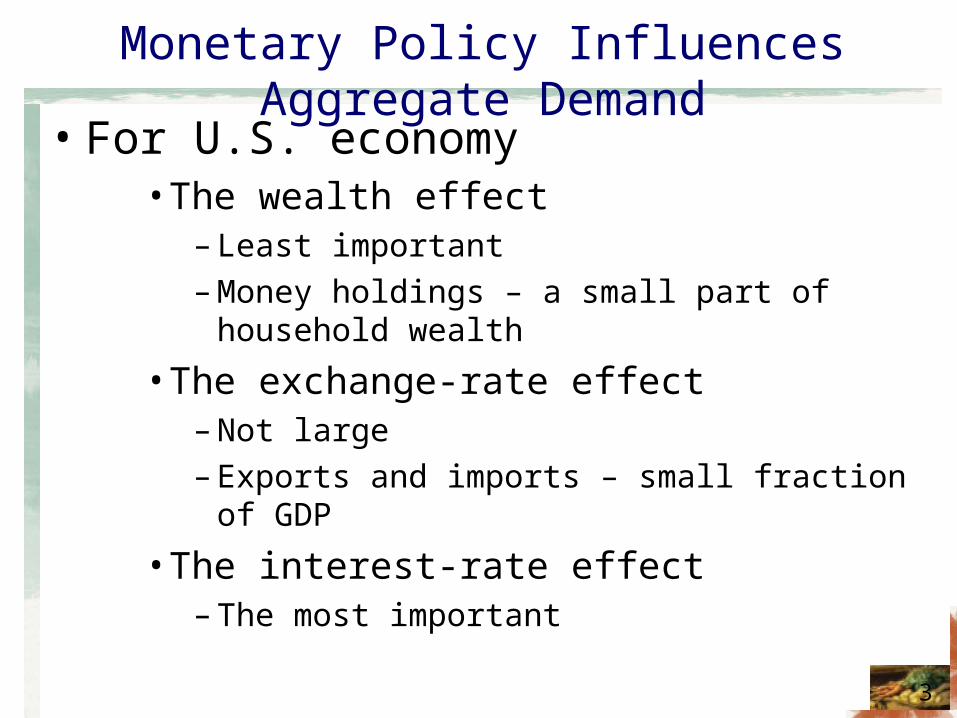
• For U.S. economy• The wealth effect
– Least important– Money holdings – a small part of household wealth
• The exchange-rate effect– Not large– Exports and imports – small fraction of GDP
• The interest-rate effect– The most important
3

Monetary Policy Influences Aggregate Demand
• The theory of liquidity preference– Keynes’s theory– Interest rate adjusts:
• To bring money supply and money demand into balance
– Nominal interest rate– Real interest rate
4
Monetary Policy Influences Aggregate Demand
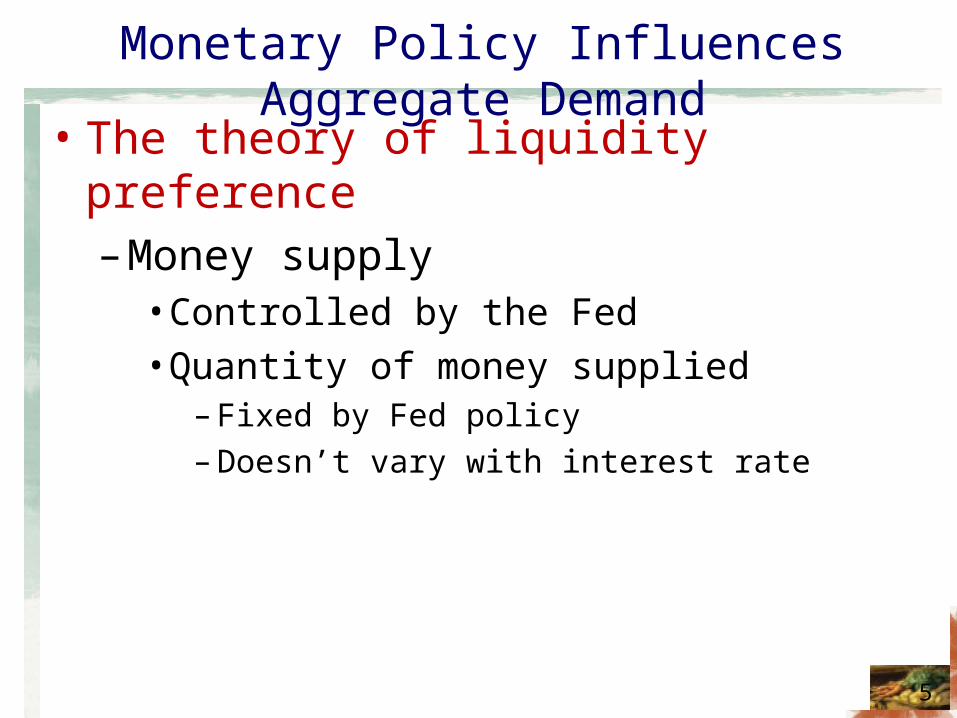
• The theory of liquidity preference– Money supply
• Controlled by the Fed• Quantity of money supplied
– Fixed by Fed policy – Doesn’t vary with interest rate
5
Monetary Policy Influences Aggregate Demand
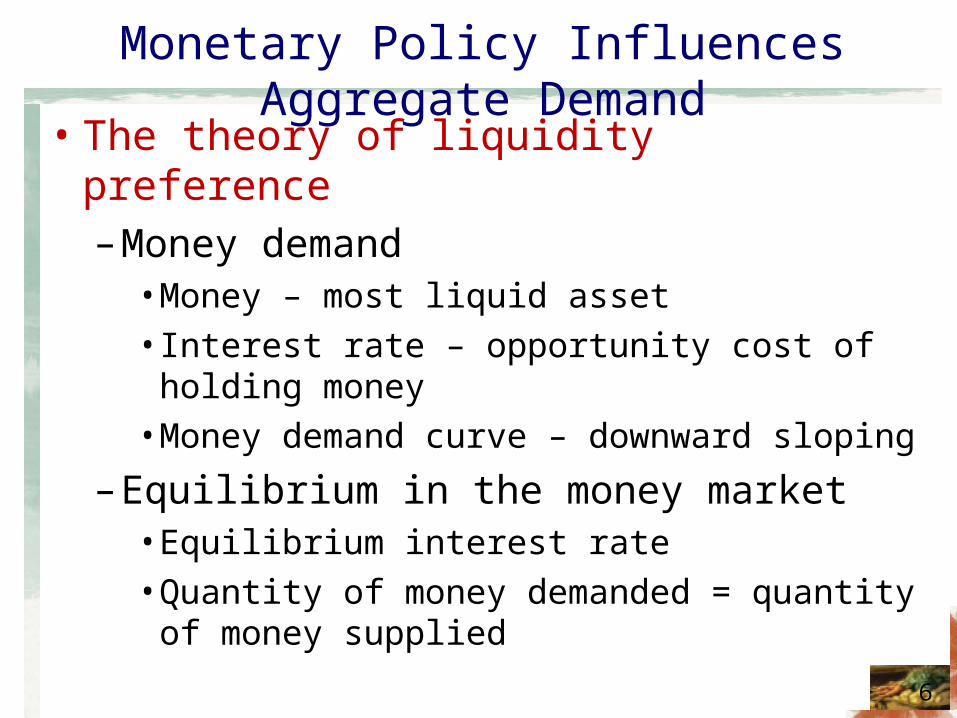
• The theory of liquidity preference– Money demand
• Money – most liquid asset• Interest rate – opportunity cost of holding money• Money demand curve – downward sloping
– Equilibrium in the money market• Equilibrium interest rate• Quantity of money demanded = quantity of
money supplied
6
Monetary Policy Influences Aggregate Demand
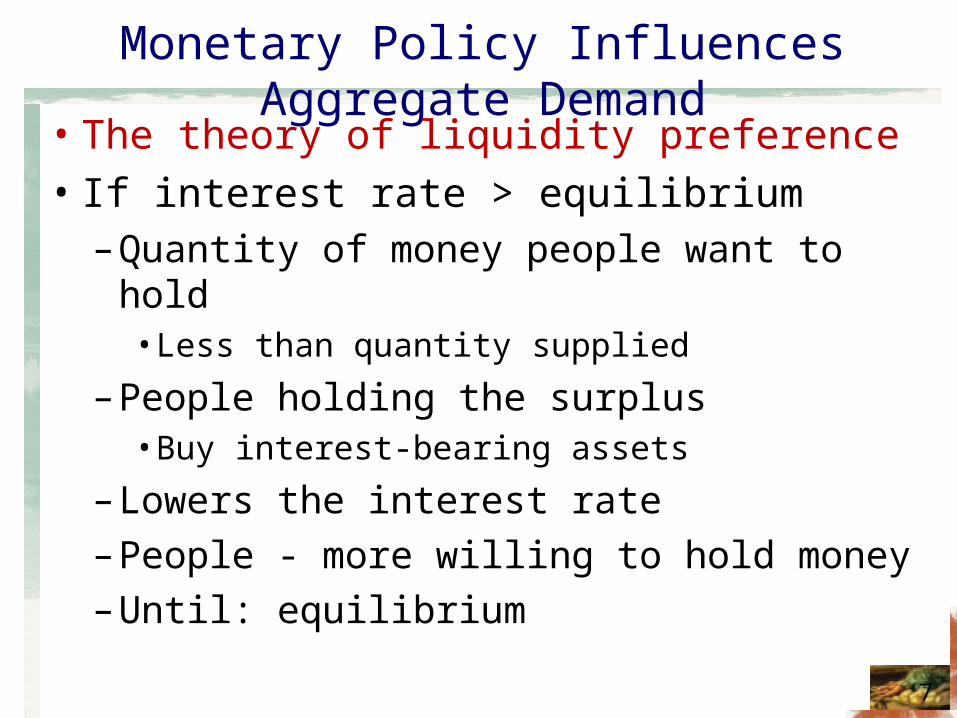
• The theory of liquidity preference• If interest rate > equilibrium
– Quantity of money people want to hold• Less than quantity supplied
– People holding the surplus• Buy interest-bearing assets
– Lowers the interest rate– People - more willing to hold money– Until: equilibrium
7
Monetary Policy Influences Aggregate Demand
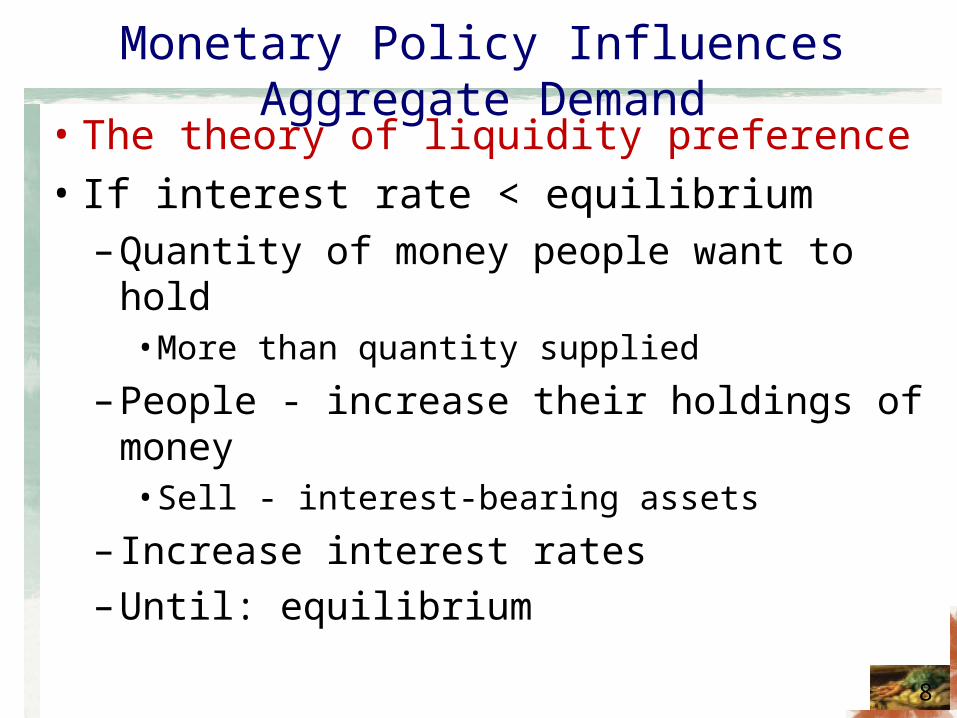
• The theory of liquidity preference• If interest rate < equilibrium
– Quantity of money people want to hold• More than quantity supplied
– People - increase their holdings of money• Sell - interest-bearing assets
– Increase interest rates– Until: equilibrium
8

Figure
Equilibrium in the money market
1
9
Interestrate
Quantity of Money
r1
Moneydemand
Md1
According to the theory of liquidity preference, the interest rate adjusts to bring the quantity of money supplied and the quantity of money demanded into balance. If the interest rate is above the equilibrium level (such as at r1), the quantity of money people want to hold (Md1) is less than the quantity the Fed has created, and this surplus of money puts downward pressure on the interest rate. Conversely, if the interest rate is below the equilibrium level (such as at r2), the quantity of money people want to hold (Md2) is greater than the quantity the Fed has created, and this shortage of money puts upward pressure on the interest rate. Thus, the forces of supply and demand in the market for money push the interest rate toward the equilibrium interest rate, at which people are content holding the quantity of money the Fed has created.
r2
Md2
Money supply
Quantity Fixed by the Fed
EquilibriumInterest rate

Monetary Policy Influences Aggregate Demand
• The downward slope of the aggregate-demand curve
1.A higher price level– Raises money demand
2.Higher money demand– Leads to a higher interest rate
3.A higher interest rate– Reduces the quantity of goods and services
demanded10
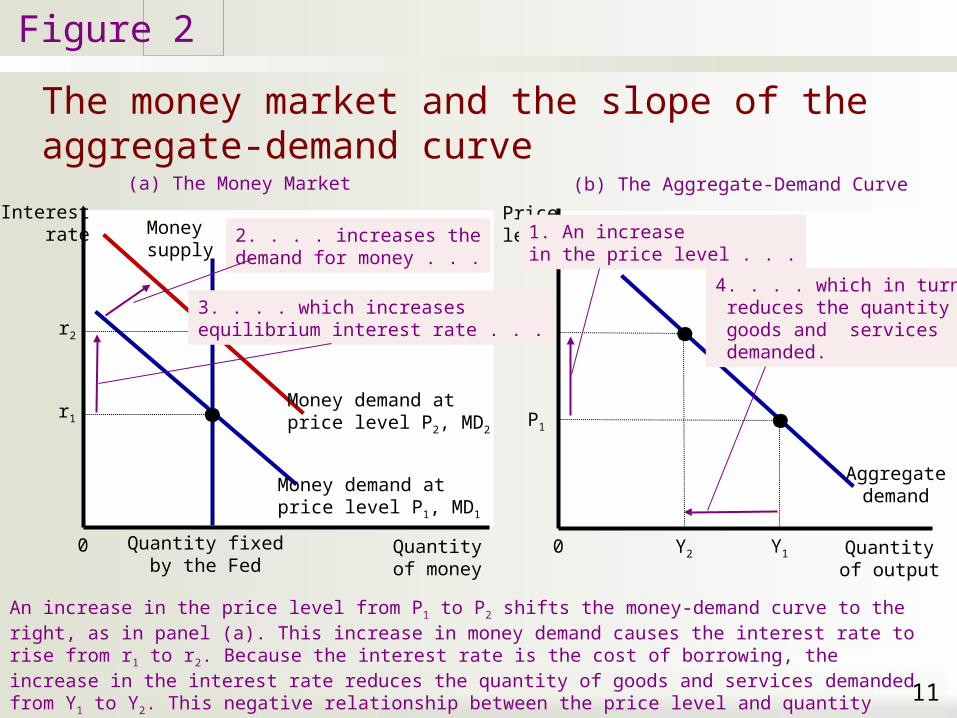
Figure
The money market and the slope of the aggregate-demand curve
2
11
Interestrate
An increase in the price level from P1 to P2 shifts the money-demand curve to the right, as in panel (a). This increase in money demand causes the interest rate to rise from r1 to r2. Because the interest rate is the cost of borrowing, the increase in the interest rate reduces the quantity of goods and services demanded from Y1 to Y2. This negative relationship between the price level and quantity demanded is represented with a downward-sloping aggregate-demand curve, as in panel (b).
Quantityof money
0
(a) The Money Market
Pricelevel
Quantityof output
0
(b) The Aggregate-Demand Curve
Aggregatedemand
P2
Money demand atprice level P1, MD1
Moneysupply
Quantity fixedby the Fed
Money demand atprice level P2, MD2
r2
r1
Y2
P1
Y1
1. An increasein the price level . . .
2. . . . increases thedemand for money . . .
3. . . . which increasesequilibrium interest rate . . .
4. . . . which in turn reduces the quantity of goods and services demanded.
Monetary Policy Influences Aggregate Demand
• Changes in the money supply• Aggregate-demand curve shifts
– Quantity of goods and services demanded changes
– For a given price level• Monetary policy
– Shifts aggregate-demand curve
12

Monetary Policy Influences Aggregate Demand
• Changes in the money supply• Monetary policy: the Fed increases the
money supply– Money-supply curve shifts right– Interest rate falls– At any given price level
• Increase in quantity demanded of goods and services
– Aggregate-demand curve shifts right
13

Figure
A monetary injection
3
14
Interestrate
In panel (a), an increase in the money supply from MS1 to MS2 reduces the equilibrium interest rate from r1 to r2. Because the interest rate is the cost of borrowing, the fall in the interest rate raises the quantity of goods and services demanded at a given price level from Y1 to Y2. Thus, in panel (b), the aggregate-demand curve shifts to the right from AD1 to AD2.
Quantityof money
0
(a) The Money MarketPricelevel
Quantity of output0
(b) The Aggregate-Demand Curve
Aggregatedemand, AD1
Money demandat price level P
Money supply, MS1
r1
Y1
P
1. When the Fedincreases themoney supply . . .
MS2
r2
AD2
Y22. . . . the equilibriuminterest rate falls . . .
3. . . . which increases the quantity of goods and services demanded at a given price level.
Monetary Policy Influences Aggregate Demand
• Changes in the money supply• Monetary policy: the Fed decreases the
money supply– Money-supply curve shifts left– Interest rate increases– At any given price level
• Decrease in quantity demanded of goods and services
– Aggregate-demand curve shifts left
15

Monetary Policy Influences Aggregate Demand
• The role of interest-rate targets in Fed policy• Federal funds rate
– Interest rate– Banks charge one another– For short-term loans
• The Fed– Targets the federal funds rate
• The FOMC – open-market operations – Adjust money supply
16
Monetary Policy Influences Aggregate Demand
• Changes in monetary policy– Aimed at expanding aggregate demand
• Increasing the money supply• Lowering the interest rate
• Changes in monetary policy– Aimed at contracting aggregate demand
• Decreasing the money supply• Raising the interest rate
17

• The Fed– Not interested in stock prices themselves– Monitor and respond to
• Developments the overall economy
• Stock market boom– Households – wealthier
• Stimulates consumer spending
– Firms – want to sell new shares of stock• Stimulates investment spending• Cash from stock used for I financing instead of loans
– Aggregate demand – increases
Why the Fed watches the stock market (and vice versa)
18

• The Fed’s goal– Stabilize aggregate demand
• The Fed’s response to a stock-market boom– Keep money supply lower– Keep interest rates higher
• The Fed’s response to a stock-market fall– Increase money supply– Lower interest rates
Why the Fed watches the stock market (and vice versa)
19

• Stock-market participants– Keep an eye on the Fed– The Fed can
• Influence interest rates and economic activity• Alter the value of stocks
• The Fed - raises interest rates– Less attractive owning stocks
• Bonds - earning a higher return• Smaller stock prices
– Reduced demand for goods and services
Why the Fed watches the stock market (and vice versa)
20

Fiscal Policy Influences Aggregate Demand
• Fiscal policy– Government policymakers– Set the level of government spending and
taxation• Changes in government purchases
– Shift the aggregate demand directly• Multiplier effect• Crowding-out effect
21

Fiscal Policy Influences Aggregate Demand
• The multiplier effect– Additional shifts in aggregate demand
• Result when expansionary fiscal policy increases income
– And thereby increases consumer spending
• Increase in government purchases– $20 billion
• Aggregate-demand curve – shifts right– By exactly $20 billion
• Consumers respond: increase spending• Aggregate-demand curve – shifts right again
22

Figure
The multiplier effect
4
23
Pricelevel
Quantity of Output
Aggregate demand, AD1
An increase in government purchases of $20 billion can shift the aggregate-demand curve to the right by more than $20 billion. This multiplier effect arises because increases in aggregate income stimulate additional spending by consumers.
AD2
AD3
$20 billion
1. An increase in government purchasesof $20 billion initially increases aggregatedemand by $20 billion . . .
2. . . . but the multipliereffect can amplify theshift in aggregatedemand.

Fiscal Policy Influences Aggregate Demand
• The multiplier effect• Multiplier effect
– Response of consumer spending– Response of investment
• Investment accelerator– Higher government demand
• Higher demand for investment goods
– Positive feedback from demand to investment
24
Fiscal Policy Influences Aggregate Demand
• A formula for the spending multiplier • Marginal propensity to consume, MPC
– Fraction of extra income• That consumers spend
• Size of the multiplier– Depends on the MPC
• A larger MPC– Larger multiplier
25

Fiscal Policy Influences Aggregate Demand
• A formula for the spending multiplier • Change in government purchases = $20 billion• First change in consumption = MPC × $20 billion• Second change in consumption = MPC2 × $20 billion• Third change in consumption = MPC3 × $20 billion• …• Total change in demand = (1 + MPC + MPC2 + MPC3
+ . . .) × $20 billion
– Multiplier = 1 + MPC + MPC2 + MPC3 + . . .– Multiplier = 1 / (1 – MPC)
26
Fiscal Policy Influences Aggregate Demand
• Other applications of the multiplier effect• Because of multiplier effect
– $1 of government purchases• Can generate > $1 of aggregate demand
– $1 of consumption, investment, or net exports• Can generate > $1 of aggregate demand
27

Fiscal Policy Influences Aggregate Demand
• The crowding-out effect– Offset in aggregate demand– Results when expansionary fiscal policy raises
the interest rate– Thereby reduces investment spending
28
Fiscal Policy Influences Aggregate Demand
• The crowding-out effect• Increase in government spending
– Aggregate demand curve – shifts right• Increase in income• Money demand – increases• Interest rate – increases• Aggregate-demand curve – shifts left
29

Figure
The crowding-out effect
5
30
Interestrate
Panel (a) shows the money market. When the government increases its purchases of goods and services, the resulting increase in income raises the demand for money from MD1 to MD2, and this causes the equilibrium interest rate to rise from r1 to r2. Panel (b) shows the effects on aggregate demand. The initial impact of the increase in government purchases shifts the aggregate-demand curve from AD1 to AD2. Yet because the interest rate is the cost of borrowing, the increase in the interest rate tends to reduce the quantity of goods and services demanded, particularly for investment goods. This crowding out of investment partially offsets the impact of the fiscal expansion on aggregate demand. In the end, the aggregate-demand curve shifts only to AD3.
Quantityof money
0
(a) The Money Market
Pricelevel
Quantityof output
0
(b) The Aggregate-Demand Curve
Aggregate demand, AD1Money demand, MD1
Moneysupply
Quantity fixedby the Fed
MD2
r2
r1
1. When an increase in government purchases increases aggregate demand . . .
2. . . . the increase inspending increasesmoney demand . . .
3. . . . which increasesthe equilibrium interestrate . . .
4. . . which in turnpartly offsets theinitial increase inaggregate demand.
AD2
AD3
$20 billion

Fiscal Policy Influences Aggregate Demand
• Changes in taxes• Smaller income taxes
– Households income – increases– Multiplier effect
• Aggregate demand - increases
– Crowding-out effect• Aggregate demand – decreases
31
Fiscal Policy Influences Aggregate Demand
• Changes in taxes• Permanent tax cut
– Large impact on aggregate demand• Temporary tax cut
– Small impact on aggregate demand
32
Using Policy to Stabilize the Economy
• The case for active stabilization policy• A change in aggregate-demand
– The government• Use fiscal policy
– The Fed• Use monetary policy
– To stabilize the economy
33
• 1964, President John F. Kennedy– Advocated a tax cut - to stimulate the economy– Investment tax credit– John Maynard Keynes’s General Theory– Stimulate aggregate demand– Change incentives that people face– Can alter the aggregate supply of goods and services
Keynesians in the White House
34
• Fiscal policy– Short-run: increase production through higher
aggregate demand– Long-run: increase production through higher
aggregate supply
• 2001, President George W. Bush– Economy – heading into recession– Policy: substantial and permanent tax cut
Keynesians in the White House
35
Using Policy to Stabilize the Economy
• The case against active stabilization policy• Government
– Should avoid active use of monetary and fiscal policy• To try to stabilize the economy
– Affect the economy with a big lag• Policy instruments
– Should be set to achieve long-run goals– The economy – left alone to deal with short-
run fluctuations36

Using Policy to Stabilize the Economy
• Automatic stabilizers– Changes in fiscal policy
• That stimulate aggregate demand• When the economy goes into a recession
– Without policymakers having to take any deliberate action
– The tax system– Government spending
37