
Chapter Stock Price Behavior and Market Efficiency McGraw-Hill/IrwinCopyright © 2012 by The...
39
Chapter Stock Price Behavior and Market Efficiency McGraw-Hill/Irwin Copyright © 2012 by The McGraw-Hill Companies, Inc. All rights reserved. 7
-
Upload
junior-bennett -
Category
Documents
-
view
215 -
download
1
Transcript of Chapter Stock Price Behavior and Market Efficiency McGraw-Hill/IrwinCopyright © 2012 by The...

Chapter
Stock Price Behavior and
Market Efficiency
McGraw-Hill/Irwin Copyright © 2012 by The McGraw-Hill Companies, Inc. All rights reserved.
7

7-2
The Market
“A market is the combined behavior of thousands of people responding to information, misinformation, and whim.”
“If you want to know what's happening in the market, ask the market.”
— Kenneth Chang
— Japanese Proverb

7-3
Controversy, Intrigue, and Confusion
• We begin by asking a basic question: Can you, as an investor, consistently “beat the market?”
• It may surprise you to learn that evidence strongly suggests that the answer to this question is “probably not.”
• We show that even professional money managers have trouble beating the market.
• At the end of the chapter, we describe some market phenomena that sound more like carnival side shows, such as “the amazing January effect.”

7-4
Market Efficiency
• The efficient market hypothesis (EMH) is a theory that asserts: As a practical matter, the major financial markets reflect all relevant information at a given time.
• Market efficiency research examines the relationship between stock prices and available information.
– The important research question: is it possible for investors to “beat the market?”
– Prediction of the EMH theory: if a market is efficient, it is not possible to “beat the market” (except by luck).

7-5
What Does “Beat the Market” Mean?
• The excess return on an investment is the return in excess of that earned by other investments that have the same risk.
• “Beating the market” means consistently earning a positive excess return.

7-6
Three Economic Forces that Can Lead to Market Efficiency
• Investors use their information in a rational manner.– Rational investors do not systematically overvalue or undervalue financial
assets.– If every investor always makes perfectly rational investment decisions, it
would be very difficult to earn an excess return.
• There are independent deviations from rationality.– Suppose that many investors are irrational.– The net effect might be that these investors cancel each other out.– So, irrationality is just noise that is diversified away.– What is important here is that irrational investors have different beliefs.
• Arbitrageurs exist.
– Suppose collective irrationality does not balance out.– Suppose there are some well-capitalized, intelligent, and rational investors.– If rational traders dominate irrational traders, the market will still be
efficient.
These conditions are so powerful that any one of them leads to efficiency.

7-7
Forms of Market Efficiency, (i.e., what information is used?)
• A Weak-form Efficient Market is one in which past prices and volume figures are of no use in beating the market.
– If so, then technical analysis is of little use.
• A Semistrong-form Efficient Market is one in which publicly available information is of no use in beating the market.
– If so, then fundamental analysis is of little use.
• A Strong-form Efficient Market is one in which information of any kind, public or private, is of no use in beating the market.
– If so, then “inside information” is of little use.

7-8
Information Sets for Market Efficiency

7-9
Some Implications of Market Efficiency:Does Old Information Help Predict Future Stock Prices?
• This is a surprisingly difficult question to answer clearly.
• Researchers have used sophisticated techniques to test whether past stock price movements help predict future stock price movements.
– Some researchers have been able to show that future returns are partly predictable by past returns. BUT: there is not enough predictability to earn an excess return.
– Also, trading costs swamp attempts to build a profitable trading system built on past returns.
– Result: buy-and-hold strategies involving broad market indexes are extremely difficult to outperform.
Technical Analysis implication: No matter how often a particular stock price path has related to subsequent stock price changes in the past, there is no assurance that this relationship will occur again in the future.

7-10
Some Implications of Market Efficiency: Random Walks and Stock Prices
• If you were to ask people you know whether stock market prices are predictable, many of them would say yes.
• To their surprise, and perhaps yours, it is very difficult to predict stock market prices.
• In fact, considerable research has shown that stock prices change through time as if they are random.
• That is, stock price increases are about as likely as stock price decreases.
• When there is no discernable pattern to the path that a stock price follows, then the stock’s price behavior is largely consistent with the notion of a random walk.

7-11
How New Information Gets into Stock Prices, I.
• In its semi-strong form, the EMH states simply that stock prices fully reflect publicly available information.
• Stock prices change when traders buy and sell shares based on their view of the future prospects for the stock.
• But, the future prospects for the stock are influenced by unexpected news announcements.
• Prices could adjust to unexpected news in three basic ways:
– Efficient Market Reaction: The price instantaneously adjusts to the new information.
– Delayed Reaction: The price partially adjusts to the new information.
– Overreaction and Correction: The price over-adjusts to the new information, but eventually falls to the appropriate price.

7-12
How New Information Gets into Stock Prices, II.

7-13
Event Studies, I.
• Researchers have examined the effects of many types of news announcements on stock prices.
• Such researchers are interested in:– The adjustment process itself– The size of the stock price reaction to a news
announcement.
• To test for the effects of new information on stock prices, researchers use an approach called an event study.
• Let us look at how researchers use this method.
• We will use a dramatic example.

7-14
Informed Traders and Insider Trading, I.
• If a market is strong-form efficient, no information of any kind, public or private, is useful in beating the market.
• But, it is clear that significant inside information would enable you to earn substantial excess returns.
• This fact generates an interesting question: Should any of us be able to earn returns based on information that is not known to the public?

7-15
Informed Trading
• When an investor makes a decision to buy or sell a stock based on publicly available information and analysis, this investor is said to be an informed trader.
• The information that an informed trader possesses might come from:
– Reading the Wall Street Journal– Reading quarterly reports issued by a company– Gathering financial information from the Internet– Talking to other investors

7-16
Are Financial Markets Efficient (Part 1)?
• Financial markets are the most extensively documented of all human endeavors.
• Colossal amounts of financial market data are collected and reported every day.
• These data, particularly stock market data, have been exhaustively analyzed to test market efficiency.
• But, market efficiency is difficult to test for these four basic reasons:
– The risk-adjustment problem– The relevant information problem– The dumb luck problem– The data snooping problem

7-17
Are Financial Markets Efficient (Part 2)?
• Nevertheless, three generalities about market efficiency can be made:
– Short-term stock price and market movements appear to be difficult to predict with any accuracy.
– The market reacts quickly and sharply to new information, and various studies find little or no evidence that such reactions can be profitably exploited.
– If the stock market can be beaten, the way to do so is not obvious.

7-18
Some Implications if Markets are Efficient
• Security selection becomes less important, because securities will be fairly priced.
• There will be a small role for professional money managers.
• It makes little sense to time the market.

7-19
Market Efficiency and the Performance of Professional Money Managers, I.
• Let’s have a stock market investment contest in which you are going to take on professional money managers.
• The professional money managers have at their disposal their skill, banks of computers, and scores of analysts to help pick their stocks.
• Does this sound like an unfair match?
• You have a terrific advantage if you follow this investment strategy: Hold a broad-based market index.
– One such index that you can easily buy is a mutual fund called the Vanguard 500 Index Fund (there are other market index mutual funds)
– The fund tracks the performance of the S&P 500 Index by investing its assets in the stocks that make up the S&P 500 Index.

7-20
Market Efficiency and the Performance of Professional Money Managers, II.

7-21
Market Efficiency and the Performance of Professional Money Managers, III.
• The previous slide shows the number of these funds that beat the performance of the Vanguard 500 Index Fund.
• You can see that there is much more variation in the dashed blue line than in the dashed red line.
• What this means is that in any given year, it is hard to predict how many professional money managers will beat the Vanguard 500 Index Fund.
• But, the low level and variation of the dashed red line means that the percentage of professional money managers who can beat the Vanguard 500 Index Fund over a 10-year investment period is low and stable.

7-22
Market Efficiency and the Performance of Professional Money Managers, IV.

7-23
Market Efficiency and the Performance of Professional Money Managers, V.

7-24
Market Efficiency and the Performance of Professional Money Managers, VI.
• Two previous slides show the percentage of managed equity funds that beat the Vanguard 500 Index Fund.
– In only 12 of the 24 years (1986—2009) did more than half beat the Vanguard 500 Index Fund.
– The performance is worse when it comes to a 10-year investment periods (1977-1986 through 2000-2009).
– In only 5 of these 24 investment periods did more than half the professional money managers beat the Vanguard 500 Index Fund.

7-25
Market Efficiency and the Performance of Professional Money Managers, VII.
• The upcoming slide presents more evidence concerning the performance of professional money managers.
• Using data from 1980 through 2009, we divide this time period into:
– 1-year investment periods– Rolling 3-year investment periods – Rolling 5-year investment periods– Rolling 10-year investment periods
• Then, after we calculate the number of investment periods, we ask two questions:
– What percent of the time did half the professionally managed funds beat the Vanguard 500 Index Fund?
– What percent of the time did three-fourths of them beat the Vanguard 500 Index Fund?

7-26
Market Efficiency and the Performance of Professional Money Managers, VIII.

7-27
Market Efficiency and the Performance of Professional Money Managers, IX.
• The previous slides raise some potentially difficult and uncomfortable questions for security analysts and other investment professionals.
• If markets are inefficient, and tools like fundamental analysis are valuable, why can’t mutual fund managers beat a broad market index?
• The performance of professional money managers is especially troublesome when we consider the enormous resources at their disposal and the substantial survivorship bias that exists.
– Managers and funds that do especially poorly disappear.
– If it were possible to beat the market, then the process of elimination should lead to a situation in which the survivors can beat the market.
– The fact that professional money managers seem to lack the ability to outperform a broad market index is consistent with the notion that the equity market is efficient.

7-28
What is the Role for Portfolio Managers in an Efficient Market?
• The role of a portfolio manager in an efficient market is to build a portfolio to the specific needs of individual investors.
• A basic principle of investing is to hold a well-diversified portfolio.
• However, exactly which diversified portfolio is optimal varies by investor.
• Some factors that influence portfolio choice include the investor’s age, tax bracket, risk aversion, and even employer. Employer?
– Suppose you work for Starbucks and part of your compensation is stock options.
– Like many companies, Starbucks offers its employees the opportunity to purchase company stock at less than market value.
– You can imagine that you could wind up with a lot of Starbucks stock in your portfolio, which means you are not holding a diversified portfolio.
– The role of your portfolio manager would be to help you add other assets to your portfolio so that it is once again diversified.

7-29
Anomalies
• We will now present some aspects of stock price behavior that are both baffling and potentially hard to reconcile with market efficiency.
• Researchers call these market anomalies.
• Three facts to keep in mind about market anomalies.
– First, anomalies generally do not involve many dollars relative to the overall size of the stock market.
– Second, many anomalies are fleeting and tend to disappear when discovered.
– Finally, anomalies are not easily used as the basis for a trading strategy, because transaction costs render many of them unprofitable.

7-30
The Day-of-the-Week Effect:Mondays tend to have a Negative Average Return
• The day-of-the-week effect refers to the tendency for Monday to have a negative average return—which is economically significant.
• Interestingly, the effect is much stronger in the 1950-1979 time period than in the 1980-2009 time period.
7-31
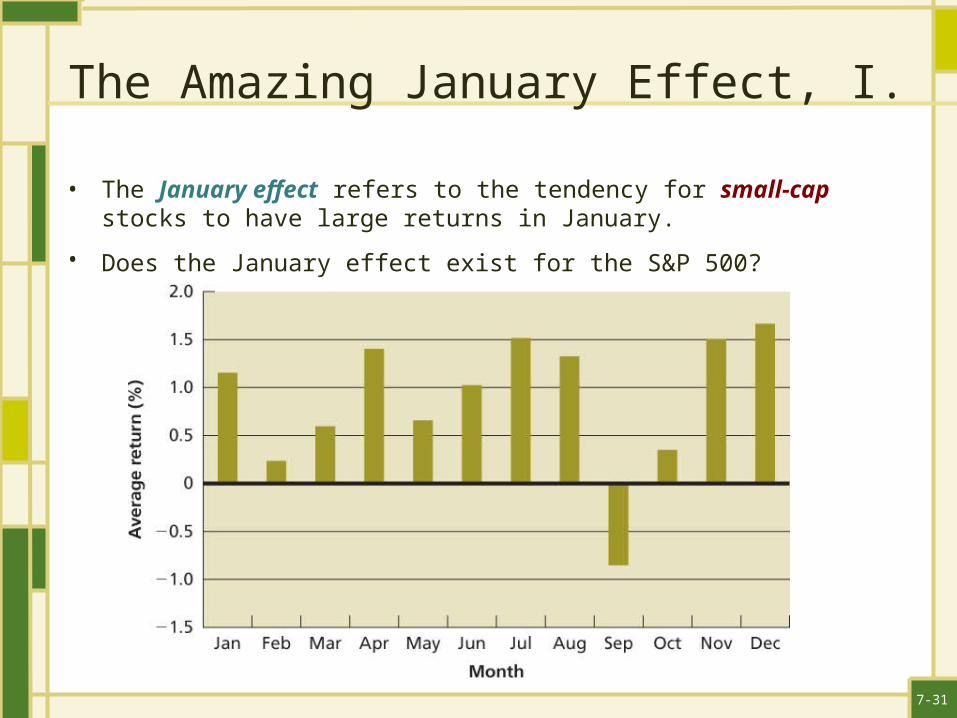
The Amazing January Effect, I.
• The January effect refers to the tendency for small-cap stocks to have large returns in January.
• Does the January effect exist for the S&P 500?

7-32
The Amazing January Effect, II.
• But, what do we see when we look at returns on small-cap stocks?
7-33
Bubbles and Crashes
• Bubble: occurs when market prices soar far in excess of what normal and rational analysis would suggest.
– Investment bubbles eventually pop. – When a bubble does pop, investors find themselves
holding assets with plummeting values.– A bubble can form over weeks, months, or even years.
• Crash: significant and sudden drop in market values.
– Crashes are generally associated with a bubble.– Crashes are sudden, generally lasting less than a
week. – However, the financial aftermath of a crash can last for
years.

7-34
The Crash of 1929

7-35
The Crash of 1929 — The Aftermath

7-36
The Crash of 1987
• Once, when we spoke of the Crash, we meant October 29, 1929. That was until October 1987.
• The Crash of 1987 began on Friday, October 16th.
– The DJIA fell 108 points to close at 2,246.73. – First time in history that the DJIA fell by more than 100 points in
one day.
• On October 19, 1987, the DJIA lost about 22.6% of its value on a new record volume (about 600 million shares)
• The DJIA plummeted 508.32 points to close at 1,738.74.
– During the day on Tuesday, October 20th, the DJIA continued to plunge in value, reaching an intraday low of 1,616.21.
– But, the market rallied and closed at 1,841.01, up 102 points.

7-37
The Crash of 1987 — Aftermath

7-38
The “Dot-Com” Bubble and Crash, II.

7-39
The Dow Jones Average,January 2008 through April 2010