CHAPTER - IV INDIA’S GEMS AND JEWELLERY EXPORT EXPERIENCE...
47
66 CHAPTER - IV INDIA’S GEMS AND JEWELLERY EXPORT EXPERIENCE WITH ITS TRADE PARTNERS The gems and jewellery industry has a global significance and enjoys a major industry status since the colonial period. India has achieved remarkable progress in the world of gems and jewellery over the last few decades, but it has not been smooth sailing all along. Whatever success India claimed so far, has been achieved by the hard and devoted work of its artisans, expertise of its designers and the business acumen of its entrepreneurs. During the past, the country had to face a lot of difficulties and adverse situations in economic sector but it went to the credit of India’s gems and jewellery sector that it never looked back. India exports gems and jewellery to nearly160 countries. Among the first ten buyers of India’s gems and jewellery the US mostly remained at the top. Other major buyers are Belgium, Hong Kong, Japan, Switzerland, Netherland, the U.K., France, Singapore and Germany. India has also succeeded in reaching some new markets like Turkey, Trinidad, Korea, Cyprus, Finland, Taiwan, Lebanon, Spain, Israel, Sweden and Denmark etc. The ten main overseas market taken together, account for more than 90 per cent exports of the gems and jewellery by India. Gems and jewellery exports of India contribute nearly 20 per cent to country’s total foreign exchange earnings. There is no doubt that during the period from 1990-91 to 2009-10 Indian gems and jewellery exports displayed an appreciable increase. The most noticeable feature is that during the prescribed study period India’s gems and jewellery exports increased at a compound rate of 16.59 per cent while Indian total exports registered a growth rate of 17.82 per cent over the same period. However, growth itself is not a virtue, for there remains scope for immense improvement. The growth phenomenon has been accompanied by a high degree of instability caused to a great extent by high degree of product and
-
Upload
nguyenminh -
Category
Documents
-
view
224 -
download
4
Transcript of CHAPTER - IV INDIA’S GEMS AND JEWELLERY EXPORT EXPERIENCE...

66
CHAPTER - IV
INDIA’S GEMS AND JEWELLERY EXPORT EXPERIENCE WITH ITS TRADE PARTNERS
The gems and jewellery industry has a global significance and enjoys a major industry status since the colonial period. India has achieved remarkable progress in the world of gems and jewellery over the last few decades, but it has not been smooth sailing all along. Whatever success India claimed so far, has been achieved by the hard and devoted work of its artisans, expertise of its designers and the business acumen of its entrepreneurs. During the past, the country had to face a lot of difficulties and adverse situations in economic sector but it went to the credit of India’s gems and jewellery sector that it never looked back. India exports gems and jewellery to nearly160 countries. Among the first ten buyers of India’s gems and jewellery the US mostly remained at the top. Other major buyers are Belgium, Hong Kong, Japan, Switzerland, Netherland, the U.K., France, Singapore and Germany. India has also succeeded in reaching some new markets like Turkey, Trinidad, Korea, Cyprus, Finland, Taiwan, Lebanon, Spain, Israel, Sweden and Denmark etc. The ten main overseas market taken together, account for more than 90 per cent exports of the gems and jewellery by India. Gems and jewellery exports of India contribute nearly 20 per cent to country’s total foreign exchange earnings. There is no doubt that during the period from 1990-91 to 2009-10 Indian gems and jewellery exports displayed an appreciable increase. The most noticeable feature is that during the prescribed study period India’s gems and jewellery exports increased at a compound rate of 16.59 per cent while Indian total exports registered a growth rate of 17.82 per cent over the same period. However, growth itself is not a virtue, for there remains scope for immense improvement. The growth phenomenon has been accompanied by a high degree of instability caused to a great extent by high degree of product and

67
market concentration. In this chapter, the study make an attempt to analyze country-wise as well as product-wise growth trend of gems and jewellery products exports, measurement of associated instability and market concentration. Effects of present reform process on exports of gems and jewellery exports have also been analyzed. In order to measure market concentration, six indices have been used. These are:
(i) Index of Maximum Proportion (D1); (ii) Hirschman Herfindhal Index (D2); (iii) Entropy Index (D3); (iv) Concentration Ratio of Four Major Countries CR4 (D4); (v) Concentration Ratio of Eight Major Countries CR8 (D5); (vi) Concentration Ratio of Sixteen Major Countries CR16 (D6).
To fulfill the objectives of the study, the relevant data on India’s exports of gems and jewellery products have been collected from the authenticated sources (given in the chapter-I)
The data have been used to calculate the growth rates of the major importing countries from the year 1996-97 to 2009-10 which depicts the comparative analysis of exports to these countries. Further, the importing countries have been categorized into following three categories: Category-I includes countries having greater than 40 per cent growth rates (High Potential); Category-II includes countries having between 10 per cent and 40 per cent growth rates (Middle Potential) and Category-III includes countries having below 10 per cent growth rates (Low Potential). The use of the ranks has also been made in identifying the status of a country within a category that again clearly states the comparative analysis of India’s gems and jewellery exports to these countries. In addition, descriptive statistics of gems and jewellery products exports during the study period have also been discussed. For example, coefficients of variations, which are considered as a relative measure of inequality in the gems and jewellery products exports from India show instability in the exports during the study period.

68
ANALYTICAL FINDINGS Figure-4.1 represents the country concentration indices of the exports of cut and polished diamonds among the fifty major importing countries during the period 1996-97 to 2009-10. The indicators below the figure denoted by D1, D2, D3, D4, D5 and D6 show Index of Maximum Proportion, Hirschman Herfindhal Index, Entropy Index, the Concentration ratio of four major importing countries, eight major importing countries and sixteen major importing countries, respectively. The figure shows the value of six different measures of concentration of cut and polished diamonds exports. These measures of concentration viz., Index of Maximum Proportion (D1) ranges from 0.257261 to 0.368052, Hirschman Herfindhal Index (D2) ranges from 0.170415 to 0.232587, Entropy Index (D3) ranges from 0.785865 to 0.897400, concentration ratio of four major importing countries CR4 (D4) ranges from 0.731733 to 0.865695, concentration ratio of eight major importing countries CR8 (D5) ranges from 0.936116 to 0.959464 and concentration ratio of sixteen major importing countries CR16 (D6) ranges from 0.988276 to 0.994047. Here, the Hirschman Herfindhal Index (D2) indicates the presence of diversification (Low Concentration) of cut and polished diamonds among the various importing countries. The Index D3 depicts the entropy index of cut and polished diamonds exports over the study period. The higher value of the entropy index indicates valuable information about the concentration of importing countries. Concentration index D6 represents that it has been almost constant for Germany, the UAE, the UK, France, Australia, Canada, Italy, Japan, Israel, the USA, Hong Kong, Belgium, Thailand, Singapore, Switzerland and Malaysia over the study period except in years 1997-98 and 1998-99. In these years it has been showing decreasing trend. Table-4.1 exhibits the country wise growth rate for the exports of Indian cut and polished diamonds to the fifty major importing countries during the period 1996-97 to 2009-10. Further, the importing countries have been categorized into the following three categories: Category-I includes countries

69
Figure – 4.1 Country Concentration Indices of Cut and Polished Diamonds during the Period 1996-97 to 2009-10
Source: Calculated on the basis of data given in Appendix-I
1996-97 1997-98 1998-99 1999-00 2000-01 2001-02 2002-03 2003-04 2004-05 2005-06 2006-07 2007-08 2008-09 2009-10
D1 0.3269190 0.3553112 0.3680524 0.3627581 0.3402978 0.3232971 0.2905555 0.3386704 0.2572611 0.2768978 0.3101565 0.3327326 0.3050731 0.3055800
D2 0.2116225 0.2255623 0.2305520 0.2325871 0.2195896 0.210493 0.1732290 0.235339 0.1704159 0.1704470 0.1928383 0.2023495 0.1946839 0.2227433
D3 0.8152013 0.8083933 0.8053518 0.7977987 0.8180314 0.8306888 0.8974008 0.7897538 0.8881180 0.8876976 0.8506085 0.8301152 0.8480203 0.7858651
D4 0.85053 0.845352 0.846686 0.834238 0.816018 0.798816 0.7628007 0.847838 0.768157 0.731733 0.796268 0.823725 0.826574 0.865695
D5 0.956126 0.941007 0.945442 0.950431 0.949327 0.950497 0.936116 0.950708 0.955292 0.959464 0.95241 0.954484 0.945628 0.958918
D6 0.992127 0.989921 0.988276 0.992169 0.993138 0.992986 0.992647 0.990647 0.991238 0.992237 0.99096 0.991974 0.990129 0.994047
0
0.2
0.4
0.6
0.8
1
1.2
Inde
x V
alue
s
Year

70
having greater than 40 per cent growth rates, Category-II includes countries having between 10 per cent and 40 per cent growth rates and Category-III includes countries having below 10 per cent growth rates. Such type of
Table – 4.1 Country-wise Growth Rates of Gems and Jewellery Products of Exports (Cut and Polished Diamonds) during the Period from 1996-97 to 2009-10 (Values in Rs. Lacs) Category Country CAGR t-value R2 F-value Ranks
Hig
h Po
tent
ial C
ateg
ory China P RP 97.80 3.775* 0.542 14.251 1
Turkey 67.86 7.842* 0.836 61.509 2 Honduras 46.77 2.481** 0.339 6.159 3 U A E 45.74 9.177* 0.875 84.224 4 South Africa 40.46 9.502* 0.882 90.300 5
Mid
dle
Pote
ntia
l Cat
egor
y
Chile 34.68 1.646 0.184 2.711 6 Poland 30.55 1.942** 0.246 3.931 7 Malaysia 22.71 7.280* 0.815 53.009 8 Korea RP 19.43 4.548* 0.632 20.692 9 Italy 18.99 2.058** 0.260 4.237 10 Australia 18.66 22.877* 0.977 523.384 11 Israel 17.57 9.812* 0.889 96.291 12 Singapore 17.54 3.368* 0.485 11.345 13 Lebanon 17.02 4.873* 0.664 23.753 14 Greece 16.57 2.390** 0.568 5.716 15 Hong Kong 15.51 22.670* 0.977 513.962 16 New Zealand 13.87 11.860* 0.921 140.675 17 Finland 11.18 2.360** 0.317 5.571 18
Thailand 9.94 5.964* 0.747 35.575 19 Belgium 9.55 16.962* 0.959 287.728 20 U K 8.83 7.350* 0.818 54.026 21 Canada 8.18 4.951* 0.671 24.518 22 U S A 7.00 6.401* 0.773 40.983 23

71
Low
Pot
entia
l Cat
egor
y Taiwan 6.19 1.401 0.140 1.965 24 Ukrain 5.65 0.266 0.005 0.071 25 Switzerland 3.23 1.739 0.201 3.025 26
France 3.15 2.182** 0.284 4.765 27 Germany 2.92 2.522* 0.346 6.361 28 Spain 1.96 0.496 0.020 0.246 29 Indonesia 0.001 0.000 0.000 0.000 30 Japan -1.17 -0.802 0.050 0.643 31 Ireland -2.07 -0.342 0.009 0.117 32 Sri Lanka -4.14 -0.604 0.029 0.365 33 Bahrain Is -4.53 -0.475 0.018 0.226 34 Netherland -7.24 -1.137 0.097 1.294 35 Brazil -8.30 -0.923 0.066 0.852 36 Russia -14.05 -3.037 0.434 9.227 37 Kuwait -14.56 -1.865 0.224 3.480 38 Denmark -14.88 -1.464 0.151 2.144 39 Austria -15.13 -1.511 0.159 2.284 40 Mauritius -15.26 -3.375 0.487 11.392 41 Norway -19.71 -1.701 0.195 2.915 42 Qatar -21.37 -1.431 0.145 2.048 43 Bangladesh -23.26 -3.81 0.547 14.528 44 Portugal -25.16 -3.444 0.497 11.866 45 Saudi Arab -25.96 -2.879 0.408 8.291 46 Oman -26.00 -2.230 0.293 4.974 47 Sweden -26.88 -3.606 0.520 13.004 48 Cyprus -29.60 -9.334 0.878 87.133 49 Maxico -122.47 -1.811 0.214 3.281 50
Source: Calculated on the basis of data collected from Export Import Data Bank, Director General of Commercial Intelligence and Statistics, Ministry of Commerce, Government of India, Kolkata, Gem and Jewellery Export Promotion Council (GJEPC), Ministry of Commerce and Industry, Government of India, New Delhi.
Note * The coefficients are significant at α = 0.01.
** The coefficients are significant at α = 0.10.

72
classification may be valuable in identifying the high, middle and low potential countries for the purpose of exports of the gems and jewellery products. On the basis of the ranks given for the growth rates, one can conclude that the first five countries like China P RP (97.80), Turkey (67.86), Honduras (46.77), the UAE (45.74) and South Africa (40.46) come in the high potential category, which shows the appreciable progress of India in the exports of cut and polished diamonds among these countries. In addition, next thirteen countries fall in the middle potential category and rest of the countries are of the low potential category. Obviously, the t-values of growth rates, it is found that some of countries are having its positive values while others having as negative values. The Table clearly displays that the most of growth rates are statistically significant at one per cent (α = 0.01) level of significance. However, the growth rates of Japan, Ireland, Sri Lanka, Brazil, Russia, Kuwait, Denmark and Norway etc. have been negative and statistically insignificant and all these values are confirmed by t-value, coefficient of determination R2 and ANOVA (F-value). The coefficient of variations for the exports of cut and polished diamonds to various countries during the period from 1996-97 to 2009-10 are displayed in the Table 4.2. The column III of the Table shows the mean values of the total exports for the study period. Similarly, column IV depicts standard deviation of the year-wise exports to various countries, which highlights the dispersion among the importing countries. The last column of the Table provides coefficients of variations, which is considered as relative measures of inequality in cut and polished diamonds exports of India. The mean value of year-wise exports of cut and polished diamonds have increased from 2,883.354 to 1,69,823.951 which is almost fifty nine times increase from the year 1996-97 to 2009-10. Further, absolute dispersion measured by standard deviation has increased from 89,998.778 to 5,46,190.546 which is six folds increase in fourteen years (1996-97 to 2009-10) Likewise, the coefficients of variations during the study period have been of fluctuating nature. However, one may conclude that the stability over the study period in exports of cut and polished diamonds has improved. It is
73
Table – 4.2 Descriptive Statistics of Exports of Cut and Polished Diamonds during
the Period from 1996-97 to 2009-10 (Values in Rs. Lacs)
I II III IV V Sr. No. Year Mean Standard
Deviation Coefficient of
Variations 1 1996-97 2883.354 89998.778 312.676 2 1997-98 32142.187 104092.445 323.849 3 1998-99 40251.458 131926.877 327.756 4 1999-00 56229.261 185123.723 329.336 5 2000-01 56478.895 180230.013 319.110 6 2001-02 56405.934 175847.514 311.753 7 2002-03 80955.316 226353.835 279.603 8 2003-04 68507.838 227077.223 331.461 9 2004-05 92472.353 256171.460 277.024 10 2005-06 102364.404 283604.268 277.053 11 2006-07 95498.257 283587.749 296.955 12 2007-08 113536.464 346305.695 305.017 13 2008-09 142723.193 426081.853 298.537 14 2009-10 169823.951 546190.546 321.621
Source: Ibid., Table-4.1
because in the year 1996-97, the figure was 312.676 and in the year 2009-10 the figure increased to 321.621. Obviously, it signifies the presence of diversification.
Figure-4.2 represents the country concentration indices of the exports of gold jewellery among fifty major importing countries during the period 2003-04 to 2009-10. These measure concentration namely, Index of Maximum Proportion (D1), Hirschman Herfindhal Index (D2), Entropy Index (D3), CR4 (D4), CR8 (D5) and CR16 (D6) ranges from value 0.402811 to 0.540555, 0.299682 to 0.378181, 0.591940 to 0.768880, 0.822189 to 0.925231,

74
Figure – 4.2 Country Concentration Indices of Gold Jewellery during the Period 2003-04 to 2009-10
Source: Calculated on the basis of data given in Appendix-III
2003-04 2004-05 2005-06 2006-07 2007-08 2008-09 2009-10
D1 0.540555 0.503796 0.505918 0.500777 0.402811 0.491886 0.529525
D2 0.377732 0.371359 0.377222 0.378181 0.314336 0.299682 0.340601
D3 0.617398 0.615214 0.597924 0.59194 0.684514 0.7688804 0.681118
D4 0.913459 0.908971 0.920465 0.925231 0.897002 0.822189 0.885351
D5 0.951725 0.947122 0.954009 0.954209 0.947074 0.932722 0.952205
D6 0.9834302 0.983195 0.987106 0.988864 0.987677 0.978543 0.986032
0
0.2
0.4
0.6
0.8
1
1.2
Inde
x V
alue
s
Year

75
0.932722 to 0.952205 and 0.978543 to 0.988864, respectively. Further, index D2 that has been almost stable in first four years, starts declining after the year 2007-2008 and starts increasing again in 2009-10, which is also displayed in the figure-4.2. The index D3 that measures the information about the concentration of the group has been declining in first four years and of fluctuating nature during rest of the years. In addition, the concentration ratio CR4 (D4), CR8 (D5) and CR16 (D6) also indicate almost stable exports of gold jewellery for these countries in the International market.
The country-wise growth rates for the exports of gold jewellery among the fifty major importing countries during the period 2003-04 to 2009-10 are shown in Table-4.3. A careful examination of the Table reveals that the first eight countries like China P RP, Poland, Hong Kong, France, Korea RP, Saudi Arab, Australia and South Africa come in the high potential category, which demonstrate an enormous potential market for the India’s exports of gold jewellery. Further, twenty seven countries fall in the middle potential category and last fifteen counties come in the low potential category. It is clear from the Table that t-values of growth rates of Ireland, Nepal, Lebanon, Cyprus, Fiji Is, Taiwan and Kenya have been negative and statistically insignificant and all these values are confirmed by t-value and R2.
Table – 4.3 Country-wise Growth Rates of Gems and Jewellery Products of Exports
(Gold Jewellery) during the Period from 2003-04 to 2009-10 (Values in Rs. Lacs) Category Country CAGR t-value R2 F-value Ranks
Hig
h Po
tent
ial
Cat
egor
y
China P RP 256.90 4.574* 0.807 20.922 1 Poland 212.13 5.088* 0.838 25.896 2 Hong Kong 75.52 24.378* 0.991 594.321 3 France 71.09 2.960** 0.636 8.763 4 Korea RP 58.26 1.642 0.350 2.698 5 Soudi Arab 46.28 3.969* 0.759 15.755 6 Australia 42.07 10.351* 0.955 107.155 7

76
South Africa 41.74 5.442* 0.855 29.621 8 M
iddl
e Po
tent
ial C
ateg
ory
Singapore 37.12 3.922* 0.754 15.382 9 Spain 36.94 4.263* 0.784 18.178 10 U.A.E. 34.47 7.781* 0.923 60.557 11 Italy 33.63 5.598* 0.862 31.348 12 Qatar 31.50 2.610** 0.576 6.815 13 Canada 29.93 4.490* 0.801 20.164 14 Indonesia 28.02 0.880 0.134 0.774 15 Maxico 26.84 0.825 0.120 0.681 16 Greece 26.72 0.768 0.105 0.590 17 Bahrain Is 25.01 1.491 0.307 2.225 18 Israel 23.96 2.708** 0.594 7.336 19 Austria 22.42 2.615** 0.577 6.840 20 Thailand 21.98 4.601* 0.808 21.173 21 Finland 21.85 1.266 0.242 1.603 22 Sri Lanka 21.25 1.199 0.223 1.439 23 New Zealnd 21.02 3.334** 0.689 11.116 24 Germany 20.54 3.343** 0.691 11.182 25 Portugal 20.11 0.758 0.103 0.575 26 Phillipines 19.67 0.392 0.029 0.154 27 Belgium 19.05 2.713** 0.595 7.364 28 Norway 18.90 1.963** 0.435 3.855 29 Denmark 17.99 1.410 0.284 1.988 30 Brazil 17.25 0.357 0.024 0.127 31 Netherland 15.52 1.078 0.188 1.162 32 Georgia 14.63 0.923 0.145 0.852 33 Oman 11.57 0.125 0.003 0.015 34 Kuwait 10.55 0.568 0.060 0.323 35
U.K. 9.55 2.608** 0.576 6.802 36 Malaysia 7.46 1.005 0.168 1.010 37 Turkey 7.29 1.009 0.169 1.019 38

77
Source: Ibid., Table-4.1 Note * The coefficients are significant at α = 0.01. ** The coefficients are significant at α = 0.10.
Table-4.4 demonstrates the descriptive statistics of the gold jewellery exports to various importing countries during the period from 2003-04 to 2009-10. The column III of the Table represents the mean values of exports of the study period. Further, column IV represents standard deviation of the exports to various importing countries for these years, which signifies the dispersion among the importing countries. The last column of the Table displays coefficients of variations, which is considered as relative measures of inequality in the exports of India’s gold jewellery. The mean values of year-wise gold jewellery exports have increased from 16,893.034 to 55,143.391 which is three times increase from the year 2003-04 to 2009-10. Similarly, the absolute dispersion measured by standard deviation has increased from 72,170.397 to 2,23,022.136 which has almost four times increased over the study period. The coefficients of variations during the study period have been of fluctuating nature. The figure of coefficient of variations was 427.219 in 2003-04 and in 2009-10, the figure reduced 404.440, which means the reduction in the inequality of the exports of gold jewellery. It may be considered as a good sign for the Indian economy.
Low
Pot
entia
l Cat
egor
y Switzerland 6.53 0.638 0.075 0.407 39 Mauritius 6.51 0.560 0.059 0.314 40 Sweden 5.81 0.451 0.039 0.203 41 Japan 4.84 0.615 0.070 0.379 42 U.S.A. 3.23 0.743 0.099 0.552 43 Ireland -0.00 -0.000 0.000 0.000 44 Nepal -1.59 -0.041 0.0003 0.001 45 Lebanon -3.32 -0.175 0.006 0.030 46 Cyprus -15.88 -1.047 0.179 1.096 47 Fiji Is -22.95 -3.602 0.721 12.975 48 Taiwan -42.02 -3.458 0.705 11.959 49 Kenya -63.09 -1.841 0.404 3.391 50

78
Table – 4.4 Descriptive Statistics of Exports of Gold Jewellery during the Period
from 2003-04 to 2009-10 (Values in Rs. Lacs) I II III IV V
Sr No. Year Mean Standard Deviation
Coefficients of Variation
1 2003-04 16893.034 72170.397 427.219 2 2004-05 25779.879 10801.929 418.985 3 2005-06 27775.373 118577.145 426.914 4 2006-07 37869.094 161885.598 427.487 5 2007-08 34351.917 133120.630 387.520 6 2008-09 61918.147 233895.984 377.750 7 2009-10 55143.391 223022.136 404.440
Source: Ibid., Table-4.1
Figure-4.3 exhibits the country concentration indices of the exports of coloured gemstones among the fifty major countries again during the period 1996-97 to 2009-10. In the figure, the different measures of concentration namely, Index of Maximum Proportion (D1) Hirschman Herfindhal Index (D2), Entropy Index (D3), concentration ratio of four major importing countries CR4 (D4), concentration ratio of eight major importing countries
CR8 (D5) and concentration ratio of sixteen major importing countries CR16 (D6) ranges from 0.266407 to 0.525818, 0.149388 to 0.289646, 0.765341 to 0.982657, 0.697379 to 0.858813, 0.883191 to 0.937609 and 0.958489 to 0.982544, respectively. After analyzing the figure-4.3, it has been observed that the index D2 displays the presence of diversification (Low Concentration) of coloured gemstones exports among the various importing countries. Further, index D3 measures the information about the concentration of the group has been of fluctuating nature over the study period. The concentration ratio CR4 (D4) in the figure illustrates low concentration in the first four major importing countries of coloured gem- stones. These countries are the USA, Hong Kong, Thailand and Japan.

79
Figure – 4.3 Country Concentration Indices of Coloured Gemstones during the Period 1996-97 to 2009-10
Source: Calculated on the basis of data given in Appendix-V
1996-97 1997-98 1998-99 1999-00 2000-01 2001-02 2002-03 2003-04 2004-05 2005-06 2006-07 2007-08 2008-09 2009-10
D1 0.409868 0.525818 0.430930 0.446762 0.427694 0.431312 0.443778 0.507705 0.379360 0.410324 0.373438 0.333370 0.311483 0.266407
D2 0.233129 0.319368 0.234261 0.247998 0.227935 0.237801 0.238866 0.289646 0.191814 0.271999 0.200501 0.191804 0.181986 0.149388
D3 0.862349 0.765341 0.870512 0.850420 0.873872 0.854945 0.880866 0.828902 0.950097 0.767150 0.927154 0.929083 0.935290 0.982657
D4 0.779212 0.802755 0.764928 0.769568 0.742979 0.806747 0.767283 0.781882 0.711172 0.858813 0.744005 0.757943 0.745527 0.697379
D5 0.913013 0.919332 0.91159 0.913489 0.923406 0.920415 0.90906 0.911436 0.883191 0.937609 0.895885 0.903722 0.899233 0.896391
D6 0.974841 0.980989 0.980482 0.980394 0.982544 0.977859 0.967038 0.968952 0.96819 0.979358 0.966141 0.958489 0.970797 0.977315
0
0.2
0.4
0.6
0.8
1
1.2
Inde
x V
alue
s
Year

80
Furthermore, the concentration ratio CR8 (D5) and CR16 (D6) Indicate high concentration for the exports of coloured gemstones in the first eight and then sixteen countries of the world. On the pattern of earlier Tables, Table-4.5 illustrates the country-wise growth rates of the exports of coloured gemstones to fifty major importing countries during the period 1996-97 to 2009-10. The Table represents that the Turkey (68.75), China P RP (45.40), Indonesia (42.77), and Lebanon (40.25) are falling in the first high potential category. Therefore, growth rate of the above countries signifies a lucrative market for the Indian coloured gemstones. Further, the next twenty-one countries come in the second potential category, which indicates the increasing exports trend of coloured gemstones in this group. The category of low potential countries consists of Qatar, the UK, Hong Kong, Japan, Netherland, Germany, Australia, Oman, Canada, Spain, the USA, Finland, Greece, New Zealand, Egypt, Mauritius, Belgium, Switzerland, France, Norway, Cyprus, Sweden, Kenya, Phillipines and Austria. After examining the t-values, most of the growth rates are statistically significant at one per cent (α = 0.01) level of significance. However, the growth rates of Egypt, Mauritius, Belgium, France, Norway, Cyprus, Sweden, Kenya and Austria are negative and statistically insignificant. All these values are confirmed by the t-values and R2.
Table – 4.5 Country-wise Growth Rates of Gems and Jewellery Products of Exports
(Coloured Gemstones) during the Period from 1996-97 to 2009-10 (Values in Rs. Lacs)
Category Country CAGR t-value R2 F-value Ranks
Hig
h Po
tent
ial
Cat
egor
y
Turkey 68.75 6.120* 0.757 37.465 1 China P RP 45.40 6.603* 0.784 43.604 2 Indonesia 42.77 4.500* 0.628 20.258 3 Lebanon 40.25 6.202* 0.762 38.467 4
Czech Republic 29.64 5.985* 0.749 35.820 5 Nepal 29.14 3.063* 0.438 9.383 6

81
Mid
dle
Pote
ntia
l Cat
egor
y Poland 25.65 5.434* 0.711 29.538 7 Maxico 24.14 3.352* 0.483 11.240 8 Ireland 24.09 2.797** 0.394 7.823 9 South Africa 23.41 7.088* 0.807 50.245 10 U.A.E. 21.52 5.199* 0.692 27.038 11 Korea RP 21.29 6.866* 0.797 47.144 12 Kuwait 19.94 2.040** 0.257 4.162 13 Denmark 19.92 6.571* 0.782 43.186 14 Taiwan 19.41 5.569* 0.721 31.019 15 Portugal 18.61 2.130** 0.274 4.540 16 Singapore 18.40 2.001* 0.250 4.004 17 Sri Lanka 17.09 2.643* 0.368 6.988 18 Malaysia 16.18 1.570 0.170 2.467 19 Israel 15.45 8.463* 0.856 71.625 20 Saudi Arab 15.04 1.683 0.190 2.832 21 Thailand 14.74 3.900* 0.559 15.217 22 Brazil 12.76 1.054 0.084 1.111 23 Bahrain Is 12.14 2.053** 0.260 4.216 24 Italy 11.02 3.586* 0.517 12.864 25
Qatar 8.43 0.813 0.052 0.661 26 U. K. 7.80 4.215* 596.00 17.769 27 Hong Kong 7.65 4.573* 0.635 20.921 28 Japan 6.30 2.309** 0.307 5.335 29 Netherland 5.53 1.763 0.205 3.110 30 Germany 5.45 3.596* 0.518 12.933 31 Australia 4.64 2.609** 0.362 6.811 32 Oman 3.91 0.425 0.014 0.180 33 Canada 3.42 1.709 0.195 2.922 34 Spain 3.18 1.292 0.122 1.669 35 U.S. A. 3.13 2.336** 0.312 5.460 36 Finland 2.88 0.448 0.016 0.201 37
82
Greece 1.55 0.447 0.016 0.200 38 New Zealand 1.50 0.310 0.007 0.096 39 Egypt -0.56 -0.036 0.001 0.001 40 Mauritius -0.86 -0.156 0.002 0.024 41 Belgium -1.60 -0.561 0.025 0.315 42 Switzerland -2.38 -0.840 0.055 0.706 43 France -3.11 -0.688 0.038 0.474 44 Norway -5.74 -1.462 0.151 2.139 45 Cyprus -8.48 0.107 0.053 0.674 46 Sweden -8.77 -2.641 0.367 6.979 47 Kenya -10.21 -0.779 0.048 0.607 48 Phillipines -10.99 -1.882 0.227 3.542 49 Austria -15.17 -4.159 0.590 17.301 50
Source: Ibid., Table-4.1 Note * The coefficients are significant at α = 0.01. ** The coefficients are significant at α = 0.10.
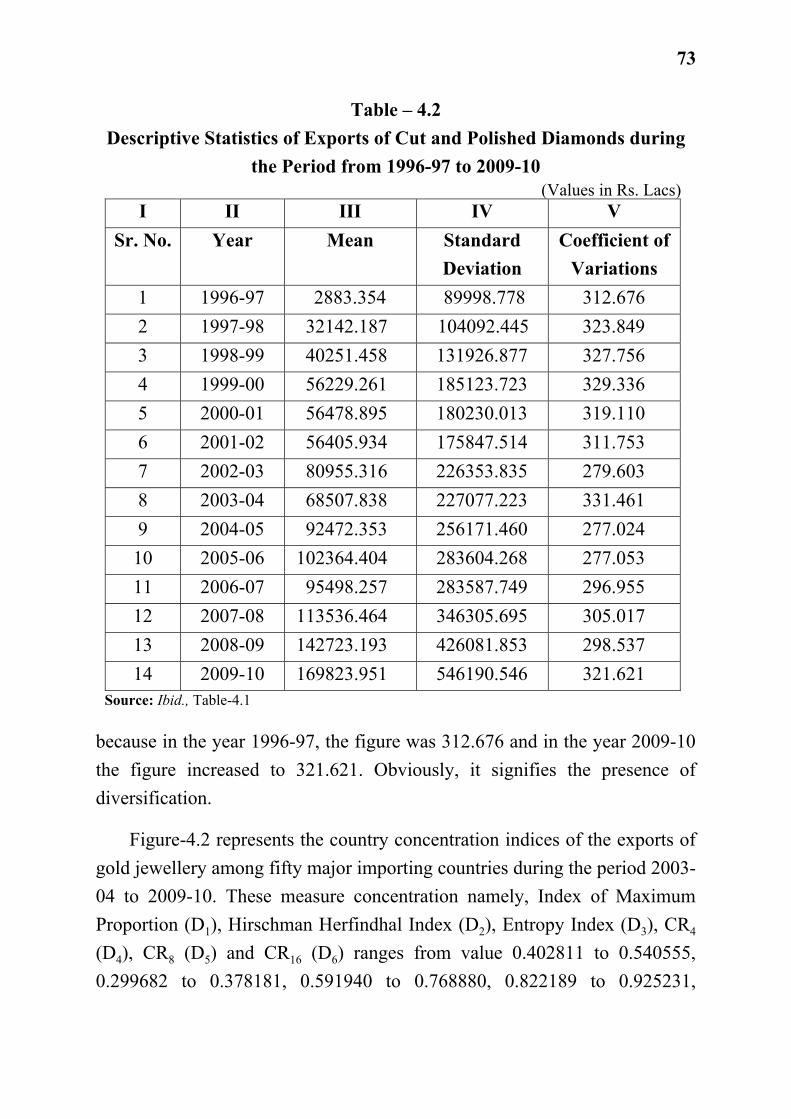
The coefficient of variations for the exports of coloured gemstones to various countries during the period from 1996-97 to 2009-10 are displayed in the Table 4.6. The column III of the table demonstrates the mean values of exports for respective years. Similarly, column IV illustrates standard deviations of the exports of coloured gemstones to various importing countries for respective years, which shows the dispersion among the importing countries. The last column of the table shows coefficients of variations that are reflected as relative measures of inequality in the exports of India’s coloured gemstones. The mean value of year-wise coloured gem- stones exports has increased from 1,002.311 to 3,432.884 which is almost four times increase from the year 1996-97 to 2009-10. Further, the absolute dispersion measured by standard deviation has increased from 3305.189 to 8820.206 which is almost three times increase over the study period. The coefficients of variations in these years have been of fluctuating nature. However, one may conclude that the stability over the study period in the exports of coloured gemstones has to some degree, improved. It is because in the year 1996-97 the figure of coefficient of variations was 329.756 and in

83
the year 2009-10 the figure reduced to 256.932. It means the reduction in the inequality at the exports of coloured gemstones improved the stability of the gems and jewellery exports of the country.
Table – 4.6
Descriptive Statistics of Exports of Coloured Gemstones during the Period from 1996-97 to 2009-10
(Values in Rs. Lacs)
Source: Ibid., Table-4.1
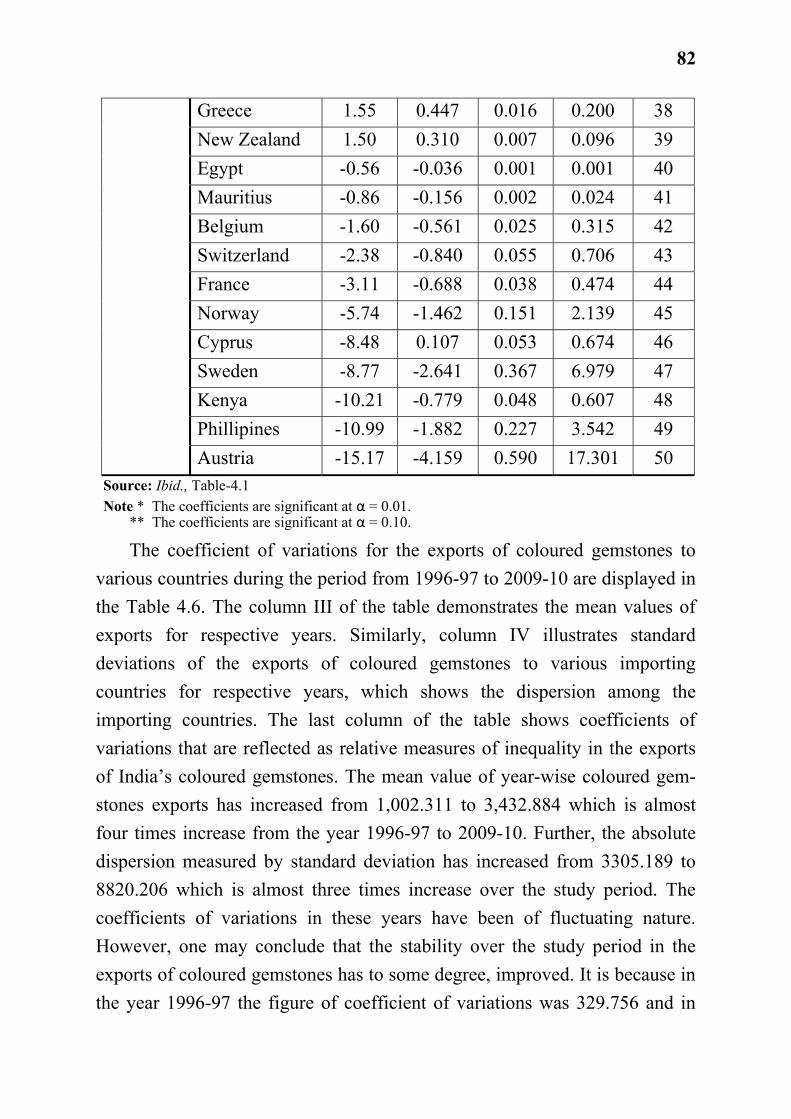
Figure-4.4 represents the country concentration indices of the exports of non-gold jewellery among the fifty importing countries during the period 1996-97 to 2009-10. The figure shows the values of six different measures of concentration viz., Index of Maximum Proportion (D1) ranges from 0.214524 to 0.560404, Hirschman Herfindhal Index (D2) ranges from 0.127377 to 0.334423, Entropy Index (D3) concentration ratio of four major importing
I II III IV V Sr. No. Year Mean Standard
Deviation Coefficient of
Variations 1 1996-97 1002.311 3305.189 329.756 2 1997-98 1162.024 4541.408 390.818 3 1998-99 1751.892 5792.298 330.631 4 1999-00 1897.648 6472.222 341.065 5 2000-01 1963.966 6396.903 325.713 6 2001-02 1914.226 6381.097 333.351 7 2002-03 2145.453 7169.367 334.165 8 2003-04 1930.014 7158.630 370.910 9 2004-05 2139.258 6333.809 296.074 10 2005-06 3421.945 12270.010 358.568 11 2006-07 2356.141 7150.119 303.467 12 2007-08 2187.480 6476.396 296.066 13 2008-09 2516.695 7235.059 287.482 14 2009-10 3432.884 8820.206 256.932
84
Figure – 4.4 Country Concentration Indices of Non-Gold Jewellery during the Period 1996-97 to 2009-10
Source: Calculated on the basis of data given in Appendix-VII
1996-97 1997-98 1998-99 1999-00 2000-01 2001-02 2002-03 2003-04 2004-05 2005-06 2006-07 2007-08 2008-09 2009-10
D1 0.463418 0.381481 0.328704 0.433536 0.485926 0.554140 0.522641 0.544735 0.544758 0.447676 0.498420 0.560404 0.214524 0.358479
D2 0.239963 0.187600 0.158897 0.214494 0.258441 0.324053 0.303395 0.316566 0.316138 0.236246 0.270079 0.334423 0.127377 0.185012
D3 0.951063 0.995395 1.031680 1.002373 0.928821 0.849894 0.837815 0.843777 0.853808 0.927428 0.915822 0.813599 1.056835 0.970471
D4 0.684911 0.671512 0.663089 0.670806 0.683699 0.743683 0.771948 0.745737 0.752868 0.734031 0.713131 0.784940 0.638990 0.716200
D5 0.834094 0.855188 0.838764 0.817058 0.848355 0.853473 0.872836 0.871802 0.856138 0.854860 0.841976 0.869212 0.862689 0.867745
D6 0.946487 0.951527 0.949485 0.927724 0.946812 0.951695 0.960855 0.955294 0.951141 0.957469 0.951210 0.959956 0.951140 0.958734
0
0.2
0.4
0.6
0.8
1
1.2
Inde
x V
alue
s
Year
85
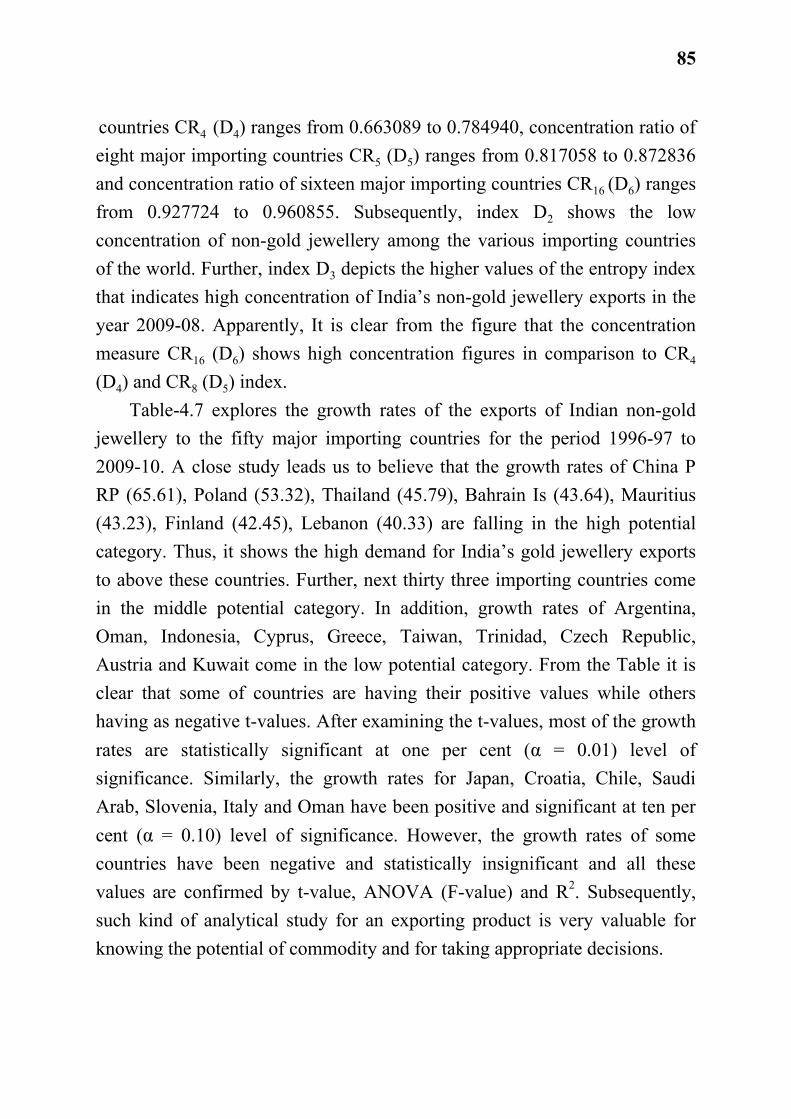
countries CR4 (D4) ranges from 0.663089 to 0.784940, concentration ratio of eight major importing countries CR5 (D5) ranges from 0.817058 to 0.872836 and concentration ratio of sixteen major importing countries CR16 (D6) ranges from 0.927724 to 0.960855. Subsequently, index D2 shows the low concentration of non-gold jewellery among the various importing countries of the world. Further, index D3 depicts the higher values of the entropy index that indicates high concentration of India’s non-gold jewellery exports in the year 2009-08. Apparently, It is clear from the figure that the concentration measure CR16 (D6) shows high concentration figures in comparison to CR4
(D4) and CR8 (D5) index. Table-4.7 explores the growth rates of the exports of Indian non-gold jewellery to the fifty major importing countries for the period 1996-97 to 2009-10. A close study leads us to believe that the growth rates of China P RP (65.61), Poland (53.32), Thailand (45.79), Bahrain Is (43.64), Mauritius (43.23), Finland (42.45), Lebanon (40.33) are falling in the high potential category. Thus, it shows the high demand for India’s gold jewellery exports to above these countries. Further, next thirty three importing countries come in the middle potential category. In addition, growth rates of Argentina, Oman, Indonesia, Cyprus, Greece, Taiwan, Trinidad, Czech Republic, Austria and Kuwait come in the low potential category. From the Table it is clear that some of countries are having their positive values while others having as negative t-values. After examining the t-values, most of the growth rates are statistically significant at one per cent (α = 0.01) level of significance. Similarly, the growth rates for Japan, Croatia, Chile, Saudi Arab, Slovenia, Italy and Oman have been positive and significant at ten per cent (α = 0.10) level of significance. However, the growth rates of some countries have been negative and statistically insignificant and all these values are confirmed by t-value, ANOVA (F-value) and R2. Subsequently, such kind of analytical study for an exporting product is very valuable for knowing the potential of commodity and for taking appropriate decisions.

86
Table – 4.7 Country-wise Growth Rates of Gems and Jewellery Products of Exports
(Non-Gold Jewellery) during the Period from 1996-97 to 2009-10 (Values in Rs. Lacs)
Category Country CAGR t-value R2 F-value Ranks
Hig
h Po
tent
ial
C
ateg
ory
China P RP 65.61 3.029* 0.433 9.178 1 Poland 53.32 5.492* 0.715 30.162 2 Thailand 45.79 4.190* 0.594 17.558 3 Bahrain Is 43.64 5.232* 0.695 27.381 4 Mauritius 43.23 3.699* 0.532 13.683 5 Finland 42.45 3.725* 0.536 13.876 6 Lebanon 40.33 3.347* 0.482 11.207 7
Mid
dle
Pote
ntia
l Cat
egor
y
South Africa 38.63 7.413* 0.820 54.953 8 Portugal 37.27 10.368* 0.899 107.479 9 Turkey 34.10 4.726* 0.650 22.341 10 Australia 34.06 5.008* 0.676 25.084 11 Hong Kong 33.92 4.109* 0.584 16.887 12 Croatia 32.08 2.366** 0.318 5.599 13 Sweden 31.48 4.168* 0.591 17.378 14 Japan 30.80 2.962** 0.422 8.774 15 Israel 30.16 4.846* 0.661 23.484 16 U.A.E. 29.13 4.207* 0.595 17.699 17 Germany 28.85 7.840* 0.836 61.475 18 Ireland 26.42 5.794* 0.736 33.580 19 Canada 25.08 6.324* 0.769 39.994 20 Netherland 23.89 6.728* 0.790 42.269 21 U.S.A. 23.83 6.964* 0.801 48.502 22 Malaysia 22.00 3.826* 0.549 14.644 23 Chile 21.55 2.080** 0.265 4.329 24 U.K. 21.52 4.717* 0.649 22.252 25 Saudi Arab 21.48 2.317** 0.309 5.368 26 Switzerland 21.30 6.184* 0.761 38.254 27

87
Belgium 21.02 3.682* 0.530 13.560 28 New Zealand 19.31 5.268* 0.698 27.755 29 Slovenia 17.32 2.102** 0.269 4.421 30 Singapore 16.60 3.084* 0.442 9.513 31 Fiji Is 16.43 1.606 0.176 2.579 32 France 16.32 5.239* 0.695 27.447 33 Korea RP 16.21 1.538 0.164 2.365 34 Brazil 14.92 1.480 0.154 2.192 35 Denmark 14.19 4.580* 0.636 20.978 36 Hungary 14.11 1.323 0.127 1.750 37 Spain 13.35 6.210* 0.762 38.57 38 Norway 10.69 1.462 0.151 2.138 39 Italy 10.39 2.299** 0.305 5.286 40
Low
Pot
entia
l cat
egor
y
Argentina 9.88 1.049 0.084 1.100 41 Oman 7.77 2.042** 0.258 4.173 42 Indonesia 5.49 0.434 0.015 0.188 43 Cyprus 5.41 0.664 0.035 0.440 44 Greece 1.55 0.579 0.027 0.336 45 Taiwan 0.02 0.003 0.000 0.000 46 Trinyded -0.56 -0.049 0.000 0.002 47 Czech Republic -1.29 -0.148 0.001 0.022 48 Austria -3.92 -0.492 0.019 0.243 49 Kuwait -12.75 -0.990 0.075 0.981 50
Source: Ibid., Table-4.1 Note * The coefficients are significant at α = 0.01. ** The coefficients are significant at α = 0.10.
Table 4.8 demonstrates the descriptive statistics of non-gold jewellery exports to importing countries during the period 1996-97 to 2009-10. The mean values of exports for the study period have been displayed in column III. Likewise, standard deviations of the exports to various countries for the period have been depicted in the column IV. The last column of the Table provides coefficients of variations. Year-wise mean values of non-gold

88
jewellery has increased from 91.530 to 2,238.680 which is twenty four times increase from the year 1996-97 to 2009-10. Similarly, the absolute dispersion measured by standard deviation has increased from 306.629 to 6,495.657, which is twenty one times increase from the year 1996-97 to 2009-10.
Table – 4.8 Descriptive Statistics of Exports of Non- Gold Jewellery during the
Period from 1996-97 to 2009-10 (Values in Rs. Lacs)
I II III IV V Sr. No.
Year Mean Standard Deviation
Coefficient of Variations
1 1996-97 91.530 306.629 335.001 2 1997-98 90.916 265.860 292.421 3 1998-99 457.009 1216.591 266.206 4 1999-00 244.265 769.463 315.011 5 2000-01 348.862 1216.790 348.788 6 2001-02 557.386 2195.346 393.864 7 2002-03 833.726 3170.234 380.249 8 2003-04 949.085 3691.797 388.984 9 2004-05 807.117 3137.301 388.704 10 2005-06 703.172 2335.681 332.159 11 2006-07 771.388 2755.396 357.199 12 2007-08 810.172 3244.943 400.525 13 2008-09 4170.073 9760.481 234.060 14 2009-10 2238.680 6495.657 290.155
Source: Ibid., Table-4.1
The coefficients of variations in these years have been of the fluctuating nature. The figure of coefficient of variations in the year 1996-97 was 335.001 and in the year 2009-10, the figure was 290.155, which means the reduction in inequality of the exports of non-gold jewellery. Obviously, it highlights that the stability over the study period in the exports of non-gold

89
Figure – 4.5 Country Concentration Indices of Costume/Fashion Jewellery during the Period 1996-97 to 2009-10
Source: Calculated on the basis of data given in Appendix-IX
1996-97 1997-98 1998-99 1999-00 2000-01 2001-02 2002-03 2003-04 2004-05 2005-06 2006-07 2007-08 2008-09 2009-10
D1 0.2590415 0.3290983 0.3318340 0.3210095 0.3147501 0.3217522 0.3696456 0.7246304 0.9059217 0.6291205 0.2197979 0.3263583 0.2344361 0.2166994
D2 0.1124455 0.1414996 0.1427315 0.1369256 0.1314945 0.1398085 0.1653185 0.5365327 0.8216806 0.4133249 0.0984978 0.1634051 0.1178597 0.1231882
D3 1.2120119 1.1578971 1.1749846 1.1602642 1.1914669 1.1498859 1.1178685 0.5601514 0.2496868 0.7225292 1.2448819 1.0523794 1.1880310 1.1496338
D4 0.556891 0.5866905 0.596687 0.585423 0.575024 0.582306 0.595901 0.890725 0.952344 0.819087 0.535552 0.712196 0.585432 0.642194
D5 0.706428 0.749753 0.740615 0.742583 0.717294 0.7674707 0.754617 0.932574 0.970475 0.882107 0.713359 0.828395 0.7540000 0.7710509
D6 0.875204 0.888739 0.871293 0.895748 0.876991 0.891852 0.896567 0.969091 0.987381 0.954849 0.862318 0.917413 0.877198 0.894786
0
0.2
0.4
0.6
0.8
1
1.2
1.4
Inde
x V
alue
s
Year

90
jewellery has improved. Figure-4.5 shows the value of six different measures of concentration of costume/fashion jewellery exports among the fifty major importing countries during the period 1996-97 to 2009-10. These measures of concentration viz., Index of Maximum Proportion (D1) Herfindhal Index (D2), Entropy Index (D3), concentration ratio of four major importing countries CR4 (D4), concentration ratio of eight importing courtiers CR8 (D5), and concentration ratio of sixteen major imparting countries CR16 (D6) ranges from value 0.216699 to 0.905921, 0.098497 to 0.821680, 0.249686 to 1.244882, 0.535552 to 0.952344, 0.706428 to 0.970475 and 0.862318 to 0.987381, respectively. Further, in the figure-4.4 index D2 has been displaying fluctuating nature regarding concentration of the group except the year 2004-05 which is showing the highest value of index D2. Index D3 depicts also the fluctuating information about the concentration except the year 2004-05 which is revealing the lowest value of index D3. From the figure, it is clear that the concentration measures CR16 (D6) gives high concentration figures in comparison to CR4 (D4) and CR8 (D5) index. Table-4.9 represents the country-wise growth rates of the exports of Indian costume/fashion jewellery to the fifty major importing countries during the period 1996-97 to 2009-10. It is clear from the Table that the growth rates of Turkey (82.35), Fiji Is (69.49), Portugal (50.77) and Thailand (41.08) are falling in the high potential category which indicates an increasing trend of the exports of costume/fashion jewellery in the above importing centuries. Undoubtedly, there is an great potential for exports of costume/fashion jewellery in the markets of the above mentioned countries Further, thirty five countries come in the middle potential category and the last eleven countries are falling in the low potential category. It is clear from the Table that the most of the growth rates are statistically significant at one per cent (α = 0.01) level of significance. Similarly, the growth rates for the UAE, Sweden and Kuwait have been positive and significant at ten per cent (α = 0.10) level of significance. However, the t-values of growth rates of

91
Table – 4.9 Country-wise Growth Rates of Gems and Jewellery Products of Exports (Costume/Fashion Jewellery) during the Period from 1996-97 to 2009-10 (Values in Rs. Lacs)
Category Country CAGR t-value R2 F-value Ranks
Hig
h Po
tent
ial
Cat
egor
y
Turkey 82.35 6.533* 0.780 42.682 1 Fiji Is 69.49 4.001* 0.571 16.015 2 Portugal 50.77 7.343* 0.817 53.925 3 Thailand 41.08 4.342* 0.611 18.853 4
Mid
dle
Pote
ntia
l Cat
egor
y
Spain 38.08 21.175* 0.973 448.412 5 UAE 37.35 2.924** 0.416 8.550 6 Greece 36.33 6.363* 0.771 40.489 7 Egypt 33.91 7.370* 0.819 54.324 8 Sri Lanka 32.91 5.977* 0.748 35.728 9 UK 32.69 19.472* 0.969 379.164 10 Denmark 32.11 6.586* 0.783 43.383 11 Australia 31.89 7.420* 0.821 55.069 12 Finland 31.79 4.612* 0.639 21.271 13 Senegal 30.23 9.599* 0.884 92.148 14 Poland 27.85 3.765* 0.541 14.178 15 France 27.73 5.175* 0.690 26.787 16 Ghana 27.36 5.884* 0.742 34.624 17 South Africa 26.91 7.701* 0.831 59.312 18 Austria 26.15 4.257* 0.601 18.127 19 Germany 25.52 8.3158 0.852 69.143 20 Netherland 25.22 6.969* 0.801 48.574 21 Nigeria 24.47 5.088* 0.683 25.897 22 Sudan 23.99 8.767* 0.864 76.872 23 Israel 22.98 6.113* 0.756 37.371 24 Canada 20.44 10.469* 0.901 109.615 25 Italy 20.17 5.764* 0.734 33.234 26

92
Afghanistan 19.40 4.449* 0.662 23.519 27 New Zeland 19.00 6.984* 0.802 48.784 28 Switzerland 18.99 4.530* 0.631 20.521 29 Malaysia 17.11 7.371* 0.819 54.343 30 Norway 16.38 3.515* 0.507 12.355 31 Mauritius 15.99 6.626* 0.785 43.915 32 USA 14.85 8.128* 0.846 66.078 33 Balgium 14.54 5.438* 0.711 29.58 34 Swedan 14.17 2.656** 0.370 7.054 35 Ymen Republic 14.11 6.870* 0.797 47.198 36 Japan 12.58 4.974* 0.673 24.745 37 Qatar 11.81 2.065** 0.262 4.265 38 Tanzania 11.59 3.449* 0.497 11.901 39
Low
Pot
entia
l Cat
egor
y
Kuwait 9.91 1.895** 0.230 3.594 40 Baharain Is 9.89 1.628 0.180 2.651 41 Oman 9.37 1.659 0.186 2.753 42 Kenya 9.00 3.093* 0.443 9.569 43 Singapore 8.79 1.328 0.128 1.765 44 Saudi Arab 8.26 4.438* 0.621 19.700 45 Hong Kong 6.59 1.585 0.173 2.514 46 Jordan 6.37 0.859 0.057 0.738 47 Ethiopia -4.48 -0.670 0.036 0.449 48 Bangladesh -9.47 -1.219 0.110 1.486 49 Russia -18.40 -2.924 0.416 8.554 50
Source: Ibid., Table-4.1 Note * The coefficients are significant at α = 0.01. ** The coefficients are significant at α = 0.10.
Ethiopia, Bangladesh and Russia have been negative and statistically insignificant and all these values are confirmed by t-value and R2. Table-4.10 represents descriptive statistics of the costume/fashion jewellery exports to various importing countries during the period from 1996-97 to 2009-10. The column III of the table displays the mean values of

93
costume/fashion jewellery exports for the study period. Similarly, column IV depicts standard deviations of the year-wise exports to various importing countries. The last column of the Table provides coefficient of variations which is considered as relative measures of inequality in gems and jewellery
Table – 4.10 Descriptive Statistics of Exports of Costume/Fashion Jewellery during
the Period from 1996-97 to 2009-10 (Values in Rs. Lacs)
I II III IV V Sr. No.
Year Mean Standard Deviation
Coefficient of Variations
1 1996-97 131.305 285.166 217.177 2 1997-98 184.353 458.997 248.977 3 1998-99 202.717 507.272 250.236 4 1999-00 283.386 692.159 244.245 5 2000-01 386.475 921.765 238.505 6 2001-02 311.054 769.045 247.238 7 2002-03 379.985 1034.662 272.290 8 2003-04 1710.327 8780.111 513.358 9 2004-05 5987.253 38291.317 639.547 10 2005-06 2863.307 12826.722 447.968 11 2006-07 911.391 1823.919 200.124 12 2007-08 1412.133 3819.707 270.491 13 2008-09 1299.607 2903.931 223.446 14 2009-10 1602.657 3677.290 229.449
Source: Ibid., Table-4.1
exports of India. The mean value of year-wise exports of costume/fashion jewellery has increased from 131.305 to 1,602.657 which is twelve times increased from the year 1996-97 to 2009-10. Further, absolute dispersion measured by standard deviation has increased from 285.166 to 3,677.290 which is almost thirteen times increased in fourteen years (1996-97 to 2009-
94
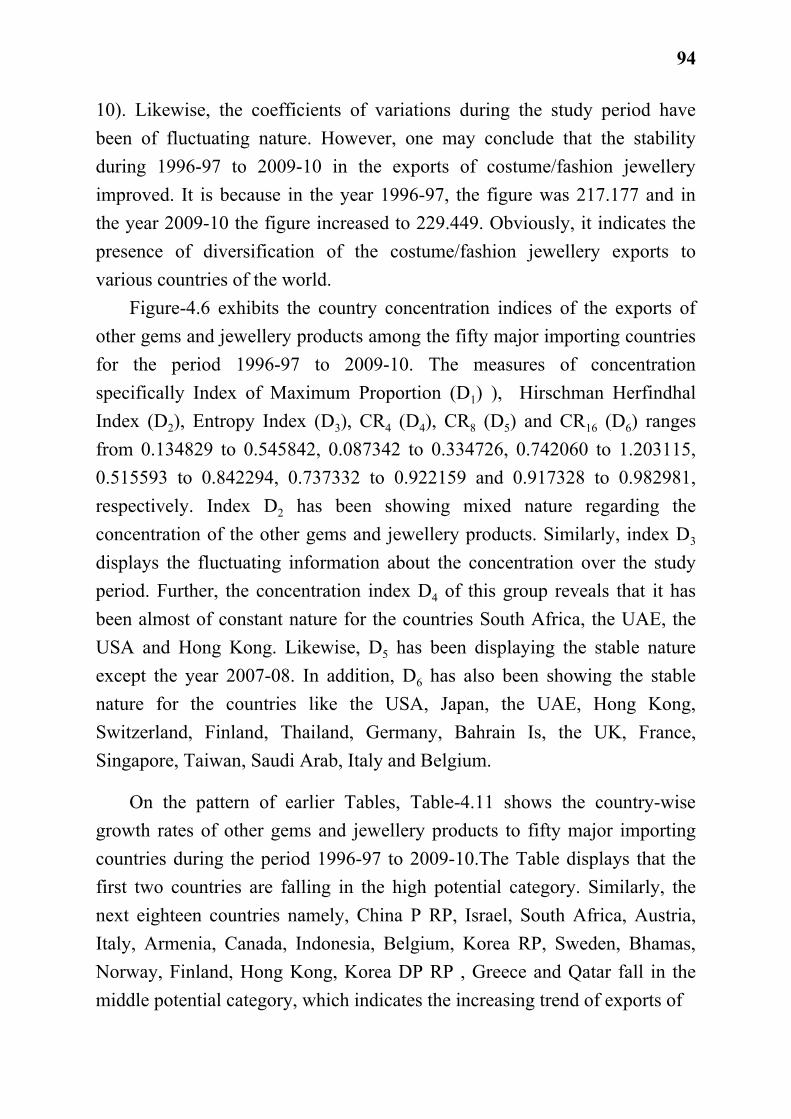
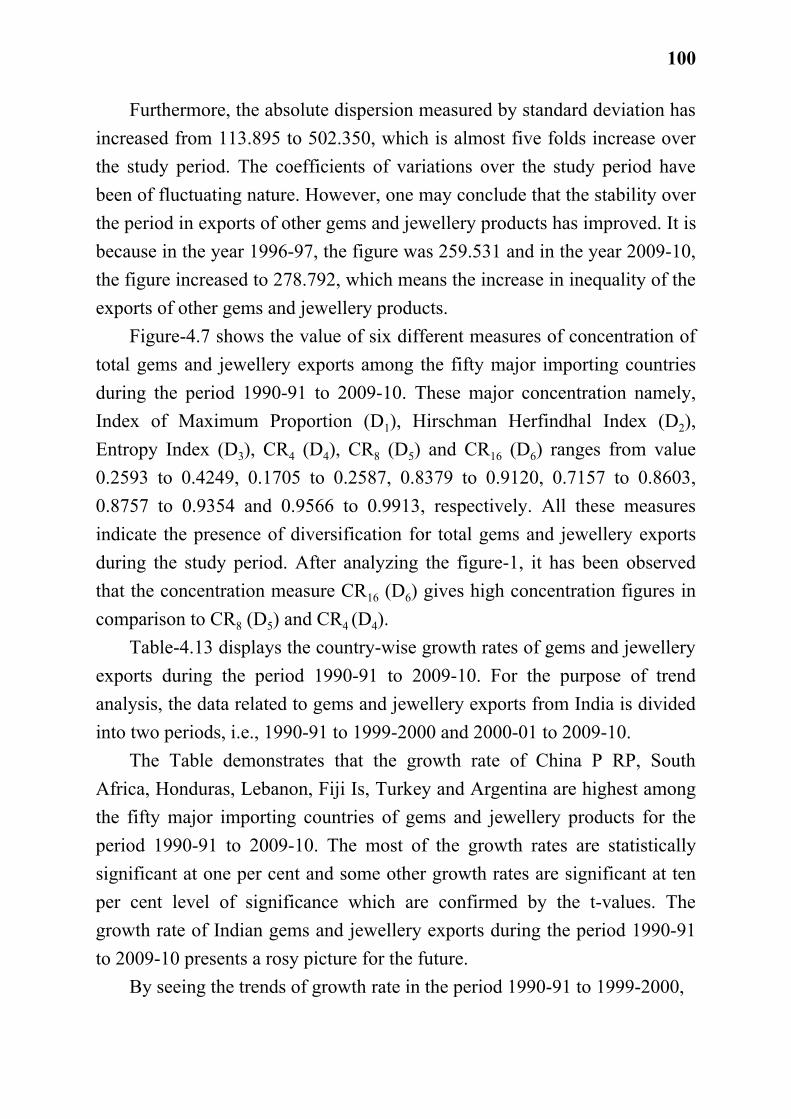
10). Likewise, the coefficients of variations during the study period have been of fluctuating nature. However, one may conclude that the stability during 1996-97 to 2009-10 in the exports of costume/fashion jewellery improved. It is because in the year 1996-97, the figure was 217.177 and in the year 2009-10 the figure increased to 229.449. Obviously, it indicates the presence of diversification of the costume/fashion jewellery exports to various countries of the world. Figure-4.6 exhibits the country concentration indices of the exports of other gems and jewellery products among the fifty major importing countries for the period 1996-97 to 2009-10. The measures of concentration specifically Index of Maximum Proportion (D1) ), Hirschman Herfindhal Index (D2), Entropy Index (D3), CR4 (D4), CR8 (D5) and CR16 (D6) ranges from 0.134829 to 0.545842, 0.087342 to 0.334726, 0.742060 to 1.203115, 0.515593 to 0.842294, 0.737332 to 0.922159 and 0.917328 to 0.982981, respectively. Index D2 has been showing mixed nature regarding the concentration of the other gems and jewellery products. Similarly, index D3 displays the fluctuating information about the concentration over the study period. Further, the concentration index D4 of this group reveals that it has been almost of constant nature for the countries South Africa, the UAE, the USA and Hong Kong. Likewise, D5 has been displaying the stable nature except the year 2007-08. In addition, D6 has also been showing the stable nature for the countries like the USA, Japan, the UAE, Hong Kong, Switzerland, Finland, Thailand, Germany, Bahrain Is, the UK, France, Singapore, Taiwan, Saudi Arab, Italy and Belgium.
On the pattern of earlier Tables, Table-4.11 shows the country-wise growth rates of other gems and jewellery products to fifty major importing countries during the period 1996-97 to 2009-10.The Table displays that the first two countries are falling in the high potential category. Similarly, the next eighteen countries namely, China P RP, Israel, South Africa, Austria, Italy, Armenia, Canada, Indonesia, Belgium, Korea RP, Sweden, Bhamas, Norway, Finland, Hong Kong, Korea DP RP , Greece and Qatar fall in the middle potential category, which indicates the increasing trend of exports of

95
Figure – 4.6 Country Concentration Indices of Other Gems and Jewellery Products during the Period 1996-97 to 2009-10
Source: Calculated on the basis of data given in Appendix-XI
1996-97 1997-98 1998-99 1999-00 2000-01 2001-02 2002-03 2003-04 2004-05 2005-06 2006-07 2007-08 2008-09 2009-10
D1 0.259066 0.375261 0.343667 0.281652 0.373327 0.193519 0.301311 0.232885 0.246566 0.390832 0.225908 0.134829 0.545842 0.299938
D2 0.152018 0.195023 0.174319 0.139034 0.183997 0.125898 0.176680 0.150751 0.134620 0.199202 0.144422 0.087342 0.334726 0.172341
D3 0.988301 0.913287 0.952824 1.028025 0.968539 1.026106 0.948144 0.991814 1.049335 0.946832 1.003662 1.203115 0.742060 0.956453
D4 0.663827 0.739681 0.702930 0.658901 0.659064 0.648272 0.707854 0.713859 0.654977 0.696598 0.698776 0.515593 0.842294 0.735945
D5 0.890742 0.910381 0.904184 0.829522 0.873120 0.877058 0.886275 0.864391 0.835219 0.880698 0.867277 0.737332 0.922159 0.882252
D6 0.977491 0.982981 0.976273 0.981799 0.97128 0.982074 0.978652 0.972148 0.967796 0.966415 0.967596 0.917328 0.978674 0.973730
0
0.2
0.4
0.6
0.8
1
1.2
1.4
Inde
x V
alue
s
Year

96
Table – 4.11 Country-wise Growth Rates of Gems and Jewellery Products of Exports
(Other Gems and Jewellery Products) during the Period from 1996-97 to 2009-10 (Values in Rs. Lacs)
Category Country CAGR t-value R2 F-value Ranks
Hig
h Po
tent
ial
Cat
egor
y Lebanon 47.01 4.672* 0.645 21.834 1 Brazil 44.54 5.194* 0.692 26.979 2
Mid
dle
Pote
ntia
l Cat
egor
y
China P RP 37.09 4.181* 0.592 17.481 3 Israel 33.61 3.748* 0.539 14.051 4 South Africa 24.81 1.162 0.101 1.351 5 Austria 23.55 1.517 0.161 2.303 6 Italy 20.09 1.987** 0.247 3.951 7 Armenia 20.07 1.684 0.191 2.837 8 Canada 18.77 2.560** 0.353 6.558 9 Indonesia 16.62 2.186** 0.284 4.782 10 Belgium 16.36 0.935 0.068 0.875 11 Korea RP 16.13 2.442** 0.331 5.963 12 Sweden 14.44 1.871** 0.225 3.502 13 Bhamas 13.42 1.021 0.079 1.042 14 Norway 13.38 1.303 0.123 1.698 15 Finland 13.07 1.048 0.083 1.098 16 Hong Kong 12.57 2.009** 0.251 4.037 17 Korea DP RP 11.64 0.861 0.058 0.741 18 Greece 11.32 1.266 0.117 1.603 19 Qatar 10.30 1.600 0.175 2.561 20
U A E 9.80 1.220 0.110 1.488 21 Sri Lanka 9.57 0.099 0.922 0.066 22 Spain 7.83 0.898 0.063 0.807 23 Singapore 6.13 0.423 0.014 0.179 24 Switzerland 5.95 1.550 0.100 1.335 25 Chile 3.58 0.516 0.021 0.266 26 Cyprus 3.21 0.564 0.025 0.318 27

97
Low
Pot
entia
l Cat
egor
y Russia 2.68 0.210 0.003 0.044 28 Oman 1.70 0.220 0.004 0.048 29 Mauritius 1.59 0.285 0.006 0.081 30 New Zealand 0.99 0.142 0.001 0.020 31 U S A 0.87 0.191 0.003 0.036 32 U K 0.70 0.183 0.002 0.033 33 Portugal 0.52 0.083 0.000 0.006 34 France 0.37 0.044 0.000 0.001 35 Australia 0.21 0.037 0.000 0.001 36 Germany -0.38 -0.083 0.000 0.006 37 Thailand -0.68 -0.097 0.000 0.009 38 Ireland -5.16 -0.992 0.075 0.985 39 Japan -5.79 -1.793 0.211 3.216 40 Denmark -5.83 -0.863 0.058 0.746 41 Nigeria -6.95 -1.321 0.127 1.745 42 Malaysia -7.36 -0.854 0.057 0.730 43 Kenya -8.84 -1.066 0.086 1.136 44 Soudi Arab -11.06 -1.639 0.182 2.686 45 Bahrain Is -13.21 -2.366 0.318 5.598 46 Netherland -13.83 -1.582 0.172 2.503 47 Czech Republic -15.47 -1.786 0.210 3.189 48 Taiwan -16.05 -1.920 0.235 3.687 49 Kuwait -1788 -0.647 0.033 0.419 50
Source: Ibid., Table-4.1 Note * The coefficients are significant at α = 0.01. ** The coefficients are significant at α = 0.10.
other gems and jewellery products for these countries. However, the rest of the countries are falling in the third low potential category. After examining t-values, the growth rates values for Lebanon, Brazil, China P RP and Israel are positive and statistically significant at one per cent (α =0.01) level of significance. However, Germany, Thailand, Ireland, Japan, Denmark, Saudi

98
Arab, Nigeria, Malaysia, Kenya, Taiwan and Kuwait are negative and statistically insignificant. All these results are based on t-test. Table-4.12 demonstrates the descriptive statistics of the other gems and jewellery products exports to various importing countries for the period 1996-97 to 2009-10.The column III of the Table shows the mean values of exports for the period. Likewise, column IV depicts standard deviations of the exports to various importing countries for the study period. The last column of the Table gives coefficients of variations. The mean value of exports of other gems and jewellery products has increased from 43.885 to 180.187, which is four folds increase from the year 1996-97 to 2009-10.
Table – 4.12
Descriptive Statistics of Exports of Other Gems and Jewellery Products during the Period from 1996-97 to 2009-10
(Values in Rs. Lacs) I II III IV V
Sr. No.
Year Mean Standard Deviation
Coefficient of Variations
1 1996-97 43.885 113.895 259.531 2 1997-98 74.495 222.613 298.827 3 1998-99 56.308 157.998 280.596 4 1999-00 51.175 126.115 246.438 5 2000-01 52.117 150.755 289.261 6 2001-02 58.418 135.788 232.443 7 2002-03 111.032 313.928 282.735 8 2003-04 16.709 415.085 258.282 9 2004-05 247.985 599.692 241.825 10 2005-06 69.668 210.660 302.373 11 2006-07 42.427 107.000 251.953 12 2007-08 45.108 83.613 185.360 13 2008-09 179.765 720.352 400.718 14 2009-10 180.187 502.350 278.792
Source: Ibid., Table-4.1
99
Figure – 4.7 Country Concentration Indices of Total Gems and Jewellery Exports during the Period 1990-91 to 2009-10
Source: Calculated on the basis of data given in Appendix-XIII
1990-91 1991-92 1992-93 1993-94 1994-95 1995-96 1996-97 1997-98 1998-99 1999-00 2000-01 2001-02 2002-03 2003-04 2004-05 2005-06 2006-07 2007-08 2008-09 2009-10
D1 0.3197 0.3239 0.3767 0.3346 0.3316 0.3106 0.3445 0.3749 0.387 0.3843 0.3695 0.3596 0.3663 0.3509 0.2948 0.2812 0.3028 0.2593 0.3838 0.4249
D2 0.1917 0.1864 0.2157 0.2054 0.2071 0.1961 0.2046 0.2223 0.2214 0.2286 0.217 0.2081 0.1975 0.2033 0.1762 0.1705 0.194 0.1874 0.2174 0.2587
D3 0.866 0.8848 0.8395 0.8387 0.8382 0.8568 0.868 0.8484 0.864 0.8379 0.8538 0.8703 0.9028 0.8754 0.9109 0.912 0.8718 0.8785 0.884 0.7827
D4 0.8223 0.8136 0.7457 0.8132 0.8402 0.8274 0.8138 0.8136 0.7949 0.8014 0.7887 0.7823 0.7157 0.7997 0.7747 0.7508 0.8132 0.8167 0.8033 0.8603
D5 0.9276 0.9206 0.8851 0.9331 0.9334 0.9328 0.9192 0.9206 0.9159 0.9264 0.9232 0.9255 0.8757 0.919 0.9244 0.9354 0.9331 0.9268 0.8986 0.9342
D6 0.9913 0.9829 0.9789 0.9823 0.9906 0.9881 0.984 0.9829 0.9801 0.9867 0.988 0.9854 0.9566 0.9846 0.9848 0.9815 0.9823 0.9839 0.9729 0.9845
0
0.2
0.4
0.6
0.8
1
1.2
Inde
x V
alue
s
Year
100
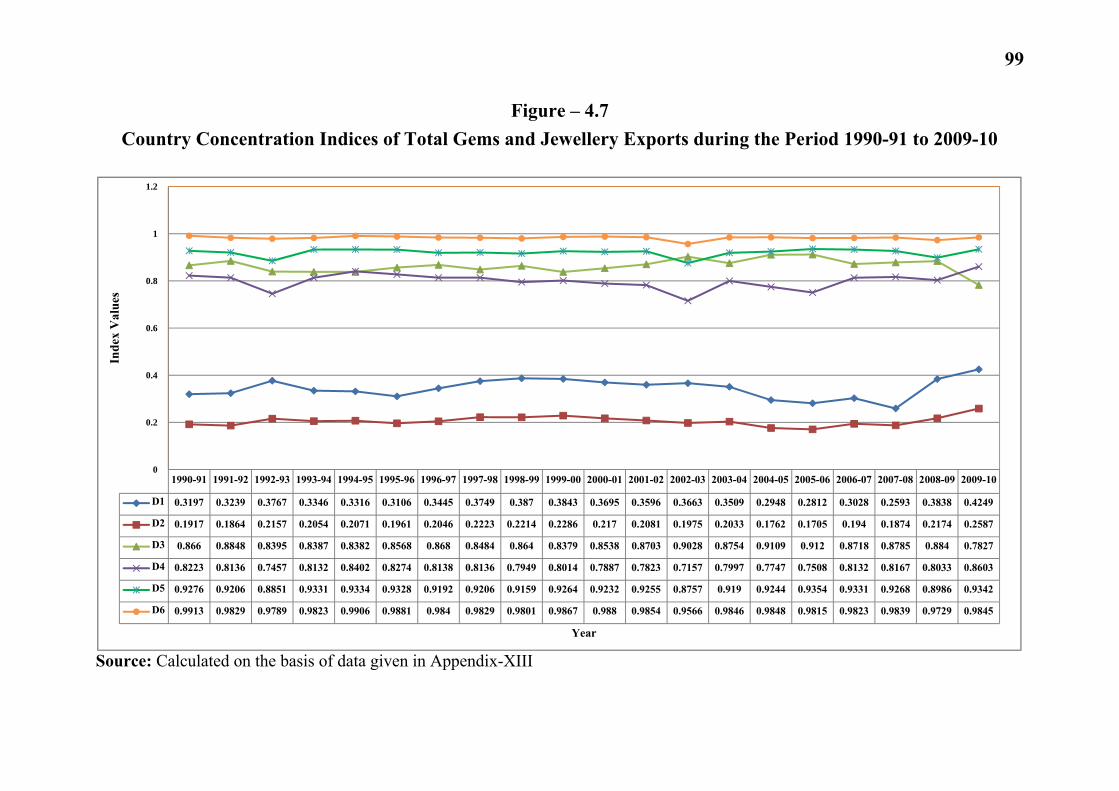
Furthermore, the absolute dispersion measured by standard deviation has increased from 113.895 to 502.350, which is almost five folds increase over the study period. The coefficients of variations over the study period have been of fluctuating nature. However, one may conclude that the stability over the period in exports of other gems and jewellery products has improved. It is because in the year 1996-97, the figure was 259.531 and in the year 2009-10, the figure increased to 278.792, which means the increase in inequality of the exports of other gems and jewellery products. Figure-4.7 shows the value of six different measures of concentration of total gems and jewellery exports among the fifty major importing countries during the period 1990-91 to 2009-10. These major concentration namely, Index of Maximum Proportion (D1), Hirschman Herfindhal Index (D2), Entropy Index (D3), CR4 (D4), CR8 (D5) and CR16 (D6) ranges from value 0.2593 to 0.4249, 0.1705 to 0.2587, 0.8379 to 0.9120, 0.7157 to 0.8603, 0.8757 to 0.9354 and 0.9566 to 0.9913, respectively. All these measures indicate the presence of diversification for total gems and jewellery exports during the study period. After analyzing the figure-1, it has been observed that the concentration measure CR16 (D6) gives high concentration figures in comparison to CR8 (D5) and CR4 (D4). Table-4.13 displays the country-wise growth rates of gems and jewellery exports during the period 1990-91 to 2009-10. For the purpose of trend analysis, the data related to gems and jewellery exports from India is divided into two periods, i.e., 1990-91 to 1999-2000 and 2000-01 to 2009-10. The Table demonstrates that the growth rate of China P RP, South Africa, Honduras, Lebanon, Fiji Is, Turkey and Argentina are highest among the fifty major importing countries of gems and jewellery products for the period 1990-91 to 2009-10. The most of the growth rates are statistically significant at one per cent and some other growth rates are significant at ten per cent level of significance which are confirmed by the t-values. The growth rate of Indian gems and jewellery exports during the period 1990-91 to 2009-10 presents a rosy picture for the future. By seeing the trends of growth rate in the period 1990-91 to 1999-2000,

101
Table – 4.13
Country-wise Growth Rates of Total Gems and Jewellery Products during the Period from 1990-91 to 2009-10
(Values in Rs. Lacs) Sr. No. Country CAGR t-value R2 F-value
1 U.S.A. 13.97 14.590* 0.922 212.89 α 22.58 15.620* 0.968 243.988 β 6.65 7.501* 0.875 56.275 2 U.A.E. 39.1 23.391* 0.968 547.16 α 28.11 5.925* 0.814 35.111 β 45.31 13.673* 0.958 186.964 3 Hong Kong 18.38 17.402* 0.943 302.831 α 27.54 8.493* 0.900 72.143 β 16.67 16.335* 0.970 266.853 4 Belgium 11.75 21.705* 0.963 471.141 α 16.59 17.595* 0.974 309.599 β 8.83 9.336* 0.915 87.171 5 Singapore 19.09 8.548* 0.802 73.076 α 18.99 4.929* 0.752 24.297 β 15.34 1.815** 0.291 3.295 6 Israel 22.27 17.863* 0.946 319.119 α 33.26 17.115* 0.973 292.95 β 14.68 5.753* 0.805 33.099 7 Japan 1.68 1.849** 0.159 3.419 α 4.94 1.691 0.263 2.862 β -2.29 -1.262 0.166 1.594 8 Thailand 11.43 10.841* 0.867 117.539 α 13.57 3.577* 0.615 12.799 β 6.139 4.389* 0.706 19.263 9 U.K. 15.67 18.189* 0.948 330.839 α 20.75 11.499* 0.942 132.232

102
β 11.38 4.907* 0.750 24.082 10 Switzerland 11.24 8.531* 0.801 72.791 α 20.22 11.193* 0.939 125.304 β 1.15 0.443 0.023 0.196
11 Australia 19.92 28.410* 0.978 807.173 α 14.46 15.945* 0.969 254.25 β 24.82 15.756* 0.968 248.257
12 Canada 20.00 12.222* 0.892 149.396 α 38.23 13.921* 0.96 193.814 β 13.63 5.904* 0.813 34.863
13 France 11.52 12.771* 0.900 163.118 α 15.25 10.642* 0.934 113.259 β 13.83 4.328* 0.700 18.737
14 Germany 10.80 9.754* 0.840 95.155 α 15.16 10.322* 0.930 106.558 β 14.51 3.628* 0.621 13.163
15 Italy 20.2 14.848* 0.924 220.463 α 16.99 3.633* 0.622 13.199 β 17.04 6.039* 0.820 36.472
16 Kenya 28.18 4.278* 0.504 18.308 α 57.01 2.307** 0.399 5.322 β 23.49 1.619 0.246 2.623
17 Argentina 50.32 7.536* 0.759 56.795 α 98.82 5.978* 0.817 35.746 β 31.53 1.655 0.255 2.741
18 Austria 7.28 3.039* 0.339 9.235 α 26.07 5.619* 0.797 31.573 β 6.99 1.039 0.118 1.080
19 Bahamas 49.83 3.599* 0.418 12.959 α -7.65 -0.223 0.006 0.050 β 71.66 2.073** 0.349 4.300

103
20 Bharain Is 19.47 6.823* 0.721 46.564 α 37.82 4.971* 0.755 24.712 β 15.34 1.976** 0.328 3.908
21 Chile 45.05 4.978* 0.579 24.781 α 93.24 2.944* 0.52 8.671 β 37.63 1.608 0.244 2.587
22 Puerto Rico 37.39 4.218* 0.497 17.797 α 5.62 0.562 0.038 0.316 β 50.38 1.415 0.200 2.002
23 China P RP 86.11 9.427* 0.831 88.868 α 120.31 3.260* 0.570 10.63 β 126.05 8.572* 0.901 73.481
24 Cyprus -7.52 -2.176 0.208 4.736 α 28.85 6.940* 0.857 48.164 β -20.94 -3.441 0.596 11.84
25 Denmark 20.07 7.512* 0.758 56.431 α 43.72 7.703* 0.881 59.341 β 25.48 4.001* 0.666 16.009
26 Finland 25.13 13.152* 0.905 172.981 α 24.10 5.097* 0.764 25.981 β 22.73 3.511* 0.606 12.327
27 Malaysia 22.04 12.721* 0.899 161.824 α 17.25 3.384* 0.588 11.457 β 19.89 4.132* 0.681 17.081
28 Kuwait 8.59 3.172* 0.358 10.064 α 30.42 4.605* 0.726 21.206 β 7.64 1.149 0.141 1.322
29 Fiji Is 61.73 6.483* 0.700 42.035 α 137.16 4.193* 0.687 17.586 β -5.65 -1.241 0.161 1.541
30 Indonesia 14.3 2.418** 0.245 5.851

104
α 21.11 0.961 0.103 0.924 β 26.24 2.002** 0.333 4.008
31 Greece 16.74 5.478* 0.625 30.014 α 22.91 2.015** 0.336 4.063 β 12.80 2.031** 0.340 4.127
32 Honduras 63.85 4.106* 0.483 16.86 α 1.81 0.041 0.0001 0.001 β 27.88 1.624 0.248 2.640
33 Ireland 17.76 5.765* 0.648 33.245 α 21.70 1.842* 0.297 3.393 β 8.56 1.749** 0.276 3.059
34 Korea RP 38.73 13.742* 0.912 188.863 α 24.74 5.700* 0.802 32.497 β 51.82 5.237* 0.774 27.432
35 Lebanon 62.77 7.176* 0.741 51.499 α 172.08 5.860* 0.811 34.345 β 8.83 2.781* 0.491 7.739
36 Mauritius 27.32 3.876* 0.454 15.025 α 125.84 5.899* 0.813 34.806 β 12.56 1.821** 0.293 3.316
37 Netherland 7.21 3.453* 0.398 11.927 α 8.32 1.886** 0.307 3.558 β 5.46 0.715 0.060 0.512
38 New Zealand 13.48 16.566* 0.938 274.457 α 12.36 4.162* 0.684 17.325 β 15.18 9.264* 0.914 85.840
39 Norway 19.22 6.038* 0.669 36.460 α 49.39 12.092* 0.948 146.210 β 12.58 1.425 0.202 2.032
40 Oman 4.41 2.071** 0.192 4.291 α 14.24 2.567** 0.451 6.592

105
β 6.26 0.969 0.105 0.939 41 Poland 45.32 7.493* 0.757 56.198 α 32.70 1.674 0.259 2.805 β 83.16 6.578* 0.843 43.277
42 Qatar 5.88 2.110** 0.198 4.453 α 20.04 2.653** 0.468 7.042 β 17.89 2.586** 0.455 6.688
43 Russia 40.96 4.231* 0.498 17.907 α 138.11 3.443* 0.597 11.856 β 24.68 1.725** 0.271 2.976
44 Saudi Arab 19.8 5.986* 0.665 35.834 α 51.87 6.566* 0.843 43.115 β 26.42 4.060* 0.673 16.491
45 South Africa 70.63 9.2318 0.825 85.224 α 168.56 6.596* 0.844 43.51 β 31.96 4.649* 0.729 21.614
46 Spain 24.04 18.062* 0.947 326.239 α 32.06 7.087* 0.862 50.231 β 21.68 9.112* 0.912 83.045
47 Sri Lanka 20.51 4.839* 0.565 23.423 α 51.56 4.179* 0.685 17.467 β 5.03 0.551 0.036 0.304
48 Sweden 22.06 6.979* 0.730 48.716 α 41.67 4.429* 0.710 19.619 β 14.24 1.854** 0.300 3.439
49 Maxico -73.32 4.895* 0.571 23.968 α 30.91 1.421 0.201 2.021 β 12.11 0.947 0.100 0.897
50 Turkey 52.59 10.687* 0.863 114.232 α 53.80 2.826** 0.499 7.988 β 33.80 5.628* 0.798 31.683

106
51 Others 35.26 10.222* 0.853 104.491 α 37.3 4.690* 0.733 22.004 β 25.63 2.228** 0.382 4.965
Source: Calculated on the basis of data collected from Foreign Trade Statistics of India, Director General of Commercial Intelligence and Statistics (DGCI&S), Ministry of Commerce, Government of India, Kolkata.
Note: α Denote the period from 1990-91 to 1999-2000.
β Denote the period from 2000-2001 to 2009-2010
* The coefficients are significant at α = 0.01.
** The coefficients are significant at α = 0.10.
it is clear that the growth rate of gems and jewellery exports from India to various importing countries have increased much more as compared to total period of twenty years, i.e., 1990-91 to 2009-10. For example, the growth rate of the USA, Hong Kong, Belgium, Israel, Japan, Thailand, the UK, Switzerland, Canada, France, Germany, Kenya, Argentina, Austria, Bahrain Is, Chile, China P RP, Cyprus, Denmark, Kuwait, Fiji Is, Indonesia, Greece, Ireland, Lebanon, Mauritius, Netherland, Norway, Oman, Qatar, Russia, Saudi Arab, South Africa, Spain, Sri Lanka, Sweden and Turkey were higher as compared to the total period. The increasing growth rate of gems and jewellery exports for the period 1990-91 to 1999-2000 stresses the positive effects of Globalization, Privatization and Liberalization (LPG) on exports of gems and jewellery products. The Table also represents the growth rate of gems and jewellery exports for the period 2000-2001 to 2009-10. After studying the growth rate of gems and jewellery exports from India to various importing countries during the period 2000-01 to 2009-10, we can conclude that the growth rate of some countries have increased but also have decreased for some countries as compared to total period of twenty years (1990-91 to 2009-10). For example, the growth rate of the UAE, Australia, France, Bhamas, Puerto Rico, China P RP, Denmark, Indonesia, Korea RP, New Zealand, Oman, Poland, Qatar, Saudi Arab and Maxico was higher as compared to the total period. On the other hand, some countries have been showing negative trends in the period 2000-01 to 2009-10, which shows the negative effect of LPG and some other

107
factors related to supply of India’s gems and jewellery exports during the period 2000-01 to 2009-10. Table-4.14 illustrates the descriptive statistics of the total gems and jewellery exports to various countries during the period from 1990-91 to
Table – 4.14 Descriptive Statistics of Total Gems and Jewellery Exports during the
Period 1990-91 to 2009-10 (Values in Rs. Lacs)
I II III IV V Sr. No.
Year Mean Standard Deviation
Coefficient of Variations
1 1990-91 10215.762 30573.639 299.279 2 1991-92 13235.502 38990.765 294.592 3 1992-93 17331.594 55363.745 319.438 4 1993-94 24573.260 76410.456 310.949 5 1994-95 27712.857 86561.470 312.351 6 1995-96 34597.979 104862.562 303.088 7 1996-97 33024.528 102452.211 310.231 8 1997-98 37281.477 121087.270 324.792 9 1998-99 48703.342 157807.613 324.180 10 1999-00 64880.407 213967.607 329.787 11 2000-01 66197.463 212175.043 320.518 12 2001-02 68318.241 213973.177 313.200 13 2002-03 84013.470 255632.852 304.276 14 2003-04 94693.840 292727.824 309.130 15 2004-05 120746.225 344699.300 285.474 16 2005-06 134960.982 378231.436 280.252 17 2006-07 138283.232 416508.060 301.199 18 2007-08 155180.209 458559.498 295.501 19 2008-09 249851.631 801616.630 320.837 20 2009-10 269020.223 948820.895 352.695
Source: Ibid., Table 4.13.

108
2009-10. The column III of the Table displays the mean values of total gems and jewellery exports for the study period. Similarly, column IV depicts standard deviations of the year-wise exports to various countries, which highlights the dispersion among the importing countries. The last column of the table provides coefficients of variations, which is considered as relative measures of inequality, in gems and jewellery exports of India. The mean value of year-wise total exports of gems and jewellery has increased from 10,215.762 to 2,69,020.223 which is twenty six times increase from the year 1990-91 to 2009-10. Further, absolute dispersion measured by standard deviation has increased from 30,573.639 to 9,48,820.895 which is thirty one fold increase in twenty years (1990-91 to 2009-10). Likewise, the coefficients of variations during the study period have been of fluctuating nature. However, one may conclude that the stability over the study period in the exports of gems and jewellery has, to some extent, improved. It is because in the year 1990-91, the figure was 299.279 and in the year 2009-10 the figure increased to 352.695. Obviously, it signifies the presence of diversification of the gems and jewellery exports from India to various importing countries. Table-4.15 reveals the growth rate and ranks of fifty major importing countries of India’s gems and jewellery exports during the period 1990-91 to 2009-10. The Table displays that China P RP, South Africa, Honduras, Lebanon, Fiji Is, Turkey, Argentina, Bhamas, Poland, Chile and Russia are the eleven largest importers of India’s gems and jewellery products in the world. From the Table it is also clear that South Africa, China P RP, Honduras, Lebanon, Fiji Is, Turkey and Argentina are very lucrative markets for the Indian gems and jewellery products not only because of being the largest rank (1 to 7), but also due to their continuous positive annual growth rate, i.e., 86.11, 70.63, 63.85, 61.73, 52.59 and 50.32 per cent, respectively. Further, the next thirty two countries come in the middle potential category which indicates only marginal demand for Indian gems and jewellery exports. Moreover, the category of low potential countries consisting of Aus- tria, Kuwait and Netherland have been positive and statistically significant at
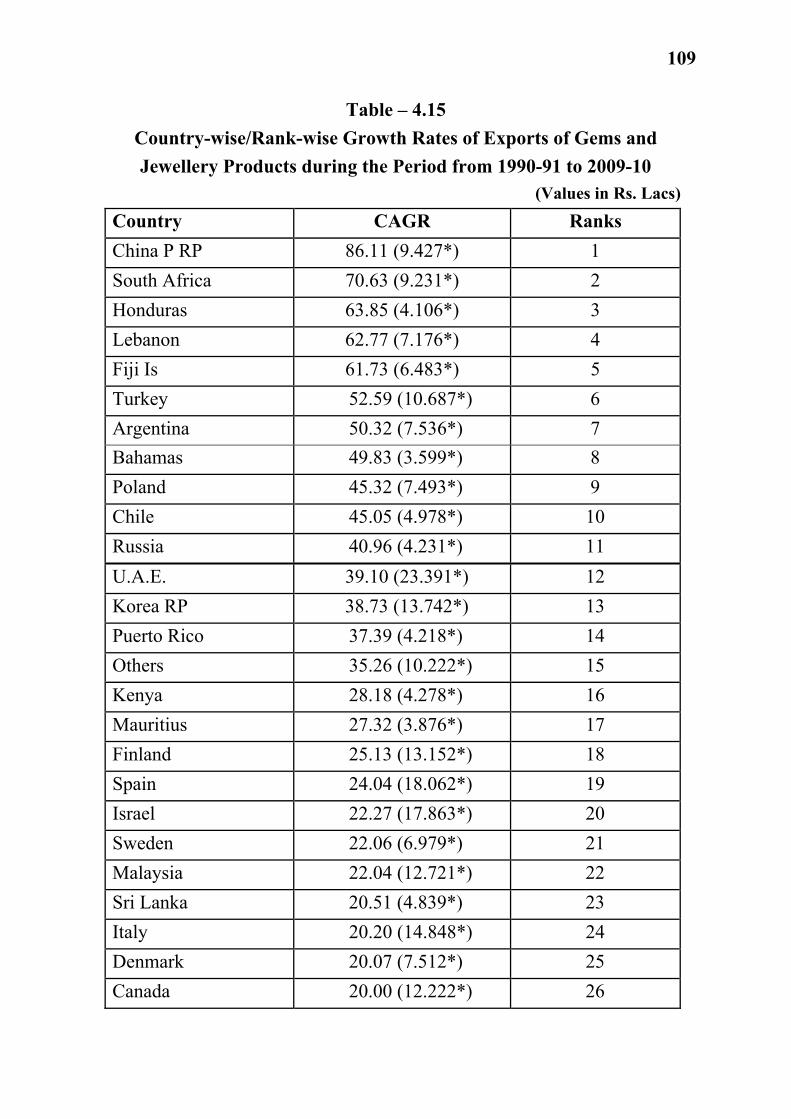
109
Table – 4.15 Country-wise/Rank-wise Growth Rates of Exports of Gems and Jewellery Products during the Period from 1990-91 to 2009-10
(Values in Rs. Lacs)
Country CAGR Ranks China P RP 86.11 (9.427*) 1 South Africa 70.63 (9.231*) 2 Honduras 63.85 (4.106*) 3 Lebanon 62.77 (7.176*) 4 Fiji Is 61.73 (6.483*) 5 Turkey 52.59 (10.687*) 6 Argentina 50.32 (7.536*) 7 Bahamas 49.83 (3.599*) 8 Poland 45.32 (7.493*) 9 Chile 45.05 (4.978*) 10 Russia 40.96 (4.231*) 11 U.A.E. 39.10 (23.391*) 12 Korea RP 38.73 (13.742*) 13 Puerto Rico 37.39 (4.218*) 14 Others 35.26 (10.222*) 15 Kenya 28.18 (4.278*) 16 Mauritius 27.32 (3.876*) 17 Finland 25.13 (13.152*) 18 Spain 24.04 (18.062*) 19 Israel 22.27 (17.863*) 20 Sweden 22.06 (6.979*) 21 Malaysia 22.04 (12.721*) 22 Sri Lanka 20.51 (4.839*) 23 Italy 20.20 (14.848*) 24 Denmark 20.07 (7.512*) 25 Canada 20.00 (12.222*) 26

110
Australia 19.92 (28.410*) 29 Saudi Arab 19.80 (5.986*) 27 Bharain Is 19.47 (6.823*) 28 Norway 19.22 (6.038*) 30 Singapore 19.09 (8.548*) 31 Hong Kong 18.38 (17.402*) 32 Ireland 17.76 (5.765*) 33 Greece 16.74 (5.478*) 34 U.K. 15.67 (18.189*) 35 Indonesia 14.30 (2.418**) 36 U.S.A. 13.97 (14.590*) 37 New Zealand 13.48 (16.566*) 38 Belgium 11.75 (21.705*) 39 France 11.52 (12.771*) 40 Thailand 11.43 (10.841*) 41 Switzerland 11.24 (8.531*) 42 Germany 10.80 (9.754*) 43 Kuwait 8.59 (3.172*) 44 Austria 7.28 (3.039*) 45 Netherland 7.21 (3.453*) 46 Qatar 5.88 (2.110**) 47 Oman 4.41 (2.071**) 48 Japan 1.68 (1.849**) 49 Cyprus -7.52 (-2.176) 50 Maxico -73.32 (4.895) 51
Source: Ibid., Table 4.13. Note: Figures in parentheses are t-values.
* The coefficients are significant at α = 0.01.
** The coefficients are significant at α = 0.10.
one per cent (α = 0.01) level of significance. Likewise, the growth rate of Maxico and Cyprus is negative and statistically insignificant and all these

111
values are confirmed by t-value, ANOVA (F-value) and R2. It is clear from the Table that the world trading system is constantly creating new opportunities and new trends for the developed as well as developing countries. Table-4.16 displays the comparative picture of the product-wise growth rate of gems and jewellery products exports during the period 1990-91 to 2009-10. Further, for the purpose of trend analysis, the data related to gems and jewellery products exports from India is divided into two periods,
Table -4.16 Growth Rates of the Exports of Gems and Jewellery Products
(Item-wise) during the Period from 1990-91 to 2009-10 (Values in Rs. Crores)
Sr. No.
Product CAGR t-value R2 F-value
1 Cut and Polished Diamonds 14.39 22.689* 0.966 514.803 α 19.41 12.343* 0.950 152.350 β 11.83 9.912* 0.924 98.249 2 Gold Jewellery 25.90 37.517* 0.987 1407.578 α 29.84 16.555* 0.971 274.089 β 26.78 14.142* 0.961 200.011 3 Coloured Gemstones 9.55 12.733* 0.900 162.135 α 16.27 12.508* 0.951 156.461 β 4.80 4.851* 0.746 23.532 4 Non-Gold Jewellery 26.92 21.367* 0.962 456.560 α 37.43 10.901* 0.936 118.834 β 21.01 10.836* 0.936 117.434 5 Costume/Fashion Jewellery 13.2 5.649* 0.639 31.920 α 25.34 3.525* 0.608 12.430 β -0.47 -0.135 0.002 0.018 6 Pearls 1.63 1.744 0.144 3.043 α 7.61 3.934* 0.659 15.477 β 0.81 0.297 0.010 0.088

112
7 Synthetic Stones 3.80 1.237 0.082 1.530 α 36.73 4.767* 0.739 22.724 β -4.23 -1.307 0.175 1.708 8 Rough Diamonds 27.03 11.566* 0.911 133.774 α 142.21 5.988* 0.817 35.860 β 19.80 5.987* 0.817 35.847 9 Total 16.59 30.741* 0.981 945.013 α 20.7 14.969* 0.965 224.094 β 15.27 13.140* 0.955 172.672
Source: Ibid., Table 3.1. Note: α Denote the period from 1990-91 to 1999-2000.
β Denote the period from 2000-2001 to 2009-2010. * The coefficients are significant at α = 0.01. ** The coefficients are significant at α = 0.10.
i.e., 1990-91 to 1999-2000 and 2000-01 to 2009-10. From the Table it is clear that during the period 1990-91 to 1999-2000 the growth rates of all gems and jewellery products like cut and polished diamonds, gold jewellery, coloured gemstones, non-gold jewellery, costume/fashion jewellery, pearls, synthetic stones, rough diamonds and total of gems and jewellery have been showing high growth rates as compared to the total period (1990-91 to 2009-10). And, after examining the t-value, most of the growth rates are statistically significant at one per cent (α = 0.01) level of significance.
\