CHAPTER : IV : Characterization...
40
CHAPTER : IV : Characterization Techniques Growth and Characterization of Struvite and Related Crystals 162 Chapter IV Characterization Techniques Topic Number Topic Page Number 4.1 Introduction 163 4.2 X-ray Diffraction by Powder Method 163 4.3 Infrared (IR) Spectroscopy and FT-IR Spectroscopy 172 4.4 Thermal Studies 185 4.5 Dielectric Studies 194 4.6 Micro-hardness Studies 198 4.7 Etching Studies 198
Transcript of CHAPTER : IV : Characterization...

CHAPTER : IV : Characterization Techniques
Growth and Characterization of Struvite and Related Crystals
162
Chapter IV
Characterization Techniques
Topic Number Topic Page
Number
4.1 Introduction 163
4.2 X-ray Diffraction by Powder Method 163
4.3 Infrared (IR) Spectroscopy and FT-IR Spectroscopy 172
4.4 Thermal Studies 185
4.5 Dielectric Studies 194
4.6 Micro-hardness Studies 198
4.7 Etching Studies 198

CHAPTER : IV : Characterization Techniques
Growth and Characterization of Struvite and Related Crystals
163
4.1 Introduction
Nowadays, scientists and engineers have an impressive array of
powerful and elegant tools for acquiring quantitative and qualitative
information about the composition and structure of matter. There are variety of
crystals grown having numerous applications in science and technology. It is
always important to characterize these crystals with various angles of
interests by different instruments [1].
This chapter describes a brief review of different experimental
characterization techniques, which are used by the present author to
characterize the grown struvite and related crystals.
4.2 X-ray Diffraction by Powder Method
The use of X-ray techniques in the field of materials qualitative and
quantitative analysis is now completing more than its century. While the broad
definition of X-ray techniques covers many techniques based on the scatter,
emission and absorption properties of X-radiation (X-ray), the two most
common are X-ray Fluorescence Spectrometry (XRF) and X-Ray powder
Diffractometry (XRD). The powder method derives its name from the fact that
the specimen is typically in the form of a microcrystalline powder. Since single
crystals are not always available, this method is more suitable for structural
determination of various substances. Any material which is made up of an
ordered array of atoms gives a particular diffraction pattern. The powder XRD,
which is also known as Debye-Scherrer method is a non-destructive
technique widely used for the characterization of a variety of crystalline
materials.

CHAPTER : IV : Characterization Techniques
Growth and Characterization of Struvite and Related Crystals
164
4.2.1 Brief History of the Development of Powder XRD
X-rays were discovered by Wilhelm Conrad Roentgen, the first Nobel
laureate in physics, in 1895 [2]. In 1912, Max von Laue, a German physicist
and a Nobel laureate, discovered that crystalline substances act as three-
dimensional diffraction gratings for X-ray wavelengths similar to the spacing of
planes in a crystal lattice. Both the discoveries gave a powerful tool that could
see inside of crystals and allow investigators for detailed determination of
crystal structures. So both the events changed the dimensions of physics,
chemistry, crystallography, mineralogy and medicine. After Laue's pioneering
research, the field developed rapidly, most notably by the contribution from a
pair of father and son physicists, namely, William Henry Bragg and William
Lawrence Bragg, respectively. In 1912-1913, the W. L. Bragg developed a
well known Bragg's law, which connects the observed scattering with
reflections from evenly spaced planes within the crystal [3,4]. Following these
discoveries two major fields of materials analysis have developed. One of
them is the method of powder XRD, which was devised independently in 1916
by Peter Joseph William Debye, a Nobel laureate, and P. Scherrer [5] in
Germany and in 1917 by A. W. Hull [6,7] in United States. In the late 1930s,
the powder XRD technique was recognized as a powerful technique for phase
identification and chemical analysis. The technique developed steadily and,
half a century later, the traditional applications, such as phase identification,
the determination of accurate unit-cell dimensions and the analysis of
structural imperfections, were well established. There was then a dramatic
increase of interest in powder methods during the 1970s, following the
introduction by Rietveld in 1967 of his powerful Rietveld method for refining

CHAPTER : IV : Characterization Techniques
Growth and Characterization of Struvite and Related Crystals
165
crystal structures from X-ray and neutron powder diffraction data [8,9].
Powder XRD has become an important tool for rapid identification of
polymorphs and formed compounds in pharmaceutical industry. Powder XRD
opens tremendous possibilities for characterization of materials and
stimulates an interdisciplinary dialogue and collaboration among physicists,
mineralogists, crystallographers, chemists, pharmacists and material scientist.
4.2.2 X-Ray Diffractometer and Experimental Procedure
Basically, this method involves the diffraction of monochromatic X-ray
by a powdered specimen. The instrument used for the method is X-ray
diffractometer, which consist of three basic elements, (i) an X-ray tube, (ii) a
sample holder, and (iii) an X-ray detector. Figure 4.1 shows the schematic
presentation of powder x-ray diffraction (Image Source: PANalytical).
Figure : 4.1 The Schematic Presentation of Powder X-Ray Diffraction
X-rays are generated in a cathode ray tube by heating a filament to
produce electrons, accelerating the electrons toward a target by applying a
high voltage, and bombarding the target material with electrons. When
electrons have sufficient energy to dislodge inner shell electrons of the target

CHAPTER : IV : Characterization Techniques
Growth and Characterization of Struvite and Related Crystals
166
material, characteristic X-ray spectra are produced. These spectra consist of
several components, the most common being Kα (α-doublet) and Kβ. Kα
consists, in part, of Kα1 and Kα2. Kα1 has a slightly shorter wavelength and
twice the intensity as Kα2. The specific wavelengths are characteristic of the
target material. The most common laboratory X-ray tube uses a copper
anode, but cobalt and molybdenum are also popular. Table 4.1 shows the
wavelengths in Å for various sources. Filtering, by foils or crystal
monochrometers, is required to produce monochromatic X-rays needed for
diffraction. Kα1 and Kα2 are sufficiently close in wavelength such that a
weighted average of the two is used. Copper is the most common target
material for single-crystal diffraction, with CuKα radiation = 1.54184 Å. The
basic purpose of the monochromatization is to obtain an experimental pattern
from a single, unique wavelength.
Table : 4.1 : Wavelengths in Å for various sources of X-ray tube
Wavelength in Å Element Kα1
(Very Strong) Kα2
(Strong) Kα
(Weighted Average)
Kβ (Weak)
Cu 1.54056 1.54439 1.54184 1.39222 Co 1.78897 1.79285 1.79026 1.62079 Mo 0.70930 0.71359 0.71073 0.63229 Cr 2.28970 2.29361 2.29100 2.08487 Fe 1.93604 1.93998 1.93736 1.75661
A fine powder of the material under investigation should be placed in
the sample holder - a small disc like container and its surface carefully
flattened. The X-rays are collimated and directed onto the sample.
The fundamental law, which governs the x-ray diffraction phenomenon,
is the Bragg’s Law and the equation is as follows;

CHAPTER : IV : Characterization Techniques
Growth and Characterization of Struvite and Related Crystals
167
θλ sin2 dn = (4.1)
where, λ is the wavelength of the x-ray, θ is the scattering angle, and n is an
integer representing the order of the diffraction peak. The interaction of the
incident X-rays with the crystalline powdered sample produces constructive
interference when conditions satisfy Bragg's Law and it gets diffracted in the
form of cones, which is exhibited in figure 4.2 [10]. The cones may emerge in
all directions, forwards and backwards. A circle of film is used to record the
diffraction pattern as shown. Each cone intersects the film giving diffraction
lines. The lines are seen as arcs on the film. Each diffraction line is made up
of a large number of small spots, each from a separate crystal. Each spot is
so small as to give the appearance of a continuous line. If the crystal is not
ground finely enough, the diffraction lines appear speckled.
Figure : 4.2 Powder Sample Diffract X-ray Beam in Cones [10]
These diffracted X-rays are then detected, processed and counted.
The geometry of an X-ray diffractometer is such that the sample rotates in the
path of the collimated X-ray beam at an angle θ while the X-ray detector,
mounted on an arm to collect the diffracted X-rays, rotates at an angle of 2θ,
which is known as Bragg-Brentano configuration. The intensity of diffracted X-
rays is continuously recorded as the sample and detector rotate through their
respective angles. A peak in intensity occurs when the mineral or crystalline
Front reflections
Film which can be replaced with detector
Back reflections
Different cones for different reflections

CHAPTER : IV : Characterization Techniques
Growth and Characterization of Struvite and Related Crystals
168
material contains lattice planes with d-spacing appropriate to diffract X-rays at
that value of θ. The instrument used to maintain the angle and rotate the
sample is termed a goniometer. For typical powder patterns, data is collected
at 2θ in the range of angles from ~5° to 70°, angles that are preset in the X-
ray scan. By scanning the sample through a range of 2θ angles, all possible
diffraction directions of the lattice should be attained due to the random
orientation of the powdered material. Conversion of the diffraction peaks to d-
spacing allows identification of the mineral or crystalline material because
each mineral has a set of unique d-spacing. Typically, this is achieved by
comparison of d-spacing with standard reference patterns. Resultant
diffraction pattern contains a good deal of information of which three
parameters are of special interest – (i) the position of the diffraction maxima,
(ii) the peak intensities and (iii) the intensity distribution as a function of
diffraction angle. Results of the procedure are commonly presented as peak
positions at 2θ and X-ray counts (intensity) in the form of a table or an x-y
plot, known as diffractogram. For determination of unit cell parameters, each
reflection must be indexed to specific Miller indices (h, k, l). Nowadays, many
types of software are available in market for powder XRD data analysis.
There are three types of powder methods, differentiated by the relative
position of the specimen and the film : (i) Debye-Scherrer Method - The film is
placed on the surface of a cylinder and specimen on the axis of the cylinder.
(ii) Focusing Method - The film, specimen, and X-ray source are all placed on the
surface of a cylinder. (iii) Pinhole Method - The film is flat, perpendicular to the
incident X-ray beam, and located at any convenient distance.

CHAPTER : IV : Characterization Techniques
Growth and Characterization of Struvite and Related Crystals
169
The powder photographic methods are well described by Azaroff and
Buerger [11] as well as Klug and Alexander [12]. The simplest and most
inexpensive way of practicing the powder method is to record the X-ray
diffraction on photographic film, using a powder camera. A more elaborate
way is to detect the diffracted radiation by means of a quantum counter, like
Geiger counter. The use of counter diffractometer, and recorder equipment is
justified chiefly when one wants to examine different samples rapidly. Such
methods also have a real advantage whenever accurately measured
intensities are necessary.
4.2.3 Applications of Powder XRD
Powdered XRD has a wide range of applications in material science,
geology, environmental science, chemistry, forensic science, and the
pharmaceutical industry, etc. This method has been conventionally used for
phase identification, quantitative analysis and the determination of structure
imperfections. Various types crystalline materials can be characterized by
powder XRD, including organic and inorganic materials, minerals, drugs,
zeolites, catalysts, metals and ceramics. In the pharmaceutical industries
the powder XRD is popular for identification of drug molecule and its
polymorphs. The physical states of the materials can be loose powders, thin
films, poly-crystalline and bulk materials. By properly using this technique one
can yield a great deal of structural information about the material under
investigation. For most applications, the amount of information which is
possible to extract depends on the nature of the sample microstructure
(crystallinity, structure imperfections, crystallite size and texture), the
complexity of the crystal structure (number of atoms in the asymmetric unit

CHAPTER : IV : Characterization Techniques
Growth and Characterization of Struvite and Related Crystals
170
cell and unit cell volume) and the quality of the experimental data (instrument
performances and counting statistics) [13].
The powder method can be used as a tool to identify crystals, since the
powder XRD patterns produced by a crystalline substance is a characteristic
of that particular substance. One of the most important uses of the powder
method is in the identification of an unknown material. The ASTM (American
Society for Testing and Materials) data cards as well as JCPDS (Joint
Committee of Powder Diffraction Standards) data files are available for large
number of substances for identifications and comparison. Statistical study of
the relative orientations of the individual crystals of an aggregate is one of the
important secondary uses of the powder method [11,14]. The broad
application of powder XRD is summarized as shown in table 4.2 [13].
Table : 4.2 : Applications of Powder XRD [13]
Diffraction Line Parameter Applications
Peak Position Unit-cell parameter refinement Pattern indexing Space group determination (2θ0 / absent reflections) Anisotropic thermal expansion Macro stress: sin2ψ method Phase identification (d / I)
Intensity Phase abundance Reaction kinetics Crystal structure analysis (whole pattern) Rietveld refinement (whole pattern) Search/match, phase identification Preferred orientation, texture analysis
Width / Breadth and Shape
Instrumental resolution function Microstructure: line profile analysis Microstructure (crystallite size, size distribution, lattice distortion, structure mistakes, dislocations, composition gradient) Crystallite growth kinetics Three-dimensional microstructure (whole pattern)
Non-ambient and dynamic diffraction
In situ diffraction under external constraints reaction kinetics.

CHAPTER : IV : Characterization Techniques
Growth and Characterization of Struvite and Related Crystals
171
However, in recent years the applications have been extended to new areas,
such as the determination of crystal structures and the extraction of three-
dimensional micro-structural properties.
4.2.4 Advantages of Powder XRD :
• It is reliable and powerful tool for crystalline sample identification.
• It is a non-destructive technique.
• Ability to analyze mixed phases.
• For the purpose of simultaneous and quick measurement of the positions
and intensities of diffraction lines the diffractometers are advantageous. It
is a fast technique (< 20 min) for identification of an unknown sample.
• In most cases, it provides an unambiguous sample determination.
• Simplicity in sample preparation, i.e., required sample preparation is
minimal and extensive sample preparation is not needed.
• XRD units are widely available.
• Data interpretation is relatively straight forward.
4.2.5 Limitations of Powder XRD :
• Homogeneous and single phase material is best for material identification.
• Must have access to a standard reference file of compounds.
• Requires tenths of a gram of material which must be ground into a powder.
• The sensitivity of the powder diffraction method is not comparable in
sensitivity to the other X-ray-based techniques.
• A phase present in quantities lower than 5% by weight is usually not
detected. For mixed materials, detection limit is ~ 2 - 5% of sample.
• Peak overlay may occur and worsens for high angle 'reflections'.
• Can not identify amorphous materials.

CHAPTER : IV : Characterization Techniques
Growth and Characterization of Struvite and Related Crystals
172
• For unit cell determinations, indexing of patterns for non-isometric crystal
systems is complicated.
• There may be a chance of misinterpretation during the course of a
qualitative analysis procedure.
• No depth profile information.
Figure : 4.3 X-ray Powder Diffractometer [15]
In the present work grown struvite and related crystals were analyzed
by powder X-ray analysis PHILIPS X’PERT Modular Powder Diffractometer
(MPD) system as shown in figure 4.3 [15]. The crystal structures were
determined by a computer software Powder-X.
4.3 Infrared (IR) Spectroscopy and FT-IR Spectroscopy
The term ‘spectroscopy’ is generally used for the analytical techniques
based on the interaction of electromagnetic radiation with matter and variation
of particular physical quantity with frequency of radiation. In spectroscopy, the
measurements of absorbance / transmittance of electromagnetic radiation, due
to interaction with sample by molecules that are carried out in a gas or vapour
state or dissolved molecules/ions or solid depending upon requirement.
Spectroscopy is used for both qualitative and quantitative investigations.

CHAPTER : IV : Characterization Techniques
Growth and Characterization of Struvite and Related Crystals
173
4.3.1 Brief History
The root of the IR spectroscopy is in the discovery of IR radiation by Sir
William Herschel in 1800. The first mid-infrared spectrometer was developed
by Melloni in 1833 [16]. Infrared spectroscopy emerged as a science with the
invention of interferometer by the Nobel Laureate A. A. Michelson in 1890s
[17-19]. In 1911 Rubens and Wood presented the first real interferogram. The
dispersive infrared spectrometer emerged in the 1940s, but it was still an
immature scientific field. But with development of the optical null dispersive
spectrophotometer, later that decade, chemical infrared spectroscopy came
into widespread use. Dispersive instruments proved the tremendous value of
infrared analysis, and soon became the mainstay of organic characterization
laboratories. In 1949 Fellgett used an interferometer to measure light from
celestial bodies and produced the first Fourier transform infrared spectrum. In
the late 1960s due to advent of microcomputers, the Fourier transform
became available and the commercial FT-IR spectrometers appeared. The
1966 development of the Cooley-Tukey algorithm [20], which quickly does a
Fourier transform, was influential in the popularization of FT-IR spectrometers.
4.3.2 Infrared (IR) Spectroscopy
In infrared (IR) spectroscopy, when IR radiation is incident on a sample,
some of the IR radiation is absorbed by the sample and some of it is passed
through (transmitted). The resulting spectrum represents the molecular
absorption or transmission, creating a molecular fingerprint of the sample. Like
a fingerprint no two unique molecular structures produce the same infrared
spectrum. This makes IR spectroscopy useful for several types of analysis. It
is one of the most powerful analytical techniques, which indicates the

CHAPTER : IV : Characterization Techniques
Growth and Characterization of Struvite and Related Crystals
174
possibility of chemical identifications [21]. Infrared spectroscopy takes the
advantage of the fact that molecules absorb specific frequencies that are
characteristic of their structure. These absorptions are resonant frequencies,
i.e., the frequency of the absorbed radiation matches the frequency of the bond
or group that vibrates.
The original IR instruments were of the dispersive type. The individual
frequencies of energy emitted from the infrared source were separated by a
prism or grating. A grating is a more modern dispersive element which better
separates the frequencies of infrared energy. The detector measures the
amount of energy at each frequency which has passed through the sample.
This results in a spectrum which is a plot of intensity vs. frequency.
4.3.3 IR Spectral Region
The infrared region of the electromagnetic spectrum extends from the red
end of the visible spectrum to the microwave region. Infrared spectral region
can be divided into three regions; near-infrared, mid-infrared and far-infrared.
Table 4.3 gives the details of different infrared spectral regions.
Table : 4.3 : Different Infrared Spectral Regions and its Applications
Spectral Regions
Wave Numbers
(cm−1)
Type of Measurement Analysis Applicable
Samples
Diffuse reflectance Quantitative Solid or liquid materialsNear-
infrared 12,800 - 4000 Absorption Quantitative Gaseous mixtures
Absorption Qualitative
Gaseous, liquid or solid organic compounds. Complex gaseous, liquid or solid mixtures.
Reflectance Qualitative
Pure solid or liquid compounds Polymer films, Fibers and rubbers
Mid- infrared 4000 - 200
Emission Quantitative Atmospheric samples Far- infrared 200 - 10 Adsorption Qualitative Pure inorganic or
metal-organic species

CHAPTER : IV : Characterization Techniques
Growth and Characterization of Struvite and Related Crystals
175
4.3.4 Types of Molecular Vibrations
(a) Symmetrical Stretching
(b) Asymmetrical Stretching
(c) Scissoring (In Plane of Paper)
(d) Rocking (In Plane of Paper)
(e) Wagging (Out of Plane of Paper)
(f) Twisting (Out of Plane of Paper)
Figure : 4.4 Various stretching and bending modes of vibration in molecule Stretching Modes : (a) Symmetrical Stretching (b) Asymmetrical Stretching
Bending Modes : (c) Scissoring (d) Rocking (e) Wagging (f) Twisting [22]

CHAPTER : IV : Characterization Techniques
Growth and Characterization of Struvite and Related Crystals
176
The covalent bonds of molecules are not rigid, but are more like stiff
springs that can be stretched and bent. At ordinary temperatures a molecule
can vibrate in many ways, and each way is called a vibrational mode. A
molecule composed of N-atoms has 3N degrees of freedom, six of which are
translations and rotations of the molecule itself. This leaves 3N-6 degrees of
vibrational modes for non-linear molecules, whereas it will be 3N-5 for the
linear molecule. Molecular vibrations are falling into two basic categories of
stretching and bending. A stretching vibration involves a continuous change in
the inter-atomic distance along the axis of bond between two atoms, i.e.
change in bond length. However, the bending vibrations are characterized by
a change in the angle between two bonds, which are of four types, scissoring
(bending), rocking, wagging and twisting in the figure 4.4.
The fundamental vibrational frequency of a diatomic molecular ensemble can
be given by the following formula, which can be derived from Hooke’s law.
( )21
21
.21
21
mmmm
cc+
==κ
πµκ
πν (4.2)
where, ν is the fundamental vibration frequency in cm−1, c is the velocity of
light in cm / s, κ is the force constant of the bond in dyne / cm, and µ is the
reduced mass in gram. The reduced mass is µ = m1 . m2 / (m1 +m2). Here, m1
and m2 are the masses of the component atoms of the chemical bond.
Because of the interaction with molecular vibrations, portions of the incident
infrared radiation are absorbed at particular wavelengths. The multiplicity of
vibrations occurring simultaneously produces a highly complex absorption
spectrum, which is a unique characteristic of the overall configuration of the
atoms as well. Details of assignments of different frequencies with different

CHAPTER : IV : Characterization Techniques
Growth and Characterization of Struvite and Related Crystals
177
vibrations of bonds, such as H−O, N−H, C=O, C−C, C−H etc are given in
detail by many authors [1, 21, 23-25]. Many times it is given in chart and
tabular forms to facilitate the user to identify the specific bond vibrations from
the frequency in wave numbers, represented in the figure 4.5.
Figure : 4.5 A Simple Chart to Identify Specific Bond Vibrations in Wave Numbers
(Blue = Stretching Vibrations; Green = Bending Vibrations) [26]
The general trends of frequency of vibrations are (i) Stretching frequencies
are higher than corresponding bending frequencies, since it is easier to bend
a bond than to stretch or compress it, (ii) Bonds to hydrogen have higher
stretching frequencies than those to heavier atoms, and (iii) Stronger bonds
have higher stretching frequencies than weaker bonds.
4.3.5 Fourier Transform Infrared Spectroscopy
Due to the advent of Fourier Transform technology, the scenario is
completely changed. Fourier Transform Infrared (FT-IR) spectrometry was
developed in order to overcome the limitations encountered with dispersive
instruments. The main difficulty was the slow scanning process. A method for
measuring all of the infrared frequencies simultaneously, rather than
individually, was needed. A solution was developed which employed a very

CHAPTER : IV : Characterization Techniques
Growth and Characterization of Struvite and Related Crystals
178
simple optical device called an interferometer. The interferometer produces a
unique type of signal which has all of the infrared frequencies “encoded” into
it. The signal can be measured very quickly, usually on the order of one
second or so. Thus, the time element per sample is reduced to a matter of a
few seconds rather than several minutes. Therefore, FT-IR is the preferred
method of infrared spectroscopy.
4.3.6 FT-IR Spectrometer and Experimental Procedure
An FT-IR spectrometer is a spectral instrument that collects and
digitizes the interferogram, performs the Fourier transform function on the
interferogram and displays the spectrum. FT-IR spectrometer is the
advancement of the dispersive spectrometer.
Sample preparation: Samples for FT-IR can be prepared in a number of
ways. Sample crystal can be milled with potassium bromide (KBr) to form a
very fine powder. This powder is then compressed into a thin pellet which can
be analyzed. KBr is also transparent in the IR. Alternatively, solid samples can
be dissolved in a solvent such as methylene chloride, and the solution placed
onto a single salt plate. The solvent is then evaporated off, leaving a thin film
of the original material on the plate. This is called a cast film, and is frequently
used for polymer identification. For liquid samples, the easiest is to place one
drop of sample between two plates of sodium chloride (salt). Salt is
transparent to infrared light. The drop forms a thin film between the plates.
Multiplex types of instruments employ the mathematical tool of Fourier
Transform [27]. The Michelson interferometer, which is the heart of the
apparatus of FT-IR spectrometer, is as shown in figure 4.6. The creation of
today’s FT-IR would not have been possible had it not been for the existence
CHAPTER : IV : Characterization Techniques
Growth and Characterization of Struvite and Related Crystals
179
of the Michelson interferometer. The interferometer requires two mirrors (M1
and M2), an infrared light source, an infrared detector, and a beam splitter (B)
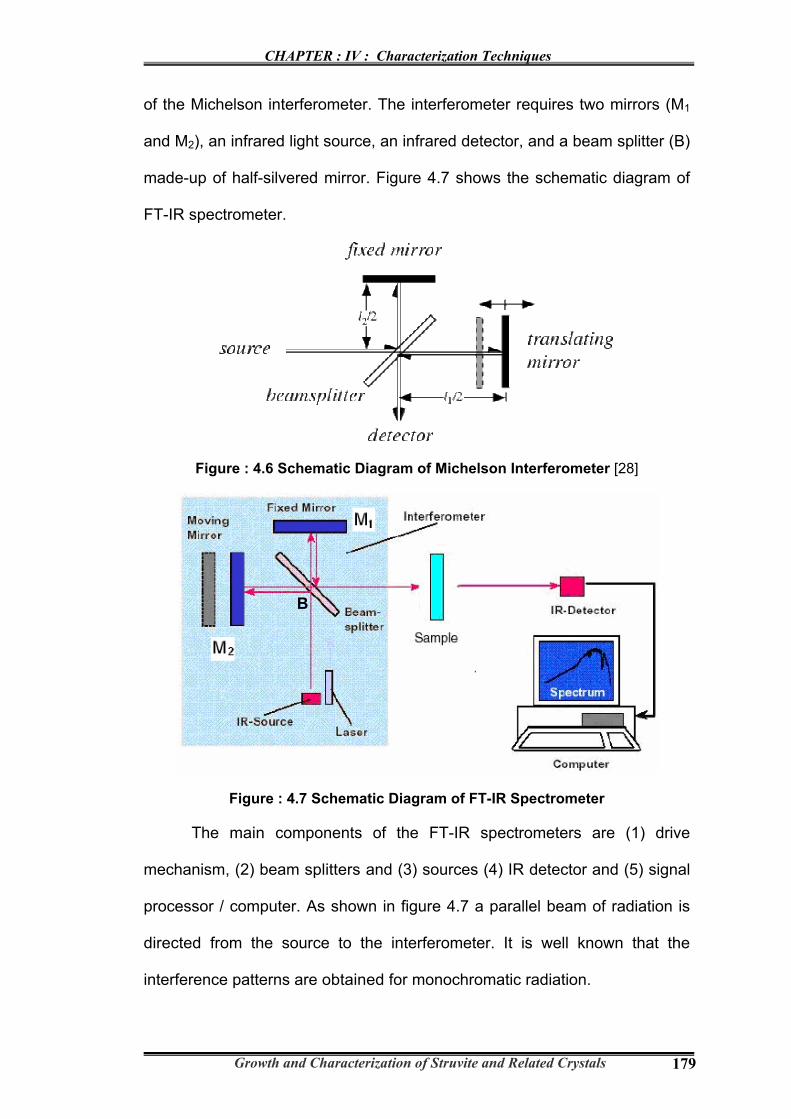
made-up of half-silvered mirror. Figure 4.7 shows the schematic diagram of
FT-IR spectrometer.
Figure : 4.6 Schematic Diagram of Michelson Interferometer [28]
Figure : 4.7 Schematic Diagram of FT-IR Spectrometer
The main components of the FT-IR spectrometers are (1) drive
mechanism, (2) beam splitters and (3) sources (4) IR detector and (5) signal
processor / computer. As shown in figure 4.7 a parallel beam of radiation is
directed from the source to the interferometer. It is well known that the
interference patterns are obtained for monochromatic radiation.
B

CHAPTER : IV : Characterization Techniques
Growth and Characterization of Struvite and Related Crystals
180
Radiation from the source strikes the beam splitter and separates into
two beams. One beam is transmitted through the beam splitter to the fixed
mirror and the second is reflected off the beam splitter to the moving mirror.
The fixed and moving mirrors reflect the radiation back to the beam splitter.
Again, half of this reflected radiation is transmitted and half is reflected at the
beam splitter, resulting in one beam passing to the detector and the second
back to the source. The interference patterns (interferogram) obtained can
be transferred back to the original frequency distribution. This can be
achieved by a mathematical process known as Fourier Transform,
nowadays; this process is carried out by a computer or microprocessor of
the spectrometer. The end result of the Fourier transform is the spectrum of
peaks and valleys that is displayed. The resulting absorption pattern can be
compared to the millions of patterns that are stored in computer databases,
both on-site and remotely via the Internet. If a matching spectrum is
obtained, then the identity of the sample compound can be determined. FT-
IR Spectrometer makes use of all the frequencies from the source
simultaneously, rather than sequentially as in dispersive instrument (i.e.
grating spectrometer). This feature is called the Multiplex or Felgett
Advantage.
There are different versions; modifications and attachments available with
FT-IR. Diffuse Reflectance Infrared Fourier Transform Spectroscopy
(DRIFTS) uses an effective way of obtaining infrared spectra directly on
powdered samples with a minimum sample preparation [29-31]. The
advantage is that it permits conventional infrared spectral data to be obtained
on the samples that are not altered much from their original state.

CHAPTER : IV : Characterization Techniques
Growth and Characterization of Struvite and Related Crystals
181
4.3.7 Applications of FT-IR Spectroscopy
Various applications of FT-IR spectroscopy are as follows :
• Identification of simple mixtures of organic and inorganic compounds.
• Routine qualitative and quantitative FT-IR Analysis.
• Determination of functional groups in unknown materials.
• Identification of polymers and polymer blends.
• Determination of degrees of crystallinity in polymers.
• Indirect verification of trace organic contaminants on surfaces.
• Thin film analysis.
• Analysis of adhesives, coatings, adhesion promoters or coupling agents.
• Analysis of resins, composite materials and release films.
• Identification of rubbers and filled rubbers.
• Comparative chain lengths in organics.
• Extent of thermal, UV or other degradation or depolymerization of
polymers and paint coatings.
• Analysis of gaseous samples using a gas cell for environmental study.
• Analysis of unknown solvents, cleaning agents and detergents.
4.3.8 Advantages of FT-IR
Some of the major advantages of FT-IR over the dispersive technique include:
1. Better Speed: As noted earlier, because all of the frequencies are
measured simultaneously, most measurements by FT-IR are made in a
few seconds rather than several minutes. It is also referred to as the
Felgett Advantage.
2. Sensitivity: Sensitivity is dramatically improved with FT-IR for many
reasons. The detectors employed are much more sensitive, the optical

CHAPTER : IV : Characterization Techniques
Growth and Characterization of Struvite and Related Crystals
182
throughput is much higher (referred to as the Jacquinot Advantage) which
results in much lower noise levels, and the fast scans enable the co-
addition of several scans in order to reduce the random measurement
noise to any desired level (referred to as signal averaging).
3. Mechanical Simplicity: The moving mirror in the interferometer is the
only continuously moving part in the instrument. Thus, there is very little
possibility of mechanical breakdown.
4. Internally Calibrated: These instruments employ a He-Ne laser (helium-
neon laser) as an internal wavelength calibration standard (referred to as
the Connes Advantage). The use of a helium - neon laser as the internal
reference in many FT-IR systems provides an automatic calibration in an
accuracy of better than 0.01 cm–1. These instruments are self-calibrating
and never need to be calibrated by the user.
5. Increased optical throughput (Jaquinot advantage) : Energy-wasting
slits are not required in the interferometer because dispersion or filtering is
not needed. Instead, a circular optical aperture is commonly used in FT-IR
systems. The beam area of an instrument is usually 75 to 100 times larger
than the slit width of a dispersive spectrometer. Thus, more radiation
energy is made available. This constitutes a major advantage for many
samples or sampling techniques that are energy-limited.
6. Elimination of stray light and emission contributions: The
interferometer in FT-IR modulates all the frequencies. The unmodulated
stray light and sample emissions (if any) are not detected.
7. Powerful data station : Modern FT-IR spectrometers are usually
equipped with a powerful, computerized data system. It can perform a

CHAPTER : IV : Characterization Techniques
Growth and Characterization of Struvite and Related Crystals
183
wide variety of data processing tasks such as Fourier transformation,
interactive spectral subtraction, baseline correction, smoothing,
integration, and library searching.
8. Resolving power of FT-IR instrument is constant over the entire spectrum,
whereas it varies with frequency in the conventional technique [32].
9. IR analysis can be conducted at room temperature.
10. Equally applicable to both emission and absorption spectroscopy.
These advantages, along with several others, make measurements
made by FT-IR extremely accurate and reproducible. Thus, it is a very reliable
technique for positive identification of virtually any sample. The sensitivity
benefits enable identification of even the smallest of contaminants. In addition,
the sensitivity and accuracy of FT-IR detectors, along with a wide variety of
software algorithms, have dramatically increased the practical use of infrared
for quantitative analysis. Thus, FT-IR technique has brought significant
practical advantages to infrared spectroscopy.
4.3.9 Analytical Capabilities of FT-IR
• Identifies chemical bond functional groups by the absorption of infrared
radiation, which excites vibrational modes in the bond.
• May be used in transmission mode.
• Detects and Identifies organic contaminants.
• In attenuated total reflectance (ATR) mode, the detection depth is
generally 1-2 µm deep, but can be much more or less dependent upon the
material. Black, absorbing materials tend to be less.
• Especially capable of identifying the chemical bonds of organic materials.

CHAPTER : IV : Characterization Techniques
Growth and Characterization of Struvite and Related Crystals
184
• Characterization of compounds via FT-IR is not only limited to organic
compounds. Any inorganic compound that forms bonds of a covalent
nature within a molecular ion fragment, cation or anion, will produce a
characteristic absorption spectrum, with associated group frequencies.
• Identifies water, phosphates, sulfates, nitrates, nitrites, carbonate ions,
silicates ions, and ammonium ions.
• Detection limits vary greatly, but are sometimes <1013 bonds/cm3 or
sometimes sub monolayer.
• Useful with solids, liquids, or gases.
4.3.10 Limitations of FT-IR
• Minimal elemental information is given for most samples.
• FT-IR instrument is inherently a single-beam instrument.
• Background solvent or solid matrix must be relatively transparent in the
spectral region of interest.
• Molecule must be active in the IR region. (When exposed to IR radiation, a
minimum of one vibrational motion must alter the net dipole moment of the
molecule in order for absorption to be observed.)
• It mainly operates in transparent or reflective mode.
• Limited surface sensitivity (typical sampling volumes are ~0.8 µm).
• Minimum analysis area ~15 micron.
• Limited inorganic information.
• IR-active atmospheric components (CO2, H2O) will appear in the spectrum.
(However, usually, a "Background" spectrum is run, and then automatically
subtracted from every spectrum.)
• Cannot detect atoms or monoatomic entities contain no chemical bonds.

CHAPTER : IV : Characterization Techniques
Growth and Characterization of Struvite and Related Crystals
185
• Aqueous solutions are very difficult to analyze- water is a strong IR absorber.
• Complex mixtures - samples give rise to complex spectra.
Figure : 4.8 Nicolet 6700 FT-IR spectrometer
The present author has used Nicolet 6700 FT-IR spectrometer (as
shown in figure 4.8) having optical resolution of 0.09 cm–1, in the range from
400 cm–1 to 4000 cm–1 in KBr disc medium. The set up used for the analysis
was from Physics Department of Saurashtra University.
4.4 Thermal Studies
According to widely accepted definition of thermal analysis (Thermo
analytical), it is a group of techniques in which physical properties of a
substance and/or its reaction products are measured as a function of
temperature whilst the substance is subjected to a controlled temperature
program [1]. According to International Confederation for Thermal Analysis
and Calorimetry (ICTAC), thermal analysis is defined as a group of techniques
in which a property of the sample is monitored against time or temperature
while the temperature of the sample, in a specified atmosphere, is
programmed [33]. Nearly over a dozen thermal methods can be identified,
which differ in the properties measured and temperature programs [34-36].
These methods find widespread use for both quality control and research

CHAPTER : IV : Characterization Techniques
Growth and Characterization of Struvite and Related Crystals
186
applications of various substances, such as, polymers, pharmaceuticals,
crystals, clays, minerals, metals and alloys.
4.4.1 Brief History
Historically, Josiah Wedgwood (1730-1795) first attempted to study the
thermal behaviour of a clay piece and noted that the decrease in its size due
to water loss on drying then increase its size before the final decrease
continuously. In 1887, Henry Louis Le Chateliar introduced the use of heating
rate curves to identify clays [37]. G. Tammann introduced the term “thermal
analysis” first time in 1903 [38]. In 1904, Kumakov [39] developed a versatile
photographic recorder which was utilized in Differential Thermal Analysis
(DTA) by the Russian school [40]. In the year 1915, Kotaro Honda [41] laid
the broad foundations of modern thermogravimetry, introducing the thermo
balance. The first commercial thermo-gravimeter was produced in 1945 [42].
Differential Scanning Calorimetry (DSC) technique was developed by Watson
et al in 1964 [43]. However, because of advent of electronics and computer
interfacing, very accurate fully automated computer controlled thermal
analyzers are available.
4.4.2 Classification of Thermal Analysis Techniques
Thermal analysis techniques involve the measurement of various
properties of materials subjected to dynamically changing environments under
predetermined condition of heating rate, temperature range and gaseous
atmosphere or vacuum. Classification of thermal analysis techniques is as
shown in table 4.4. Among all the thermal methods, the most widely used
techniques are TGA, DTA and DSC, which are employed in inorganic and
organic chemistry, metallurgy, mineralogy and other areas.

CHAPTER : IV : Characterization Techniques
Growth and Characterization of Struvite and Related Crystals
187
Table : 4.4 : Classification of Thermal Analysis Techniques
Thermal Analysis (Thermo Analytical) Techniques Techniques Based On Variation of
Physical Property Abbreviated
Name Full Form
Classical Techniques TG / TGA Thermo-Gravimetry /
Thermo Gravimetric Analysis DTG Derivative Thermo-Gravimetry
Isobaric Mass-Change Determination
EGD Evolved Gas Detection
EGA • TG – FT-IR • TG – MS
Evolved Gas Analysis • Thermo Gravimetric Analysis
Coupled to a Fourier Transform Infrared Spectrophotometer
• Thermo Gravimetric Analysis Coupled to a Mass Spectrometer
Emanation Thermal Analysis
Mass
Thermo-Particulate Analysis
DTA Differential Thermal Analysis
DDTA Derivative Differential Thermal Analysis Temperature
Heating Curve Determination • Heating Rate Curve • Inverse Heating Rate Curve
Enthalpy DSC Differential Scanning Calorimetry
DSM/NC Differential Scanning Micro / Nano Calorimetry
Dimensions TD Thermo- Dilatometry • Differential Dilatometry • Derivative Dilatometry
Modern Techniques
TMA Thermo Mechanical Analysis
DMA Dynamic Mechanical Analysis Mechanical Characteristics
Dynamic Thermomechanometry
Thermosonimetry Acoustic Characteristics Thermoacoustimetry
Optical Characteristics Thermoptometry
Thermoelectrometry Electrical Characteristics DETA Dielectric Thermal Analysis
Magnetic Characteristics
Thermomagnetometry

CHAPTER : IV : Characterization Techniques
Growth and Characterization of Struvite and Related Crystals
188
In certain cases, the use of a single thermo analytical technique may
not provide sufficient information to solve the problem on hand and hence the
use of other thermal techniques, either independently or simultaneously, for
complementary information becomes necessary. For example, both
differential thermal analysis (DTA) and thermo gravimetric analysis (TGA) are
widely used in studies involving physicochemical changes accompanied by
variation in the heat content and the weight of the material.
4.4.3 Thermo Gravimetric Analysis (TGA)
Thermo gravimetric analysis is a technique in which the mass of a
substance is measured as a function of temperature or time while the
substance is subjected to a controlled temperature program. The curve
obtained in a thermo gravimetric analysis is called thermogram (TG) and its
first derivative is called a derivative thermogram (DTG).
Modern commercial TG instrument consists of following main parts:
• A sensitive analytical balance
• A temperature programmable furnace
• A purge gas system for providing suitable gas atmosphere
• A microprocessor for instrument control, data acquisition and display
The null-point weighing mechanism is employed since the sample
remains in the same zone of furnace irrespective of changes in mass. The
furnace is normally an electrical resistive heater and the temperature range
for most of the furnace is from ambient to 1000-2000 °C. The rate of heat
exchange between the furnace and the sample depends on the heating rate
which influences the TG curve in a number of ways. A slower rate gives a

CHAPTER : IV : Characterization Techniques
Growth and Characterization of Struvite and Related Crystals
189
better resolution of the closely lying steps, while the faster heating rate
merges such steps.
One of the objectives of TG and DTA is to delineate as accurately as
possible the various temperatures associated with the thermal behavior of a
given substance, i.e., temperature of decomposition, stability range of an
intermediate compound and the temperature at which the reaction get
completed. As noted earlier that the TGA involves change in weight with
respect to temperature. The acquired data obtained as a plot of mass or loss of
mass in percentage as a function of temperature is considered as a thermal
spectrum, or a thermogram, or a thermal decomposition curve. These
thermograms characterize a system in terms of temperature dependence of
its thermodynamic properties and physical-chemical kinetics. Since the TGA
involves measurement of a change in weight of a system as the temperature
is increased at pre-determined rate, changes in weight are a result of the
rupture and/or formation of various physical and chemical bonds at elevated
temperatures that lead to the evaluation of volatile products or the formation
of heavier reaction products. From such curves, parameters concerning the
thermodynamics and kinetics of the various chemical reactions can be
evaluated, reaction mechanism, the intermediate and final reaction products
can be identified. Usually, the temperature range is from ambient to 1200 °C
with inert or reactive atmospheres. The derivative in TG is often used to
pinpoint completion of weight- loss steps or to increase resolution of
overlapping weight-loss occurrences. The shape of thermogravimetric curve
of a particular compound is influenced by the heating rate of the sample and
the atmosphere surrounding it [23,34,44].

CHAPTER : IV : Characterization Techniques
Growth and Characterization of Struvite and Related Crystals
190
Applications of TGA
• Study thermal degradation / decomposition / dehydration.
• Chemical reaction resulting in changes of mass such as absorption,
adsorption, desorption.
• To check the sample purity.
4.4.4 Differential Thermal Analysis (DTA)
DTA is a technique in which the temperature difference between a
substance and a reference material is measured as a function of temperature
whilst the substance and reference material are subjected to a controlled
temperature program [33]. DTA provides information on the chemical
reactions, phase transformations, and structural changes that occur in a
sample during a heat-up or a cool-down cycle. The DTA measures the
differences in energies released or absorbed, and the changes in heat
capacity of materials as a function of temperature. The graph of DTA signal,
i.e. differential thermocouple output in micro volts on the Y-axis plotted versus
the sample temperature in °C on the X-axis gives the results of DTA.
Modern thermo-balances are often equipped so as to record the DTA
signal and the actual thermo-gravimetric measurement, simultaneously. In
addition to showing the energetic nature of weight loss events, the DTA signal
can also show thermal effects that are not accompanied by a change in mass,
e.g. melting, crystallization or a glass transition. Transition temperatures are
measured precisely using the DTA. The DTA identifies the temperature
regions and the magnitude of critical events during a drying or firing process
such as binder burnout, carbon oxidation, sulfur oxidation, structural clay
collapse, Alpha to Beta quartz transition, carbonate decompositions,

CHAPTER : IV : Characterization Techniques
Growth and Characterization of Struvite and Related Crystals
191
recrystalizations, melting and cristobalite transitions, melting, solidification or
solidus temperature, glass transition temperature (Tg), curie point, energy of
reaction, heat capacity, and others. The transition enthalpy is estimated from
the DTA curve using the heat capacity of the heat sensitive plate as a function
of temperature.
Application of DTA
• Primarily used for detection of transition temperature.
• To check the sample purity.
4.4.5 Differential Scanning Calorimetry (DSC)
DSC is a technique in which the difference in energy inputs into a
substance and a reference material is measured as a function of temperature
whilst the substance and reference material are subjected to a controlled
temperature program [33]. A DSC analyzer measures the energy changes
that occur as a sample is heated, cooled or held isothermally, together with
the temperature at which these changes occur.
The graph of heat flow in mJ/s on the Y-axis plotted versus
temperature at a fixed rate of change of temperature in °C on the X-axis
shows the output of the DSC. Usually, for the power compensation DSC
curve, heat flow rate should be plotted on the ordinate with endothermic
reactions upwards, and for the heat-flux DSC curve with endothermic
reactions downwards. The energy changes enable the user to find and
measure the transitions that occur in the sample quantitatively, and to note
the temperature where they occur, and so to characterize a material for
melting processes, measurement of glass transitions and a range of more
complex events.

CHAPTER : IV : Characterization Techniques
Growth and Characterization of Struvite and Related Crystals
192
There are two methods of carrying out DSC, namely, (i) Power-
compensated DSC, and (ii) heat-flux DSC. Power-compensated DSC is the
method usually discussed in textbooks, though most practical instruments are
based on heat-flux DSC. However, in practice these usually give equivalent
results. In the present study the heat flux type of DSC was used.
Power-Compensated DSC : In this method, the sample and reference are in
separate furnaces, each with a heater coil and a thermocouple. The aim is to
maintain both at the same temperature, even during a thermal event in the
sample. The difference in power supplied to the two furnaces to maintain zero
temperature differential between the sample and the reference is measured.
Heat-Flux DSC : The sample and reference are both within the same furnace
and are connected by a low-resistance heat-flow path. If any difference in
temperature develops, heat flows in proportion to that temperature difference.
DTA and DSC are sister techniques which provide fast, convenient
analysis of the glass characteristic temperatures such as Tg and temperatures
of phase changes, for instance devitrification and melting. DSC is rather more
versatile than DTA. DSC allows quantitative determination of heat capacity,
and also the enthalpy of a phase transformation.
Application of DSC :
• Determination important transition temperatures.
• Determine heat of fusion of a crystal phase.
• Degree of crystallization and study the crystal kinetics.
• Determine heat capacity and heat of formation.
• To check the sample purity.

CHAPTER : IV : Characterization Techniques
Growth and Characterization of Struvite and Related Crystals
193
4.4.6 Experimental Procedure :
In the present study, the thermal analysis - TGA, DTA and DSC of the
grown struvite and related crystals were carried out to determine
simultaneous changes of mass and caloric reactions using PC controlled
Linseis Simultaneous Thermal Analyzer (STA) PT-1600, in the atmosphere of
air from 35 °C to 900 °C at a heating rate of 15 °C/min. TA-WIN and WIN-STA
software used for testing and analysis. The set up for thermal analysis is
shown in figure 4.9.
Figure : 4.9 Linseis Simultaneous Thermal Analyzer PT-1600
Figure : 4.10 Measuring head and crucible
After switching on computer and thermo balance, one has to open
furnace using LIFT switch. As shown in the figure 4.10, the measuring head,

CHAPTER : IV : Characterization Techniques
Growth and Characterization of Struvite and Related Crystals
194
carries two equal crucibles, one for the reference material and one for the
sample substance, each one is sitting on a thermocouple. Carefully remove
used crucible and clean it thoroughly. Insert a fine powder of the grown
crystals under investigation in the sample crucible in the right side. The
sample is evenly distributed in the bottom of the sample crucible. Take Al2O3,
with equal amount in reference crucible in the left. The two thermocouples are
wired such as to measure the temperature difference between the sample and
the reference material. The absolute temperature is measured with the
reference thermocouple. Good thermal contact between the sample and heat-
flux sensor is an indispensable requirement for optimum results. Since the
test parameters have a significant influence in thermo analytical
investigations, the parameters such as calibration, sample preparation,
sample weight, reference material, sample chamber temperature, temperature
program and atmosphere should be well considered. Calibration of the
instrument is a prerequisite for quantitative analysis of STA measurements.
4.5 Dielectric Studies
Every material has a unique set of electrical characteristics, which are
dielectric properties, like permittivity, permeability, resistivity, conductivity, etc.
A material is classified as “dielectric” if it has the ability to store energy when
an external electric field is applied. In other words, materials, which are
electric insulators or in which an electric field can be sustained with a
minimum dissipation of power, are known as dielectric materials. Simply,
dielectrics are insulating materials. In dielectrics all the electrons are bound to
their parent molecules and there are no free charges. Even with normal
voltage or thermal energy the electrons are not released. Dielectrics are non

CHAPTER : IV : Characterization Techniques
Growth and Characterization of Struvite and Related Crystals
195
metallic materials of high specific resistance and have negative temperature
coefficient of resistance. The dielectric characteristics of the material are
important to study the lattice dynamics in the crystal. It is important to note
that permittivity and permeability are not constant. They can change with
frequency, temperature, orientation, mixture, pressure, and molecular
structure of the material. Many authors discussed various dielectric properties,
dielectric applications and dielectric theories in details [45-49]. Classical
theory of dielectric constant was given by Kachhava and Saxena [50]. Also
the predecessors of the present author have described the dielectric
properties in detail [51-54], therefore, it is avoided in the present thesis.
In the present investigation the dielectric study was carried out by
measuring different parameters such as capacitance and dielectric loss of the
pressed pellets of samples of known dimension at room temperature on
Agilent 4284 A precession Inductance, Capacitance and Resistance (LCR)
meter using specially designed sample holder, within the frequency range
from 1 kHz to 1 MHz. Figure 4.12 (a) shows the photograph of the set up. The
powdered samples were pelletized by using a die of 1 cm diameter and
applying 2 tone pressure. The pellets were placed in a suitably design spring-
loaded holder. Figure 4.12 (b) describes the design of the sample holder.
Figure : 4.11 (a) Agilent 4284 A precession LCR meter (b) Sample Holder
(a) (b)

CHAPTER : IV : Characterization Techniques
Growth and Characterization of Struvite and Related Crystals
196
Dielectric constant ( κ ) or Relative Permittivity ( εr ) : Dielectric constant
is defined as the ratio of the capacitance (C) of a capacitor filled with the
given material to the capacitance (C0) of an identical capacitor in a vacuum
without the dielectric material. The dielectric constant can also be defined as
the ratio of the permittivity of the dielectric material (ε ) to the permittivity of
vacuum (εo). The dielectric constant, is therefore, also known as the relative
permittivity (εr) of the material. Some times it is also referred as the absolute
permittivity.
Dielectric constant, 00 εεεκ ===
CC
r (4.3)
Since the dielectric constant is just a ratio of two similar quantities, it is
dimensionless and is always greater than 1. It is a measure of polarization in
the dielectric material. It denotes a large-scale property of dielectrics without
specifying the electrical behaviour on the atomic scale. In the present study
dielectric constant was calculated using following formula
Dielectric constant, AdC
r0ε
εκ == (4.4)
Where, where C is the capacitance, d is the thickness of the pellet, ε0 is the
vacuum dielectric constant (permittivity of free space, ε0 = 8.854 x 10⁻¹² F/m)
and A is the area of the pellet.
Complex Relative Permittivity ( ε* ) :
Permittivity is determined by the ability of a material to polarize in
response to the field, and thereby reduce the total electric field inside the
material. Thus, permittivity relates to the ability of material to transmit (or
permit) an electric field. The response of normal materials to external fields

CHAPTER : IV : Characterization Techniques
Growth and Characterization of Struvite and Related Crystals
197
generally depends on the frequency of the field. This frequency dependence
reflects the fact that the polarization of material does not respond
instantaneously to an applied field. The response must always be causal
which can be represented by a phase difference. For this reason permittivity is
often treated as a complex function. The response of materials to alternating
fields is characterized by a complex permittivity,
δεεεε jej −∗ =′′−′= (4.5)
Where ε' is the real part of the relative permittivity (i.e. the dielectric constant),
which is related to the stored energy within the medium; and ε'' is the
imaginary part of the relative permittivity, which is related to the dissipation (or
loss) of energy within the medium. Equation (4.5) expresses the complex
permittivity in two ways, as real and imaginary or as magnitude and phase.
Dielectric Loss : The dielectric loss is a loss of energy which eventually
produces a rise in temperature of a dielectric placed in an alternating electrical
field. In other words it is a measure of the energy absorbed by dielectric. It is
the electrical energy lost as heat in the polarization process in applied AC
electric field. The ratio of imaginary part to the real part of the relative
permittivity is known as dielectric loss or the dissipation factor D.
εεδ′′′
== tanD (4.6)
The dissipation factor is measured along with the capacitance at room
temperature using the LCR meter.
a. c. Conductivity and a.c. Resistivity :
a.c. conductivity is one of the studies done on solids in order to characterize
the bulk resistance of the crystalline sample. The values of a. c. conductivity

CHAPTER : IV : Characterization Techniques
Growth and Characterization of Struvite and Related Crystals
198
and a. c. resistivity were calculated for the different frequencies of the applied
electric field using the following formulae,
a. c. conductivity, A
dDCfac
πσ 2= (4.7)
where, f is the frequency, C capacitance, D dissipation factor or dielectric
loss or D = tan δ, d thickness of the pellet and A is the area of the pellet.
a. c. resistivity, ac
ac σρ 1
= (4.8)
4.6 Micro-hardness Studies
Micro-hardness tests are the simplest, cheapest and non-destructive
ones to assess the mechanical properties of materials, which are reviewed in
detail by Mott [55]. In the present investigation, Vickers micro-hardness (i.e.
micro-indentation hardness) study was carried out and related mechanical
properties of the Struvite crystals were assessed. The present author has
used Vaiseshika Vickers micro-hardness tester type 7005 for the
measurements of Vickers micro-hardness. The details of the micro-hardness
study will be discussed elaborately in the chapter VII.
4.7 Etching Studies
Etching is one of the selective tools to identify the defects in the as
grown crystals, which is discussed in detail by Sangwal [56]. When the crystal
is selectively dissolved in an etchant, the reversal of the growth-taking place
by giving a well defined etches pits. The etching time depends on the
reactivity of the crystalline material in different etchants. In the present
investigation chemical etching study of the struvite crystals with the citric acid
was carried out and will be discussed elaborately in the chapter VII.

CHAPTER : IV : Characterization Techniques
Growth and Characterization of Struvite and Related Crystals
199
References
1. D. A. Skoog, F. J. Holler, T. A. Nieman, “Principles of Instrumental
Analysis”, Saunders College Publishing, Philadelphia, (1998).
2. W. C. Roentgen, Ann. Phys. Chem., 64 (1898) 1.
3. W. L. Bragg, Nature, 90 (1912) 410.
4. W. L. Bragg, Proc. Cambridge Philos. Soc., 17 (1913) 43.
5. P. Debye, P. Scherrer, Physik. Z, 27 (1917) 277.
6. A. W. Hull, Phys. Rev. (2), 9 (1917) 84.
7. A. W. Hull, J. Am. Chem. Soc., 41 (1919) 1168.
8. H. M. Rietveld, Acta Cryst., 22 (1967) 151.
9. H. M. Rietveld, J. Appl. Cryst., 2 (1969) 65.
10. http://www.matter.org.uk/diffraction/x-ray/images/powderstatic3.jpg
11. L. V. Azaroff, M. J. Buerger, “The Power Method in X-ray Crystallography”,
Mc Graw Hill, New York (1958).
12. H. P. Klug, L. E. Alexander, “X-ray Diffraction Procedures”, 2nd Ed. Wiley,
New York (1974).
13. D. Louer, E. Mittemeijer, “Powder Diffraction in Material Science”, (1967).
14. H. Lipson, H. Steeple, “Interpretation of X-ray Powder Diffraction
Patterns”, Macmillan, New York (1970).
15. http://www.lcc-toulouse.fr/lcc/IMG/jpg/XPertMPD1-2.jpg
16. A. A. Christy, Y. Ozaki, V. G. Gregoriou, “Modern Infrared Fourier
Transform Spectroscopy”, Elsever, New York (2001).
17. A. A. Michelson, Philos. Mag., 31 (1891) 338.
18. A. A. Michelson, Philos. Mag., 34 (1892) 280.
19. A. A. Michelson, Philos. Mag., 45 (1898) 85.

CHAPTER : IV : Characterization Techniques
Growth and Characterization of Struvite and Related Crystals
200
20. J. W. Cooley, J. W. Tukey, Math. Comput., 19 (1965) 297.
21. N. B. Colthup, L. H. Daly, S. E. Wiberley, “Introduction to Infrared and
Raman Spectroscopy”, Academic Press, London (1975).
22. http://en.wikipedia.org/wiki/Infrared_spectroscopy.
23. S. M. Khopkar, “Basic Concepts of Analytical Chemistry”, Wiley Eastern,
New Delhi, (1984).
24. S. I. Gupta, V. Kumar, R. C. Sharma, “Elements of Spectroscopy”,
Pragati Prakashan, Meerut, India (2007).
25. M. J. D. Lon, Anal. Chem., 97A (1969) 41.
26. http://www2.chemistry.msu.edu/faculty/reusch/VirtTxtJml/Spectrpy/Image
s/irspect.gif.
27. E. G. Brame, J. G. Grasselli, “Infrared and Raman Spectroscopy”, Vol. 1,
Practical Spectroscopy Series, Marcell Decker, New York (1977).
28. http://chemwiki.ucdavis.edu/@api/deki/files/5122/=2.gif
29. B. K. Sharma, “Spectroscopy”, Goel Publ., Meerut, (1997).
30. M. P. Fuller, P. R. Griffiths; Analy. Chem, 50 (1978) 1906.
31. M. P. Fuller, P. R, Griffiths; Appl. Spectrosc., 34 (1980) 533.
32. B. C. Smith, “Fourier Transform Infrared Spectroscopy”, CRC Press,
Boca Raton (1996).
33. J. O. Hill, “For Better Thermal Analysis”, 3rd Edition, International
Confederation for Thermal Analysis, New Castle, Australia (1991).
34. W. W. Wendlandt, “Thermal Analysis”, Wiley, New York (1985).
35. M. E. Brown, “Introduction to Thermal Analysis: Techniques and
Applications”. Chapman and Hall, New York (1988).
36. P. J. Haines, “Thermal Methods of Analysis”, Blackie, London (1995).

CHAPTER : IV : Characterization Techniques
Growth and Characterization of Struvite and Related Crystals
201
37. H. Le Chatelier, Bull. Soc. Fr. Min. Cristallogr., 10 (1887) 204.
38. G. Z. Tammann, Z. Anorg. Chem., 37 (1903) 303.
39. N. S. Kurnakov, Z. Anorg. Chem., 42 (1904) 184.
40. H. Saito, “Thermobalance Analysis”, Technical Book Pub., Tokyo (1962).
41. K. Honda, Sci. Rep. Tohoku. Univ., 4 (1915) 97.
42. W. W. Wendlandt, P. K. Gallagher, “Brief history of thermal analysis”, In
“Thermal Characterization of Polymeric Materials”, Ed. E. A. Turi,
Academic Press, London (1981).
43. E. Watson, M. O'Neill, J. Justin, N. Brenner, Anal. Chem., 36 (1964) 1233.
44. L. Erdey, “Gravimetric Analysis”, Pergamon Press, New York (1963).
45. H. Frohlic, “Theory of Dielectrics”, Clarendon Press, Oxford (1949).
46. J. C. Anderson, “Dielectric”, Chapman and Hall, London (1963).
47. P. J. Harrop, “Dielectrics”, Butterworth, London (1972).
48. B. Tareev, “Physics of Dielectric Materials”, Mir Publishers, Moscow (1975).
49. L. Solymar, D. Walsh, “Lectures on the Electrical Properties of
Materials”, Oxford University Press, New York (1984).
50. C. M. Kachhava, S. C. Saxena, Indian J. Phys., 41 (1967) 440.
51. B. B. Parekh, Ph.D. Thesis, Saurashtra University, Rajkot (2005).
52. S. R. Suthar, Ph.D. Thesis, Saurashtra University, Rajkot (2007).
53. D. J. Dave, Ph.D. Thesis, Saurashtra University, Rajkot (2011).
54. K. D. Parikh, Ph.D. Thesis, Saurashtra University, Rajkot (2011).
55. B. W. Mott, “Micro-indentation hardness testing”, Butterworths Scientific
Publications, London (1956).
56. K. Sangwal, “Etching of crystals: Theory, experiment, and application”,
Elsevier Science, Amsterdam, North Holland, (1987).