CHAPTER -III RESEARCH DESIGN - Information and...
21
CHAPTER -III RESEARCH DESIGN In previous chapter namely review of related research studies, an attempt was made to review research studies related to personality factors, teaching competency and emotional intelligence. It included research studies conducted in India and abroad. Actually review of the earlier studies helped and guided the researcher at every step of the study i.e. in deciding the research methodology of the study, in the selection of the sample more precisely, in deciding sample size and sampling method, in the selection and using the appropriate statistical techniques to analyse the data of the present study. The review of the study guided the researcher in overcoming weaknesses of earlier studies and including strengths of earlier studies in present one. The chapter in hand is an attempt to describe research method and procedure used to achieve objectives of the study, population on which research findings would be generalised, method of selecting sample and determination of sample size on which study was conducted, description of research tools used in the study to collect the data and finally the statistical techniques used for the analysis of data. In order to investigate something, unknown in any of the type of research, data must be obtained to reach certain conclusions. A method is a systematic and standardized procedure for the fulfillment of some specific purpose. Observation, description and the analysis of
Transcript of CHAPTER -III RESEARCH DESIGN - Information and...
CHAPTER -III RESEARCH DESIGN
In previous chapter namely review of related research studies,
an attempt was made to review research studies related to personality
factors, teaching competency and emotional intelligence. It included
research studies conducted in India and abroad. Actually review of the
earlier studies helped and guided the researcher at every step of the
study i.e. in deciding the research methodology of the study, in the
selection of the sample more precisely, in deciding sample size and
sampling method, in the selection and using the appropriate statistical
techniques to analyse the data of the present study. The review of the
study guided the researcher in overcoming weaknesses of earlier
studies and including strengths of earlier studies in present one.
The chapter in hand is an attempt to describe research method
and procedure used to achieve objectives of the study, population on
which research findings would be generalised, method of selecting
sample and determination of sample size on which study was
conducted, description of research tools used in the study to collect the
data and finally the statistical techniques used for the analysis of data.
In order to investigate something, unknown in any of the type of
research, data must be obtained to reach certain conclusions. A
method is a systematic and standardized procedure for the fulfillment
of some specific purpose. Observation, description and the analysis of
119
what happens under certain circumstances are the elements of all
research methods.
J.W. Best (1981) stated "to carry out any of the types of
research investigation, the data are gathered with which the hypothesis
may be tested. A great variety of methods and procedures have been
developed to aid in the acquisition of data. These tools are of many
kinds and employ distinctive ways of describing and qualifying the
data. Each is particularly appropriate for certain sources of data,
yielding information of the kind and in the form that would be most
effectively used."
There is probably too much dependence up on single method of
inquiry, because each data gathering procedure or device has its own
particular weakness or bias, advantage lies on using multiple methods,
supplementing one with others to counteract bias and generate more
adequate data. Students of research should familiarize themselves with
each of these tools of research and attempt to develop skill in their use
and sensitivity to their effectiveness in specific situation.
All researchers in the field of educational research generally
follow one or a combination of the following methods of research–
1. Historic Research
2. Descriptive Research
(i) Survey method
(ii) Case study
120
(iii) Genetic Study
(iv) Follow up study
3. Experimental Research
(i) Laboratory experiments
(ii) Field experiments
(iii) Field Studies
(iv) Survey Research
METHOD OF RESEARCH:
Selection of an appropriate research methodology for a
particular research study depends on insight and understanding of the
research scholar of research methods. Method depends on nature of
the problem undertaken for the study.
In case of the problem related to present status of phenomenon
Ex-post Facto survey method of research is applied to realize the
objectives of the present study.
In present study the problem has been stated as: "A Study of
Effect of Personality Factors and Emotional Intelligence of Pupil
Teachers on their Teaching Competency".
It is obvious from the title of the study that the problem is
neither related to history, nor philosophy, nor cause and effect, it is
concerned with present status of a phenomenon i.e. personality factors,
emotional intelligence and teaching competency of the pupil teachers.
121
Therefore, historical, philosophical and experimental method of
research did not serve the purpose of the study and these methods
were found unfit for the study. Ex-post Facto Survey method of
research which is used in the problems related to the present status of
phenomenon was found suiTable for the present study. Thus Ex-post
Facto survey method of research was applied in present study.
POPULATION OF THE STUDY:
Population, in research stands for universe or well-defined
group of persons on whom research finding can be generalized. More
precisely, it can be said that population is that group of people from
which sample of study is selected. In present study pupil teachers
studying in self-financed and Govt. aided institutions or colleges
affiliated to C.C.S. University, Meerut constituted the population.
SAMPLE OF THE STUDY:
It is very difficult, if not impossible to collect data from each
individual of the population. It also needs a lot of money, time and
resources. Therefore to overcome such problem, concept of sample was
developed by earlier research scientists. Sample stands for small portion
of population which represents the population. Therefore, findings of
research study conducted on small portion but representative portion of
the population can be generalised on the population. In present study
total 998 (Nine hundred ninety eight) pupil teachers in all, formed
the sample of the study.
122
Total 398 (Three hundred ninety eight) pupil teachers were
selected from the Govt. aided teacher education departments of Six
aided colleges and 600 (Six hundred) from six self-financed
institutions. This sample includes male as well as female pupil teachers
of two kinds of institutions, rural and urban as well. Sample of the study
was selected by simple random method by lottery system.
SAMPLING METHOD:
Simple random sampling method was used to select the
sample of the study. At first, out of eight (08) Govt.-aided colleges
imparting teacher education, i.e., running B.Ed. course affiliated to
C.C.S. University, Meerut total six (06) were selected randomly using
lottery method. Similarly out of Two hundred sixty (260) self-financed
institutions imparting teacher education i.e., B.Ed. course affiliated to
C.C.S. University, Meerut only six (06) institutions were selected
randomly using lottery method. From each teacher education
college/institution all the pupil teachers who participated in teaching
practice of teaching skill were included in the sample of the study.
Thus, total three hundred ninety eight (398) pupil teachers from
teacher education (B.Ed.) departments of six aided colleges and Six
hundred (600) pupil teachers from self-financed institutions were
selected finally and thus total Nine hundred ninety eight (998) B.Ed.
students or pupil teachers finally formed the sample of the present
study. All the institutes or colleges which are situated in rural area
123
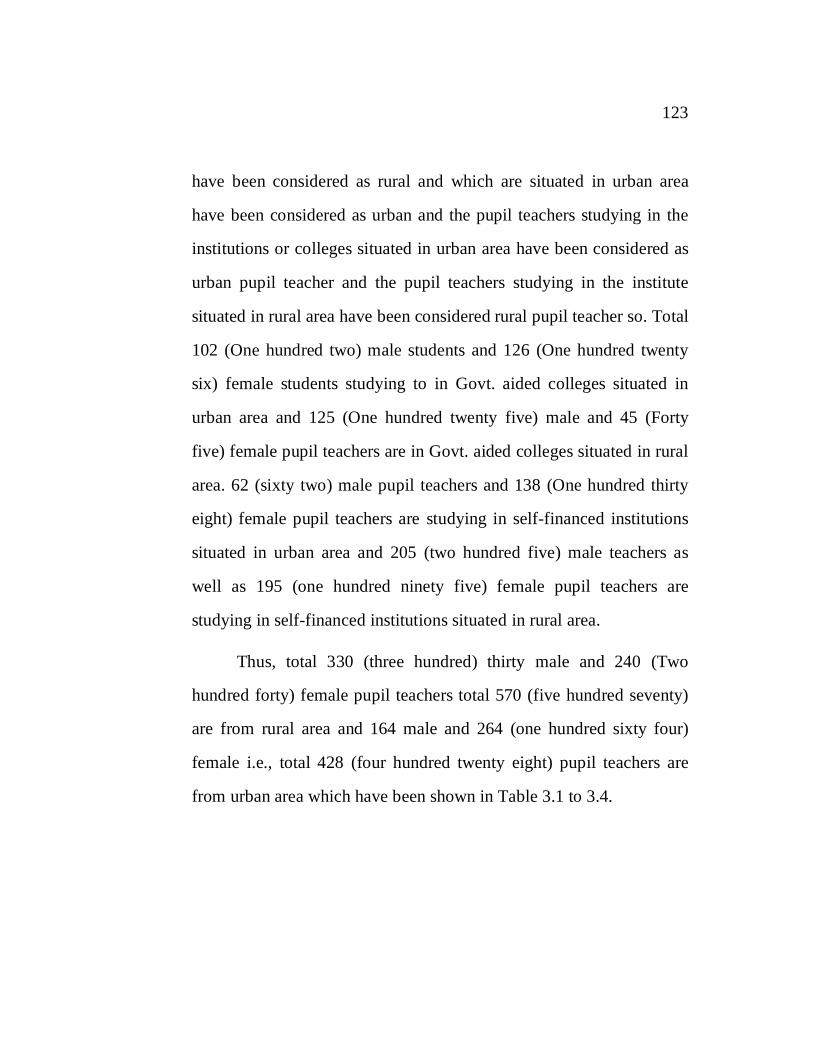
have been considered as rural and which are situated in urban area
have been considered as urban and the pupil teachers studying in the
institutions or colleges situated in urban area have been considered as
urban pupil teacher and the pupil teachers studying in the institute
situated in rural area have been considered rural pupil teacher so. Total
102 (One hundred two) male students and 126 (One hundred twenty
six) female students studying to in Govt. aided colleges situated in
urban area and 125 (One hundred twenty five) male and 45 (Forty
five) female pupil teachers are in Govt. aided colleges situated in rural
area. 62 (sixty two) male pupil teachers and 138 (One hundred thirty
eight) female pupil teachers are studying in self-financed institutions
situated in urban area and 205 (two hundred five) male teachers as
well as 195 (one hundred ninety five) female pupil teachers are
studying in self-financed institutions situated in rural area.
Thus, total 330 (three hundred) thirty male and 240 (Two
hundred forty) female pupil teachers total 570 (five hundred seventy)
are from rural area and 164 male and 264 (one hundred sixty four)
female i.e., total 428 (four hundred twenty eight) pupil teachers are
from urban area which have been shown in Table 3.1 to 3.4.
124
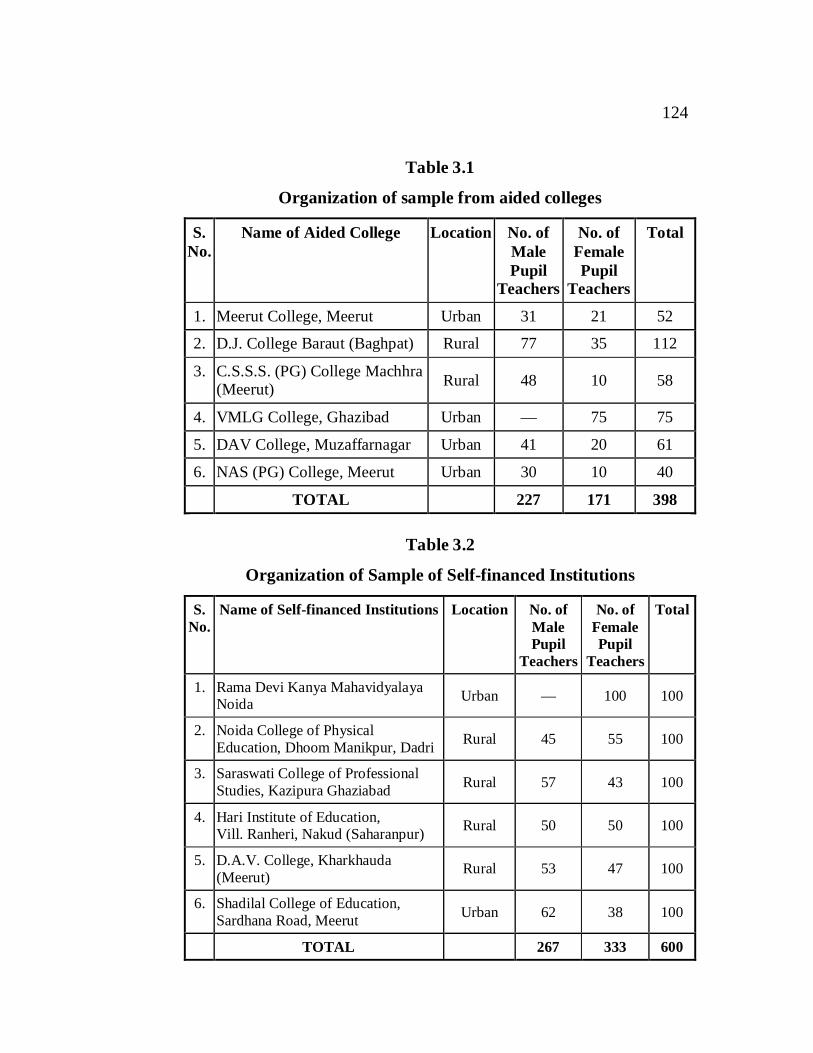
Table 3.1
Organization of sample from aided colleges
S. No.
Name of Aided College Location No. of Male Pupil
Teachers
No. of Female Pupil
Teachers
Total
1. Meerut College, Meerut Urban 31 21 52
2. D.J. College Baraut (Baghpat) Rural 77 35 112
3. C.S.S.S. (PG) College Machhra (Meerut) Rural 48 10 58
4. VMLG College, Ghazibad Urban — 75 75
5. DAV College, Muzaffarnagar Urban 41 20 61
6. NAS (PG) College, Meerut Urban 30 10 40
TOTAL 227 171 398
Table 3.2
Organization of Sample of Self-financed Institutions
S. No.
Name of Self-financed Institutions Location No. of Male Pupil
Teachers
No. of Female Pupil
Teachers
Total
1. Rama Devi Kanya Mahavidyalaya Noida Urban — 100 100
2. Noida College of Physical Education, Dhoom Manikpur, Dadri Rural 45 55 100
3. Saraswati College of Professional Studies, Kazipura Ghaziabad Rural 57 43 100
4. Hari Institute of Education, Vill. Ranheri, Nakud (Saharanpur) Rural 50 50 100
5. D.A.V. College, Kharkhauda (Meerut) Rural 53 47 100
6. Shadilal College of Education, Sardhana Road, Meerut Urban 62 38 100
TOTAL 267 333 600
125
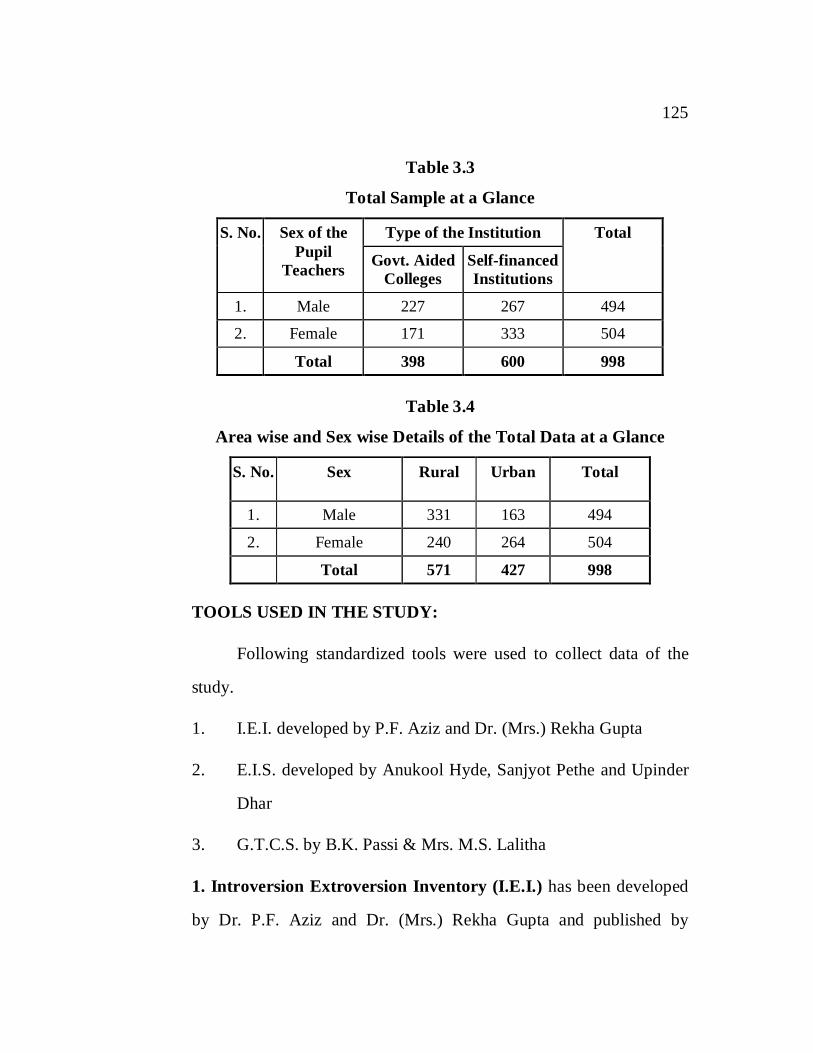
Table 3.3
Total Sample at a Glance
S. No. Sex of the Pupil
Teachers
Type of the Institution Total
Govt. Aided Colleges
Self-financed Institutions
1. Male 227 267 494
2. Female 171 333 504
Total 398 600 998
Table 3.4
Area wise and Sex wise Details of the Total Data at a Glance
S. No. Sex Rural Urban Total
1. Male 331 163 494
2. Female 240 264 504
Total 571 427 998
TOOLS USED IN THE STUDY:
Following standardized tools were used to collect data of the
study.
1. I.E.I. developed by P.F. Aziz and Dr. (Mrs.) Rekha Gupta
2. E.I.S. developed by Anukool Hyde, Sanjyot Pethe and Upinder
Dhar
3. G.T.C.S. by B.K. Passi & Mrs. M.S. Lalitha
1. Introversion Extroversion Inventory (I.E.I.) has been developed
by Dr. P.F. Aziz and Dr. (Mrs.) Rekha Gupta and published by
126
National Psychological Corporation, 4/230, Kacheri Ghat, Agra is ued
to estimate the personality and classifying in introvert or extrovert or
Ambivert type of personality contains total 60 items – 30 pertaining to
an introvert's characteristics and 30 to an extrovert's characteristics.
Each has to be answered in 'yes' or 'no' response.
The test has been standardized on a sample of 792 individuals
consisting of students, teachers, doctors, lawyers, engineers, business
men and housewives etc.
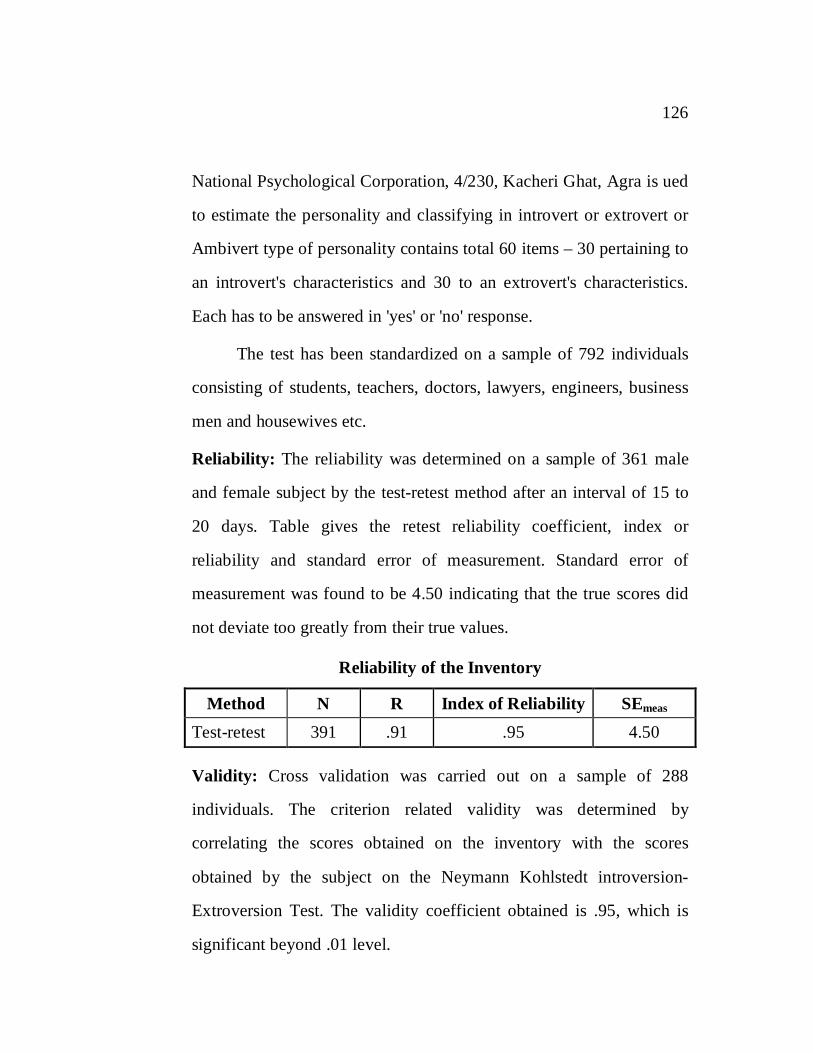
Reliability: The reliability was determined on a sample of 361 male
and female subject by the test-retest method after an interval of 15 to
20 days. Table gives the retest reliability coefficient, index or
reliability and standard error of measurement. Standard error of
measurement was found to be 4.50 indicating that the true scores did
not deviate too greatly from their true values.
Reliability of the Inventory
Method N R Index of Reliability SEmeas Test-retest 391 .91 .95 4.50
Validity: Cross validation was carried out on a sample of 288
individuals. The criterion related validity was determined by
correlating the scores obtained on the inventory with the scores
obtained by the subject on the Neymann Kohlstedt introversion-
Extroversion Test. The validity coefficient obtained is .95, which is
significant beyond .01 level.
127
Instructions for Administration:
1. It is a self-administering inventory. Through it may be
administered on groups of reasonable sizes, it can also be used
individually.
2. There is no fixed time limit. Ordinarily an individual takes 10 to 15
minutes.
3. It should be duly emphasized that all items have to be answered
either in the positive or in the negative in 'Yes' or 'No' and that no
statement must be skipped.
Scoring of the test:
Scoring: Scoring system is very easy. Extrovert responses are
considered to be correct. One mark is awarded for each correct
response. The correct responses are shown in Table 2 on page 6 of
manual of the test. After checking the responses of the subject's score
is calculated by the following formula:
Score obtained = No. of correct responses – No. of incorrect responses
The subject obtains a plus score when the No. of correct responses
exceeds that of the incorrect ones; he gets a minus score when the No.
of incorrect responses exceeds that of the correct ones. If the subject's
score ranges between –15 and +15 he is said to be an ambivert. If the
subjects score is above +15 he is said to be an extrovert; and if the
score is below –15 he is said to be an introvert.
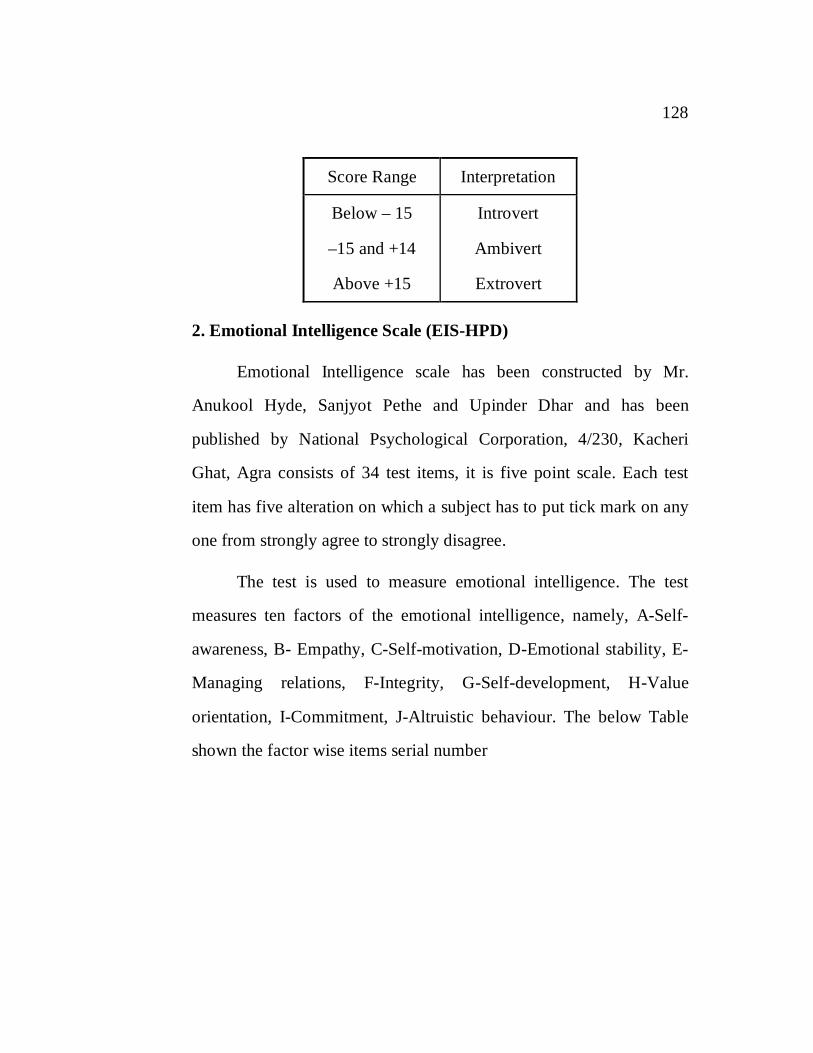
128
Score Range Interpretation
Below – 15
–15 and +14
Above +15
Introvert
Ambivert
Extrovert
2. Emotional Intelligence Scale (EIS-HPD)
Emotional Intelligence scale has been constructed by Mr.
Anukool Hyde, Sanjyot Pethe and Upinder Dhar and has been
published by National Psychological Corporation, 4/230, Kacheri
Ghat, Agra consists of 34 test items, it is five point scale. Each test
item has five alteration on which a subject has to put tick mark on any
one from strongly agree to strongly disagree.
The test is used to measure emotional intelligence. The test
measures ten factors of the emotional intelligence, namely, A-Self-
awareness, B- Empathy, C-Self-motivation, D-Emotional stability, E-
Managing relations, F-Integrity, G-Self-development, H-Value
orientation, I-Commitment, J-Altruistic behaviour. The below Table
shown the factor wise items serial number

129
Factor wise Items Serial Number
S.No. Factor Item Serial Number Total
A Self-awareness 6, 12, 18, 29 4
B Empathy 9, 10, 15, 20, 25 5
C Self-motivation 2, 4, 7, 8, 31, 34 6
D Emotional stability 14, 19, 26, 28 4
E Managing relations 1, 5, 11, 17 4
F Integrity 16, 27, 32 3
G Self-development 30, 33 2
H Value Orientation 21, 22 2
I Commitment 23, 14 2
J Altruistic behavior 3, 13 2
Total 34
Reliability: The reliability of the scale was determined by calculating
reliability coefficient on a sample of 200 subjects. The split-half
reliability coefficient was found to be 0.88.
Validity: Besides face validity, as all items were related to the
variable under focus, the scale has high content validity. It is evident
from the assessment of judges / experts that items of the scale are
directly related to the concept of Emotional Intelligence. In order to
find out the validity from the coefficient of reliability (Garrett, 1981),
130
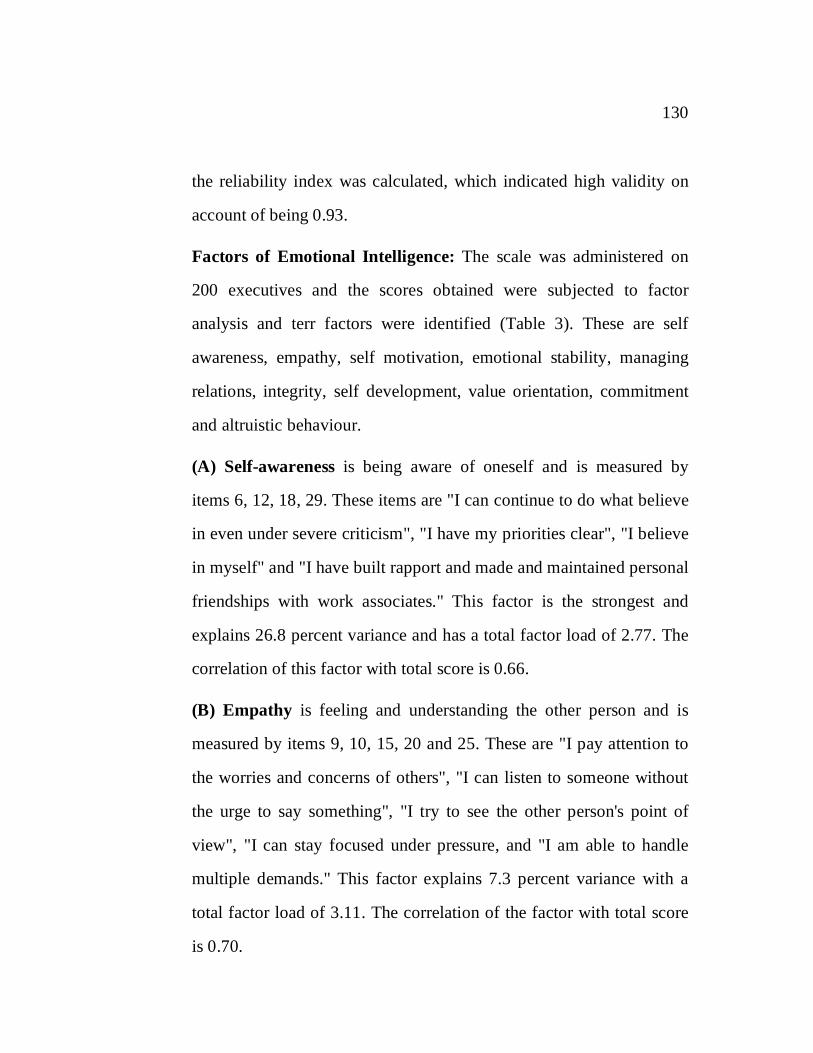
the reliability index was calculated, which indicated high validity on
account of being 0.93.
Factors of Emotional Intelligence: The scale was administered on
200 executives and the scores obtained were subjected to factor
analysis and terr factors were identified (Table 3). These are self
awareness, empathy, self motivation, emotional stability, managing
relations, integrity, self development, value orientation, commitment
and altruistic behaviour.
(A) Self-awareness is being aware of oneself and is measured by
items 6, 12, 18, 29. These items are "I can continue to do what believe
in even under severe criticism", "I have my priorities clear", "I believe
in myself" and "I have built rapport and made and maintained personal
friendships with work associates." This factor is the strongest and
explains 26.8 percent variance and has a total factor load of 2.77. The
correlation of this factor with total score is 0.66.
(B) Empathy is feeling and understanding the other person and is
measured by items 9, 10, 15, 20 and 25. These are "I pay attention to
the worries and concerns of others", "I can listen to someone without
the urge to say something", "I try to see the other person's point of
view", "I can stay focused under pressure, and "I am able to handle
multiple demands." This factor explains 7.3 percent variance with a
total factor load of 3.11. The correlation of the factor with total score
is 0.70.
131
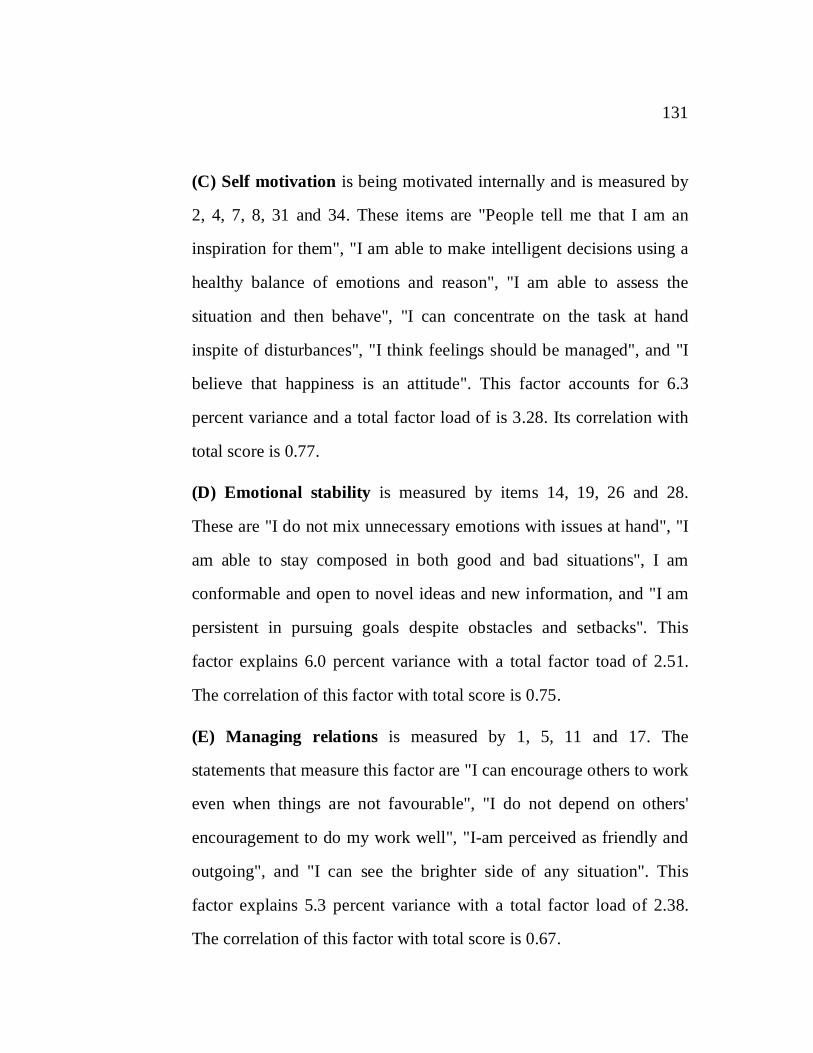
(C) Self motivation is being motivated internally and is measured by
2, 4, 7, 8, 31 and 34. These items are "People tell me that I am an
inspiration for them", "I am able to make intelligent decisions using a
healthy balance of emotions and reason", "I am able to assess the
situation and then behave", "I can concentrate on the task at hand
inspite of disturbances", "I think feelings should be managed", and "I
believe that happiness is an attitude". This factor accounts for 6.3
percent variance and a total factor load of is 3.28. Its correlation with
total score is 0.77.
(D) Emotional stability is measured by items 14, 19, 26 and 28.
These are "I do not mix unnecessary emotions with issues at hand", "I
am able to stay composed in both good and bad situations", I am
conformable and open to novel ideas and new information, and "I am
persistent in pursuing goals despite obstacles and setbacks". This
factor explains 6.0 percent variance with a total factor toad of 2.51.
The correlation of this factor with total score is 0.75.
(E) Managing relations is measured by 1, 5, 11 and 17. The
statements that measure this factor are "I can encourage others to work
even when things are not favourable", "I do not depend on others'
encouragement to do my work well", "I-am perceived as friendly and
outgoing", and "I can see the brighter side of any situation". This
factor explains 5.3 percent variance with a total factor load of 2.38.
The correlation of this factor with total score is 0.67.
132
(F) Integrity is measured by items 16, 27 and 32. "I can stand up for
my beliefs", "I pursue goals beyond what is required of me", and "I am
aware of my weaknesses" are the statements that measure this factor.
This factor explains 4.6 percent variance with a total factor load of
1.88.
(G) Self-development is measured by items 30 and 33 which are "I
am able to identify and separate my emotions" and "I feel that I must
develop myself even when my job does not demand it" and explains
4.1 percent variance with a total load of 1.37.
(H) Value orientation is measured by items 21, 22. The statements
are "I am able to maintain the standards of honesty and integrity", and
"I am able to confront unethical actions in others" and explains 4.1
percent variance with a total factor load of 1.29.
(I) Commitment is measured by the items 23 and 24. "I am able to
meet commitments and keep promises", and "I am organized and
careful in my work" measure this factor. This factor accounts for 3.6
percent variance with a total factor load of 1.39.
(J) Altruistic behaviour is mChapter-easured by the items 3 and 13.
The items are "I am able to encourage people to take initiative", and "I
can handle conflicts around me". It explains 3.0 percent variance with
a total factor load of 1.3.
133
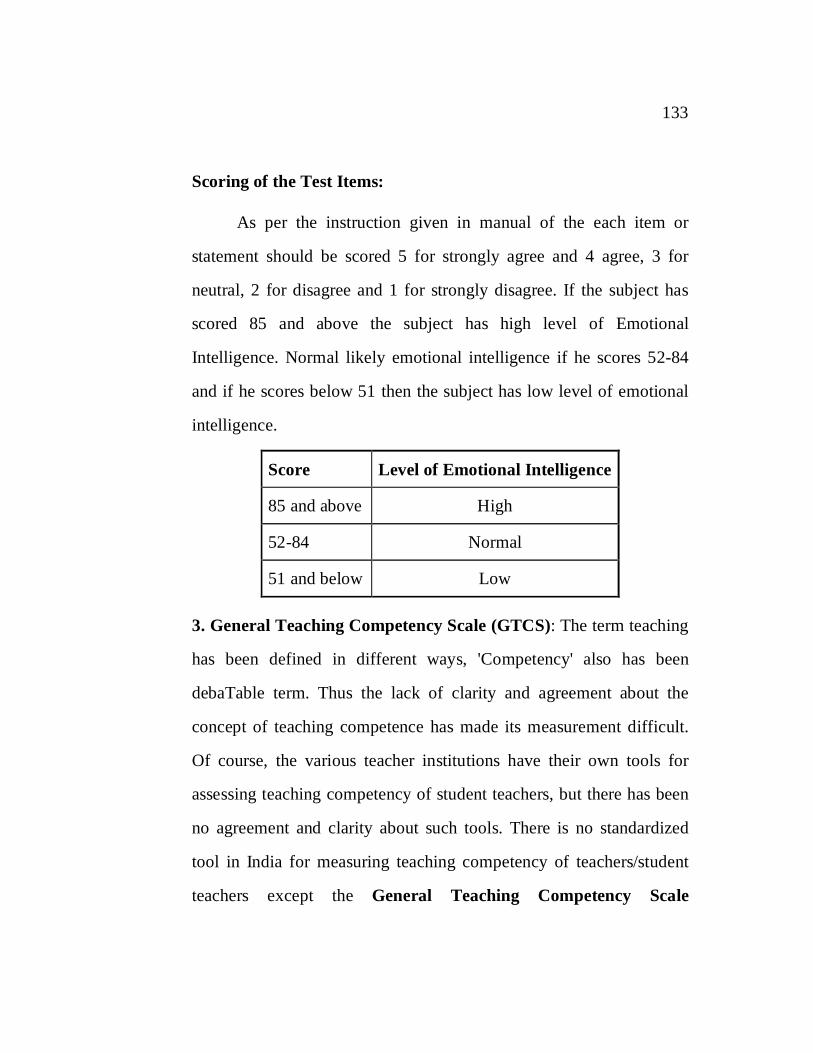
Scoring of the Test Items:
As per the instruction given in manual of the each item or
statement should be scored 5 for strongly agree and 4 agree, 3 for
neutral, 2 for disagree and 1 for strongly disagree. If the subject has
scored 85 and above the subject has high level of Emotional
Intelligence. Normal likely emotional intelligence if he scores 52-84
and if he scores below 51 then the subject has low level of emotional
intelligence.
Score Level of Emotional Intelligence
85 and above High
52-84 Normal
51 and below Low
3. General Teaching Competency Scale (GTCS): The term teaching
has been defined in different ways, 'Competency' also has been
debaTable term. Thus the lack of clarity and agreement about the
concept of teaching competence has made its measurement difficult.
Of course, the various teacher institutions have their own tools for
assessing teaching competency of student teachers, but there has been
no agreement and clarity about such tools. There is no standardized
tool in India for measuring teaching competency of teachers/student
teachers except the General Teaching Competency Scale
134
constructed by B.K. Passi and Mrs. M.S. Lalitha (1994). This
provides a measure of teaching competency.
Description of GTCS:
There are 21 items related to 21 teaching skills which
encompass the entire teaching-learning process in the class-room.
Teacher can be put under 15 different teaching skills. They are related
to 15 major aspect of class-room teaching namely, Introducing a
lesson, Fluency in questioning, Probing Question, Explanation,
Stimulus Variation, Reinforcement, Students Participation, pacing
Lesson, Interaction, Black-Board Writing, Closure Home Assignment,
Evaluating and Class-room Management. The items are such that they
are centered around teacher class-room behaviour in relation to Pupil
behaviour. The various teaching skills included are related to
objectives of the lesson, content selection, Content Organization
Selection of audiovisual materials (Planning Skills) introducing the
lesson, fluency of questions, use of probing questions, explaining,
illustrating with examples, stimulus variation, use of silence and non-
verbal cues, increasing pupil participation, Pacing use of Black board,
achieving closure giving assignment, classroom evaluation, diagnosis
of Pupil difficulties, recognising attending behaviour and maintaining
classroom discipline. The GTCS is a 7-points rating scale measuring
the use of skill by the teacher in the classroom corresponding to each
item ranging from '1' for 'not at all' to '7' for 'very much'. This
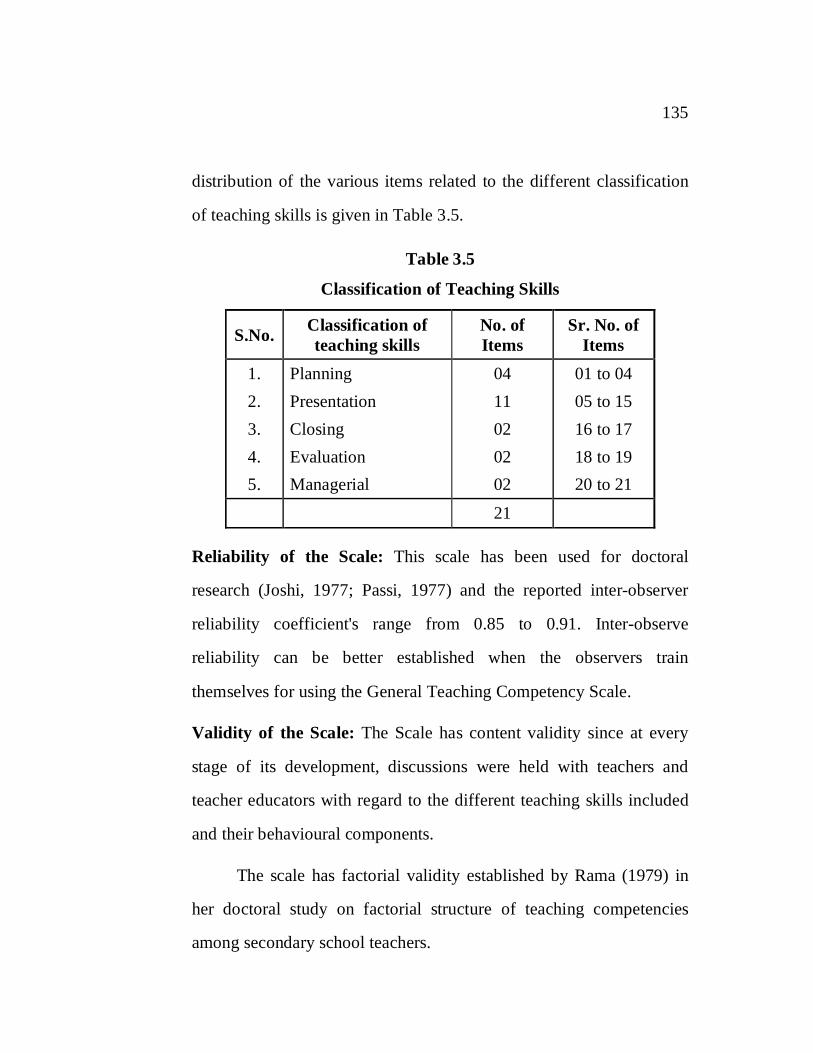
135
distribution of the various items related to the different classification
of teaching skills is given in Table 3.5.
Table 3.5
Classification of Teaching Skills
S.No. Classification of teaching skills
No. of Items
Sr. No. of Items
1. 2. 3. 4. 5.
Planning Presentation Closing Evaluation Managerial
04 11 02 02 02
01 to 04 05 to 15 16 to 17 18 to 19 20 to 21
21
Reliability of the Scale: This scale has been used for doctoral
research (Joshi, 1977; Passi, 1977) and the reported inter-observer
reliability coefficient's range from 0.85 to 0.91. Inter-observe
reliability can be better established when the observers train
themselves for using the General Teaching Competency Scale.
Validity of the Scale: The Scale has content validity since at every
stage of its development, discussions were held with teachers and
teacher educators with regard to the different teaching skills included
and their behavioural components.
The scale has factorial validity established by Rama (1979) in
her doctoral study on factorial structure of teaching competencies
among secondary school teachers.
136
Administration: The administration of general teaching competency
scale (GTCS) means the observation of teaching method of B.Ed.
Pupil teacher by the investigator. As the teacher began to teach the
subject in the class the investigator took his seat at the back in the
classroom for observation. At the end of teaching period, the
investigator gave him ratings on GTCS against all the 21 items. The
scale was thus administered on 200 Pupil teachers (general caste, OBC
& SC) of Govt. aided institutions and also 300 pupil teachers (general
caste, OBC & SC) of Self-financed institutions and data were thus
collected on a sample of 500 pupils teacher (general caste, OBC &
SC) of Govt. aided and self-financed teacher education institutions.
Scoring: The sum of the rating against all the 21 items constitutes the
score on General Teaching Competency (GTC Score) of the pupil
teacher being observed. The maximum score possible is 147 and the
minimum is 21. So the scoring is done by adding the ratings on the
GTC scale against all the items given by the investigator after
observation of teaching process.
COLLECTION AND ORGANIZATION OF DATA:
First of all the researcher met personally with the principals and
heads of the department of education of the colleges or institutions
which were selected randomly. Then he collected the list of the pupil
teachers (students of B.Ed. session 2010-11) and asked the dates and
venue or school for the teaching practice.
137
The researcher reached the school on the fixed dates where the
teaching practice was going on.
PROCESS OF DATA COLLECTION
First the each and every pupil teacher was observed by the
researcher himself and marked the concerned point on GTCS. Then in
the afternoon after the completion of teaching practice EIS-HPD and
I.E.I. were also administered on such all the pupil teachers whose
lessons were observed by the researcher himself..
All the three tests were evaluated/scoring was done in the
evening after the completion of the work.
Finally a Table was prepared by the researcher himself as the
data for the present study. Thus, the data for the purpose was
collected.
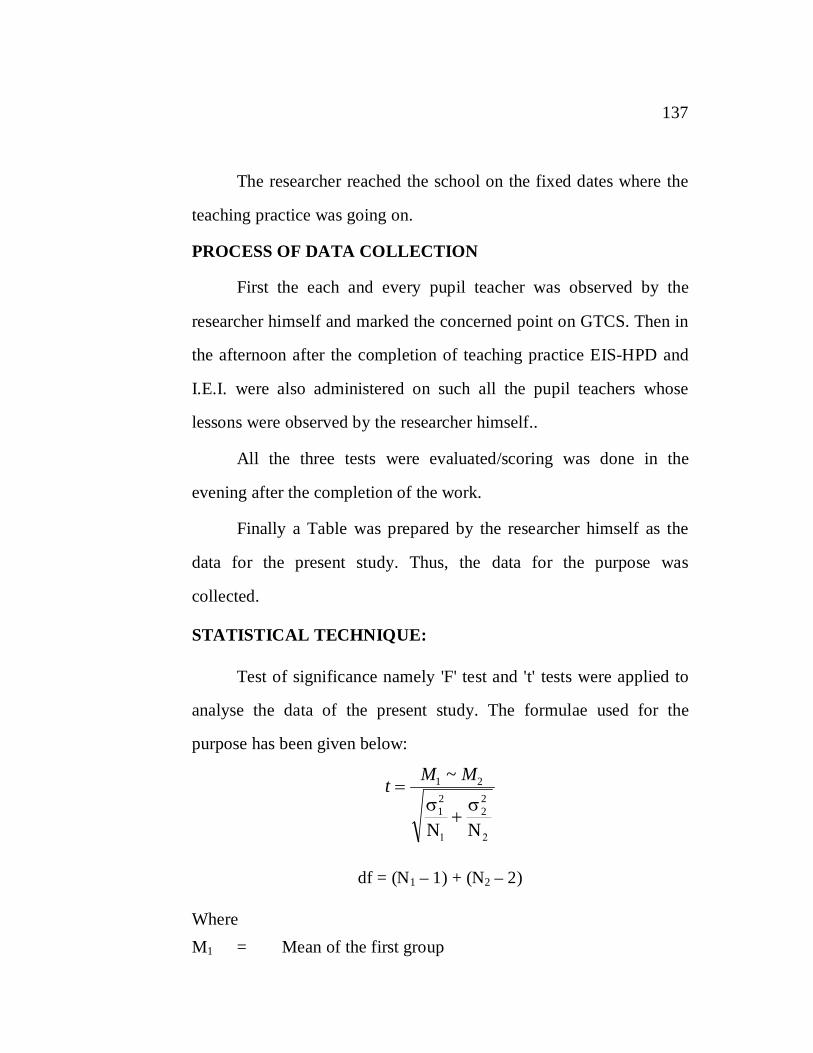
STATISTICAL TECHNIQUE:
Test of significance namely 'F' test and 't' tests were applied to
analyse the data of the present study. The formulae used for the
purpose has been given below:
t M M
1 2
12
22
~
N N
df = (N1 – 1) + (N2 – 2)
Where M1 = Mean of the first group
138
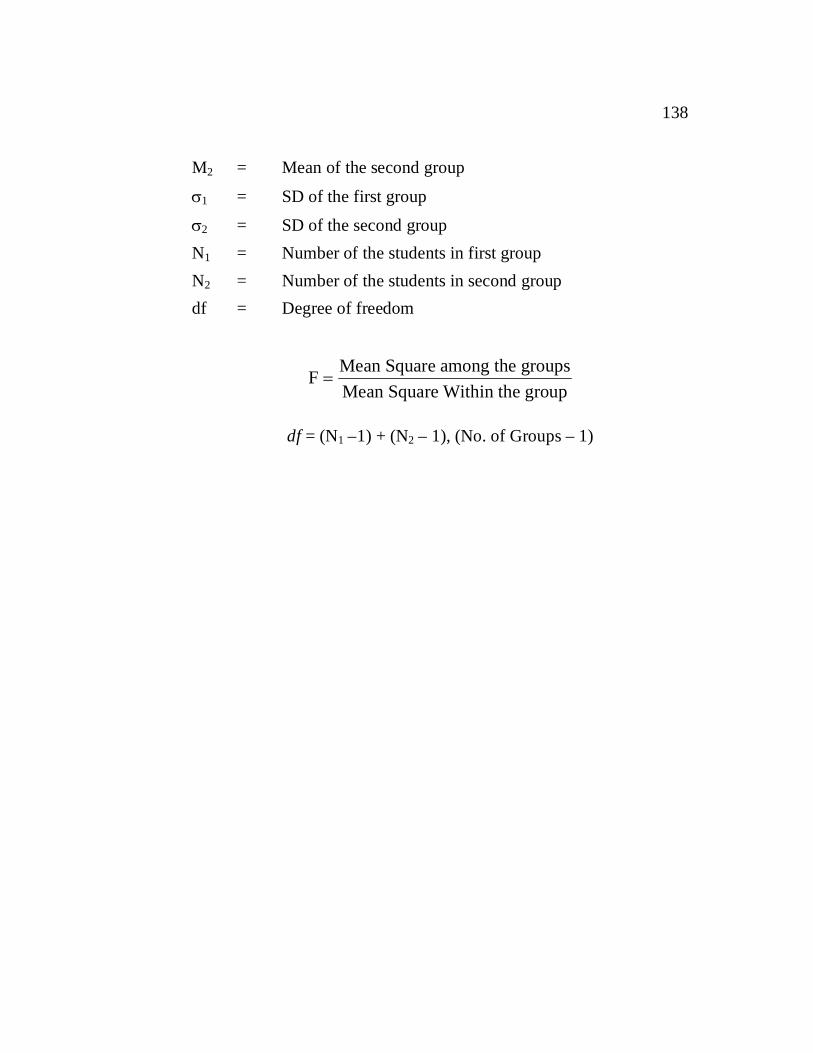
M2 = Mean of the second group
1 = SD of the first group
2 = SD of the second group N1 = Number of the students in first group N2 = Number of the students in second group df = Degree of freedom
F Mean Square among the groupsMean Square Within the group
df = (N1 –1) + (N2 – 1), (No. of Groups – 1)