CHAPTER II HONG KONG’S POPULATION: CHARACTERISTICS … · HONG KONG’S POPULATION:...
25
5 CHAPTER II HONG KONG’S POPULATION: CHARACTERISTICS AND TRENDS Our Population Population Projections 2.1 Hong Kong’s population tripled during 1950-2001, increasing from 2.2 million to 6.7 million over the period. The rate of growth, however, has declined over the decades (see Table 2.1 below). Table 2.1: Average annual growth rate of Hong Kong population Years Average Annual Growth Rate (%) 1951-1956 5.3 1956-1961 3.9 1961-1966 2.8 1966-1971 2.2 1971-1976 2.2 1976-1981 2.8 1981-1986 1.3 1986-1991 0.8 1991-1996 1.9 2 1996-2001 0.9 Source: Demographic Statistics Section, Census and Statistics Department 2 This figure is compiled based on the mid-1996 population estimate of 6.31 million under the extended de facto method.
Transcript of CHAPTER II HONG KONG’S POPULATION: CHARACTERISTICS … · HONG KONG’S POPULATION:...

5
CHAPTER II
HONG KONG’S POPULATION: CHARACTERISTICS AND TRENDS
Our Population
Population Projections
2.1 Hong Kong’s population tripled during 1950-2001, increasing from 2.2 million to 6.7 million over the period. The rate of growth, however, has declined over the decades (see Table 2.1 below).
Table 2.1: Average annual growth rate of Hong Kong population
Years Average Annual
Growth Rate (%)
1951-1956 5.3
1956-1961 3.9
1961-1966 2.8
1966-1971 2.2
1971-1976 2.2
1976-1981 2.8
1981-1986 1.3
1986-1991 0.8
1991-1996 1.92
1996-2001 0.9 Source: Demographic Statistics Section, Census and Statistics Department
2 This figure is compiled based on the mid-1996 population estimate of 6.31 million under the
extended de facto method.

6
2.2 According to the latest population projections 3 announced by the Census and Statistics Department (C&SD), Hong Kong’s population is projected to increase from 6.72 million in 2001 to 8.72 million in 2031:
Table 2.2: Population projections
Mid-year Total number of persons Average annual growth rate over the preceding ten years
%
2001 6,724,900 1.6
2011 7,527,700 1.1
2021 8,228,300 0.9
2031 8,721,500 0.6
Source: Hong Kong Population Projections 2002 - 2031
Census and Statistics Department These statistics reveal that over the past 50 years Hong Kong has undergone a demographic transition from a high-growth phase to a low-growth phase, and the growth rate is projected to remain low for the next few decades. 2.3 According to the Planning Department, the existing development areas in Hong Kong can, subject to certain constraints, physically accommodate a total population of 8.23 million as shown in the table below.
3 The projections are based on a set of assumptions on fertility, mortality and migration trends and
on current policies. If there are changes to these assumptions and policies, the projections would need to be revised.

7
Table 2.3: Population capacity of existing development areas
Population level at 2001
Population capacity
(a) Metro area 4.1M 4.59M
(b) Existing new towns 2.26M 3.24M
(c) Others 0.36M 0.40M
Total 6.72M 8.23M
Source: “Population Capacity of Hong Kong”, January 2003, Planning Department. 2.4 Moreover, with the potential development areas, again subject to certain limitations, we can further increase population capacity to 8.79 million.
Table 2.4: Estimated expansion in population capacity
Population capacity
(a) Existing development areas 8.23M
(b) Potential development areas 0.56M
Total 8.79M
Source:
“Population Capacity of Hong Kong”, January 2003, Planning Department.
2.5 Comparing the population projections in Table 2.2 with the estimated population capacities in Table 2.4, the existing population capacity of 8.23 million will not be reached until 2021. The existing and potential development areas taken together can accommodate a capacity of 8.79 million, which is sufficient to meet the projection of 8.72 million in 2031. 2.6 It must be emphasized that population capacities, suggested in paragraphs 2.3 and 2.4 above, are very broad-brush estimates which are subject to the following limitations:

8
♦ They are based on numerous assumptions such as the development potential of sites, flat size and average number of occupants per flat. Most of these variables are subject to market forces.
♦ They do not take into account major constraints such as transport and environmental issues, which will be considered under the HK2030 Study led by the Housing, Planning and Lands Bureau.
♦ Substantial investment will be required to realise the potential capacity for use and to redress the various constraints.
Fertility and Mortality
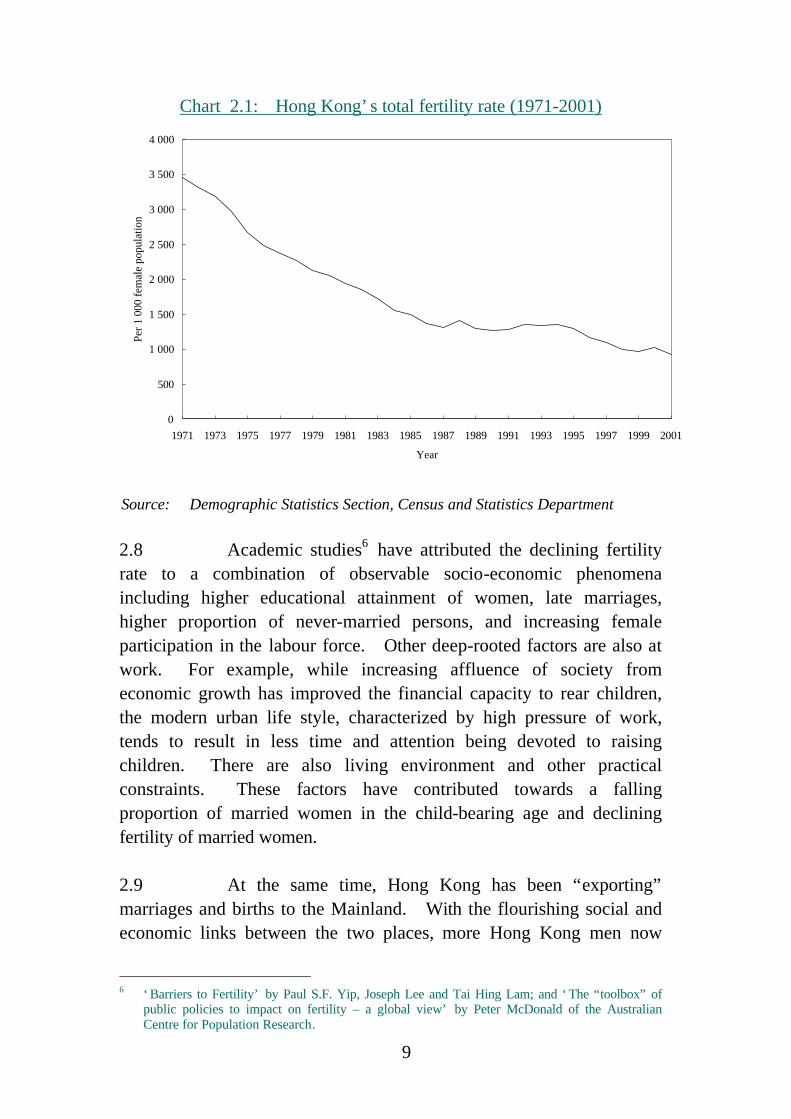
2.7 The total fertility rate4 in Hong Kong has dropped rapidly over the past three decades (see Chart 2.1 below). In 2001, it reached an extremely low level of 927 children per 1 000 women, well below the replacement level of 2 100 children per 1 000 women.5
4 The total fertility rate (TFR) refers to the average number of children that would be born alive to
1 000 women during their lifetime based on the age-specific fertility rates prevailing in a given year. In compiling the TFR for Hong Kong, all births in a year are counted, including those born in Hong Kong to women (the majority being wives of Hong Kong permanent residents) who are currently not but will in due course become members of the Hong Kong resident population. There, however, could be variant treatments of data in the computation of the TFR in dealing with such special phenomenon.
5 For a population to replace itself, each woman would have to produce on average a sufficient
number of children. A total fertility rate of 2 100 children per 1 000 women is considered to correspond to the replacement level, allowing for factors such as sex differential at birth, mortality of infants/children and mortality of women before reaching their reproductive years. For comparison purpose, for the year 2000 countries in Asia which have TFR below replacement level include Japan (1 400), Republic of Korea (1 500), Singapore (1 500), Thailand (1 700) and China (1 800). Many European countries are in a similar situation e.g. Spain (1 100), Italy (1 200), Germany (1 300), Sweden (1 400), Switzerland (1 400), Belgium (1 500), Finland
(1 600), Denmark (1 700), UK (1 700) and France (1 800). (Source: World Health Organization and United Nations Population Division)
9
Chart 2.1: Hong Kong’s total fertility rate (1971-2001)
500
1 000
1 500
2 000
2 500
3 000
3 500
4 000
1971 1973 1975 1977 1979 1981 1983 1985 1987 1989 1991 1993 1995 1997 1999 2001
Year
Per
1 00
0 fe
mal
e po
pula
tion
0
Source:
Demographic Statistics Section, Census and Statistics Department
2.8 Academic studies6 have attributed the declining fertility rate to a combination of observable socio-economic phenomena including higher educational attainment of women, late marriages, higher proportion of never-married persons, and increasing female participation in the labour force. Other deep-rooted factors are also at work. For example, while increasing affluence of society from economic growth has improved the financial capacity to rear children, the modern urban life style, characterized by high pressure of work, tends to result in less time and attention being devoted to raising children. There are also living environment and other practical constraints. These factors have contributed towards a falling proportion of married women in the child-bearing age and declining fertility of married women. 2.9 At the same time, Hong Kong has been “exporting” marriages and births to the Mainland. With the flourishing social and economic links between the two places, more Hong Kong men now
6 ‘Barriers to Fertility’ by Paul S.F. Yip, Joseph Lee and Tai Hing Lam; and ‘The “toolbox” of
public policies to impact on fertility – a global view’ by Peter McDonald of the Australian Centre for Population Research.
10
marry across the boundary, leading to more births attributable to Hong Kong people across the boundary. This also tends to lower the fertility rate in Hong Kong, as such births in the Mainland are not counted into Hong Kong’s fertility rate. The indigenous population growth in Hong Kong is hence dampened. 2.10 There are no comprehensive or accurate statistics to reveal the extent of these marriages (or births) taking place in the Mainland. We can only deduce from the number of applications for the Certificate of Absence of Marriage Records (CAMR) obtained from the Immigration Department, but this may show only a partial picture. However, the number of successful applications for CAMRs for marriage purpose in the Mainland in 1995, 1996, 1997, 1998, 1999, 2000 and 2001, at 21 655, 23 901, 27 864, 17 729, 15 870, 15 028 and 14 847 respectively, depicts a downtrend lately. Of the CAMR applicants, some 90% were men. Statistics also indicate that while the marriage rate in Hong Kong of both men and women has declined over the last 15 years, that for women dropped by one third compared with 25% for men. 2.11 Meanwhile, the standardised death rates7 dropped from 7.6 per 1 000 population in 1981 to 4.9 in 2001. Life expectancy at birth in Hong Kong has thus increased considerably over the years and is one of the longest among the developed economies in the world. Our high standards of public health and the success of anti-smoking campaigns have contributed to this uptrend. For male and female residents in Hong Kong, life expectancy at birth has increased from 68 and 75 to 78 and 85 respectively in the last 30 years, and is projected to reach 82 and 88 in 2031. 2.12 Based on the demographic trends of low fertility and high life expectancy, a quarter of the population in Hong Kong in 2031 is
7 Crude death rate relates the number of deaths occurred during a given year to the mid-year
population of that year. Differences in the age-sex composition of populations under comparison will contribute to differences to the crude death rates. To eliminate such difference in the comparison of the death rates of different populations, the age-sex composition of a standard population is chosen as a common reference. Essentially, the age-sex composition of the standard population is applied to the death rates of the corresponding age-sex groups of the populations under comparison to derive the respective “standardised death rates” of the populations. Currently, the population as at the 2001 Population Census moment is chosen as the standard population.

11
expected to be above the age of 65. The increase will be especially prominent for the “older” elderly, with a projected tripling of those aged 85 or over, rising from the current 67 200 to 209 000 in 2031. Table 2.5 and Chart 2.2 below show the aging trend of our population. Annex II shows the population pyramids for selected years.
Table 2.5: Number and percentage of persons in Hong Kong by major age group
Persons aged 0-14 Persons aged 15-64
Persons aged
65 & above
Mid-year
No. of persons (%)
No. of persons (%)
No. of persons (%)
1971 1 452 100 (35.9) 2 410 900 (59.6) 182 300 (4.5)
1981 1 277 300 (24.6) 3 561 800 (68.7) 344 300 (6.6)
1991 1 198 700 (20.8) 4 050 900 (70.4) 502 400 (8.7)
2001 1 104 100 (16.4) 4 867 200 (72.4) 753 600 (11.2)
2011 1 006 900 (13.4) 5 601 100 (74.4) 919 600 (12.2)
2021 1 036 600 (12.6) 5 777 300 (70.2) 1 414 400 (17.2)
2031 1 017 900 (11.7) 5 583 600 (64.0) 2 120 000 (24.3)
Note: Figures in brackets represent % of total population.
Sources: Hong Kong Annual Digest of Statistics, 2002 Edition,
Hong Kong Monthly Digest of Statistics, November 2002, and Hong Kong Population Projections 2002-2031, Census and Statistics Department

12
Chart 2.2: Hong Kong’s changing population
2 000 000
4 000 000
6 000 000
8 000 000
10 000 000
1971 1981 1991 2001 2011 2021 2031
Year
No. of persons
Total population Population aged 65+
Population aged 15-64 Population aged 0-14
0
Sources: Hong Kong Annual Digest of Statistics, 2002 Edition,
Hong Kong Monthly Digest of Statistics, November 2002, and Hong Kong Population Projections 2002-2031, Census and Statistics Department
Labour Force Projections
2.13 According to the latest projections, although Hong Kong’s population will grow by 30% from 6.72 million in 2001 to 8.72 million in 2031, the corresponding growth in the labour force will be much slower, by only 8% from 3.43 million to 3.70 million as shown in Table 2.6, Chart 2.3 and Chart 2.4. This can be attributed to the projected increase in the proportion of elderly persons; decline in the prime working age population (aged 25-59) and decline in labour force participation in the age groups of 15-19 and 20-24 as a higher proportion of them will receive tertiary education in future. As a result, 5 million or 58% of the population in 2031 will comprise economically inactive persons, as compared to 3.3 million or 49% in 2001. Thus, using the conventional concept of dependency, 30 years from now, a much higher proportion of economically inactive people will have to be supported by the economically active population.

13
Table 2.6: Labour force projection
Mid-year
Labour force
Average annual growth rate
over the preceding ten years
%
2001 3 427 100 2.0
2011 3 757 200 0.9
2021 3 750 600 *
2031 3 702 200 -0.1
Note: (*) - Change of less than 0.05%.
Source: Census and Statistics Department
Chart 2.3: Total population and labour force
1981 1991 2001 2011 2021 20311000
2000
3000
4000
5000
6000
7000
8000
9000Number ('000)
0
Total population
Labour force
Source: Census and Statistics Department

14
Chart 2.4: Growth profile of total population and labour force
-0.5
0.0
0.5
1.0
1.5
2.0
2001 2006 2011 2016 2021 2026 2031
Year
Ave
rage
ann
ual g
row
th r
ate
(%)
Population Labour force Source: Census and Statistics Department
Quality of the Existing Population Stock
2.14 A key indicator of population quality is educational attainment. Over the years, there has been a continued shift in the composition of the local population towards higher education levels. The results of the population census show that, in 2001, some 52% of population aged 15 and over in Hong Kong had at least upper secondary school education, and some 13% had tertiary degree education. These much exceeded the corresponding proportions of 20% and 3% in 1971 (details are shown in Table 2.7 below).

15
Table 2.7: Population aged 15 and over by educational attainment (highest level attended)
No. of persons (%)
Educational attainment 1971 1981 1991 2001
No schooling/ Kindergarten
574 793 (22.7)
604 623 (16.1)
557 297 (12.8)
469 939 (8.4)
Primary 1 114 464
(44.1) 1 283 393
(34.2) 1 100 599
(25.2) 1 148 273
(20.5)
Lower secondary 338 104
(13.4) 679 531
(18.1) 837 730
(19.1) 1 060 489
(18.9)
Upper secondary^ 389 705
(15.4) 796 403
(21.2) 1 169 271
(26.7) 1 473 681
(26.3)
Matriculation* 135 556
(3.6) 214 577
(4.9) 528 090
(9.4)
Tertiary:
- non-degree
46 045
(1.8)
123 753 (3.3)
234 912 (5.4)
209 878 (3.7)
- degree 65 615 (2.6)
125 794 (3.4)
255 979 (5.9)
708 622 (12.7)
Total 2 528 726
(100) 3 749 053
(100) 4 370 365
(100) 5 598 972
(100)
Notes: Figures in brackets represent % of total population.
^ Persons who have attended the “Craft level” are included. * Persons who have attended the “Diploma / certificate courses in Institute of
Vocational Education / former polytechnics” are included.
Source: Hong Kong Population Censuses, 1971, 1981, 1991 and 2001 Census and Statistics Department
2.15 To meet the needs of a knowledge-based economy, the CE announced in his 2000 Policy Address that it would be the Government’s target to allow 60% of Hong Kong’s senior secondary school leavers to receive tertiary education within 10 years, as against the existing ratio of 30%. This will help improve the quality of the population in the years to come. 2.16 Population quality can also be revealed from the skill level of the workforce. The results of the population censuses also

16
show that skilled personnel working as administrators, managers, professionals and associate professionals rose to 32% of the total working population in 2001, distinctly up from the proportion of 23% in 1991 (details are shown in Table 2.8 below). According to the results of the “Manpower Projection to 2005”, the demand for better-educated and more skilled workers will remain strong in the coming years.
Table 2.8: Working population aged 15 and over by occupation category
1991 1996 2001
Occupation category
Number of
persons
% share
Number of
persons
% share
Number of
persons
% share
Managers and
administrators
249 247 9.2 369 323 12.1 349 637 10.7
Professionals
99 331 3.7 151 591 5.0 179 825 5.5
Associate professionals
279 909 10.3 369 132 12.1 498 671 15.3
Clerks
431 651 15.9 512 719 16.8 529 992 16.3
Service workers and
shop sales workers
359 319 13.2 419 721 13.8 488 961 15.0
Craft and related
workers
397 992 14.7 373 143 12.3 321 000 9.9
Plant and machine
operators and
assemblers
365 836 13.5 259 909 8.5 238 666 7.3
Elementary occupations
and others
531 828 19.6 588 160 19.3 645 954 19.9
Total 2 715 103 100.0 3 043 698 100.0 3 252 706 100.0
Sources: Hong Kong Population Censuses, 1991 and 2001 and Hong Kong Population By-census 1996 Census and Statistics Department

17
Population Flow
Inflow
New Arrivals from the Mainland – the One Way Permit (OWP) Scheme 2.17 The OWP Scheme has been the single most important immigration policy that shapes Hong Kong’s demographic growth and composition. From 1997 to 2001, Mainland new arrivals under this Scheme were equivalent to some 93% of the population growth in Hong Kong.8 The OWP Scheme is a scheme devised primarily to facilitate families with immediate members (spouses and children) residing in the Mainland to be reunited in Hong Kong. OWP holders can be broadly divided into two groups: children of Hong Kong permanent residents with Certificate of Entitlement (CoE); and spouses and other dependants. The CoE children are permanent residents and have right of abode in Hong Kong. Spouses and other dependants who enter Hong Kong on OWPs are non-permanent residents but may become permanent residents after having ordinarily resided in Hong Kong for a continuous period of not less than seven years. The Scheme is operated by the Mainland authorities which govern the exit of Mainlanders to Hong Kong for settlement in accordance with Mainland laws and Article 22(4) of the Basic Law as interpreted by the National People’s Congress Standing Committee (NPCSC) Interpretation dated 26 June 1999. From 1983 to 2001, there were a total of 724 259 new arrivals admitted under the OWP Scheme, which was 10.8% of the population of 6.72 million in 2001. Current policy allows some 55 000 Mainland residents to migrate to Hong Kong under the Scheme every year, i.e. 150 a day. The daily quota used to be 75 in 1982, which was subsequently increased to 105 in 1993 and further to 150 in 1995 and has remained unchanged since then. The proportion of the new arrivals in the whole population has increased steadily from 2.6% in 1991 to 4% in 2001 (Chart 2.5).
8 The population growth from 1997 to 2001 was 292 400, comprising natural increase (101 900)
and net movement of residents (190 500). The number of births was 266 000, thus bearing a ratio of 91% to the population growth of 292 400. The inflow of One Way Permit holders was 272 100 and the corresponding ratio was 93%.

18
Chart 2.5: Number of New Arrivals and Proportion to the Whole Population, 1991, 1996 and 2001
Number Proportion (%)
Sources : Hong Kong 1991 and 2001 Population Census, Hong Kong 1996 Population By-census Census and Statistics Department 2.18 According to data provided by the Mainland authorities, the total number of OWP applications at August 2002 was around 168 000. Currently spouses in Guangdong have to wait seven or eight years to obtain an OWP while those in other provinces have to wait about five years. As regards CoE children, we notice from information published by the Guangdong Public Security Department that CoE children born in 2000 and 2001 were issued with OWPs to settle in Hong Kong.
2.19 With eligible children born every year through intermarriages between Hong Kong permanent residents and Mainlanders, it is likely that the OWP Scheme will continue to be a main source of population growth in Hong Kong for the foreseeable future. The socio-economic profile of OWP holders, particularly with
0
50 000
100 000
150 000
200 000
250 000
300 000
350 000
400 000
450 000
0
1
2
3
4
5
Number of New Arrivals Proportion of New Arrivals to the whole population
1991 1996 2001
2.6 2.7
4.0
143 944 169 319
266 577

19
respect to their age and educational attainment, will have a profound impact on the quality of our population. 2.20 We have not been able to obtain detailed profiles of OWP applicants. CPU has analysed Immigration Department data on the new arrivals on OWP, at the time of arrival, from 1997 to 2001. Results of the analysis help to throw some light on the likely profile of OWP applicants in the future. 2.21 The results are summarised as follows:
♦ There are more new arrivals of working age (20-59) than aged 19 and below. In 1996, 48% of new arrivals were aged 19 or below. This came down to 36% in 2001;
♦ The sex ratio is more or less balanced among those children of Hong Kong permanent residents with CoE. Females greatly out-numbered males in the non-CoE category, the majority of them being wives of Hong Kong residents. In 2001, 65% of all OWP holders entering Hong Kong were females; and
♦ For those aged 20 and above, 36% had only primary education or below in 1996, but this increased to 49% in 2001, as against 31% for the Hong Kong population as a whole in 2001. The majority of persons in this age group were not working prior to coming to Hong Kong (72% in 1996 and 57% in 2001), probably because most of them were housewives of Hong Kong residents.
2.22 Based on the 2001 Population Census data, the characteristics of new arrivals who arrived in the past seven years are examined in more detail below:
♦ Of the total 365 999 OWP holders who arrived in the seven-year period up to March 2001, only 266 577 were still residing in Hong Kong at the time of the Census. Some 27% have left, comprising mainly women aged

20
30-39 and children under the age of 15. They are probably spouses and children of Hong Kong residents. Some may have chosen to move back to the Mainland for various reasons after landing in Hong Kong, while others may have emigrated to other countries.
♦ Of those who stayed, about 35% were children under the age of 15, 62% were 15-64 and the remaining 3% were 65 and above;
♦ For those aged 15 and above, only about 30% had upper secondary education or higher, which was lower than that of the 52% of the whole population aged 15 and over (Table 2.9); and
♦ The labour force participation rate was 44.2% compared to 61.4% of the overall population. 30.7% were service workers/retail sales workers, and 34.9% were workers in elementary occupations. The median monthly income from all employment was $6,000, which was much lower than the $10,000 for the overall working population.

21
Table 2.9: New arrivals and whole population aged 15 and over by educational attainment (highest level attended)
New arrivals aged
15 and over
Whole population
Aged 15 and over
Educational Attainment Number % Number %
(highest level attended)
No schooling/Kindergarten 11 580 6.7 469 939 8.4
Primary 43 884 25.3 1 148 273 20.5
Lower secondary 66 431 38.4 1 060 489 18.9
Upper
Secondary/Matriculation
41 438 23.9 2 001 771 35.8
Tertiary 9 879 5.7 918 500 16.4
Total 173 212 100.0 5 598 972 100.0
Source: Hong Kong 2001 Population Census Census and Statistics Department
2.23 We can conclude from the above analysis that a great majority of the recent new arrivals are adults with relatively low educational attainment and relatively little working experience. Yet they have provided a steady supply to the labour force contributing to some 30%9 of the annual growth from 1999 to 2001. 2.24 The data show that on first arrival, this lack of education and experience puts them at a disadvantage in the local labour market. The unemployment rate for new arrivals is thus disproportionately high. 2.25 A closer examination (Table 2.10) shows that the unemployment rate for those who have been in Hong Kong longer approaches that of the entire population (i.e. the unemployment rate of new arrivals decreases with their length of stay in Hong Kong). This suggests that, although the generally lower educational attainment and
9 The number of new arrivals entering the labour force is estimated by applying the labour force
participation rates by sex in the 2001 Population Census to the new arrivals aged 15 and above coming to Hong Kong each year.

22
skill levels of the new arrivals tend to slow the adaptation process, with sufficient time more and more of them can be successfully integrated into the labour force. From a wider perspective, it makes little difference whether the unemployment rates were calculated with or without the unemployed new arrivals due to the small proportion of new arrivals in the total labour force (2.1% in the third quarter of 2002). Chart 2.6: Number and Proportion of New Arrivals in Labour Force
Source: Hong Kong 1991 and 2001 Population Censuses, Hong Kong 1996 Population By-census Census and Statistics Department
0
20
40
60
80
100
120
140
0
1
2
3
Thousands
Proportion (%)
Proportion of New Arrivals in the labour force to the total labour force
1991 1996 2001
65 491 65 228 76 568
2.3 2.0
2.2
Number of New Arrivals in the labour force

23
Table 2.10: Unemployment rate of new arrivals by duration of residence in Hong Kong
Duration of residence in
Hong Kong (Years) Unemployment rate*
for new arrivals (%)
<1 13.3
1 - <2 12.2
2 - <3 10.8
3 - <5 8.2
5 - <7 9.2
Total 10.1
Notes: Figures presented in the above table are based on small sample of
observations and subject to large sampling error.
* The figures presented in the table are average of those pertaining to the 4th
Quarter (Q4) 2001, Q2 2002 and Q3 2002. Figures for Q1 2002 are not
available. The unemployment rate (not seasonally adjusted) for the overall
population during the same period was 7.1%.
Source: General Household Survey, 4th Quarter, 2001, 2nd Quarter and 3rd Quarter,
2002 Census and Statistics Department
2.26 New arrivals are often found to be less choosy and more willing to accept lower wages for their jobs. Thus, the median monthly income from all employment of new arrivals with different levels of educational attainment are lower than those of the total labour force, and the gap is more noticeable for those new arrivals with higher educational attainment (Table 2.11). Also, on account of their relatively lesser education and skills and more limited local working experience, new arrivals tend to be engaged relatively more in jobs at the lower segment of the labour market.

24
Table 2.11: Median monthly income from all employment of working new arrivals and all working population by educational attainment (highest level attended) and sex, 2001
Median monthly income from all employment ($)
Working New arrivals All working population Educational attainment (highest level
attended) Male Female Both
Sexes Male Female Both
Sexes
No schooling / kindergarten 8 000 4 600 4 700 8 000 4 500 5 500
Primary 7 000 5 000 5 300 9 500 5 500 7 500
Lower secondary 7 500 5 700 6 000 10 000 6 499 9 000
Upper secondary / matriculation 8 000 6 500 7 000 12 000 9 500 10 500
Tertiary 12 000 9 500 10 000 25 000 17 000 20 000
Total 8 000 5 700 6 000 12 000 8 645 10 000
Source: Hong Kong 2001 Population Census
Census and Statistics Department 2.27 On the education performance of new arrivals, an academic study10 conducted on data from the population censuses has found that while children born in Hong Kong are generally more likely to attend university compared to the newly arrived children in the age 19-20 range, there are few significant differences in university attendance between native-born children and the Mainlanders who came to Hong Kong before the age of nine. It is only among the “older” Mainland children who arrived in Hong Kong after the age of nine that significant differences in university attendance exist. This suggests that the younger an OWP applicant is admitted, the easier it will be for him or her to adapt to Hong Kong’s education system.
10 David Post of the Hong Kong University of Science and Technology and the University of
Pittsburgh, published in his paper “Trends in Social Selectivity in Access to Hong Kong’s Higher Education, Preliminary Results from the 1981 – 2001 Census”.

25
Skilled Immigrants 2.28 HKSAR welcomes talent and professionals from outside Hong Kong to work and settle here. These skilled immigrants and their dependants are non-permanent residents but may become permanent residents after having ordinarily resided in Hong Kong for a continuous period of not less than seven years. There are various admission schemes for people from the Mainland and overseas. For the admission of foreign professionals, there are no quota or job sector restrictions. Successful applicants are allowed to bring along their dependants. From 1997 to 2001, an average of about 16 700 foreign professionals have come to work in Hong Kong each year. Admission schemes for Mainlanders are much more restrictive. Since its inception in December 1999, the Admission of Talents Scheme had recorded only 256 successful applications as at 31 December 2002. The Admission of Mainland Professionals Scheme is even more restrictive. The scheme is confined to the information technology and financial services sectors and successful applicants are not allowed to bring their spouse and children. There were only 268 successful applications as at 31 December 2002 since its commencement in June 2001. Transient Population11: Foreign Domestic Helpers and Imported Workers under the Supplementary Labour Scheme 2.29 Hong Kong has a significant number of imported low-skilled workers. They have no right of abode irrespective of their length of stay in Hong Kong. They are employed predominantly as domestic helpers. Others are mainly admitted under the Supplementary Labour Scheme. The number is rather small, currently at around 1 200. As at December 2002, there was a total of 237 104 foreign domestic helpers (FDHs) in Hong Kong. The importation of FDHs in the earlier years was a response to the rapid economic development prevailing then when more local women were attracted to join the labour force. Also, it redressed a shortage of local domestic helpers. The proportion of FDHs in total labour supply leaped from
11 For the purpose of this Report, transient population means migrant workers, who irrespective of
their length of stay in Hong Kong, have no right of abode in the SAR.

26
1% in 1982 to 7% in 2001. There was no clear indication that the admission of FDHs was affected by the economic downturn in the past few years, as shown in Table 2.12 below: Table 2.12: Total importation of foreign domestic helpers
End-year Total number
1982 21 517
1987 36 831
1992 101 182
1997 170 971
2002 237 104
Source: Visa Control Administration Section, Immigration Department 2.30 The employment of FDHs to take care of household chores has helped improve the quality of living for Hong Kong families. The arrangement also enables children, elderly and disabled persons to live with their family. There is also evidence that hiring FDHs has boosted the percentage of double-income families as more women are able to engage in full-time work. According to the 2001 Population Census, an average FDH employer household typically comprises a married working couple with one or two children. In 2001, 61% of FDH employer households have two economically active members (other than the FDH), as opposed to the proportion of 32% for non-FDH employer households. 2.31 According to a survey by the Education and Manpower Bureau in October 2000, FDHs were more likely to be required to take care of young children and the elderly. The 2001 Population Census showed that there were 160 527 households employing FDHs, of which 113 673 working females were found in households with children (aged 14 and below) and/or elderly (aged 60 and above) that employed FDHs. The main reasons for households employing FDHs were generally lower wages for FDHs when compared to those of local domestic helpers (LDHs), their overnight stay with the employers making them more suited to households with small children or elderly, and their

27
commitment to an employment contract. Households requiring services of LDHs would usually employ them on a part-time basis. In 2000 and 2001, there were 5 619 and 6 839 job-seekers registered with the Labour Department indicating a preference for LDH jobs. Yet some 40% of those registered did not indicate an interest in taking up full-time LDH jobs. We believe that out of all those interested in full-time LDH jobs, only a small percentage would be available on a live-in basis. The small number of live-in full-time LDHs available clearly falls far short of the demand for live-in full-time domestic helpers. Thus, FDHs and LDHs comprise two distinct markets both in terms of supply and demand, with LDHs preferring part-time jobs and households requiring full-time domestic helpers preferring FDHs.
Outflow Emigration 2.32 Emigration can be an important factor that decreases the population size. But in Hong Kong, the number of emigrants has decreased significantly over the past decades as shown in Chart 2.7.
Chart 2.7: Emigration from Hong Kong (1981-2002)
10 000
20 000
30 000
40 000
50 000
60 000
70 000
1981 1983 1985 1987 1989 1991 1993 1995 1997 1999 2001
Year
No.
of
pers
ons
0
Source: Hong Kong Information Notes : Emigration – October 2002
28
The number emigrating from Hong Kong each year declined from 66 200 in 1992 to just 10 500 in 2002. The accuracy of these figures has to be treated with caution since they are compiled on the basis of visa applications at local consulates complemented by the issuance of local documentation (such as certificates of no criminal conviction). Very significant emigration took place during the period 1987-1996, when perhaps a total of 503 800 Hong Kong residents left. An unknown but certainly significant number has since returned. This means that there is a large number of Hong Kong residents who can readily re-emigrate as they already have acquired their foreign passports or permanent resident status elsewhere. The number of Hong Kong permanent residents bearing foreign nationality stands at about 290 000 according to the Immigration Department. The number of persons with right of abode in foreign countries is likely to be substantially higher as many ethnic Chinese holding foreign passports prefer not to reveal or declare such possession. 2.33 The pressure or the demand to emigrate has eased in recent years. Uncertainty associated with the return of Hong Kong to China has passed and the recent economic downturn does not appear, thus far at least, to have increased the propensity to emigrate. The only factor that may change the course of emigration will be the persistently high unemployment in Hong Kong. Yet the recent high unemployment does not seem to have induced increased emigration. Whether those permanent residents with foreign nationality now choose to leave Hong Kong is difficult to determine accurately as they would appear neither in the emigration statistics of Hong Kong nor in the immigration statistics of the relevant countries. 2.34 A considerable proportion of emigrants from the HKSAR resident population are highly educated or skilled and the pattern has not changed over time. Many in the most recent, if diminished outflow, are professionals, associate professionals and administrative and managerial personnel, just as they were at the height of emigration outflow in the 1990s.

29
Hong Kong Residents Moving to the Mainland 2.35 Another outflow of more recent significance is the growing number of Hong Kong residents living, working or retiring in the Mainland, in particular in the Pearl River Delta (PRD). The Planning Department recently commissioned a joint survey with the Guangdong authorities of Hong Kong residents living in the PRD. The exercise is expected to be completed by mid-2003 and should provide data on this important aspect. 2.36 As far as existing data are concerned, there is no evidence that retiring across the boundary has become a significant trend,12 although this may change in the future. According to estimates by CPU, about 15 000 persons aged 50 or above had left Hong Kong for the Mainland and Macao between mid-1996 and mid-1998 and had not returned by mid-2001. This group might have already retired there. 2.37 In 2001, there was a total of 52 million departures to the Mainland by Hong Kong residents, up from 50 million in 2000 and 29 million five years earlier. The surveys on cross-boundary travels conducted by the Planning Department indicate that on average some 333 000 trips a day (including both arrivals and departures) were made during the survey period in 2001, up by about 17% over the level in the 1999 Survey. While leisure trips still dominate, business and work trips make up some 35% of all northbound trips. Two-thirds of the southbound trips made by Hong Kong residents who usually live in the Mainland are business and work trips. 2.38 The outflow of Hong Kong people to the Mainland will erode our revenue income as Hong Kong’s taxes are territorially based. However, persons whose status as Hong Kong permanent residents not affected under the law, even if they have resided outside Hong Kong for a long time, are entitled to public benefits and services on their return. This poses an additional challenge to public services which are heavily subsidized by the Government.
12 For example, the portable Comprehensive Social Security Assistance (CSSA) Scheme for elders
retiring in the Guangdong Province has not been popular since its introduction some five years ago, with only 2 800 participants, representing only 2% of all CSSA old age cases.