CHAPTER – II HISTORY OF INDIAN...
45
40 CHAPTER – II HISTORY OF INDIAN AGRICULTURE 2.1 INTRODUCTION Indian agriculture has long, old and beyond memory history which begins the Indus valley civilization. One of the most old water regulating structure in the world is Grand Anicut dam on river Kaveri (1st-2nd Century CE) [1] . Indian agriculture began by 9000 BCE as a result of early cultivation of plants, and domestication of crops and animals. Settled life soon followed with implements and techniques being developed for agriculture. Double monsoons led to two harvests being reaped in one year. Indian products soon reached the world via existing trading networks and foreign crops were introduced to India. Plants and animals—considered essential to their survival by the Indians—came to be worshiped and venerated. The middle ages saw irrigation channels reach a new level of sophistication in India and Indian crops affecting the economies of other regions of the world under Islamic patronage. Land and water management systems were developed with an aim of providing uniform growth. Despite some stagnation during the later modern era the independent Republic of India was able to develop a comprehensive agricultural program. Reference 1: Stein, Burton (1998), A History of India, Blackwell Publishing, ISBN 0-631-20546-2
Transcript of CHAPTER – II HISTORY OF INDIAN...

40
CHAPTER – II
HISTORY OF INDIAN AGRICULTURE 2.1 INTRODUCTION Indian agriculture has long, old and beyond memory history which begins the Indus
valley civilization. One of the most old water regulating structure in the world is
Grand Anicut dam on river Kaveri (1st-2nd Century CE)[1].
Indian agriculture began by 9000 BCE as a result of early cultivation of plants, and
domestication of crops and animals. Settled life soon followed with implements and
techniques being developed for agriculture. Double monsoons led to two harvests
being reaped in one year. Indian products soon reached the world via existing trading
networks and foreign crops were introduced to India. Plants and animals—considered
essential to their survival by the Indians—came to be worshiped and venerated.
The middle ages saw irrigation channels reach a new level of sophistication in India
and Indian crops affecting the economies of other regions of the world under Islamic
patronage. Land and water management systems were developed with an aim of
providing uniform growth. Despite some stagnation during the later modern era the
independent Republic of India was able to develop a comprehensive agricultural
program.
Reference 1: Stein, Burton (1998), A History of India, Blackwell Publishing, ISBN
0-631-20546-2

41
2.2 HISTORY OF INDIAN AGRICULTURE
2.2.1 Early History
Wheat, barley and jujube were domesticated in the Indian subcontinent by 9000 BCE.
Domestication of sheep and goat soon followed. This period also saw the first
domestication of the elephant. Barley and wheat cultivation—along with the
domestication of cattle, primarily sheep and goat—was visible in Mehrgarh by 8000-
6000 BCE. Agro pastoralism in India included threshing, planting crops in rows—
either of two or of six—and storing grain in granaries. By the 5th millennium BCE
agricultural communities became widespread in Kashmir. Zaheer Baber (1996)[1]
writes that 'the first evidence of cultivation of cotton had already developed'. Cotton
was cultivated by the 5th millennium BCE-4th millennium BCE. The Indus cotton
industry was well developed and some methods used in cotton spinning and
fabrication continued to be practiced till the modern Industrialization of India. A
variety of tropical fruit such as mango and muskmelon are native to the Indian
subcontinent. The Indians also domesticated hemp, which they used for a number of
applications including making narcotics, fiber, and oil. The farmers of the Indus
Valley grew peas, sesame, and dates. Sugarcane was originally from tropical South
Asia and Southeast Asia. Different species likely originated in different locations with
S. barberi originating in India and S. edule and S. officinarum coming from New
Guinea. Wild Oryza rice appeared in the Belan and Ganges valley regions of northern
India as early as 4530 BCE and 5440 BCE respectively. Rice was cultivated in the
Indus Valley Civilization. Agricultural activity during the second millennium BC
included rice cultivation in the Kashmir and Harrappan regions. Mixed farming was
the basis of the Indus valley economy. Denis J. Murphy (2007)[2] details the spread of
cultivated rice from India into South-east Asia:
References 1 : Baber, Zaheer (1996), The Science of Empire: Scientific Knowledge, Civilization, and Colonial Rule in India, State University of New York Press, ISBN 0-7914-2919-9.
Reference 2: Murphy, Denis J. (2007), People, Plants and Genes: The Story of Crops and Humanity, Oxford University Press, ISBN 0-19-920713-5.

42
Several wild cereals, including rice, grew in the Vindhyan Hills, and rice
cultivation, at sites such as Chopani-Mando and Mahagara, may have been
underway as early as 7000 BP. The relative isolation of this area and the early
development of rice farming imply that it was developed indigenously....Chopani-
Mando and Mahagara are located on the upper reaches of the Ganges drainage
system and it is likely that migrants from this area spread rice farming down the
Ganges valley into the fertile plains of Bengal, and beyond into south-east Asia.
Irrigation was developed in the Indus Valley Civilization by around 4500 BCE. The
size and prosperity of the Indus civilization grew as a result of this innovation, which
eventually led to more planned settlements making use of drainage and sewers.
Sophisticated irrigation and water storage systems were developed by the Indus Valley
Civilization, including artificial reservoirs at Girnar dated to 3000 BCE, and an early
canal irrigation system from circa 2600 BCE. Archeological evidence of an animal-
drawn plough dates back to 2500 BC in the Indus Valley Civilization.
2.2.2 Vedic period – Post Maha Janapadas period (1500 BCE – 200 CE)
Accoridng to Gupta (2004) [1] the summer monsoons may have been longer and may
have contained moisture in excess than required for normal food production. One
effect of this excessive moisture would have been to aid the winter monsoon rainfall
required for winter crops. In India, both wheat and barley are held to be Rabi (winter)
crops and—like other parts of the world—would have largely depended on winter
monsoons before the irrigation became widespread. The growth of the Kharif crops
would have probably suffered as a result of excessive moisture. Jute was first
cultivated in India, where it was used to make ropes and cordage. Some animals—
thought by the Indians as being vital to their survival—came to be worshiped.
Reference 1: Gupta, Anil K. (2004), "Origin of agriculture and d omestication of plants and animals linked to early Holocene climate amelioration", Current Science, 87 (1), Indian Academy of Sciences.

43
Trees were also domesticated, worshiped, and venerated—Pipal and Banyan in
particular. Others came to be known for their medicinal uses and found mention in the
holistic medical system Ayurveda.
In the later Vedic texts (c. 1000–500 BC), there are repeated references to
iron. Cultivation of a wide range of cereals, vegetables, and fruits is described.
Meat and milk products were part of the diet; animal husbandry was important. The
soil was plowed several times. Seeds were broadcast. Fallowing and a certain
sequence of cropping were recommended. Cow dung provided the manure.
Irrigation was practiced.
The Mauryan Empire (322–185 BCE) categorized soils and made meteorological
observations for agricultural use. Other Mauryan facilitation included construction and
maintenance of dams, and provision of horse-drawn chariots—quicker than traditional
bullock carts. The Greek diplomat Megasthenes (c. 300 BC)—in his book Indika—
provides a secular eyewitness account of Indian agriculture:
2.2.3 Early Common Era – High Middle Ages (200–1200 CE)
The Tamil people cultivated a wide range of crops such as rice, sugarcane, millets,
black pepper, various grains, coconuts, beans, cotton, plantain, tamarind and
sandalwood. Jackfruit, coconut, palm, areca and plantain trees were also known.
Systematic ploughing, manuring, weeding, irrigation and crop protection was
practiced for sustained agriculture. Water storage systems were designed during this
period. Kallanai (1st-2nd century CE), a dam built on river Kaveri during this period,
is considered the as one of the oldest water-regulation structures in the world still in
use.
Spice trade involving spices native to India—including cinnamon and black pepper—
gained momentum as India starts shipping spices to the Mediterranean. Roman trade
with India followed as detailed by the archaeological record and the Periplus of the
Erythraean Sea. Chinese sericulture attracted Indian sailors during the early centuries
of the common era. Crystallized sugar was discovered by the time of the Guptas (320-
44
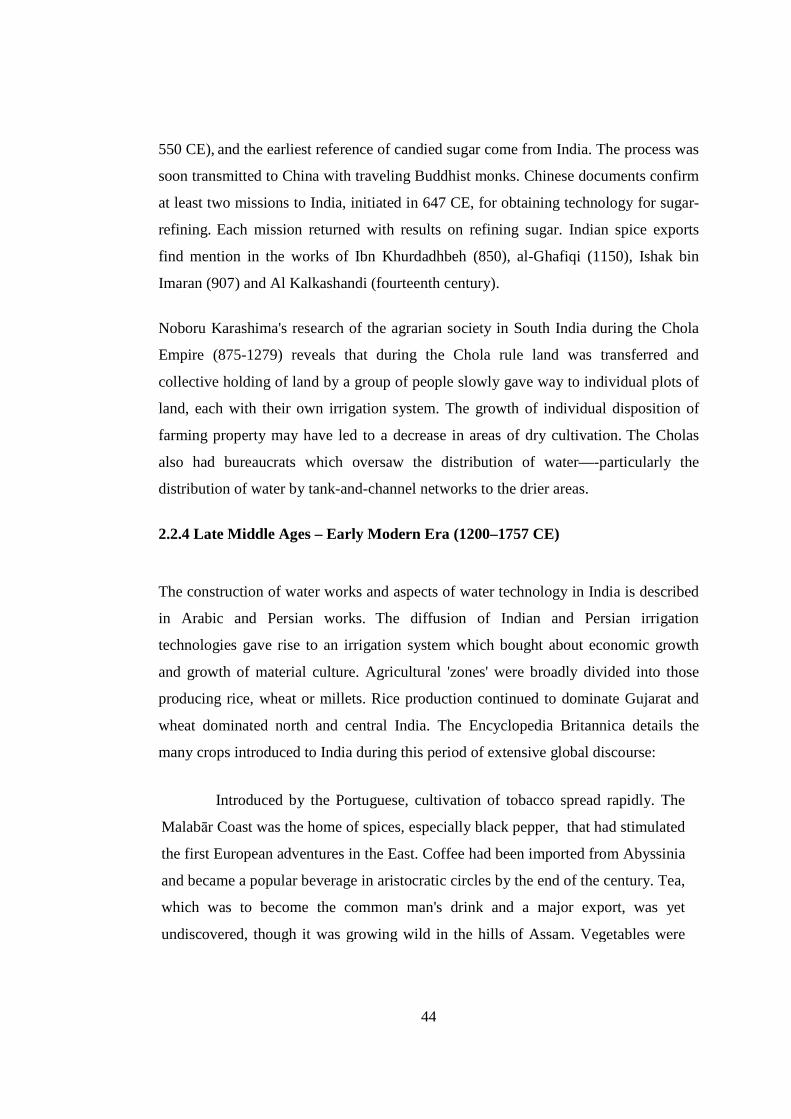
550 CE), and the earliest reference of candied sugar come from India. The process was
soon transmitted to China with traveling Buddhist monks. Chinese documents confirm
at least two missions to India, initiated in 647 CE, for obtaining technology for sugar-
refining. Each mission returned with results on refining sugar. Indian spice exports
find mention in the works of Ibn Khurdadhbeh (850), al-Ghafiqi (1150), Ishak bin
Imaran (907) and Al Kalkashandi (fourteenth century).
Noboru Karashima's research of the agrarian society in South India during the Chola
Empire (875-1279) reveals that during the Chola rule land was transferred and
collective holding of land by a group of people slowly gave way to individual plots of
land, each with their own irrigation system. The growth of individual disposition of
farming property may have led to a decrease in areas of dry cultivation. The Cholas
also had bureaucrats which oversaw the distribution of water—-particularly the
distribution of water by tank-and-channel networks to the drier areas.
2.2.4 Late Middle Ages – Early Modern Era (1200–1757 CE)
The construction of water works and aspects of water technology in India is described
in Arabic and Persian works. The diffusion of Indian and Persian irrigation
technologies gave rise to an irrigation system which bought about economic growth
and growth of material culture. Agricultural 'zones' were broadly divided into those
producing rice, wheat or millets. Rice production continued to dominate Gujarat and
wheat dominated north and central India. The Encyclopedia Britannica details the
many crops introduced to India during this period of extensive global discourse:
Introduced by the Portuguese, cultivation of tobacco spread rapidly. The
Malabār Coast was the home of spices, especially black pepper, that had stimulated
the first European adventures in the East. Coffee had been imported from Abyssinia
and became a popular beverage in aristocratic circles by the end of the century. Tea,
which was to become the common man's drink and a major export, was yet
undiscovered, though it was growing wild in the hills of Assam. Vegetables were
45
cultivated mainly in the vicinity of towns. New species of fruit, such as the
pineapple, papaya, and cashew nut, also were introduced by the Portuguese. The
quality of mango and citrus fruits was greatly improved.
Land management was particularly strong during the regime of Akbar the Great
(reign: 1556-1605), under whom scholar-bureaucrat Todarmal formulated and
implemented elaborated methods for agricultural management on a rational basis.
Indian crops—such as cotton, sugar, and citric fruits—spread visibly throughout North
Africa, Islamic Spain, and the Middle East. Though they may have been in cultivation
prior to the solidification of Islam in India, their production was further improved as a
result of this recent wave, which led to far-reaching economic outcomes for the
regions involved.
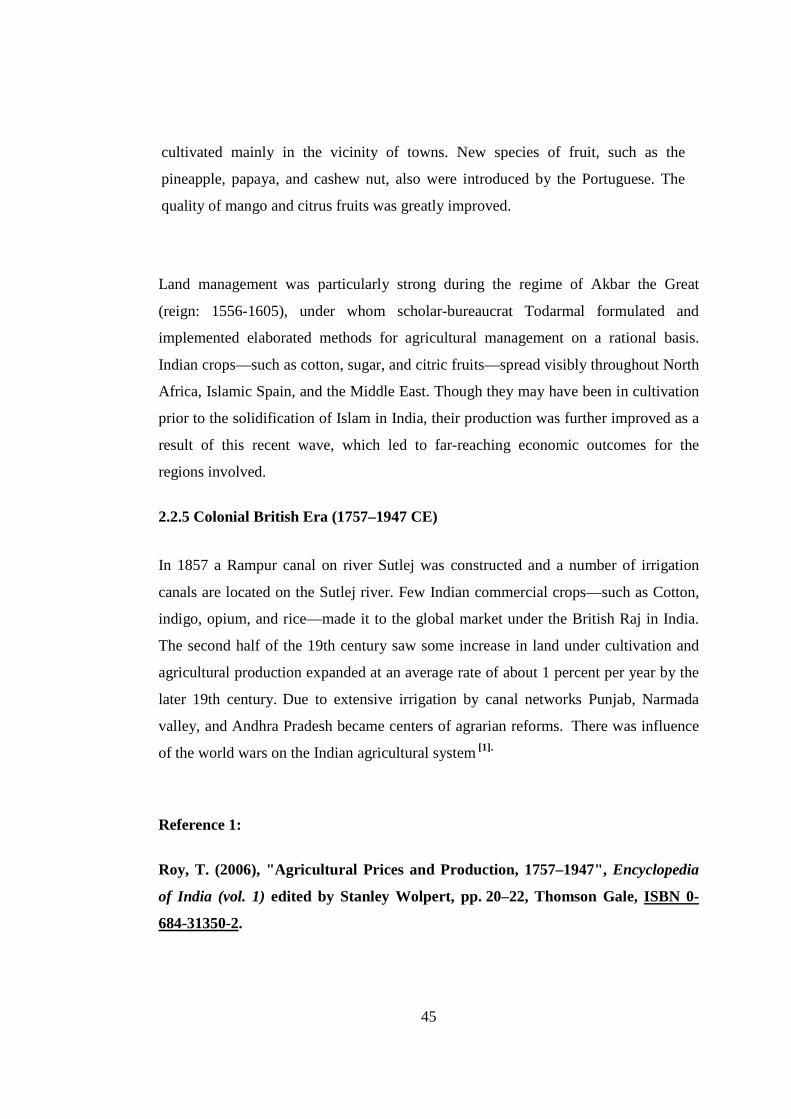
2.2.5 Colonial British Era (1757–1947 CE)
In 1857 a Rampur canal on river Sutlej was constructed and a number of irrigation
canals are located on the Sutlej river. Few Indian commercial crops—such as Cotton,
indigo, opium, and rice—made it to the global market under the British Raj in India.
The second half of the 19th century saw some increase in land under cultivation and
agricultural production expanded at an average rate of about 1 percent per year by the
later 19th century. Due to extensive irrigation by canal networks Punjab, Narmada
valley, and Andhra Pradesh became centers of agrarian reforms. There was influence
of the world wars on the Indian agricultural system [1].
Reference 1:
Roy, T. (2006), "Agricultural Prices and Production, 1757–1947", Encyclopedia
of India (vol. 1) edited by Stanley Wolpert, pp. 20–22, Thomson Gale, ISBN 0-
684-31350-2.
46
Agricultural performance in the interwar period (1918–1939) was dismal.
From 1891 to 1946, the annual growth rate of all crop output was 0.4 percent, and
food-grain output was practically stagnant. There were significant regional and
intercrop differences, however, nonfood crops doing better than food crops. Among
food crops, by far the most important source of stagnation was rice. Bengal had
below-average growth rates in both food and nonfood crop output, whereas Punjab
and Madras were the least stagnant regions. In the interwar period, population growth
accelerated while food output decelerated, leading to declining availability of food per
head. The crisis was most acute in Bengal, where food output declined at an annual
rate of about 0.7 percent from 1921 to 1946, when population grew at an annual rate
of about 1 percent.
The British regime in India did supply the irrigation works but rarely on the scale
required. Community effort and private investment soared as market for irrigation
developed. Agricultural prices of some commodities rose to about three times between
1870-1920.
A rich source of the state of Indian agriculture in the early British era is a report
prepared by a British engineer, Thomas Barnard, and his Indian guide, Raja
Chengalvaraya Mudaliar, around 1774. This report contains data of agricultural
production in about 800 villages in the area around Chennai in the years 1762 to 1766.
This report is available in Tamil in the form of palm leaf manuscripts at Thanjavur
Tamil University, and in English in the Tamil Nadu State Archives. A series of articles
in The Hindu newspaper in the early 1990s authored by researchers at The Center for
Policy Studies led by Shri Dharampal Dharampal highlight the impressive production
statistics of Indian farmers of that era.

47
2.2.6 Republic of India (1947 CE onwards) Bhakra Dam (completed 1963) is the largest dam in India. Special programs were
undertaken to improve food and cash crops supply. The Grow More Food Campaign
(1940s) and the Integrated Production Programme (1950s) focused on food and cash
crops supply respectively. Five-year plans of India—oriented towards agricultural
development—soon followed. Land reclamation, land development, mechanization,
electrification, use of chemicals—fertilizers in particular, and development of
agriculture oriented 'package approach' of taking a set of actions instead of promoting
single aspect soon followed under government supervision. The many 'production
revolutions' initiated from 1960s onwards included Green Revolution in India, Yellow
Revolution (oilseed: 1986-1990), Operation Flood (dairy: 1970-1996), and Blue
Revolution (fishing: 1973-2002) etc. Following the economic reforms of 1991,
significant growth was registered in the agricultural sector, which was by now
benefiting from the earlier reforms and the newer innovations of Agro-processing and
Biotechnology.
Due to the growth and prosperity that followed India's economic reforms a strong
middle class emerged as the main consumer of fruits, dairy, fish, meat and
vegetables—a marked shift from the earlier staple based consumption. Since 1991,
changing consumption patterns led to a 'revolution' in 'high value' agriculture while the
need for cereals is experienced a decline. The per capita consumption of cereals
declined from 192 to 152 kilograms from 1977 to 1999 while the consumption of
fruits increased by 553%, vegetables by 167%, dairy products by 105%, and non-
vegetarian products by 85% in India's rural areas alone. Urban areas experienced a
similar increase.
Agricultural exports continued to grow at well over 10.1% annually through the
1990s. Contract farming—which requires the farmers to produce crops for a company
48
under contract—and high value agricultural product increased. Contract farming led to
a decrease in transaction costs while the contract farmers made more profit compared
to the non-contract workforce. However, small landholding continued to create
problems for India's farmers as the limited land resulted in limited produce and limited
profits.
Since independence, India has become one of the largest producers of wheat, edible
oil, potato, spices, rubber, tea, fishing, fruits, and vegetables in the world. The
Ministry of Agriculture oversees activities relating to agriculture in India. Various
institutions for agriculture related research in India were organized under the Indian
Council of Agricultural Research (est. 1929). Other organizations such as the National
Dairy Development Board (est. 1965), and National Bank for Agriculture and Rural
Development (est. 1982) aided the formation of cooperatives and improved financing.
The contribution of agriculture in employing India's male workforce declined from
75.9% in 1961 to 60% in 1999–2000. Dev (2006)[1] holds that 'there were about 45
million agricultural labor households in the country in 1999–2000.' These households
recorded the highest incidence of poverty in India from 1993 to 2000. The green
revolution introduced high yielding varieties of crops which also increased the usage
of fertilizers and pesticides. About 90% of the pesticide usage in India is accounted for
by DDT and Lindane (BHC/HCH). There has been a shift to organic agriculture
particularly for exported commodities.
• Reference 1 :Dev, S. M. (2006), "Agricultural Labor and Wages since 1950", Encyclopedia of India (vol. 1) edited by Stanley Wolpert, pp. 17–20, Thomson Gale, ISBN 0-684-31350-2.

49
Figure 2.1
India’s Natural vegetation
Source: ICAR report 2006-2007

50
2.3 Indian Agriculture under Five Year Plans
On the eve of first plan (1951-1956) agriculture was in a hopeless and
deplorable condition. Our farmers were heavy debt to the village money-lenders. They
were having small and scattered holdings. They had neither the money nor the
knowledge to use proper equipment, good seeds and chemical manures. Except in
certain areas, they were dependent upon rainfall and upon the vagaries of the
monsoons. Productivity of land as well as of labour had been declining and was
generally the lowest in the world. In spite of the fact that nearly 70% of our working
population was engaged in cultivation, the country was not self-sufficient in food
grains but had come to depend on imports of food grains. Besides, the partition of the
country in 1946 worsened the agricultural situation as India was allotted more people
but less land to support.
2.3 (A) Objectives of Economic Planning for the Agricultural Sector
While planning to develop the agricultural sector, the Planning Commission has
kept four broad objectives[1]:
(a) Increase Agricultural Production - The aim has always been
i) To bring more land under cultivation,
ii) Raise the per hectare yield through intensive application of such agricultural
inputs as irrigation, improved seeds fertilizers, etc. and thus
iii) Bring about increased agricultural production.
(b) Increase Employment Opportunities – Apart from increase in production,
the agricultural sector has to generate additional employment opportunities and
provide scope for increasing the incomes of the poorer sections in our villages.

51
© Reduce the Pressure of Population on Land - Another basic objective of
planning in the agricultural sector has been to reduce the number of people working on
land, on the assumption that there are too many people working on land. The surplus
labour on land should be shifted to secondary and tertiary sectors, preferably in rural
land semi-urban areas.
Reference 1 : Indian Economy, Ruddar Datta, K.P.M Sundaram, S. Chand &
Co.53rd Edition, ISBN : 81-219-2045-0

52
(d) Reduce Inequality of Incomes in the Rural Sector - The Government should
remove the exploitation of tenants, and should distribute surplus land among small and
marginal farmers in such a way that there would be some degree of equality and
justice in the rural areas.
All these four objectives are generally followed in all our five year plans but in
practice, agricultural planning in India has come to mean increase in agricultural
production, viz., the achievement of the first objective; all other objectives have either
been ignored or given lower priority.
2.4 Strategy Used in Agricultural Sector under Five Year Plans
To bring about increase in agricultural production and also increase in rural
employment such as; setting up of community development programmes and
agricultural extension services throughout the country, expansion of irrigation
facilities, fertilizers, pesticides, agricultural machinery, high-yielding varieties of
seeds and expansion of transportation, power, marketing, and of institutional credit. To
reduce the pressure of population on land, the strategy used was to set up agro-based
industries and handicrafts in rural areas, to promote rural transport and
communications and to encourage the movement of people from agriculture to
industries and service sectors. Finally, to bring about equality and justice in rural
India, the strategy used was land reforms which included the removal of
intermediaries, like the Zamindars, the protection of tenants through tenancy
legislation, ceiling of land holding and distribution of surplus land among landless
labourers and small and marginal farmers.

53
2.4.1 Pattern of Investment in the Agricultural Sector - The pattern of investment
in the different five year plans is summarized in table 2.1 :
Table 2.1 Pattern of Government Outlay on Agriculture in the Plans (in Rs.)
Five Year
Plan
Year Total Plan
Outlay
Outlay on
Agriculture
& Irrigation
% of Total
Outlay
First Plan 1951-56 1,960 600 31
Second Plan 1956-61 4,600 950 20
Third Plan 1961-66 8,600 1,750 21
Fourth Plan 1969-74 15,780 3,670 23
Fifth Plan 1974-79 39,430 8,740 22
Sixth Plan 1980-85 1,09,290 26,130 24
Seventh Plan 1985-90 2,18,730 48,100 22
Eighth Plan 1992-97 4,85,460 1,02,730 20
Ninth Plan 1997-2002 8,59,200 1,70,230 20
Tenth Plan 2002-07 15,25,640 3,05,060 20
Source: Various Five Year Plan documents
It would be clear that the total outlay in each Plan had increased and, correspondingly,
the outlay on agriculture and irrigation had also increased. However. The percentage
of outlay on agriculture and irrigation to total plan outlay was the highest in the First
Plan, viz, 31% but ranged between 20 to 24% in all other plans.
The Indian Planning Commission specified the various programmes for increasing
agricultural production such as irrigation, soil conservation, dry farming and land
reclamation, supply of fertilizers and manures, better ploughs and improved
agricultural implements, adoption of scientific practices, etc. The Government gave
considerable attention to institutional changes such as the setting up of community

54
development programmes and agricultural expansion of transportation, power,
marketing and other basic facilities, improvement of the system of co-operative credit,
etc. From the Third Plan onwards, the greatest emphasis was laid on irrigation,
fertilizer, seed technology which led to green revolution.
2.4.2 Agricultural Progress under the Five Year Plans
We shall describe the progress made by India in the field of agriculture under the first
nine plans. In the next section, we shall take up the progress of agriculture under the
Ninth Plan separately.
a) First two Plans (1951-61)
The First Plan aimed at solving the food crisis India was facing at that time and ease
the critical agricultural raw material situation, particularly the acute shortage pf raw
cotton and raw jute. Accordingly, it gave highest priority to agriculture, specially food
production by allotting 31% of the total public sector outlay on agriculture, but it fixed
rather modest targets of production. (See the above table). As a result of favourable
weather conditions and the production targets in the agricultural sector were exceeded
for instance, as against the target of about 62 million tones, actual production of food
grains came to nearly 67 million tones. The targets fixed for other crops were not
fulfilled.
The Planning Commission wanted the Second Plan to lay the foundations of
industrialization and secure equal opportunities for all, particularly for the weaker
sections of the people in the country. Out of total outlay of Rs. 4,600 crores during the
Second Plan, a sum of Rs. 950 crores or about 20% was spent on agriculture. Despite
the percentage reduction in Plan outlay on agriculture, the progress on the agricultural
front was significant. For example, food grains production recorded nearly 80 million
tonnes in 1960-61, as against the target of 81 million tonnes. Likewise the production
of oilseeds, sugarcane, and cotton was much more in 1960-61. There was, however, a
shortfall in the production of all groups of commodities, as against the target fixed,
except in the case of sugarcane in which there was remarkable progress.

55
b) Third to Fifth Plans (1961-79)
Experience in the Second Plan had shown clearly that the rate of growth in agricultural
production was a major limiting factor in the progress of the India economy. As the
Government felt that the success of the agricultural sector was an essential condition
for the agricultural sector was an essential condition for the success of entire plan, the
Third Plan fixed ambitious targets of production for all agricultural crops.
It was during the Third Plan that the Government introduced the new agricultural
technology known as Intensive Agricultural District Programme of using improved
seeds, viz., High Yielding Varieties Programme (HYVP). The new agricultural
technology was expected to usher in the green revolution. However, as a result of the
extensive and serious drought conditions in 1965-66, agricultural production was
adversely affected.
a) None of the agricultural targets except sugarcane was chieved during the third
plan period; and
b) The actual output at the end of the Third Plan in the case of food grains,
oilseeds and raw cotton was lower than the output at the end of the Second Plan,
indicating that the Third Plan was a wash-out, as far as agriculture was concerned.
As the consequence of the shortfall in food production and serious famine conditions
in many parts of the country, the Government was forced to import food grains
extensively during the last of the third plan. Besides, for the first time, the public lost
interest in the planning process and the Government adopted “plan holiday” for three
years.
The experience of the Third Plan made the Planning Commission realize the bitter fact
that economic Planning would be a failure unless agricultural production was
increased rapidly. Accordingly, the Planning Commission assigned high priority to
agriculture in the successive plans.

56
Table 2.2: Achievements in the Agricultural Sector in the Various Plans
Five Year Plans
Food grains Oilseeds Sugarcane Cotton Jute
Target Achiev- ement
Target Achiev- ement
Target Achiev- Ement
Target Achiev- ement
Target Achiev- ement
First Plan
62 67 5.5 5.6 63 60 4.2 4.0 5.4 4.2
Second Plan
81 80 7.6 6.5 78 104 6.5 5.4 6.5 4.0
Third Plan
100 72 9.8 6.4 100 127 7.0 4.6 6.2 4.5
Fourth Plan
129 104 10.5 8.7 150 140 8.0 5.8 7.4 6.2
Fifth Plan
125 126 12.0 8.9 165 165 8.0 7.1 7.7 7.1
Sixth Plan
154 146 11.1 13.0 215 170 9.2 8.5 9.1 7.8
Seventh Plan
180 172 18.0 17.0 217 210 9.5 10.5 9.5 7.9
Eighth Plan
210 191 23.0 25.0 275 277 14.0 14.3 9.5 11.0
Ninth Plan
234 211 30.0 20.7 336 300 15.7 10.1 ----- 11.6
Note: 1. Production of food grains, oilseeds and sugar cane in million tones 2: Production of cotton in millions of bales of 180 kgs each 3: Production of jute in millions of bales of 170 kgs each Source: Plan documents and Economic Surveys
The approach to the Fourth Plan, for instance, emphasized the necessity
to create favourable economic conditions for the promotion of agriculture and a
systematic effort to extend the application of science and technology to improve
agricultural practices.
Table above, however, reveals clearly that none of the targets fixed in agriculture in
Fourth Plan was realized. For example, the target for food grains was 129 million

57
tonnes for 1973-74 but the actual production in that year was only 104 million tones
the highest level of production was 108 million in 1970-71.
The Fifth Plan (1974-79) was prepared with great care, with total plan outlay at Rs.
39,430 crores out of which outlay on agriculture would be Rs. 8,740 crores (which
was 22% of the total Plan outlay). The targets for production of various crops and
necessary inputs to achieve these targets were also clearly set. Unfortunately, all the
financial calculations went wrong because of the serious inflationary situation during
1973-74. The Fifth Plan period also witnessed the declaration of emergency (1975).
Even though agricultural progress was steady and plan targets were being realized, the
Janata Party which came to power at the Center suspended the Fifth Plan mid way and
started preparing the Sixth Plan. ( Refer to Table 2.1 for V Plan targets and actual
achievements in the agricultural sector).
(D) Progress since the Sixth Plan
Of all the Plans, the Sixth Plan (1980-85) was hailed as a great success, particularly
because of the success on the agricultural front. As against the annual growth rate of
3.8 for agriculture, the actual growth rate was 4.3%. The production of food grains in
1983-84 was 154 million tonnes (against the target of 154 million tonnes) and was
hailed by the Indian Government as the second green revolution. While the First
Green Revolution from 1967-68 arose from the introduction of new high yielding
varieties of Mexican Wheat and dwarf rice varieties, the Second Green Revolution
from 1983-84 was said to be from expansion in supplies of inputs and services to
farmers, agricultural extension and better management.
While the First Green Revolution was confined mainly to Punjab, Haryana and
Western U.P., the Second Green Revolution had spread to eastern and central states
including West Bengal, Bihar, Orissa, Madhya Pradesh and Eastern U.P. These states
had made tremendous progress in recent years.

58
However, it is important to emphasize the fact that, despite all the great claim of the
Government, none of the targets (except in oilseeds) of agricultural production was
achieved during Sixth Plan (Refer Table).
The Seventh Plan (1985-90) and the Eighth Plan (1992-97) laid emphasis on specific
projects in the field of agriculture They included a special rice production programme
for rain fed agriculture, national oilseeds development project, social forestry, etc.
The Seventh Plan was not successful in the sense that the targets fixed for various
sectors (except cotton) were not achieved. However, the level of production at the end
of the Seventh Plan was much higher than the beginning of the Seventh Plan.
The Eighth Plan (1992-97) was basically sound in its approach in the strategy of
development and in the targets of agricultural crops. Fortunately, weather and climate
conditions were favourable and broadly many of the targets could be fulfilled. For
instance, the actual outputs in1996-97 of oil seeds, of sugarcane, of cotton and of jute
were higher than the targets for these crops in the Eighth Plan. The only exception was
food grains the Eighth Plan target was 210 million tones but the actual production was
199 million tonnes. In fact, the production of food Grains at 199 million tonnes was
the highest output registered by India till the date.
The Ninth Plan (1997-2002) treated more elaborately in the next section was not much
of a success, as far as the agricultural targets were concerned. For instance, the Ninth
Plan fixed the target of food grains production at 234 million tonnes in 2001-02; but
the actual production was only 212 million tones. The same story of under –
achievement was to be noted in other sectors of agriculture also. One is inclined to ask
the question: why should the planners fix unrealistic and unrealizable targets?

59
2.5 India’s Rainbow Revolution
Rainbow revolution concept is a combination of Green Revolution, White Revolution,
Blue Revolution, Yellow Revolution and Brown Revolution. It was after these
revolutions, the Indian agriculture slowly shifted from traditional behaviour to
scientific behaviour. So, it is necessary to understand these revolutions in brief. The
following chart shows various revolutions related to various produces of Indian
agriculture. Here we are discussing mainly Green Revolution, White Revolution, Blue
Revolution and Yellow Revolution in brief
Revolution Production
Black Revolution Petroleum production
Blue Revolution Fish production
Brown Revolution Leather/non-conventional(India)/Cocoa production
Golden Revolution Overall Horticulture development/Honey Production
Golden Fiber Revolution Jute Production
Green Revolution Food grain (Cereals, Wheat &Leguminous plant) production
Grey Revolution Fertilizer production
Pink Revolution Onion production/Pharmaceutical (India)/Prawn production
Red Revolution Meat & Tomato production
Round Revolution Potato production
Silver Fiber Revolution Cotton production
Silver Revolution Egg/Poultry production
White Revolution Milk/Dairy production (In India - Operation Flood)
Yellow Revolution Oil Seeds production

60
2.5.1 Green Revolution
The introduction of high-yielding varieties of seeds after 1965 and the
increased use of fertilizers and irrigation are known collectively as the Green
Revolution, which provided the increase in production needed to make India self-
sufficient in food grains, thus improving agriculture in India. Famine in India, once
accepted as inevitable, has not returned since the introduction of Green Revolution
crops.
Of the high-yielding seeds, wheat produced the best results. All India Radio (AIR)
played a vital role in creating awareness for these methods. Along with high yielding
seeds and irrigation facilities, the enthusiasm of farmers mobilized the idea of
agricultural revolution and is also credited to All India Radio.
The major benefits of the Green Revolution were experienced mainly in northern and
northwestern India between 1965 and the early 1980s; the program resulted in a
substantial increase in the production of food grains, mainly wheat and rice Food-grain
yields continued to increase throughout the 1980s, but the dramatic changes in the
years between 1965 and 1980 were not duplicated. By FY 1980, almost 75 percent of
the total cropped area under wheat was sown with high-yielding varieties. For rice the
comparable figure was 45 percent. In the 1980s, the area under high-yielding varieties
continued to increase, but the rate of growth overall was slower. The eighth plan
aimed at making high-yielding varieties available to the whole country and developing
more productive strains of other crops
The map no.2 shows the total food grain cultivation in India. From the map we see
that the foodgrains such as wheat and rice are majorly cultivated in Punjab, Haryana,
Himachal Pradesh, Uttaranchal, Jharkhand, Uttar Pradesh for wheat and Andhra
Pradesh, Tamilnadu, Karnatak and Kerala for rice. We see a crowded foodgrain
cultivation of Bajra, Jowar and Maize in the states of Maharashtra and Karnataka.

61
Figure no. 2.2
Agricultural Map of India (Food crops)
Source :-Indian Economy,Agriculture report 2007-2008

62
From the above map we see that rice is majorly cultivated on the western coastal line
completely, in some parts of Andhra Pradesh, Tamilnadu, Orissa, West Bengal and
North-Eastern states. Wheat is densely cultivated in the states of Punjab, Haryana,
Jharkhand and in some parts of Maharashtra, Madhya Pradesh and Gujarat. Millets
which constitute foodgrains such as Ragi, Jowar, Bajra is densely cultivated in the
states of Tamilnadu, Andhra Pradesh, Karnataka and in some parts of Rajasthan,
Gujarat and Himachal Pradesh.
The environmental impact of excessive use to chemical fertilizers and pesticides was
only revealed as years passed by. In 2009, under a Greenpeace Research Laboratories
investigation, Dr Reyes Tirado, from the University of Exeter, UK, conducted a study
in 50 villages in Muktsar, Bathinda and Ludhiana districts that revealed chemical,
radiation and biological toxicity was rampant in Punjab. 20% of the sampled wells
showed nitrate levels above the safety limit of 50 mg/l, established by WHO. The
study connected this finding with high use of synthetic nitrogen fertilizers. With
increasing poisoning of the soil, the region once hailed as the home to the Green
Revolution, now due to excessive use of chemical fertilizer, is being termed by one
columnist as the "Other Bhopal". For example, Buddha Nullah, a rivulet which run
through Malwa region of Punjab, India, and after passing through highly populated
Ludhiana district, before draining into Sutlej River, a tributary of the Indus river, is
today an important case point in the recent studies, which suggest this as another
Bhopal in making. A joint study by PGIMER and Punjab Pollution Control Board in
2008, revealed that in villages along the Nullah, calcium, magnesium, fluoride,
mercury, beta-endosulphan and heptachlor pesticide were more than permissible limit
(MPL) in ground and tap waters. Plus the water had high concentration of COD and
BOD (chemical and biochemical oxygen demand), ammonia, phosphate, chloride,
chromium, arsenic and chlorpyrifos pesticide. The ground water also contains nickel
and selenium, while the tap water has high concentration of lead, nickel and cadmium.
In addition to large inputs of fertilizers and pesticides, the Green Revolution in India
was made possible in large part by a dramatic increase in irrigation, particularly from
deep groundwater sources. The exploitation of groundwater resources allowed farmers

63
to double-crop (grow crops even during the dry season) and to grow water-intensive
crops such as rice in areas that were traditionally unsuited for rice production.
This growth in irrigation has led to an alarming drop in the water table in a number of
key agricultural Indian states, such as Punjab, where the water table is reportedly
falling by about 1 meter per year. In other states, the problem is worse; in Gujarat, the
water table is falling by as much as 3-5 meters per year.
What this means is that without a dramatic change in agricultural practice,
groundwater resources could be depleted within a few years. In the case of Gujarat and
other coastal areas, intrusion of seawater could render underground aquifers useless
for human consumption or agriculture.
2.5.2 White Revolution
White Revolution was a rural development programme started by India's National
Dairy Development Board (NDDB) in 1970. One of the largest of its kind, the
programme objective was to create a nationwide milk grid.
It resulted in making India the largest producer of milk and milk products, and hence
is also called the White Revolution of India. It also helped reduce malpractices by
milk traders and merchants. This revolution followed the Indian Green Revolution and
helped in alleviating poverty and famine levels from their dangerous proportions in
India during the era.
Operation Flood has helped dairy farmers, direct their own development, placing
control of the resources they create in their own hands. A 'National Milk Grid', links
milk producers throughout India with consumers in over 700 towns and cities,
reducing seasonal and regional price variations while ensuring that the producer gets a
major share of the price consumers pay.

64
The bedrock of Operation Flood has been village milk producers' cooperatives, which
procure milk and provide inputs and services, making modern management and
technology available to members. Operation Flood's objectives included :
• Increase milk production ("a flood of milk")
• Augment rural incomes
• Fair prices for consumers
• Based co-operation "Anand Milk Union Limited", often called Amul, was the
engine behind the success of the programme, and in turn became a mega company
based on the cooperative approach. Tribhuvandas Patel was the founder Chairman of
Amul, while Verghese Kurien was the chairman of NDDB at the time when the
programme was implemented. Verghese Kurien, who was then 33, gave the
professional management skills and necessary thrust to the cooperative, and is
considered the architect of India's 'White Revolution' (Operation Flood). His work has
been recognised by the award of a Padma Bhushan, the Ramon Magsaysay Award for
Community Leadership, the Carnegie-Wateler World Peace Prize, and the World Food
Prize.
• Operation Flood was implemented in three phases.
Phase I of White Revolution
• Phase I (1970–1980) was financed by the sale of skimmed milk powder and
butter oil donated by the European Union (then the European Economic Community)
through the World Food Programme. NDDB planned the programme and negotiated
the details of EEC assistance.
• During its first phase, Operation Flood linked 18 of India's premier milksheds
with consumers in India's major metropolitan cities: Delhi, Mumbai, Kolkata and
Chennai. Thus establishing mother dairies in four metros.
• Operation flood, also referred to as “White Revolution” is a gigantic project
propounded by Government of India for developing dairy industry in the country. The
Operation Flood – 1 originally meant to be completed in 1975, actually spanned the
period of about nine years from 1970–79, at a total cost of Rs.116 crores.

65
• At start of operation Flood-1 in 1970 certain set of aims were kept in view for
the implementation of the programmes. Improvement by milk marketing the organized
dairy sector in the metropolitan cities Mumbai(then Bombay), Kolkata(then Calcutta),
Chennai(then Madras), Delhi. The objectives of commanding share of milk market
and speed up development of dairy animals respectively hinter lands of rural areas
with a view to increase both production and procurement.
Phase II of White Revolution
• Operation Flood Phase II (1981–1985) increased the milksheds from 18 to 136;
290 urban markets expanded the outlets for milk. By the end of 1985, a self-sustaining
system of 43,000 village cooperatives with 4,250,000 milk producers were covered.
Domestic milk powder production increased from 22,000 tons in the pre-project year
to 140,000 tons by 1989, all of the increase coming from dairies set up under
Operation Flood. In this way EEC gifts and World Bank loan helped promote self-
reliance. Direct marketing of milk by producers' cooperatives increased by several
million litres a day.
Phase III of White Revolution
• Phase III (1985–1996) enabled dairy cooperatives to expand and strengthen the
infrastructure required to procure and market increasing volumes of milk. Veterinary
first-aid health care services, feed and artificial insemination services for cooperative
members were extended, along with intensified member education.
• Operation Flood's Phase III consolidated India's dairy cooperative movement,
adding 30,000 new dairy cooperatives to the 42,000 existing societies organized
during Phase II. Milksheds peaked to 173 in 1988-89 with the numbers of women
members and Women's Dairy Cooperative Societies increasing significantly.
• Phase III gave increased emphasis to research and development in animal
health and animal nutrition. Innovations like vaccine for Theileriosis, bypassing
protein feed and urea-molasses mineral blocks, all contributed to the enhanced
productivity of milch animals.

66
2.5.3 Blue Revolution
The fisheries-based blue revolution can become real and sustainable if the
production potential of available water resources can be efficiently managed. But there
are several areas of concern that need to be addressed to realize this goal. The marine
fish production, which at one stage constituted the bulk of the total fish output, is
showing practically no growth for nearly a decade. Much of the growth in the fisheries
sector is coming chiefly from the inland fisheries, which is also beset with some
formidable problems, including the environmental degradation of inland waters and
the paucity of fish seed. Indeed, at present, hardly 40 per cent of the country’s fresh
water resources are being used for fisheries. The output of the inland fisheries sector
could, therefore, be stepped up by two-and-half times just by utilizing all the available
water bodies. Similarly, most of the fisheries potential of deep sea waters is going
abegging for want of suitable fishing vessels and curbs on joint ventures for deep sea
fishing. The fish stocks of these waters are being either clandestinely harvested by
ships belonging to countries or are remaining unexploited. On the other hand, the
coastal waters, predominantly drawn upon by the traditional fishing communities, are
being over-exploited, leading to the fast depletion of fisheries resources of this zone.
This is also reflected in gradual shrinking of fish catches in the coastal waters. Even
shrimps-based aquaculture, which has till recently been witnessing a fast, largely
exports-driven, growth, has now begun flagging due to the imposition of various kinds
of non-tariff trade barriers by the importing countries. Besides, the vulnerability of
shrimps to diseases is causing problems for the shrimp industry.
Equally worrisome is the poor post-harvest handling of fish, which is resulting
in huge wastage of this nutritious food. While these losses are reckoned at a huge 25
per cent in the marine sector, these are around 8 per cent in inland fisheries. The total
value of the losses is assessed at a colossal Rs 1,000 crore annually.
67
2.5.4 Brown Revolution
Brown revolution means turn garbage which is brown into gold and fertilizer which is
totally organic or bio or worm compost.
A `Brown Revolution' is happening in the tribal areas of Visakhapatnam district. The
tribal people are taught and encouraged to grow "socially responsible and environment
friendly" coffee to cater to the demand from developed countries.
The Coffee Board has embarked upon the challenging campaign of promoting the
coffee grown in these remote areas as niche coffee for markets in the West. Niche
coffee, determined by consistent quality and the socio-economic well-being of the
local people, is a $55-billion market world-wide.
Although the tribal people of Visakhapatnam district have been growing coffee since
the 1970s, it is only recently, particularly after eyeing the organic market, that it is
being given a thrust. Some 30,000 tribal people of Andhra Pradesh, who once
practised slash-and-burn `Podu' (shifting) cultivation, are now growing coffee as a
shade crop under the canopy of silver oak.
What the tribal people of Visakhapatnam are cultivating may be a minuscule part of
India's annual coffee production of around three lakh tonnes. But, according to the
Coffee Board, what is significant is that apart from regenerating the forest cover in
those parts of the Eastern Ghats where it is cultivated, coffee has helped at the micro
level by boosting the income of the tribal people. Their per hectare income from
coffee is estimated at Rs.15,000 compared to Rs.10,000 for pineapple, Rs.1,500 for
niger seeds and Rs.1,000 for maize.
The Coffee Board cites the instance of 50-year-old Linganna Padal who owns a
demonstration coffee plot, which has generated enough income for him to own a
house and educate his children. His success is now sought to be replicated throughout
the Integrated Tribal Development Agency areas of the district.

68
However, it is not just a case of the good intentions of the Coffee Board and the ITDA
of Paderu to help the tribal people. Some argue that there could even be a sound
marketing base to all this. World over, there is a burgeoning demand for organic
coffee. In those areas of Karnataka, Tamil Nadu and Kerala where over 90 per cent of
India's coffee is grown, any shift to organic coffee cultivation would necessitate a
break in cultivation as the soil has to be left fallow for a few years to wash out traces
of chemicals. But the tribal areas of Visakhapatnam can cultivate organic coffee as no
chemical fertilizers or pesticides are used, as much owing to financial constraints as
the lack of exposure to modern methods of cultivation.
Trying to turn this into an advantage, the Coffee Board and the ITDA launched the
programme to grow coffee in the Araku Valley. Coffee Board officials, however, say
that it seems far-fetched for Araku Valley coffee to sell in London or New York. But
the process is moving in that direction. The Coffee Board has even created a logo for
the "Araku Valley Coffee" brand.
According to the Coffee Board, the quality of Araku Valley coffee will be improved
through systematic development of on- and off-farm processing facilities. Self-help
groups of tribal farmers are to be strengthened to facilitate pooling of coffee so as to
offer consistent and larger quantities. A physical platform for auctioning is expected to
give a fillip to marketing and the prospects of exporting coffee to Japanese, Australian
and American markets through Visakhapatnam port are to be pursued. Araku coffee is
turning out to be a potent brew indeed.

69
2.5.5 Yellow Revolution
Yellow revolution means the cultivation of mustard as a part of crop rotation. It
prevents the soil from getting eroded and at the same time gives a rich crop of oil
seeds. The use of mustards is to build soil organic matter and to eliminate the need for
chemical soil fumigants. The yellow revolution man of Vaishali is Bindeshwar Prasad
Singh (67), a farmer owning just 2.5 acre of land but still making gold. No matter he
was not chosen for last year's Kisan Samman by Bihar government, the Indian
Vegetable Research Institute at Varanasi gave him silver medal The growth,
development and adoption of new varieties of oilseeds and complementary
technologies nearly doubled oilseeds production from 12.6 mt in 1987-88 to 24.4 mt
in 1996-97, catalyzed by the Technology Mission on Oilseeds, brought about the
Yellow Revolution.
70
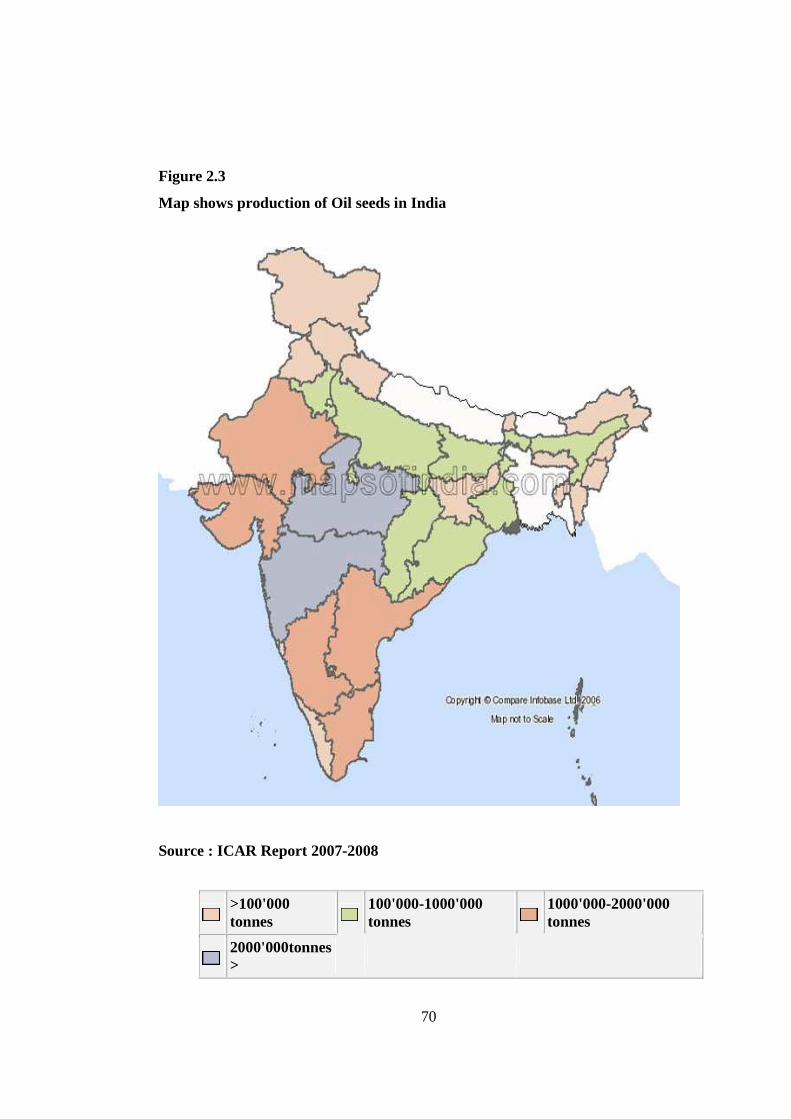
Figure 2.3
Map shows production of Oil seeds in India
Source : ICAR Report 2007-2008
>100'000 tonnes
100'000-1000'000 tonnes
1000'000-2000'000 tonnes
2000'000tonnes >
71
The map no.3 shows the amount of production of Oilseeds in India. From the map it is
clear that the states of Himachal Pradesh, Jammu & Kashmir, Uttarkhand, Haryana,
North-Eastern states, Jharkhand and Kerala have a production of less than 1 lakh
tones. The states of Uttar Pradesh, Bihar, Chattisgarh, Orissa and West Bengal
produce oilseeds upto 10 lakh tones, while the states of Rajasthan, Gujarat,
Karnataka, Andhra Pradesh and Tamilnadu have production of oilseeds in the range of
10 lakh to 20 lakh tones. The highest oilseed production of above 20 lakh tonnes is
seen in the states of Maharashtra and Madhya Pradesh.
The growth, development and adoption of new varieties of oilseeds and
complementary technologies nearly doubled oilseeds production from 12.6 mt in
1987-88 to 24.4 mt in 1996-97, catalyzed by the Technology Mission on Oilseeds,
brought about the Yellow Revolution. The term also stands for the People Power
Revolution in Phillipines in 1986 against then President Ferdinand Marcos. It was a
series non-violent protests where demonstrators used yellow ribbons during the arrival
of Ninoy Aquino. Around this time of the year, bright yellow flowers carpet the fields
in scores of villages in Bihar's Vaishali district. They are not mustard crops waiting to
burst into full bloom but cauliflower seeds that have ushered in a revolution of sorts —
locals term it ‘Yellow Revolution’ — in the region. These seeds — which fetch high
prices as they are completely organic — are sold across Bihar, Rajasthan, Madhya
Pradesh and Maharashtra under an exclusive brand called Vaishali under various
names like satya beej, green seeds and jawahar seeds. While over three dozen villages
under Hajipur, Mahnar and Lalganj blocks in Vaishali cultivate cauliflower seeds
along with other crops, the entire Chakbara village near Hajipur is devoted to
cauliflower seed cultivation. The cumulative earning of around 50 farmers from the
sale of seeds last year was about Rs 50 lakh.

72
2.5.6 Results of Rainbow Revolution
After effective implementation of Green Revolution, White Revolution, Blue
Revolution, Yellow Revolution and a combined concept of Rainbow Revolution has
certain programmes such as
1. To increase the annual growth rate in agriculture over 4%
2. To give greater private sector participation through contract farming
3. To enable price protection for farmers
4. To launch National Agriculture Insurance Scheme for all farmers and for all
crops
5. To dismantle the restrictions on movement of agricultural commodities
throughout the country
The new agriculture policy which was presented in 2000 aimed to achieve the above
said objectives through Rainbow Revolution. Today, India ranks second worldwide in
farm output. Agriculture and allied sectors like forestry and logging accounted for
16.6% of the GDP in 2007, employed 52% of the total workforce[1] and despite a
steady decline of its share in the GDP, is still the largest economic sector and plays a
significant role in the overall socio-economic development of India.
Today India is the largest producer in the world of fresh fruit, anise, fennel, badian,
coriander, tropical fresh fruit, jute, pigeon peas, pulses, spices, millets, castor oil seed,
sesame seeds, safflower seeds, lemons, limes, cow's milk, dry chillies and peppers,
chick peas, cashew nuts, okra, ginger, turmeric guavas, mangoes, goat milk and
buffalo milk and meat. Coffee.It also has the world's largest cattle population (281
million). It is the second largest producer of cashews, cabbages, cotton seed and lint,
fresh vegetables, garlic, egg plant, goat meat, silk, nutmeg. mace, cardamom, onions,
wheat, rice, sugarcane, lentil, dry beans, groundnut, tea, green peas, cauliflowers,
potatoes, pumpkins, squashes, gourds and inland fish. It is the third largest producer of
tobacco, sorghum, rapeseed, coconuts, hen's eggs and tomatoes. India accounts for
10% of the world fruit production with first rank in the production of mangoes,

73
papaya, banana and sapota. India's population is growing faster than its ability to
produce rice and wheat.
2.6 Scenario of Agriculture in 2008-09
The performance of the agricultural sector influences the growth of the Indian
economy. Agriculture (including allied activities) accounted for 17.8 per cent of the
Gross Domestic Product (GDP-at constant prices) in 2007-08 as compared to 21.7 per
cent in 2003-04. Notwithstanding the fact that the share of this sector in GDP has been
declining over the years, its role remains critical as it accounts for about 52 per cent of
the employment in the country. Apart from being the provider of food and fodder, its
importance also stems from the raw materials that it provides to industry. The
prosperity of the rural economy is also closely linked to agriculture and allied
activities. Agricultural sector contributed 12.2 per cent of national exports in 2007-08.
The rural sector (including agriculture) is being increasingly seen as a potential source
of domestic demand; a recognition, that is shaping the marketing strategies of
entrepreneurs wishing to widen the demand for goods and services.
In terms of composition, out of the total share of 17.8 per cent in GDP in
2007-08 for the agriculture and allied activities sector, agriculture alone accounted for
16.3 per cent of GDP followed by fishing at 0.8 per cent and forestry and logging at
0.7 per cent of GDP (Table 2.3).
74
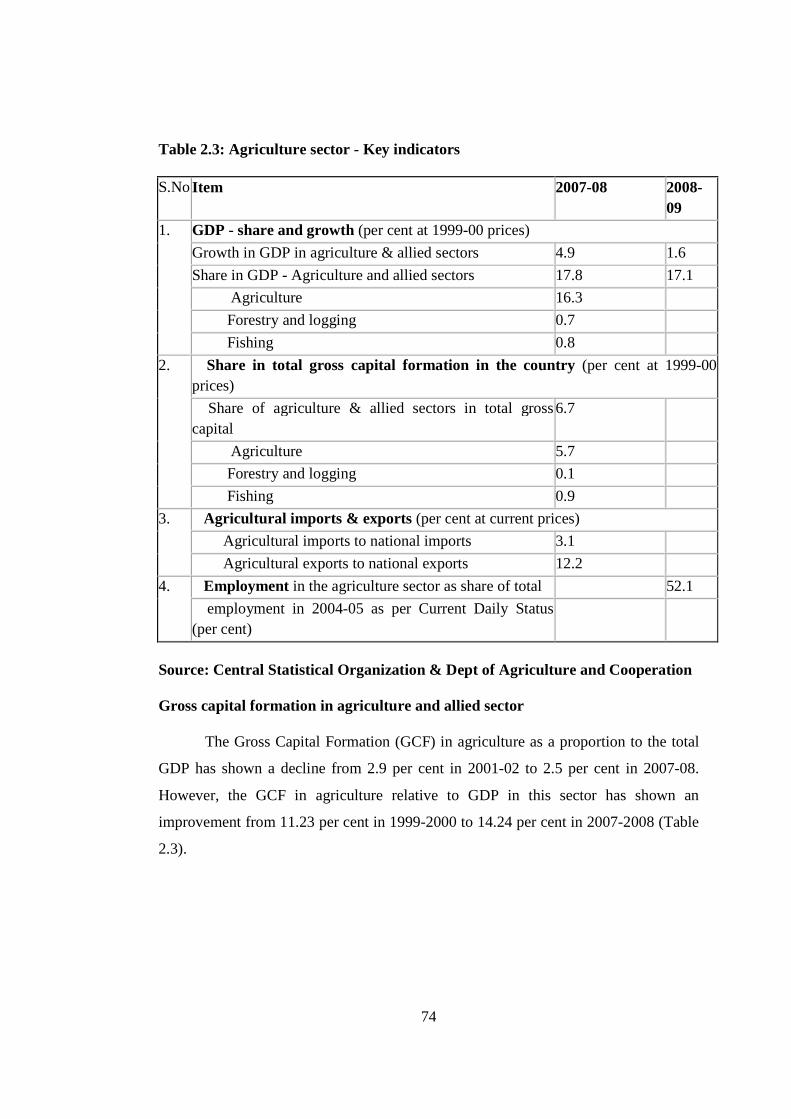
Table 2.3: Agriculture sector - Key indicators
S.NoItem 2007-08 2008-09
1. GDP - share and growth (per cent at 1999-00 prices)
Growth in GDP in agriculture & allied sectors 4.9 1.6
Share in GDP - Agriculture and allied sectors 17.8 17.1
Agriculture 16.3
Forestry and logging 0.7
Fishing 0.8
2. Share in total gross capital formation in the country (per cent at 1999-00prices)
Share of agriculture & allied sectors in total gross capital
6.7
Agriculture 5.7
Forestry and logging 0.1
Fishing 0.9
3. Agricultural imports & exports (per cent at current prices)
Agricultural imports to national imports 3.1
Agricultural exports to national exports 12.2
4. Employment in the agriculture sector as share of total 52.1
employment in 2004-05 as per Current Daily Status (per cent)
Source: Central Statistical Organization & Dept of Agriculture and Cooperation
Gross capital formation in agriculture and allied sector
The Gross Capital Formation (GCF) in agriculture as a proportion to the total
GDP has shown a decline from 2.9 per cent in 2001-02 to 2.5 per cent in 2007-08.
However, the GCF in agriculture relative to GDP in this sector has shown an
improvement from 11.23 per cent in 1999-2000 to 14.24 per cent in 2007-2008 (Table
2.3).

75
Table 2.4: Gross capital formation in agriculture (Figures in Rs. crore at 1999-
2000 prices)
Year GDP Agriculture & allied activities
GCF/GDP in
Agriculture & allied (%)
GCF in agriculture as % of total GDP
GCF GDP
2004-05 2388768 57849 482446 12.0 2.4
2005-06 2616101 66065 511013 12.9 2.5
2006-07 2871120 73285 531315 13.8 2.6
2007-08 3129717 79328 557122 14.2 2.5
Source: Central Statistical Organization & Dept of Agriculture and Cooperation
The share of agriculture & allied sector in total GCF after showing a marginal increase during 1999-2000 to 2001-02 has been continuously declining. It stood at 10.2 per cent in 1999-2000, increased to 11.7 per cent in 2001-02 and thereafter declined to 7 per cent in 2006-07. The decline was mainly attributed to decline in the private sector despite increase in the share of public sector (Table 2.4).
Table 2.5: Share of agriculture & allied sector in total GCF (%) (at 1999-2000
prices)
Year Public sector Private sector Total
1999-2000 6.0 11.9 10.2
2000-01 5.8 11.3 9.7
2001-02 6.7 13.7 11.7
2002-03 6.5 11.5 10.3
2003-04 7.4 9.2 8.8
2004-05 7.8 7.7 7.7
2005-06 7.9 7.1 7.2
2006-07 8.2 6.6 7.0
Source: Agricultural Statistics at a Glance 2008, Directorate of Economics & Statistics

76
Apart from production, the demand and distributional aspects of the agricultural
sector, especially of food availability and food management, are of importance to the
economy. The production performance of different segments of agriculture and allied
activities covering, inter alia, horticulture, animal husbandry and fisheries as also the
developments in the area of food management during the year 2008-09 is shown in the
above tables
2.7 Indian Agri Export Scenario
Export of agricultural produces has taken a large leap after 1990-91, when
Indian government went for economic reforms in all sectors. After the beginning of
WTO and globalization of markets the Indian Agricultural Produces specially fruits,
vegetables, spices and cash crops like cotton, jute, tea, coffee and rubber have
exceeded the expectations and proved to be a great economical support for the
country.
2.7.1 Exports of fruits since 1990
India is the second largest producer of Fruits after China, with a production of
44.04 million tonnes of fruits from an area of 3.72 million hectares (Table 2.6). A
large variety of fruits are grown in India, of which mango, banana, citrus, guava,
grape, pineapple and apple are the major ones. Apart from these, fruits like papaya,
sapota, annona, phalsa, jackfruit, ber, pomegranate in tropical and sub-tropical group
and peach, pear, almond, walnut, apricot and strawberry in the temperate group are
also grown in a sizeable area. Although fruit is grown throughout of the country, the
major fruit growing states are Maharashtra, Tamil Nadu, Karnataka, Andhra Pradesh,
Bihar, Uttar Pradesh and Gujarat. It is seen that mango fruit is highly cultivated with
large area of land cultivated under it. After mango, banana and citrus fruits are
cultivated largely. Grapes are cultivated mainly in the district of Nasik of Maharashtra
state. Area under grape cultivation is comparatively less as seen from the table. 2.6

77
Table 2.6
AREA, PRODUCTION AND EXPORT OF FRUITS IN INDIA AFTE R 1990
S.No Fruits Area (000
ha.)
Production (000
MT)
Exports (in million tones)
1 Apple 238.3 1047.4 375
2 Banana 490.7 16813.5 436
3 Citrus 526.9 4650.6 865
4 Grapes 44.3 1137.8 646
5 Guava 150.9 1710.5 230
6 Litchi 56.4 433.2 185
7 Mango 1486.9 10503.5 2634
8 Papaya 60.5 1666.2 346
9 Pineapple 75.5 1025.4 292
10 Sapota 64.4 800.3 76.3
11 Others 601.2 5707.6 932
Total 3796.8 45496.0 7017.3
Source: Directorate General of Commercial Intelligence and Statistics, Kolkatta
The graph 2.1 shows the area, production of fruits from 1990 to 2000. From
the graph we see that the area under cultivation of fruits has shown a constant area
ranging between 2.5 million hectares to 3.5 million hectares. But by 2008-09 the area
under fruit cultivation has increased slightly to 4.2 million hectares. Whereas the
production of fruits has shown a steady growth from 28.63 million tonnes in 1992-93
to 45.50 million tonnes in 1999-2000. As per the agricultural report the growth in the
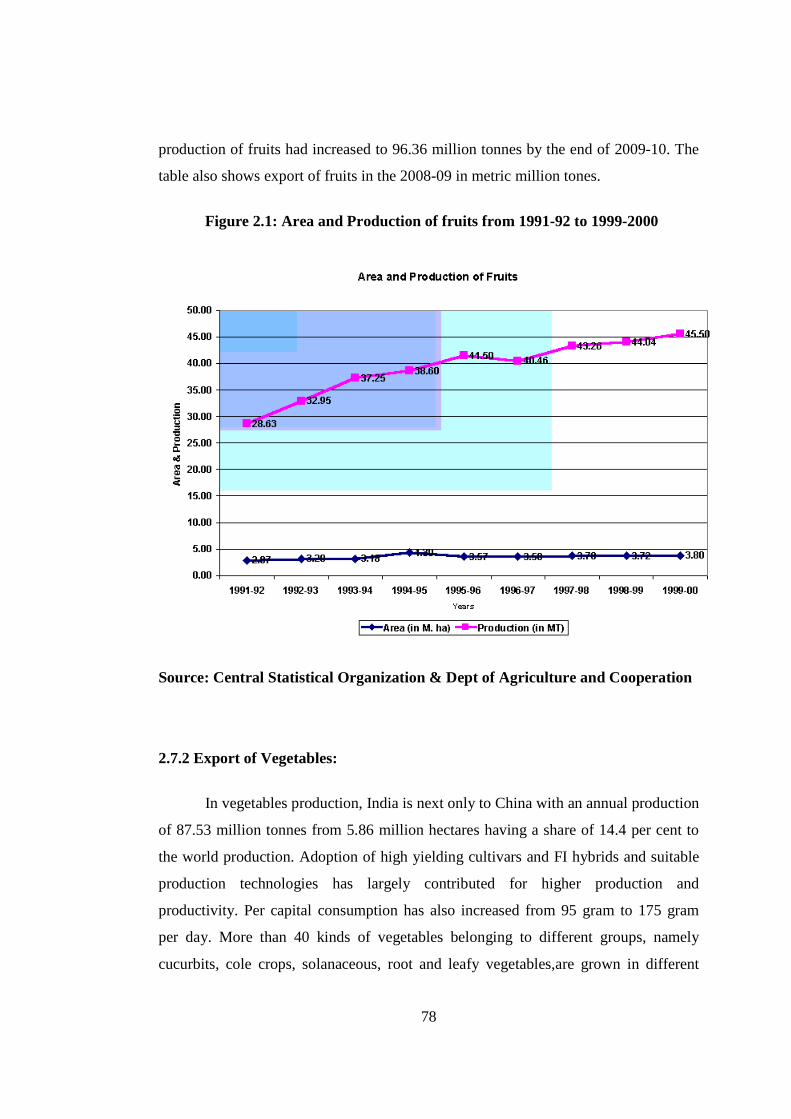
78
production of fruits had increased to 96.36 million tonnes by the end of 2009-10. The
table also shows export of fruits in the 2008-09 in metric million tones.
Figure 2.1: Area and Production of fruits from 1991-92 to 1999-2000
Source: Central Statistical Organization & Dept of Agriculture and Cooperation
2.7.2 Export of Vegetables:
In vegetables production, India is next only to China with an annual production
of 87.53 million tonnes from 5.86 million hectares having a share of 14.4 per cent to
the world production. Adoption of high yielding cultivars and FI hybrids and suitable
production technologies has largely contributed for higher production and
productivity. Per capital consumption has also increased from 95 gram to 175 gram
per day. More than 40 kinds of vegetables belonging to different groups, namely
cucurbits, cole crops, solanaceous, root and leafy vegetables,are grown in different

79
agro-climatic situations of the country. Except a few, namely brinjal (egg plant),
colocasia, cucumber, ridge gourd, sponge gourd, pointed gourd etc., most of the other
vegetables have been introduced from abroad.
Potato is most widely grown vegetable crop in the country with a share of 25.7 per
cent. The area under potato cultivation is 1.28 Million ha with total production of
22.49 MT. The main varieties of potato grown in the country are Kufri Chandramukhi,
Kufri Jyoti, Kufri Badshah, Kufri Himalani, Kufri Sindhuri, Kufri Lalima etc. Uttar
Pradesh is the leading potato growing state in the country with a production of 9.53
million tonnes followed by West Bengal and Bihar. Tomato occupies second position
amongst the vegetable crops in terms of production. The total production of tomato in
the country in 1998-99 was 8.27 MT from an area of 0.46 M. ha. The main varieties of
tomato grown in the country are Pusa Ruby, Pusa Early Dwarf, Arka Abha, Arka
Alok, Pant Bahar, Pusa hybrid-1, Pusa hybrid-2, MTH-6, Arka Vardan etc. Andhra
Pradesh is the largest grower of tomato with a production of 2.05 MT. The other main
tomato growing states are Bihar, Karnataka, Maharashtra and Orissa. Brinjal occupies
the third position amongst vegetable crops. The production of brinjal in the year 1998-
99 was 7.88 MT from an area 0.49 M.ha. The varieties of brinjal popular in the
country are Arka Navneet, Pusa Ankur, Hybrid-6, Pusa hybrid-5, ARBH-1, ABH-1,
Pusa Purple Long, Pusa Purple Cluster, Ritu Raj etc. West Bengal is the largest
producer of brinjal followed by Maharashtra and Bihar. The other main state growing
brinjal Karnataka, Maharashtra, Gujarat, Andhra Pradesh, Assam and Madhya
Pradesh. Cabbage is the fourth most widely grown vegetable crop of our country.
India is the leading country producing Cabbage. The area under Cabbage cultivation is
0.23 M.ha producing 5.62 MT. The main varieties of cabbage are Pusa Drum Head,
Golden Acre, Pride of India, Pusa Mukta, Pusa Synthetic etc. West Bengal produces
1.84 MT and is the largest grower of the cabbage. Orissa and Bihar occupies second
and third position respectively. The other major growers of cabbage are Assam,
Karnataka, Maharashtra and Gujarat. The other important vegetable crops grown in
the country are onion, chillies, peas, beans, okra, cabbage, cauliflower, pumpkin,
bottlegourd, cucumber, watermelon, palak, methi, carrot and radish.

80
India, known as “Land of Spices”, is the largest producer, consumer and
exporter of variety of spices in the world. The area covered under various spices in
the country is estimated to be 25.17 lakhs ha with an annual production of 29.10 lakhs
tonnes (Fig-8). More than 90% of the spices produced in the country is used for
domestic consumption and the rest exported as raw as well as value added products.
The important spices produced in the country are: Black pepper, ginger, turmeric,
garlic, chillies, coriander, cumin, fennel, fenugreek, celery, clove, cassia, nutmeg,
mace, cardamom, saffron, vanilla and a group of herbal spices. Chillies occupies the
top position amongst spices with a share of 30 per cent. Total production of Chillies in
the year 1998-99 was The share of spices in the total agricultural export during 1998-
99 was about 6% with an export of 2.31 lakh tonnes earning foreign exchange worth
Rs. 1758 crores. The exports of spices and spice products during 1999-2000 was 2.09
lakh tonnes valuing Rs. 1861 crores. Pepper was the leader in export earning with
46% share followed by Oil & Oleoresins (15%), chillies (13%) and turmeric (6%).
2.8 Initiatives to Improve Agriculture sector
The required level of investment for the development of marketing, storage and cold
storage infrastructure is estimated to be huge. The government has not been able to
implement various schemes to raise investment in marketing infrastructure. Among
these schemes are Construction of Rural Go downs, Market Research and Information
Network, and Development / Strengthening of Agricultural Marketing Infrastructure,
Grading and Standardization.
The Indian Agricultural Research Institute (IARI), established in 1905, was
responsible for the research leading to the "Indian Green Revolution" of the 1970s.
The Indian Council of Agricultural Research (ICAR) is the apex body in agriculture
and related allied fields, including research and education. The Union Minister of
Agriculture is the President of the ICAR. The Indian Agricultural Statistics Research
Institute develops new techniques for the design of agricultural experiments, analyses
data in agriculture, and specializes in statistical techniques for animal and plant
breeding.
81
Recently Government of India has set up Farmers Commission to completely evaluate
the agriculture program. However the recommendations have had a mixed reception.
2.8.1 Problems
There are many problems in Indian agriculture for example cotton flower in India.
This is the main cash crop in Vidarbha region. Slow agricultural growth is a concern
for policymakers as some two-thirds of India’s people depend on rural employment
for a living. Current agricultural practices are neither economically nor
environmentally sustainable and India's yields for many agricultural commodities are
low. Poorly maintained irrigation systems and almost universal lack of good extension
services are among the factors responsible. Farmers' access to markets is hampered by
poor roads, rudimentary market infrastructure, and excessive regulation.
According to World Bank Report ‘India countryOverview 2007-08’ The low
productivity in India is a result of the following factors:
• According to World Bank, Indian Branch: Priorities for Agriculture and Rural
Development", India's large agricultural subsidies are hampering productivity-
enhancing investment. Overregulation of agriculture has increased costs, price risks
and uncertainty. Government intervenes in labour, land, and credit markets. India has
inadequate infrastructure and services. World Bank also says that the allocation of
water is inefficient, unsustainable and inequitable. The irrigation infrastructure is
deteriorating. The overuse of water is currently being covered by over pumping
aquifers, but as these are falling by foot of groundwater each year, this is a limited
resource.
• Illiteracy, general socio-economic backwardness, slow progress in
implementing land reforms and inadequate or inefficient finance and marketing
services for farm produce.
• Inconsistent government policy. Agricultural subsidies and taxes often changed
without notice for short term political ends.
• The average size of land holdings is very small (less than 20,000 m²) and is
subject to fragmentation due to land ceiling acts, and in some cases, family disputes.
82
Such small holdings are often over-manned, resulting in disguised unemployment and
low productivity of labour.
• Adoption of modern agricultural practices and use of technology is inadequate,
hampered by ignorance of such practices, high costs and impracticality in the case of
small land holdings.
• Irrigation facilities are inadequate, as revealed by the fact that only 52.6% of
the land was irrigated in 2003–04, which result in farmers still being dependent on
rainfall, specifically the Monsoon season. A good monsoon results in a robust growth
for the economy as a whole, while a poor monsoon leads to a sluggish growth. Farm
credit is regulated by NABARD, which is the statutory apex agent for rural
development in the subcontinent. At the same time over pumping made possible by
subsidized electric power is leading to an alarming drop in aquifer levels.
2.8.2 India needs to improve food product standards
India needs to improve the standards of its food products to acquire a competitive edge
in the global market, says Sanjay Dave[1], the first Indian vice-chair of the Rome-based
Codex Alimentarius Commission (CAC), an international organization that aims at
promoting food safety globally. Dave, also the director of India’s Agricultural and
Processed Food Products Export Development Authority (APEDA), feels that his
tenure as CAC vice-chair would see continuous deliberations to meet emerging
challenges at home and abroad.
“There is no scope for any complacency when it comes to dealing with the issue of
food product standards. International and domestic consumers are quite quality
conscious. India and other developing nations need to improve standards of food
products,” Dave told IANS in an interview.
India’s farm and processed food products’ exports have grown from Rs.6.47 billion in
1999-2000 to Rs.24.12 billion in 2006-07.

83
Major importers of Indian products like pomegranates, mangoes, onions and basmati
rice are the United Arab Emirates, Saudi Arabia, Russia, Bangladesh, Turkey, Kuwait,
Sri Lanka, Italy, Germany, Australia, Jordan, Bahrain, and Malaysia.
As capacity building is the key to ensuring food standards, the CAC intends to provide
technical assistance to the developing nations so that the quality aspect is addressed
right from the field. “From proper monitoring of pesticide residue to the processing
units, there is a need to be vigilant at all levels so that the end product is healthy and
well received by consumers,” Dave maintained.
Dave said he would act aggressively to implement Codex Plan-2008-13, a vision
document that speaks of consensus building and understanding food safety needs. “For
me, the vice-chair of CAC does not mean just holding a few meetings. I am committed
to holding meeting and deliberating with all stakeholders throughout the year,” he
said. The Food and Agriculture Organisation (FAO) and the World Health
Organisation (WHO) created the Codex Alimentarius (Latin for food law or code) in
1963. The CAC aims at developing food standards, guidelines and related texts such
as codes of practice under the food standards programme of FAO and WHO, two
bodies under the aegis of the United Nations. His new position, however, does not
mean that he will have less time for APEDA, the organization he has headed for long.
Reference 1: Article by Rajeev Ranjan Roy July 12th, 2008 ICT by IANS

84
“APEDA stands to benefit a lot from CAC and vice versa. Our great work at APEDA
in managing quality of processed foods and agricultural products played a decisive
role in my election,” he said. APEDA is an autonomous body under India’s ministry
of commerce and industry dealing with quality management of agricultural and
processed foods, and promoting their export.
2.9 CONCLUSIONS
Indian agriculture forms the back bone of Indian economy and despite concerted
industrialization in the last six decades, agriculture occupies a place of pride. Being
the largest industry in the country it provides employments to around 65% of the total
workforce in the country. But in the recent year, its share in the GDP has declined to
18% in 2008-09. There is lot of scope for improvement in this sector. Summarizing
the important points we can conclude that
1. Indian agriculture needs shift itself from traditional approach to scientific
approach.
2. Indian agriculture should focus on market oriented produces rather than self
sufficiency of food grains.
3. Indian agriculture needs to adapt technological and research oriented
environment instead of struggling in traditional and superstitious environment.
4. Indian government should provide modern technology access to the rural
farmers along with knowledge of markets and export potential.
5. Indian agriculture should aim to be free from trades and middle men dominant
market and establish market access directly to farmers.
6. Indian agriculture shows a lot of potential because it has the largest diversity in
physiography and climate and has highest amount of resources such as man power.
7. Indian agriculture should utilize these resources and develop the agriculture
sector into one of the fastest growing, largest contributing sector of our economy.
================