CHAPTER FOUR - mospi.nic.inmospi.nic.in/sites/default/files/reports_and_publication/cso... ·...
61
CHAPTER FOUR CHAPTER FOUR ATMOSPHERE ATMOSPHERE
Transcript of CHAPTER FOUR - mospi.nic.inmospi.nic.in/sites/default/files/reports_and_publication/cso... ·...

CHAPTER FOURCHAPTER FOUR
ATMOSPHEREATMOSPHERE

83
CHAPTER FOUR
ATMOSPHERE Atmospheric Pollution – Main Sources 4.1 The atmosphere consists of a mixture of gases that completely surround the earth. It extends to an altitude of 800 to 1000 kms above the earth’s surface, but is deeper at the equator and shallow at the poles. About 99.9% of the mass occurs below 50 Km and 0.0997% between 50 and 100 km altitude. Major polluting gases/ particles are confined to the lowermost layer of atmosphere known as Troposphere that extends between 8 and 16 Kms above the earth surface. 4.2 The main sources of atmospheric pollution may be summarized as follows: a) The combustion of fuels to produce energy for
heating and power generation both in the domestic sector as well as in the industrial sector.
b) The exhaust emissions from the transport vehicles that use petrol, diesel oil, etc.
c) Waste gases, dust and heat from many industrial sites including chemical manufacturers, electrical power generating stations, etc.
Environment Pollution due to Energy Use 4.3 A considerable amount of air pollution results from burning of fossil fuels. Fuels are primarily derived from fossilized plant material and consist mainly of carbon and/or its compounds. The household sector is the largest consumer of energy in India. More than 60 percent of Indian households depend on traditional sources of energy like fuel wood, dung and crop residue for meeting their cooking and heating needs. Out of total rural energy consumption about 65 per cent is met from fuel wood. Fuel wood consumption during 2001-02 is estimated at 223 million tones, 180 millions tones of which is for household consumption and the balance for cottage industry, big hotels etc. Burning of traditional fuels introduces large quantities of CO2 when the combustion is complete, but if there is incomplete combustion and oxidation then Carbon monoxide (CO) is produced, in addition to hydrocarbons. Incomplete combustion of coal produces smoke consisting of particles of soot or carbon, tarry droplets of unburnt hydrocarbons and CO. Fossil fuels also contain 0.5–4.0% of sulphur which is oxidized to SO2 during combustion.
4.4 The environmental effects of various fuels, namely, coal, oil, nuclear etc. are of growing concern owing to increasing consumption levels. The combustion of these fuels in industries and vehicles has been a major source of pollution. Coal production through opencast mining, its supply to and consumption in power stations, and industrial boilers leads to particulate and gaseous pollution which can cause pneumoconiosis, bronchitis, and respiratory diseases. Another major impact of coal mining is land degradation, especially of forest areas. 4.5 The consumption of petroleum products in vehicles, industries and domestic cooking activities results in the emission of pollutants in large quantities. Radioactive emissions from nuclear power plants are of grave concern as they can cause serious impact both in terms of spatial and inter-generational concerns. In addition, two key problems are long-term waste disposal and the eventual decommissioning of plants. Due to limited reserves of petroleum, main emphasis needs to be given to non-conventional energy sources such as wind energy, solar energy and ocean energy. Industrial Emissions 4.6 Air borne emissions emitted from various industries are a cause of major concern. These emissions are of two forms, viz. solid particles (SPM) and gaseous emissions (SO2, NOx, CO, etc.). Liquid effluents, generated from certain industries, containing organic and toxic pollutants are also a cause of concern. Heavily polluting industries were identified which are included under the 17 categories of highly polluting industries for the purpose of monitoring and regulating pollution from them. The Ministry of Environment and Forests has, developed standards for regulating emissions from various industries and emission standards for all the polluting industries including thermal power stations, iron and steel plants, cement plants, fertilizer plants, oil refineries, pulp and paper, petrochemicals, sugar, distilleries and tanneries have been prescribed. The industrial units in India are largely located in the States of Gujarat, Maharashtra, Uttar Pradesh, Bihar, West Bengal and Madhya Pradesh. The highest concentration of sulpher dioxide and oxides of nitrogen is, therefore, often found in cities located in these states. Some other industrial estates in Delhi, Punjab, Rajasthan and Andhra Pradesh are also becoming critical.

84
Road Transport 4.7 Road vehicles are the second major source of pollution. They emit CO, HCs, NOX, SO2, and other toxic substances such as TSP and lead. Diesel engines are much less polluting than petrol engines. Both types of engines are not very efficient converters of fuel energy. However, diesel types with a conversion efficiency of around 30% must be more efficient and use less fuel than petrol types with a 15-20% conversion efficiency. Both types of engines have incomplete combustion of fuel, so the major pollutant is CO, amounting to 91% by weight of all vehicle emissions.The primary pollutants produced in vehicle emissions undergo a series of complex interrelated chemical reactions in the troposphere and lower stratosphere to form secondary products. 4.8 Four factors make pollution from the vehicles more serious in developing countries.
(i) Poor quality of vehicles creating more particulates and burning fuels inefficiently. (ii) Lower quality of fuel being used leads to far greater quantities of pollutants. (iii) Concentration of motor vehicles in a few large cities. (iv) Exposure of a larger percentage of population that lives and moves in the open.
Harmful Effects of Emissions 4.9 The high concentration of particulates in the atmosphere over large urban and industrial areas can produce a number of general effects. Smoke and fumes can increase the atmospheric turbidity and reduce the amount of solar radiation reaching the ground. The overall effect of air pollution upon the biosphere and the built environment can be broadly considered under 3 headings: The effect upon-
(i) buildings and materials, (ii) soil, vegetation, crops and animal
life, (iii) human beings.
i) Buildings and Materials: The fabric of
buildings that are surrounded by heavily polluted air for years undergo chemical changes. Gradual erosion takes place and this is only too evident when grimy upper surface is removed. A good example is that of the famous historical monument ‘Taj Mahal’ at Agra, which, on account of reaction of Sulphur-di-oxide, emitted from neighbouring industries, with the limestone has slowly, started turning yellow. As a result, on
Court’s directives, a number of measures have been taken to protect our national heritage monument, e.g. closure of neighbouring heavy polluting industries, operation of only non-polluting vehicles like battery buses, tonga, in the vicinity of Taj Mahal.
ii) Soil, vegetation and Animal Life: The presence of gaseous pollutants in the air and deposition of particulates on to the soil can effect plants. It can effect the cattle and animals too as they have been found to develop breathing difficulties and suffer from low yield of milk, lameness and joint stiffness in a polluted environment.
iii) Human beings: Smoke and SO2 cause the general and most widespread effects of air pollution on people. Atmospheric smoke contains potentially carcinogenic organic compounds similar to those that occur in cigarette tobacco smoke. The CO affects the cardiovascular system, NOxs affect the respiratory system, Ozone causes increased sensitivity to infections, lung diseases, irritation in eyes, nose and throat, etc.
National Air Quality Monitoring Programme 4.9 Central Pollution Control Board has laid down
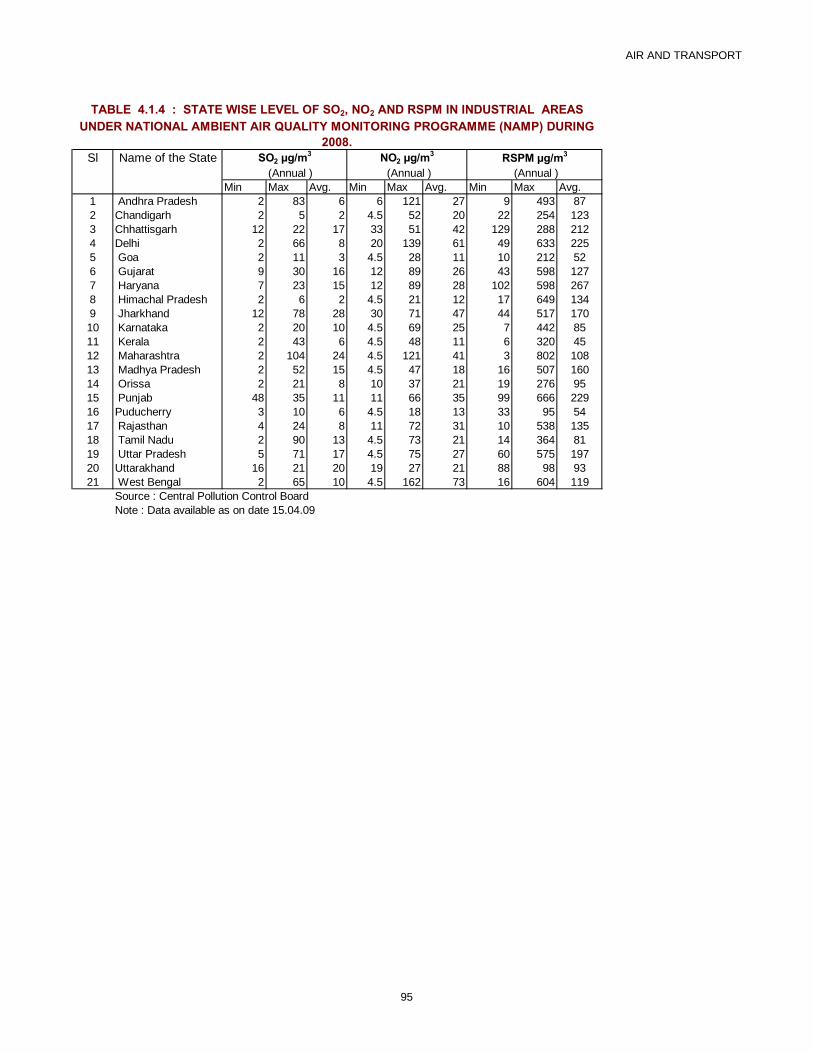
national air quality monitoring network with the help of State Pollution Control Boards. The network is consisting of 346 stations covering 130 Cities, 26 States and 4 Union Territories. The parameters are Sulpher Dioxide, Oxides of Nitrogen and Respirable Suspended Particulate Matter. It is expected that there will be 104 observations in a year taken twice a week, 24 hourly at uniform level. State-wise level of SO2, NOx and RSPM in residential areas are summarised in the Table.
Summary of the Observations are as follows: • With respect to Sulpher di-oxide it is
observed that annual average is well within the limit in all States. There are some occasional pulses in the States of Andhra Pradesh, Maharashtra, Punjab, Tamil Nadu, Uttar Pradesh and West Bengal.
• With respect to NO2 Values, the annual average are well with in limit except in some Cases. The maximum value indicates that of Andhra Pradesh, Delhi, Bihar, Maharashtra, Tamil Nadu and West Bengal are higher.
• In case of RSPM average value indicates that except few States such as Goa, Kerala, Mizoram, and Pondicherry, Tamil Nadu all are exceeding the limit. The maximum

85
value indicates that except Mizoram all are high. States like Rajasthan also is high as 829 micro gram per metre cube.
• With respect to industrial area sulpher di-oxide are again within the limit and so is the with Nitrogen Oxide.
• With respect to RSPM the trend shows that 13 States are exceeding the limits.
4.10 Areas of Concern a) Air pollution is existed in major cities where vehicles are the major sources. b) There are 24 critically polluted areas where industrial pollution is predominant. Action plan have been formulated and implemented by the Central/ States Pollution Control Board in these problem areas. 4.11 Non-attainment Cities CPCB has identified list of polluted cities in which the prescribed National Ambient Air Quality Standards (NAAQS) are violated. Action plans are being formulated and implemented to control air pollution in non-attainment cities by respective states.
Steps taken to Control Air Pollution
4.12 Measures taken for Control of Air Pollution from Vehicles A) Vehicular Emission Norms The vehicle emission norms in India are detailed below.
a) During 1990-91 India for the first time notified mass emission norms for the vehicles at the manufacturing stage as well as for in-use vehicles. These norms were notified under EPA, more vehicles rules and Air Act.
b) b. The emission norms introduced in 1996
have been crucial in controlling vehicular pollution because of stringency of emission norms along with specifications on fuel quality in 1996. for the first time crankcase emission norms and evaporative emission norms were introduced.
c) From April 1995 passenger cars were
allowed to register only if they are fitted with a catalytic converter in four metros-Delhi, Mumbai, Kolkata and Chennai. Emission
norms for such vehicles were stricter by 50 percent compared to 1996 norms.
d) The testing method for passenger car norms
were changed from hot start to cold start, which is also a stringent measure, compared to the earlier one.
e) More stringent norms were introduced for
the year 2000. These norms were notified under Motor Vehicle Rules during 1997. Automobile manufacturers have to undergo major modification to meet these norms.
f) As per Hon’ble Supreme Court’s directors
only private vehicles confirming to at lease EURO-1 norms are being registered. In Mumbai Euro-II norms for private vehicles (4 wheelers) was applicable from 2001. In Mumbai Euro-II norms for private vehicles (4 wheelers) was applicable from 2001. In Kolkata, India-2000 norms (Euro-I) have been made applicable from November 1999.
g) From 1st October 1999, emission norms for
agricultural tractors were introduced throughout the country. Bharat Stage-II and Bharat Stage-III emission norms for tractors have been scheduled to be implemented from 2003 and 2005 respectively.
h) The Bharat Stage-II norms for new 4-
wheeler private non-commercial vehicle were introduced in Mumbai from January 2001 and in Kolkata and Chennai from July 2001 to 24th October, 2001.
i) Only those taxies are being registered in
Delhi, which are meeting Bharat Stage-II norms.
j) Bharat State-II norms for Diesel 4 wheeler
transport vehicles were introduced in NCT from 24th October, 2001, in Greater Mumbai, Kolkata & Chennai from 31.10.2001.
k) The expert committee on Auto Oil Policy
was constituted during September 2001. The interim report of the committee was submitted to Govt. on 1.1.2000, recommending Bharat Stage-III emission norms for all category of 4-whellers in 7 mega cities from 2005 and rest of the country by 2010. Final report of the committee has been submitted in September 2002 which includes road map for control of vehicular pollution up to 2010.

86
l) Final report of the inter-Ministerial Task Force constituted by Ministry of Petroleum & Natural Gases at the instance of the Committee of Secretaries to evolve a long term policy for vehicular emission and auto fuel policy has been submitted which recommended introduction of Bharat Stage-II norms for 4-wheelers and next stage emission norms for 2/3 wheelers throughout the country from 2005 and introduction of Bharat stage III norms for four wheelers in 7-mega cities from 2005.
B) Fuel Quality Specifications For the first time diesel and gasoline fuel quality with respect to environment related parameters has been notified under EPA during April 1996. C) Lubricants Quality: Specifications of 2T oil for two stroke engine with respect to smoke has been notified under EPA during September 1998 for implementation from 1.4.1999 throughout the country. Pre-mix 2T oil dispenser has been installed at all petrol filling stations in Delhi so that excessive oil is not being used by the vehicle owners. Sale of loose 2T oil has been banned from December 1998 in Delhi. D) Alternate Fuels:
a) All Govt. vehicles were required to compulsorily fit CNG kit or catalytic converter by December 1996.
b) Custom duly on CNG kit has been excepted
for promotion of CNG vehicles.
c) Emission norms for CNG vehicles have been notified under Motor Vehicles Rule Vide GSR 853 (E) dated 19.11.2001.
d) LPG is now being used as alternate fuel for
motor vehicles after making amendments in CMVR. Emission norms for LPG vehicles have been notified vide GSR 284 (E) dated 24.4.2001.
e) Battery driven vehicles have been introduced in few corridors in Delhi
E) Restriction of Grossly polluting Vehicles
a. Registration of new auto rickshaws with
conventional engine has been banned from May 1996 from May 1996 and registration of Defense Service and Govt. auctioned
vehicles has been banned from April 1994 in Delhi.
b. 20 years old commercial vehicles were
phased out from October 1998, 17 year old commercial vehicles has been phased out from November 1998 and 15 year old commercial vehicle from December 1998 in Delhi.
c. Registration on alternation of vehicles by
replacing petrol engine with diesel has been banned from 1.4.1998 in Delhi.
F) Traffic Management
a. Restriction has been imposed on goods
vehicles during day time from August 1999 in Delhi.
b. Left lane has been made exclusive to buses
and other HMV in Delhi.
c. Time clocks have been installed in important red lights to enable the drivers to switch off their vehicles depending on the time left in the time clocks.
d. More fly over and subways have been
constructed and T-Junctions have been closed for better traffic flow.
G) Public Transport Systems:
a. Number of buses has been increased to discourage use of individual vehicles by allowing private sectors for operation.
b. Metro Rail Project for Shahdara – Tri Nagar
has been commissioned. H) Technology
a. Fitment of catalytic converter for new petrol passenger cars has been made compulsory from 1.4.1995 in four metros and 45 cities from 1.9.1998.
b. Two wheeler scooters with four stroke
engine are being introduced in the market from October 1998.
c. Registration of only rear engine auto
rickshaws is being allowed from May 1996 onwards.

87
d. More four stroke two wheelers are being registered in Delhi. I) Mass Awareness
a. Messages/articles related to vehicular emissions are disseminated through newsletters, pamphlets, newspapers, magazines, Television, Radio, internet, Workshops and Summer Exhibitions.
b. Display of ambient air quality data through
display system near ITO, Newspapers, daily news and internet.
c. NGOs working on vehicular pollution
control are being encouraged for mass awareness companies.
Measures Taken for Controlling Air Pollution from Industries 4.13 The measures taken for controlling air pollution from industries are as follows:
a. Emission standards have been notified under the Environment (Protection) Act, 1986 to check pollution
b. Industries have been directed to install
necessary pollution control equipment in a time bound manner and legal action has been initiated against the defaulting units.
c. 24 critically polluted areas have been
identified. Action Plan have been formulated for restoration of environmental quality in these areas.
d. Environmental guidelines have evolved for
siting of industries.
e. Environmental clearance is made compulsory for 29 categories of development projects involving public hearing/NGO participation as an important component of Environmental Impact Assessment process.
f. Environmental audit in the form of
environmental statement has been made mandatory for all polluting industries.
g. Preparation of zoning Atlas for setting of
industries based on environmental considerations in various districts of the country has been taken up.
h. Power plants (coal based) located beyond
1000 kms from the pit-head are required to use low ash content coal (not exceeding 34%) with effect from 1.6.2002. Power plants located in the sensitive areas are also required to use low ash coal irrespective of their distance from the pit head.
.4.17 Up-coming initiatives a. Monitoring using automatic analysers is being initiated in 16 polluted cities identified by Hon’ble Supreme Court. b. Action Plan are being formulated and implemented by the Central/ States Pollution Control Boards in 16 cities identified by Hon’ble Supreme Court as polluted cities. c. Road map given by Auto fuel policy for vehicular pollution control is being implemented. d. Corporate Responsibility for Environmental protection (CREP) is being implemented by industries for controlling industrial pollution. e. Source apportionment studies have been imitated and it is planned to carry out such studies initially in six cities. f. Monitoring of hazardous air pollutants such as benzene, PAHs etc. has been initiated and it is proposed to carry out there monitoring in other cities also. Major City Specific Action Plan in Delhi 4.14 a) Vehicular Pollution Control
a. Public transport (buses, auto, taxis) in Delhi has been converted to CNG mode.
b. Sulphur content in diesel has been reduced in
a phased manner.
c. The lead content in petrol has been progressively reduced to make it unleaded.
d. Bharat Stage-III norms have been
implemented in Delhi.
e. Pre-mix 2T oil dispensers have been installed at all petrol filling stations.

88
f. Grossly polluting old commercial vehicles have been phased out .
g. Restriction has been made on plying of
goods commercial vehicles during day time.
h. Metro rail has been introduced to have a more efficient public transport system.
(b) Industrial Pollution Control (i) Directions under Section 5 of E(P)A, 1986 have been issued on April 1996 and July 1996 to all the three power plants located in Delhi for completing the following in a time bound manner. Ø Comply with emission and liquid effluent
standard. Ø Submission of action plan for switching over
the beneficiated coal with an ash content of not more than 34%.
Ø Submission of action plan to achieve 20% utilization of fly-ash by Dec. 1997.
Ø Installation of opacity meter in all units to ensure compliance with the standards.
Ø Coverage of abandoned ash ponds with top soil.
(ii) All stone crushers have been closed down in Delhi and shifted to Pali in Rajasthan. (iii) All the hot mix plants have been closed down and shifted to other states. (iv) As per the directions of Hon’ble Supreme Court, 168 hazardous industries have been closed down in Delhi.
4.15 Major City Specific Action Plan in Mumbai Ø Bhatart Stage-III norms have been
implemented in Mumbai. Ø Unleaded gasoline and low sulphur diesel are
being supplied in Mumbai. Ø Visits are made to petrol pump as per
guidelines prescribed to check/inspect adulteration/malpractices in diesel and petrol under Central Govt. vide order The Motor Spirit and High Diesel (Regulation of Supply and Distribution and Prevention of Malpractices), 1998. Defaulter petrol pumps
are legally prosecuted under Essential Commodities Act, 1955.
Ø Licence and ‘End Use Certificate’ is made
compulsory to persons who store Naptha and Solvents which are also used as adulterants in petrol and diesel.
Ø Pollution under Control certificate has been
made mandatory for every vehicle owner. Ø Implementation of rigorous inspection and
maintenance measures periodically for all types of vehicles, involving vehicle manufacturers.
Ø From 15.10.99 ‘No Pollution Under
Certificate- No Petrol’ scheme is launched in Mumbai Metropolitan Region (MMR)
Ø Buses, taxis, autos are on CNG mode.
Ø Mass awareness Programme are being
organized for creating awareness in public. Ø The Transport Commissioner’s Office has
increased vigilance in checking polluting vehicles in Mumbai by increasing number of exhaust monitors for petrol and diesel driven vehicles.
Ø Auto exhaust checking are also done at entry
points to Maharashtra State to check compliance to norms fixed under Central Motor Vehicles Act, 1989.
Major City Specific Action Plan in Ahmedabad 4.16 a) Vehicular Pollution Control The measures include following (i) Banning of old buses of more than 15 years old (ii) Bharat Stage- III norms have been introduced in Ahmedabad. (iii) Banning of diesel run rickshaw within city limits. (iv) Diversion of heavy vehicles such as trucks/luxury buses/trailers/tankers/tractors/lorries, etc. aw ay from the city. (v) Improvement of road condition and making the roads pucca upto the footpath not leaving any uncovered space on either sides of the roads.

89
(vi) Strict enforcement of smoke test/vehicle test protocol (vii) Surveillance of vehicles with higher black smoke emission (viii) Third party audits of PUC Centres including calibration audits (ix) To launch a drive to stop usage of kerosene in vehicles particularly three wheelers and commercial vehicles. (b) Industrial Pollution Control The measures include following (i) Intensifying monitoring by special vigilance squad under the Air Act, 1981. (ii) Determining efficacy of APC system & taking remedial action(s) including upgradation of existing Air Pollution Control Measures wherever needed. (iii) Implementation of CREP Action Plan for highly pollution industries as decided by MOEF. (iv) Ban on burning of off specification materials/wastes by scrap traders. 4.17 Major City Specific Action plan in Bangalore Ø To reduce traffic congestion, 108 roads have
been converted to one way, 5 flyovers completed, 3 railway under pass on Quter rind road (ORR) limit completed, 2 railway over bridges completed and 206 Km of road has been asphalted.
Ø Low sulphur diesel (Green Diesel) and Green
Petrol (Sulphur 0.05%)is being supplied in Bangalore ORR area from 1.4.2003.
Ø Bharat Stage – III norms have been
introduced in Bangalore. Ø Out of 70,131 ( as on 31.07.2003) auto
rickshaws registered in Bangalore city, 35000 auto rickshaws are running on LPG
Ø 6 Auto LPG dispensing stations ( ALDS) are
operating Ø Transport department has approved Bajaj 4
stroke ( rear engine ) LPG auto rickshaw in Bi- fuel mode
Ø 5% ethanol blended petrol is being supplied
in all districts from 01.10.2003. Ø Regular check on adulteration of fuel is
being conducted by Food and Civil Supplies Department.
Ø Goods vehicles carrying construction
materials are allowed within ORR only during 10 PM to 6AM for unloading.
Ø Modernization of Emission testing Centers
for issue of “Pollution Under Control” Certificate bearing photograph of the tested vehicle using Web camera by the Transport Department.
Ø Karnataka State Pollution Control Board to
take action to promote use of cleaner fuels used by major industries in Generator sets and boilers.
4.18 Major City Specific Action Plan in Chennai Ø Bharat Stage – III norms have been
introduced in Chennai. Ø Unleaded gasoline and low sulphur diesel are
being supplied in Chennai. Ø Pollution Under Constrol Certificate has
been made mandatory. Ø Pre mixed 2T oil dispensers have been
installed in most of the retail outlets in Chennai City.
Ø The Motor Spirit and High Speed Diesel
(Regulation & Supply and Distribution and Prevention of malpractices) order 1998 has been republished by the Government of Tamilnadu with the intention to curb malpractices such as adulteration, pilferation etc.,
Ø LPG supply is being implemented by oil
companies, Oil companies have promised to setup 28 Auto ALP dispensing station (ALDS). Presently five ALDS are functioning.
Ø Mass Rapid Transit System (MRTS) and
electric trains are operated by Southern Railways.

90
Ø Power plants have been insisted to provide scrubber for the control of emissions
Ø For all the process emission sources and
boiler of higher capacity air pollution control measures such as dust collectors and wet scrubbers are insisted by Tamil Nadu Pollution Control Board.
Ø The industrial units are also insisted to
switch over to cleaner fuels such as LSHS, LDO etc., to control the SO2 emission.
Major City Specific Action Plan in Kolkata 4.19 a) Vehicular Pollution Control
i.Bharat State –III norms have been introduced in Kolkata
ii.Supply, Distribution and Selling of Loose 2T oil in Kolkata Metropolitan Area (KMA) has been Banned from 01.10.2001 and Selling of Premixed Fuel oil made Mandatory within KMA from 15.11.2001.
iii. Unleaded Petrol and Low Sulphur Petrol and Diesel made available within Kolkata and Howrah and adjoining agglomeration.
iv. Availability of Cleaner Automotive Fuel like LPG ensured in Kolkata.
v. Introduced Upgraded Auto Emission Testing Centre (PUC Centre)
b) Industrial Pollution Control
i. Stricter Locational Policy for New Industrial Units
ii.Ensuring Regulatory Compliance by Grossly Polluting Industries
iii.Introduction of Stricter Emission Standard for Boilers, Ceramic, Kilns, Foundries and Rolling Mills operating within Kolkata Metropolitan Areas.
iv.Mandatory Use of Cleaner Fuel in Small Boilers, Ceramic Kilns and Rolling Mills operating within Kolkata Metropolitan Area.
v.Discontinuance of Coal Supply to the industries which have been ordered to discontinue the use of coal.
vi.Environmental compliance by Cluster of Small Scale Industries is also ensured
Major City Specific Action Plan in Hyderabad
4.20 The measures include following
o Upgradation of existing Pollution under Control (PUC) centers with computer testing facility o Unleaded gasoline and low sulphur diesel are being supplied in Hyderabad
o Introduction of mobile task forces to monitor the visibly polluting vehicles. o Bharat Stage-III norms have been introduced in Hyderabad o Ban on sale of loose 2T oil. Shall be dispensed through premixed dispensing stations o Establishment of LPG dispensing stations o Constitution of task forces to check the adulteration of oil and fuel
o Introduction of multi model transport system o Urban Greening by Hyderabad Urban Development Authority (HUDA) is being carried out o Open space plantation by Municipal Corporation of Hyderabad (MCH) is being carried out
Noise Pollution
4.21 Of late, noise has been recognized as a
pollutant which until recently was considered only as a nuisance. The Central Pollution Control Board (CPCB) has notified the ambient noise standards in 1987 under section 20 of the Air (Prevention and Control of Pollution) Act, 1981. The noise standards specify limits as 55dB(A) and 45dB(A) as limits for day and night time, respectively, for residential areas, 75 dB(A) and 70 dB(A) in the day and night time for industrial areas, and 50 dB (A) and 40 dB(A) in the day and night for silence zones. Special campaign for reduction in use of fire crackers in Delhi

91
have resulted in reduced pollution levels during Diwali.
Green House Gases and Their Effects 4.22 The greenhouse effect plays a crucial role in regulating the heat balance of the earth. It allows the incoming short-wave solar radiation to pass through the atmosphere relatively unimpeded; but the long-wave terrestrial radiation emitted by the earth’s surface is partially absorbed and then re-emitted by a number of trace gases in the atmosphere. These gases known as Greenhouse Gases (GHGs) are: water vapor, carbon dioxide, methane, nitrous oxide and ozone in the troposphere and in the stratosphere. This natural greenhouse effect warms the lower atmosphere. 4.23 If the atmosphere were transparent to the outgoing long wave radiation emanating from the earth’s surface, the equilibrium mean temperature of the earth’s surface would be considerably lower and probably below the freezing point of water. Mere incidence of GHG’s in the atmosphere, by itself, is no concern. What is more important is that their concentration should stay within reasonable limits so that global ecosystem is not unduly affected. However, by increasing the concentrations of natural GHG’s and by adding new GHG’s like chloro-flouro carbons, the global average and the annual mean surface-air temperature (referred to as the global temperature) can be raised, although the rate at which it will occur is uncertain. This is the enhanced greenhouse effect, which is over and above that occurring due to natural greenhouse concentration. Such a rise in the atmospheric concentration of GHG’s has led to an upward trend in global temperature.
4.24 While it is required to follow the general commitments under the Framework Convention on Climate Change, India is not required to adopt any GHG reduction targets. Irrespective of international commitments, it seems prudent to be ready with
• Inventory of sinks and sources of GHG emission
• Predict the cumulative impact of national and international GHG emissions to plan for temperature and sea level rise
• Devise land use plans for the coastal areas likely to be affected
• Devise water and land management strategies especially agricultural sector.

AIR AND TRANSPORT
Sl. No.1
1
2
3
4
5
6
7
8
9
10
11
Source : Ministry of Environment & Forests
TABLE 4.1.1 : AVERAGE GASEOUS COMPOSITION OF DRY AIR IN THE TROPOSPHERE
2 3 4
Parts Per Million (ppm)
Percent by VolumeGas
20.950000
780840.00
209500.00
9300.00
0.09
5.20
1.40
0.50
1.00
345.00
18.00
Ozone
0.000009
0.000140
0.000100Kryton
Hydrogen
Methane
Xenon
Variable
0.000050
0.000520Helium
Variable
0.034500
78.080000
0.930000
0.001800
Nitrogen
Oxygen
Argon
Neon
Carbon dioxide
92

AIR AND TRANSPORT
Pollutant
1 2 3 4 5 6 7 8 9 10 11 12 13 14 15 16
1 Time Weighted Annual * 24 hours** Annual * 24 hours** Annual * 24 hours** Annual * 24 hours** Annual * 24 hours** 8 hours** 1 hours Annual * 24 hours**Average Average Average Average Average Average Average Average Average Average Average Average Average Average Average
(µg/m3) (µg/m3) (µg/m3) (µg/m3) (µg/m3) (µg/m3) (µg/m3) (µg/m3) (µg/m3) (µg/m3) (µg/m3) (µg/m3) (mg/m3) (mg/m3)2 Industrial Area 80 120 80 120 360 500 120 150 1.00 1.50 5.00 10.00 0.10 0.40
3 Residential, Rural 60 80 60 80 140 200 60 100 0.75 1.00 2.00 4.00 0.10 0.40and Other Area
4 Sensitive Area 15 30 15 30 70 100 50 75 0.50 0.75 1.00 2.00 0.10 0.405 Methods of
Measurement1. Improved West & Gaeke Method
1. Jacob & Hochheiser Modified
Respirable particulate matter
High volume sampling (Average
Oxides ofNitrogen (NO2)
Carbon Monoxide (CO)
Ammonia #
Non- Dispresive infra-red
AAS Method after sampling using EPM
TABLE 4.1.2 : NATIONAL AMBIENT AIR QUALITY STANDARDS (NAAQS)
Sl. No.
Respirable Particulate Matter (RPM) (size less
than 10 µm)
Lead
Matter (SPM)
Sulphur Dioxide (SO2)
SuspendedParticulate
Measurement
93
Source : Central Pollution Control Board* : Annual Arithmatic Mean of minimum 104 measurements in a year taken twice a week 24-hourly at uniform interval.** : 24-hourly /8 -hourly values should be met 98% of the time in a year. However 2% of time, it may exceed but not on two consecutive days.µm : Micometer µg : MicrogramNote : 1. National Ambient Air Quality Standards : The level of air quality necessary with an adequate margin of safety necessary to protect the public health, vegetation and property2. Whenever and wherever two consecutive values exceed the limits specified above for the respective category, it would be considered adequate reason to institute regular/continuous monitoring and further investigations.3. The standards for H2s and CS2 have been notified seqerately vide GSR No. 7, dated December 22, 1998 under Rayon Industry. continuous monitoring and further investigations.
Gaeke Method
2. Ultraviolet Fluorescence
Hochheiser Modified (Na- arsenic) Method
particulate matter sampier
2. Gas phase Chemiluminiscence
sampling (Average flow rate not less than 1.1 m3/minute)
-------
infra-red Spectroscopy
sampling using EPM 2000 or equivalent filter paper
AIR
AN
D TR
AN
SP
OR
T

AIR AND TRANSPORT
Sl Name of the State(Annual ) (Annual ) (Annual )
Max Min Avg. Max Min Avg. Max Min Avg.1 Andhra Pradesh 74 2 8 108 7 26 425 12 852 Assam 21 2 6 33 5 13 450 16 893 Bihar 14 2 7 93 8 39 402 25 1204 Chandigarh 2 2 2 49 5 14 217 21 895 Chhattisgarh 28 3 16 63 13 28 261 68 1266 Delhi 31 2 5 138 23 55 630 18 2097 Goa 11 2 2 30 4.5 13 197 14 578 Gujarat 45 4 12 40 4.5 18 293 33 839 Haryana 24 4 9 36 5 13 293 45 12110 Himachal Pradesh 20 2 2 25 5 12 218 15 7111 Jharkhand 30 11 19 66 20 38 454 31 15212 Karnataka 49 2 10.5 66 8 27 381 28 7713 Kerala 31 2 5 72 5 20 280 11 4814 Madhya Pradesh 38 2 9 47 5 19 609 7 11015 Maharashtra 90 2 16 159 5 31 579 3 10116 Meghalaya 22 2 2 37 5 34 113 29 7317 Mizoram 2 2 2 10 5 15 61 15 3718 Manipur 6 2 3 38 14 19 125 34 8419 Nagaland 5 2 2 62 7 14 133 16 7220 Orissa 13 2 4 41 6 16 203 14 8021 Punjab 64 5 10 57 158 30 387 62 19322 Puducherry 10 2 4 21 5 10 182 25 4523 Rajasthan 18 2 7 74 5 28 829 10 12224 Tamil Nadu 80 2 12 106 5 20 302 11 5825 Uttar Pradesh 68 4 12 64 5 30 442 50 17026 Uttarakhand 61 21 27 31 23 28 159 73 12627 West Bengal 70 2 9 137 5 66 514 6 101
Source : Central Pollution Control BoardNote : Data available as on date 15.04.09
TABLE 4.1.3 : STATE WISE LEVEL OF SO2, NO2 AND RSPM IN RESIDENTIAL AREAS UNDER NATIONAL AMBIENT AIR QUALITY MONITORING PROGRAMME (NAMP) DURING
2008.SO2 µg/m3 NO2 µg/m3 RSPM µg/m3
94
AIR AND TRANSPORT
Sl Name of the State(Annual ) (Annual ) (Annual )
Min Max Avg. Min Max Avg. Min Max Avg.1 Andhra Pradesh 2 83 6 6 121 27 9 493 872 Chandigarh 2 5 2 4.5 52 20 22 254 1233 Chhattisgarh 12 22 17 33 51 42 129 288 2124 Delhi 2 66 8 20 139 61 49 633 2255 Goa 2 11 3 4.5 28 11 10 212 526 Gujarat 9 30 16 12 89 26 43 598 1277 Haryana 7 23 15 12 89 28 102 598 2678 Himachal Pradesh 2 6 2 4.5 21 12 17 649 1349 Jharkhand 12 78 28 30 71 47 44 517 17010 Karnataka 2 20 10 4.5 69 25 7 442 8511 Kerala 2 43 6 4.5 48 11 6 320 4512 Maharashtra 2 104 24 4.5 121 41 3 802 10813 Madhya Pradesh 2 52 15 4.5 47 18 16 507 16014 Orissa 2 21 8 10 37 21 19 276 9515 Punjab 48 35 11 11 66 35 99 666 22916 Puducherry 3 10 6 4.5 18 13 33 95 5417 Rajasthan 4 24 8 11 72 31 10 538 13518 Tamil Nadu 2 90 13 4.5 73 21 14 364 8119 Uttar Pradesh 5 71 17 4.5 75 27 60 575 19720 Uttarakhand 16 21 20 19 27 21 88 98 9321 West Bengal 2 65 10 4.5 162 73 16 604 119
Source : Central Pollution Control BoardNote : Data available as on date 15.04.09
TABLE 4.1.4 : STATE WISE LEVEL OF SO2, NO2 AND RSPM IN INDUSTRIAL AREAS UNDER NATIONAL AMBIENT AIR QUALITY MONITORING PROGRAMME (NAMP) DURING
2008.SO2 µg/m3 NO2 µg/m3 RSPM µg/m3
95

( Number)
1 2 3 4 5 6 7 9 10 111 1992-93 17183224 720364 512602 2550286 297941 363962 1752536 2124433 255053482 1993-94 18898701 771117 552038 2654232 362622 392148 1828117 2200903 276598783 1994-95 20831428 897383 614567 2875651 350331 423383 1938422 2769990 302946564 1995-96 23252287 1010344 671682 3150951 381011 448415 2030728 2966042 339114605 1996-97 25728982 1175283 727965 3527303 417013 484099 2343000 2927887 373315326 1997-98 28642351 1360151 824525 3829209 484374 537237 (b) 2535930 3154263 413680407 1998-99 31327607 1495200 837700 4201774 516449 539819 (b) 2553689 3403087 448753258 1999-2000 34117662 1583561 919067 4647969 575612 562308 2715005 3735620 488568049 2000-01 38556026 1777130 1126148 5297219 634357 633900 2948300 4017946 54991026
10 2001-02 41581058 1881085 1168868 5717456 688204 518658 3044976 4219191 5881949611 2002-03 47525161 2114668 1196058 6597325 825638 727109 3487538 4559535 6703303212 2003-04 51921973 2167324 1282113 7267174 901889 767593 3748484 4661385 7271793513 2004-05 58799000 10320000* 892000 4031000 7457000$ 8150100014 2005-06 (P) 64743000 11526000* 992000 4436000 7921000$ 89618000
State:1 Andhra Pradesh 4543283 263325 58114 397738 81627 52047 210038 113748 57199202 Arunachal Pradesh 10605 1430 2260 2340 299 665 2878 667 211443 Assam 418780 29806 14266 106063 10368 10286 97506 39744 7268194 Bihar 469751 9507 21726 27508 14000 14220 62812 131179 7507035 Chhattisgarh 991022 7474 7302 43572 22005 2043 57099 85228 12157456 Goa 309488 9375 @ 71516 8273 4868 28326 4274 4361207 Gujarat 5162167 276908 110943 572414 40100 47014 386640 491304 70874908 Haryana 1526404 37841 87203 272895 14990 12134 205992 390451 25479109 Himachal Pradesh 152286 2783 12331 51918 14970 4916 43984 5625 288813
10 Jammu & Kashmir 253611 14255 10693 74187 10325 20139 42230 13156 43859611 Jharkhand 937745 36257 23419 92171 21814 9539 62566 33447 121695812 Karnataka 2732674 190362 41024 418181 40839 66223 192351 294930 397658413 Kerala 1595808 294244 71656 378912 114245 97694 209496 30019 279207414 Madhya Pradesh 2876191 45146 36282 148030 61424 24626 107208 504621 380352815 Maharashtra 6216794 493142 262741 924006 102475 61701 499195 408679 896873316 Manipur 75333 2521 7872 8030 363 2973 7169 2064 10632517 Meghalaya 21050 2934 9401 14595 5030 2827 14028 3517 7338218 Mizoram 19501 1145 6765 4850 3864 840 4470 710 4214519 Nagaland 36741 8291 21649 33273 4448 3712 50262 13541 17191720 Orissa 1223573 21893 26527 62553 24614 16204 86039 63579 152498221 Punjab 2587181 36838 32797 267379 11982 18579 110566 463778 352910022 Rajasthan 2692175 64580 128056 203991 32868 55936 187153 469047 383380623 Sikkim 4682 - 2863 1870 4947 893 1972 9 1723624 Tamil Nadu 6734205 154192 53987 731380 116373 96864 480549 207691 857524125 Tripura 44241 12162 - 8672 257 1596 6916 1703 7554726 Uttaranchal 391251 6799 6452 42220 13385 5413 15461 35001 51598227 Uttar Pradesh 4922047 78067 97821 391443 30193 41173 152163 747291 646019828 West Bengal 1581326 38289 @ 494505 67918 0 241035 124890 2547963
Union Territory: 0 0 01 A & N Islands 21743 784 1033 1693 436 459 1519 789 284562 Chandigarh 416917 - @ 157612 1173 1239 9130 36 5861073 Dadra & Nagar Haveli 17881 500 429 9270 108 160 6677 90 351154 Daman & Diu 30351 890 295 12278 43 399 3725 319 483005 Delhi 2665750 20893 122283 1192389 24712 44445 151548 14655 42366756 Lakshadweep 3978 408 85 78 - 5 270 547 53717 Pondicherry 235438 4283 3838 47642 1421 4376 9511 6441 312950
INDIA 51921973 2167324 1282113 7267174 901889 767593 3748484 4661385 72717935 Source: Transport Research Wing, Ministry of Road Transport & Highways . # : Includes trucks three and four wheelers used for carrying goods. ## : Includes tractors and trailers. (b) : Includes Omini Buses @ : Included in cars
* Car, Jeeps and Taxis $ Auto Rickshaws & others P- Provisional
2003-2004
AIR
AN
D TR
AN
SP
OR
TTaxis BusesAuto-
RickshawsJeeps
AIR
AN
D TR
AN
SP
OR
TTotal No. of
Vehicles
8
Cars
TABLE 4.1.5 (a) : NUMBER OF MOTOR VEHICLES REGISTERED IN INDIA (TAXED AND TAX-EXEMPTED)
Goods Vehicles #
Misce-llaneous ##
Two-Wheelers
Sl. No.
Year/State/UT
96

AIR AND TRANSPORT
(Number)
Multi-axied/Articulated
Vehicles Trucks & Lorries
Light Motor Vehicles (Goods)
Buses Taxies Light Motor Vehicles
(Passengers)
Total Transport
1 2 3 4 5 6 7 81 Andhra Pradesh 143147 66891 15498 81627 263325 5704882 Arunachal Pradesh* 2323 555 665 299 1430 52723 Assam 83189 14317 10286 10368 29806 1479664 Bihar 30516 32296 10961 14000 9507 972805 Chhattisgarh 40413 16686 2043 22005 7474 886216 Goa © 28326 $ 4868 8273 9375 508427 Gujarat 182304 204336 45669 40100 276908 7493178 Haryana 147667 58325 9369 14990 37841 2681929 Himachal Pradesh 41644 2340 4872 14970 2783 6660910 Jammu & Kashmir 29958 12272 20139 10325 14255 8694911 Jharkhand 62566 $ 9539 21814 36257 13017612 Karnataka 100596 91755 29710 40839 190362 45326213 Kerala 73315 136181 67206 114245 294244 68519114 Madhya Pradesh 77178 30030 24626 61424 45146 23840415 Maharashtra 243113 256082 49092 102475 493142 114390416 Manipur 5963 1206 2403 363 2521 1245617 Meghalaya*** 14028 $ 2827 5030 2934 2481918 Mizoram 3215 1255 840 3864 1145 1031919 Nagaland 41019 9243 3505 4448 8291 6650620 Orissa 50496 35543 13966 24614 21893 14651221 Punjab 75921 34645 18579 11982 36838 17796522 Rajasthan 173552 13601 55936 32868 64580 34053723 Sikkim 1619 353 406 4947 - 732524 Tamil Nadu 276235 204314 76907 116373 154192 82802125 Tripura 6321 595 1596 257 12162 2093126 Uttaranchal 9799 5662 4626 13385 6799 4027127 Uttar Pradesh 94482 57681 26437 30193 78067 28686028 West Bengal 241035 $ 41385> 67918 38289 388627
Union Territory:1 A & N Islands** 1519 $ 459 436 784 31982 Chandigarh 1671 7459 1239 1173 - 115423 Dadra & Nagar Haveli 5487 1190 154 108 500 74394 Daman & Diu 1896 1829 361 43 890 50195 Delhi 75601 75947 36059 24712 20893 2332126 Lakshadweep - 270 - - 408 6787 Pondicherry 6588 2923 1831 1421 4283 17046
Total (P) 2372702 1375782 594059 901889 2167324 7411756
(c ) : LMV (passengers) includes 6063 Motorcycles on hire also.- Not indicated $ : Included in Multi-Axled/Articulated Vehicles/Trucks & Lorries.
(P) : Total are provisional -representing summation of available data. > : Includes maxicab* : Data relates to 1996-97 ** :Data relates to 2001-02 *** : Data relates to 2002-03
97
Source : Motor Transport Statistics of India,Transport Research Wing, Ministry of Road Transport & Highways
Sl. No. States/UT Transport
TABLE 4.1.5 (b) : TOTAL REGISTERED MOTOR VEHICLES IN INDIA BY STATES/UTs(as on 31st March, 2004)- Provisional Contd.
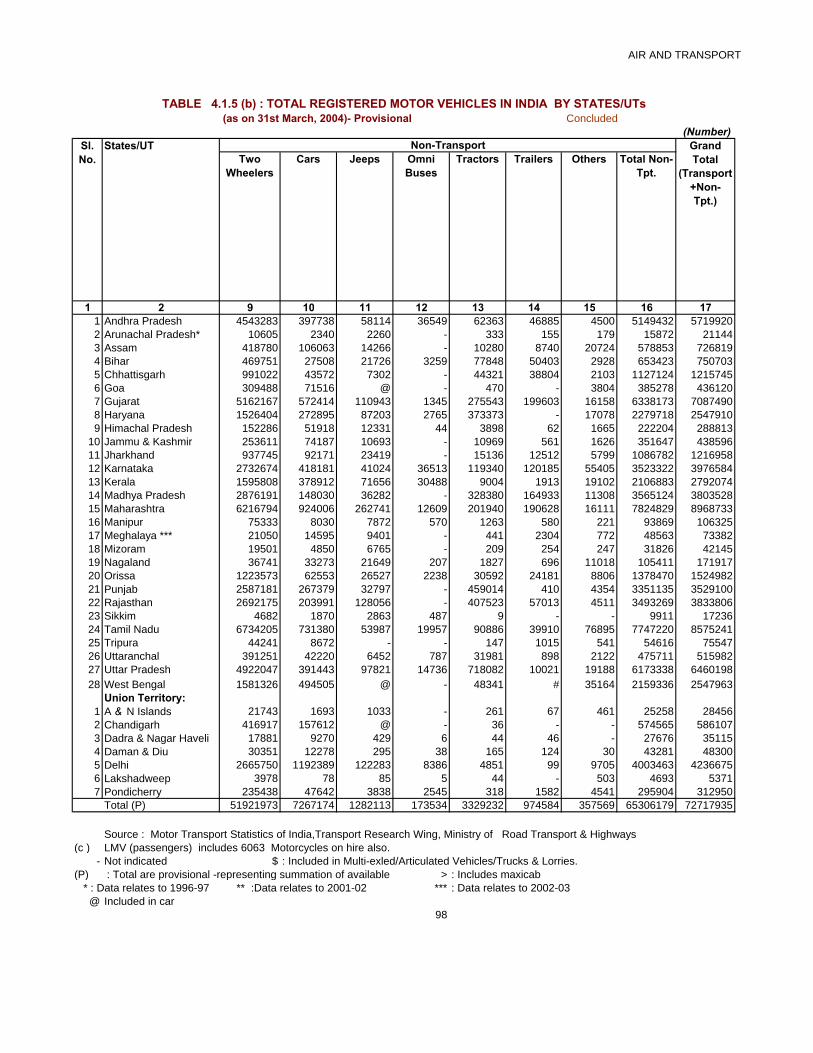
AIR AND TRANSPORT
Concluded
Two Wheelers
Cars Jeeps Omni Buses
Tractors Trailers Others Total Non- Tpt.
1 2 9 10 11 12 13 14 15 16 171 Andhra Pradesh 4543283 397738 58114 36549 62363 46885 4500 5149432 57199202 Arunachal Pradesh* 10605 2340 2260 - 333 155 179 15872 211443 Assam 418780 106063 14266 - 10280 8740 20724 578853 7268194 Bihar 469751 27508 21726 3259 77848 50403 2928 653423 7507035 Chhattisgarh 991022 43572 7302 - 44321 38804 2103 1127124 12157456 Goa 309488 71516 @ - 470 - 3804 385278 4361207 Gujarat 5162167 572414 110943 1345 275543 199603 16158 6338173 70874908 Haryana 1526404 272895 87203 2765 373373 - 17078 2279718 25479109 Himachal Pradesh 152286 51918 12331 44 3898 62 1665 222204 288813
10 Jammu & Kashmir 253611 74187 10693 - 10969 561 1626 351647 43859611 Jharkhand 937745 92171 23419 - 15136 12512 5799 1086782 121695812 Karnataka 2732674 418181 41024 36513 119340 120185 55405 3523322 397658413 Kerala 1595808 378912 71656 30488 9004 1913 19102 2106883 279207414 Madhya Pradesh 2876191 148030 36282 - 328380 164933 11308 3565124 380352815 Maharashtra 6216794 924006 262741 12609 201940 190628 16111 7824829 896873316 Manipur 75333 8030 7872 570 1263 580 221 93869 10632517 Meghalaya *** 21050 14595 9401 - 441 2304 772 48563 7338218 Mizoram 19501 4850 6765 - 209 254 247 31826 4214519 Nagaland 36741 33273 21649 207 1827 696 11018 105411 17191720 Orissa 1223573 62553 26527 2238 30592 24181 8806 1378470 152498221 Punjab 2587181 267379 32797 - 459014 410 4354 3351135 352910022 Rajasthan 2692175 203991 128056 - 407523 57013 4511 3493269 383380623 Sikkim 4682 1870 2863 487 9 - - 9911 1723624 Tamil Nadu 6734205 731380 53987 19957 90886 39910 76895 7747220 857524125 Tripura 44241 8672 - - 147 1015 541 54616 7554726 Uttaranchal 391251 42220 6452 787 31981 898 2122 475711 51598227 Uttar Pradesh 4922047 391443 97821 14736 718082 10021 19188 6173338 646019828 West Bengal 1581326 494505 @ - 48341 # 35164 2159336 2547963
Union Territory:1 A & N Islands 21743 1693 1033 - 261 67 461 25258 284562 Chandigarh 416917 157612 @ - 36 - - 574565 5861073 Dadra & Nagar Haveli 17881 9270 429 6 44 46 - 27676 351154 Daman & Diu 30351 12278 295 38 165 124 30 43281 483005 Delhi 2665750 1192389 122283 8386 4851 99 9705 4003463 42366756 Lakshadweep 3978 78 85 5 44 - 503 4693 53717 Pondicherry 235438 47642 3838 2545 318 1582 4541 295904 312950
Total (P) 51921973 7267174 1282113 173534 3329232 974584 357569 65306179 72717935
(c ) :LMV (passengers) includes 6063 Motorcycles on hire also.- Not indicated $ : Included in Multi-exled/Articulated Vehicles/Trucks & Lorries.
(P) : Total are provisional -representing summation of available data. > : Includes maxicab * : Data relates to 1996-97 ** :Data relates to 2001-02 *** : Data relates to 2002-03
@ Included in car98
Sl. No.
TABLE 4.1.5 (b) : TOTAL REGISTERED MOTOR VEHICLES IN INDIA BY STATES/UTs(as on 31st March, 2004)- Provisional
Source : Motor Transport Statistics of India,Transport Research Wing, Ministry of Road Transport & Highways
Grand Total
(Transport +Non- Tpt.)
Non-TransportStates/UT(Number)

AIR AND TRANSPORT

AIR AND TRANSPORT

AIR AND TRANSPORT
(Number)
Multi-axied/Articulate
d Vehicles Trucks & Lorries
Light Motor Vehicles (Goods)
Buses Taxies Light Motor Vehicles
(Passengers-Auto)
Total Transport
1 2 3 4 5 6 7 8
1 Ahmedabad 8870 10724 15291 4950 44290 841252 Bangalore 30720 23772 12890 16589 75360 1593313 Bhopal 4424 4571 2664 7228 9877 287644 Chennai 76820 56312 27457 38668 53804 2530616 Coimbatore 11649 6586 3119 4086 6509 319497 Delhi 75601 75947 36059 24712 20893 2332128 Hyderabad 23600 23034 2703 5049 73738 1281249 Indore 27655 7367 4658 13719 10255 63654
10 Jaipur 31698 3286 15787 8280 9832 6888311 Kanpur* 8253 3077 977 445 2816 155685 Cochin * 5786 9826 12597 10173 8327 46709
12 Kolkata 68331 $ 13648 33490 15403 13087213 Lucknow* 7557 5435 3359 5364 8324 3003914 Ludhiana 13918 12923 1537 2097 9046 3952115 Madurai 6340 3061 2469 4640 7294 2380416 Mumbai 16753 35490 11662 56459 102224 22258817 Nagpur 9790 9953 2793 750 10567 3385318 Patna* 15595 $ 4096 2998 32370 5505919 Pune 19833 16584 7704 4379 45308 9380820 Surat 3397 7129 991 1022 33767 4630621 Vadodara 6550 11325 3380 5541 27812 5460822 Varanasi* 5817 2266 1081 688 4972 1482423 Visakhapatnam 7815 4501 893 4123 18707 36039
486772 333169 187815 255450 631495 1894701
Name of City
Total (P)
Sl. No.
Transport
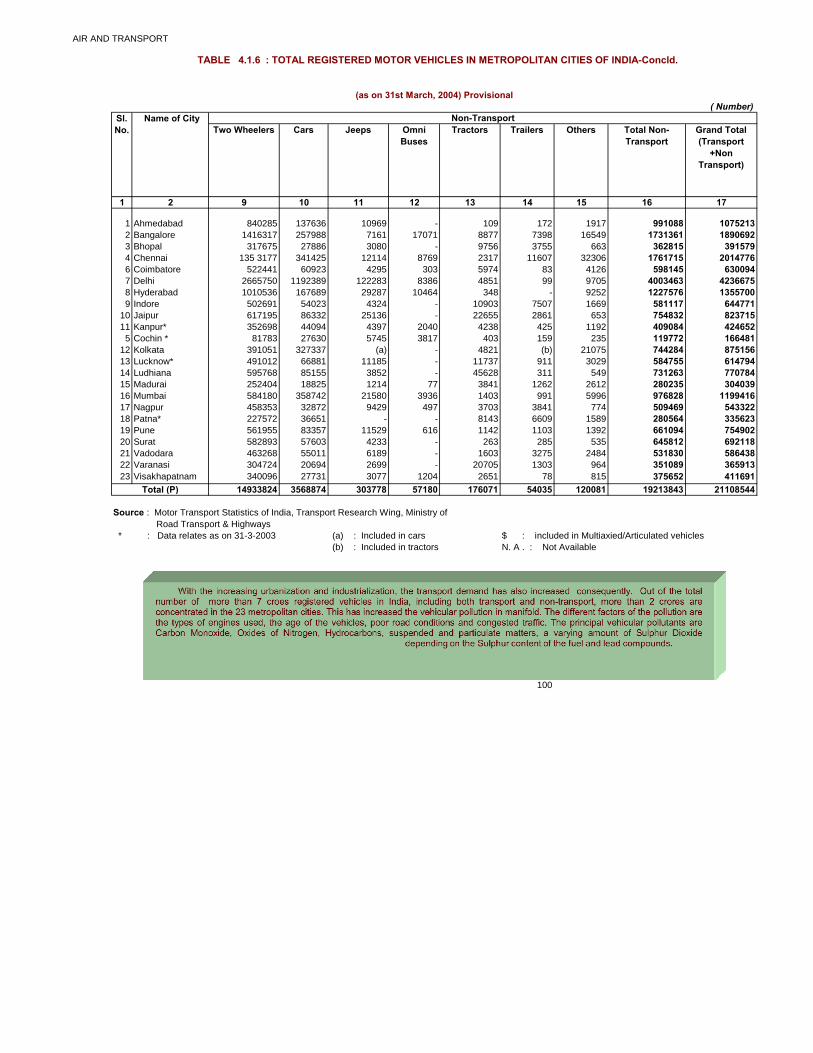
TABLE 4.1.6 : TOTAL REGISTERED MOTOR VEHICLES IN METROPOLITAN CITIES OF INDIA (as on 31st March, 2004)- Provisional Contd.
486772 333169 187815 255450 631495 1894701
Source : Motor Transport Statistics of India, Transport Research Wing, Ministry of Road Transport & Highways
* : Data relates to 1997-98 (a) : Included in cars (--) : Nil (b) : Included in tractors $ : Data relates to1998-99 *** : Data relates to 2000-01
99
Total (P)
AIR AND TRANSPORT
Two Wheelers Cars Jeeps Omni Buses
Tractors Trailers Others Total Non-Transport
Grand Total (Transport
+Non Transport)
1 2 9 10 11 12 13 14 15 16 17
1 Ahmedabad 840285 137636 10969 - 109 172 1917 991088 10752132 Bangalore 1416317 257988 7161 17071 8877 7398 16549 1731361 18906923 Bhopal 317675 27886 3080 - 9756 3755 663 362815 3915794 Chennai 135 3177 341425 12114 8769 2317 11607 32306 1761715 20147766 Coimbatore 522441 60923 4295 303 5974 83 4126 598145 6300947 Delhi 2665750 1192389 122283 8386 4851 99 9705 4003463 42366758 Hyderabad 1010536 167689 29287 10464 348 - 9252 1227576 13557009 Indore 502691 54023 4324 - 10903 7507 1669 581117 644771
10 Jaipur 617195 86332 25136 - 22655 2861 653 754832 82371511 Kanpur* 352698 44094 4397 2040 4238 425 1192 409084 424652
5 Cochin * 81783 27630 5745 3817 403 159 235 119772 16648112 Kolkata 391051 327337 (a) - 4821 (b) 21075 744284 87515613 Lucknow* 491012 66881 11185 - 11737 911 3029 584755 61479414 Ludhiana 595768 85155 3852 - 45628 311 549 731263 77078415 Madurai 252404 18825 1214 77 3841 1262 2612 280235 30403916 Mumbai 584180 358742 21580 3936 1403 991 5996 976828 119941617 Nagpur 458353 32872 9429 497 3703 3841 774 509469 54332218 Patna* 227572 36651 - - 8143 6609 1589 280564 33562319 Pune 561955 83357 11529 616 1142 1103 1392 661094 75490220 Surat 582893 57603 4233 - 263 285 535 645812 69211821 Vadodara 463268 55011 6189 - 1603 3275 2484 531830 58643822 Varanasi 304724 20694 2699 - 20705 1303 964 351089 36591323 Visakhapatnam 340096 27731 3077 1204 2651 78 815 375652 411691
14933824 3568874 303778 57180 176071 54035 120081 19213843 21108544Total (P)
( Number)Non-Transport
TABLE 4.1.6 : TOTAL REGISTERED MOTOR VEHICLES IN METROPOLITAN CITIES OF INDIA-Concld.
(as on 31st March, 2004) Provisional
Name of CitySl. No.
14933824 3568874 303778 57180 176071 54035 120081 19213843 21108544
Source : Motor Transport Statistics of India, Transport Research Wing, Ministry of Road Transport & Highways
* : Data relates as on 31-3-2003 (a) : Included in cars $ : included in Multiaxied/Articulated vehicles (b) : Included in tractors N. A . : Not Available
100
Total (P)

AIR AND TRANSPORT

AIR AND TRANSPORT
AIR AND TRANSPORT
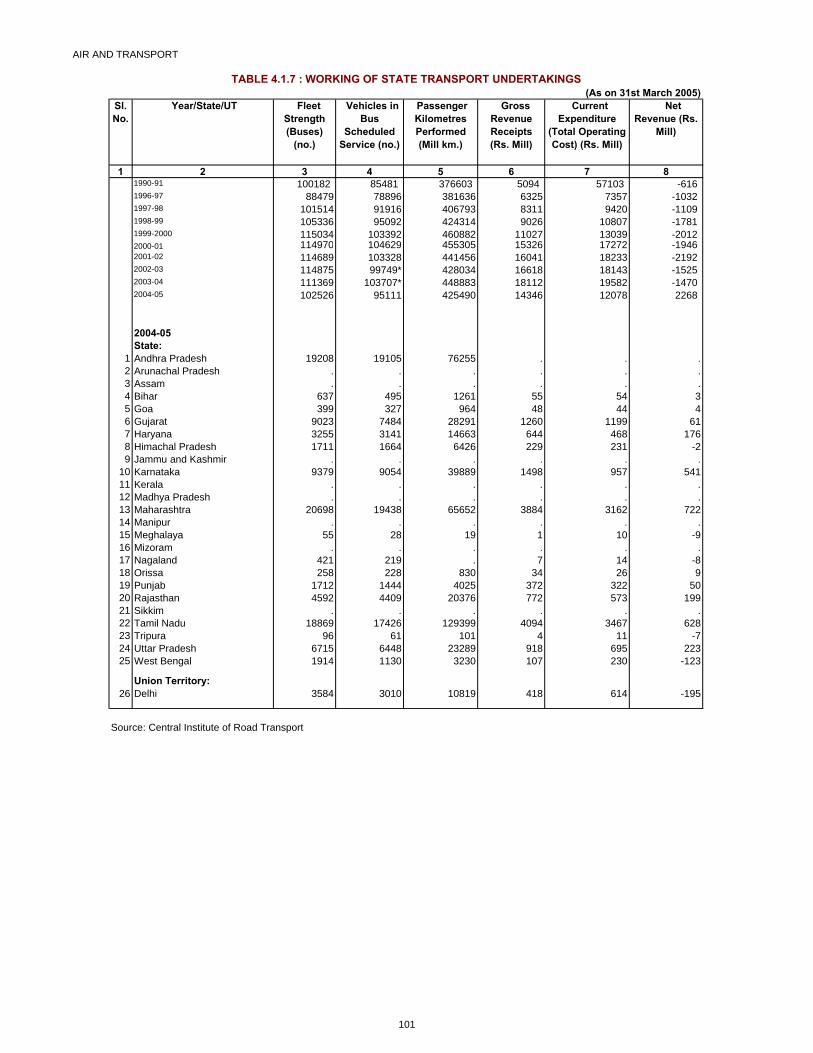
Sl. No.
Year/State/UT Fleet Strength (Buses)
(no.)
Vehicles in Bus
Scheduled Service (no.)
Passenger Kilometres Performed (Mill km.)
Gross Revenue Receipts (Rs. Mill)
Current Expenditure
(Total Operating Cost) (Rs. Mill)
Net Revenue (Rs.
Mill)
1 2 3 4 5 6 7 81990-91 100182 85481 376603 5094 57103 -6161996-97 88479 78896 381636 6325 7357 -10321997-98 101514 91916 406793 8311 9420 -11091998-99 105336 95092 424314 9026 10807 -17811999-2000 115034 103392 460882 11027 13039 -20122000-01 114970 104629 455305 15326 17272 -19462001-02 114689 103328 441456 16041 18233 -21922002-03 114875 99749* 428034 16618 18143 -15252003-04 111369 103707* 448883 18112 19582 -14702004-05 102526 95111 425490 14346 12078 2268
2004-05State:
1 Andhra Pradesh 19208 19105 76255 . . .2 Arunachal Pradesh . . . . . .3 Assam . . . . . .4 Bihar 637 495 1261 55 54 35 Goa 399 327 964 48 44 46 Gujarat 9023 7484 28291 1260 1199 617 Haryana 3255 3141 14663 644 468 1768 Himachal Pradesh 1711 1664 6426 229 231 -29 Jammu and Kashmir . . . . . .
10 Karnataka 9379 9054 39889 1498 957 54111 Kerala . . . . . .12 Madhya Pradesh . . . . . .13 Maharashtra 20698 19438 65652 3884 3162 72214 Manipur . . . . . .15 Meghalaya 55 28 19 1 10 -916 Mizoram . . . . . .17 Nagaland 421 219 . 7 14 -818 Orissa 258 228 830 34 26 919 Punjab 1712 1444 4025 372 322 5020 Rajasthan 4592 4409 20376 772 573 19921 Sikkim . . . . . .22 Tamil Nadu 18869 17426 129399 4094 3467 62823 Tripura 96 61 101 4 11 -724 Uttar Pradesh 6715 6448 23289 918 695 22325 West Bengal 1914 1130 3230 107 230 -123
Union Territory:26 Delhi 3584 3010 10819 418 614 -195
Source: Central Institute of Road Transport
(As on 31st March 2005)TABLE 4.1.7 : WORKING OF STATE TRANSPORT UNDERTAKINGS
101

AIR AND TRANSPORT
City 1995 1996 1997 1998 1999 2000 2001 2002 2003 2004Ahmedabad 32.0 25.0 15.1 - 12.2 8.4 10 12.3 16 15.7Banglore - 20.7 27.9 20.3 38.2 20.7 20 13.4 12 8.5Chennai 21.7 8.1 15.9 12.6 11.9 12.5 17 19.9 15 12.2Delhi 23.5 17.3 16.3 15.4 17.5 15.2 13 11.3 10 9.89Hyderabad 17.2 16.8 16.4 11.8 14 12.4 10 7.27 6 5.63Kolkata 35.7 21.3 0 34.3 44.5 17.4 18 11.4 17 9.33Mumbai 31.1 18 25.1 11.5 14.9 12.1 16 9.07 8 6.67
City 1995 1996 1997 1998 1999 2000 2001 2002 2003 2004Ahmedabad 18.8 14.8 20 - 33 28.6 39 31.8 25 24.3Banglore - 28 20.4 25 27.1 40.2 23 25.5 35 51.8Chennai 17.5 9 13 16.7 10.7 14.4 18 18.4 26 16.8Delhi 47.2 39.7 34 33.9 35.7 39.9 37 37.3 42 46.1Hyderabad 37.8 25 30.7 30.8 24.3 25.2 31 25.5 26 30.3Kolkata 29.9 29.3 0 32 30.5 34.8 74 81.7 71 59.7Mumbai 64.2 35.3 34.3 19.5 29.6 25.5 23 17.4 21 18.3
City 1995 1996 1997 1998 1999 2000 2001 2002 2003 2004Ahmedabad 251 254 235 - 351 393 343 281 256 244Banglore - 176 187 153 146 153 148 149 163 153Chennai 127 115 107 127 88 92 98 132 155 136Delhi 411 402 343 379 388 381 346 427 355 374Hyderabad 178 177 144 213 209 163 157 161 164 196Kolkata 354 498 0 279 308 315 251 256 251 266Mumbai 210 213 298 187 221 252 231 225 224 247
1999 2000 2001 2002 2003 2004161 237 198 169 154 152
0 89.7 68 64.3 76 6971.7 65 77.6 74.8 86 60172 155 146 158 151 149127 98 68.8 71 64 71140 145 117 128 121 134115 107 67.2 68.7 70 78
SPM : Suspended particulate matter; RSPM : Respirable suspended particulate matter
Table 4.1.8: Ambient Air Quality in Major cities
Table 4.1.8 : Ambient Air Quility in Major cities
Respirable Suspended Particulate Matter (RSPM)
Sulphur dioxide (SO2)( µg/m3)
( µg/m3)
( µg/m3)
( µg/m3) Oxides of Nitrogen (NOx)
Suspended Particulate Matter (SPM)
Table 4.1.8 : Ambient Air Quility in Major cities
Table 4.1.8 : Ambient Air Quility in Major cities
Mumbai
City
BangloreChennaiDelhiHyderabadKolkata
Ahmedabad
102

AIR AND TRANSPORT
Sl. No.
Category 1991 1996 2000 (Euro II)
2005 (Euro III)
2008
1 2 3 4 5 6 7
1 Petrol Vehicles : (in grams/km)I. Two wheelers
(a) CO 12-30 4.5 2.0 1.5 1(b) HC 8-12 - - - -(c ) (HC+NOX) - 3.6 2.0 1.5 1
II. Three Wheelers(a) CO 12-30 6.75 4.0 2.25 1.25(b) HC 8-12 - - - -(c ) (HC+NOX) - 5.40 2.0 2.0 1.25
III. Cars with CC :(a) CO - 4.34-6.20 2.72 2.2 -(b) HC - - - - -(c ) (HC+NOX) - 1.5-2.18 0.97 0.5 -
IV. Cars without CC :(a) CO 14.3-27.1 8.68-12.4 2.72 2.2 -(b) HC 2.0-2.9 - - - -(c ) (HC+NOX) - 3.00-4.36 0.97 0.5 -
2 Diesel Vehicles : A : Gross Vehicles Weight > 3.5 ton (Heavy Duty Vehicles)-in grams/kWh(a) CO 14.0 11.2 4.5 4 -(b) HC 3.5 2.4 1.1 1.1 -(c ) NOX 18.0 14.4 8.0 7 -(d) PM > 85 KW/g/KWh - - 0.36 0.15 -(e) PM < 85 KW/g/KWh - - 0.61 0.15 -B : Gross Vehicles Weight < 3.5 ton (Light duty Vehicles)*-in grams/km(a) CO 14.3-27.1 5.0-9.0 2.72-6.90 1.06 -(b ) (HC+NOX) 2.7-6.9 2.0-4.0 0.97-1.70 0.71 -(c ) NOX - - - 0.566 -(d) PM - - 0.14-0.25 0.080
Source : The Energy Resources Institute.CO : Carbon Monoxide CC : Catalytic ConverterHC : Hydrocarbon PM : Particulate matterNOX : Oxides of Nitrogen* : The test cycle is as per 13 mode cycle or a chasis dynamometer.Euro I w.e.f. 1-6-99 and Euro II w.e.f. 1-4-2000 for private (non-commercial) vehicles in NCR.
TABLE 4.1.9 : PHASED TIGHTENING OF EXHAUST EMISSION STANDARDS FOR INDIAN AUTOMOBILES
103

AIR AND TRANSPORT
Sl. No.
ODS 1998 1999 2000 2001 2002 2003 2004 2005 2006 2007 2008
1 2 3 4 5 6 7 8 9 10 11 12 13
1 CFC-11 6291.0 6057.0 5634.0 4514.0 3689.0 2609.0 2429.0 1543.4 785.1 424.8 117.6
2 CFC-12 13721.0 16442.0 14777.0 14164.0 13167.0 12373.0 10611.0 9702.2 6104.7 1869.9 549.6
3 CFC-113 -- 38.0 5.0 14.0 35.0 32.0 30.0 18.0 373.5 72.6 79.1
4 H-1211 -- - - - - - - - - - -
5 H-1301 -- - - - - - - - - - -
6 CTC 19225.0 20138.0 17509.0 16459.0 18957.0 18239.0 16631.0 17433.3 13877.8 9538.0 12035.7
7 MCF 11426 - - - - - - - - -8 HCFC-22 15412 14061 14868 14606 19216 25592.0 24789.2 30386.4 41213.6 45558.29 MBr - - 107 85 37914.0 - - - - - -
- - - -50663.0 58087.0 51986.0 50019.0 50454.0 52469.0 55293.0 53486.1 51527.6 53118.9 58340.2
ODS: Ozone Depleting Substances
(MT)Sl. No.
ODS 2000 2001 2002 2003 2004 2005 2006 2007 2008
1 2 3 4 5 6 7 8 9 10 11
1 CFC-11 3002.0 2196 1680.0 829 426 337.3 514.9 274.9 101.6
2 CFC-12 2612.0 2315 2210.0 1777 1808 1609 3017.9 723.6 109.7
CFC-113 - 5 29.0 4 10 14.3 - - 6.6
3 CTC 11043.0 8471 9510.0 9798 6781 1494.5 3636.8 634 1563.7
4 HCF-22 3583.0 2973 3207.0 3648 7228 8854.3 6137 14576.6 10831.7
5 HCF-123 20.0 25 25.0 0 60 15.3 - 27.2 101
6 HCF-141b 483.0 359 1401.0 952 1357 2155.9 - 4711.9 12588.9
7 MBr - 27 9510.0 - - - - - -
20743 16371 27572.0 17008 17670 14480.6 13306.5 20948.2 25303.2
ODS: Ozone Depleting Substances-
(MT)
TABLE 4.1.10 (a) : PRODUCTION OF OZONE DEPLETING SUBSTANCES IN INDIA
Source : Ozone cell, Ministry of Environment and Forests
Source : Ozone cell, Ministry of Environment and Forests
Total
Total
TABLE 4.1.10(b) TOTAL CONSUMPTION OF OZONE DEPLETING SUBSTANCES
104

ENERGY
Steam Diesel Gas
1 2 3 4 5 6 7 8 9
I Northern Region 12975.15 18877.50 14.99 3543.19 1288.27 1180.00 37879.101 Haryana 884.24 2202.50 3.92 0.00 62.70 0.00 3153.362 Himachal Pradesh 393.60 0.00 0.13 0.00 146.62 0.00 540.353 Jammu & Kashmir 330.00 0.00 8.94 175.00 111.83 0.00 625.774 Punjab 2319.82 2380.00 0.00 0.00 123.90 0.00 4823.725 Rajasthan 987.84 2545.00 0.00 443.80 30.25 0.00 4006.896 Uttar Pradesh 527.40 4380.00 0.00 0.00 25.10 0.00 4932.507 Uttaranchal 1248.25 0.00 0.00 0.00 82.62 0.00 1330.878 Chandigarh 0.00 0.00 2.00 0.00 0.00 0.00 2.009 Delhi 0.00 320.00 0.00 612.40 0.00 0.00 932.40
10 Central sector 5498.00 7050.00 0.00 2311.99 0.00 1180.00 16039.9911 Private sector 786.00 0.00 0.00 0.00 705.25 0.00 1491.25
II Western Region 7198.50 24252.50 17.48 6600.72 3130.94 1840.00 43040.141 Gujarat 772.00 4369.00 17.28 518.72 24.30 0.00 5701.302 Madhya Pradesh 1703.67 2657.50 0.00 0.00 51.76 0.00 4412.933 Chhatisgharh 120.00 1780.00 0.00 0.00 18.05 0.00 1918.054 Maharashtra 2638.83 6546.00 0.00 912.00 219.73 0.00 10316.565 Goa 0.00 0.00 0.00 0.00 0.05 0.00 0.056 Dadra & Nagar Haveli 0.00 0.00 0.00 0.00 0.00 0.00 0.007 Daman & Diu 0.00 0.00 0.00 0.00 0.00 0.00 0.008 Central sector 1520.00 5860.00 0.00 3512.00 0.00 1840.00 12732.009 Private sector 444.00 3040.00 0.20 1658.00 2817.05 0.00 7959.25
III Southern Region 10685.18 16682.50 949.29 3586.30 6351.24 1100.00 39354.511 Andhra Pradesh 3533.93 3342.50 0.00 272.30 185.96 0.00 7334.692 Karnataka 3288.20 1970.00 127.92 0.00 471.49 0.00 5857.613 Kerala 1769.10 0.00 234.60 0.00 100.12 0.00 2103.824 Tamil Nadu 2093.95 2970.00 0.00 431.00 110.20 0.00 5605.155 Lakshadweep 0.00 0.00 9.97 0.00 0.00 0.00 9.976 Puducherry 0.00 0.00 0.00 32.50 0.00 0.00 32.507 Central sector 0.00 7890.00 0.00 350.00 0.00 1100.00 9340.008 Private sector 0.00 510.00 576.80 2500.50 5483.47 0.00 9070.77
IV Eastern Region 3933.93 16146.38 77.25 190.00 208.96 0.00 20556.521 Bihar 0.00 540.00 0.00 0.00 50.40 0.00 590.402 Jharkhand 130.00 1260.00 0.00 0.00 4.05 0.00 1394.053 Orissa 2067.93 420.00 0.00 0.00 7.30 0.00 2495.234 West Bengal 1022.00 4275.00 12.06 100.00 99.50 0.00 5508.565 D.V.C. 0.00 0.00 0.00 90.00 0.00 0.00 0.007 Sikkim 0.00 0.00 5.00 0.00 39.11 0.00 44.116 A. & N. Islands 0.00 0.00 40.05 0.00 5.25 0.00 45.308 Central sector 714.00 8210.00 0.00 90.00 0.00 0.00 9014.009 Private sector 0.00 1441.38 20.14 0.00 3.35 1464.87
V North-Eastern Region 1116.00 90.00 142.74 736.00 146.00 0.00 2230.741 Assam 100.00 90.00 20.69 209.00 2.11 0.00 421.802 Manipur 0.00 0.00 45.41 0.00 5.45 0.00 50.863 Meghalaya 156.00 0.00 2.05 0.00 31.03 0.00 189.084 Nagaland 0.00 0.00 2.00 0.00 28.67 0.00 30.675 Tripura 0.00 0.00 4.85 127.50 16.01 0.00 148.366 Arunachal Pradesh 0.00 0.00 15.88 0.00 45.24 0.00 61.127 Mizoram 0.00 0.00 51.86 0.00 17.47 0.00 69.338 Central sector 860.00 0.00 0.00 375.00 0.00 0.00 1235.009 Private sector 0.00 0.00 0.00 24.50 0.02 24.52
35908.76 76048.88 1201.75 14656.21 11125.41 4120.00 143061.01
Source : Central Electricity Authority
TABLE 4.2.1 : INSTALLED CAPACITY OF POWER UTILITIES on 31st March, 2008
All-India
Sl. No.
State/Union Territory Hydro Thermal( Mega Watts)
TotalWind Nuclear
105

Electricity Generation **Parameter
1
Total (Utilities) 617510.40Public sector 563203.40Private sector 54307.00Source : Central Electricity Authority ** : in gigawatts-hours
ThermalHydro Coal $ Gas Diesal Nuclear RES Total
1 31.12.47 508 756 0 98 854 0 0 13622 31.12..50 560 1004 0 149 1153 0 0 17133 31.03.56 (End of the 1st Plan) 1061 1597 0 228 1825 0 0 28864 31.03.61 (End of the 2nd Plan) 1917 2436 0 300 2736 0 0 46535 31.03.66 (End of the 3rd Plan) 4124 4417 134 352 4903 0 0 90276 31.03.69 (End of the 3rd Annual Plans) 5907 6640 134 276 7050 0 0 129577 31.03.74(End of the 4th Plan) 6966 8652 165 241 9058 640 0 166648 31.03.79(End of the 5th Plan) 10833 14875 168 164 15207 640 0 266809 31.03.80 (End of the Annual Plan) 11384 15991 268 165 16424 640 0 2844810 31.03.85 (End of the 6th Plan) 14460 26311 542 177 27030 1095 0 4258511 31.03.90 (End of the 7th Plan) 18307 41236 2343 165 43764 1565 0 6363612 31.03.92(End of the 2nd Annual Plan) 19194 44791 3095 168 48054 1785 32 6906513 31.03.97(End of the 8th Plan) 21658 54154 6562 2947 61010 2225 902 8579514 31.03.02(End of the 9th Plan) 26269 62131 11163 1135 74429 2720 1628 10504615 31.03.03 (End of the 1st Year of 10th Plan) 26767 63951 11633 1178 76762 2720 1628 10787716 31.03.04(End of the 2nd Year of 10th Plan) 29507 64957 11840 1172 77969 2720 2488 11268417 31.03.05(End of the 3rd Year of 10th Plan) 30942 67791 11910 1202 80903 2770 3811 11842618 31.03.03 (End of the 4th Year of 10th Plan) 32326 68518 12690 1202 82410 3360 6191 12428719 31.03.07 (End of 10 Plan)* 34654 71121 13692 1202 86015 3900 7760 13232920 31.03.08 (End of 11th Plan) 35909 76049 14656 1202 91907 4120 11125 143061*
2006-07
58879.30
587416.10
50663.40642164.3562304.67
TABLE 4.2.2 (a) : GENERATING CAPACITY AND ELECTRICITY GENERATION
2
Total TherMal
2004-05 2005-064
704469.02
52007-08
Sr. No. As on
3
TABLE 4.2.2 (b) : GROWTH OF INSTALLED GENERATING CAPACITY IN INDIA
536752.70 603643.70
(Megawatt)
662523.00
20 31.03.08 (End of 11th Plan) 35909 76049 14656 1202 91907 4120 11125 143061*
Source: Central Electricity AuthorityRES: Renewable Energy Sources*: Provisional, $ : Includes Lignite
CHART 4.1 : ALL INDIA INSTALLED GENERATING CAPACITY (MW) AS ON 31.03.2008
Hydro25.10%
Coal $53.16%
Gas10.24%
Diesal0.84%
Nuclear2.88%
RES7.78%
Hydro Coal $
Gas Diesal
Nuclear RES
106

ENERGY
Requirement (MU)
Availability (MU)
Supply/ Deficit
Shortage
(MU) % 1 3 4 5 6
I. Northern Region 219797 196147 -23650 -10.81 Chandigarh 1446 1446 0 0.02 Delhi 22439 22301 -138 -0.63 Haryana 29353 25652 -3701 -12.64 Himachal Pradesh 5992 5814 -178 -3.05 Jammu & Kashmir 11782 8362 -3420 -29.06 Punjab 42372 38795 -3577 -8.4
7 Rajasthan 36738 35597 -1141 -3.18 Uttar Pradesh 62628 51335 -11293 -18.09 Uttaranchal 7047 6845 -202 -2.9
II. Western Region 247173 208228 -38945 -15.81 Chhatisgarh 14079 13409 -670 -4.82 Gujarat 68747 57614 -11133 -16.23 Madhya Pradesh 41560 35700 -5860 -14.14 Maharashtra 114885 93846 -21039 -18.35 Daman & Diu 1774 1580 -194 -10.96 Dadar Nagar Haveli 3388 3372 -16 -0.57 Goa 2740 2707 -33 -1.2
III. Southern Region 187743 187743 187743 187743.01 Andhra Pradeash 64139 61511 -2628 -4.12 Karnataka 40320 39230 -1090 -2.73 Kerala 15663 15284 -379 -2.44 Tamil Nadu 65780 63954 -1826 -2.85 Pondicherry 1841 1841 0 0.0
Lakshedweep# 24 24 0 0.00
IV. Eastern Region 75831 75831 75831 758311 Bihar 9155 7933 -1222 -13.32 D.V.C. 13387 13039 -348 -2.63 Jharkhand 5139 4458 -681 -13.34 Orissa 18846 18500 -346 -1.8
West Bengal 29020 27902 -1118 -3.9Sikkim 284 267 -17 -6.0A&N Island# 240 180 -60 -25.0
V. North-Eastern Region 8799 7713 -1086 -12.31 Arunachal Pradesh 391 302 -89 -22.82 Assam 4816 4412 -404 -8.43 Manipur 530 501 -29 -5.54 Meghalaya 1620 1232 -388 -24.05 Mizoram 288 246 -42 -14.66 Nagaland 377 334 -43 -11.47 Tripura 777 686 -91 -11.7
739343 666007 -73336 -9.9
Source : Central Electricity Authority
All India
MU : Million Units# : Lakshadweep and Andaman & Nicobar Islands are stand alone systems, power supply position of these does not form part of regional,requirement and availability
TABLE 4.2.3 : CUMULATIVE COMPARISON OF POWER SUPPLY POSITION Sl. No.
Region/ State/ System April 2007 to March 2008
2
107

ENERGY
Year Hydro Steam Diesel & Gas Nuclear Thermal* Total** @ Wind @ $
1 2 3 4 5 6 7 8 9
1 1980-81 46541.8 60713.8 61.5 522.0 3001.3 - 110840.42 1985-86 51020.6 112540.1 50.6 1756.9 4981.9 - 170350.13 1990-91 71641.3 178321.7 111.3 8113.2 6141.1 - 264328.64 1991-92 72757.1 197163.2 134.0 11450.0 5524.4 - 287028.75 1992-93 69869.2 211123.5 162.3 13480.4 6726.3 - 301361.76 1993-94 70462.7 233150.7 310.9 14727.6 5397.7 - 324049.67 1994-95 82712.0 243110.2 545.2 18474.8 5648.2 - 350490.48 1995-96 72759.2 273743.5 714.4 24858.4 7981.7 - 380057.29 1996-97 68900.8 289378.3 1554.3 26984.9 9071.1 - 395889.410 1997-98 74581.7 300730.5 1929.3 34423.2 10082.6 - 421747.311 1998-99 82690.0 308056.0 2136.0 43480.0 12015.0 353662.0 448367.012 1999-00 80637.0 377814.0 3989.0 49773.0 13267.0 386776.0 480680.013 2000-01 74481.0 357006.0 3822.0 48311.0 16928.0 408139.0 499548.014 2001-02 73579.9 370883.5 6402.7 47098.6 19474.6 424385.8 517439.215 2002-03 64014.0 389550.3 7052.4 52686.6 19390.0 449289.3 532693.316 2003-04 75242.5 407283.8 6867.0 57928.4 17780.0 472079.2 565101.717 2004-05 84495.3 424083.2 2518.7 59473.6 16845.3 486075.5 587416.118 2005-06 103057.3 435096.6 1987.7 60128.0 17238.9 497214.3 617510.419 2006-07 116368.9 461340.0 2488.8 63718.6 18606.8 527547.4 662523.020 2007-08 128702.1 486763.2 3297.3 68930.6 16776.9 558990.1 704469.0
Source: Monthly Generaation Report of Central Electricity Authority* : Including Coal, Lignite, Diesel & Gas based stations
$ : Includes generation from liquid fired Gas Turbine stations.
** : Includes imports from Bhutan
(in MU units)Sl. No.
TABLE 4.2.4 (a) : ANNUAL GROSS GENERATION OF POWER BY SOURCE
MU : Million Units
@' : CEA is not monitoring Captive Power Plants, Wind & Generation of small mini stations & micro Hydel stations and thermal stations of less than 25 MW capacity.
108

TABLE 4.2.4(b) : PLAN WISE GROWTH OF ELECTRICITY SECTOR IN INDIA
Sr. No. As on during financial year ending with Installed capacity (MW)
No. of Villages electrified
Length of T & D lines (Ckt. Kms)
Annual Per capita consumption $ (KWh)
1 2 3 4 5 61 31.12.47 1362 NA 23238 16.32 31.12.50 1713 3061 29271 18.23 31.03.56 (End of the 1st Plan) 2886 7294 85427 30.94 31.03.61 (End of the 2nd Plan) 4653 21754 157887 45.95 31.03.66 (End of the 3rd Plan) 9027 45148 541704 73.96 31.03.69 (End of the 3rd Annual Plans) 12957 73739 886301 97.97 31.03.74(End of the 4th Plan) 16664 156729 1518884 126.28 31.03.79(End of the 5th Plan) 26680 232770 2145919 171.69 31.03.80 (End of the Annual Plan) 28448 249799 2351609 172.410 31.03.85 (End of the 6th Plan) 42585 370332 3211956 228.711 31.03.90 (End of the 7th Plan) 63636 470838 4407501 329.212 31.03.92(End of the 2nd Annual PlanPlans) 69065 487170 4574200 347.513 31.03.97(End of the 8th Plan) 85795 498836 5151513 464.614 31.03.02(End of the 9th Plan) 105046 512153 6030148 559.215 31.03.03 (End of 1st year of the 10th Plan) 107877 492325 6551737 566.716 31.03.04 (End of 2st year of the 10th Plan) 112684 495031 6345421 592.017 31.03.05 (End of 3st year of the 10th Plan) 118426 439800 6570823 612.518 31.03.06 (End of 4st year of the 10th Plan) 124287 441347 6778359 631.419 31.03.07 (End of 10th Plan) 132329 482864 6939529 671.9
109
19 31.03.07 (End of 10th Plan) 132329 482864 6939529 671.920 31.03.08 (End of 11th Plan)* 146091 4873475# 7106078* 704.2*
Source : Central Eclectricity Authority# : As per revised definition of village electrification and 2001 Census.* Provisional N.A. : Not available.$ As per UN methodology (Gross Electrical Energy Availability/Population)
Chart 4.2 : Planwise Growth of Installed capacity in India
0
20000
40000
60000
80000
100000
120000
140000
160000
(Meg
awat
t)
Year
109

ENERGY
Total (as per 2001
Census)
Electrified Total (as per 2001
Census)
Electrified
1 3 4 5 6
I. Northern Region 1470 1470 196591 1713941 Haryana 106 106 6764 67642 Himachal Pradesh 57 57 17495 171833 Jammu & Kashmir 75 75 6417 63044 Punjab 157 157 12278 122785 Rajasthan 222 222 39753 271556 Uttar Pradesh 704 704 97942 863167 Uttaranchal 86 86 15761 152138 Chandigarh 1 1 23 239 Delhi 62 62 158 158
II. Western Region 1159 1159 131462 1238191 Gujarat 242 242 18066 179932 Madhya Pradesh 394 394 52117 502133 Chhatisgharh 97 97 19744 188774 Maharashtra 378 378 41095 362965 Goa 44 44 347 3476 Daman & Diu 2 2 23 237 Dadra & Nagar Haveli 2 2 70 70
III. Southern Region 1480 1480 70958 706031 Andhra Pradesh 210 210 26613 266132 Karnataka 270 270 27481 271263 Kerala 159 159 1364 13644 Tamil Nadu 832 832 15400 154005 Pondicherry 6 6 92 926 Lakshadweep 3 3 8 8
IV. Eastern Region 807 807 154794 934091 Bihar 130 130 39015 206202 Jharkhand 152 152 29354 91193 Orissa 138 138 47529 265354 West Bengal 375 375 37945 363805 A & N Islands 3 3 501 3306 Sikkim 9 9 450 425
V. North-Eastern Region 245 245 39927 292141 Assam 125 125 25124 197412 Manipur 33 33 2315 19663 Meghalaya 16 16 5782 34284 Nagaland 9 9 1278 8235 Tripura 23 23 858 4916 Arunachal Pradesh 17 17 3863 21957 Mizoram 22 22 707 570
5161 5161 593732 488439
Source : Central Electricity Authority
Total (All India)
2
TABLE 4.2.5 : NUMBER OF TOWNS AND VILLAGES ELECTRIFIED IN INDIA (As on 31.03.2008)
Sl. No.
Towns VillagesState/Union Territory
110

ENERGY
Sl. No.
States 1997-98 1998-99 1999-00 2000-01 2001-02 2002-03 2003-04 2004-05 2005-06 2006-07 2007-08 (P)
1 2 4 5 6 7 8 9 10 11 12 13 14
I. Coal 296.7 296.5 304.1 313.7 327.8 341.2 361.2 382.6 407.0 430.8 457.01 Andhra Pradesh 28.9 27.3 29.6 30.3 30.8 33.2 33.9 35.3 36.1 37.7 40.62 Assam 0.7 0.6 0.6 0.7 0.6 0.6 0.7 0.6 1.1 1.1 1.13 Chhatisgarh — — — 50.2 53.6 56.8 61.5 69.3 76.4 83.0 90.24 Jharkhand 81.0 76.2 76.5 75.4 76.8 78.6 79.5 78.0 85.4 88.8 90.95 Meghalaya - 4.2 4.1 4.1 5.1 4.4 5.4 5.3 5.6 5.8 6.56 Madhya Pradesh 84.4 84.9 87.9 42.5 44.2 45.7 49.8 52.5 55.6 60.0 67.8
7 Maharashtra 26.2 25.3 27.7 28.8 30.8 31.4 32.9 34.5 36.1 36.2 36.48 Orissa 42.0 43.5 43.6 44.8 47.8 52.2 60.1 66.6 70.5 81.2 89.59 Uttar Pradesh 15.7 15.6 16.2 16.9 16.5 17.8 15.8 16.8 15.7 12.2 11.4
10 West Bengal 17.5 18.8 18.0 20.1 21.4 20.5 21.5 23.6 24.5 24.9 22.5
II. Lignite 23.1 23.4 22.2 24.2 24.8 26.0 28.0 30.5 30.1 31.1 34.0
TABLE 4.2.6 : STATEWISE PRODUCTION OF COAL AND LIGNITE(Million tonnes)
II. Lignite 23.1 23.4 22.2 24.2 24.8 26.0 28.0 30.5 30.1 31.1 34.01 Gujarat 4.9 5.0 4.4 5.9 6.2 6.9 6.7 8.3 8.9 9.7 11.82 Rajasthan - 0.2 0.2 0.2 0.3 0.5 0.7 0.5 0.7 0.5 0.63 Tamilnadu 18.1 18.2 17.6 18.2 18.4 18.6 20.6 21.6 20.4 21.0 21.6
Source : Indian Bureau of Mines P: Provisional
111
ENERGY
( Tonnes)
Fully Mechanised Manual Mechanised
1 2 3 4 5 6
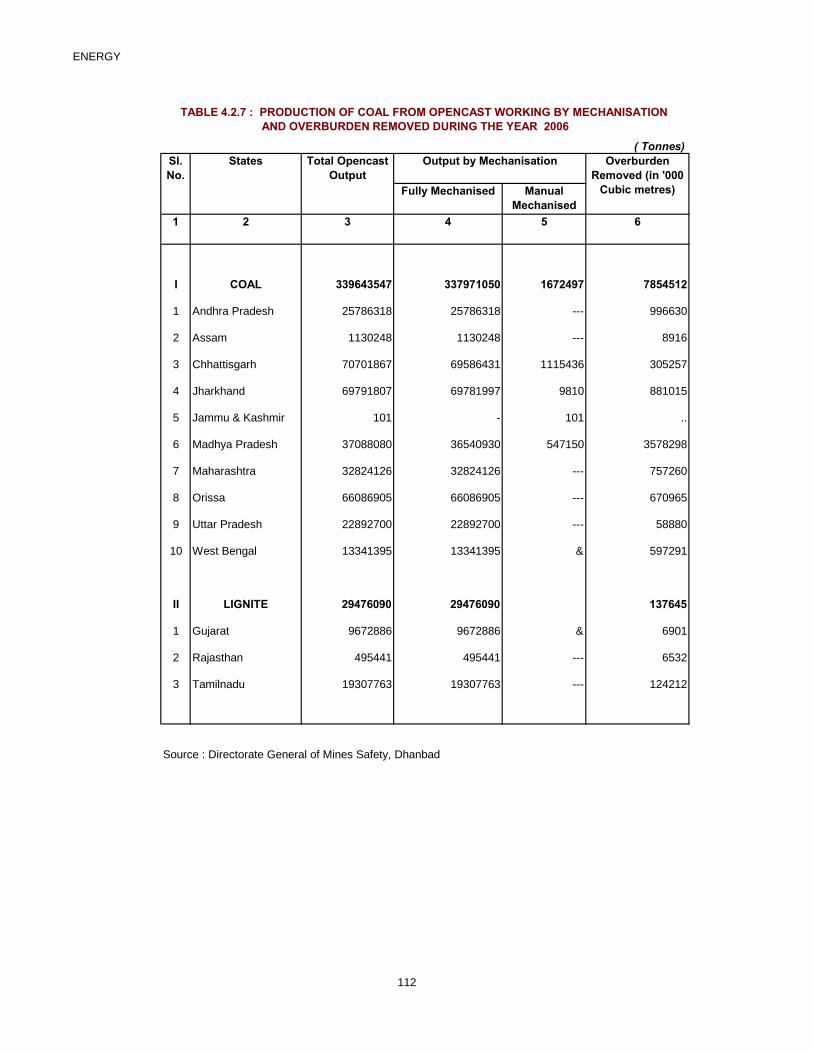
I COAL 339643547 337971050 1672497 7854512
1 Andhra Pradesh 25786318 25786318 --- 996630
2 Assam 1130248 1130248 --- 8916
3 Chhattisgarh 70701867 69586431 1115436 305257
4 Jharkhand 69791807 69781997 9810 881015
5 Jammu & Kashmir 101 - 101 ..
6 Madhya Pradesh 37088080 36540930 547150 3578298
7 Maharashtra 32824126 32824126 --- 757260
8 Orissa 66086905 66086905 --- 670965
9 Uttar Pradesh 22892700 22892700 --- 58880
10 West Bengal 13341395 13341395 … 597291
II LIGNITE 29476090 29476090 … 137645
1 Gujarat 9672886 9672886 … 6901
2 Rajasthan 495441 495441 --- 6532
3 Tamilnadu 19307763 19307763 --- 124212
Source : Directorate General of Mines Safety, Dhanbad
Output by Mechanisation Total Opencast Output
Overburden Removed (in '000
Cubic metres)
TABLE 4.2.7 : PRODUCTION OF COAL FROM OPENCAST WORKING BY MECHANISATION AND OVERBURDEN REMOVED DURING THE YEAR 2006
Sl. No.
States
112

ENERGY
Belowground Opencast Overall Belowground Opencast Overall1 2 3 4 5 6 7 8
I COAL 313 5080 1074 1.00 15.41 3.37
1 Andhra Pradesh 312 4278 685 1.03 13.13 2.24
2 Assam 113 1129 433 0.37 3.51 1.38
3 Chhattisgarh 480 11592 2215 1.46 35.11 6.71
4 Jharkhand 203 2565 697 0.67 8.07 2.22
5 Jammu & Kashmir 25 2 19 0.08 0.01 0.06
6 Madhya Pradesh 504 5976 1114 1.57 18.45 3.47
7 Maharashtra 385 4737 1282 1.16 14.44 3.82
8 Orissa 452 10384 4155 1.46 29.43 12.41
9 Uttar Pradesh - 6172 3698 - 19.42 11.61
10 West Bengal 218 3180 340 0.69 9.76 1.07
-
II LIGNITE --- 3270 2350 … 10.17 7.34
1 Gujarat --- 10390 5687 --- 36.17 19.76
2 Rajasthan --- 3058 1808 --- 10.04 5.54
3 Tamil Nadu --- 2438 1827 --- 7.48 5.62
.
Source : Directorate General of Mines Safety, Dhanbad
State
TABLE 4.2.8 : PRODUCTIVITY IN COAL MINES IN THE YEAR 2006(Tonnes)
Sl. No.
Output Per Man Year Output Per Manshift
113

ENERGY
Sl No. State As on Proved Indicated Inferred Total
1 2 3 4 5 6 7
1 Andhra Pradesh (Gondawana) 1-1-2003 7944 6122 2518 165841-1-2004 8091 6092 2514 166971-1-2005 8263 6079 2584 169261-1-2006 8403 6158 2585 171461-4-2007 8791 6266 2658 177141-4-2008 9007 6711 2979 18697
2 Arunachal Pradesh (Tertiary) 1-1-2003 31 40 19 901-1-2004 31 40 19 901-1-2005 31 40 19 901-1-2006 31 40 19 901-4-2007 31 40 19 901-4-2008 31 40 19 90
3 Assam (Tertiary) 1-1-2003 279 27 34 3401-1-2004 279 27 34 3401-1-2005 279 24 34 3371-1-2006 315 24 34 3731-4-2007 315 24 34 3731-4-2008 315 24 34 373
Assam (Gondawana) 1-1-2005 0 3 0 31-1-2006 0 3 0 31-1-2007 0 3 0 31-4-2008 0 3 0 3
4 Jharkhand (Gondawana) 1-1-2003 35266 29552 6326 711441-1-2004 35305 30211 6348 718641-1-2005 35417 30438 6348 722041-1-2006 36148 31411 6338 738971-4-2007 36960 31094 6338 743921-4-2008 37493 31629 6338 75460
5 Bihar (Gondawana) 1-1-2003 0 0 160 1601-1-2004 0 0 160 1601-1-2005 0 0 160 1601-1-2006 0 0 160 1601-4-2007 0 0 160 1601-4-2008 0 0 160 160
6 Madhya Pradesh (Gondawana) 1-1-2003 7100 7888 3217 182051-1-2004 7503 8233 2924 186601-1-2005 7513 8815 2904 192321-1-2006 7566 9258 2934 197581-4-2007 7842 9723 2782 203461-8-2008 7896 9882 2782 20560
7 Chhatisgarh (Gondawana) 1-1-2003 8561 25410 4165 381351-1-2004 8771 26419 4355 395451-1-2005 9373 26191 4411 399751-1-2006 9570 27433 4439 414421-1-2007 9973 27035 4443 414501-8-2008 10419 29272 4443 44134
8 Maharashtra (Gondawana) 1-1-2003 4508 2151 1534 81941-1-2004 4652 2156 1605 84131-1-2005 4652 2309 1620 85811-1-2006 4652 2432 1992 90761-1-2007 4856 2822 1992 96701-8-2008 5004 2822 1992 9818
114
(Million tonnes)TABLE 4.2.9 : STATEWISE INVENTORY OF GEOLOGICAL RESERVES OF COAL

ENERGY
9 Meghalaya (Tertiary) 1-1-2003 118 41 301 4591-1-2004 118 41 301 4601-1-2005 118 41 301 4591-1-2006 118 41 301 4601-4-2007 118 41 301 4591-4-2008 89 70 301 459
10 Nagaland (Tertiary) 1-1-2003 3 1 15 201-1-2004 4 1 15 201-1-2005 4 1 15 201-1-2006 4 1 15 201-4-2007 3 1 15 201-4-2008 3 1 15 20
11 Orissa (Gondawana) 1-1-2003 14301 29516 15285 591031-1-2004 14613 31239 15135 609871-1-2005 15161 30976 14846 609831-1-2006 16911 30793 14297 620011-1-2007 17465 31455 14314 632341-4-2008 19222 31728 14314 65263
Sikkim (Gondawana) 1/4/2007 0 55 18 731-4-2008 0 58 43 101
12 Uttar Pradesh (Gondawana) 1-1-2003 766 296 0 10621-1-2004 766 296 0 10621-1-2005 766 296 0 10621-1-2006 766 296 0 10621-4-2007 766 296 0 10621-4-2008 766 296 0 1062
13 West Bengal (Gondawana) 1-1-2003 11207 11570 1062 238391-1-2004 11383 11523 4488 273941-1-2005 11383 11876 4553 278131-1-2006 11383 11879 4553 278151-4-2007 11454 11810 5071 283351-4-2008 11584 11680 5071 28335
Tertiary Coalfields 1-1-2005 432 106 369 9071-1-2006 468 106 369 9431-4-2007 467 106 369 9421-4-2008 438 135 369 9421-1-2003 90085 112613 38050 2407481-1-2004 91516 116281 37901 2456921-1-2005 92960 117090 37796 2478471-1-2006 95867 119769 37667 2533031-4-2007 98573 120665 38144 2573821-4-2008 101829 124216 38490 264535
Source : Gelogical Survey of IndiaNote: (i) Data may not add up to respective total due to rounding off.
115
India (Total)
(ii ) Singrimari coalfield of Assam (Non- coking) is included in Gondawana coalfield, not considered in Gondawana coalfield, not considered in Tertiary coalfields.

ENERGY
Sl. No
As on Proved Indicated Inferred Total
1 3 4 5 6 7
11-1-2003 4614 699 0 53131-1-2004 4614 699 0 53131-1-2005 4614 699 0 53131-1-2006 4614 699 0 53131-4-2007 4614 699 0 53131-4-2008 4614 699 0 53131-1-2003 11325 11839 1889 250531-1-2004 11325 11839 1889 250531-1-2005 11417 11765 1889 250701-1-2006 11445 11751 1881 250771-4-2007 11853 11601 1880 253341-4-2008 12308 12136 1880 263241-1-2003 482 907 222 16101-1-2004 482 1003 222 17071-1-2005 482 1003 222 17071-1-2006 482 1003 222 17071-4-2007 482 1003 222 17071-4-2008 482 1003 222 1707
2 1-1-2003 73664 99168 35940 2087721-1-2004 75096 102736 35787 2136191-1-2005 76447 103623 35686 2157561-1-2006 78858 106210 35195 2202631-4-2007 81624 107362 36042 2250271-4-2008 84425 110378 36388 2311911-1-2003 90085 112613 38050 2407481-1-2004 91517 116277 37898 245692
Coking
2
Types of Coal
Non-coking (Including High Sulphur)
Total
TABLE 4.2.10 : INVENTORY OF GEOLOGICAL RESERVES OF COAL BY TYPE
(Million tonnes)
III. Blendable/semi-coking
II. Medium coking
I. Prime coking
1-1-2004 91517 116277 37898 2456921-1-2005 92960 117090 37797 2478471-1-2006 95399 119663 37298 2523601-4-2007 * 98573 120665 38144 2573821-4-2008* 101829 124216 38490 264535
Source : Office of the Coal Controller, Kolkata* Including Sikkim
Sl. No1 Biogas Plants2 Improved Chulhas3 Wind4 Small Hydro5 Biomas 6 Biomass Gasifiers7 Solar PV8 Waste -to -Energy9 Solar Water Heating
Source: Ministry of Non-Conventional Energy Sources
15000 MW
1200 lakh W
140 Million sq.m Collector Area.
120 lakh W
2500 MW20 MW/sq.km
45000 MW
--19500 MW
Total
TABLE 4.2.11 : ESTIMATED POTENTIAL FOR RENEWABLE ENERGY TECHNOLOGIES IN INDIA
Approximate PotentialSource/Systems
116

ENERGY
2001-02 2002-03 2003-04 2004-05 2005-06 2006-07 2007-081 2 3 4 5 6 7 8 9
1 Andhra Pradesh 0.7 0.0 6.2 21.8 0.5 0.8 0.02 Gujarat 0.0 6.2 28.9 51.5 84.6 284.0 238.23 Karnataka 24.0 55.6 84.9 201.5 143.8 266.0 96.14 Kerala 0.0 0.0 0.0 0.0 0.0 0.0 0.05 Madhya Pradesh 0.0 0.0 0.0 6.3 11.4 16.4 13.06 Maharashtra 209.4 2.0 6.2 48.8 545.1 485.3 158.67 Rajasthan 8.8 44.6 117.8 106.3 73.3 111.8 25.98 Tamil Nadu 44.0 133.6 371.2 675.5 857.6 577.9 218.89 Others 0.0 0.0 0.0 0.0 0.0 0.0 0.0
287.5 242.0 615.2 1111.7 1716.2 1742.1 750.6Source : Ministry of New And Renewable Energy
No. Sources / Systems1 I. Power From RenewablesA.1 Bio Power (Agro residues)2 Wind Power3 Small Hydro Power (up to 25 MW)
4 Cogeneration-bagasse
5 Waste to EnergySub Total (in MW) (A)
B Distributed renewable power6 Solar Power7 Biomass Power / Cogen.(non-bagasse) 8 Biomass Gasifier9 Waste-to- Energy
Sub Total (B)Total ( A + B )
II Remote Village ElectrificationIII Decentralised Energy Systems12 Solar Thermal Programme
i. Solar Water Heating Systems ii. Solar Cookers
13 Wind Pumps14 Aero-generator /Hybrid Systems 15 Solar Photovoltaic PumpsIV Other Programmes16 Energy Parks17 Akshay Urja Shops18 Battery Operated Vehicle
Source:
Note: MWe = Megawatt equivalent; MW = Megawatt; kW = kilowatt; kWp = kilowatt peak; sq. m. = square meter
493 nos. 104 nos. 255 nos.
572 kW
Estimated Potential
A. Grid-interactive renewable power
1905.00 MW602.00 MW40.95 MW9372.95 MW
7068 nos.
34.30 MW 75.85 MW 11.03 MW124.10 MW9497.05 MW2501 villages + 830 hamlets
1.66 million sq.m. collector 6.03 lakh1141 nos.
2.92 MW
-
-
---
---
--
Cumulative Achivements
510.00 MW 6315.00 MW
-
---
15,0003 MWe5,0004 MWe 2,7005 MWe84,7766 MWe
-
45,1952 MWe
TABLE 4.2.12 (a) : STATE-WISE WIND POWER INSTALLED CAPACITY(MW)
Sl No. State Wind Power Installed Capacity (Mw)
4. With new sugar mills and modernization of existing ones, technically feasible 5. Technically feasible municipal waste-to energy potential is assessed at 2700 6. Not all of this renewable energy potential may be suitable for grid-interactive
1. Although the potential is based on surplus agro-residues, in practice biomass 2. Potential based on areas having wind power density (wpd) greater than 200
Total
Annual Report 2006-07, Ministry of New and Renewable Energy
Table 4.2.12(b) : Estimated potential and cumulative achievements as on 31.1.2007
3. Technically feasible hydro potential of all sites upto 25 MW station capacity, all
16,8811 Mwe
117

ENERGY
(AS ON 31.12.2006)Sr. No State
1 Andhra Pradesh 301.252 Chattisgarh 88.523 Gujarat 50.004 Haryana 6.005 Karnataka 254.286 Madhya Pradesh 1.007 Maharashtra 52.008 Punjab 28.009 Rajasthan 23.30
10 Tamil Nadu 215.5011 Uttar Pradesh 121.50
Total 1101.83Source: Ministry of New and Renewable Energy
Sr. No States
No.sCapacity
(MW) NoCapacity
(MW)1 Andhra Pradesh 58 179.10 11 17.502 Arunachal Pradesh 68 45.24 56 41.823 Assam 3 2.11 4 15.004 Bihar 7 50.40 9 7.605 Chhattisgarh 5 18.05 1 1.006 Goa 1 0.05 - -7 Gujarat 2 7.00 - -8 Haryana 5 62.70 1 6.009 Himachal Pradesh 62 146.62 16 71.7510 Jammu & Kashmir 32 111.83 5 5.9111 Jharkhand 6 4.05 8 34.8512 Karnataka 72 464.00 17 92.0013 Kerala 16 98.12 5 39.5514 Madhya Pradesh 9 51.16 5 39.9015 Maharashtra 29 211.33 5 31.3016 Manipur 8 5.45 3 2.7517 Meghalaya 4 31.03 3 1.7018 Mizoram 16 17.47 3 15.5019 Nagaland 10 28.67 4 4.2020 Orissa 6 7.30 8 60.9321 Punjab 29 123.90 - -22 Rajasthan 10 23.85 - -23 Sikkim 14 39.11 4 13.2024 Tamil Nadu 14 89.70 4 13.0025 Tripura 3 16.01 - -26 Uttar Pradesh 9 25.10 -27 Utrakhand 89 82.62 37 74.1528 West Bengal 23 98.40 16 79.2529 Andaman and Nicobar Islands 1 5.25 - -
Total 611 2045.61 225 668.86Source: Ministry of New And Renewable Energy
TABLE 4.2.12 (c) : STATEWISE GRID-INERACTIVE BIOMASS POWER INSTALLED CAPACITY
Projects set-up Project under Implementation
Cumulative Installed Capacity (MW)
TABLE 4.2.12 (d) : State wise Details of Small Hydro Power Projects (upto 25 MW) Setup & Under Implementation (as on 31.12.2007)
118
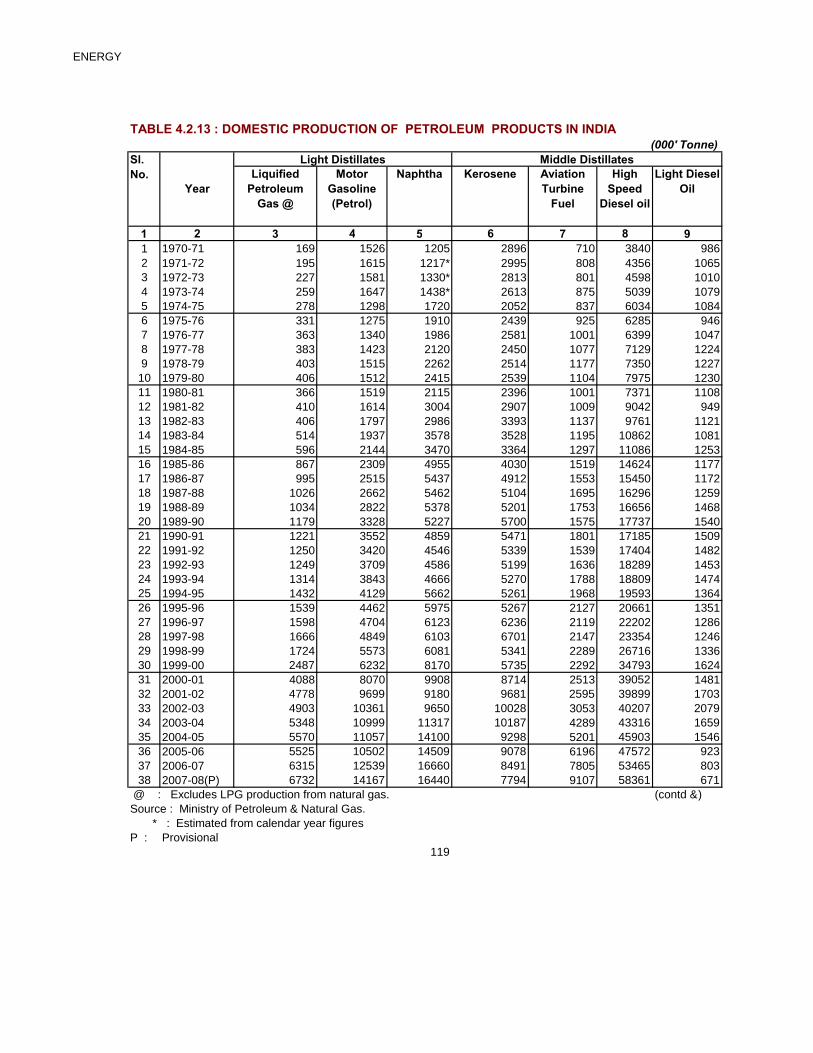
ENERGY
Liquified Petroleum
Gas @
Motor Gasoline (Petrol)
Naphtha Kerosene Aviation Turbine
Fuel
High Speed
Diesel oil
Light Diesel Oil
1 2 3 4 5 6 7 8 91 1970-71 169 1526 1205 2896 710 3840 9862 1971-72 195 1615 1217* 2995 808 4356 10653 1972-73 227 1581 1330* 2813 801 4598 10104 1973-74 259 1647 1438* 2613 875 5039 10795 1974-75 278 1298 1720 2052 837 6034 10846 1975-76 331 1275 1910 2439 925 6285 9467 1976-77 363 1340 1986 2581 1001 6399 10478 1977-78 383 1423 2120 2450 1077 7129 12249 1978-79 403 1515 2262 2514 1177 7350 122710 1979-80 406 1512 2415 2539 1104 7975 123011 1980-81 366 1519 2115 2396 1001 7371 110812 1981-82 410 1614 3004 2907 1009 9042 94913 1982-83 406 1797 2986 3393 1137 9761 112114 1983-84 514 1937 3578 3528 1195 10862 108115 1984-85 596 2144 3470 3364 1297 11086 125316 1985-86 867 2309 4955 4030 1519 14624 117717 1986-87 995 2515 5437 4912 1553 15450 117218 1987-88 1026 2662 5462 5104 1695 16296 125919 1988-89 1034 2822 5378 5201 1753 16656 146820 1989-90 1179 3328 5227 5700 1575 17737 154021 1990-91 1221 3552 4859 5471 1801 17185 150922 1991-92 1250 3420 4546 5339 1539 17404 148223 1992-93 1249 3709 4586 5199 1636 18289 145324 1993-94 1314 3843 4666 5270 1788 18809 147425 1994-95 1432 4129 5662 5261 1968 19593 136426 1995-96 1539 4462 5975 5267 2127 20661 135127 1996-97 1598 4704 6123 6236 2119 22202 128628 1997-98 1666 4849 6103 6701 2147 23354 124629 1998-99 1724 5573 6081 5341 2289 26716 133630 1999-00 2487 6232 8170 5735 2292 34793 162431 2000-01 4088 8070 9908 8714 2513 39052 148132 2001-02 4778 9699 9180 9681 2595 39899 170333 2002-03 4903 10361 9650 10028 3053 40207 207934 2003-04 5348 10999 11317 10187 4289 43316 165935 2004-05 5570 11057 14100 9298 5201 45903 154636 2005-06 5525 10502 14509 9078 6196 47572 92337 2006-07 6315 12539 16660 8491 7805 53465 80338 2007-08(P) 6732 14167 16440 7794 9107 58361 671
@ : Excludes LPG production from natural gas. (contd…)Source : Ministry of Petroleum & Natural Gas. * : Estimated from calendar year figuresP : Provisional
119
Middle Distillates(000' Tonne)
Light Distillates
TABLE 4.2.13 : DOMESTIC PRODUCTION OF PETROLEUM PRODUCTS IN INDIA
Sl. No.
Year

ENERGY
Total
Fuel Oil Lubricants Petroleum Coke
Bitumen
1 10 11 12 13 14 15
1 1970-71 4090 231 151 805 501 171102 1971-72 4098 140 142 1009 999 186393 1972-73 3688 304 132 1109 267 178604 1973-74 3931 318 131 1093 1072 194955 1974-75 4243 387 137 873 668 196116 1975-76 5083 342 160 697 436 208297 1976-77 4728 368 163 945 511 214328 1977-78 5332 413 155 992 521 232199 1978-79 5644 490 122 962 527 2419310 1979-80 6351 487 99 1103 573 2579411 1980-81 6120 426 86 1082 533 2412312 1981-82 6908 407 141 1298 493 2818213 1982-83 7964 434 149 1397 528 3107314 1983-84 8000 470 136 1069 556 3292615 1984-85 7886 414 181 944 601 3323616 1985-86 7955 501 192 1107 645 3988117 1986-87 8011 491 264 1224 737 4276118 1987-88 8466 478 257 1370 653 4472819 1988-89 8171 497 275 1548 896 4569920 1989-90 8952 547 275 1671 959 4869021 1990-91 9429 561 229 1603 1142 4856222 1991-92 9637 390 216 1710 1416 4834923 1992-93 10403 533 221 1862 1219 5035924 1993-94 10304 489 233 1874 1020 5108425 1994-95 9822 504 259 1845 1088 5292726 1995-96 9579 633 256 2032 1199 5508127 1996-97 10298 619 246 2283 1291 5900528 1997-98 11080 593 282 2158 1129 6130829 1998-99 11030 586 286 2419 1163 6454430 1999-00 11352 728 465 2485 3048 7941131 2000-01 11392 684 2473 2721 4518 9561432 2001-02 12227 651 2784 2561 4246 10000433 2002-03 12167 684 2659 2941 5408 10414034 2003-04 13372 666 2743 3397 6170 11346335 2004-05 14970 646 3162 3349 3777 11857936 2005-06 14305 677 3182 3576 3705 11975037 15697 825 3779 3891 4990 13526038 15804 881 4129 4507 6337 144930
Source : Ministry of Petroleum & Natural Gas. * : Estimated from calendar year figures ** : Includes those of light distillates, middle distillates and heavy ends. P : Provisional
120
2007-08 (P)
Others**
2006-07
2
Sl. No.
TABLE 4.2.13 : DOMESTIC PRODUCTION OF PETROLEUM PRODUCTS IN INDIA - Concld.
Year
Heavy Ends(000' Tonne)

ENERGY
YearProduction Net Imports Gross
AvailabilityProduction@
1 2 3 4 5 6
1 1970-71 6822 11683 18505 17110 752 178622 1971-72 7299 12951 20250 18639 2011 20650
3 1972-73 7321 12084 19405 17830 3399 21229
4 1973-74 7189 13855 21044 19495 3387 22882
5 1974-75 7684 14016 21700 19603 2473 22076
6 1975-76 8448 13624 22072 20829 2048 22877
7 1976-77 8898 14048 22946 21432 2550 23982
8 1977-78 10763 14507 25270 23219 2832 26051
9 1978-79 11633 14657 26290 24193 3834 28027
10 1979-80 11766 16121 27887 25794 4636 30430
11 1980-81 10507 16248 26755 24123 7253 31376
12 1981-82 16194 14460 30654 28182 4829 33011
13 1982-83 21063 12397 33460 31073 4233 35306
14 1983-84 26020 10445 36465 32926 2856 35782
15 1984-85 28990 7164 36154 33236 5159 38395
16 1985-86 30168 14616 44784 39881 1902 41783
17 1986-87 30480 15476 45956 42761 556 43317
18 1987-88 30357 17734 48091 44728 739 45467
19 1988-89 32040 17815 49855 45699 4200 49899
20 1989-90 34087 19490 53577 48690 3971 52661
21 1990-91 32160 20699 52859 48562 6012 54574
22 1991-92 30345 23994 54339 48349 6509 54858
23 1992-93 26950 29247 56197 50359 7564 57923
24 1993-94 27026 30822 57848 51084 8042 59126
25 1994-95 32494 27349 59843 52927 10697
10697 63624
26 1995-96 35168 27342 62510 55081 16900 71981
27 1996-97 32900 33906 66806 59005 17103 76108
28 1997-98 33858 34493 68351 61308 20589 81897
29 1998-99 32722 39808 72530 64544 23052 87596
30 1999-00 31949 57805 89754 79411 15862 95273
31 2000-01 32426 74097 106523 95614 902 9651632 2001-02 32032 78706 110738 100004 -3056 9694833 2002-03 33044 81989 115033 104140 -3061 10107934 2003-04 33373 90434 123807 113463 -6619 10684435 2004-05 33981 95861 129842 118579 -9383 10919636 2005-06 32190 99409 131599 119750 -9830 10992037 2006-07 33988 11502 145490 135260 -15964 11929638 2007-08(p) 34118 121673 155791 144930 -16612 128318
Source : Ministry of Petroleum & Natural Gas. P : Provisional '@ :Excludes LPG production from natural gas.
TABLE 4.2.14: AVAILABILITY OF CRUDE OIL AND PETROLEUM PRODUCTS IN INDIA
Crude Oil(000' Tonne)
7
Gross Availability
8
Sl. No. Net Imports
Petroleum Products
121

ENERGY
Sl. No.Year
Gross Production Re-injected Flarred Net Production (Utilisation)
1 2 3 4 5 6
1 1970-71 1445 36 744 6672 1971-72 1535 49 768 7183 1972-73 1565 141 653 7714 1973-74 1713 115 836 7625 1974-75 2041 139 951 9516 1975-76 2368 160 1084 11247 1976-77 2428 190 857 13818 1977-78 2839 184 1191 14649 1978-79 2812 148 953 171110 1979-80 2767 127 964 167611 1980-81 2358 43 793 152212 1981-82 3851 110 1519 222213 1982-83 4936 91 1888 295714 1983-84 5961 45 2515 340115 1984-85 7241 48 3052 414116 1985-86 8134 66 3118 495017 1986-87 9853 63 2715 707518 1987-88 11467 54 3445 796819 1988-89 13217 84 3883 925020 1989-90 16988 96 5720 1117221 1990-91 17998 102 5131 1276522 1991-92 18644 132 4072 1441023 1992-93 18061 90 1854 1611724 1993-94 18336 71 1924 1634125 1994-95 19468 23 2108 1733726 1995-96 22642 0 1710 2093227 1996-97 23256 0 1932 2135428 1997-98 26401 0 1856 2454529 1998-99 27428 0 1722 2570630 1999-00 28446 0 1561 2688631 2000-01 29477 0 1617 2786032 2001-02 29714 0 1677 2803733 2002-03 31389 0 1426 2996334 2003-04 31962 0 1056 3090635 2004-05 31763 0 988 3077536 2005-06 32202 0 877 3132537 2006-07 31747 0 956 3079138 2007-08 (P) 32402 0 924 31478
Source : Ministry of Petroleum & Natural Gas. P : Provisional
TABLE 4.2.15 : GROSS AND NET PRODUCTION & UTILISATION OF NATURAL GAS IN INDIA
(Million cubic metre)
122

ENERGY
Power Generation
Industrial Fuel
Tea Plantation
Others Fertilizer Industry
Others
1 2 3 4 5 6 7 8 9
1 1970-71 261 116 15 68 187 - 6472 1971-72 313 129 19 61 196 - 7183 1972-73 339 148 20 63 201 - 7714 1973-74 323 157 22 81 179 - 7625 1974-75 354 164 29 86 318 - 9516 1975-76 368 143 33 117 463 2 11267 1976-77 344 155 38 157 663 24 13818 1977-78 372 165 39 184 673 31 14649 1978-79 560 175 43 189 721 23 1711
10 1979-80 514 158 39 190 755 25 168111 1980-81 492 163 45 190 611 21 152212 1981-82 612 166 47 379 991 27 222213 1982-83 1025 185 51 513 1155 28 295714 1983-84 1209 230 58 588 1283 33 340115 1984-85 1454 250 62 739 1603 33 414116 1985-86 1299 223 78 816 2500 34 495017 1986-87 2041 257 96 1320 3335 26 707518 1987-88 2721 281 99 1347 3490 30 796819 1988-89 1823 526 87 1371 5334 109 925020 1989-90 2140 695 78 1567 6578 114 1117221 1990-91 3634 827 89 1825 5612 779 1276622 1991-92 4774 766 108 2237 5509 1048 1444223 1992-93 4967 1450 105 2103 6672 819 1611624 1993-94 4785 1794 121 2466 6499 675 1634025 1994-95 5229 1927 134 2420 6936 691 1733726 1995-96 $ 6836 2301 111 767 7602 474 1809127 1996-97 $ 6935 2631 130 802 7625 509 1863228 1997-98 $ 8114 3106 117 775 8752 649 2151329 1998-99 $ 8714 3005 147 1104 8869 650 2248930 1999-00 8829 2329 140 5126 8592 1869 2688531 2000-01 8801 2870 151 5377 8480 2181 2786032 2001-02 9214 2979 147 5894 7957 1846 2803733 2002-03 10510 2939 119 6199 7955 2242 2996434 2003-04 11478 3099 142 6221 7889 2077 3090635 2004-05 12099 3569 142 5518 8173 1274 30775
36 2005-06 11878 3780 151 6243 7762 1211 3102537 2006-07 11963 3205 170 5517 8497 2016 3136838 2007-08(P) 12037 3324 160 6915 9822 2070 34328
Source : Ministry of Petroleum & Natural Gas. $ : Includes petro-chemicals.
Non-Energy Purposes Grand Total
TABLE 4.2.16 : INDUSTRY-WISE OFF-TAKE OF NATURAL GAS IN INDIA.
YearSl No.
Energy Purposes(Million Cubic Metre)
123

ENERGY
Project Status
MW Nos MW Nos MW Nos
1 2 3 4 5 6 7 8
1 Commissioned 290 52 437 57 727 109
2 Under implementation 284 41 323 35 607 76
Source :Ministry of New and Renewable Energy
BIOMASS POWER PROJECTS (as on 30-06.2007)
S.No Source /System1 Power from renewablesA Grid-interactive renewable power1 Solar photovoltaic power2 Wind power3 Small hydro power (up to 25 MW)4 Biomass power5 Bagasse cogeneration6 Energy recovery from waste (MW)
Sub total (A)B Distributed renewable power7 Biomass/cogenentation (non-bagasse)8 Biomass gasifier9 Energy recovery from waste
Sub total (B)Total (A+B)
II II Remote village electrification III Decentralized energy systems10 Family-type biogas plants11 Solar photovoltaic programme
i. Solar street lighting system ii. Home lighting system iii. Solar lantern iv. Solar power plants
12 Solar thermal programme i. Solar water heating systems ii. Solar cookers
13 Wind pumps14 Aero generator/hybrid systems15 Solar photovoltaic pumpsIV Other programmes16 Energy parks17 Akshay Urja shops18 Battery operated vehicles19 Research, design, and development 20 Renewable energy clubs21 District Advisory Committees
MW - megawatt MWp - megawatt peak;kW - kilowatt; m2 - square metre; km2 - kilometre square
TABLE 4.2.17 : THE STATUS OF BIOMASS PROJECTS
165 nos 256 nos
600 projects 521 nos 560 nos
TABLE 4.2.18 : STATEWISE AND YEARWISE COMPOSITION OF COMMISSIONED
6.17 lakh 1180 nos
565 658 nos
608.27 kW 7068 nos
494 nos
Source: Akshay Urja, July-August 2007, Ministry of New and Renewable Energy
1867.80 kWp
1.95 million m2 collector
19.76152.09
10619.453651 villages/hamlets
38.90 lakh
61 321 nos 313 859 nos
140 million m2 collector
(MW)
45.886.53
634.8343.45
10 467.36(MW)
120 lakh 20 MW/km2
-
-
84776
--
-----
Total
Estimated potential
(MW)
1688150002700
542.8
45195-
15000
Sl. No. CogenerationBiomass Power
2.127230.992013.17
Achivement
124

ENERGY
1 2 3 4 5 61 Andhra Pradesh 1065000 400857 18000 90852 Arunachal Pradesh 7500 2210 150 -3 Assam 307000 58667 50 -4 Bihar 733000 124935 100 -5 Goa 8000 3707 75 166 Gujarat 554000 378846 8000 40107 Haryana 300000 49190 1000 8178 Himachal Pradesh 125000 44866 150 1379 Jammu & Kashmir 128000 2122 110 -10 Karnataka 680000 393236 4000 150411 Kerala 150000 108313 4500 217912 Madhya Pradesh 1491000 247566 15000 451913 Maharashtra 897000 719084 13000 749314 Manipur 38000 2128 100 -15 Meghalaya 24000 4226 200 6016 Mizoram 5000 3470 100 5017 Nagaland 6700 2617 200 -18 Orissa 605000 224373 4000 127319 Punjab 411000 80856 1500 137020 Rajasthan 915000 66941 25 -21 Sikkim 7300 5574 200 15522 Tamil Nadu 615000 210616 1500 72723 Tripura 28000 2442 300 -24 Uttar Pradesh 1938000 407966 4000 225925 West Bengal 695000 263587 8500 7560
Union Territory26 Andaman and Nicobar Islands 2200 137 - -27 Chandigarh 1400 97 - -28 Dadra and Nagar Haveli 2000 169 - -29 Delhi 12900 677 - -30 Pondicherry 4300 573 - -31 Chhattisgarh 400000 18645 1500 140632 Jharkhand 100000 2083 200 -33 Uttaranchal 83000 6603 400 25534 KVIC and others - - 15000 7922
Total 12339000 3837379 101860 52797
Source : Annual Report 2006-07, Minisitry of New and Renewable EnergyKVIC : Khadi and Village Industries Commission
TABLE 4.2.19 : DISTRIBUTION OF FAMILY -TYPE BIOGAS PLANTS (NUMBER OF INSTALLATIONS)
Sl. No. State/UT Estimated Potential
Cumulative Achievemen
t as on (31-03-2006)
Target (2006-07)
Achievement till
( 31.01.2007)
125

ENERGY
District Level State Level1 Andhra Pradesh 30 12 Arunachal Pradesh 6 13 Assam 15 14 Bihar 5 -
5 Chhattisgarh 11 16 Delhi 9 17 Goa 2 -8 Gujarat 14 19 Haryana 22 1
10 Himachal Pradesh 12 -11 Jammu & Kashmir 7 112 Jharkhand 15 113 Karnataka 26 114 Kerala 16 115 Madhya Pradesh 23 -16 Maharashtra 52 117 Manipur 10 -18 Meghalaya 7 119 Mizoram 7 120 Nagaland 6 121 Orissa 9 122 Punjab 19 123 Rajasthan 12 -24 Sikkim 5 -25 Tamil Nadu 45 126 Tripura 10 127 Uttar Pradesh 52 128 Uttarakhand 11 129 West Bengal 8 130 A&N Islands 8 131 Chandigarh 3 132 Pondicherry 2 1
Total 476 25
Source : Annual Report 2007, Ministry of New and Renewable Energy
Table 4.2.20(a) : State-wise Break-up of The Energy Parks as on 31.01.2007
No. State/UT Energy Parks in Nos.
126

ENERGY
1 Andhra Pradesh 402 Chandigarh Administration 43 Chhattisgarh 84 Haryana 95 Himachal Pradesh 26 Jammu & Kashmir 47 Karnataka 608 Madhya Pradesh 319 Maharashtra 67
10 Orissa 1311 Pondicherry 512 Punjab 1513 Rajasthan 1214 Tamil Nadu 12315 Uttar Pradesh 6416 West Bengal 24
Total 481
Source : Annual Report 2007, Ministry of New and Renewable Energy
S. No State No. of Renewable Energy Clubs
Table 4.2.20 (b) : State wise Renewable Energy Clubs
127

INDUSTRIES
Sl. No.
Manufacturing Electricity, Gas & Water
Repair Services & Cold Storage
All Activities
1 3 4 5 6
1 1987-88 98379 458 3759 102596
2 1988-89 99724 481 3872 104077
3 1989-90 103373 493 4126 107992
4 1990-91 105511 518 4150 110179
5 1991-92 107454 505 4327 112286
6 1992-93 113890 961 4643 119494
7 1993-94 116227 542 4825 121594
8 1994-95 117564 554 4892 123010
9 1995-96 125281 4013 5277 134571
10 1996-97 125166 4160 5230 134556
11 1997-98 126272 3856 5423 135551
12 1998-99 * 130222 143 1341 131706
13 1999-2000 * 130035 158 1365 131558
14 2000-01 * 127036 163 4069 131268
15 2001-02 * 124099 170 4279 128548
16 2002-03 * 123401 182 4374 127957
17 2003-04 124277 219 4578 129074
18 2004-05 131232 275 4846 136353
19 2005-06 134619 259 5232 140160Source : Central Statistical Organisation* : From 1998-99, all electricity undertakings other than Captive Units have been kept
outside the purview of ASINote: Factories registered under Factory Act 1948
Year
2
TABLE 4.3.1 : NUMBER OF REGISTERED FACTORIES BY MANUFACTURING INDUSTRIES
128

INDUSTRIES
Defaulting Closed Total1 2 3 4 5 6
States1 Andhra Pradesh 243 90 34 3672 Arunachal Pradesh 0 0 0 03 Assam 10 3 5 184 Bihar 25 4 19 485 Chhattisgarh 18 5 2 256 Goa 10 0 1 117 Gujarat 263 61 21 3458 Haryana 73 31 23 1279 Himachal Pradesh 14 3 2 19
10 Jammu and Kashmir 8 0 3 1111 Jharkhand 8 7 6 2112 Karnataka 98 5 40 14313 Kerala 23 11 15 4914 Madhya Pradesh 60 4 15 7915 Maharashtra 454 42 69 56516 Manipur 0 0 0 017 Meghalaya 8 0 0 818 Mizoram 0 0 0 019 Nagaland 0 0 0 020 Orissa 38 12 2 5221 Punjab 53 31 17 10122 Rajasthan 94 9 8 11123 Sikkim 0 0 0 024 Tamil Nadu 175 42 3 22025 Tripura 10 0 0 1026 Uttaranchal 16 18 2 3627 Uttar Pradesh 234 13 27 27428 West Bengal 49 18 20 8729 Chandigarh 0 0 1 130 Daman 1 2 0 331 Delhi 2 3 0 532 Pondicherry 4 0 4 833 Andaman & Nicobar 0 0 0 034 Lakshadweep 0 0 0 0
Total 1991 414 339 2744
# :Having Adequate facilites to comply with the standardsSource : Ministry of Environment Forest. (Central Polution Control Board, MOEF)
TABLE 4.3.2: STATE-WISE SUMMARY STATUS OF THE POLLUTION CONTROL IN MEDIUM AND LARGE SCALE UNITS OF 17 CATEGORIES OF INDUSTRIES
as on JUNE,2007Sl. No.
State/UT Complying# Status (No. of Units)
129

INDUSTRIES
(As on June,2007)Sr. No Industrial Category Complying# Defaulting Closed Total
1 Aluminium 6 1 0 72 Cement 193 23 20 2363 Chlor-Alkali 25 9 0 344 Copper 3 1 0 45 Distillery 195 35 41 2716 Dyes & Dl 87 9 23 1197 Fertilizer 106 8 25 1398 Iron & Steel 30 9 1 409 Oil Refineries 18 2 1 2110 Perstocodes 97 10 9 11611 Petrochemicals 76 7 1 8412 Pharmaceuticals 379 134 58 57113 Pulp & Paper 120 31 38 18914 Sugar 428 65 95 58815 Tannery 96 15 18 12916 Thermal Power 128 54 8 19017 Zinc 4 1 1 6
Total 1991 414 339 2744
Source : Central Polution control Board. MOEF.
TABLE 4.3.3 : SUMMARY STATUS OF POLLUTION CONTROL IN GROSSLY POLLUTING INDUSTRIES DISCHARGING THEIR EFFLUENTS INTO RIVERS AND
LAKES
130

INDUSTRIES
(mg/Litre)
Sl. No.
Parameter Into Inland Surface Waters
Indian Standards 2490
(1974)
Into Public Sewers Indian
Standards: 3306 (1974)
Onland for Irrigation
Indian Standards: 3307 (1974)
Marine Coastal
Area
1 2 3 4 5 6
1 pH 5.5-9.0 5.5-9.0 5.5-9.0 5.5-9.12 Biological oxygen demand (for 5 days
at 20oC)30.00 350.00 100.00 100.00
3 Chemical oxygen demand 250.00 - - 2504 Suspended solids 100.00 600.00 200.005 Total dissolved solids (inorganic) 2100.00 2100.00 2100.00 -6 Temperature (oC) 40.00 45.00 - 45.007 Oil and grease 10.00 20.00 10.00 20.008 Phenolic Compounds 1.00 5.00 - 5.009 Cyanides 0.20 2.00 0.20 0.2010 Sulphides 2.00 - - 5.0011 Fluorides 2.00 15.00 - 15.0012 Total residual chlorine 1.00 - - 1.0013 Pesticides - - - -14 Arsenic 0.20 0.20 0.20 0.2015 Cadmium 2.00 1.00 - 2.0016 Chromium (hexavalent) 0.10 2.00 - 1.0017 copper 3.00 3.00 - 3.0018 Lead 0.10 1.00 - 1.0019 Mercury 0.01 0.01 - 0.0120 Nickel 3.00 3.00 - 5.0021 Selenium 0.05 0.05 - 0.0522 Zinc 5.00 15.00 - 15.0023 Chlorides 1000.00 1000.00 600.00 -24 Boron 2.00 2.00 2.00 -25 Sulphates 1000.00 1000.00 1000.00 -26 Sodium (%) - 60.00 60.00 -27 Ammoniacal nitrogen 50.00 50.00 - 5028 Radioactive materials29 Alpha emitters (milli curie/millilitre) 10-7 10-7 10-8 10-7
30 Beta emitters (µ curie/millilitre) 10-6 10-6 10-7 10-6
Source : Central Pollution Control Board
TABLE 4.3.4 : MAXIMUM PERMISSIBLE LIMITS FOR INDUSTRIAL EFFLUENT DISCHARGES
131

INDUSTRIES
Disposal on Land Disposal in Surface Water1 2 3 4
1 Biological Oxygen Demand (5 days at 200C) 100 30
2 Suspended Solids 100 30
Source : Central Polution Control Board
Capacity (Tonnes a year) Parameter Permissible Limits2 3
Above 24,000 pH 7.0-8.5Biological Oxygen Demand at 200C 30 mg/litreChemical Oxygen Demand 350 mg/litreSuspended solids 50 mg/litreTotal organic chloride 2.0 kg/tonne of paper producedFlow (total waste water discharge) --Large pulp and papera 200 m3/tonne of paper producedLarge rayon grade newsprint 150 m3/tonne of paper produced
Source : Central Polution Control Boarda : the standards with respect to total waste water discharge for large pulp and paper mills established from 1992 will meet the standards of 100 m3/tonne of paper produced
(Mg/Litre)Sl. No.
Parameter Permissible Limit Quantum (Kg/Thousand Tonnes of Crude Processed)
1 2 3 4
1 Oil and grease 10.0 7.002 Phenol 1.0 0.703 Sulphide 0.5 0.354 Biological Oxygen Demand (5
days at 200C)15.0 10.50
5 Suspended Solids 20.0 14.006 pH -- 6.00-8.50
Source : Central Polution Control Board
1
TABLE 4.3.7 : EFFLUENT STANDARDS FOR OIL REFINERIES
TABLE 4.3.5 : EFFLUENT STANDARDS FOR SUGAR INDUSTRY
Sl. No.
Parameter Permissible Limits (mg/Litres)
TABLE 4.3.6 : EFFLUENT STANDARDS FOR LARGE PULP AND PAPER INDUSTRIES
132

INDUSTRIES
Sl. No.
Plant Parameters Permissible Limits
1 2 3 4
1 Alumina PlantRaw material handling Primary and secondary crusher
particulate matter150 mg/m3
Precipitation area : calcination Particulate matter 250 mg/m3
Carbon Mono-oxide 1 % maximumStack Heighta
2 Smelter plantGreen anode shop Particulate matter 150 mg/m3
Anode bake oven Particulate matter 150 mg/m3
Total fluoride 0.3kg/tonne at Al3 Potroom Particulate matter 150 mg/m3
Total fluorideVertical stud soderberg 4.7 kg/tonne of Al producedHorizontal stud soderberg 6.0 kg/tonne of Al producedPrebacked side worked 2.5 kg/tonne of Al producedPrebacked centre worked 1.0 kg/tonne of Al producedStack Heighta
Source : Central Polution Control Boarda H = 14 Q0.3, where Q is the emission rate of sulphur dioxide in Kg/h and H is the stack height in meters.
(Mg/Litre)Sl. No.
Permissible Limit
1 3
1 pH 6.5-8.52 Biological Oxygen Demand (5 days at 200C)a 50.03 Phenolb 5.04 Sulphide (as S) 2.05 Chemical Oxygen Demand 250.06 Cyanide (as CN) 0.27 Fluoride (as F)c 15.08 Total Suspended Solids 1000.09 Hexavalent Chromium 0.110 Total Chromium (as Cr)d 2.0
Source : Central Polution Control Boarda :
b :
c :
d :
The limit for phenol shall be confirmed at the outlet of effluent treatment of phenol plant. However, at the final disposal point, the limit shall be less than 1 mg/l The limit for fluoride shall be confirmed at the outlet of the chrome removal unit. However, at the disposal point, fluoride concentration shall be lower than 5 mg/l
TABLE 4.3.8 : EFFLUENT STANDARDS FOR ALUMINIUM INDUSTRY
TABLE 4.3.9 : EFFLUENT STANDARDS FOR PETRO-CHEMICAL
2
The state board may prescribe the biological oxygen demand value of 30 mg/l if the recepient system so demands.
The limits for total and hexavalent chromium shall be confirmed at the outlet of the chromate removal. This implies that in the final treated effluent total, and hexavalent chromium shall be lower than prescribed herein
(BASIC & INTERMEDIATES) INDUSTRY
Parameter
133

GREENHOUSE GASES
Sl. No.
Green Houses Gases Contribution to atmosphere (%)
1 2 3
1 Carbondioxide 55
2 Methane 15
3 CFCs 11 & 12 17
4 Nitrousoxide 6
5 Others 7
Source : Central Pollution Control Board
TABLE 4.4.1 : CONTRIBUTION OF GREEN HOUSE GASES TO ATMOSPHERE
Chart 4.4.1: Contribution of Green House Gases toAtmosphere(%)
Carbondioxide Methane CFCs 11 & 12 Nitrousoxide Others
7%6%
17%
15%
55%
134

Grid1
NEWNESouthernIndiaSource : Central Electriciity Authority
Grid Average OM BM CM1 2 3 4 5
NEWNE 0.81 1.00 0.60 0.80Southern 0.72 0.99 0.71 0.85India 0.79 1.00 0.63 0.81Source : Central Electriciity Authority
OM: operating marginBM: build marginCM: combined margin
Grid Coal Diesel Gas Lignite Naphtha Oil1 2 3 4 5 6 7
NEWNE 1.10 0.63 0.47 1.37 0.44 0.77Southern 1.01 0.62 0.47 1.41 0.60 0.64India 1.08 0.62 0.47 1.40 0.45 0.74Source : Central Electriciity AuthorityNote: NEWNE Grid : Integrated Grid of Northern, Eastern, Western and North Eastern Region.
2005-06 2006-07 2007-082
Absolute Emissions Total (Million tCO2)
520.19
3 4
TABLE 4.4.2 (a): TOTAL ABSOLUTE EMISSIONS of CO2 FROM THE POWER SECTOR BY REGION FOR THE YEAR 2005-06 TO 2007-08
(tCO2/MWh)
TABLE 4.4.2 (b): EMISSION FACTORS OF CO2 FOR 2007-08 (t/MWh)
TABLE 4.4.2 (c): SPECIFIC EMISSIONS (WEIGHTED AVERAGE) OF CO2 FOR FOSSIL FUEL-FIRED STATIONS IN 2007-08
Note: Average is the average emission of all stations in the grid, weighted by net generation OM is the average emission from all stations excluding the low cost/must run sources BM is the average emission of the 20% (by net generation) most recent capacity addition in the grid.CM is a weighted average of the OM and BM (here weighted 50:50)
469.67
385.64109.02494.66
368.11101.55
406.56113.63
135
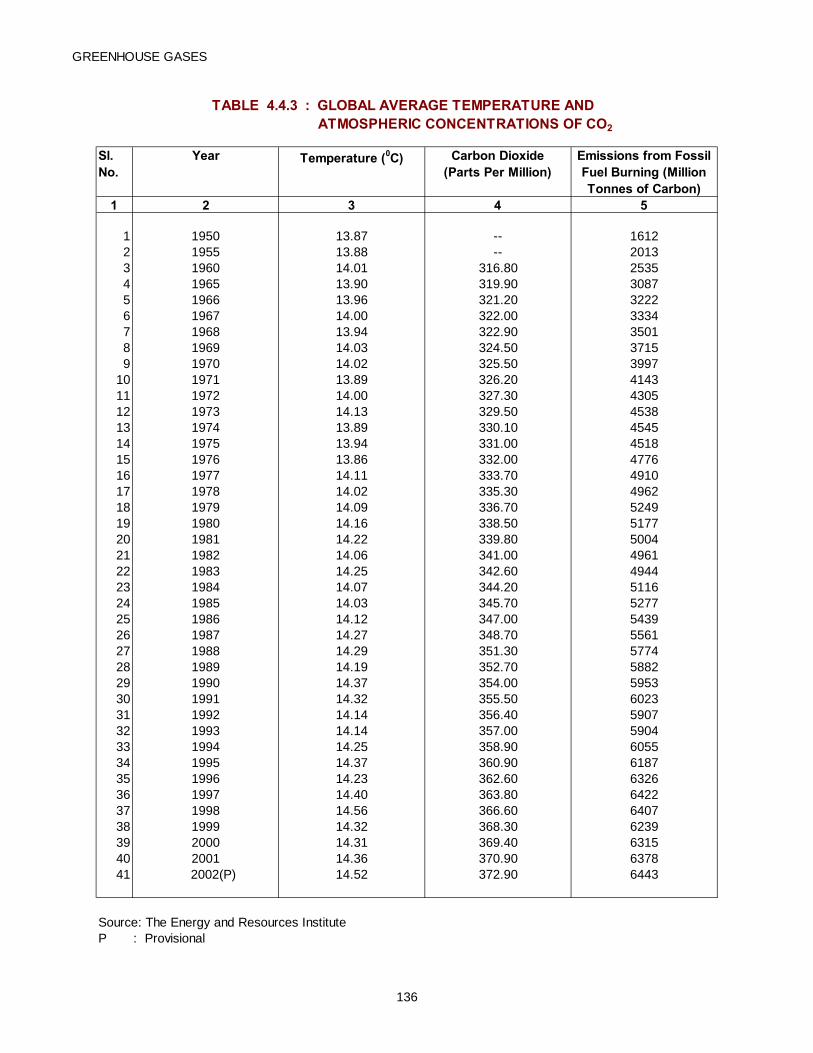
GREENHOUSE GASES
Sl. No.
Year Temperature (0C) Carbon Dioxide (Parts Per Million)
Emissions from Fossil Fuel Burning (Million Tonnes of Carbon)
1 2 3 4 5
1 1950 13.87 -- 16122 1955 13.88 -- 20133 1960 14.01 316.80 25354 1965 13.90 319.90 30875 1966 13.96 321.20 32226 1967 14.00 322.00 33347 1968 13.94 322.90 35018 1969 14.03 324.50 37159 1970 14.02 325.50 3997
10 1971 13.89 326.20 414311 1972 14.00 327.30 430512 1973 14.13 329.50 453813 1974 13.89 330.10 454514 1975 13.94 331.00 451815 1976 13.86 332.00 477616 1977 14.11 333.70 491017 1978 14.02 335.30 496218 1979 14.09 336.70 524919 1980 14.16 338.50 517720 1981 14.22 339.80 500421 1982 14.06 341.00 496122 1983 14.25 342.60 494423 1984 14.07 344.20 511624 1985 14.03 345.70 527725 1986 14.12 347.00 543926 1987 14.27 348.70 556127 1988 14.29 351.30 577428 1989 14.19 352.70 588229 1990 14.37 354.00 595330 1991 14.32 355.50 602331 1992 14.14 356.40 590732 1993 14.14 357.00 590433 1994 14.25 358.90 605534 1995 14.37 360.90 618735 1996 14.23 362.60 632636 1997 14.40 363.80 642237 1998 14.56 366.60 640738 1999 14.32 368.30 623939 2000 14.31 369.40 631540 2001 14.36 370.90 637841 2002(P) 14.52 372.90 6443
Source: The Energy and Resources InstituteP : Provisional
ATMOSPHERIC CONCENTRATIONS OF CO2
TABLE 4.4.3 : GLOBAL AVERAGE TEMPERATURE AND
136

NOISE
AreaDay Time Night Time
1 2 3 4
1 Industrial Area 75 70
2 Commercial Area 65 55
3 Residential Area 55 45
4 Silence Zone 50 40
Source : Central Pollution Control BoardNotes :
12 Night time --22.00 hour to 06.00 hour (08 hours)3 Areas upto 100 metres around certain premises like hospitals, educational
institutions and courts, religious places or any other area which is declared as silence zones by the competent authority.
4 Mixed categories of areas may be declared as one of four aforesaid categories by the competent Authority.
-- * dB (A) Leq denotes the time weighted average of the level of sound in decibels on scale A which is relatable to human hearing.
-- A "decibel" is a unit in which noise is measured.-- "A", in dB (A) Leq denotes the frequency weighting in the measurement of noise
and corresponds to frequency response characteristics of the human ear.-- Leq : It is an energy mean of the noise level over a specified period.
Limits in dB(A)Leq *
TABLE 4.5.1 : AMBIENT AIR QUALITY STANDARDS IN RESPECT OF NOISE
Sl. No.
Day Time -- 06.00 hour to 22.00 hour (16 hours)
137

NOISE
(dB[A])Metropolitan Day/ Industrial Commercial Residential Silence
Cities Night Area Area Area Area1 2 3 4 5 6 7
1 Kolkata Day 78 82 79 79Night 67 75 65 65
2 Mumbai Day 76 75 70 66Night 65 66 62 52
3 Chennai Day 71 78 66 63Night 66 71 48 49
4 Bangalore Day 78 76 67 67Night 53 57 50 --
5 Hardwar* Day - 77 66 71Night - 75 58 66
6 Kanpur* Day - 79 75 75Night - 78 72 66
Source : Central Polution Control Board * : 2003 Figures
Stage : I Stage : II Threat to Survival Causing Injury(a) Communication interference (a) Neural -humoral stress response(b) Permanent hearing loss (b) Temporary hearing loss
( c) Permanent hearing loss
Stage III Stage IVCurbing Efficient Performance Diluting Comfort and Enjoyment(a) Mental Stress (a) Invasion of Privacy(b) Task Interference (b) Disruption of Social Interaction( c) Sleep Interference ( c) Hearing Loss
Source: West Bengal Pollution Control Board
Sl. No.
TABLE 4.5.2 : AVERAGE NOISE LEVELS IN VARIOUS METROPOLITAN CITIES
B. Noise Nuisances
A. Noise HazardsTABLE 4.5.3 : EFFECTS OF NOISE POLLUTION ON HUMAN HEALTH
138