Chapter four – Empowered customers are more responsible ... File Library/Key Publications... ·...
56
Smart metering Subtask 5, Report n:o 5 Seppo Kärkkäinen Elektraflex Oy in co-operation with the country experts International Energy Agency Demand- Side Management Programme Task XVII: Integration of Demand Side Management, Distributed Generation, Renewable Energy Sources and Energy Storages Operating Agent: Seppo Kärkkäinen Elektraflex Oy, Finland Tel: +358 50 555 1207 [email protected]
Transcript of Chapter four – Empowered customers are more responsible ... File Library/Key Publications... ·...

Smart metering
Subtask 5, Report n:o 5
Seppo Kärkkäinen
Elektraflex Oy
in co-operation with the country experts
International Energy Agency Demand-Side Management Programme
Task XVII: Integration of Demand Side Management, Distributed Generation, Renewable Energy Sources and Energy Storages
Operating Agent:
Seppo Kärkkäinen Elektraflex Oy, Finland Tel: +358 50 555 1207 [email protected]

Country experts
Matthias Stifter Austria AIT Austrian Institute of Technology – Energy Department
Peter Palensky Austria AIT Austrian Institute of Technology – Energy Department
Rusbeh Rezania Austria Vienna University of Technology – Energy Economics Group
Samuli Honkapuro Finland Lappeenranta University of Technology - Department of Energy
([email protected] ) and Environmental Technology
Jarmo Partanen Finland Lappeenranta University of Technology - Department of Energy
([email protected] ) and Environmental Technology
Dominique Fourtune France ADEME
Vincent Krakowski France ADEME
Nouredine Hadjsaid France Grenoble Institute of Technology - The research center G2Elab
Jean-Christophe Maisonobe France Grenoble Institute of Technology - The research center G2Elab
René Kamphuis Netherlands Energy Research Centre of Netherlands (ECN)/ since 2011TNO
Andre Postma Netherlands Enexis
Miguel Ordiales Botija Spain Red Eléctrica España
Asier Moltó Llovet Spain Red Eléctrica España
Operating Agent
Seppo Kärkkäinen Finland Elektraflex Oy
with the assistance of
Jussi Ikäheimo Finland VTT Technical Research Centre of Finland
Göran Koreneff Finland VTT Technical Research Centre of Finland
Juha Kiviluoma Finland VTT Technical Research Centre of Finland

EXECUTIVE SUMMARY - Smart metering
TASK XVII: INTEGRATION OF DEMAND SIDE MANAGEMENT, DISTRIBUTED
GENERATION, RENEWABLE ENERGY SOURCES AND ENERGY STORAGES
Task extension: The effects of the penetration of emerging DER technologies to different stakeholders and to the whole electricity system
Background Energy policies are promoting distributed energy resources such as energy
efficiency, distributed generation (DG), energy storage devices, and renewable
energy resources (RES), increasing the number of DG installations and especially
variable output (only partly controllable) sources like wind power, solar, small
hydro and combined heat and power.
Intermittent generation like wind can cause problems in grids, in physical
balances and in adequacy of power.
Thus, there are two goals for integrating distributed energy resources locally and
globally: network management point of view and energy market objectives.
Solutions to decrease the problems caused by the variable output of intermittent
resources are to add energy storages into the system, create more flexibility on
the supply side to mitigate supply intermittency and load variation, and to
increase flexibility in electricity consumption. Combining the different
characteristics of these resources is essential in increasing the value of
distributed energy resources in the bulk power system and in the energy market.
This Task is focusing on the aspects of this integration.
Objectives The main objective of this Task is to study how to achieve a better integration of
flexible demand (Demand Response, Demand Side Management) with
Distributed Generation, energy storages and Smart Grids. This would lead to an
increase of the value of Demand Response, Demand Side Management and
Distributed Generation and a decrease of problems caused by intermittent

distributed generation (mainly based on renewable energy sources) in the
physical electricity systems and at the electricity market.
Approach The first phase in the Task was to carry out a scope study collecting information
from the existing IEA Agreements, participating countries with the help of country
experts and from organized workshops and other sources (research programs,
field experience etc), analyzing the information on the basis of the above
mentioned objectives and synthesizing the information to define the more detailed
needs for the further work. The main output of the first step was a state-of-the art
report.
The second phase (Task extension) is dealing with the effects of the penetration
of emerging DER technologies to different stakeholders and to the whole
electricity system.
The main subtasks of the second phase are (in addition to Subtasks 1 – 4 of the
phase one):
Subtask 5: Assessment of technologies and their penetration in participating
countries
Subtask 6: Pilots and case studies
Subtask 7: Stakeholders involved in the penetration and effects on the
stakeholders
Subtask 8: Assessment of the quantitative effects on the power systems and
stakeholders
Subtask 9: Conclusions and recommendations
The figure below describes the concept of this extension.
Results The report analyzes the technologies, regulation, costs and benefits as well as
experiences of smart metering. It also describes the current situation of smart

metering in the participating countries. Short summary of this is as follows.
Austria
According to the new Electricity Act (ElWOG 2010), the Minister of Economy may
introduce smart metering per decree, following a cost-benefit-analysis. The
regulator may define functionalities and data requirements of a smart metering
system. Current situation in Austria is that approx. 40.000 smart meters are
installed, and it is planned that 80% of the customers will be equipped in 2020
according to the EU rules..
Finland
Currently, the number of the AMR meters is increasing rapidly in Finland,
because almost all DSOs have AMR meter installation work ongoing. This is
mostly due to the “Government Decree on settlement and measurement of
electricity transactions (66/2009)”. Based on the decree, at least 80 % of the
customers have to be measured with AMR meters by 31st of December 2013.
However, it is assumable that penetration will be almost 100 %, since most of the
DSOs are installing AMR meters for all customers during their AMR installation
programs. More than one million meters have been installed
France
ERDF was asked by the CRE (Energy Regulation Committee) to experiment an
advanced smart meter counting system, based on recommendations made in the
CRE’s declaration of the 6th of June 2007. This LINKY pilot project consisted
300 000 meters and ended in March 2011. The CRE validated this
experimentation. The deployment objective of smart meters is 35 million smart
meters installed in 2020.
The results being positive, this project prefigures the national deployment of
smart meter systems in France, though some points are still being discussed as,
for instance, what kind of information and services suppliers should provide to
their clients in order to help them reduce their consumption and at what price? By
the end of 2011, there are still political discussions concerning who shall finance
the system and who will own the meter (ERDF or local distribution managers).
The Netherlands
The Dutch Government plans to roll out smart meters following Electricity
Directive 2006/32 EC. The bill concerning the rollout was adopted in February
2011 and was followed by an Order in Council (“Algemene Maatregel van
Bestuur” or “AMvB”) which came into effect on January 1st 2012. This Order
determines the functions of the Smart Meter on which the final standard should
be based. The Grid Operators (GO’s) in the Netherlands are responsible for the
roll-out of smart meters, for both gas and electricity
There are currently about 8 million electricity meters and 7.1 million gas meters in

the Netherlands. In a period starting in 2012 up to 2020, 80 percent of these
meters will be replaced by smart meters
From the first of January 2012 the GO’s will start with the small-scale rollout.
During a two year period the GO’s will be placing smart meters:
In new domestic houses
As part of regular replacements of old meters
In case a customer requests a smart meter.
The GO’s plan to install smart meters at 450.000 households in these 2 years. As
most Dutch households are dual fuel consumers, this amounts to almost double
that number in terms of actual meters. The large scale rollout is planned to start
on January 1st 2014.
Spain
In 2007, since the publication of the “Reglamento Unificado de Puntos de
Medida” (RD 1110/2007) and of the “Orden Ministerial por la que se regula el
control metrológico del estado” (ITC/3022/2007), the regulatory framework for
smart meters in the residential sector establish new functionalities to be
implemented in the meters.
At the end of 2007, Spain approved the National Plan for Meters Substitution
which involved the obligation for distribution companies to change 26 millions of
meters in the residential sector in Spain for 2018. In addition consumers will pay
around 15 % more each month for the smart meter rent since the moment that
they have a new meter.
However the delay in the implementation of this plan has motivated a revision of
milestones in the Orden IET/290/2012 maintaining the target of 26 millions of
meters for 2018 but rescheduling the milestones.
In Finland the minimum functional requirements for the smart meters are defined,
in other countries they are still under discussion and the requirements seem to be
varying depending on the local circumstances and market regulations.
International Energy Agency Demand-Side Management Programme
Task XVII: Integration of Demand Side Management, Distributed Generation, Renewable Energy Sources and Energy Storages
Operating Agent:
Seppo Kärkkäinen Elektraflex Oy, Finland Tel: +358 50 555 1207 [email protected]

1
Table of content
1. Basic concepts ...................................................................................................................... 3
2. Functionalities of smart meters .......................................................................................... 4
3. The role of smart meters ..................................................................................................... 4
4. Cost-benefit analysis of Smart Metering ........................................................................... 7
4.1. Analysis of costs on the basis of experiences........................................................................ 7
4.1.1. Cost components ............................................................................................................ 7 4.1.2. Experiences .................................................................................................................... 8
4.2. Benefits ................................................................................................................................ 11
5. Regulation and legislation ................................................................................................ 13
6. Experiences from the roll outs of smart meters .............................................................. 15
7. Smart customers as a part of smart grid and smart metering ...................................... 18
7.1. The effectiveness of the feedback ....................................................................................... 18
7.2. Technologies of direct feedback .......................................................................................... 20
8. Present situation of smart metering in participating countries .................................... 22
9. References .......................................................................................................................... 26
Appendix 1 Present situation of smart metering in Austria
A1.1. Policies related to the smart metering (support etc) ...................................................... 28
A1.2. Functional requirements ................................................................................................... 28
A1.3. List of research and demonstration projects and case studies ..................................... 29
A1.4. Penetration scenarios ........................................................................................................ 30
A1.5. References 31
Appendix 2 Present situation of smart metering in Finland
A2.1. Policies related to smart metering, functional requirements and displays .................. 32

2
A2.2. Penetration scenarios ........................................................................................................ 32
Appendix 3 Present situation of smart metering in France
A3.1. Introduction: a context defined by regulations .............................................................. 34
A3.2. Recommendations for functionality and performance of advanced counting systems ..
............................................................................................................................................. 35
A3.2.1 Counting and measuring devices ................................................................................... 35 A3.2.2 The teleprocessing system ............................................................................................. 36
A3.3. ERDF’s advanced counting system pilot project: the LINKY ...................................... 36
A3.3.1 The LINKY project’s context ........................................................................................ 36 A3.3.2 LINKY project’s results ................................................................................................. 36
A3.4. The planned deployment of smartmeters ........................................................................ 38
A3.4.1 Smartmeter deployment ................................................................................................. 38 A3.4.2 The deployment technical and economical studies ........................................................ 38
A3.4.3 The CRE’s recommendations for carrying out the LINKY’s deployment .................... 39
A3.5. Conclusion .......................................................................................................................... 40
Appendix 4 Present situation of smart metering in the Netherlands
A4.1. Background ........................................................................................................................ 41
A4.2. Responsibilities .................................................................................................................. 41
A4.3. Rollout ................................................................................................................................ 41
A4.4. Design ................................................................................................................................. 42
Appendix 5 Present situation of smart metering in Spain
A5.1. Regulatory framework ...................................................................................................... 44
A5.2. Functional requirements in Spanish smart meters ........................................................ 44
A5.3. Communications ................................................................................................................ 45
A5.4. National projects................................................................................................................ 46
Appendix 6 Overview of the IEA Demand-Side Management Programme .............................. 48

3
1. Basic concepts
There is no single definition of smart metering, however all smart-meter systems comprise an
electronic box and a communications link. At its most basic, a smart meter measures electronically
how much energy is used in a certain time-interval, and can communicate this information to the
utility or other actor responsible for metering. This information can be shared with end-use devices
to let the customer see how much energy they are using and how much it is costing them [1].
Definition in [2] is “Advanced metering is a metering system that records customer consumption
[and possibly other parameters] hourly or more frequently and that provides for daily or more
frequent transmittal of measurements over a communication network to a central collection point”.
The key distinction between smart-meter types is determined by their communication i.e. whether
there is any with the energy supplier, whether this is one-way or two-way and the data-storage
capability of the meter. The combination of these features determines the extent to which the
metering system can help customers reduce their energy usage and minimise carbon emissions.
In most countries there are no adequate requirements for functionality of smart meters. The lack of
common requirements increases costs of smart metering systems and makes it expensive to develop,
maintain and implement market applications and services that are based on smart meter data. Some
examples of common minimum requirements for smart meter functionality can be found ([4], [5]).
The frequency or duration of meter intervals depends upon the electricity provider’s tariff and rate
designs. The requirements for billing metering stem from the tariffs applied. In principle, it is not
necessary for the metering system to know the tariff applied. It is enough that the meter meters both
the consumption and production of active and possibly reactive power separately (so called four
quadrant metering) with the time resolution required for the tariff. In the Nordic countries this time
resolution is 1 hour, in some other countries it is 15 or 30 minutes. Consumption and customer-
initiated generation usually have different tariffs. Meter data can be stored in the meter for days or
weeks before it is transferred to the utility’s meter data management system. The data must be
reliable and accurate. Lost or erroneous data may cause significant costs, but transactional
communication mechanism can avoid this.
Apart from solid ‘back-office’ applications receiving the metering data, detection of meter faults,
erroneous installation and tampering is useful. Compensations for long voltage interruptions are
also quite often included in the billing. Compensations for some power quality defects are also
tentatively considered. Thus registering of voltage interruptions and perhaps even some basic power
quality characteristics may be required for the billing meters of the future.
Data communication with the meter shall be such that the accuracy of the measurement data
produced by the meter is not reduced due to data communication. The accuracy requirements of
static billing meters are defined in IEC 61036 standards. It is reasonable to require that the hourly or
15 minute values required by the tariff maintain the original accuracy. In other words the data
communication may not be the biggest source of measurement error. Typical source of such
unacceptable inaccuracy is too large pulse size of pulse metering.
Cyber security of smart metering and privacy of customers and electricity market data are not
discussed here in details although cyber security is considered in many countries to be a critical
issue. Privacy questions and data availability should be defined in legislation.

4
2. Functionalities of smart meters
As mentioned above, there are no common requirements for the functionality of smart meters. In
many countries there are not adequate requirements for functionality. In principle, the functions of a
smart meter include some or all of the following:
- consumption measurement and recording with the time resolution applied in the electricity
market (15 minutes, 30 minutes or 1 hour depending on the market) and storing such
measurement data at the meter a specified minimum time such as 60 days.
- remote reading
- daily remote reading
- visual display on meter
- communication with data security
- tamper detection and detection of installation errors
- remote time clock synchronisation
- load management via the meter with a dedicated controlled circuit
- power factor measurement
- import and export metering of energy
- remote connect and disconnect of power
- control of supply capacity limit and/or measurement of peak power
- interface with local automation network or home automation network (eg. ZigBee,
Ethernet, etc.)
- monitoring interruptions, quality of voltage and events
- meter loss of supply detection
- remote configuration and software upgrades
- plug and play device commissioning
This list is mainly based on [4].
The additional cost for additional functionalities is low in large scale applications. Often too much
emphasis has been but on not having any unnecessary functionality in the meters. This often leads
to higher costs than having one common requirement that covers all common needs. This is also
problematic for many applications that need metered data or transfer of simple control signals.
3. The role of smart meters [19]
Since 1 July 2007, all European citizens can freely choose their electricity and gas supplier. Same
applies also to some other markets around the world. However, market opening as such cannot
guarantee a sufficient degree of supplier choice and competition. Smart meters may facilitate better
services for customers in various ways. More accurate metering and billing is an obvious advantage.

5
Today, customers with floating prices do not get an accurate bill as in most countries where price
based varying tariffs are offered to household customers, consumption is distributed according to
one or more standardised profiles. Consumers with a consumption pattern that differs from these
standard profiles will get an inaccurate bill, especially if prices fluctuate a lot. In countries where
self-reading is practiced, smart meters will make those manual readings obsolete. Smart meters will
also facilitate supplier switching. With smart meters, a customer can make a switch any day of the
week, and meter reading can be done automatically without involving the customer. Both for the
customers themselves and for the power system as such, it is important that the price signals from
the wholesale market get through to the retail market.
With Automated Metering Infrastructure (AMI) technology and a display showing both
consumption and price, the customer can reduce consumption when prices are high and get full
benefits from it with accurate metering and billing based on the actual consumption. In this way,
customers can save on their electricity bills. Retailers can compete by offering customers different
electricity prices which apply at different times of the day. Similarly, retailers can target certain
groups of customers with particular tariffs that would be most economical for their consumption
patterns. Such pricing innovation and variety in smart meters will promote retail competition to the
benefit of customers. Especially for households with relatively high electricity consumption, house
and building automation can lead to additional savings and increased comfort: optimisation of
heating and lighting of the household and small business.
For customers that are fuel-poor or want to be more in control of their spending on electricity,
prepayment meters are an option. With such meters, the customer can pay in advance and get a
message when it is time for an additional payment. Even for that purpose smart metering can be
more cost-efficient than prepayment meters, depending on the local conditions.
Looking at the broader picture, reducing greenhouse gases emissions and global warming will be of
benefit to everyone, including consumers. Smart metering can lead to a reduction in peak load
demand and also electricity consumption in general. This will possibly result in reduced CO2-
emissions from generation based on fossil fuel.
Smart metering infrastructure for small-scale consumers is not an objective in itself. International
experience indicates that the reasons for metering innovation vary among countries. The main
driver in several countries is the hope that exposing consumers to a time varying cost of electricity
will lead to a reduction in consumption and to a reduction of peak demand, reducing the need for
additional investments in networks and generation. In turn, increased energy efficiency will
translate into savings for consumers and the system as a whole. In particular, policies adopted in the
States of Victoria (Australia), California (USA), and the province of Ontario (Canada) were clearly
motivated by a need to manage high and increasing summer peak demand driven by increased air-
conditioning use.
A need for improved billing accuracy was the main driver to introduce smart meters, for example in
Sweden. Shortly after deregulation of the electricity market, energy prices soared while consumer
groups heavily criticised electricity bills for being both unclear and inaccurate. Sweden has
introduced, from July 2009, a legal requirement for all electricity meters to be read monthly. The
most cost effective way distribution companies could meet this requirement is to invest in remote
meter reading technology. In addition, environmental concerns are a strong driver for power
conservation in Sweden.

6
Italy indicated the billing accuracy as one of the main objectives to be pursued as well. The
requirement to reduce losses due to fraud is of prime importance in both Italy and Northern Ireland
where the scale of the losses, and costs associated with their detection, were significant. In
particular, Enel, the dominant distribution (and retail) company in the domestic sector in Italy has
invested in smart metering for a number of business driven reasons:
Limiting the large number of visits per year.
Reducing bad debts.
Getting into a good position before market opening in July 2007.
In the USA similar to the 2006 FERC Survey [2], the 2008 FERC Survey [6] asked respondents
how their entities use advanced metering, beyond interval meter reading collection. Figure 1 shows
the results for 2006 and 2008. Respondents identify increased use of newer types of advanced
metering functionality, especially the use of advanced metering to perform remote outage
management and to remotely upgrade firmware on the advanced meters. Enhanced customer service
is the most often cited use of advanced metering by respondents, as it was in 2006.
Figure 1. Reported uses of advanced metering in 2006 and 2008

7
4. Cost-benefit analysis of Smart Metering
The range of potential benefits from smart metering can be rather extensive. For instance, if peak
shaving is the main driver for smart meter deployment, the expected cost savings derived from
generation and network investments deferral should be quantified first. Then there are additional
benefits like enhanced system security, or cost savings in meter reading. It is important to remember
that not all benefits can be quantified (or quantified with a given accuracy).
Estimation of the costs of smart metering is more straightforward although the costs are highly
dependent on the local circumstances, on the functional requirements and on the selected
technologies.
The cost-benefit analysis of smart metering is a complicated process and depends on many factors;
especially it is important to define the scope of the analysis: is that the investor point of view,
network operator point of view, are all stakeholders included, are societal aspects taken into account
etc. No simple guidelines can be given. In the following mainly cost and benefit components are
discussed, but no detailed proposal how to do it is not tried to give.
4.1. Analysis of costs on the basis of experiences
4.1.1. Cost components [19]
In assessing the costs of smart meter deployment, two main cost categories are identified:
- New costs: new capital and operation and management (O&M) costs attributable to smart
meters;
- Stranded costs: equipment and systems that may be displaced by smart metering;
New costs
Smart Metering cost-benefit analyses include capital costs for meters, communication, associated
systems for data handling and installation; operating and management costs for reading, service,
and re-verification. Note that costs vary significantly with the type of meter and with the
communication infrastructure (PLC, GSM/GPRS, ADSL or cable). A higher frequency of billing
and installation of displays at customer site (where consumer have always direct information about
their consumption and its associated costs) could increase costs.
- Capital costs: Capital costs of smart meters are the fundamental cost category in the analysis.
Assumptions regarding the technology, the depreciation rate, the timing and scale of the roll-out
programme and the lifetime of the metering assets are crucial for the results. Moreover,
installation costs differ across countries because of differences in labour costs.
A cost analysis can estimate an average figure, but the cost per meter will vary among utilities
because of geography, customer density and customer type.

8
- Operation and management (O&M) costs: Operation and management (O&M) costs of smart
meters are an important cost category. Quantifying O&M costs for a new technology is
complicated by extremely limited operating experiences. Estimates tend to fall within wide
ranges and can vary significantly depending on which technology is adopted and what
economies of scale are assumed. As a general average, the Ontario Energy Board (2004)
estimates communication maintenance is about 1% of the installed capital cost of the system.
Data storage and management are thought to become a much larger task for
distributors/metering companies than presently and the costs may be significant. Presenting
smart metering data to the customer is another new cost that might potentially be large,
depending on the frequency of updating information and the quality of the presentation.
Estimates can include or exclude new operating costs that are not now being incurred. An
example of this is meter re-verification costs. Electronic meters have to be tested more often
than electromechanical meters, so the cost of ensuring accuracy will increase with smart
metering.
Stranded costs
It is important to note that most residential and small commercial customers have electromechanical
meters that record cumulative energy consumption only. All electromechanical meters will be
rendered obsolete by smart meters and there is limited potential to reuse this hardware. Some
electronic meters might be adaptable to smart metering systems. However, in general, stranded
costs, also excluding the cost of removing and handling the old meters, are expected to be of minor
importance.
4.1.2. Experiences
Figure 2 shows the cost benchmarking of several projects presented in 2006 report [2] and Figure 3
shows the breakdown of costs. Detailed estimates on how the total costs are constituted from
individual cost items can also be found in the detail reports of the cost benefit analysis of NERA
[4].
It has to be noted that the costs of the actual meter hardware are usually less than 50 % of the total
costs per meter. Installation costs depend highly on the existing metering infrastructure and can in
some cases be about the same magnitude as the actual meter hardware.

9
Figure 2. Total AMI capital and hardware costs per meter [2]
Figure 3. AMI System Cost Breakdown
The reported costs per meter of different planned or implemented projects vary in large scale
between 70 – 450 €/meter (for ex. [2], [7], [8]). They depend for ex. from the cost categories
included, size and timing of the projects, geographical conditions etc. and are not directly
comparable.
After checking source, some corrections were made and further analyses of the selected cases were
carried out. Also some more cases reported in other sources were added and all together 24 cases
were analysed. These include 6 cost analyses, 5 completed projects, 5 projects that started before
2008 and 7 projects starting 2008 and 1 starting 2009. The Figure 4 is plotted from data of these 24
cases.

10
Figure 4. Cost per smart meter vs. implementation scale in 24 reported cases (source: Pekka Koponen, VTT)
The costs shown in the Figure 4 are still not directly comparable. In most of these cases it has not
been reported what costs are included. In many cases it is either known or likely that the estimated
running costs of communication, operation and maintenance are not included. Depending on the
system and its use these can be estimated to be from 25% to over 50 % of the costs. In reality, the
running costs easily exceed the estimated costs, because of unexpectedly high number of site visits
due to design errors or poor reliability. In some cases the investment in IT systems is not included
and it may be around 20 % of the costs. The value and expected lifetime of the replaced meters can
vary much and the stranded costs can be taken into account very differently. The assumed rates of
interest can be different. The cases come from Europe, UK, Australia, USA and Canada and the
results depend on the variations of the exchange rates of the currencies.
Reporting of running costs is not comparable either. In some cases only costs of data
communication and meter maintenance have been reported. Maintenance of information systems
can be omitted or included. Especially for smaller systems (some 100 000 or less meters) the
maintenance of information systems can form most of the running costs.
In Canada and in the Nordic countries the installation costs are high. It is also well known that the
installation costs are very sensitive to the installation schedule, good planning of the installation,
number of exceptions that need to be handled individually and availability of service companies that
could do most of the installation as their low priority background work.
The Figure 4 shows that the scale of the project clearly has a significant impact on the costs per
meter, but there are many other things that affect the price, too. For example, the circumstances in
Cost per smart meter vs. scale reported in Nort America, Europe and Australia
(only in some of these cases it has been reported what costs are included)
0
50
100
150
200
250
300
350
400
450
10 000 100 000 1 000 000 10 000 000 100 000 000
number of meters (electricity or electrcity and gas)
co
st
pe
r m
ete
r in
€
analysis estimate
starting 2008 or 2009
started before 2008
completed before 2008
outlier ?
includes some running costs
includes also NPV running
costs, much functionality,
the range includes both
uncertainty and much
difference in functionality
lower bound and upper
bound
ENEL,
does not
include
running
costs
high costs due to
experimenting of 3
communication
technologies
does not include
running cost
running costs NPV
added, mostly ICT
maintenance

11
Italy, and the timing of the project were so favourable in the Enel project in Italy that it does not
seem likely to achieve equally low costs in the other countries. The Italy case also gives support the
finding of some cost benefit analyses that much functionality can be included in the meter without
significantly adding to the costs, when very large numbers of similar meters can be produced.
The Figure 4 does not give support to the assumption that the metering system costs are now going
down. Earlier the costs of remotely readable meters have dropped, but now functionality and
performance of smart meters and related ICT are improving instead. This development is reasonable
as there is more potential to increase benefits than reduce costs. Also increasing demand of smart
metering systems may affect the prices of smart metering systems.
4.2. Benefits
The main problem in the assessment of the potential benefits attributed to smart metering systems is
that the benefits are divided between different stakeholders which often means that the cost-benefit
analysis is not always feasible if only one stakeholder (like DSO) is considered. In general the
benefits can be classified for ex.
For final customers to increase energy awareness and decrease energy use and energy cost.
For metering companies or DSOs to decrease meter operation costs.
For grid operators who want to prepare their grid for the future.
For energy suppliers/retailers who want to introduce new, customer made services and
reduce call center cost.
For TSO in decreasing system peaks and introducing demand response programs
For governments to reach energy saving and environmental targets and to improve free
market
Benefits can be described also as operational and societal savings where
Operational savings are discernible and measurable reductions in the utility’s or metering service
company’s overall cost of meeting its service obligations that serve to offset some or all of the Smart
Metering investment costs.
Societal benefits accrue to consumers in the form of lower bills, and enhanced electric services, and
sector adjustments that accrue directly to some consumers and indirectly to others processes.
Operational savings are easier to estimate and they are direct benefits to the investor of the smart
metering systems. These savings can include for ex.
savings in meter reading (regular and instantaneous)
savings in metering data handling and transfer
savings in network operation and investments
income from services to other stakeholders
etc.
When considering cost-benefit analyses from the point of view of the investor, these savings are
usually considered.
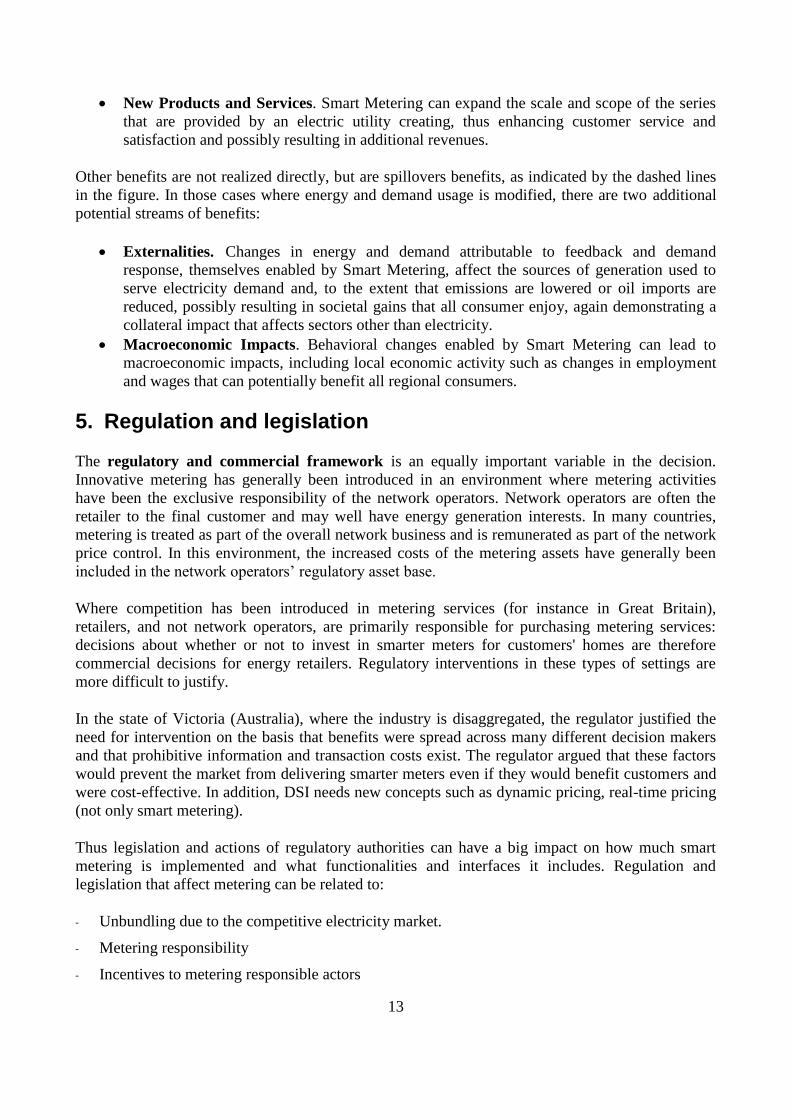
In the report [9] these societal benefits are analyzed in more details. Figure 5 provides a summary
of the processes by which these benefits are generated and to who they accrue. Because the primary
benefits in some cases are measured in different ways, methods and protocols are needed to

12
transform the physical manifestation into monetary terms. As the figure illustrates, there are four
sources of directly attributable benefits and two forms of spillover benefits.
Figure 5. Source and Measurement of Societal Benefits [9]
The direct societal benefits are as follows:
Service Enhancement. Smart Metering includes features that are the enabling factors,
labeled as influences in the figure. By providing the utility with better information about the
nature and extent of outages, Smart Metering influences the duration of outages. This
benefit is manifested as improved service quality, i.e., shorter outages. One way to monetize
these benefits is to use the value of lost load (VOLL) which equals the benefits (measured as
kWhs of restored energy) times a measure of the value ($/kWh) consumer realize. Those
affected by an outage are the direct beneficiaries. However, since every consumer is
potentially exposed to an outage, these benefits may be treated as accruing to all electricity
consumers since they all are presumably exposed to outages and the associated undesirable
consequences.
Feedback. Metering load at a very fine level of granularity (over hourly or shorter intervals)
and making those readings available quickly and conveniently to consumers (direct
feedback), may cause some of them to reevaluate how they use electricity and result in
lower electricity usage. The benefits of this outcome accrue to those participants that reduce
usage, but the benefits may also inure to all other electricity consumers.
Demand Response. More precise metering and meter reading enables an increased scope
and scale for demand response programs, which is manifested as load profile modifications
measured as energy and demand changes. Like feedback, these modifications can trigger
market adjustments that end up benefiting demand response participants and consumers in
general.
13
New Products and Services. Smart Metering can expand the scale and scope of the series
that are provided by an electric utility creating, thus enhancing customer service and
satisfaction and possibly resulting in additional revenues.
Other benefits are not realized directly, but are spillovers benefits, as indicated by the dashed lines
in the figure. In those cases where energy and demand usage is modified, there are two additional
potential streams of benefits:
Externalities. Changes in energy and demand attributable to feedback and demand
response, themselves enabled by Smart Metering, affect the sources of generation used to
serve electricity demand and, to the extent that emissions are lowered or oil imports are
reduced, possibly resulting in societal gains that all consumer enjoy, again demonstrating a
collateral impact that affects sectors other than electricity.
Macroeconomic Impacts. Behavioral changes enabled by Smart Metering can lead to
macroeconomic impacts, including local economic activity such as changes in employment
and wages that can potentially benefit all regional consumers.
5. Regulation and legislation
The regulatory and commercial framework is an equally important variable in the decision.
Innovative metering has generally been introduced in an environment where metering activities
have been the exclusive responsibility of the network operators. Network operators are often the
retailer to the final customer and may well have energy generation interests. In many countries,
metering is treated as part of the overall network business and is remunerated as part of the network
price control. In this environment, the increased costs of the metering assets have generally been
included in the network operators’ regulatory asset base.
Where competition has been introduced in metering services (for instance in Great Britain),
retailers, and not network operators, are primarily responsible for purchasing metering services:
decisions about whether or not to invest in smarter meters for customers' homes are therefore
commercial decisions for energy retailers. Regulatory interventions in these types of settings are
more difficult to justify.
In the state of Victoria (Australia), where the industry is disaggregated, the regulator justified the
need for intervention on the basis that benefits were spread across many different decision makers
and that prohibitive information and transaction costs exist. The regulator argued that these factors
would prevent the market from delivering smarter meters even if they would benefit customers and
were cost-effective. In addition, DSI needs new concepts such as dynamic pricing, real-time pricing
(not only smart metering).
Thus legislation and actions of regulatory authorities can have a big impact on how much smart
metering is implemented and what functionalities and interfaces it includes. Regulation and
legislation that affect metering can be related to:
- Unbundling due to the competitive electricity market.
- Metering responsibility
- Incentives to metering responsible actors

14
- Adequate functionality
- Adequate open interfaces and interoperability
- Availability and privacy of metered data
- Improving energy efficiency with the meters
- Rules that are difficult to meet without smart metering. These may be related to customer
switching, meter reading frequencies, support for energy efficiency improvement, etc.
- Rules that require full scale AMR rollout within a specified time horizon.
It is important that regulation and legislation allow adequate time to update the metering systems.
Too fast rollout increases costs and often makes it necessary to sacrifices critical requirements.
Table 1 gives the summary of the regulation in those European countries who are active in smart
metering. It is based on [10] with updates from [1].
Table 1. Summary of smart metering related regulation in some European countries
Austria According to the new Electricity Act (ElWOG 2010), the Minister of Economy may introduce smart metering per decree, following a cost-benefit-analysis. The regulator may define functionalities and data requirements of a smart metering system. A first draft of meter functionalities is available
Belgium No legislation regarding the introduction of smart metering yet. However, smart metering is high on the agenda of all stakeholders
Denmark Hourly metering (consumption > 200,000 kWh/year) was mandatory from January 2003. After January 2005 the limit changed to 100,000 kWh/year. There is no legal framework for the provision of smart meters for household customers. Mandatory metering of the electricity consumption of household customers has been suggested, but a cost-benefit-analysis led to a negative result. Minimum functional requirement for electronic electricity meters are available
Finland From 1st of March 2009, government regulation requires that utilities install hourly meters for at least 80% of their customers by the end of 2013. Minimum functional requirements are also defined
France Legislation is in preparation for a mandatory rollout. The goal is from January 2012 to only install electronic meters and have a 95% coverage by the end of 2016. This goal was enforced by a government decree in August 2010. The regulator defined some guidelines and minimum functional requirements for electricity meters. A cost-benefit-analysis with a positive result was presented in 2007.
Germany A mandatory rollout is not planned. Germany follows a policy driven by customer demand. The metering service is liberalised. The national legislature (EnWG 2009) only demands to install smart meters in new buildings and buildings that are undergoing major refurbishing from the beginning of 2010. By 2011 electricity suppliers have to offer load-variable or time-of-use tariffs. Minimum functional requirements are not available.
Ireland A National Smart Metering Plan is in place, the regulator (CER) started consultation process on a rollout strategy and functional requirements for electricity and gas (ongoing). A cost-benefit analysis will be available in March 2011 and will inform about the decision on a possible rollout.
Italy Digital smart meters have been compulsory for all electricity providers since 2006. The Italian regulatory authority established minimum functional requirements and introduced incentives for the adoption of advanced metering features related to quality of supply.
Netherlands Dutch Parliament adopted legal framework for voluntary installation of smart metering in November 2010. Customers may choose between four alternatives (from keeping

15
conventional meters to full AMM). Privacy concerns dominated public discussions. Smart meters need option for “administrative off” and port for decentralised metering services (real-time feedback with data remaining in the house, etc.). An updated cost-benefit-analysis and functional requirements are available.
Norway Regulation about mandatory hourly metering for all final customers with annual consumption over 100.000 kWh was introduced on the Jan 1st 2005. Any customer can require hourly metering of the electricity consumption from its local DSO if he covers the costs. A proposal for a full rollout and functional requirements was postponed in late 2009 in order to wait for European standards. In January 2011, the Ministry of Petroleum and Energy asked the Norwegian regulator to submit a proposal for earlier installation of smart metering technology in Central Norway by 2013 and a full rollout by 2016. A discussion document is published in February 2011.
Portugal No legal framework for a mandatory rollout. In 2007, the regulator presented a meter substitution plan for the period 2010–2015 and a list of functional requirements. That plan is co-ordinated with Spain.
Spain Spanish regulator forced Distribution companies to implement smart metering projects in a specific timeframe, establishing also a set of minimum functionalities that the implemented solution must cover. The ORDEN ITC/3860/2007 law established the obligation for DNOs to implement smart metering solution replacing all the meters before 2018.
Sweden In 2003 the government passed a bill obligating the grid companies to a monthly meter reading for all electricity users by 2009. DSOs are responsible for metering. A cost-benefit-analysis resulted in net benefits of more frequent meter readings. Functional requirements are available.
United Kingdom All aspects of utility metering have been unbundled and opened to competition. The supplier is responsible for metering and is required to contract with a meter asset provider, a meter operator and a data collector. In May 2007 the government set in train the requirement for energy suppliers to install smart meters in most businesses by 2012. In 2008 the government announced that it will require all households to have smart meters installed over the next 10 years. In July 2010, the government published the smart metering prospectus outlining the rollout strategy. Minimum requirements for meters and displays are proposed but not yet finally decided.
6. Experiences from the roll outs of smart meters
The situation varies very much between countries regarding:
- penetration of AMR
- functionality and
- requirements on functionality.
An overview report [11] shows a rough prediction of the smart metering penetration in each of the
EU-15 countries in 2010 and 2020 and assesses the current interest in demand response (demand
flexibility). Table 2 shows the conclusion with some updating. It is expected that in 2020 smart
metering penetration will be about 100% in France, 60% in UK, 50% in Spain and Greece and 30%
in Germany, if the current trends in regulatory, technical and market conditions continue.

16
Table 2. Status on Smart Metering developments in the EU-15 countries
Smart metering penetration
Current interest in DR
Comments
2010 2020 (moderate scenario)
Austria 1 % 50 % No 40000 smart meters installed, ongoing analysis by Utilities and the government
Belgium-Luxenbourg 1 % 80 % No Ongoing trials
Denmark 10 % 90 % Yes Small trials . Wind is the key issue . DR is viewed as a solution for compensating wind variability
Finland 50 % 90 % Yes Voluntary rollout of SM already in progress, estimated will reach 1,400,000 by 2010. Ministry of Labor and Economy has decided 80% SM rollout by 2014
France 1 % 100 % Yes A 300,000 smart meters pilot finished in 2011, target: 35 million smart meters in 2020
Germany 1 % 30 % Yes SM will take place if regulatory barriers are solved. if not Germany will be the last country with manual meters in the EU. Some Utilities estimate that SM penetration will be as low as 20-50% in 2020
Greece 1 % 50 % No However, looming power crisis ought to make DR seem more appealing
Ireland 5 % 100 % No DR pilots likely to happen. Wind development is a driver.
Italy 90 % 100 % Yes Utilities required to make TOU tariffs an option for all customers.
Netherlands 1 % 100 % Yes Heated discussion. 400000 households with smart meters 2012 – 2013. Large scale rollout from 2014.
Portugal 1 % 50 % No TOU tariffs and Direct Load Control are both being considered by the regulator. EdP is seriously involved in DR.
Spain 5 % 50 % Yes Wind is driving Spain to look at DR. 26 million smart meters by 2018, functional requirements defined
Sweden 100 % 100 % Yes TOU is already mandated
UK 1 % 100 % Yes OFGEM has it in the White Paper and has made free in home displays available through the network company to anyone who wants one. This is being fought as an unfunded mandate by the network companies
The most recent results of the 2008 FERC Demand Response and Advanced Metering Survey (2008
FERC Survey, [6]) in the USA indicate advanced metering penetration (i.e., the ratio of advanced
meters to all installed meters) has reached about 4.7 per cent for the United States. This is a
significant increase from 2006, when advanced metering penetration was less than one per cent.
Market penetration of advanced metering increased substantially in nearly all regions since 2006.
Peninsular Florida had the largest increase, from less than one percent advanced metering
penetration in 2006 to 10.4 per cent in 2008.
The 2007 FERC Demand Response Report identified 28 utilities that since 2005 had announced
plans to deploy over 45 million advanced meters. Recent contracts to purchase advanced metering
systems by Southern Company (4.2 million advanced meters), Alliant Energy (one million
advanced meters), Duke Energy’s filing with the state of Indiana for an 800,000 advanced meter
deployment bring planned deployments to nearly 52 million. These deployments are scheduled to
take place over the course of the next five to seven years. The number is significant when one
considers that there are totally 145 million meters in North America.
17
As explained below it can be expected the smart metering penetration in 2020 to be close to 100%
in France, Spain, UK and in some other countries. In 28 October 2008, the UK government
announced that it will mandate smart metering to all households with an indicative timetable that
the rollout will be completed by 2020. In Spain in 2007 a government order was given that requires
full penetration by 2018. Regarding Germany and Greece the development still seems highly
uncertain and 50% penetration in Greece in 2020 seems rather optimistic.
UK
In UK the retail energy supply company (RESC) is responsible for meter purchase and for metering.
Actual purchase may be by a meter asset provider. OFGEM (www.ofgem.org.uk) is responsible for
the regulation of metering for gas and electricity. The number of smart meters in UK is small (some
tens of thousands).
In UK the government has a goal that everybody has a smart meter and a display within the next ten
years. They have initially been proposing that smart metering be introduced from 2010 and that
meters should have a customer display.
The following information is included in [12]. In the 2008 Budget the Government has already
announced its intention to legislate for a roll out of advanced metering to medium business over the
next 5 years. The Government has 23 April 2008 proposed amendments to the energy bill. The
amendments give Government the powers it needs to take the next steps on smart metering. The
Government plans to take the final decision on a smart meter roll out to domestic and small
business consumers as soon as possible after reception of the second report of the Energy Research
Project trials which is expected in November 2008.
30 October 2008 the U.K. government [13] has announced that it will mandate smart meters for all
households. This will result in as many as 47 million smart electricity and gas meters being rolled
out nationwide. An indicative timetable a period of around two years is anticipated to resolve the
issues and to design the full detail of the rollout, with a subsequent rollout to be completed by 2020.
In July 2010, the government published the smart metering prospectus outlining the rollout strategy.
Minimum requirements for meters and displays are proposed but not yet finally decided.
Italy
In Italy ENEL has implemented smart metering to all of its 30 million electricity customers and
several other distribution companies have followed. Requirements for full coverage AMR and
minimum functionality have been established for the electricity meters in December 2006 by the
regulatory order 292/06. All 36 million Italian electricity customers must be covered by smart
metering by 2012. (All over 55kW customers must have smart metering by the end of 2008 and 95
% of 55kW or smaller customers by the end of 2011.) In July 2006 the Italian Energy Authority had
given a consultation document [14] regarding the minimum functionality and performance of the
electronic meters. The recommendation is based on a study of metering systems available on the
market and the ENEL system seems to be compatible with almost all of these requirements. The
requirements include: for three phase meters reactive energy in addition to active energy for all the
meters, ability to record totalizers depending on the time of the day and day of the week for time of
use price schemes, recording of hourly load profiles with a depth of at least 60-70 days, mains
circuit breaker for direct demand control of single phase customers etc. and recording of quarter

18
hourly peak for those meters that do not have a circuit breaker, security of data withdrawal,
synchronization of meter clocks, remote periodic reading of consumption data for billing purposes,
remote meter activation and closure, remote change of contracted power and price scheme, remote
parametrization of meter, transmission of messages on the meter display, snapshots of the
consumption data totalizers and quarter hourly peak power registers, meter display, and remote
upgrades of the meter and data concentrator software. The Authority also felt that reading of hourly
load profiles for dispatch purposes, through mandatory implementation in AMM systems, could
gradually replace conventional load profiling for all LV customers, or for LV customers in a certain
segment. Performance requirements for the above functionalities were also given. Starting 2012 all
meters installed must meter energy bi-directionally. A consultation document of the minimum
functional requirements for gas meters was published 9 June 2007.Compulsory remote metering
and related functional and performance requirement are developed by the Authority.
Australia is preparing a full scale roll out for smart metering to its nearly 10 million energy
customers. Detailed cost benefit analysis of smart metering and direct load control has been
completed and is available from www.mce.gov.au. Costs and benefits of different functionalities
and implementation alternatives are assessed. Based on the cost benefit analysis a recommendation
for national minimum functionality is given. This includes an interface with a Home Area Network
(HAN) that is expected to enable significant benefits via load control and energy efficiency
improvement.
In California (USA) the electricity companies plan to complete full scale rollout of all customers
by 2013 or sooner, depending on the company. Ontario (Canada) has given legislation that
requires that in 2010 all customers have remotely communicating meters that meet certain
requirements. Canadian distributor HydroOne has installed more than 1.2 million smart meters
across Ontario (close to 100% of meters are installed), and as at June 2011, had transferred around
900 000 customers to TOU pricing. The Ontario Energy Board (Government) mandated that all
HydroOne customers must be transferred to TOU pricing by October 2011.
7. Smart customers as a part of smart grid and smart metering
One part of smart customers is the customer behavior without automation, how to effect on the
customers so that they consumes electricity in a rational way? Basically there are three main means
to affect the electricity consumption habits:
the indirect feedback in informative electricity bills showing the benefits of energy savings
to customers and giving hints
general education of customers and specific campaigns through different media like
TV/radio, newspapers and internet
the direct feedback from metering data either via internet or different types of home
displays.
The last type of feedback is shortly discussed here.
7.1. The effectiveness of the feedback
The study [15] gives a basic summary of the literature on the feedback studies. Recently in [18] a
short summary of the recent studies is given including

19
Meta study on energy bill reductions due to information (Darby 2006)
– Direct information (e.g., immediate) = 5-15%
– Indirect treatments (billing detail) resulted in 0-10% reduction
– In one case consumption increased
Ontario Hydro Board –Direct
– Information-only treatments ~225
– Participants reduced electricity usage by 6.5% on average
Newfoundland and Vancouver Residential Feedback Studies – Direct
– Follow-up to Ontario Study (same in-home display device)
– Newfoundland – 18% reduction in usage
– Vancouver 2.6% reduction
California State Pricing Pilot- Direct
– Information treatment resulted in no significant difference in electric usage
Milton Ontario Feedback Pilot – Indirect
– 106 participants information-only treatment 2006-7
– No discernible change in usage detected, but 64% said they took actions
Prepaid Metering- Direct, Balance only
– Salt River Project (SRP) - reports 12% average usage reduction among 55,000 (~5% of
total) residential prepayment customers
– Northern Ireland (Darby 2006) – 25% of residential consumers use prepay, and
reportedly use, on average, use 3% less electricity
– Woodstock Hydro (website) – 20-25% of residential customers use prepay and exhibit
15-20% reduction in electricity use
Figure 6 shows the summary of the electronic feedback studies. These study results suggest that
there may be a large benefit to providing customer feedback on electricity consumption, especially
if that feedback is direct and readily accessible on the premises. The results are surprisingly
uniform, which might suggest that they are highly credible.
Figure 6. Electronic Display Electricity Savings [9]

20
In Figure 7 a summary of 36 studies based on different types of indirect and direct feedback in
different countries is given. It includes also average results from the large study from UK (more
detailed information from this can be found from [20].
Figure 7. Summary of feedback studies [1]
7.2. Technologies of direct feedback
Direct feedback is a very active area for technology development. It is clear that a number of
different options are being explored and the basic concepts have been set out below. It is not
intended here to list all such devices but rather to pick those that illustrate different approached or
novel features.
Consumption feedback via internet access. One approach to energy feedback is to give
customers access to the meter data held by the utility via a web site. This data can be
displayed in a number of ways, such as in charts and tables. The data can also be linked to

21
energy analysis software that allows the customer to enter the details of their energy usage
and property. This in turn allows the web site to offer energy reduction advice and
comparisons with other customers‟ usage. Many utilities currently offer energy analysis
software for customers to model their usage. However, these can be very time consuming to
fill in. The availability of smart meter data can simplify and speed this process.
Displays linked to meter data. Numerous energy displays have now been developed and
put on the market. A notable development in recent years has been the emergence of ZigBee
enabled displays. Some of these are based on the new ZigBee energy profile and depend on
the widespread installation of Zigbee enabled meters by US utilities. These displays can be
offered by the utility or directly to the customer. This trend gives a glimpse of how the
European market might develop if AMM meters were widely installed and were fitted with a
standard local interface. It can be expected that the competing network protocols will seek to
emulate the growth of the ZigBee device range.
Displays with non-meter data sources. Despite this early work on displays linked to
meters, in Europe the tendency has been for displays to be developed that are independent of
the meter as there is currently poor local access to the data in the meter. A similar market is
apparent in the US, where the local meters do not allow access to data. The majority of these
displays utilise a split current transformer to measure the power flow at the meter. A few
also measure voltage so that an accurate power value can be determined. These displays
normally have a wireless link to a display. A number of the displays also link to computer
packages to allow detailed analysis of the data.
The Energy Saving Trust has published a study dealing with the properties of displays taking into
account the behavior of the average households [16]. It concludes that displays should have
minimum functional requirements from the users’ point of view including
1. The default display should include:
A clear analogue indicator of current rate of consumption
Current rate of consumption as a rate of spend in pounds per day (numeric)
Cumulative daily spend in pounds (numeric)
2. The display should offer the following options through interaction (by pressing a single button):
Spend in last seven days, day by day
Spend in last complete week
Spend in last complete month
Spend in last complete quarter
The historic periods should match the utility’s billing periods in order that the display is
consistent with household bills.
3. The display should offer the option (by pressing a single button) of switching units from money
to power, i.e. from pounds per day and pounds to kilowatts and kilowatt-hours. If interaction is
not possible, current rate of consumption in kilowatts should form part of the default display.
4. The display should be mains-powered but have an internal battery to enable mobility in the
home.

22
8. Present situation of smart metering in participating countries
In Annexes 1 – 5 a short description of the present situation in participating countries is given. In
the following short summary on some aspects is given.
Austria
According to the new Electricity Act (ElWOG 2010), the Minister of Economy may introduce
smart metering per decree, following a cost-benefit-analysis. The regulator may define
functionalities and data requirements of a smart metering system. Current situation in Austria is that
approx. 40.000 smart meters are installed, and it is planned that 80% of the customers will be
equipped in 2020 according to the EU rules.
In the Austria consultation paper issued from E-Control the following requirements are listed which
can enable DSM:
Minimum of 4 registers for different tariffs per day (time of use).
Communicate with at least 4 external meters - possible use as synergy for energy
management systems
Interface to external system
It is explicit stated, that the SM would not act as a gateway to home automation system to directly
control external devices.
Finland
Currently, the number of the AMR meters is increasing rapidly in Finland, because almost all DSOs
have AMR meter installation work ongoing. This is mostly due to the “Government Decree on
settlement and measurement of electricity transactions (66/2009)”. Based on the decree, at least 80
% of the customers have to be measured with AMR meters by 31st of December 2013. However, it
is assumable that penetration will be almost 100 %, since most of the DSOs are installing AMR
meters for all customers during their AMR installation programs. More than one million meters
have been installed
Above mentioned government decree defines the minimum requirements and functionalities that
energy meters have to meet.
Customers’ energy measurements have to be based on hourly measurements and remote
readings
The customers’ energy meters have to be able to receive, transmit and execute load control
commands
Meters have to register begin and end times of the outages, which last more than three
minutes

23
Furthermore, based on the decree, the DSO is obliged to read its customers’ hourly energy
measurement data once a day, and its balance settlement has to be based on hourly
measurements. Hourly energy measurement data has to be stored in DSO’s database at least
for six years. Similarly data concerning the outages has to be stored at least for two years.
If customer requests so, DSO has to provide customer with AMR meter, which is equipped
with standardised interface for real-time power consumption measurement. Although it is
not said exactly, this can be interpreted so that customer has to be able to connect power
consumption display to such meter
Furthermore, it is defined that customer’s measurement data has to be given for customer
himself, without any payments. In practice, this can be realised by web-service, as has been
already done by some companies.
Moreover, there are some requirements for metering the distributed generation in the
customer premises. If there is both generation and consumption, and main fuse is at
maximum 3*63 A, one metering device can be used. However, it must be able to meter
separately electricity fed to the network and electricity acquired from the network. It is not
permitted to net the network input and output, but separate registers for these have to be
used. In the case main fuse is over 3*63 A, there have to be separate meters for network
input and output. Furthermore, in this case also consumption of own generation must be
metered, which is the difference between generation of the electricity and output to the
network.
France
ERDF was asked by the CRE (Energy Regulation Committee) to experiment an advanced smart
meter counting system, based on recommendations made in the CRE’s declaration of the 6th of
June 2007. This LINKY pilot project consisted 300 000 meters and ended in March 2011. The CRE
validated this experimentation. The deployment objective of smart meters is 35 million smart
meters installed in 2020.
The results being positive, this project prefigures the national deployment of smart meter systems in
France, though some points are still being discussed as, for instance, what kind of information and
services suppliers should provide to their clients in order to help them reduce their consumption and
at what price? By the end of 2011, there are still political discussions concerning who shall finance
the system and who will own the meter (ERDF or local distribution managers).
On the basis of the experiments recommendations for counting and measuring devices are given.
The counting and measuring devices must measure and record the load curve, the maximum power
asked, the various quality characteristics of the electricity provided and must also support multiple
index systems for price setting. Below are the details of the recommended measuring and recording
parameters:
Load curve (active power): time step of 10, 30, or 60min, with a minimum capacity of 2
months sliding memory with a 30min time step
Maximum power asked: daily value with a sliding memory of 2 months
Provided electricity quality: date and duration of short and long power break, date and
duration of voltage excursion out of predefined limits, with a sliding memory of 2 years.
Index system: 2 different indexes must be supported, 4 indexes for the prices and 10 indexes
for the energy provision (regulated price market offer)

24
The counting devices must also be able to display information such as: hourly seasonal
index, instantaneous power, maximum power value. They must also include a limiting
system (with a threshold set by step of 1 kVA).
A bidirectional communication, to and from the upstream of the meter, and to the
downstream of the meter: Upstream: the smart meter must allow the transfer of recorded
data (energy flow and quality), the modification of its parameters (price calendars and
subscribed power), and the possibility to command power breaks and power recovery.
Downstream: there must be a controlled relay based on the price calendar of the distribution
network manager or energy provider, and a data transfer interface for the user, which can
transmit all the data collected to a display device or a remote device.
The Netherlands
The Dutch Government plans to roll out smart meters following Electricity Directive 2006/32 EC.
The bill concerning the rollout was adopted in February 2011 and was followed by an Order in
Council (“Algemene Maatregel van Bestuur” or “AMvB”) which came into effect on January 1st
2012. This Order determines the functions of the Smart Meter on which the final standard should be
based. The Grid Operators (GO’s) in the Netherlands are responsible for the roll-out of smart
meters, for both gas and electricity
There are currently about 8 million electricity meters and 7.1 million gas meters in the Netherlands.
In a period starting in 2012 up to 2020, 80 percent of these meters will be replaced by smart meters
From the first of January 2012 the GO’s will start with the small-scale rollout. During a two year
period the GO’s will be placing smart meters:
In new domestic houses
As part of regular replacements of old meters
In case a customer requests a smart meter.
The GO’s plan to install smart meters at 450.000 households in these 2 years. As most Dutch
households are dual fuel consumers, this amounts to almost double that number in terms of actual
meters. The large scale rollout is planned to start on January 1st 2014.
The current design of the smart meter in the Netherlands is based on the functional requirements
and the global design as laid down in the NTA (Netherland technical Agreement). The functional
specifications are detailed in the DSMR (the Dutch Smart Meter Requirements) to insure
interoperability. Various versions of the DSMR have already been developed and published on the
Netbeheer Nederland website.
An important decision that still has to be made for the large scale roll out is the communication
technology that will be implemented. A number of options is being investigated, including
GPRS/LTE, PLC and CDMA.

25
Spain
In 2007, since the publication of the “Reglamento Unificado de Puntos de Medida” (RD
1110/2007) and of the “Orden Ministerial por la que se regula el control metrológico del estado”
(ITC/3022/2007), the regulatory framework for smart meters in the residential sector establish new
functionalities to be implemented in the meters.
At the end of 2007, Spain approved the National Plan for Meters Substitution which involved the
obligation for distribution companies to change 26 millions of meters in the residential sector in
Spain for 2018. In addition consumers will pay around 15 % more each month for the smart meter
rent since the moment that they have a new meter.
However the delay in the implementation of this plan has motivated a revision of milestones in the
Orden IET/290/2012 maintaining the target of 26 millions of meters for 2018 but rescheduling the
milestones.
The functional requirements for the smart meters in Spain are detailed in the RD 1110/2007 and in
the ITC/3022/2007 and can be summarized as follows:
End user information (demand, maximum power, TOU, information of load control…)
Remote reading of power, energy consumed and other information (hourly measures)
Verification of communications
Verification of smart meter well functioning
Event report (lack of voltage, overvoltage…)
Remote synchronization of date and time
Software y firmware update
Remote control of contract power
Management of TOU (at least with 6 periods) including dynamic updates of the tariffs
Load management

26
9. References
[1] http://www.esma-home.eu/
[2] Federal Energy Regulatory Commission, “Assessment of Demand Response & Advanced
Metering”, Staff Report Docket Number: AD-06-2-000, August 2006, 228 p.
[3] Pekka Koponen (ed.), Definition of Smart Metering and Applications and Identification of
Benefits, Deliverable D3 of the European Smart Metering Alliance ESMA (available at
www.esma-home.eu, members area), 2008, 42 p.
[4] Adrian Kemp, Ann Whitfield, Brendan Quach, Yuliya Hedynach, Tara D'Souza, Cost Benefit
Analysis of Smart Metering and Direct Load Control: Overview Report for Consultation,
Report for the Ministerial Council on Energy Smart Meter Working Group, NERA Economic
Consulting, Sydney NSW Australia, 29 February 2008. 212 p. Available from
www.mce.gov.au
[5] Netherlands Technical Agreement NTA 8130:2007, Minimum set of functions for metering
of electricity, gas and thermal energy for domestic customers. Netherlands Standardization
Institute (NEN), August 2007, 25 p.
[6] Federal Energy Regulatory Commission, “2008 Assessment of Demand Response &
Advanced Metering”, Staff Report, December 2008, 139 p.
[7] Francois-Annet de Ferrieres, Yves Rosseau, AMM for France, the complete case. Metering
Europe 2007, Vienna, 2-4 October 2007. Presentation comprising 21 slides.
[8] Smart Meters - Costs and Consumer Benefits, Report to energywatch by Eoin Lees Energy,
July 2007, 26 p. A two page supplement was published 31 July 2007.
[9] Characterizing and Quantifying the Societal Benefits Attributable to Smart Metering
Investments. EPRI Topical Report, July 2008, EPRI Project Manager B. Neenan, 150 p.
[10] From Policy to Implementation: The Status of Europe’s Smart Metering Market. Gapgemini.
Point of View by Meir Shargal. 2009, 12 p.
[11] Demand Response: a decisive breakthrough for Europe. How Europe could save Gigawatts,
Billions of Euros and Millions of tons of CO2. Gapgemini in collaboration with VasaETT
and Enerdata. 2008, 32 p.
[12] Department of Business Enterprise & Regulatory Reform, Smart Metering, A letter to Energy
Metering and Billing Stakeholders, UK, 23 April 2008, 3 p.
[13] House of Lords debates, Energy Bill, 28 October 2008
http://www.theyworkforyou.com/lords/?gid=2008-10-28a.1514.0
[14] Recommendations for the use of electronic meters and AMM systems with low voltage
customers, consultation document, 26 july 2006, Act no 23/06, Autorita per l'energia elettrica
e il gas, Italy, 32 p. http://www.autorita.energia.it
[15] Darby, Sarah, the effectiviness of feedback on energy consumption. A review for DEFRA of
the literature on metering, billing and direct displays. Environmental Change Institute,
University of Oxford, 2006, 21 p.

27
[16] The smart way to display. A summary report on consumer preferences for energy display
designs. Energy Saving Trust, 2009, 12 p
[17] European Smart Metering Landscape Report. SmartRegions Deliverable 2.1. Vienna
February 2011, 158 p.
[18] Leitner “Skip”, John A., The economy-wide impact of feedback-induced behaviors that drive
residential electricity savings, ACEEE Report E12B, August 2012
[19] Demand Side Integration. CIGRE Working Group C6.09, August 2011, 143 p.
[20] Energy Demand Research Project: Final Analysis. AECOM, Building Emgineering, Ofgem,
June 2011, 179 p.
,

28
Appendix 1 Present situation of smart metering in Austria
A1.1. Policies related to the smart metering (support etc)
The legal framework for the introduction of smart metering for gas and electricity is given by:
the 3. EU energy market package (RL/2009/72/EG for electricity and RL/2009/73/EG for
gas) and the
the Energy efficiency directive (RL/2006/32/EG)
It has been estimated that the electricity demand reduced by the introduction of SM will be about
3.5%. Reductions will be due to display of the current demand and the introduction of time-of-use
tariffs (PwC 2010).
Current situation in Austria is that approx. 40.000 SM are installed, and it is planned that 80% of
the customers will be equipped in 2020 (E-Control 2010a).
A1.2. Functional requirements
In the Austria consultation paper issued from E-Control the following requirements are listed which
can enable DSM:
Minimum of 4 registers for different tariffs per day (time of use).
Communicate with at least 4 external meters - possible use as synergy for energy
management systems
Interface to external system
It is explicit stated, that the SM would not act as a gateway to home automation system to directly
control external devices (E-Control 2009).
Consultation paper on innovative metering systems in Austria
In April 2007 E-Control posted a consultation paper entitled “Einführung innovativer Messsysteme
in Österreich” (Introduction of Innovative Metering Systems in Austria) on its website (www.e-
control.at). All market participants are entitled to make consultation submissions up to 15 June
2007.
E-Control welcomes the use of innovative metering systems in principle, and takes the view that the
nationwide installation of such systems is already economically viable under current operating
conditions (metering charges). In order to ensure that all market participants enjoy the benefits of
these systems, E-Control recommends imposing the following minimum specification:
Load profile recording;
Bidirectional data communication;
Multi-tariff functionality;

29
Import and export metering;
Power quality monitoring;
Recording of supply interruptions;
Centrally controllable maximum demand control and supply interruption;
Display unit on the meter;
Communication interface with an external display;
Communication interface for the acquisition of data from external metering devices (e.g. gas,
water or district heating).
In addition, metering data should be made accessible to authorized market participants at all times.
A1.3. List of research and demonstration projects and case studies to be included in the case study data base
Innovative Solutions to Optimise Low Voltage Electricity Systems: Power Snap- Shot Analysis by Meters (PSSA-M)
The existing low voltage networks in their traditional form are not rated for integrating a high
number of renewable electricity producers. Today, the relevant decisions on connecting
decentralized energy plants in low voltage networks are based on calculations related to estimated
peak demands in single line sections. For this reason, during the planning, high safety margins have
to be considered in addition. This is consequently restricting the capability of connecting distributed
generation plants.
Therefore, the objective of the project ISOLVES:PSSA-M is to define and develop the required technical
foundations to enable an increasing number of distributed energy feed-in opportunities in low voltage
networks. For this purpose a method is developed to take an instantaneous image of the network, the so-
called "Power Snap-Shot Analysis by Meters" (PSSA-M), and will be applied together with the smart meters
to be adapted in the framework of the project.
Smart Efficiency – CO2 reduction based on automated efficiency and energy analyses for households via smart meters
Since the number of electrical devices in households is growing it is not possible for customers to recognize
which of heir devices have a significant share of the whole electrical enegy consumption. The aim of this
project is to develop an automated energy analysis-tool, which recognizes the major electrical devices out of
the whole household energy consumption. Furthermore the user behavior will be analyzed automatically and
possible energy savingsopportunities are shown in diagrams and tables. Additionally these data is monitored
and assessed automatically.
The aim of this project is to develop a method for an automated energy analysis that provides customers visual advices for reducing, assessing and monitoring the electrical energy demand in their
households. To realize this, the method of nonintrusive load monitoring and data-gathering from smart
meters is used.
The basic idea of the method is to filter typical load profiles of the major electrical devices from the total
electric load profile gathered by smart meters. So, devices like refrigerators and freezers, stoves, ovens,

30
washing machines, dryers, dishwashers, electric water heaters and heating systems as well as the standby
power consumption can be identified in detail.
SGMS – C2G: Consumer to Grid
This study investigates the way in which information about potential energy savings is best
presented to the consumer in order to reduce energy consumption in the smart-grid. C2G aims at
conducting basic research regarding if, how, when and what kind of energy feedback occupants
need regarding a socio-demographic and cultural background. Various established and new forms
of communication, combined with smart metering allow for investigating the impact, the
sustainability and the handling of smart-grid enabled consumers. The expected results shall shed
light on the most resource effective energy feedback methods for the human-in-the-loop in the
smart grid.
These key factors will be obtained through user-centred methods such as interviews, questionnaires,
focus groups, and experience probing. C2G will consider energy consumption information mediated
through letters, emails, interactive online tools, mobile information, personal consultations, smart
meters, energy feedback and ambient devices. Furthermore C2G will research what data and form
of feedback occupants need to perceive, which are indirect, direct, historic, or disaggregated
feedback. The influence of timing and pricing issues will be researched thoroughly and tested in a
one-year trial phase as well.
Results from C2G will illustrate a roadmap of approaches and methods that should be applied
regarding a social, demographical and cultural context. The roadmap shows practical approaches for
our society and enables persons and organisations in charge to take the right steps for a future of
sustained demand reduction without loss of comfort.
A1.4. Penetration scenarios
(PWC 2010])
Scenarios are:
• Scenario I: Penetration of gas and electricity smart meter 95% from 2011 to 2017.
• Scenario II: Penetration of gas and electricity smart meter 95%, electricity smart meter form 2011
to 2015 and gas smart meter from 2011 to 2017.
• Scenario III: Penetration of gas and electricity smart meter 95%, electricity smart meter from 2011
to 2017 and gas smart meter from 2011 to 2019.
• Scenario IV: Penetration of gas and electricity smart meter 80%, from 2011 to 2020.

31
Figure A1 1. Costs and Benefits of the introduction of smart meters for energy supplier, electricity and gas (PwC 2010)
A1.5. References
PwC 2010: PwC Österreich, Studie zur Analyse der Kosten-Nutzen einer österreichweiten
Einführung von Smart Metering, Juni 2010
E-Control 2010a: Leistungskatalog für fernauslesbare Smart Metering-Systeme im Bereich Strom,
Öffentliches Konsultationspapier, Juni 2010.
E-Control 2009: Flächendeckende Einführung von intelligenter Zählergeneration (Smart Meter) bis
2016 realisierbar, Presse Information, März 2009

32
Appendix 2 Present situation of smart metering in Finland
Currently, the number of the AMR meters is increasing rapidly in Finland, because almost all DSOs
have AMR meter installation work ongoing. This is mostly due to the “Government Decree on
settlement and measurement of electricity transactions (66/2009)”.
A2.1. Policies related to smart metering, functional requirements and displays
Above mentioned government decree defines the minimum requirements and functionalities that
energy meters have to meet.
According to this decree, customers’ energy measurements have to be based on hourly
measurements and remote readings. In addition, the customers’ energy meters have to be able to
receive, transmit and execute load control commands. Furthermore, meters have to register begin
and end times of the outages, which last more than three minutes. Furthermore, based on the decree,
the DSO is obliged to read its customers’ hourly energy measurement data once a day, and its
balance settlement has to be based on hourly measurements. Hourly energy measurement data has
to be stored in DSO’s database at least for six years. Similarly data concerning the outages has to be
stored at least for two years.
In addition to previous, decree also states that, if customer requests so, DSO has to provide
customer with AMR meter, which is equipped with standardised interface for real-time power
consumption measurement. Although it is not said exactly, this can be interpreted so that customer
has to be able to connect power consumption display to such meter. However, DSO may charge
customer for this kind of meter.
Furthermore, it is defined that customer’s measurement data has to be given for customer himself,
without any payments. In practice, this can be realised by web-service, as has been already done by
some companies.
Moreover, there are some requirements for metering the distributed generation in the customer
premises. If there is both generation and consumption, and main fuse is at maximum 3*63 A, one
metering device can be used. However, it must be able to meter separately electricity fed to the
network and electricity acquired from the network. It is not permitted to net the network input and
output, but separate registers for these have to be used.
In the case main fuse is over 3*63 A, there have to be separate meters for network input and output.
Furthermore, in this case also consumption of own generation must be metered, which is the
difference between generation of the electricity and output to the network.
A2.2. Penetration scenarios
Based on previously discussed decree, at least 80 % of the customers have to be measured with
AMR meters by 31st of December 2013. However, it is assumable that penetration will be 100 %,

33
since most of the DSOs are installing AMR meters for all customers during their AMR installation
programs.

34
Appendix 3 Present situation of smart metering in France
A3.1. Introduction: a context defined by regulations
The European directive 2009/72/CE promotes smartmeter deployment, fixing a target of 80% of
clients equipped until 2020.1
The article 19 of the law of February 10th 2000 and the article 13 of the law of august 09th 2004
provide that distribution network manager are responsible of the counting necessary and define their
role.
The article 4 of the law of February 10th 2000 specifies that the counting devices set up by the
distribution network manager must allow the energy providers to propose to the clients different
prices depending of the period of the year or the day and encourage the network users to limit their
consumption during the periods of global high consumption.2
The Energy Regulation Committee (CRE) made different declarations about smartmeter counting
on the 5th of July 2001, the 29th of January 2004 and the 6th of June 2007.3
In France, 95% of the electricity distribution is carried out by the company ERDF4, concessionaire
of the granting authorities (often commune grouped together in an energy trade union).
The other 5% are carried out by local distribution companies (Entreprise Locale de Distribution,
ELD) that are most of the time owned as a majority by the local communes.
ERDF was asked by the CRE to experiment an advanced smartmeter counting system, based on
recommendations made in the CRE’s declaration of the 6th of June 2007.5
This pilot project ended in March 2011. The results being positive, this project prefigures the
national deployment of smartmeter systems in France, though some points are still being discussed
as, for instance, what kind of information and services suppliers should provide to their clients in
order to help them reduce their consumption and at what price?
1 Official Journal of the European Union 2 CRE’s deliberation of the 11th of February 2010 about the terms of realisation and evaluation of the ERDF
experiment about low voltage counting device evolution, page 1
3 CRE’s deliberation of the 11th of February 2010 about the terms of realisation and evaluation of the ERDF experiment about low voltage counting device evolution, page 1
4 ERDF’s website
5 CRE, evaluation of the LINKY experiment folder, June 2011, page 5

35
A3.2. Recommendations for functionality and performance of advanced counting systems
These recommendations 6(reference for the entire section) concern:
The counting and measuring devices
The associated teleprocessing device
The following information below is given by the CRE
A3.2.1 Counting and measuring devices
The counting and measuring devices must measure and record the load curve, the maximum power
asked, the various quality characteristics of the electricity provided and must also support multiple
index systems for price setting.
Below are the details of the recommended measuring and recording parameters:
- Load curve (active power): time step of 10, 30, or 60min, with a minimum capacity of 2 months
sliding memory with a 30min time step
- Maximum power asked: daily value with a sliding memory of 2 months
- provided electricity quality: date and duration of short and long power break, date and duration of
voltage excursion out of predefined limits, with a sliding memory of 2 years.
- Index system: 2 different indexes must be supported, 4 indexes for the prices and 10 indexes for
the energy provision (regulated price market offer)
The counting devices must also be able to display information such as: hourly seasonal index,
instantaneous power, maximum power value. They must also include a limiting system (with a
threshold set by step of 1 kVA).
A bidirectional communication, to and from the upstream of the meter, and to the downstream of
the meter:
- Upstream: the smartmeter must allow the transfer of recorded data (energy flow and quality), the
modification of its parameters (price calendars and subscribed power), and the possibility to
command power breaks and power recovery.
- Downstream: there must be a controlled relay based on the price calendar of the distribution
network manager or energy provider, and a data transfer interface for the user, which can transmit
all the data collected to a display device or a remote device.
6 CRE’s deliberation of the 11th of February 2010 about the terms of realisation and evaluation of the ERDF experiment about low voltage counting device evolution, Appendix n° 1 – Criteria hold by the CRE for evaluating the experiment of an advanced counting system by ERDF, page 3 to 5

36
A3.2.2 The teleprocessing system
The teleprocessing system must have a sufficient capacity which permits to collect data every day.
It must permit to command at distance power breaks and power recoveries, to modify the
subscribed power value, to modify the price calendar.
A mobile peak demand must be able to be taken into account, as well as the corresponding notice
from the provider to the network manager, at the latest at 16h the day before.
It must also support the various provider’s price calendar offers and the providers own supply offers
systems, limited in time and quantity.
A user access to all the data recorded and measured by the meter, and so for the past 2 years, must
be available.
A3.3. ERDF’s advanced counting system pilot project: the LINKY
A3.3.1 The LINKY project’s context
ERDF carried out the first pilot project on advanced counting devices.
It consisted in the installation of 300 000 smartmeters in 2 regions, an urban one (Lyon) and a rural
one (Indre et Loir). This experiment occurred between 2009 and March 2011.
A3.3.2 LINKY project’s results
The projects results 7(reference for the entire section) are globally positive: the greatest part of the tested
functionality was validated, as well as the performances, which led to the validation of the
experiment and the decision to pursue its deployment at a national level.
Indeed, the experiment has validated the expected capability to inform the end user, to improve the
electricity market functioning and improve the costs control by the network managers.
A3.3.2.1 Capability to inform the end user
In terms of information given to the end user, the experiment validated that the LINKY can
effectively do everything that is asked in section II-A above.
The device also guarantees the protection and confidentiality of the date recorded
However, a few points must be looked at closer:
the impossibility to send a monthly bill on real energy consumption due to an actual
insufficient information system
the limited visibility of the display of the device
7 CRE, evaluation of the LINKY experiment folder, June 2011, Chapter II Counting device’s functionalities

37
Note that most meters in France are not installed into the houses or flats, but next to the street. That
is why consumer’s organizations and the Environment and Energy Agency (ADEME) promote the
deployment of in-home-displays or other information systems.
A3.3.2.2 Capability to improve the functioning of the market
In terms of improvement of the functioning of the market, the experiment has validated that the
LINKY
gives the possibility to the provider to choose his price calendar independently of the
TURPE (Use Price of the Public Electricity Network) price calendar
make available 4 indexes for the TURPE and 10 indexes for the supply
permits the provider to make limited quantity offers (by using power break or power
decrease distance commands)
integrates a telecontrolled switch, with a 1 kVA step adjustable threshold
permits to command the dry contact of the meter by mean of the provider’s price grid
is compatible with the already existing and installed devices
The only restrictions are that the experiment did not test the tele-payment, neither the recording of
power overrun. However these options de not seem expedient after discussion with the different
actors.
A3.3.2.3 Capability to contribute to the network manager’s cost control
The experiment has validated that the LINKY:
participates in the supply quality control: it implements the voltage level monitoring, the
short and long power break occurrences monitoring, and can memorizes the recorded data
for a minimum of 2 years (sliding memory)
minimizes the running costs by permitting various operations: periodic measurement, power
subscription modification, put in operation and termination of electricity access, power
breaks and recoveries, specific operation to the new competitive market (change of energy
provider, change of price calendar)
A3.3.2.4 Capability to contribute to energy control and to reduce the peak
demand
The experiment has shown that the tested advanced counting device helped in controlling the
energy demand and in reducing the carbon emissions:
renewable energies: allowing no limitation on injected power and counting the reactive
power absorbed by production installations
recording of the instantaneous subscribed power overrun and of the maximum asked power
independent price grids and mobile peak price setting
transmission to users of the different price grid signals
allowing the connection of other information and control devices
The counting device permits to reduce the load demand but not by a power reduction. This
additional complex option has not been asked since a reduction of asked power (instead of a simple

38
power cut) needs that the user is equipped of an energy control device or needs the users’ presence
in order to understand the power cut. Those conditions have been judged too restrictive to be set up.
A3.4. The planned deployment of smartmeters
A3.4.1 Smartmeter deployment
ERDF plans on the deployment of 35 millions of LINKY smartmeters on the 95% of the
distribution network that ERDF manages.
ERDF plans on two targets:
- a first target of a deployment of 7 millions of smartmeters between 2013 and 2015, using G1
communication protocol
- a second target of a deployment of 28 millions of smartmeters during four years (7 millions
per year), using G3 communication protocol
Only G1 communication protocol has been tested so far. G1 is a Frenche version of the BPL
protocol. G3 is based on internet IP addressing system, but is not mature yet.
A3.4.2 The deployment technical and economical studies
Here is the presentation of the technical and economical study directly issued from the CRE’s
report:
The CRE committed to Capgemini Consulting the realisation of a technical and economical study
analysing the costs and profits of the LINKY project at the distribution network manager level.
This study was conducted on the 2011-2038 period, 2038 corresponding to the end-of-life of the
smartmeters deployed during the massive deployment stage.
The net present value (VAN) of the LINKY project is evaluated by the difference between the costs
and the profits associated to the realisation of the project and the ones associated to its non-
realisation (“business as usual”). The estimated earnings are the avoided investments and
functioning costs, while the additional costs are the costs brought by conducting the project.
The price of electricity being one of the most important parameter of the analysis, Capgemini
Consulting developed 2 price evolution scenarios:
- 1: annual average increase of 2.3% on the 2010-2020 period, 1.8% afterwards
- 2: annual average increase of 5.75% on the 2010-2020 period, 1.8% afterwards
On the basis of the hypothesis made by Capgemini Consulting, the VAN of the LINKY project for
the distribution network activity is almost at equilibrium in scenario 1 (€ +0.1 millions) and positive
in scenario 2 ((€ +0.7 millions). The following table describes the content of the VAN

39
(in Billion of €) Scenario 1 Scenario 2
Gross investments* -3,8 -3,8
Meter (equipment and installation) -3,0 -3,0
Hub (equipment and installation) -0,5 -0,5
Information systems -0,3 -0,3
Incomes on investments expenditures due to renewal of existing meters
+1,5 +1,5
Incomes on « network » investments expenditures +0.1 +0.1
Incomes on operation expenditures related to losses +1,2 +1,8
Incomes on operation expenditures related to technical maintenance
+1,0 +1,0
Incomes on operation expenditures related to data collecting
+0,7 +0,7
Other incomes on operation expenditures +0,1 +0,1
Additional costs due to the operation of the advanced counting system
-0,7 -0,7
Total +0,1 +0,7
By taking slightly different hypothesis than ERDF (actualization rate, wage evolution rate), Capgemini evaluates
the total gross investment to € 3.8 billions. ERDF evaluates it at € 4.3 billions.
This evaluation leans upon a massive deployment which would start in 2013 and would end end of 2018, with 90%
of the counting devices being advanced counting devices (the resting 10% being equipped in advanced counting
devices on the 2019-2028 period). About the broadband over power line (BPL) technology, the years 2013 to 2015
would see the deployment of about 7 millions of counting devices (5.1 millions from 2013 to 2014) and 75 000
hubs equipped of a “BPL G1” technology. And during the years 2015 to 2018, the deployment of 28 millions of
counting devices and 345 000 hubs equipped with “BPL G3” technology would occur.
A3.4.3 The CRE’s recommendations for carrying out the LINKY’s deployment
The CRE validated the system. It gave different recommendations concerning the choice of the
communication technology (BPL G1 or G3), the information for the user based on the system’s
counting/measuring data, the preparation of the deployment (communication, information system
functioning, preliminary commercial experiment).
The CRE recommends launching the deployment with the CPL G1 technology, which is sufficient
for the functionalities required by the LINKY system, but aims on the CPL G3 technology
deployment on the long run.
The CPL G3 technology should bring new functionalities to the network manager (joint
observability of high voltage and low voltage network for example).

40
A3.5. Conclusion
The LINKY has proved, through experimentation and validation, to be an adapted advanced
counting system in preparation for the national deployment of smartmeters.
300 000 LINKYs have already been installed by ERDF and experimented. The CRE (Energy
Regulation Committee) validated this experimentation. The deployment objective of this
smartmeters is 35 million smartmeters installed in 2020.
This smartmeter comes with developed functionalities which permit the integration of a DSM
strategy. Load profile access, targeted power cuts, advanced price setting such as DSM mobile peak
price setting. But consumer consumption information should still be improved.
Of course it already puts up with the existing strategies such as heater control or time-of-day rates.
By the end of 2011, there are still political discussions concerning who shall finance the system and
who will own the meter (ERDF or local distribution managers)

41
Appendix 4 Present situation of smart metering in the Netherlands
A4.1. Background
The Dutch Government plans to roll out smart meters following Electricity Directive 2006/32 EC.
The bill concerning the rollout was adopted in February 2011 and was followed by an Order in
Council (“Algemene Maatregel van Bestuur” or “AMvB”) which came into effect on January 1st
2012. This Order determines the functions of the Smart Meter on which the final standard should be
based.
There are currently about 8 million electricity meters and 7.1 million gas meters in the Netherlands.
In a period starting in 2012 up to 2020, 80 percent of these meters will be replaced by smart meters.
A4.2. Responsibilities
The Grid Operators in the Netherlands are responsible for the roll-out of smart meters, for both gas
and electricity. The Netherlands is separated into 9 different grid operators, of which 3 large GO’s
(e.g Alliander, Enexis en Stedin) and six smaller ones.
The grid operators have been working together for some years in the area of smart meters and have
developed a joint organization called “Netbeheer Nederland” which manages a growing range of
projects. At the start it was only intended to develop a joint set of specifications, the Dutch Smart
Meter Requirements (DSMR). Nowadays, the scope has widened to area’s such as purchasing,
testing, communication, privacy & security to name a few.
A4.3. Rollout
The Grid Operators made clear agreements with the government in the Netherlands regarding the
planning of the rollout and the functionalities of the meters.
From the first of January 2012 the GO’s will start with the small-scale rollout. During a two year
period the GO’s will be placing smart meters:
In new domestic houses
As part of regular replacements of old meters
In case a customer requests a smart meter.
The GO’s plan to install smart meters at 450.000 households in these 2 years. As most Dutch
households are dual fuel consumers, this amounts to almost double that number in terms of actual
meters.
Dutch GO’s already have significant experience with smart meters. At the time of the start of the
small scale rollout, GO’s already operated a sizeable number of “legacy meters” – roughly 270.000
E and 230.000 G meters.

42
Up to this moment, pilot projects have used both GPRS and PLC for communication. However,
PLC has a number of drawbacks: interoperability and performance. At this point, PLC
standardization is insufficient to meet Dutch requirements. In addition, PLC requires street by street
rollout which doesn’t fit with the demands of the small scale rollout. For this reason, GPRS will be
used during the small scale rollout.
During the small scale roll-out two evaluation moments are planned. These evaluation moments
focus on two aspects:
Assess whether the energy efficiency targets regarding smart meters are actually being
achieved
Monitor the efficiency of the roll-out
In order to measure the effect of smart meters on energy efficiency, a number of pilot projects are
being carried out. These projects make use of several types of feedback mechanisms such as in-
home displays that are connected to the smart meter.
The large scale rollout is planned to start on January 1st 2014.
A4.4. Design
The current design of the smart meter in the Netherlands is based on the functional requirements
and the global design as laid down in the NTA (Netherland technical Agreement). The functional
specifications are detailed in the DSMR to insure interoperability. Various versions of the DSMR
have already been developed and published on the Netbeheer Nederland website. As Figure A4 1
shows, the DSMR architecture uses P1, P2, P3 and P4 ports to communicate. Note that the gas
meter connects to the network via the electricity meter (P2).
Figure A4 1. DSMR High Level Architecture
2007:
NTA8130
2009:
DSMR 2.2
2010:
DSMR 3.0
2011:
DSMR 4.0
2013:
DSMR 5.0
Specifying together Testing together Purchasing together
Requirements:
Role NBNL:

43
The Grid Operators and the Dutch Legislator have agreed to plan 3 releases of the smart meter:
1. The current meter, DSMR version 2.2, which can be installed until the end of 2012.
2. The next release will be the DSMR4.0 meter. This meter must be compliant with the Dutch
Privacy& Security requirements version 1.5. In addition, temperature correction for gas
must be implemented.
3. The final version (DSMR5.0) must be completely in line with the legislation. The most
important requirement in this release is that the meter must be modular. The DSMR5.0-
meter will be used during the large scale roll out.
The overall phasing regarding roll-out, legislation and standardization is shown in Figure A4 2
below.
Figure A4 2. Legislation vs DSMR versions
An important decision that still has to be made for the large scale roll out is the communication
technology that will be implemented. A number of options is being investigated, including
GPRS/LTE, PLC and CDMA.
2011 2012 2013 2014 2015 2016>>2010
Small scale roll-out Large scale roll-out
Rollout phases
Pilot roll-out
Evaluation Evaluation
Standardisation
DSMR 2.2 meters DSMR 4.0 meterspilots meters DSMR 5.0/x.x meters
Legislation
*AMvB phase 1
AMvB phase 2
AMvB phase 3
New law approved

44
Appendix 5 Present situation of smart metering in Spain
It is important to note the key role that the “smart grid” has in the implantation of demand side
management measures, defining “smart grid” as the process “to transform the functionality of the
present electricity transmission and distribution grids so that they are able to provide a user-oriented
service, enabling the achievement of the 20/20/20 targets and guaranteeing, in an electricity market
environment, high security, quality and economic efficiency of electricity supply” (ENTSOE).
Therefore the installation of smart meters that allow the smart measures and management will be a
key role in the path of the development of demand side management measures in Spain.
Additionally, smart meters could play a relevant role in the profiling system for settlements.
A5.1. Regulatory framework
In 2007, since the publication of the “Reglamento Unificado de Puntos de Medida” (RD
1110/2007) and of the “Orden Ministerial por la que se regula el control metrológico del estado”
(ITC/3022/2007), the regulatory framework for smart meters in the residential sector establish new
functionalities to be implemented in the meters.
At the end of 2007, Spain approved the National Plan for Meters Substitution which involved the
obligation for distribution companies to change 26 millions of meters in the residential sector in
Spain for 2018. In addition consumers will pay around 15 % more each month for the smart meter
rent since the moment that they have a new meter.
However the delay in the implementation of this plan has motivated a revision of milestones in the
Orden IET/290/2012 maintaining the target of 26 millions of meters for 2018 but rescheduling the
milestones.
Figure A5 1. Spanish Smart Meters Substitution Plan
A5.2. Functional requirements in Spanish smart meters
The functional requirements for the smart meters in Spain are detailed in the RD 1110/2007 and in
the ITC/3022/2007 and can be summarized as follows:
11 años – Desde enero de 2008 a diciembre de 2018
30% (7,8
millones)
Jun. 2008 Dic. 2010 Dic. 2015 Dic. 2018Dic. 2012
20% (5,2
millones)
20% (5,2
millones)
30% (7,8
millones)
Dic. 2016 Dic. 2018Dic. 2014
35% 35% 30%Actualizado febrero 2012Orden IET /290/2012

45
End user information (demand, maximum power, TOU, information of load control…)
Remote reading of power, energy consumed and other information (hourly measures)
Verification of communications
Verification of smart meter well functioning
Event report (lack of voltage, overvoltage…)
Remote synchronization of date and time
Software y firmware update
Remote control of contract power
Management of TOU (at least with 6 periods) including dynamic updates of the tariffs
Load management
A5.3. Communications
An Advanced Metering Infrastructure (AMI) is not only a smart meter but also the different
communications infrastrucutres and protocols. (AMI implies an evolution from the Automatic
Meter Reading, AMR, including new functionalites and advances services)
Normally the communication infrastructure for an AMI system is composed by three big segments:
LAN (Red Local). This segment connects the smart meters with the communications
Gateway.
WAN Acces (Red de Acceso). This part is the communication system between the
communications Gateway and the Data Concentrator Unit (DCU) wich aggregates
information from different local areas and communicates with the management center.
WAN (Red Troncal). Connects the different DCU with the Central Management System and
also connects the different players
Figure A5 2. AMI basic scheme
The communication system is essential in the AMIs because it can be a enabler or a barrier in the
implementation of advanced Demand Side Management measures and services. In Spain there is the
example developed within the GAD Project which communications architecture is shown in the
next figure.

46
Figure A5 3. GAD Project communication architecture.
It is important to mention that in parallel with the installation of smart meters distributors are
developing Smart Meters systems in order to have a complete telemeasuring and telemanagement of
the meters installed. The Spanish Plan fixed 2014 as dealing to have this telemanagement and
telemeasuring systems
A5.4. National projects
In addition to European projects in which Spain is involved there are other many national projects
regarding smart meters. Here we describe two of them: the Gad Project and the PRICE project
• GAD Project
o Participants: Leader: IBERDORLA. ITC partners: GTD SISTEMAS DE
INFORMACIÓN, S.A., SIEMENS, S.A., DISTRIBUIDORA INDUSTRIAL DE
AUTOMATISMOS Y TELETRANSMISIÓN, S.A., ZIV MEDIDA, S.L., ERICSSON
ESPAÑA, S.A. Energy partners Energy Area, Grupo GAS NATURAL, RED
ELÉCTRICA DE ESPAÑA. Capital godos area: FORESIS, FAGOR
ELECTRODOMESTICOS, BSH ELECTRODOMESTICOS, ALTRA Corporación
empresarial, ORBIS tecnología eléctrcia and 14 Spanish Research centers (Centro
Andaluz de Innovación y Tecnologías de la Información y las Comunicaciones, Centro de
Desarrollo de las Telecomunicaciones de Castilla y León, Ikerlan (Centro de
Investigaciones Tecnológicas), Instituto de Tecnología Eléctrica, Universidad de Alcalá
de Henares, Universidad Politécnica de Madrid, Universidad de Zaragoza, Centre
Tecnològic de Telecomunicacions de Catalunya, Fundación Labein, Instituto de
Ingeniería del Conocimiento,Instituto Tecnológico de Aragón, Universidad de Málaga,
Universidad Pontificia de Comillas - Instituto de Investigación Tecnológica, Universitat
Ramon Llull)

47
o Time period: 2007 to 2010 (budget 23 M€)
o Project Description (objectives/goals): The ultimate aim of the GAD Active Demand
Side Management Project was to optimise electrical energy consumption and the costs
associated, while meeting consumer needs and maintaining quality standards.
Implementing this project generated the knowledge necessary to standardise different
consumption patterns and provide users and final consumption items with signs that
would allow them to freely decide based on prices, energy source, environmental impact,
etc, in the case of the former, and to stand at the most appropriate level of consumption -
providing user consent- in the case of the latter. Furthermore, the new management
mechanisms will require the corresponding network automation, which may result in an
improvement of the quality of the electrical supply.
o Scope of the demonstration: 1 house full equipped with smart meters and appliances,
TSO, DSO and retailer management systems developed.
• PRICE Project
o Participants: Leader: IBERDORLA and Grupo GAS NATURAL. Partners: RED
ELÉCTRICA DE ESPAÑA, INDRA, FAGOR ELECTRODOMÉSTICOS, ZIV I+D. ITE
IKERLAN.
o Time period: 2011 to 2013 (budget 34 M€)
o Project Description (objectives/goals): This Project has a wide scope including all the
aspects related to integration of distributed resources. Regarding DSM the goal is to
develope a monitoring and management system (for DSO, TSO and retailer) that take
into account consumers with smart meters (installed within the context of the National
Smart meters substitution Plan)
o Size of the demonstration: 500.000 homes with smart meters, 50 houses full equipped
with smart meters and appliances.

48
Appendix 6 Overview of the IEA Demand-Side Management Programme
IEA Demand Side Management Programme The Demand-Side Management (DSM) Programme is one of more than 40 co-operative energy technology programmes within the framework of the International Energy Agency (IEA).The Demand-Side Management (DSM) Programme, which was initiated in 1993, deals with a variety of strategies to reduce energy demand. The following 16 member countries and the European Commission have been working to identify and promote opportunities for DSM:
Austria Netherlands Belgium Norway Canada New Zealand
Finland Spain France Sweden India Switzerland Italy United Kingdom Republic of Korea United States Sponsors: RAP
Programme Vision during the period 2008 - 2012: Demand side activities should be active elements and the first choice in all energy policy decisions designed to create more reliable and more sustainable energy systems Programme Mission: Deliver to its stakeholders, materials that are readily applicable for them in crafting and implementing policies and measures. The Programme should also deliver technology and applications that either facilitate operations of energy systems or facilitate necessary market transformations The Programme’s work is organized into two clusters:
The load shape cluster, and
The load level cluster. The ‘load shape” cluster will include Tasks that seek to impact the shape of the load curve over very short (minutes-hours-day) to longer (days-week-season) time periods. Work within this cluster primarily increases the reliability of systems. The “load level” will include Tasks that seek to shift the load curve to lower demand levels or shift between loads from one energy system to another. Work within this cluster primarily targets the reduction of emissions. A total of 24 projects or “Tasks” have been initiated since the beginning of the DSM Programme. The overall program is monitored by an Executive Committee consisting of representatives from each contracting party to the Implementing Agreement. The leadership and management of the individual Tasks are the responsibility of Operating Agents. These Tasks and their respective Operating Agents are: Task 1 International Database on Demand-Side Management & Evaluation Guidebook on the Impact of DSM and EE for Kyoto’s GHG Targets - Completed Harry Vreuls, NOVEM, the Netherlands Task 2 Communications Technologies for Demand-Side Management - Completed Richard Formby, EA Technology, United Kingdom Task 3 Cooperative Procurement of Innovative Technologies for Demand-Side Management – Completed Dr. Hans Westling, Promandat AB, Sweden

49
Task 4 Development of Improved Methods for Integrating Demand-Side Management into Resource Planning - Completed Grayson Heffner, EPRI, United States Task 5 Techniques for Implementation of Demand-Side Management Technology in the Marketplace - Completed Juan Comas, FECSA, Spain Task 6 DSM and Energy Efficiency in Changing Electricity Business Environments – Completed David Crossley, Energy Futures, Australia Pty. Ltd., Australia Task 7 International Collaboration on Market Transformation - Completed Verney Ryan, BRE, United Kingdom Task 8 Demand-Side Bidding in a Competitive Electricity Market - Completed Linda Hull, EA Technology Ltd, United Kingdom Task 9 The Role of Municipalities in a Liberalised System - Completed Martin Cahn, Energie Cites, France Task 10 Performance Contracting - Completed Dr. Hans Westling, Promandat AB, Sweden Task 11 Time of Use Pricing and Energy Use for Demand Management Delivery- Completed Richard Formby, EA Technology Ltd, United Kingdom Task 12 Energy Standards To be determined
Task 13 Demand Response Resources - Completed Ross Malme, RETX, United States Task 14 White Certificates – Completed Antonio Capozza, CESI, Italy Task 15 Network-Driven DSM - Completed David Crossley, Energy Futures Australia Pty. Ltd, Australia Task 16 Competitive Energy Services Jan W. Bleyl, Graz Energy Agency, Austria Seppo Silvonen/Pertti Koski, Motiva, Finland Task 17 Integration of Demand Side Management, Distributed Generation, Renewable Energy Sources and Energy Storages Seppo Kärkkäinen, Elektraflex Oy, Finland Task 18 Demand Side Management and Climate Change - Completed David Crossley, Energy Futures Australia Pty. Ltd, Australia Task 19 Micro Demand Response and Energy Saving - Completed Barry Watson, EA Technology Ltd, United Kingdom Task 20 Branding of Energy Efficiency Balawant Joshi, ABPS Infrastructure Private Limited, India Task 21 Standardisation of Energy Savings Calculations Harry Vreuls, SenterNovem, Netherlands

50
Task 22 Energy Efficiency Portfolio Standards Balawant Joshi, ABPS Infrastructure Private Limited, India Task 23 The Role of Customers in Delivering Effective Smart Grids Linda Hull. EA Technology Ltd, United Kingdom Task 24 Closing the loop - Behaviour change in DSM, from theory to policies and practice Sea Rotmann, SEA, New Zealand and Ruth Mourik DuneWorks, Netherlands For additional Information contact the DSM Executive Secretary, Anne Bengtson, Box 47096, 100 74 Stockholm, Sweden. Phone: +46 8 510 50830, Fax: +46 8 510 50830. E-mail: [email protected] Also, visit the IEA DSM website: http://www.ieadsm.org