CHAPTER Cardiovascular Structure and Function 2.1 ... · The most basic functions of the ......
10
35 CHAPTER 2 Cardiovascular Structure and Function 2.1 Introduction One may question why it is important for a biomedical engineer to study physiology. To answer this question, we can begin by recogniz- ing that cardiovascular disorders are now the main cause of death in developed nations. Furthermore, to understand the pathologies or dysfunctions of the cardiovascular system, engineers must first begin to understand the physiology or proper functioning of that system. If an engineer would like to design devices and procedures to remedy those cardiovascular pathologies, then she or he must be well acquainted with physiology. The cardiovascular system consists of the heart, arteries, veins, capillaries, and lymphatic vessels. Lymphatic vessels collect extracel- lular fluid and return it to circulation. The most basic functions of the cardiovascular system are to deliver oxygen and nutrients, remove waste, and regulate temperature. The heart is actually two pumps: the left heart and the right heart. The amount of blood coming from the heart (cardiac output) is dependent on arterial pressure. This chapter deals with the heart and its ability to generate arterial pressure in order to pump blood. The adult human heart has a mass of approximately 300 g. If it beats 70 times per minute, then it will beat ~100,000 times per day, ~35 million times per year, and ~3 billion times (3 × 10 9 ) during your lifetime. If each beat ejects 70 mL of blood, your heart pumps over 7000 L, or the equivalent of 1800 gal/day. That is the same as 30 barrels of blood each and every day of your life! The lifetime equivalent work done by the heart is the equivalent of lifting a 30-ton weight to the top of Mount Everest. All of this work is done by a very hard- working 300-g muscle that does not rest! SAMPLE CHAPTER SAMPLE CHAPTER
-
Upload
dangkhuong -
Category
Documents
-
view
214 -
download
0
Transcript of CHAPTER Cardiovascular Structure and Function 2.1 ... · The most basic functions of the ......
35
CHAPTER 2Cardiovascular Structure and
Function
2.1 IntroductionOne may question why it is important for a biomedical engineer to study physiology. To answer this question, we can begin by recogniz-ing that cardiovascular disorders are now the main cause of death in developed nations. Furthermore, to understand the pathologies or dysfunctions of the cardiovascular system, engineers must first begin to understand the physiology or proper functioning of that system. If an engineer would like to design devices and procedures to remedy those cardiovascular pathologies, then she or he must be well acquainted with physiology.
The cardiovascular system consists of the heart, arteries, veins, capillaries, and lymphatic vessels. Lymphatic vessels collect extracel-lular fluid and return it to circulation. The most basic functions of the cardiovascular system are to deliver oxygen and nutrients, remove waste, and regulate temperature.
The heart is actually two pumps: the left heart and the right heart. The amount of blood coming from the heart (cardiac output) is dependent on arterial pressure. This chapter deals with the heart and its ability to generate arterial pressure in order to pump blood.
The adult human heart has a mass of approximately 300 g. If it beats 70 times per minute, then it will beat ~100,000 times per day, ~35 million times per year, and ~3 billion times (3 × 10⁹) during your lifetime. If each beat ejects 70 mL of blood, your heart pumps over 7000 L, or the equivalent of 1800 gal/day. That is the same as 30 barrels of blood each and every day of your life! The lifetime equivalent work done by the heart is the equivalent of lifting a 30-ton weight to the top of Mount Everest. All of this work is done by a very hard-working 300-g muscle that does not rest!
02_Waite_Ch02_035-082.indd 35 09/06/17 9:43 AM
SAMPLE C
HAPTER
SAMPLE C
HAPTER
Ca rd i o vascu la r S t ruc tu re and Func t i on 37 36 Chap t e r Two
2.2 Clinical FeaturesA 58-year-old German woman had undergone surgery in 1974 to fix a mitral stenosis.1 She later developed a restenosis, which caused the mitral valve to leak. She underwent surgery in November 1982 to replace her natural mitral valve with a Björk-Shiley convexo-concave mitral prosthesis.2
In July 1992, she suffered sudden and severe difficulty breathing and was admitted to the hospital in her hometown in Germany. She had fluid in her lungs, and the diagnosis was that she had a serious hemodynamic disturbance due to inadequate heart function (cardio-genic shock). The physician listened for heart sounds but did not hear the normal “click” associated with a prosthetic valve. The patient’s heart rate was 150 beats/min, her systolic blood pressure was 50 mmHg, and her arterial oxygen saturation was 78%.
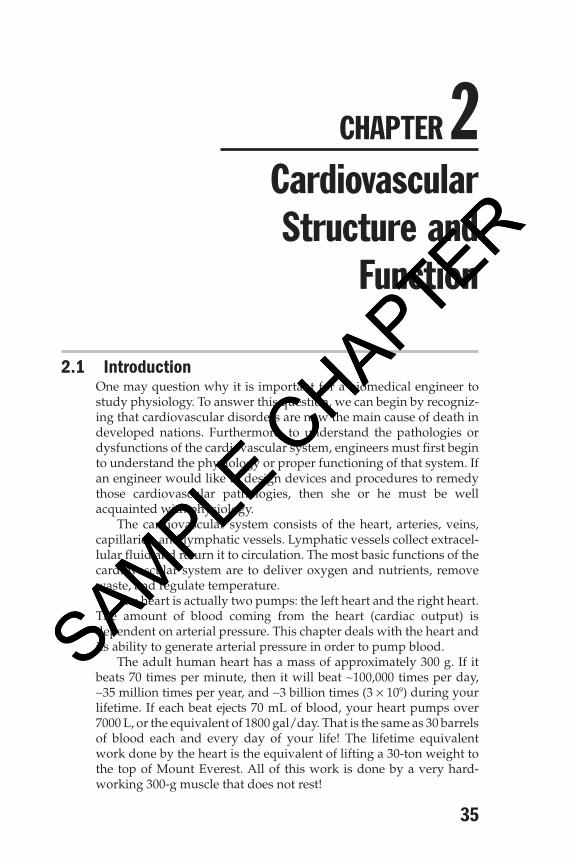
Echocardiography3 was performed, and no valve disk was seen inside the valve ring. An x-ray (see Fig. 2.1) appeared to show the valve disk in the abdominal aorta and the outflow strut in the pulmonary vein. Emergency surgery was performed, the disk and outflow strut were removed, and a new Medtronic-Hall mitral valve prosthesis was implanted into the woman. She eventually recovered.
Figure 2.1 X-ray film showing escaped strut and disk (arrow). (Courtesy of GEORG THIEME VERLAG KG Thoracic Cardiovascular Surgeon, 1993, 41, p. 78, Figure 1.)
1Narrowing or stricture.2Artificial body part.3Graphically recording the position and motion of the heart walls and internal structures.
02_Waite_Ch02_035-082.indd 36 09/06/17 9:43 AM
SAMPLE C
HAPTER
SAMPLE C
HAPTER
Ca rd i o vascu la r S t ruc tu re and Func t i on 37 36 Chap t e r Two
Aorta
Pulmonaryartery
Pulmonarycapillaries
Pulmonaryvein
Arteries
Systemiccapillaries
Leftventricle
Vena cava
Rightventricle
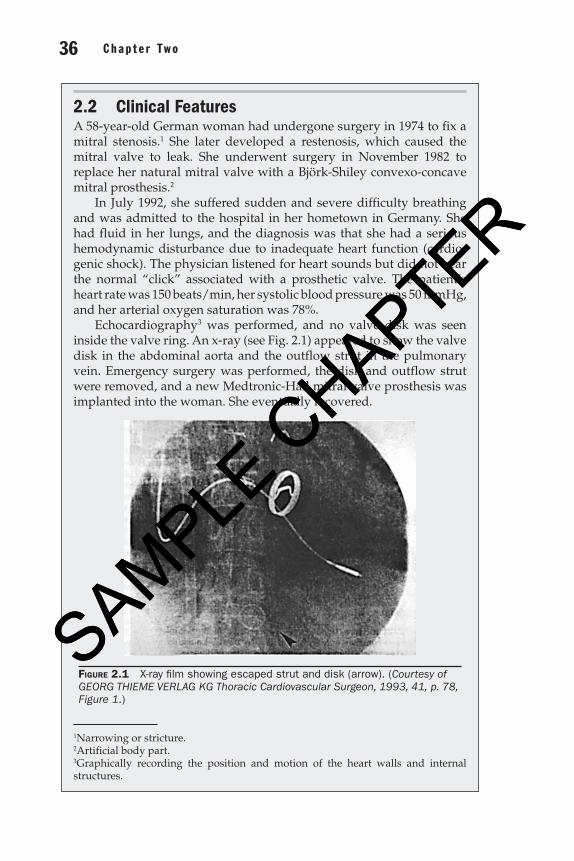
Figure 2.2 Pulmonary circulation and systemic circulation.
2.3 Functional AnatomyThe cardiovascular system can be further divided into three sub-systems. The systemic circulation, the pulmonary circulation, and the coronary circulation are the subsystems that, along with the heart and lungs, make up the cardiovascular system (see Fig. 2.2).
The three systems can be divided functionally based on the tissue to which they supply oxygenated blood. The systemic circulation is the subsystem supplied by the aorta that feeds the systemic capillar-ies. The pulmonary circulation is the subsystem supplied by the pulmonary artery that feeds the pulmonary capillaries. The coronary circulation is the specialized blood supply that perfuses cardiac muscle (perfuse means to push or pour a substance or fluid through a body part or tissue).
02_Waite_Ch02_035-082.indd 37 09/06/17 9:43 AM
SAMPLE C
HAPTER
SAMPLE C
HAPTER
Ca rd i o vascu la r S t ruc tu re and Func t i on 39 38 Chap t e r Two
The cardiovascular system has four basic functions:
1. It supplies oxygen to body tissues.
2. It supplies nutrients to those same tissues.
3. It removes carbon dioxide and other wastes from the body.
4. It regulates temperature.
The path of blood flowing through the circulatory system and the pressures of the blood at various points along the path tell us much about how tissue is perfused with oxygen. The left heart supplies oxygenated blood to the aorta at a relatively high pressure.
Blood continues to flow along the path through the circulatory system, and its path may be described as follows: Blood flows into smaller arteries and finally into systemic capillaries where oxygen is supplied to the surrounding tissues. At the same time, it picks up waste carbon dioxide from that same tissue and continues flowing into the veins. Eventually, the blood returns to the vena cava. From the vena cava, deoxygenated blood flows into the right heart. From the right heart, the still deoxygenated blood flows into the pulmo-nary artery. The pulmonary artery supplies blood to the lungs where carbon dioxide is exchanged with oxygen. The blood, which has been enriched with oxygen, flows from the lungs, through the pulmonary veins and back to the left heart.
It is interesting to note that blood flowing through the pulmonary artery is deoxygenated and blood flowing through the pulmonary vein is oxygenated. Although systemic arteries carry oxygenated blood, it is a mistake to think of arteries only as vessels that carry oxygenated blood. A more appropriate distinction between arteries and veins is that arteries carry blood at a relatively higher pressure than the pressure within the corresponding veins.
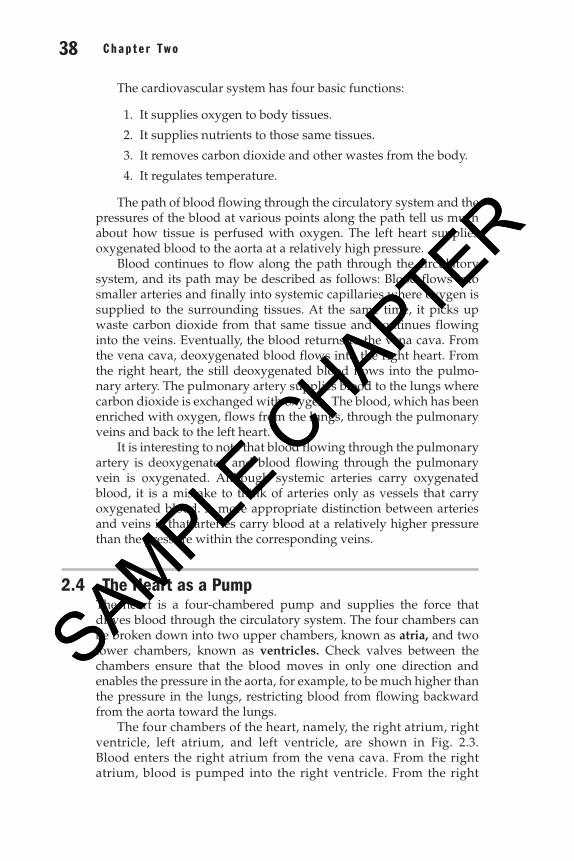
2.4 The Heart as a PumpThe heart is a four-chambered pump and supplies the force that drives blood through the circulatory system. The four chambers can be broken down into two upper chambers, known as atria, and two lower chambers, known as ventricles. Check valves between the chambers ensure that the blood moves in only one direction and enables the pressure in the aorta, for example, to be much higher than the pressure in the lungs, restricting blood from flowing backward from the aorta toward the lungs.
The four chambers of the heart, namely, the right atrium, right ventricle, left atrium, and left ventricle, are shown in Fig. 2.3. Blood enters the right atrium from the vena cava. From the right atrium, blood is pumped into the right ventricle. From the right
02_Waite_Ch02_035-082.indd 38 09/06/17 9:43 AM
SAMPLE C
HAPTER
SAMPLE C
HAPTER
Ca rd i o vascu la r S t ruc tu re and Func t i on 39 38 Chap t e r Two
ventricle, blood is pumped downstream through the pulmonary artery to the lungs where it is enriched with oxygen and gives up carbon dioxide.
On the left side of the heart, oxygen-enriched blood enters the left atrium from the pulmonary vein. When the left atrium contracts, it pumps blood into the left ventricle. When the left ventricle contracts, it pumps blood to a relatively high pressure, ejecting it from the left ventricle into the aorta.
2.5 Cardiac Muscle The myocardium, or muscle tissue of the heart, is composed of mil-lions of elongated, striated, multinucleated cardiac muscle cells. These cells are approximately 15 mm × 15 mm × 150 mm long and can be depolarized and repolarized like skeletal muscle cells. The meaning of the terms “depolarized” and “repolarized” will be explained in
Inferiorvena cava
Mitralvalve
Left p
ulmon
ary v
eins
Pulmonary
artery
Right p
ulmon
ary
veins
Aorta
Superiorvena cava
Rightatrium
Tricuspidvalve
Rightventricle
Leftventricle
Leftatrium
Figure 2.3 Heart chambers and flow through the heart. Direction of blood flow is indicated by arrows.
02_Waite_Ch02_035-082.indd 39 09/06/17 9:43 AM
SAMPLE C
HAPTER
SAMPLE C
HAPTER
Ca rd i o vascu la r S t ruc tu re and Func t i on 41 40 Chap t e r Two
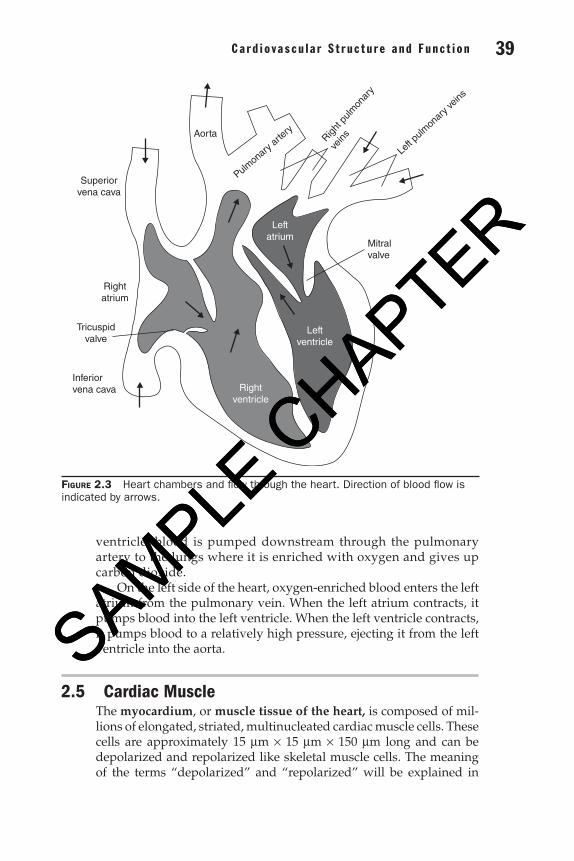
Section 2.6. Figure 2.4 shows a typical group of myocardial muscle cells. Individual cardiac muscle cells are interconnected by dense structures known as intercalated disks. The cells form a latticework of muscular tissue known as a syncytium.
A multinucleated mass of cardiac muscle cells form a functional syncytium (pronounced sin–sish’ e-um). The heart has two separate muscle syncytia. The first is the muscle mass that makes up the two atria, and the second is the muscle mass that makes up the two ven-tricles. The two syncytia are separated by fibrous rings that surround the valves between atria and ventricles. When one muscle mass is stimulated, the action potential spreads over the entire syncytium. As a result, under normal circumstances, both atria and both ventricles contract simultaneously.
Contraction in myocardium takes 10 to 15 times longer than it takes in average skeletal muscle. Myocardium contracts more slowly because sodium/calcium channels in myocardium are much slower than the sodium channel in skeletal muscle, during repolarization. In addition, immediately after the onset of the action potential, the per-meability of cardiac muscle membrane for potassium ions decreases about five-fold. This effect does not happen in skeletal muscle. This decrease in permeability prevents a quick return of the action potential to its resting level.
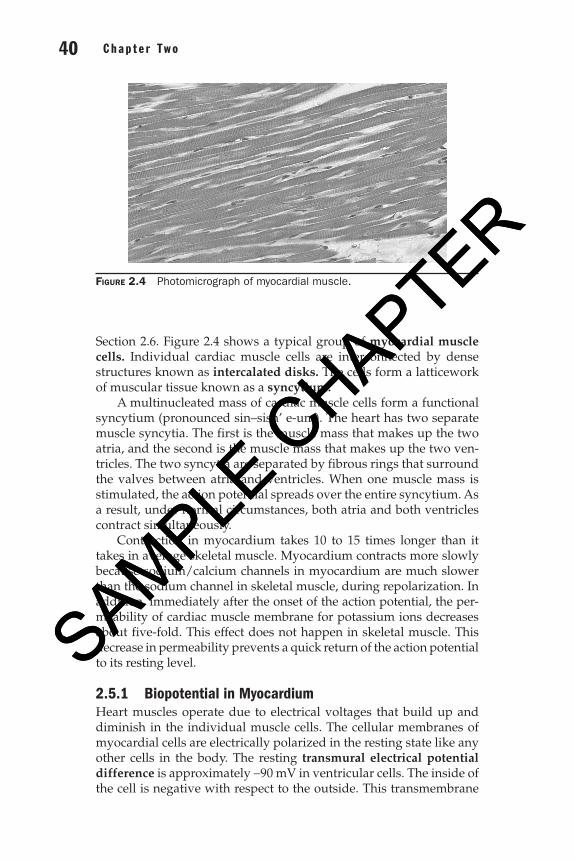
2.5.1 Biopotential in MyocardiumHeart muscles operate due to electrical voltages that build up and diminish in the individual muscle cells. The cellular membranes of myocardial cells are electrically polarized in the resting state like any other cells in the body. The resting transmural electrical potential difference is approximately -90 mV in ventricular cells. The inside of the cell is negative with respect to the outside. This transmembrane
Figure 2.4 Photomicrograph of myocardial muscle.
02_Waite_Ch02_035-082.indd 40 09/06/17 9:43 AM
SAMPLE C
HAPTER
SAMPLE C
HAPTER
Ca rd i o vascu la r S t ruc tu re and Func t i on 41 40 Chap t e r Two
potential exists because the cell membrane is selectively permeable to charged particles. Figure 2.5 shows the transmembrane resting potential in a cardiac cell.
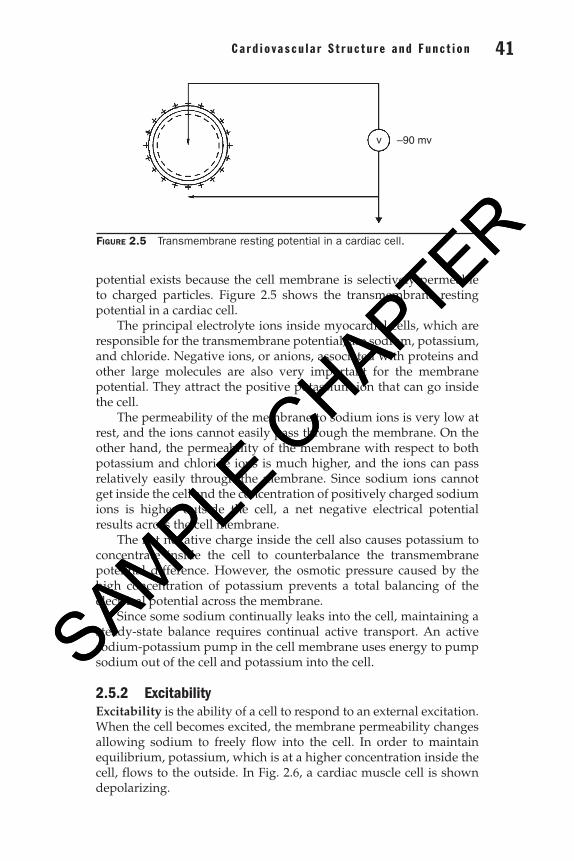
The principal electrolyte ions inside myocardial cells, which are responsible for the transmembrane potential, are sodium, potassium, and chloride. Negative ions, or anions, associated with proteins and other large molecules are also very important for the membrane potential. They attract the positive potassium ion that can go inside the cell.
The permeability of the membrane to sodium ions is very low at rest, and the ions cannot easily pass through the membrane. On the other hand, the permeability of the membrane with respect to both potassium and chloride ions is much higher, and the ions can pass relatively easily through the membrane. Since sodium ions cannot get inside the cell and the concentration of positively charged sodium ions is higher outside the cell, a net negative electrical potential results across the cell membrane.
The net negative charge inside the cell also causes potassium to concentrate inside the cell to counterbalance the transmembrane potential difference. However, the osmotic pressure caused by the high concentration of potassium prevents a total balancing of the electrical potential across the membrane.
Since some sodium continually leaks into the cell, maintaining a steady-state balance requires continual active transport. An active sodium-potassium pump in the cell membrane uses energy to pump sodium out of the cell and potassium into the cell.
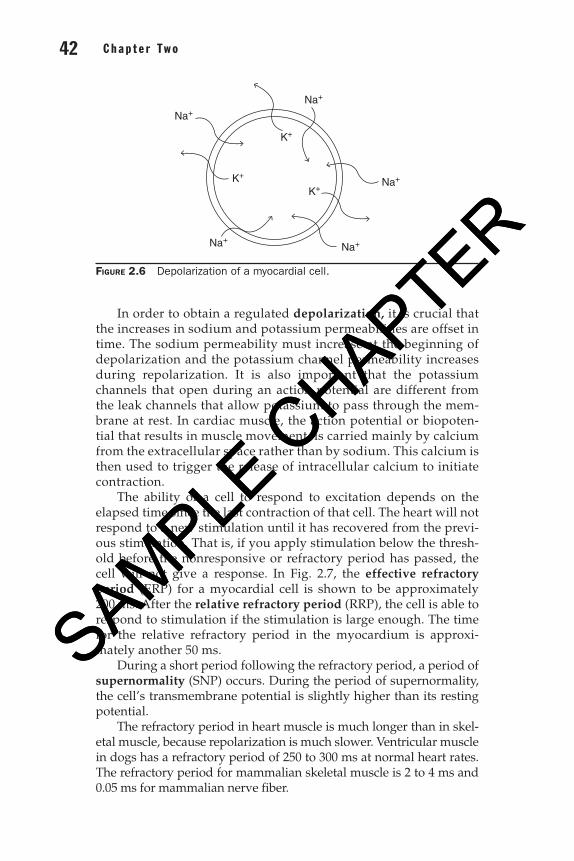
2.5.2 ExcitabilityExcitability is the ability of a cell to respond to an external excitation. When the cell becomes excited, the membrane permeability changes allowing sodium to freely flow into the cell. In order to maintain equilibrium, potassium, which is at a higher concentration inside the cell, flows to the outside. In Fig. 2.6, a cardiac muscle cell is shown depolarizing.
v –90 mv
Figure 2.5 Transmembrane resting potential in a cardiac cell.
02_Waite_Ch02_035-082.indd 41 09/06/17 9:43 AM
SAMPLE C
HAPTER
SAMPLE C
HAPTER
Ca rd i o vascu la r S t ruc tu re and Func t i on 43 42 Chap t e r Two
In order to obtain a regulated depolarization, it is crucial that the increases in sodium and potassium permeabilities are offset in time. The sodium permeability must increase at the beginning of depolarization and the potassium channel permeability increases during repolarization. It is also important that the potassium channels that open during an action potential are different from the leak channels that allow potassium to pass through the mem-brane at rest. In cardiac muscle, the action potential or biopoten-tial that results in muscle movement, is carried mainly by calcium from the extracellular space rather than by sodium. This calcium is then used to trigger the release of intracellular calcium to initiate contraction.
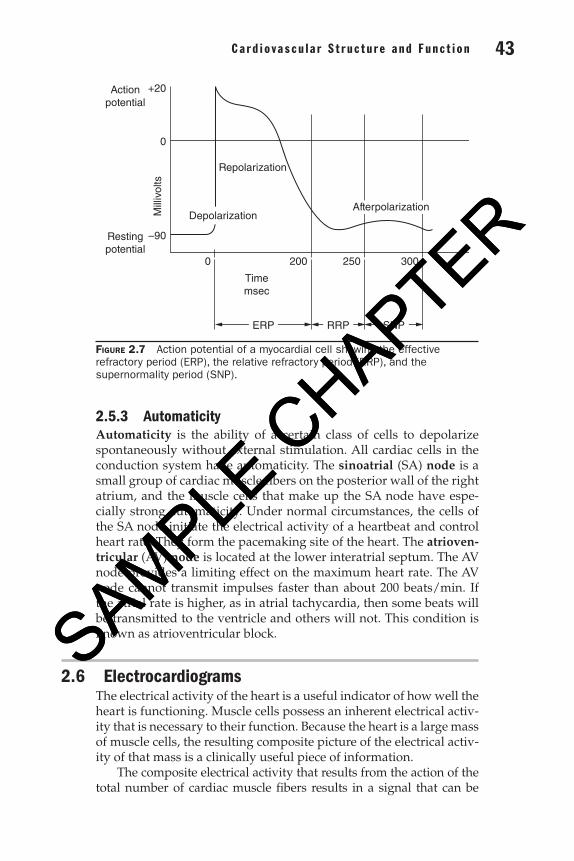
The ability of a cell to respond to excitation depends on the elapsed time since the last contraction of that cell. The heart will not respond to a new stimulation until it has recovered from the previ-ous stimulation. That is, if you apply stimulation below the thresh-old before the nonresponsive or refractory period has passed, the cell will not give a response. In Fig. 2.7, the effective refractory period (ERP) for a myocardial cell is shown to be approximately 200 ms. After the relative refractory period (RRP), the cell is able to respond to stimulation if the stimulation is large enough. The time for the relative refractory period in the myocardium is approxi-mately another 50 ms.
During a short period following the refractory period, a period of supernormality (SNP) occurs. During the period of supernormality, the cell’s transmembrane potential is slightly higher than its resting potential.
The refractory period in heart muscle is much longer than in skel-etal muscle, because repolarization is much slower. Ventricular muscle in dogs has a refractory period of 250 to 300 ms at normal heart rates. The refractory period for mammalian skeletal muscle is 2 to 4 ms and 0.05 ms for mammalian nerve fiber.
Na+
Na+
Na+
K+
K+
K+
Na+
Na+
Figure 2.6 Depolarization of a myocardial cell.
02_Waite_Ch02_035-082.indd 42 09/06/17 9:43 AM
SAMPLE C
HAPTER
SAMPLE C
HAPTER
Ca rd i o vascu la r S t ruc tu re and Func t i on 43 42 Chap t e r Two
2.5.3 AutomaticityAutomaticity is the ability of a certain class of cells to depolarize spontaneously without external stimulation. All cardiac cells in the conduction system have automaticity. The sinoatrial (SA) node is a small group of cardiac muscle fibers on the posterior wall of the right atrium, and the muscle cells that make up the SA node have espe-cially strong automaticity. Under normal circumstances, the cells of the SA node initiate the electrical activity of a heartbeat and control heart rate. They form the pacemaking site of the heart. The atrioven-tricular (AV) node is located at the lower interatrial septum. The AV node provides a limiting effect on the maximum heart rate. The AV node cannot transmit impulses faster than about 200 beats/min. If the atrial rate is higher, as in atrial tachycardia, then some beats will be transmitted to the ventricle and others will not. This condition is known as atrioventricular block.
2.6 ElectrocardiogramsThe electrical activity of the heart is a useful indicator of how well the heart is functioning. Muscle cells possess an inherent electrical activ-ity that is necessary to their function. Because the heart is a large mass of muscle cells, the resulting composite picture of the electrical activ-ity of that mass is a clinically useful piece of information.
The composite electrical activity that results from the action of the total number of cardiac muscle fibers results in a signal that can be
200 250 300
Timemsec
ERP RRP SNP
0
RepolarizationM
illiv
olts
0
+20
–90
Actionpotential
Restingpotential
AfterpolarizationDepolarization
Figure 2.7 Action potential of a myocardial cell showing the effective refractory period (ERP), the relative refractory period (RRP), and the supernormality period (SNP).
02_Waite_Ch02_035-082.indd 43 09/06/17 9:43 AM
SAMPLE C
HAPTER
SAMPLE C
HAPTER
Ca rd i o vascu la r S t ruc tu re and Func t i on 45 44 Chap t e r Two
approximately represented by a vector quantity. Imagine for a moment, the electrical field that would be generated on the surface of the body as a result of a battery “spinning” in 3-D space inside your body. In this vector model, the heart is an electric dipole located in the thorax. The dipole can be represented by the dipole moment vector M
. M
points from the negative to the positive “pole,” or charge, and has a magni-tude equal to the charge multiplied by the separation distance.
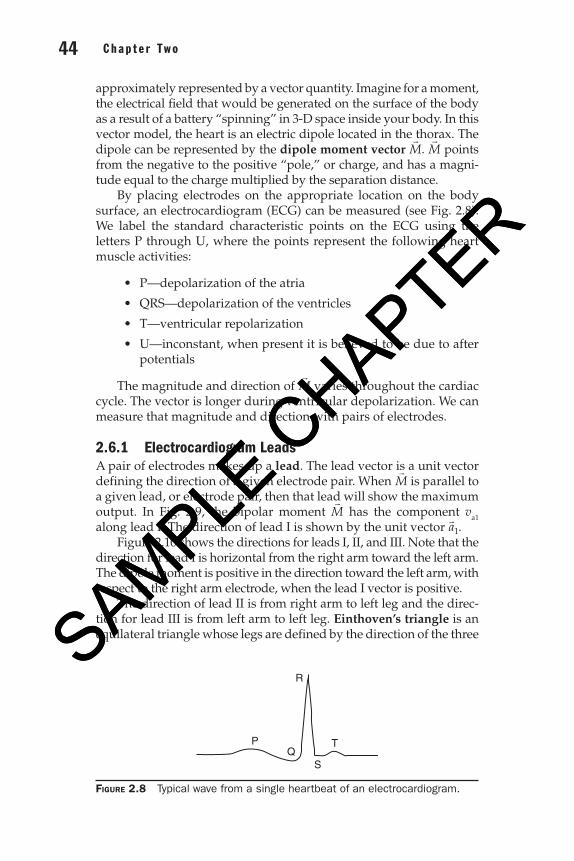
By placing electrodes on the appropriate location on the body surface, an electrocardiogram (ECG) can be measured (see Fig. 2.8). We label the standard characteristic points on the ECG using the letters P through U, where the points represent the following heart muscle activities:
• P—depolarizationoftheatria
• QRS—depolarizationoftheventricles
• T—ventricularrepolarization
• U—inconstant,whenpresentitisbelievedtobeduetoafterpotentials
The magnitude and direction of M
varies throughout the cardiac cycle. The vector is longer during ventricular depolarization. We can measure that magnitude and direction with pairs of electrodes.
2.6.1 Electrocardiogram LeadsA pair of electrodes makes up a lead. The lead vector is a unit vector defining the direction of a given electrode pair. When M
is parallel to a given lead, or electrode pair, then that lead will show the maximum output. In Fig. 2.9, the bipolar moment M
has the component va1 along lead I. The direction of lead I is shown by the unit vector a1
.Figure 2.10 shows the directions for leads I, II, and III. Note that the
direction for lead I is horizontal from the right arm toward the left arm. The dipole moment is positive in the direction toward the left arm, with respect to the right arm electrode, when the lead I vector is positive.
The direction of lead II is from right arm to left leg and the direc-tion for lead III is from left arm to left leg. Einthoven’s triangle is an equilateral triangle whose legs are defined by the direction of the three
Figure 2.8 Typical wave from a single heartbeat of an electrocardiogram.
P
R
QS
T
02_Waite_Ch02_035-082.indd 44 09/06/17 9:43 AM
SAMPLE C
HAPTER
SAMPLE C
HAPTER