CHAPTER 9: STATISTICAL ALMANAC - SA Cities · CHAPTER 9. STATISTICAL ALMANAC THE IMPORTANCE OF...
32
173 CHAPTER 9: STATISTICAL ALMANAC Indicators are critical to effective planning and management in increasingly complex urban contexts
Transcript of CHAPTER 9: STATISTICAL ALMANAC - SA Cities · CHAPTER 9. STATISTICAL ALMANAC THE IMPORTANCE OF...

173
CHAP
TER
9: ST
ATIST
ICAL
ALMA
NAC
Indicators are critical to effective planningand management in increasingly
complex urban contexts

174
STATISTICAL ALMANAC
CHAPTER 9. STATISTICAL ALMANAC
THE IMPORTANCE OF INDICATORS AND BUILDING ONTHE WORK ALREADY DONE
The importance of indicators
Indicators are critical to effective planning and management in increasinglycomplex urban contexts, organising information sets into simple, easy to graspand easy to compare ‘measures’ of what is happening. Good indicator setsallow for comparison between cities, giving each city a basis by which tobenchmark their current conditions or performance. They also allow forcomparison over time, enabling cities to see whether or not they are achievingtheir objectives.
The South African Cities Network has done considerable work in constructinga City Development Index (CDI). This measures city performance across fivediverse areas, all indicative in one way or another of the city’s total state ofdevelopment. The five areas making up the composite index are education,health, waste, infrastructure, and city-level gross geographic product.
Over the last year the SACN Urban Indicators Working Group has alsodeveloped a core set of indictors to measure development progress in each ofthe four planning quadrants: productive cities, inclusive cities, sustainablecities and well-governed cities
This State of the South African Cities Report has a further level of indicators,compiled in them in this consolidated statistical almanac. This data set formsthe basis of much of the analysis presented in this report.
Main data sources
In the course of writing this report, data has been collected through fourprocesses.
• First, census information for 1996 and 2001 has been compiled using thebase data available from the Municipal Demarcation Board. This was inturn compiled for the Demarcation Board by Dataworld using raw dataavailable from StatsSA. The ‘fitting’ of census data from 1996 to newmunicipal boundaries drawn in 2000, so that it can be compared to 2001census figures, involves a process of interpretation. It involves attributing1996 census Enumerator Areas, which may cross the new municipalboundaries, to the new municipal areas. Different methods can be usedfor this. All 2001 enumerator areas fell inside new municipal boundaries.The process of ‘fitting’ census data to new municipal boundaries, to arriveat a statistical shape-file, was undertaken by Dataworld. Their work hasbeen approved by StatsSA.
Using the shape-files available from StatsSA for 1996 and 2001 sometimesgenerates minutely different data results than that available on theDemarcation Board website for public access. The Demarcation Boardresults have been used in this report.
Census results are only as good as the census process that generated them.For example, census results for the query ‘number of homeless’ in the nine
STAT
ISTIC
AL AL
MANA
C

175
STATISTICAL ALMANAC
SACN cities give numbers far too small to be accurate. This clearly reflectsthe inability of census enumerators to capture this grouping of city dwellers.The limitations of census data need to be recognised, but limitations donot give licence to simply reject any figure as ‘wrong’. In reality, given thenature of cities, there can never be a perfect data set. Barring over-countsand under-counts, which are identified by StatsSA, the census results needto be taken as being as close to ‘the truth’ as we are ever likely to get.
Census results, and calculations based on them, were double checked andverified by a demographic specialist from the University of theWitwatersrand. The SACN municipalities were also given an opportunityto check that the information reflected for their cities was correct.
• National and provincially held data on the nine Cities was compiled in aseparate process by Research Surveys. Research Surveys also collectedand disaggregated to the nine cities results from the bi-annual All Mediaand Products Survey (AMPS) commissioned by the South AfricanAdvertising Research Foundation (SAARF).
• A survey of the nine SACN city municipalities was conducted specificallyfor this report by Dataworld, on a range on indicators agreed by the UrbanIndicators Working Group. Both Dataworld and Research Surveys workedunder the direction of Dr Owen Crankshaw of the Department of Sociology,University of Cape Town.
• Through the broader research process for report other datasets were foundby the writing team.
The combined results make up the almanac. However, in the interests of utilityand brevity not every indicator collected has been included.
A living resource
This statistical almanac represents work in progress. First careful consultationhas established that all the proposed indicators are feasible. But not allcurrently have available data that would make them useful. Second, on someindicators information is available for some SACN cities, but not for all.Third, it is hoped that the almanac will be actively used in the years to comeby SACN city councillors and officials, government and business stakeholders,community organisations and urban researchers. In the process of use, it isinevitable that some indicators will be identified as not useful, and will fallaway to be replaced by others.
Corresponding with the release of this report the latest statistical almanachas been posted on the website of the South African Cities Network where itwill be a living resource. As new information becomes available, and indicatorsare replaced, updated issues of the almanac will be posted (old versions willbe available for comparative purposes).
Accompanying the almanac on the website is a complete set of ‘source notes’.These fully explain the indicators and the basis for compiling the data, whichcould not be included here for reasons of space.
STRUCTURE AND APPROACH
The almanac provides five sets of indicators. These correspond to the keychapters in this report, and are: Urban Population Indicators; Productive

176
STATISTICAL ALMANAC
City Indicators; Inclusive City Indicators; Sustainable City Indicators; andWell-Governed City Indicators.
Outcome indicators, asset indicators and general indicators
The last four indicator sets are each broken into three components. Borrowingfrom a state of the cities report on English cities, a distinction is made betweena limited set of core ‘outcome indicators’, and a more extended set of indicatorsshowing what ‘assets’ a city has that underpin (and therefore explain) theoutcomes being seen. The outcome indicators show the final ‘results’ citieswould typically want to see if they were concerned with being more ‘productive’,‘inclusive’, ‘sustainable’ and ‘well-governed’. The asset indicators illustratehow well the cities are doing at building the conditions necessary for improvedoutcomes in the four areas. Some of these asset indicators could serve equallywell as outcome indicators, but they have been carefully selected to illustratethings that city stakeholders, led by a municipality, may have a direct orindirect influence over.
In addition to the outcome and asset indicators are a much more extendedset of general indicators. These speak very broadly to how well SACN citiesare doing in each of the four areas of planning concern.
Indicator choice and relationship between indicators
The indicators in the outcomes and assets sets have been carefully selected. Itis hoped that whereas general indicators may change, there will be reasonablestability in these banks of indicators so that results can be tracked over time.The indicators will be much more meaningful in years to come, as it becomespossible to correlate relations between changing results.
The indicators in the outcomes sets have been selected with a view to gettinga balanced perspective on those results that cities will likely want in eachplanning area. The indicators in the assets sets have been selected with a viewto identifying those things that might explain the outcomes. Quite obviouslythere are therefore implicit understandings of ‘relationships’ betweenindicators, and in turn real-world dynamics, embedded in the selections. Forexample it is assumed that the ‘Value of building plans passed annually’, aproductive city indicator reflecting the amount of urban fixed investmentgoing into a city, and therefore in turn expanding economic activity, can beexplained by urban efficiency factors as such as the ‘Average processing time(in days) for industrial and commercial planning applications’ and the ‘Hoursof electricity blackouts per year in commercial and industrial’. Similarly it isassumed that assets such as the number of burglaries per year, or the averagelevel of education in the population will have effects on the growth of newbusinesses, measured by the indicator ‘Net new RSC business registrationsas % of total’. These assumed relationships are based on a wide reading ofthe urban development literature. They reflect current common sense on whatcauses urban economies to grow. It is acknowledged, however, that they areassumptions, and are obviously open to competing interpretations. Futureresearch, debate, and regression analysis may well prove them false. Buteven if this is the case, some important conclusions about what does and doesnot encourage or inhibit urban economic growth will nonetheless have beenreached.
Drawing composite indices that can be related
It is hoped that over time, as cities collect information for these indicatorsets, it will be possible to construct composite indices for ‘productive cities’,

177
STATISTICAL ALMANAC
‘inclusive cities’, ‘sustainable cities’ and ‘well governed cities’.
A distinction between an ‘outcomes index’ and an ‘assets index’ is also possiblewithin this framework. In the State of English Cities Report 2000, this divisionwas used to map which cities were performing up to economic expectationsgiven their economic asset base, which were performing better than might beexpected, and which were underperforming. Being able to correlate outcomesto assets should give cities an extremely useful planning tool, by helping toexplain relatively good or bad performance in each of the four SACN planningquadrants. The method will also enable cities to compare how well they aredoing across perspectives, and over time. This will allow cities to see, forexample, whether good or bad economic performance may also be explicablein terms of improving or worsening outcomes or assets in the ‘inclusive city’or ‘well-governed city’ areas of planning and action. In time this will giveSouth African cities powerful insight into what is driving city development inits various dimensions.
DATA LIMITATIONS AND THE NEED TO INVEST IN INFORMATION
The usefulness of the Statistical Almanac depends on cities buying in to abank of common indicators that can be used to collectively measurecomparative progress over the long term. It is also conditional on a systematicinvestment in indicator setting and data collection and processing capabilityby all cities in network.
Inadequate data
One of the key challenges in drafting this report was with finding appropriatedata. There is a very serious dearth of readily accessible data on the SACNcities. This needs to be addressed.
The most important source of information for cities concerned with citydevelopment is the national five-yearly census conducted by StatsSA, whichalso has quarterly and annual ‘surveys’ on a range of matters important tounderstanding city development. While vitally important, there are weaknessesin StatsSA being cities’ primary source of development information. First,five-yearly censuses are too far apart for cities to keep proper track of fastchanging circumstances, especially in population size, dynamic and well-being.Second, many of the other surveys conducted by StatsSA do not provide datadisaggregated to the municipal level. And even when the do they are notalways as user-friendly as they could be from a municipal perspective.
If cities ought not to rely solely on current StatsSA releases for theirdevelopment information, what should they do instead? There are variousoptions. The first is to more actively engage with StatsSA around city-leveldevelopment information requirements. This is already happening throughthe SACN Indicators Working Group. Over time it should be possible toencourage StatsSA to collect and release information more in line with cities’data needs.
Second, a number of the cities in the SACN are already collecting their owninformation. Some cities have much more capability than others. Where somecities do not have the requisite capacity, the Indicators Working Group willbe exploring options for mutual support and shared learning to help relativelyunder-resourced partners. Furthermore, even the most capacitated cities inthe network could be doing more of their own data collection. For example,

178
STATISTICAL ALMANAC
though clearly very time consuming and expensive, there is no reason whysome SACN cities could not be doing the sorts of comprehensive area-baseddemographic surveillance systems surveys, done each year in Agincourt,Bushbuckridge, as described in Chapter 3. Such surveys could provide citieswith the very finely grained data needed to better understanding settlementdynamics in key areas that could be considered as indicative of city functioning,transformation and progress.
Last, stakeholders other than municipalities hold city level developmentinformation. Research institutes, universities, NGOs, individual firms andbusiness associations, provincial and national government, and donors, allcollect information for their own purposes. A CDS is about mobilising theresources and energies of city stakeholders towards common goals. There isno reason why this effort cannot start with trying to structure informationbanking and sharing networks.
The need to further develop analytical skills
Cities do not only lack information, they also could do with better capacity toprocess, makes sense of and make practical use of the information at theirdisposal. Skills for analysing international and local market shifts andopportunities, sector business environment and logistics requirements,infrastructure cost-benefit profiles, land and property market developments,human development trends and community dynamics are not present inmunicipalities and often not in private sector either. There is a need for along-term plan for skills development in city development analysis.

179
STATISTICAL ALMANAC
STATISTICAL ALMANAC
POPULATION INDICATORS
INDICATOR Data date Joburg eThekwini Cape Town Ekurhuleni Tshwane Nelson Buffalo Mangaung Msunduzi Total orMandela City average
Population, populationgrowth and densityCurrent rank in 2001 1 2 3 4 5 6 7 8 9population sizeCensus population 2001 3 225 812 3 090 122 2 893 247 2 480 276 1 985 983 1 005 778 701 890 645 441 553 223 16 581 77216 581 77216 581 77216 581 77216 581 772Census population 1996 2 639 110 2 751 193 2 563 612 2 026 807 1 682 701 969 771 682 287 603 704 521 805 14 440 99014 440 99014 440 99014 440 99014 440 990Five year 1996-2001 22,23% 12,32% 12,86% 22,37% 18,02% 3,71% 2,87% 6,91% 6,02% 14,82%14,82%14,82%14,82%14,82%population growthAverage annual 1996-2001 4,10% 2,35% 2,45% 4,12% 3,37% 0,73% 0,57% 1,35% 1,18% 2,80%2,80%2,80%2,80%2,80%population growthAverage annual 1970-1996 2,04% 3,62% 2,97% 2,90% 3,78% 2,78% 3,79% 4,63% 4,59% 3,09%3,09%3,09%3,09%3,09%population growthAverage annual 1946-1970 2,67% 4,41% 3,70% 2,74% 4,15% 3,86% 4,11% 4,49% 3,18% 3,45%3,45%3,45%3,45%3,45%population growthSize in land area 2001 1 644 km² 2 292 km² 2 499 km² 1 923 km² 2 198 km² 1 952 km² 2 516 km² 6 283 km² 648 km² 21 955 km²21 955 km²21 955 km²21 955 km²21 955 km²Average density 2001 1 962 / km² 1 348 / km² 1 158 / km² 1 290 / km² 904 / km² 515 / km² 279 / km² 103 / km² 854 / km² 755 / km²755 / km²755 / km²755 / km²755 / km²% of total 2001 7,20% 6,89% 6,46% 5,53% 4,43% 2,24% 1,57% 1,44% 1,23% 37,00%37,00%37,00%37,00%37,00%national population% of total 1996 6,50% 6,78% 6,32% 4,99% 4,15% 2,39% 1,68% 1,49% 1,29% 35,58%35,58%35,58%35,58%35,58%national population Birth, age and lifeexpectancy Crude birth rate 2001 19,34 18,08 18,81 19,37 17,28 15,09 15,02 18,74 17,47 18,2518,2518,2518,2518,25(per 1000 of pop)ASSA estimated province 2000 52 45 62 52 52 52 52 49 45 5050505050life expectancy at 2003ASSA estimated province 2000 42 37 57 42 42 40 40 39 37 4141414141life expectancy at 1010% of city’s population 2001 8,24% 8,50% 8,32% 8,75% 7,77% 7,31% 7,15% 8,23% 8,43% 8,22%8,22%8,22%8,22%8,22%aged 0-4% of city’s population 1996 8,81% 9,23% 9,05% 9,75% 9,04% 8,30% 8,40% 8,84% 8,85% 9,04%9,04%9,04%9,04%9,04%aged 0-4% of city’s population 2001 40,85% 39,02% 38,03% 39,99% 39,69% 36,63% 37,77% 37,86% 38,26% 39,14%39,14%39,14%39,14%39,14%aged 15-34% of city’s population 1996 39,42% 39,12% 37,50% 39,14% 38,40% 37,46% 37,35% 38,78% 39,67% 38,61%38,61%38,61%38,61%38,61%aged 15-34% of city’s population 2001 31,42% 29,22% 30,54% 30,56% 30,67% 32,24% 30,26% 29,11% 28,33% 30,44%30,44%30,44%30,44%30,44%aged 35-64% of city’s population 1996 29,48% 27,45% 28,52% 28,30% 28,21% 28,85% 27,69% 26,72% 26,11% 28,23%28,23%28,23%28,23%28,23%aged 35-64% of city’s population 2001 4,95% 5,06% 5,81% 4,29% 5,35% 6,21% 6,21% 6,14% 5,99% 5,29%5,29%5,29%5,29%5,29%aged >65% of city’s population 1996 5,23% 4,82% 5,87% 4,38% 5,52% 5,72% 5,74% 5,70% 5,49% 5,27%5,27%5,27%5,27%5,27%aged >65
Household growth andcompositionNumber of households 2001 1 006 932 786 747 759 767 744 935 562 652 260 800 191 046 185 012 130 387 4 628 2784 628 2784 628 2784 628 2784 628 278Number of households 1996 728 304 643 482 650 678 539 796 429 187 224 932 159 440 152 945 115 933 3 644 6973 644 6973 644 6973 644 6973 644 697Five year 1996-2001 38,26% 22,26% 16,77% 38,00% 31,10% 15,95% 19,82% 20,97% 12,47% 26,99%26,99%26,99%26,99%26,99%household growthAvergage annual 1996-2001 6,69% 4,10% 3,15% 6,65% 5,56% 3,00% 3,68% 3,88% 2,38% 4,89%4,89%4,89%4,89%4,89%household growth% households with 2001 23,68% 21,29% 16,05% 21,20% 20,43% 15,31% 20,33% 18,49% 17,75% 20,24%20,24%20,24%20,24%20,24%1 person% households with 2001 64,31% 58,66% 67,51% 65,86% 65,16% 66,13% 61,59% 67,12% 58,64% 64,17%64,17%64,17%64,17%64,17%2-5 persons% households with 2001 12,00% 20,05% 16,44% 12,94% 14,41% 18,56% 18,09% 14,39% 23,61% 15,59%15,59%15,59%15,59%15,59%6+ personsAverage number of 2001 3,20 3,93 3,81 3,33 3,53 3,86 3,67 3,49 4,24 3,583,583,583,583,58people per householdAverage number of 1996 3,66 4,27 3,95 3,79 3,95 4,32 4,27 3,95 4,47 3,983,983,983,983,98people per household

180
STATISTICAL ALMANAC
PRODUCTIVE CITIES
KEY URBAN ECONOMY INDICATORS
INDICATOR Data Joburg eThekwini Cape Town Ekurhuleni Tshwane Nelson Buffalo Mangaung Msunduzi Total ordate Mandela City average
Core productive cityindicators
Core indicators:Productive city outcomes Gross Value Add 2002 30 129 15 987 27 389 17 216 30 313 17 817 10 944 13 461 9 023 22 23922 23922 23922 23922 239per capita 2002 (Rand)Annual GVA growth 2001-2 2,3 4,4 1,6 2,9 5,0 2,2 -1,1 0,5 3,1 2,32,32,32,32,3over the last year (%)Net new RSC business registrations as % of totalLabour Force Survey (LFS) Feb-02 31,95% 37,39% 27,10% 42,47% 28,90% 45,59% 42,93% 38,42% 47,60% 35,72%35,72%35,72%35,72%35,72%expanded unemploymentrateValue of building plans 2002 R3 882 000 R2 263 000 R4 189 000 R 2,394,000 R3 059 000 R802 000 R403 000 R434 000 R338 000 R17 765 000R17 765 000R17 765 000R17 765 000R17 765 000passed annually (‘000)Ratio RSC remuneration to 2003 13:87 12:88 14:86 13:87 16:84 13:87 14:8614:8614:8614:8614:86turnover levy assessments
Core indicators:Productive city assets Average length of road 2003 4,57 / kmper square kilometreAv process time (days) for 2002/03 27 38 35 10 25 5indust & com planapplicationsHours of electricty blackouts per yr (comm, & Ind areas)Av % operating cost ofproperty of rates & services Total property tax 2001/02 R607,41 R605,28 R666,55 R409,53 R559,72 R337,86 R260,17 R248,24 R381,24 R534,56R534,56R534,56R534,56R534,56revenue per capita% over-20’s with post- 2001 24,80% 18,92% 19,93% 19,07% 38,76% 19,34% 15,61% 24,97% 16,16% 22,59%22,59%22,59%22,59%22,59%school education% 15-24’s enrolled in 2001 27,57% 18,23% 23,81% 20,46% 33,52% 16,26% 17,37% 16,83% 16,37% 22,98%22,98%22,98%22,98%22,98%post-school studyAMPS: % who accessed 2002B 8,00% 11,04% 11,69% 3,29% 11,22% 7,29% 6,80% 7,55% 11,87%internet last 4 weeksBurglaries (non-residential) 2002/03 16 062 10 761 13 518 6 912 8 494 3 710 2 671+ fraud + bus robbery General economicindicatorsGross Value Add GVA in 1996 (R Million) 1996 79 261 43 278 71 497 41 759 46 276 14 566 7 595 8 314 4 955 317 501317 501317 501317 501317 501GVA per capita 1996 1996 30 033 15 731 27 889 20 603 27 501 15 020 11 132 13 772 9 495 21 98621 98621 98621 98621 986(Rand)GVA in 2002 (R Million) 2002 101 172 50 562 81 183 44 459 62 231 18 052 7 725 8 805 5 050 379 239379 239379 239379 239379 2392002 GVA as % of 2002 16,4 8,1 13,2 7,0 10,0 2,9 1,3 1,4 0,8 62,662,662,662,662,6National TotalAverage annual GVA 1996- 4,2 2,6 2,1 1,0 5,1 3,6 0,3 1,0 0,3 2,22,22,22,22,2growth since 1996 (%) 2002GVA in 1996 (R Million) 1996 79 261 43 278 71 497 41 759 46 276 14 566 7 595 8 314 4 955 317 501317 501317 501317 501317 501
Employment & income Census number of 2001 647 039 591 026 386 781 516 011 306 034 196 112 157 526 104 935 112 419 3 017 8833 017 8833 017 8833 017 8833 017 883unemployedCensus number of 1996 392 777 382 182 219 842 319 517 186 321 138 498 101 349 75 290 84 632 1 900 4081 900 4081 900 4081 900 4081 900 408unemployedFive year % change in 1996-2001 64,73% 54,65% 75,94% 61,50% 64,25% 41,60% 55,43% 39,37% 32,83% 58,80%58,80%58,80%58,80%58,80%number unemployedCensus % unemployed 2001 37,35% 43,02% 29,16% 40,41% 31,86% 46,39% 53,11% 40,09% 48,20% 38,28%38,28%38,28%38,28%38,28%Census % unemployed 1996 29,15% 32,37% 19,55% 32,11% 24,19% 36,15% 38,76% 30,97% 39,48% 29,15%29,15%29,15%29,15%29,15%Census number of employed 2001 1 085 546 782 934 939 440 761 048 654 484 226 617 139 088 156 829 120 822 4 866 8084 866 8084 866 8084 866 8084 866 808

181
STATISTICAL ALMANAC
Census number of 1996 954 605 798 396 904 471 675 544 583 814 244 612 160 156 167 798 129 740 4 619 1364 619 1364 619 1364 619 1364 619 136employedFive year % change in 1996-2001 13,72% -1,94% 3,87% 12,66% 12,10% -7,36% -13,15% -6,54% -6,87% 5,36%5,36%5,36%5,36%5,36%number of peopleemployedCensus % employed 2001 62,65% 56,98% 70,84% 59,59% 68,14% 53,61% 46,89% 59,91% 51,80% 61,72%61,72%61,72%61,72%61,72%Census % employed 1996 70,85% 67,63% 80,45% 67,89% 75,81% 63,85% 61,24% 69,03% 60,52% 70,85%70,85%70,85%70,85%70,85%% of total national 2001 11,33% 8,17% 9,80% 7,94% 6,83% 2,36% 1,45% 1,64% 1,26% 50,78%50,78%50,78%50,78%50,78%employment provided% of total national 1996 10,26% 8,58% 9,72% 7,26% 6,27% 2,63% 1,72% 1,80% 1,39% 49,63%49,63%49,63%49,63%49,63%employment provided% of total national 2001 9,48% 8,66% 5,67% 7,56% 4,48% 2,87% 2,31% 1,54% 1,65% 44,22%44,22%44,22%44,22%44,22%unemployment% of total national 1996 8,28% 8,06% 4,64% 6,74% 3,93% 2,92% 2,14% 1,59% 1,78% 40,08%40,08%40,08%40,08%40,08%unemploymentAverage monthly 2001 R6 408,63 R4 226,88 R5 186,44 R5 085,60 R6 483,81 R4 298,54 R3 694,04 R3 561,97 R3 985,00 R5 297,22 R5 297,22 R5 297,22 R5 297,22 R5 297,22income peRemployedperson (AMI)Difference in city 2001 R2 345,89 R164,13 R1 123,70 R1 022,85 R2 421,07 R235,79 - R368,70 - R500,77 - R77,74 R1 234,47 R1 234,47 R1 234,47 R1 234,47 R1 234,47AMI & national AMIDiff in city AMI & national 2001 R3 619,57 R1 437,82 R2 397,38 R2 296,54 R3 694,75 R1 509,48 R904,98 R772,91 R1 195,94 R2 508,16 R2 508,16 R2 508,16 R2 508,16 R2 508,16AMI excluding9 SACN cities% change in community 1996-2001 22,76% 14,82% 4,44% 24,26% 13,07% 5,74% 0,10% 1,69% 18,83% 13,18%13,18%13,18%13,18%13,18%/government employment% change in wholesale/ 1996-2001 33,01% 38,21% 23,95% 38,71% 22,95% 26,80% 11,85% 12,01% 30,36% 29,76%29,76%29,76%29,76%29,76%retail employment% change in finance/ 1996-2001 34,86% 33,02% 18,80% 23,21% 19,72% 34,66% 44,02% 24,75% 11,14% 26,81%26,81%26,81%26,81%26,81%business employment% change in manufacturing 1996-2001 17,17% -3,23% -11,91% 26,12% 25,00% 1,06% -15,19% 7,21% 1,77% 4,79%4,79%4,79%4,79%4,79%employment% change in private 1996-2001 -12,15% -22,54% -9,58% -17,14% -15,15% -35,11% -26,86% -24,57% -24,18% -17,54%-17,54%-17,54%-17,54%-17,54%household employment% change in transport/ 1996-2001 -0,69% -3,40% -4,04% -0,55% -0,73% -5,71% -26,66% -24,29% -24,23% -4,00%-4,00%-4,00%-4,00%-4,00%communicationsemployment% change in construction 1996-2001 -3,02% -14,41% 0,73% 0,78% 4,49% -12,93% -26,83% -24,89% -12,87% -4,63%-4,63%-4,63%-4,63%-4,63%employment% change in agriculture 1996-2001 92,94% 54,30% 33,11% 95,98% 78,48% 24,65% -7,65% -11,59% 51,21% 45,88%45,88%45,88%45,88%45,88%employment% change in electricity/ 1996-2001 -48,91% -35,37% -41,68% -49,38% -45,53% -68,92% -39,86% -53,01% -33,56% -45,90%-45,90%-45,90%-45,90%-45,90%gas/water employment% change in mining 1996-2001 -41,14% -24,36% -21,41% -27,77% -20,99% -54,92% -74,39% -58,84% 31,67% -32,89%-32,89%-32,89%-32,89%-32,89%employment% change in people 1996-2001 53,11% 56,04% 12,32% 61,10% 45,98% -3,47% 0,33% 7,33% 53,98% 38,02%38,02%38,02%38,02%38,02%employed as managers etc% change in people 1996-2001 15,87% -21,52% -12,28% -3,03% 0,43% -28,66% -40,72% -36,28% -34,50% -8,25%-8,25%-8,25%-8,25%-8,25%employed asprofessionals% change in people 1996-2001 34,45% 45,84% 23,55% 50,99% 44,78% 31,26% 41,08% 49,27% 66,98% 38,78%38,78%38,78%38,78%38,78%employed as techniciansetc% change in people 1996-2001 -16,21% -5,51% -4,56% -5,92% -6,45% 3,59% -23,34% -25,47% -14,35% -9,08%-9,08%-9,08%-9,08%-9,08%employed as craft/trade workers% change in people 1996-2001 3,74% 6,03% -0,59% 2,20% 14,70% -2,21% 4,50% 19,92% 0,86% 4,01%4,01%4,01%4,01%4,01%employed as machineoperators% change in people 1996-2001 46,28% 53,46% 26,13% 51,77% 38,91% 34,19% 34,93% 18,37% 36,10% 40,56%40,56%40,56%40,56%40,56%employed as clerks% change in people 1996-2001 28,45% 27,06% 23,05% 24,69% 19,61% 15,62% -1,20% -1,87% 18,06% 22,39%22,39%22,39%22,39%22,39%employed as serviceworkers% change in people 1996-2001 15,26% 0,39% 0,60% 13,95% 12,19% -12,84% -18,30% -4,22% -1,41% 4,92%4,92%4,92%4,92%4,92%employed as elementaryworkers
INDICATOR Data Joburg eThekwini Cape Town Ekurhuleni Tshwane Nelson Buffalo Mangaung Msunduzi Total ordate Mandela City average

182
STATISTICAL ALMANAC
RSC levy growth RSC-levy assessment of 2003 R R R R R R RRRRRtotal company turnover (R m) 813 472 977 255 063 359 235 429 490 280 685 328 236 205 619 93 175 529 NA NA NA 1 914 034 3051 914 034 3051 914 034 3051 914 034 3051 914 034 305RSC-levy assessment of 2002 R R R R R R RRRRRtotal company turnover (R m) 450 619 264 234 747 438 208 644 613 184 601 831 213 941 298 85 190 392 NA NA NA 1 377 744 8361 377 744 8361 377 744 8361 377 744 8361 377 744 836RSC-levy assessment of 2001 R R R R R R RRRRRtotal company turnover (R m) 483 130 000 190 237 000 200 181 000 169 798 000 186 702 000 74 309 000 NA NA NA 1 304 357 0001 304 357 0001 304 357 0001 304 357 0001 304 357 000RSC-levy assess of total 2003 R R R R R R RRRRRemployee remuneration (R m) 125 013 451 35 345 422 38 801 540 41 292 068 45 784 011 13 605 241 NA NA NA 299 841 733299 841 733299 841 733299 841 733299 841 733RSC-levy assess of total R R R R R R RRRRRemployee remuneration (R m) 2002 64 524 411 30 489 537 32 860 695 22 813 399 42 473 640 10 634 106 NA NA NA 203 795 788203 795 788203 795 788203 795 788203 795 788RSC-levy assess of total 2001 R R R R R R RRRRRemployee remuneration (R m) 67 311 000 29 214 000 31 970 000 27 390 000 37 065 000 12 061 000 NA NA NA 205 011 000205 011 000205 011 000205 011 000205 011 000Ratio RSC remuneration to 2002 13:87 11:89 14:86 11:89 17:83 11:89 NA NA NA 13:8713:8713:8713:8713:87turnover levy assessmentsRatio RSC remuneration to 2001 12:88 13:87 14:86 14:86 17:83 14:86 NA NA NA 14:8614:8614:8614:8614:86turnover levy assessments
Property investments Total number of planning 2002/03 12 021 13 983 13 026 3 363 5 096 932applications receivedTotal estimated value of 2002/03 R3 567 715 R2 517 168 R4 122 588 R2 073 921 R385 812 R361 097 R465 977applications (‘000)Value of industrial building 2002 R248 056 R126 843 R191 250 R216 345 R176 001 R55 665 R32 656 R13 481 R159 420 R1 219 717R1 219 717R1 219 717R1 219 717R1 219 717plans passed (‘000)Value of commercial building 2002 R474 864 R181 825 R221 041 R101 195 R225 244 R53 245 R12 197 R30 402 R15 023 R1 315 036R1 315 036R1 315 036R1 315 036R1 315 036plans passed (‘000)Decentralised (suburb) A grade 2003 12,54% 5,92% 9,37% 5,61%office space % vacancyDecentralised (suburb) A grade 2003 R70,07 R70,33 R73,40 R63,16max gross asking rentalCentralised (CBD) A grade 2003 14,27% 12,76% 11,87% 7,48%office space % vacancyCentralised (CBD) A grade max 2003 R40,00 R60,00 R58,00 R75,00gross asking rental Mobility & logisticscapability/efficiency Municipal electricity 2001 25 303 39 978 19 742 23 242 14 558 8 637 5 242 4 400 NAcustomers excluding domesticMetric tons of cargo 2000 NA 32 743 7 597 NA NA 6 676 581 NA NAhandled by port (000)Metric tons of cargo 1996 NA 31 511 6 768 NA NA 5 300 1 271 NA NAhandled by port (000)Vessels handled by port 2000 NA 3 713 3 737 NA NA 1 243 273 NA NAVessels handled by port 1996 NA 5 690 3 730 NA NA 1 935 347 NA NANumber of airport passengers 2000 2 539 613 29 755 502 657 See Joburg See Joburg NA NA NA NAflying internationalNumber of airport passengers 1996 1 729 218 89 438 162 627 See Joburg See Joburg NA NA NA NAflying internationalNumber of airport passengers 2000 2 974 990 1 231 745 1 686 993 See Joburg See Joburg 425 826 172 521 107 854 NAflying domesticNumber of airport passengers 1996 2 408 820 1 028 231 446 875 See Joburg See Joburg 384 484 No data No data NAflying domesticAMPS: % of population flying 2002b 2,01% 3,46% 2,57% 1,02% 3,07% 0,64% 1,33% 0,87% 2,02%internationally in last yearAMPS: Total number of local 2002b 34 932 38 003 58 267 16 219 28 795 16 879 6 827 4 028 2 724 206 674206 674206 674206 674206 674business flightsAMPS: % of pop flying on local 2002b 10,38% 9,56% 8,93% 11,10% 8,92% 10,70% 9,72% 8,24% 4,78% 9,44%9,44%9,44%9,44%9,44%business trip last year
INDICATOR Data Joburg eThekwini Cape Town Ekurhuleni Tshwane Nelson Buffalo Mangaung Msunduzi Total ordate Mandela City average
183
STATISTICAL ALMANAC
EMPLOYMENT BY ECONOMIC SECTOR (SHARE OF EACH CITY’S TOTAL EMPLOYMENT)

184
STATISTICAL ALMANAC
EMPLOYMENT BY OCCUPATIONS (SHARE OF EACH CITY’S TOTAL EMPLOYMENT)
185
STATISTICAL ALMANAC
COMPARISON OF 1996 AND 2001 % OF TOTAL NATIONAL POPULATION, % OF TOTALNATIONAL EMPLOYMENT AND % OF TOTAL NATIONAL UNEMPLOYMENT PER CITY
INCLUSIVE CITIES
KEY SOCIAL TRENDS INDICATORS
INDICATOR Data Joburg eThekwini Cape Town Ekurhuleni Tshwane Nelson Buffalo Mangaung Msunduzi Total ordate Mandela City average
Core inclusive city indicators
Core indicators: Inclusive city outcomes % of residents satisfied 2002-3 41,00% 35,00%with quality of life% of households without 2001 22,54% 27,20% 21,06% 30,01% 24,81% 24,79% 36,95% 28,29% 30,89% 25,75%25,75%25,75%25,75%25,75%formal shelterHousehold gini co-efficient 2001 0,78 0,75 0,69 0,77 0,75 0,75 0,79 0,78 0,76 0,760,760,760,760,76(PDG method)Dependency ratio (dependents 2001 2,97 3,95 3,08 3,26 3,03 4,44 5,05 4,12 4,58 3,413,413,413,413,41to each employed person)Infant mortality rate 2003 54,8 55,5 21,7(per 1000 live births)% of 10-14yr olds not attending 2001 4,7% 4,8% 3,9% 4,4% 3,7% 4,6% 3,9% 3,7% 4,9% 4,3%4,3%4,3%4,3%4,3%school
Core indicators: inclusivecity assets Value of residential building 2002 R115 287 R49 750 R459 312 R153 744 R210 904 R153 193 R91 570 R54 550 R21 668 R1 309 978R1 309 978R1 309 978R1 309 978R1 309 978plans <80m2 (‘000)% of hsh without water on site 2001 15,52% 30,31% 15,58% 18,10% 20,23% 20,26% 41,11% 31,17% 29,97% 21,39%21,39%21,39%21,39%21,39%(ie in dwelling or yard)% of households with VIP toilet or less 2001 13,44% 31,11% 12,57% 16,95% 28,00% 20,45% 32,47% 49,64% 41,48% 22,06%22,06%22,06%22,06%22,06%

186
STATISTICAL ALMANAC
% of households without 2001 42,35% 46,10% 31,40% 47,61% 37,64% 48,10% 59,33% 57,52% 50,39% 43,32%43,32%43,32%43,32%43,32%telephone in home% of households not using 2001 14,98% 20,10% 11,15% 25,00% 19,30% 24,92% 36,91% 14,90% 14,22% 18,80%18,80%18,80%18,80%18,80%electricity for lighting% of households without weekly 2001 8,75% 14,58% 5,62% 12,03% 21,76% 13,91% 28,65% 40,19% 40,94% 14,61%14,61%14,61%14,61%14,61%refuse collectionAverage travel cost to work 2003 R186,00per month% of commuters spending 2003 46,00%>10% of income on transport% of residents walking to school 2001 17,32% 19,27% 19,03% 17,14% 19,49% 22,68% 28,81% 29,04% 23,82% 19,70%19,70%19,70%19,70%19,70%or work% hsh income on muni account 2002 13,84% 20,14% 17,67% 18,10% 17,54% 18,96% 15,25% 22,55%for hsh earning R2 263/mAnnual grants in aid (incl social rates rebates)
General access, poverty andexclusion indicators
Access to shelter Number of households 2001 212 408 150 390 142 983 213 091 129 688 59 795 54 647 43 811 16 321 1 023 1341 023 1341 023 1341 023 1341 023 134without formal shelterNumber of households 1996 155 459 139 801 125 233 156 283 82 582 60 673 42 063 34 747 10 102 806 943806 943806 943806 943806 943without formal shelter% of households without 1996 22,20% 29,45% 20,04% 29,75% 20,77% 28,13% 37,80% 28,84% 28,73% 25,59%25,59%25,59%25,59%25,59%formal shelter% change in households 1996-2001 41,55% 13,33% 23,50% 40,07% 57,74% 2,72% 17,22% 19,16% 20,61% 28,54%28,54%28,54%28,54%28,54%without formal shelterNumber of households 2001 780 017 572 746 599 745 521 385 423 086 196 148 120 464 132 668 90 110 3 436 3693 436 3693 436 3693 436 3693 436 369with formal shelterNumber of households 1996 561 856 452 339 516 867 376 893 337 609 160 784 99 074 108 405 82 849 2 696 6762 696 6762 696 6762 696 6762 696 676with formal shelter% Households with formal shelter 2001 77,46% 72,80% 78,94% 69,99% 75,19% 75,21% 63,05% 71,71% 69,11% 74,25%74,25%74,25%74,25%74,25%% Households with formal shelter 1996 77,80% 70,55% 79,96% 70,25% 79,23% 71,87% 62,20% 71,16% 71,27% 74,41%74,41%74,41%74,41%74,41%Change HsH with formal shelter 1996-2001 38,83% 26,62% 16,03% 38,34% 25,32% 21,99% 21,59% 22,38% 8,76% 27,43%27,43%27,43%27,43%27,43%% of households sharing a 2001 15,96% 18,88% 15,91% 14,26% 17,31% 13,09% 9,39% 18,44% 20,42% 16,04%16,04%16,04%16,04%16,04%single room% of households sharing a 1996 8,62% 7,67% 8,85% 10,18% 11,50% 7,03% 4,88% 8,38% 8,03% 8,74%8,74%8,74%8,74%8,74%single room% change in households 1996-2001 165,33% 216,94% 163,14% 89,25% 122,46% 125,18% 97,74% 171,19% 147,02% 147,28%147,28%147,28%147,28%147,28%sharing a single room 96-01Number households in informal 2001 145 401 183 280 124 952 171 157 113 973 55 972 59 308 43 801 37 077 934 921934 921934 921934 921934 921dwellings not in backyardNumber households in informal 1996 57 335 28 349 21 688 38 358 19 469 9 229 11 600 11 668 1 598 199 294199 294199 294199 294199 294dwellings not in backyard% of households in informal 2001 14,48% 23,40% 16,50% 23,05% 20,32% 21,53% 31,12% 23,74% 28,52% 20,26%20,26%20,26%20,26%20,26%dwellings not in backyard% of households in informal 1996 8,03% 4,46% 3,37% 7,23% 4,66% 4,15% 7,56% 7,69% 1,39% 5,56%5,56%5,56%5,56%5,56%dwellings not in backyard% change in hsh in informal 1996-2001 153,60% 546,51% 476,13% 346,21% 485,41% 506,48% 411,28% 275,39% 2220,21% 369,12%369,12%369,12%369,12%369,12%dwellings not in backyard
Income distribution Average annual household income 2001 R86 105 R61 579 R87 811 R65 318 R91 395 R53 227 R39 389 R42 398 R49 165 R71 836R71 836R71 836R71 836R71 836Number of households with 2001 196 722 186 664 101 928 174 936 98 704 57 270 55 253 43 118 28 500 943 095943 095943 095943 095943 0950 incomeNumber of households with 0 income 1996 60 718 73 812 38 436 55 101 28 906 27 415 20 915 15 728 16 233 337 264337 264337 264337 264337 264% of households with 2001 18,74% 22,66% 13,11% 22,53% 16,51% 21,60% 28,47% 22,86% 21,08% 19,61%19,61%19,61%19,61%19,61%0 income% of households with 0 income 1996 10,08% 12,96% 6,79% 12,31% 7,58% 13,69% 13,93% 11,03% 16,39% 10,68%10,68%10,68%10,68%10,68%% change in households 1996-2001 223,99% 152,89% 165,19% 217,48% 241,47% 108,90% 164,18% 174,15% 75,57% 179,63%179,63%179,63%179,63%179,63%with 0 incomeIncome share of highest 2001 33,82% 41,35% 24,54% 38,80% 31,45% 42,25% 54,04% 50,13% 45,16% 36,36%36,36%36,36%36,36%36,36%quartile (households in q)Income share of 2nd highest 2001 45,12% 42,58% 48,36% 43,07% 43,40% 41,62% 35,03% 38,35% 40,81% 43,68%43,68%43,68%43,68%43,68%quartile (households in q)
INDICATOR Data Joburg eThekwini Cape Town Ekurhuleni Tshwane Nelson Buffalo Mangaung Msunduzi Total ordate Mandela City average

187
STATISTICAL ALMANAC
Income share of 3rd highest 2001 19,12% 15,33% 25,77% 17,08% 23,41% 15,44% 10,32% 10,88% 13,30% 18,70%18,70%18,70%18,70%18,70%quartile (households in q)Income share of lowest 2001 1,95% 0,74% 1,33% 1,05% 1,75% 0,69% 0,61% 0,64% 0,73% 1,26%1,26%1,26%1,26%1,26%quartile (households in q)Income share of highest 2001 1,03% 1,97% 0,78% 1,45% 0,97% 2,37% 3,86% 3,61% 2,80% 1,37%1,37%1,37%1,37%1,37%quartile (income earned in q)Income share of 2nd highest 2001 15,98% 24,92% 19,15% 20,03% 15,41% 24,59% 26,05% 26,42% 26,03% 19,28%19,28%19,28%19,28%19,28%quartile (income earned in q)Income share of 3rd highest 2001 49,74% 52,25% 56,96% 53,36% 53,99% 52,78% 47,08% 46,21% 48,19% 52,65%52,65%52,65%52,65%52,65%quartile (income earned in q)Income share of lowest 2001 33,24% 20,86% 23,11% 25,16% 29,63% 20,26% 23,01% 23,76% 22,98% 26,70%26,70%26,70%26,70%26,70%quartile (income earned in q)Income share of highest 1996 22,08% 27,23% 14,90% 24,37% 18,34% 29,99% 36,60% 34,67% 35,43% 23,77%23,77%23,77%23,77%23,77%quartile (households in q)Income share of 2nd highest 1996 59,14% 57,11% 63,67% 59,27% 58,05% 56,22% 53,87% 54,49% 51,61% 58,59%58,59%58,59%58,59%58,59%quartile (households in q)Income share of 3rd highest 1996 18,78% 15,66% 21,43% 16,36% 23,61% 13,79% 9,53% 10,84% 12,97% 17,64%17,64%17,64%17,64%17,64%quartile (households in q)Income share of lowest 1996 0,00% 0,00% 0,00% 0,00% 0,00% 0,00% 0,00% 0,00% 0,00% 0,00%0,00%0,00%0,00%0,00%quartile (households in q)Income share of highest 1996 1,37% 1,95% 0,88% 1,59% 1,09% 2,60% 4,41% 4,14% 3,04% 1,63%1,63%1,63%1,63%1,63%quartile (income earned in q)Income share of 2nd highest 1996 31,63% 38,75% 36,26% 36,99% 29,69% 41,40% 45,69% 43,53% 40,48% 35,69%35,69%35,69%35,69%35,69%quartile (income earned in q)Income share of 3rd highest 1996 67,00% 59,30% 62,86% 61,42% 69,22% 56,01% 49,90% 52,34% 56,49% 62,68%62,68%62,68%62,68%62,68%quartile (income earned in q)Income share of lowest 1996 0,00% 0,00% 0,00% 0,00% 0,00% 0,00% 0,00% 0,00% 0,00% 0,00%0,00%0,00%0,00%0,00%quartile (income earned in q) Access to infrastructureand services Number of households with water 2001 499 469 397 617 526 866 315 704 272 805 121 818 60 104 46 805 48 627 2 289 8152 289 8152 289 8152 289 8152 289 815in dwellingNumber of households with water 1996 479 927 402 227 515 841 368 199 298 205 144 036 76 514 69 926 56 505 2 411 3802 411 3802 411 3802 411 3802 411 380in dwelling% of households with water 2001 49,60% 50,54% 69,35% 42,38% 48,49% 46,71% 31,46% 25,30% 37,29% 49,47%49,47%49,47%49,47%49,47%in dwelling% of households with water 1996 65,90% 62,51% 79,28% 68,21% 69,48% 64,04% 47,99% 45,72% 48,74% 66,16%66,16%66,16%66,16%66,16%in dwelling% change in number of hsh 1996-2001 4,07% -1,15% 2,14% -14,26% -8,52% -15,43% -21,45% -33,06% -13,94% -5,04%-5,04%-5,04%-5,04%-5,04%with water in dwellingNumber of households 2001 156 240 238 472 118 350 134 848 113 852 52 834 78 535 57 672 39 079 989 882989 882989 882989 882989 882without water on siteNumber of households without 1996 98 442 186 855 66 105 84 502 87 934 35 337 60 978 52 453 45 944 718 550718 550718 550718 550718 550water on site% of households without 1996 13,52% 29,04% 10,16% 15,65% 20,49% 15,71% 38,25% 34,30% 39,63% 19,71%19,71%19,71%19,71%19,71%water on site% change in households 1996-2001 58,71% 27,62% 79,03% 59,58% 29,47% 49,51% 28,79% 9,95% -14,94% 37,76%37,76%37,76%37,76%37,76%without water on siteNumber of households 2001 426 465 362 706 238 596 354 677 211 793 125 435 113 343 106 425 65 702 2 005 1422 005 1422 005 1422 005 1422 005 142without telephone in homeNumber of households 1996 385 060 354 297 250 210 319 709 209 000 124 298 113 496 107 637 74 002 1 937 7091 937 7091 937 7091 937 7091 937 709without telephone in home% of households without 1996 53,00% 55,14% 38,52% 59,33% 48,81% 55,33% 100,00% 100,00% 100,00% 55,28%55,28%55,28%55,28%55,28%telephone in home% change in households 1996-2001 10,75% 2,37% -4,64% 10,94% 1,34% 0,91% -0,13% -1,13% -11,22% 3,48%3,48%3,48%3,48%3,48%without telephone in homeNumber of households without 2001 152 176 159 442 85 255 187 335 109 413 65 180 70 713 27 793 18 731 876 038876 038876 038876 038876 038electricity for lightingNumber of households without 1996 102 526 164 518 82 831 132 171 92 737 64 590 84 071 58 649 30 330 812 423812 423812 423812 423812 423electricity for lighting% of households without 1996 14,12% 25,62% 12,75% 24,58% 21,66% 28,75% 52,81% 38,42% 26,20% 22,34%22,34%22,34%22,34%22,34%electricty for lighting% change in households without 1996-2001 48,43% -3,09% 2,93% 41,74% 17,98% 0,91% -15,89% -52,61% -38,24% 7,83%7,83%7,83%7,83%7,83%electricty for lightingNumber of households without 2001 88 140 114 719 42 736 89 627 122 415 36 278 54 730 74 353 53 381 676 379676 379676 379676 379676 379weekly refuse collectionNumber of households without 1996 82 088 198 047 65 476 71 337 102 924 16 570 64 077 44 940 52 354 697 813697 813697 813697 813697 813weekly refuse collection% of households without weekly 1996 11,45% 31,31% 10,16% 13,34% 24,18% 7,44% 40,58% 29,61% 45,63% 19,38%19,38%19,38%19,38%19,38%refuse collection
INDICATOR Data Joburg eThekwini Cape Town Ekurhuleni Tshwane Nelson Buffalo Mangaung Msunduzi Total ordate Mandela City average

188
STATISTICAL ALMANAC
INDICATOR Data Joburg eThekwini Cape Town Ekurhuleni Tshwane Nelson Buffalo Mangaung Msunduzi Total ordate Mandela City average
% change in households without 1996-2001 7,37% -42,07% -34,73% 25,64% 18,94% 118,94% -14,59% 65,45% 1,96% -3,07%-3,07%-3,07%-3,07%-3,07%weekly refuse collection% of commuters walking/using 2001 32,90% 38,78% 34,38% 33,57% 34,63% 46,79% 56,87% 55,24% 47,76% 37,61%37,61%37,61%37,61%37,61%bicycle to school or work% of comms using public transport 2001 33,42% 32,75% 30,38% 32,96% 32,11% 25,87% 22,86% 26,02% 26,85% 31,16%31,16%31,16%31,16%31,16%(Bus, train, minibus)% of commuters using other 2001 0,69% 0,80% 0,96% 0,69% 0,64% 0,52% 0,44% 0,32% 0,52% 0,71%0,71%0,71%0,71%0,71%Number of households with VIP 2001 135 373 244 779 95 524 126 243 157 552 53 334 62 042 91 846 54 090 1 020 7831 020 7831 020 7831 020 7831 020 783or less
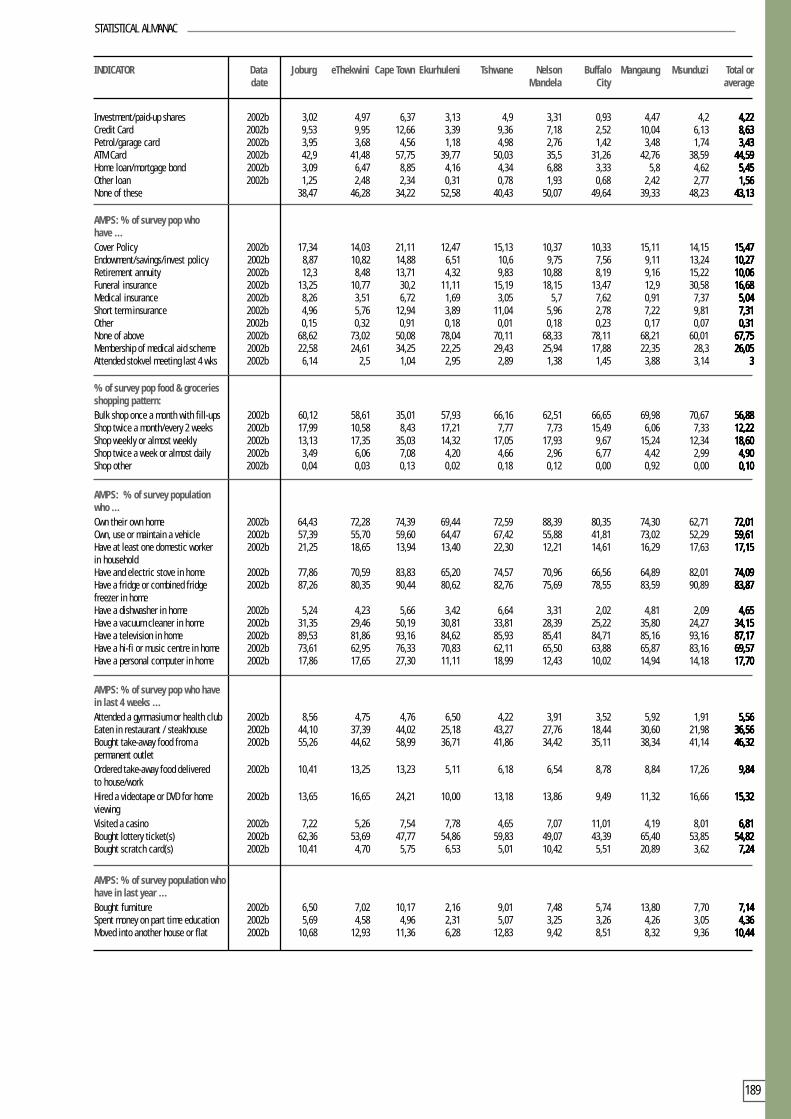
Access to muni community& social facilities/amenities Clinics per 10 000 people 2003 0,30 0,84 0,36 0,73 0,32 0,39Libraries per 10 000 people 2003 0,24 0,24 0,35 0,20 0,11 0,16Swimming pools per 10 000 people 2003 0,18 0,10 0,12 0,11 0,15 0,13Parks per 10 000 people 2003 0,17 2,66 1,82 0,09Public toilets per 10 000 people 2003 0,49 0,36 0,43 0,24 0,63Sports fields per 10 000 people 2003 0,69 0,05 0,23 0,17 0,69 0,75Community halls & recreation 2003 0,29 0,62 0,37 0,31 0,02facilities per 10 000 peopleNursery schools per 10 000 people 2003 0,28 0,03 0,05Child care facilities per 10 000 people 2003 0,28 0,04Retirement homes per 10 000 people 2003 0,08 0,01Rand/capita of CapX spent on new 2002/03 R 7,74 R3,21 R0,15 R2,83 R8,29 R1,30 R1,22 R5,19parks & gardensRand/capita of CapX spent on 2002/03 R8,92 R6,58 R2,94 R0,49 R10,96 R1,15 R0,73 R5,63sports fieldsRand/capita of CapX spent on 2002/03 R5,87 R0,75 R2,09 R3,78 R0,49 R1,98 R0,76 R4,76community hallsRand/capita of CapX spent on 2002/03 R1,65 R0,54 R0,24 R2,72 R0,39 R0,01 R0,00 R11,35librariesRand/capita of CapX spent on 2002/03 R0,60 R3,83 R0,92 R2,17 R2,52 R0,30 R1,00 R1,84recreation facilitiesRand/capita of CapX spent on clinics 2002/03 R2,23 R4,02 R0,55 R2,37 R2,17 R0,00 R2,07 R0,58Rand/capita of CapX spent on 2002/03 R0,91 R2,36 R0,97 R0,01 R7,50 R0,00 R0,00 R0,00museums and art galleriesRand/capita of CapX spent on other 2002/03 R1,19 R2,73 R0,00 R2,62 R3,45 R11,31 R0,00 R8,25% of total CapX spent on new parks 2002/03 2,08% 0,50% 0,05% 0,65% 1,92% 0,29% 0,40% 1,58%& gardens% of total CapX spent on sports fields 2002/03 2,40% 1,02% 1,05% 0,11% 2,54% 0,26% 0,24% 1,71%% of total CapX spent on community 2002/03 1,58% 0,12% 0,74% 0,87% 0,11% 0,44% 0,25% 1,45%halls% of total CapX spent on libraries 2002/03 0,44% 0,08% 0,09% 0,63% 0,09% 0,00% 0,00% 3,45%% of total CapX spent on recreation 2002/03 0,16% 0,59% 0,33% 0,50% 0,58% 0,07% 0,33% 0,56%facilities% of total CapX spent on clinics 2002/03 0,60% 0,62% 0,20% 0,55% 0,50% 0,00% 0,68% 0,18%% of total CapX spent on museums 2002/03 0,24% 0,37% 0,34% 0,00% 1,74% 0,00% 0,00% 0,00%and art galleries% of total CapX spent on other 2002/03 0,32% 0,42% 0,00% 0,60% 0,80% 2,52% 0,00% 2,51% General Human DevelopmentIndicators Number of residents over 20 years 2001 161 507 190 909 77 190 153 650 109 329 42 809 47 241 42 833 35 472 860 940860 940860 940860 940860 940old with no schoolingNumber of residents over 20 years 1996 130 664 174 404 68 111 124 504 97 650 37 394 49 235 35 562 36 502 754 026754 026754 026754 026754 026old with no schooling% of residents over 20 years old with 2001 7,25% 9,98% 4,21% 9,25% 8,32% 6,73% 10,98% 10,90% 10,73% 8,01%8,01%8,01%8,01%8,01%no schooling% of residents over 20 years old with 1996 8,06% 10,97% 4,52% 10,23% 9,79% 6,60% 12,75% 10,30% 12,37% 8,85%8,85%8,85%8,85%8,85%no schooling% change in residents over 20 years 1996-2001 23,60% 9,46% 13,33% 23,41% 11,96% 14,48% -4,05% 20,45% -2,82% 14,18%14,18%14,18%14,18%14,18%with no schoolingAsylum applicants per UNHCR 2002 11 240 1 922 5 594 NA 1 370 716 NA NA NA 20 84220 84220 84220 84220 842Refugee Reception CentreAsylum applications approved by RRC 2002 61 148 909 NA 629 248 NA NA NA 1 9951 9951 9951 9951 995Asylum applications rejected by RRC 2002 12 74 64 NA 274 113 NA NA NA 537537537537537 AMPS: % of survey pop whomake use of … Cheque account 2002b 13,5 10,84 15,94 7,1 18,26 9,77 7,23 13,71 7,98 12,3612,3612,3612,3612,36Savings account 2002b 54,93 44,98 57,26 43,68 42,87 39,71 47,99 53,63 44,78 48,6848,6848,6848,6848,68Transmission account 2002b 5,39 6,92 6,5 6,45 3,05 5,58 2,8 4,65 17,43 5,995,995,995,995,99
189
STATISTICAL ALMANAC
Investment/paid-up shares 2002b 3,02 4,97 6,37 3,13 4,9 3,31 0,93 4,47 4,2 4,224,224,224,224,22Credit Card 2002b 9,53 9,95 12,66 3,39 9,36 7,18 2,52 10,04 6,13 8,638,638,638,638,63Petrol/garage card 2002b 3,95 3,68 4,56 1,18 4,98 2,76 1,42 3,48 1,74 3,433,433,433,433,43ATM Card 2002b 42,9 41,48 57,75 39,77 50,03 35,5 31,26 42,76 38,59 44,5944,5944,5944,5944,59Home loan/mortgage bond 2002b 3,09 6,47 8,85 4,16 4,34 6,88 3,33 5,8 4,62 5,455,455,455,455,45Other loan 2002b 1,25 2,48 2,34 0,31 0,78 1,93 0,68 2,42 2,77 1,561,561,561,561,56None of these 38,47 46,28 34,22 52,58 40,43 50,07 49,64 39,33 48,23 43,1343,1343,1343,1343,13
AMPS: % of survey pop whohave … Cover Policy 2002b 17,34 14,03 21,11 12,47 15,13 10,37 10,33 15,11 14,15 15,4715,4715,4715,4715,47Endowment/savings/invest policy 2002b 8,87 10,82 14,88 6,51 10,6 9,75 7,56 9,11 13,24 10,2710,2710,2710,2710,27Retirement annuity 2002b 12,3 8,48 13,71 4,32 9,83 10,88 8,19 9,16 15,22 10,0610,0610,0610,0610,06Funeral insurance 2002b 13,25 10,77 30,2 11,11 15,19 18,15 13,47 12,9 30,58 16,6816,6816,6816,6816,68Medical insurance 2002b 8,26 3,51 6,72 1,69 3,05 5,7 7,62 0,91 7,37 5,045,045,045,045,04Short term insurance 2002b 4,96 5,76 12,94 3,89 11,04 5,96 2,78 7,22 9,81 7,317,317,317,317,31Other 2002b 0,15 0,32 0,91 0,18 0,01 0,18 0,23 0,17 0,07 0,310,310,310,310,31None of above 2002b 68,62 73,02 50,08 78,04 70,11 68,33 78,11 68,21 60,01 67,7567,7567,7567,7567,75Membership of medical aid scheme 2002b 22,58 24,61 34,25 22,25 29,43 25,94 17,88 22,35 28,3 26,0526,0526,0526,0526,05Attended stokvel meeting last 4 wks 2002b 6,14 2,5 1,04 2,95 2,89 1,38 1,45 3,88 3,14 33333
% of survey pop food & groceriesshopping pattern:Bulk shop once a month with fill-ups 2002b 60,12 58,61 35,01 57,93 66,16 62,51 66,65 69,98 70,67 56,8856,8856,8856,8856,88Shop twice a month/every 2 weeks 2002b 17,99 10,58 8,43 17,21 7,77 7,73 15,49 6,06 7,33 12,2212,2212,2212,2212,22Shop weekly or almost weekly 2002b 13,13 17,35 35,03 14,32 17,05 17,93 9,67 15,24 12,34 18,6018,6018,6018,6018,60Shop twice a week or almost daily 2002b 3,49 6,06 7,08 4,20 4,66 2,96 6,77 4,42 2,99 4,904,904,904,904,90Shop other 2002b 0,04 0,03 0,13 0,02 0,18 0,12 0,00 0,92 0,00 0,100,100,100,100,10
AMPS: % of survey populationwho … Own their own home 2002b 64,43 72,28 74,39 69,44 72,59 88,39 80,35 74,30 62,71 72,0172,0172,0172,0172,01Own, use or maintain a vehicle 2002b 57,39 55,70 59,60 64,47 67,42 55,88 41,81 73,02 52,29 59,6159,6159,6159,6159,61Have at least one domestic worker 2002b 21,25 18,65 13,94 13,40 22,30 12,21 14,61 16,29 17,63 17,1517,1517,1517,1517,15in householdHave and electric stove in home 2002b 77,86 70,59 83,83 65,20 74,57 70,96 66,56 64,89 82,01 74,0974,0974,0974,0974,09Have a fridge or combined fridge 2002b 87,26 80,35 90,44 80,62 82,76 75,69 78,55 83,59 90,89 83,8783,8783,8783,8783,87freezer in homeHave a dishwasher in home 2002b 5,24 4,23 5,66 3,42 6,64 3,31 2,02 4,81 2,09 4,654,654,654,654,65Have a vacuum cleaner in home 2002b 31,35 29,46 50,19 30,81 33,81 28,39 25,22 35,80 24,27 34,1534,1534,1534,1534,15Have a television in home 2002b 89,53 81,86 93,16 84,62 85,93 85,41 84,71 85,16 93,16 87,1787,1787,1787,1787,17Have a hi-fi or music centre in home 2002b 73,61 62,95 76,33 70,83 62,11 65,50 63,88 65,87 83,16 69,5769,5769,5769,5769,57Have a personal computer in home 2002b 17,86 17,65 27,30 11,11 18,99 12,43 10,02 14,94 14,18 17,7017,7017,7017,7017,70
AMPS: % of survey pop who havein last 4 weeks … Attended a gymnasium or health club 2002b 8,56 4,75 4,76 6,50 4,22 3,91 3,52 5,92 1,91 5,565,565,565,565,56Eaten in restaurant / steakhouse 2002b 44,10 37,39 44,02 25,18 43,27 27,76 18,44 30,60 21,98 36,5636,5636,5636,5636,56Bought take-away food from a 2002b 55,26 44,62 58,99 36,71 41,86 34,42 35,11 38,34 41,14 46,3246,3246,3246,3246,32permanent outletOrdered take-away food delivered 2002b 10,41 13,25 13,23 5,11 6,18 6,54 8,78 8,84 17,26 9,849,849,849,849,84to house/workHired a videotape or DVD for home 2002b 13,65 16,65 24,21 10,00 13,18 13,86 9,49 11,32 16,66 15,3215,3215,3215,3215,32viewingVisited a casino 2002b 7,22 5,26 7,54 7,78 4,65 7,07 11,01 4,19 8,01 6,816,816,816,816,81Bought lottery ticket(s) 2002b 62,36 53,69 47,77 54,86 59,83 49,07 43,39 65,40 53,85 54,8254,8254,8254,8254,82Bought scratch card(s) 2002b 10,41 4,70 5,75 6,53 5,01 10,42 5,51 20,89 3,62 7,247,247,247,247,24
AMPS: % of survey population whohave in last year … Bought furniture 2002b 6,50 7,02 10,17 2,16 9,01 7,48 5,74 13,80 7,70 7,147,147,147,147,14Spent money on part time education 2002b 5,69 4,58 4,96 2,31 5,07 3,25 3,26 4,26 3,05 4,364,364,364,364,36Moved into another house or flat 2002b 10,68 12,93 11,36 6,28 12,83 9,42 8,51 8,32 9,36 10,4410,4410,4410,4410,44
INDICATOR Data Joburg eThekwini Cape Town Ekurhuleni Tshwane Nelson Buffalo Mangaung Msunduzi Total ordate Mandela City average
190
STATISTICAL ALMANAC
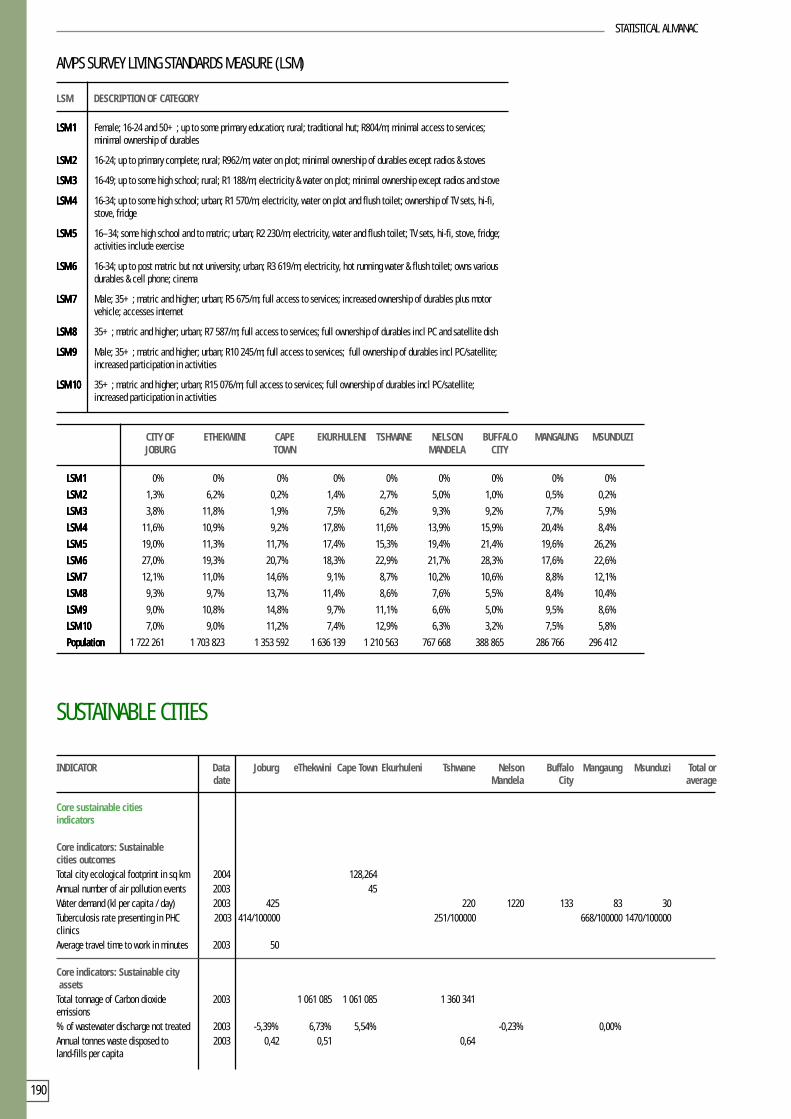
AMPS SURVEY LIVING STANDARDS MEASURE (LSM)
LSM DESCRIPTION OF CATEGORY
LSM 1LSM 1LSM 1LSM 1LSM 1 Female; 16-24 and 50+; up to some primary education; rural; traditional hut; R804/m; minimal access to services;minimal ownership of durables
LSM 2LSM 2LSM 2LSM 2LSM 2 16-24; up to primary complete; rural; R962/m; water on plot; minimal ownership of durables except radios & stoves
LSM 3LSM 3LSM 3LSM 3LSM 3 16-49; up to some high school; rural; R1 188/m; electricity & water on plot; minimal ownership except radios and stove
LSM 4LSM 4LSM 4LSM 4LSM 4 16-34; up to some high school; urban; R1 570/m; electricity, water on plot and flush toilet; ownership of TV sets, hi-fi,stove, fridge
LSM 5LSM 5LSM 5LSM 5LSM 5 16–34; some high school and to matric; urban; R2 230/m; electricity, water and flush toilet; TV sets, hi-fi, stove, fridge;activities include exercise
LSM 6LSM 6LSM 6LSM 6LSM 6 16-34; up to post matric but not university; urban; R3 619/m; electricity, hot running water & flush toilet; owns variousdurables & cell phone; cinema
LSM 7LSM 7LSM 7LSM 7LSM 7 Male; 35+; matric and higher; urban; R5 675/m; full access to services; increased ownership of durables plus motorvehicle; accesses internet
LSM 8LSM 8LSM 8LSM 8LSM 8 35+; matric and higher; urban; R7 587/m; full access to services; full ownership of durables incl PC and satellite dish
LSM 9LSM 9LSM 9LSM 9LSM 9 Male; 35+; matric and higher; urban; R10 245/m; full access to services; full ownership of durables incl PC/satellite;increased participation in activities
LSM 10LSM 10LSM 10LSM 10LSM 10 35+; matric and higher; urban; R15 076/m; full access to services; full ownership of durables incl PC/satellite;increased participation in activities
SUSTAINABLE CITIES
INDICATOR Data Joburg eThekwini Cape Town Ekurhuleni Tshwane Nelson Buffalo Mangaung Msunduzi Total ordate Mandela City average
Core sustainable citiesindicators Core indicators: Sustainablecities outcomes Total city ecological footprint in sq km 2004 128,264Annual number of air pollution events 2003 45Water demand (kl per capita / day) 2003 425 220 1220 133 83 30Tuberculosis rate presenting in PHC 2003 414/100000 251/100000 668/100000 1470/100000clinicsAverage travel time to work in minutes 2003 50 Core indicators: Sustainable city assetsTotal tonnage of Carbon dioxide 2003 1 061 085 1 061 085 1 360 341emissions% of wastewater discharge not treated 2003 -5,39% 6,73% 5,54% -0,23% 0,00%Annual tonnes waste disposed to 2003 0,42 0,51 0,64land-fills per capita
LSM 1LSM 1LSM 1LSM 1LSM 1 0% 0% 0% 0% 0% 0% 0% 0% 0%
LSM 2LSM 2LSM 2LSM 2LSM 2 1,3% 6,2% 0,2% 1,4% 2,7% 5,0% 1,0% 0,5% 0,2%
LSM 3LSM 3LSM 3LSM 3LSM 3 3,8% 11,8% 1,9% 7,5% 6,2% 9,3% 9,2% 7,7% 5,9%
LSM 4LSM 4LSM 4LSM 4LSM 4 11,6% 10,9% 9,2% 17,8% 11,6% 13,9% 15,9% 20,4% 8,4%
LSM 5LSM 5LSM 5LSM 5LSM 5 19,0% 11,3% 11,7% 17,4% 15,3% 19,4% 21,4% 19,6% 26,2%
LSM 6LSM 6LSM 6LSM 6LSM 6 27,0% 19,3% 20,7% 18,3% 22,9% 21,7% 28,3% 17,6% 22,6%
LSM 7LSM 7LSM 7LSM 7LSM 7 12,1% 11,0% 14,6% 9,1% 8,7% 10,2% 10,6% 8,8% 12,1%
LSM 8LSM 8LSM 8LSM 8LSM 8 9,3% 9,7% 13,7% 11,4% 8,6% 7,6% 5,5% 8,4% 10,4%
LSM 9LSM 9LSM 9LSM 9LSM 9 9,0% 10,8% 14,8% 9,7% 11,1% 6,6% 5,0% 9,5% 8,6%
LSM 10LSM 10LSM 10LSM 10LSM 10 7,0% 9,0% 11,2% 7,4% 12,9% 6,3% 3,2% 7,5% 5,8%
PopulationPopulationPopulationPopulationPopulation 1 722 261 1 703 823 1 353 592 1 636 139 1 210 563 767 668 388 865 286 766 296 412
CITY OF ETHEKWINI CAPE EKURHULENI TSHWANE NELSON BUFFALO MANGAUNG MSUNDUZIJOBURG TOWN MANDELA CITY

191
STATISTICAL ALMANAC
% of solid waste recycled 2003 20,00% 8,00% 5,00% 10,00%% unnacounted for water in last 2003fiscal yearNumber environmental staff / 20031000 population% of municipal area actually 2003 50,00% 15,00%monitored fpr air quality% of final effluent quality 2003 95,00% 94,00% 35,00% 87,71% 99,00%compliance (flow weighted)Sewer blockages per 100km of 2003 399 586 1,044 476 1,073 130pipe per year% of built-up municipal area 2003developed as parks% increase in 1 room formal 1996-2001 262,23% 202,25% 364,64% 319,31% 224,96% 182,60% 61,71% 95,90% 67,65% 226,87%226,87%226,87%226,87%226,87%houses last 5 yrs
General environmental andliveability indicators Waste management Domestic waste total tonnage 2003 393 226 500 000 854 880 30% of total waste that is domestic 2003 32,00% 59,00% 52,00%Commercial/Industrial waste total 2003 274 804 361 680 25tonnage% of total waste that is comm / 2003 23,00% 38,00% 22,00%IndustrialIllegal Dumping total tonnage 2003 266,139 115,080% of total waste that is dumped 2003 22,00% 3,00% 7,00%illegally% of solid waste disposed to sanitary landfill% of solid waste incinerated (c) % of solid waste disposed to opendump % of solid waste burned openly % of solid waste to compost
Urban sprawl and transportpressures Number of households in formal 2001 105 193 39 862 25 312 68 705 32 291 9 760 6 348 7 777 7 192 302 440302 440302 440302 440302 440backyard dwellingsNumber of households in formal 1996 99 024 55 735 31 989 60 235 34 604 8 892 7 602 9 227 11 205 318 513318 513318 513318 513318 513backyard dwellings% of households in formal 2001 10,48% 5,09% 3,34% 9,25% 5,76% 3,75% 3,33% 4,22% 5,53% 6,56%6,56%6,56%6,56%6,56%backyard dwellings% of households in formal 1996 13,87% 8,76% 4,97% 11,35% 8,29% 3,99% 4,96% 6,08% 9,73% 8,89%8,89%8,89%8,89%8,89%backyard dwellings% change in number of formal 1996-2001 6,23% -28,48% -20,87% 14,06% -6,68% 9,76% -16,50% -15,71% -35,81% -5,05%-5,05%-5,05%-5,05%-5,05%backyard dwellingsNumber of households in informal 2001 78 716 27 292 32 804 50 002 23 915 7 894 10 788 8 010 2 806 242 227242 227242 227242 227242 227backyard dwellingsNumber of households in informal 1996 99 676 156 739 106 151 119 160 63 102 52 999 44 285 31 894 31 070 705 076705 076705 076705 076705 076backyard dwellings% of households in informal 2001 7,84% 3,48% 4,33% 6,73% 4,26% 3,04% 5,66% 4,34% 2,16% 5,25%5,25%5,25%5,25%5,25%backyard dwellings% of households in informal 1996 13,96% 24,65% 16,50% 22,46% 15,12% 23,81% 28,88% 21,02% 26,97% 19,67%19,67%19,67%19,67%19,67%backyard dwellings% change in number of informal 1996-2001 -21,03% -82,59% -69,10% -58,04% -62,10% -85,11% -75,64% -74,89% -90,97% -65,65%-65,65%-65,65%-65,65%-65,65%backyard dwellingsNumber households in 1 room 2001 154 030 107 609 69 303 106 876 53 217 17 592 32 278 37 660 14 006 592 571592 571592 571592 571592 571dwellings not in backyardNumber households in 1 room 1996 71 003 32 412 18 475 40 667 19 955 5 630 13 488 12 759 5 268 219 657219 657219 657219 657219 657dwellings not in backyard% of households in 1 room 2001 15,34% 13,74% 9,15% 14,39% 9,49% 6,77% 16,94% 20,41% 10,77% 12,84%12,84%12,84%12,84%12,84%dwellings not in backyard% of households in 1 room 1996 9,95% 5,10% 2,87% 7,66% 4,78% 2,53% 8,80% 8,41% 4,57% 6,13%6,13%6,13%6,13%6,13%dwellings not in backyard% change in 1 room dwellings 1996-2001 116,93% 232,00% 275,12% 162,81% 166,69% 212,47% 139,31% 195,16% 165,87% 169,77%169,77%169,77%169,77%169,77%not in backyard% of commuter using Car/ 2001 32,99% 27,67% 34,28% 32,78% 32,63% 26,82% 19,82% 18,43% 24,87% 30,52%30,52%30,52%30,52%30,52%motorcycle driver or passenger
INDICATOR Data Joburg eThekwini Cape Town Ekurhuleni Tshwane Nelson Buffalo Mangaung Msunduzi Total ordate Mandela City average

192
STATISTICAL ALMANAC
Wastewater treatment Volume of wastewater treated 2003 839,00 485,00 529,00 132,30 90,00(in-house) (Ml/Day)Production per person per day 2003 255,00 162,50 175,00 41,25 28,13% of treatment capacity utilisation 2003 95,02% 67,36% 85,32% 70,90% 87,38%% of dry tons sludge produced not 2003 0,00% 5,00% 0,00% 0,00%meeting standard% of wastewater produced that is 2003 6,13% 6,73% 8,50% 4,70% 3,00%recycled/reclaimed% of income from sale of by-products 2003 0,00% 0,00% 17,81% 2,81%Network density in terms of m of 2003 18,2 14,0 11,9 17,8 23,3 25,9pipe per connection
Energy usageTotal city energy ecological footprint 2004 10 920in sq kmConsumption of electricty per 2003capita per day
INDICATOR Data Joburg eThekwini Cape Town Ekurhuleni Tshwane Nelson Buffalo Mangaung Msunduzi Total ordate Mandela City average
WELL-GOVERNED CITIES
INDICATOR Data Joburg eThekwini Cape Town Ekurhuleni Tshwane Nelson Buffalo Mangaung Msunduzi Total ordate Mandela City average
Core well-governed cities indicators
Core indicators: Well governed cities % residents satisfied with municipality 2003% of total eligible voters registered 2004to vote% revenue collected vs revenue billed 2002/3 88% 89% 93% 97% 83% 92% 88%Number of incidents of public violence 2002/03 61 43 169 33 27 28 70Number of legal claims against municipality per yearValue townhouse plans passed as 2002 28,52% 15,67% 7,36% 16,39% 35,75% 10,26% 0,68% 33,90% 7,44% 19,63%19,63%19,63%19,63%19,63%% total residential
Core indicators: Good governanceassets Number formal muni partnerships with NGOs / CBOsTotal comm orgs attending generalward meets Total municipal revenue per capita 2002/03 R3 269,27 R2 951,76 R3 297,67 R3 131,50 R2 957 11 R2 460,17 R1 869,55 R1 982,82 R2 102,69 R2 963,23R2 963,23R2 963,23R2 963,23R2 963,23Percentage of capital charges 2001/02 13,24% 17,04% 16,60% 9,82% 13,51% 11,83% 17,06% 10,71% 13,90%to total OpxRatio of CapX to OpX 2002/03 11:89 19:81 20:80 9:91 15:85 18:82 24:76 15:85 16:84 15:8515:8515:8515:8515:85% of total OpX spent on maintenance 2002/03 1,93% 10,74% 4,22% 8,61% 13,11% 7,37% 5,70% 8,66% 3,96% 6,88%6,88%6,88%6,88%6,88%% of total OpX spent on salaries 2002/03 29,19% 31,80% 22,66% 29,49% 31,39% 28,41% 42,34% 29,69% 28,90% 28,54%28,54%28,54%28,54%28,54%Number of municipal employees per1000 pop Electricity reconnections minus 2002/03 -523 -40 816 -53 194 -3 845 -2 315disconnections in yearNumber of formal IGR agreements in terms of IGR act
General government efficiency &effectiveness indicators General governanceMunicipal Category 2004 A A A A A A B B BPolitical systems type: executive 2004 Exec Mayor EXCO Exec Mayor Exec Mayor Exec Mayor Exec Mayor Exec Mayor Exec Mayor EXCOPolitical systems type: participatory 2004 Ward Sub-Council Ward Ward Ward Ward Ward

193
STATISTICAL ALMANAC
Financial capacity, stability andefficacyCapital budget 2002/3 R1 248m R1 792m R1 913m R727m R888m R437m R317m R199m R184m R7 707mR7 707mR7 707mR7 707mR7 707mOperating budget 2002/3 R9 730m R7 544m R7 861m R7 360m R5 182m R2 055m R1 002m R1 097m R993m R42 825mR42 825mR42 825mR42 825mR42 825mCapital budget peRcapita 2002/3 R371,62 R566,59 R645,49 R281,37 R432,68 R431,91 R449,66 R305,53 R329,01 R451,95R451,95R451,95R451,95R451,95Operating budget peRcapita 2002/3 R2 897,65 R2 385,18 R2 652,17 R2 850,12 R2 524,43 R2 028,26 R1 419,89 R1 677,29 R1 773,69 R2 511,29R2 511,29R2 511,29R2 511,29R2 511,29Municipal credit rating 2002/3 LT:A; ST:F2 AA ST:A1, ST:A1; ST:A3; ST: A1; ST:A2;
LT:+A LT:A+ LT:BBB LT:BBBAgency from which credit rating 2002/3 Fitch Global Global Global Global Global Globalsecured Ibca Credit Credit Credit Credit Credit Credit% of municipal debt < 30 days end 2003 2 5 NA 5 8 35% of municipal debt 30-60 days end 2003 5 2 17 4 4 4% of municipal debt 60-90 days end 2003 3 2 6 4 3 4% of municipal debt over 90 days end 2003 89 91 78 86 86 57% of total OpX spent on bulk 2002/03 18,78% 18,15% 11,68% 23,14% 15,42% 18,31% 22,21% 20,92% 21,62% 17,26%17,26%17,26%17,26%17,26%electricty purchases% of total OpX spent on bulk water 2002/03 11,11% 7,45% 3,71% 11,75% 6,68% 0,00% 5,48% 10,69% 8,29% 7,39%7,39%7,39%7,39%7,39%purchases% of total OpX contributed to 2002/03 6,36% 0,00% 0,00% 0,66% 5,17% 7,27% 1,18% 2,59% 6,20% 2,62%2,62%2,62%2,62%2,62%special funds% of total OpX set aside for 2002/03 5,37% 0,94% 0,00% 0,00% 0,00% 5,56% 0,80% 0,00% 0,68% 1,56%1,56%1,56%1,56%1,56%working capital Administrative efficiencybenchmarksNumber of permanent staff employed 2003 11 562 18 500 27 200 13 420 3 831 4 146 3 332Water Dept staff per 1000 water 2003 1,63 1,50 3,58 1,95 2,35 3,00 1,96 3,78connectionsElectricity Dept staff per 1000 2003 6,75 3,22 9,05 2,17 2,52electricty connectionsSanitation Dept staff per 1000 2003 2,22 2,09 1,99 1,61 2,23 3,00 2,16sewer connectionsAv processing time (days) for 2002/03 5 4 5 10 2 1applications: Minor buildingAv processing time (days) for 2002/03 10 20 15 10 15 1applications: DwellingsAv processing time (days) for 2002/03 27 20 10 4 1applications: MBW & circWater reconnections minus 2002/03 -626 -39 069 -20 164disconnections/restrictionsNumber of water meters read in 2002/03 2 505 572 3 850 000 1 530 312 1 035 120 702 192the yearNumber of water bills sent in the year 2002/03 4 489 716 4 200 000 1 512 396 1 002 840 702 192Number of estimated water bills 2002/03 1 157 305 350 000 88 576 100 284sent in yearWritten queries/complaints received 2002/03 7 112 2 000 7 090 2 001 25(re billing)Telephone queries/complaints 2002/03 38 867 730 000 19 025 1 679 7 800received (re billing)
INDICATOR Data Joburg eThekwini Cape Town Ekurhuleni Tshwane Nelson Buffalo Mangaung Msunduzi Total ordate Mandela City average

194
STATISTICAL ALMANAC
TABLE OF FIGURES
1 Contribution of major cities
2. Formal housing needs index
3. Relative advantage and disadvantage of SACN cities
4. Growth and decline: population and employment
5. Growth rates in SACN cities and 12 secondary cities
6. Population age and gender pyramids for 3 cities
7. Bushbuckridge Demographic Surveillance Survey
8. Population living in urban areas
9. Census 2001 date on migration and intra-city movement
10. Persons with non-South African citizenship
11. Population and AIDS mortality trends
12. Population growth and economic development
13. GGP and GGP per capita in SACN cities 1970-1994
14a. GVA and GVA per capita growth in SACN cities 1996-2001
14b. Annual GVA growth per sector 1996-2001 and 2001-2002
15. Unemployment rates per city
16. Numbers employed per city 1946-2001
17. Gross value add per sector 1970-2001 and actualemployment growth
18. Percentage employment across sectors in 2001
19. Numbers employed in manufacturing
20. Employment growth across sectors and occupations1996-2001
21. RSC levy assessments 2001-2002
22. Income earned by population group and income categoryin Tshwane
23. Difference between Census and LFS unemployment ratesper city
24a. Utilisation of manufacturing capacity
24b. Reserve bank Time-series Data 1970-2002
25. Constraints on growth and employment in eThekwini
26. Movement of people and goods through airports and ports
27. Length of time taken to process planning applications
28. Levels of crime affecting business directly 1994-2003
29. Value of industrial and commercial building plans passedin 2002
30. Frequency of urban renewal initiatives
31. Comparison of numbers in households without access toservices
32. Changes in access to household water services per city1996-2001
33. Comparison of cities, formal and informal housing
34. Social services and amenities per city per 10 000 people
35. Geographic distribution of health facilities inJohannesburg
36. Proportion of households with access to levels of servicesand shelter
37. Census data on household income distribution
38. Income distribution across the SACN cities
39. Measures of dependency 1996-2001
40. Reserve Bank data for price of metropolitan services1970-2002
41. Average monthly expenditure on household items,eThekwini
42. Percentage of income payable on municipal serviceaccounts per city
43. Per capita disposable income and expenditure on housingand utilities
44. Percentages of households with access to typicalhousehold goods 2001
45. Ownership and access to goods and services per city(AMPS 2002)
46. Spatial disadvantage in Ekurhuleni
47. Modes of transport, costs and travel time
48. Population over age 65 per city 1996 vs 2001
49. Indicators of gender equality
50. Satisfaction with standards of living across populationgroups, eThekwini
51. Plans for improving dwellings, eThekwini
52. Density and population group concentration, Tshwane
53. De-densification of office nodes in Johannesburg 1960-2001
54a. Waste challenge in SACN cities, 2003
54b. Areas likely to face severe water shortages in 2025
55. Water and water quality indicators, 2003
56. Air pollution and related diseases in Johannesburg
57. Air pollution indicators for cities, 2003
58. Cape Town’s ecological footprint
59. Cars moving in and out of Johannesburg, 2001 and 2003
60. Financial management targets, City of Johannesburg
61a. Revenue management figures, Johannesburg
61b. Municipal debt and margin squeeze, Johannesburg
62. Levels of satisfaction with services across cities
63. Residents satisfaction levels, Johannesburg 2003
64. Participation in SACN cities
65. Incidents of public violence per city 1994-2003
66. Crimes against person statistics in cities, 2002-2003
67. Crime statistics per population group, eThekwini
68. Inner-city membership of organizations, Johannesburg2003
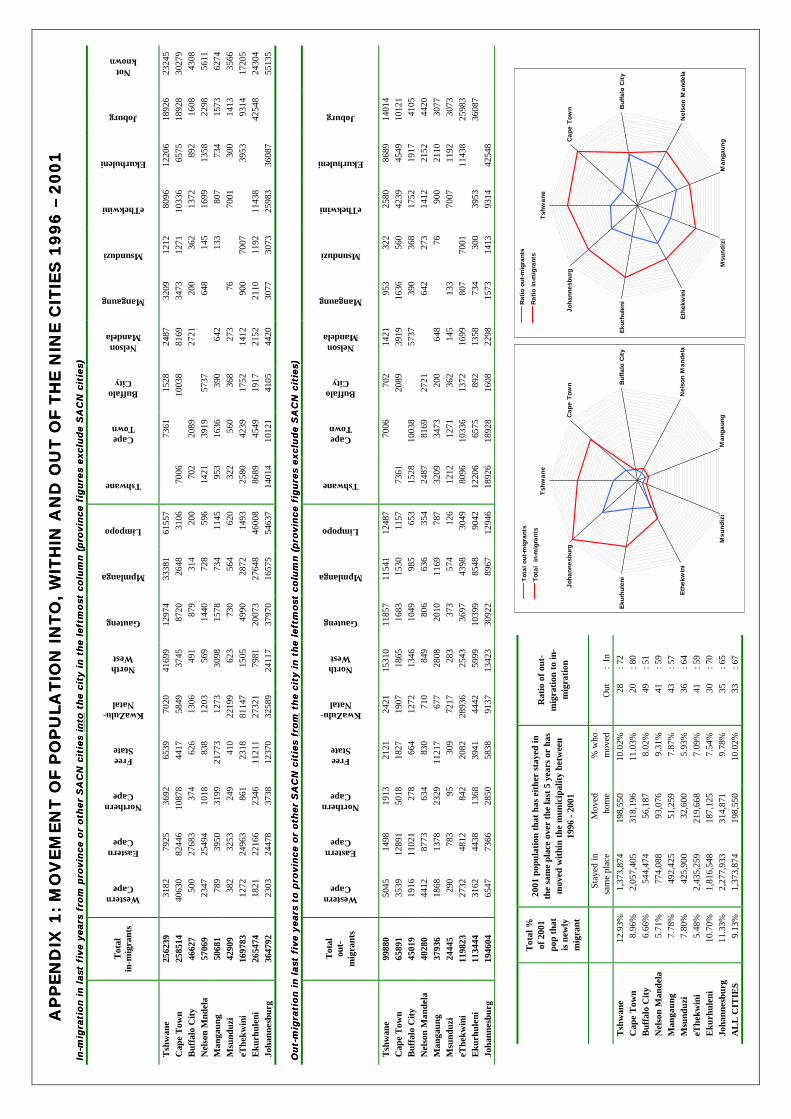
APPENDIX 1 Movement of people across cities
Gross Value Add per city
AP
PE
ND
IX 1
: M
OV
EM
EN
T O
F P
OP
ULA
TIO
N I
NT
O,
WIT
HIN
AN
D O
UT
OF T
HE
NIN
E C
ITIE
S 1
99
6 –
20
01
AP
PE
ND
IX 1
: M
OV
EM
EN
T O
F P
OP
ULA
TIO
N I
NT
O,
WIT
HIN
AN
D O
UT
OF T
HE
NIN
E C
ITIE
S 1
99
6 –
20
01
In-m
igra
tio
n i
n l
ast
fiv
e y
ears
fro
m p
rovin
ce o
r o
ther
SA
CN
cit
ies
In-m
igra
tio
n i
n l
ast
fiv
e y
ears
fro
m p
rovin
ce o
r o
ther
SA
CN
cit
ies
into
into
th
e c
ity i
n t
he l
eft
mo
st c
olu
mn
(p
rovin
ce f
igu
res
exclu
de S
AC
N c
itie
s) t
he c
ity i
n t
he l
eft
mo
st c
olu
mn
(p
rovin
ce f
igu
res
exclu
de S
AC
N c
itie
s)
Tot
alin
-mig
rant
s
WesternCape
EasternCape
NorthernCape
FreeState
KwaZulu-Natal
NorthWest
Gauteng
Mpmlanga
Limpopo
Tshwane
CapeTown
BuffaloCity
NelsonMandela
Mangaung
Msunduzi
eThekwini
Ekurhuleni
Joburg
Notknown
Tsh
wan
e25
6239
3182
7925
3692
6539
7020
4169
912
974
3338
161
557
7361
1528
2487
3209
1212
8096
1220
618
926
2324
5C
ape
Tow
n25
8514
4063
082
446
1087
844
1758
4937
4587
2026
4831
0670
0610
038
8169
3473
1271
1033
665
7518
928
3027
9B
uffa
lo C
ity
4662
750
027
683
374
626
1306
491
879
314
200
702
2089
2721
200
362
1372
892
1608
4308
Nel
son
Mnd
ela
5706
923
4725
494
1018
838
1203
569
1440
728
596
1421
3919
5737
648
145
1699
1358
2298
5611
Man
gaun
g50
681
789
3950
3199
2177
312
7330
9815
7873
411
4595
316
3639
064
213
380
773
415
7362
74M
sund
uzi
4290
938
232
5324
941
022
199
623
730
564
620
322
560
368
273
7670
0130
014
1335
66eT
hekw
ini
1697
8312
7224
963
861
2318
8114
715
0549
9028
7214
9325
8042
3917
5214
1290
070
0739
5393
1417
205
Eku
rhul
eni
2654
7418
2122
166
2346
1121
127
321
7981
2007
327
648
4600
886
8945
4919
1721
5221
1011
9211
438
4254
824
304
Joha
nnes
burg
3647
9223
0324
478
3738
1237
032
589
2411
737
970
1657
554
637
1401
410
121
4105
4420
3077
3073
2598
336
087
5513
5
Ou
t-m
igra
tio
n i
n l
ast
fiv
e y
ears
to
pro
vin
ce o
r o
ther
SA
CN
cit
ies
Ou
t-m
igra
tio
n i
n l
ast
fiv
e y
ears
to
pro
vin
ce o
r o
ther
SA
CN
cit
ies
from
from
th
e c
ity i
n t
he l
eft
mo
st c
olu
mn
th
e c
ity i
n t
he l
eft
mo
st c
olu
mn
(p
rovin
ce f
igu
res
exclu
de S
AC
N c
itie
s) (
pro
vin
ce f
igu
res
exclu
de S
AC
N c
itie
s)
Tot
alou
t-m
igra
nts
WesternCape
EasternCape
NorthernCape
FreeState
KwaZulu-Natal
NorthWest
Gauteng
Mpmlanga
Limpopo
Tshwane
CapeTown
BuffaloCity
NelsonMandela
Mangaung
Msunduzi
eThekwini
Ekurhuleni
Joburg
Tsh
wan
e99
880
5045
1498
1913
2121
2421
1531
011
857
1154
112
487
7006
702
1421
953
322
2580
8689
1401
4C
ape
Tow
n65
891
3539
1289
150
1818
2719
0718
6516
8315
3011
5773
6120
8939
1916
3656
042
3945
4910
121
Buf
falo
Cit
y45
019
1916
1102
127
866
412
7213
4610
4998
565
315
2810
038
5737
390
368
1752
1917
4105
Nel
son
Man
dela
4028
044
1287
7363
483
071
084
980
663
635
424
8781
6927
2164
227
314
1221
5244
20M
anga
ung
3793
618
6813
7823
2911
217
677
2808
2010
1169
787
3209
3473
200
648
7690
021
1030
77M
sund
uzi
2444
529
078
395
309
7217
283
373
574
126
1212
1271
362
145
133
7007
1192
3073
eThe
kwin
i11
9823
2732
4812
842
2082
2893
625
4336
9743
9830
4980
9610
336
1372
1699
807
7001
1143
825
983
Eku
rhul
eni
1134
4431
6244
3813
6839
4144
4259
9910
399
8548
9042
1220
665
7589
213
5873
430
039
5336
087
Joha
nnes
burg
1946
0465
4773
6628
5058
3891
3713
423
3092
289
6712
946
1892
618
928
1608
2298
1573
1413
9314
4254
8
Tshw
ane
Cap
e To
wn B
uffa
lo C
ity
Nel
son
Man
dela
Man
gaun
gM
sund
izi
Ethe
kwin
i
Ekur
hule
ni
Joha
nnes
burg
Tota
l out
-mig
rant
s
Tota
l in
-mig
rant
sTs
hwan
e
Cap
e To
wn B
uffa
lo C
ity
Nel
son
Man
dela
Man
gaun
gM
sund
izi
Ethe
kwin
i
Ekur
hule
ni
Joha
nnes
burg
Rat
io o
ut-m
igra
nts
Rat
io in
-mig
rant
sT
otal
%of
200
1po
p th
atis
new
lym
igra
nt
2001
pop
ulat
ion
that
has
eit
her
stay
ed in
the
sam
e pl
ace
over
the
last
5 y
ears
or
has
mov
ed w
ithi
n th
e m
unic
ipal
ity
betw
een
1996
- 2
001
Rat
io o
f ou
t-m
igra
tion
to
in-
mig
rati
on
Stay
ed in
sam
e pl
ace
Mov
edho
me
% w
hom
oved
Out
: In
Tsh
wan
e12
.93%
1,37
3,87
419
8,55
010
.02%
28: 7
2C
ape
Tow
n8.
96%
2,05
7,40
531
8,19
611
.03%
20: 8
0B
uffa
lo C
ity
6.66
%54
4,47
456
,187
8.02
%49
: 51
Nel
son
Man
dela
5.71
%77
4,08
893
,076
9.31
%41
: 59
Man
gaun
g7.
78%
492,
425
51,2
597.
87%
43: 5
7M
sund
uzi
7.80
%42
5,90
032
,600
5.93
%36
: 64
eThe
kwin
i5.
48%
2,43
5,25
921
9,66
87.
09%
41: 5
9E
kurh
ulen
i10
.70%
1,81
6,54
818
7,12
57.
54%
30: 7
0Jo
hann
esbu
rg11
.33%
2,27
7,93
331
4,87
19.
78%
35: 6
5A
LL
CIT
IES
9.13
%1,
373,
874
198,
550
10.0
2%33
: 67
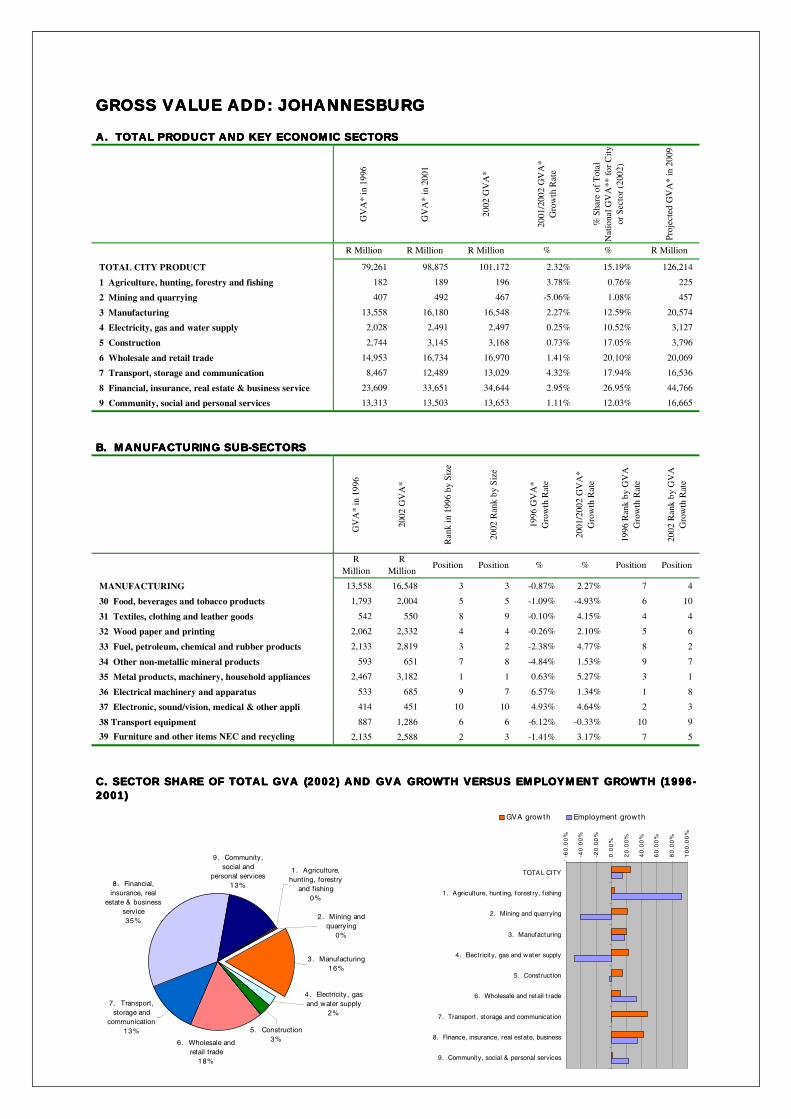
GROSS VALUE ADD: JOHANNESBURGGROSS VALUE ADD: JOHANNESBURGGROSS VALUE ADD: JOHANNESBURGGROSS VALUE ADD: JOHANNESBURG
A. TOTAL PRODUCT AND KEY ECONOMIC SECTORSA. TOTAL PRODUCT AND KEY ECONOMIC SECTORSA. TOTAL PRODUCT AND KEY ECONOMIC SECTORSA. TOTAL PRODUCT AND KEY ECONOMIC SECTORS
GV
A*
in 1
996
GV
A*
in 2
001
2002
GV
A*
2001
/200
2 G
VA
*G
row
th R
ate
% S
hare
of
Tot
alN
atio
nal G
VA
** f
or C
ityor
Sec
tor
(200
2)
Proj
ecte
d G
VA
* in
200
9
R Million R Million R Million % % R Million
TOTAL CITY PRODUCT 79,261 98,875 101,172 2.32% 15.19% 126,214
1 Agriculture, hunting, forestry and fishing 182 189 196 3.78% 0.76% 225
2 Mining and quarrying 407 492 467 -5.06% 1.08% 457
3 Manufacturing 13,558 16,180 16,548 2.27% 12.59% 20,574
4 Electricity, gas and water supply 2,028 2,491 2,497 0.25% 10.52% 3,127
5 Construction 2,744 3,145 3,168 0.73% 17.05% 3,796
6 Wholesale and retail trade 14,953 16,734 16,970 1.41% 20.10% 20,069
7 Transport, storage and communication 8,467 12,489 13,029 4.32% 17.94% 16,536
8 Financial, insurance, real estate & business service 23,609 33,651 34,644 2.95% 26.95% 44,766
9 Community, social and personal services 13,313 13,503 13,653 1.11% 12.03% 16,665
B. MANUFACTURING SUB-SECTORSB. MANUFACTURING SUB-SECTORSB. MANUFACTURING SUB-SECTORSB. MANUFACTURING SUB-SECTORS
GV
A*
in 1
996
2002
GV
A*
Ran
k in
199
6 by
Siz
e
2002
Ran
k by
Siz
e
1996
GV
A*
Gro
wth
Rat
e
2001
/200
2 G
VA
*G
row
th R
ate
1996
Ran
k by
GV
AG
row
th R
ate
2002
Ran
k by
GV
AG
row
th R
ate
RMillion
RMillion
Position Position % % Position Position
MANUFACTURING 13,558 16,548 3 3 -0.87% 2.27% 7 4
30 Food, beverages and tobacco products 1,793 2,004 5 5 -1.09% -4.93% 6 10
31 Textiles, clothing and leather goods 542 550 8 9 -0.10% 4.15% 4 4
32 Wood paper and printing 2,062 2,332 4 4 -0.26% 2.10% 5 6
33 Fuel, petroleum, chemical and rubber products 2,133 2,819 3 2 -2.38% 4.77% 8 2
34 Other non-metallic mineral products 593 651 7 8 -4.84% 1.53% 9 7
35 Metal products, machinery, household appliances 2,467 3,182 1 1 0.63% 5.27% 3 1
36 Electrical machinery and apparatus 533 685 9 7 6.57% 1.34% 1 8
37 Electronic, sound/vision, medical & other appli 414 451 10 10 4.93% 4.64% 2 3
38 Transport equipment 887 1,286 6 6 -6.12% -0.33% 10 9
39 Furniture and other items NEC and recycling 2,135 2,588 2 3 -1.41% 3.17% 7 5
C. SECTOR SHARE OF TOTAL GVA (2002) AND GVA GROWTH VERSUS EMPLOYMENT GROWTH (1996-C. SECTOR SHARE OF TOTAL GVA (2002) AND GVA GROWTH VERSUS EMPLOYMENT GROWTH (1996-C. SECTOR SHARE OF TOTAL GVA (2002) AND GVA GROWTH VERSUS EMPLOYMENT GROWTH (1996-C. SECTOR SHARE OF TOTAL GVA (2002) AND GVA GROWTH VERSUS EMPLOYMENT GROWTH (1996-2001)2001)2001)2001)
7. Transport, storage and
communication13%
3. Manufacturing16%
8. Financial, insurance, real
estate & business service35%
1. Agriculture, hunting, forestry
and fishing0%
9. Community, social and
personal services13%
2. Mining and quarrying
0%
5. Construction3%6. Wholesale and
retail trade18%
4. Electricity, gas and water supply
2%
-60
.00
%
-40
.00
%
-20
.00
%
0.0
0%
20
.00
%
40
.00
%
60
.00
%
80
.00
%
10
0.0
0%
TOTAL CITY
1. Agriculture, hunt ing, forest ry, f ishing
2. Mining and quarrying
3. Manufacturing
4. Electricity, gas and water supply
5. Const ruct ion
6. Wholesale and retail t rade
7. Transport , storage and communicat ion
8. Finance, insurance, real estate, business
9. Community, social & personal services
GVA growth Employment growth

GROSS VALUE ADD: ETHEKWINIGROSS VALUE ADD: ETHEKWINIGROSS VALUE ADD: ETHEKWINIGROSS VALUE ADD: ETHEKWINI
A. TOTAL PRODUCT AND KEY ECONOMIC SECTORSA. TOTAL PRODUCT AND KEY ECONOMIC SECTORSA. TOTAL PRODUCT AND KEY ECONOMIC SECTORSA. TOTAL PRODUCT AND KEY ECONOMIC SECTORS
GV
A*
in 1
996
GV
A*
in 2
001
2002
GV
A*
2001
/200
2 G
VA
*G
row
th R
ate
% S
hare
of
Tot
alN
atio
nal G
VA
** f
or C
ityor
Sec
tor
(200
2)
Proj
ecte
d G
VA
* in
200
9
R Million R Million R Million % % R Million
TOTAL CITY PRODUCT 43,278 48,417 50,562 4.43% 8.30% 60,807
1 Agriculture, hunting, forestry and fishing 695 730 760 4.07% 2.89% 873
2 Mining and quarrying 29 23 20 -13.07% 0.07% 21
3 Manufacturing 13,132 14,118 14,743 4.43% 12.25% 17,660
4 Electricity, gas and water supply 1,267 1,413 1,438 1.76% 6.58% 1,724
5 Construction 1,621 1,612 1,668 3.52% 10.07% 1,889
6 Wholesale and retail trade 6,631 6,988 7,357 5.28% 8.90% 8,489
7 Transport, storage and communication 5,023 6,561 7,014 6.90% 10.67% 8,613
8 Financial, insurance, real estate & business service 6,873 8,852 9,351 5.64% 7.87% 11,523
9 Community, social and personal services 8,007 8,120 8,211 1.11% 7.23% 10,015
B. MANUFACTURING SUB-SECTORSB. MANUFACTURING SUB-SECTORSB. MANUFACTURING SUB-SECTORSB. MANUFACTURING SUB-SECTORS
GV
A*
in 1
996
2002
GV
A*
Ran
k in
199
6 by
Siz
e
2002
Ran
k by
Siz
e
1996
GV
A*
Gro
wth
Rat
e
2001
/200
2 G
VA
*G
row
th R
ate
1996
Ran
k by
GV
AG
row
th R
ate
2002
Ran
k by
GV
AG
row
th R
ate
RMillion
RMillion
Position Position % % Position Position
MANUFACTURING 13,132 14,743 1 1 2.57% 4.43% 4 4
30 Food, beverages and tobacco products 2,393 2,422 1 2 2.67% -2.48% 6 10
31 Textiles, clothing and leather goods 1,638 1,621 3 5 3.90% 7.52% 4 2
32 Wood paper and printing 1,430 1,541 6 7 3.72% 5.15% 5 6
33 Fuel, petroleum, chemical and rubber products 2,262 2,707 2 1 1.43% 7.45% 8 3
34 Other non-metallic mineral products 294 303 9 9 -0.84% 4.34% 9 7
35 Metal products, machinery, household appliances 1,562 1,823 5 4 4.56% 7.97% 3 1
36 Electrical machinery and apparatus 463 530 8 8 10.31% 4.02% 1 8
37 Electronic, sound/vision, medical & other appli 131 126 10 10 8.77% 7.17% 2 4
38 Transport equipment 1,623 2,113 4 3 -2.35% 1.87% 10 9
39 Furniture and other items NEC and recycling 1,336 1,557 7 6 2.53% 6.53% 7 5
C. SECTOR SHARE OF TOTAL GVA (2002) AND GVA GROWTH VERSUS EMPLOYMENT GROWTH (1996-C. SECTOR SHARE OF TOTAL GVA (2002) AND GVA GROWTH VERSUS EMPLOYMENT GROWTH (1996-C. SECTOR SHARE OF TOTAL GVA (2002) AND GVA GROWTH VERSUS EMPLOYMENT GROWTH (1996-C. SECTOR SHARE OF TOTAL GVA (2002) AND GVA GROWTH VERSUS EMPLOYMENT GROWTH (1996-2001)2001)2001)2001)
7. Transport, storage and
communication14%
3. Manufacturing29%
8. Financial, insurance, real
estate & business service18%
1. Agriculture, hunting, forestry
and fishing2%
9. Community, social and
personal services16% 2. Mining and
quarrying0%
5. Construction3%
6. Wholesale and retail trade
15%
4. Electricity, gas and water supply
3%
-60
.00
%
-40
.00
%
-20
.00
%
0.0
0%
20
.00
%
40
.00
%
60
.00
%
80
.00
%
10
0.0
0%
TOTAL CITY
1. Agriculture, hunting, forest ry, f ishing
2. Mining and quarrying
3. Manufacturing
4. Electricity, gas and water supply
5. Const ruct ion
6. Wholesale and retail t rade
7. Transport , storage and communication
8. Finance, insurance, real estate, business
9. Community, social & personal services
GVA growth Employment growth

GROSS VALUE ADD: CAPE TOWNGROSS VALUE ADD: CAPE TOWNGROSS VALUE ADD: CAPE TOWNGROSS VALUE ADD: CAPE TOWN
A. TOTAL PRODUCT AND KEY ECONOMIC SECTORSA. TOTAL PRODUCT AND KEY ECONOMIC SECTORSA. TOTAL PRODUCT AND KEY ECONOMIC SECTORSA. TOTAL PRODUCT AND KEY ECONOMIC SECTORS
GV
A*
in 1
996
GV
A*
in 2
001
2002
GV
A*
2001
/200
2 G
VA
*G
row
th R
ate
% S
hare
of
Tot
alN
atio
nal G
VA
** f
or C
ityor
Sec
tor
(200
2)
Proj
ecte
d G
VA
* in
200
9
R Million R Million R Million % % R Million
TOTAL CITY PRODUCT 71,497 79,868 81,183 1.65% 13.64% 96,763
1 Agriculture, hunting, forestry and fishing 935 971 1,010 4.00% 4.04% 1,160
2 Mining and quarrying 564 574 525 -8.49% 1.21% 537
3 Manufacturing 14,354 14,404 14,633 1.59% 13.39% 17,050
4 Electricity, gas and water supply 1,504 1,465 1,514 3.37% 7.79% 1,744
5 Construction 2,180 2,856 2,827 -1.00% 13.55% 3,544
6 Wholesale and retail trade 11,441 12,769 12,765 -0.03% 15.37% 14,866
7 Transport, storage and communication 7,437 9,879 10,332 4.58% 15.79% 12,441
8 Financial, insurance, real estate & business service 19,787 23,465 23,942 2.03% 22.23% 28,790
9 Community, social and personal services 13,295 13,485 13,634 1.11% 12.01% 16,632
B. MANUFACTURING SUB-SECTORSB. MANUFACTURING SUB-SECTORSB. MANUFACTURING SUB-SECTORSB. MANUFACTURING SUB-SECTORS
GV
A*
in 1
996
2002
GV
A*
Ran
k in
199
6 by
Siz
e
2002
Ran
k by
Siz
e
1996
GV
A*
Gro
wth
Rat
e
2001
/200
2 G
VA
*G
row
th R
ate
1996
Ran
k by
GV
AG
row
th R
ate
2002
Ran
k by
GV
AG
row
th R
ate
RMillion
RMillion
Position Position % % Position Position
MANUFACTURING 14,354 14,633 2 2 5.03% 1.59% 5 5
30 Food, beverages and tobacco products 2,101 1,946 2 5 4.63% -5.77% 7 10
31 Textiles, clothing and leather goods 2,025 1,868 4 6 6.12% 4.06% 4 2
32 Wood paper and printing 2,088 2,128 3 2 5.78% 1.90% 5 6
33 Fuel, petroleum, chemical and rubber products 2,344 2,611 1 1 3.69% 3.63% 8 3
34 Other non-metallic mineral products 572 503 8 8 -0.16% 1.42% 9 7
35 Metal products, machinery, household appliances 1,951 2,044 5 3 6.23% 4.36% 3 1
36 Electrical machinery and apparatus 455 487 9 9 12.99% 0.07% 1 8
37 Electronic, sound/vision, medical & other appli 241 209 10 10 11.03% 2.94% 2 4
38 Transport equipment 660 798 7 7 -0.49% -0.81% 10 9
39 Furniture and other items NEC and recycling 1,917 2,039 6 4 4.73% 2.61% 6 5
C. SECTOR SHARE OF TOTAL GVA (2002) AND GVA GROWTH VERSUS EMPLOYMENT GROWTH (1996-C. SECTOR SHARE OF TOTAL GVA (2002) AND GVA GROWTH VERSUS EMPLOYMENT GROWTH (1996-C. SECTOR SHARE OF TOTAL GVA (2002) AND GVA GROWTH VERSUS EMPLOYMENT GROWTH (1996-C. SECTOR SHARE OF TOTAL GVA (2002) AND GVA GROWTH VERSUS EMPLOYMENT GROWTH (1996-2001)2001)2001)2001)
7. Transport, storage and
communication13%
3. Manufacturing18%
8. Financial, insurance, real
estate & business service29%
1. Agriculture, hunting, forestry
and fishing1%
9. Community, social and
personal services17%
2. Mining and quarrying
1%
5. Construction3%
6. Wholesale and retail trade
16%
4. Electricity, gas and water supply
2%
-60
.00
%
-40
.00
%
-20
.00
%
0.0
0%
20
.00
%
40
.00
%
60
.00
%
80
.00
%
10
0.0
0%
TOTAL CITY
1. Agriculture, hunting, forest ry, f ishing
2. Mining and quarrying
3. Manufacturing
4. Electricity, gas and water supply
5. Const ruct ion
6. Wholesale and retail t rade
7. Transport , storage and communication
8. Finance, insurance, real estate, business
9. Community, social & personal services
GVA growth Employment growth

GROSS VALUE ADD: EKURHULENIGROSS VALUE ADD: EKURHULENIGROSS VALUE ADD: EKURHULENIGROSS VALUE ADD: EKURHULENI
A. TOTAL PRODUCT AND KEY ECONOMIC SECTORSA. TOTAL PRODUCT AND KEY ECONOMIC SECTORSA. TOTAL PRODUCT AND KEY ECONOMIC SECTORSA. TOTAL PRODUCT AND KEY ECONOMIC SECTORS
GV
A*
in 1
996
GV
A*
in 2
001
2002
GV
A*
2001
/200
2 G
VA
*G
row
th R
ate
% S
hare
of
Tot
alN
atio
nal G
VA
** f
or C
ityor
Sec
tor
(200
2)
Proj
ecte
d G
VA
* in
200
9
R Million R Million R Million % % R Million
TOTAL CITY PRODUCT 41,759 43,187 44,459 2.94% 7.98% 51,355
1 Agriculture, hunting, forestry and fishing 254 266 277 4.07% 1.06% 318
2 Mining and quarrying 816 673 781 15.94% 2.38% 726
3 Manufacturing 12,683 12,408 12,819 3.31% 11.72% 14,537
4 Electricity, gas and water supply 939 1,015 1,025 0.98% 4.87% 1,216
5 Construction 1,588 1,452 1,470 1.22% 9.87% 1,601
6 Wholesale and retail trade 6,300 5,855 5,978 2.10% 8.46% 6,529
7 Transport, storage and communication 5,250 6,604 6,829 3.40% 10.91% 8,089
8 Financial, insurance, real estate & business service 8,086 8,988 9,289 3.35% 9.41% 11,022
9 Community, social and personal services 5,842 5,925 5,991 1.11% 5.28% 7,316
B. MANUFACTURING SUB-SECTORSB. MANUFACTURING SUB-SECTORSB. MANUFACTURING SUB-SECTORSB. MANUFACTURING SUB-SECTORS
GV
A*
in 1
996
2002
GV
A*
Ran
k in
199
6 by
Siz
e
2002
Ran
k by
Siz
e
1996
GV
A*
Gro
wth
Rat
e
2001
/200
2 G
VA
*G
row
th R
ate
1996
Ran
k by
GV
AG
row
th R
ate
2002
Ran
k by
GV
AG
row
th R
ate
RMillion
RMillion
Position Position % % Position Position
MANUFACTURING 12,683 12,819 1 1 1.85% 3.31% 3 5
30 Food, beverages and tobacco products 1,482 1,340 3 3 2.00% -4.85% 6 10
31 Textiles, clothing and leather goods 141 125 10 9 2.07% 6.20% 5 1
32 Wood paper and printing 932 886 5 6 2.33% 4.02% 4 5
33 Fuel, petroleum, chemical and rubber products 2,370 2,586 2 2 1.22% 4.72% 8 4
34 Other non-metallic mineral products 797 726 7 7 -2.22% 2.98% 9 7
35 Metal products, machinery, household appliances 4,316 4,384 1 1 3.11% 5.86% 3 2
36 Electrical machinery and apparatus 424 415 8 8 8.98% 1.27% 1 8
37 Electronic, sound/vision, medical & other appli 147 124 9 10 7.88% 4.89% 2 3
38 Transport equipment 859 1,012 6 5 -3.66% 0.29% 10 9
39 Furniture and other items NEC and recycling 1,213 1,221 4 4 1.37% 3.74% 7 6
C. SECTOR SHARE OF TOTAL GVA (2002) AND GVA GROWTH VERSUS EMPLOYMENT GROWTH (1996-C. SECTOR SHARE OF TOTAL GVA (2002) AND GVA GROWTH VERSUS EMPLOYMENT GROWTH (1996-C. SECTOR SHARE OF TOTAL GVA (2002) AND GVA GROWTH VERSUS EMPLOYMENT GROWTH (1996-C. SECTOR SHARE OF TOTAL GVA (2002) AND GVA GROWTH VERSUS EMPLOYMENT GROWTH (1996-2001)2001)2001)2001)
7. Transport, storage and
communication15%
3. Manufacturing30%
8. Financial, insurance, real
estate & business service21%
1. Agriculture, hunting, forestry
and fishing1%
9. Community, social and
personal services13% 2. Mining and
quarrying2%
5. Construction3%
6. Wholesale and retail trade
13%
4. Electricity, gas and water supply
2%
-60
.00
%
-40
.00
%
-20
.00
%
0.0
0%
20
.00
%
40
.00
%
60
.00
%
80
.00
%
10
0.0
0%
TOTAL CITY
1. Agriculture, hunting, forest ry, f ishing
2. Mining and quarrying
3. Manufacturing
4. Electricity, gas and water supply
5. Const ruct ion
6. Wholesale and retail t rade
7. Transport , storage and communication
8. Finance, insurance, real estate, business
9. Community, social & personal services
GVA growth Employment growth
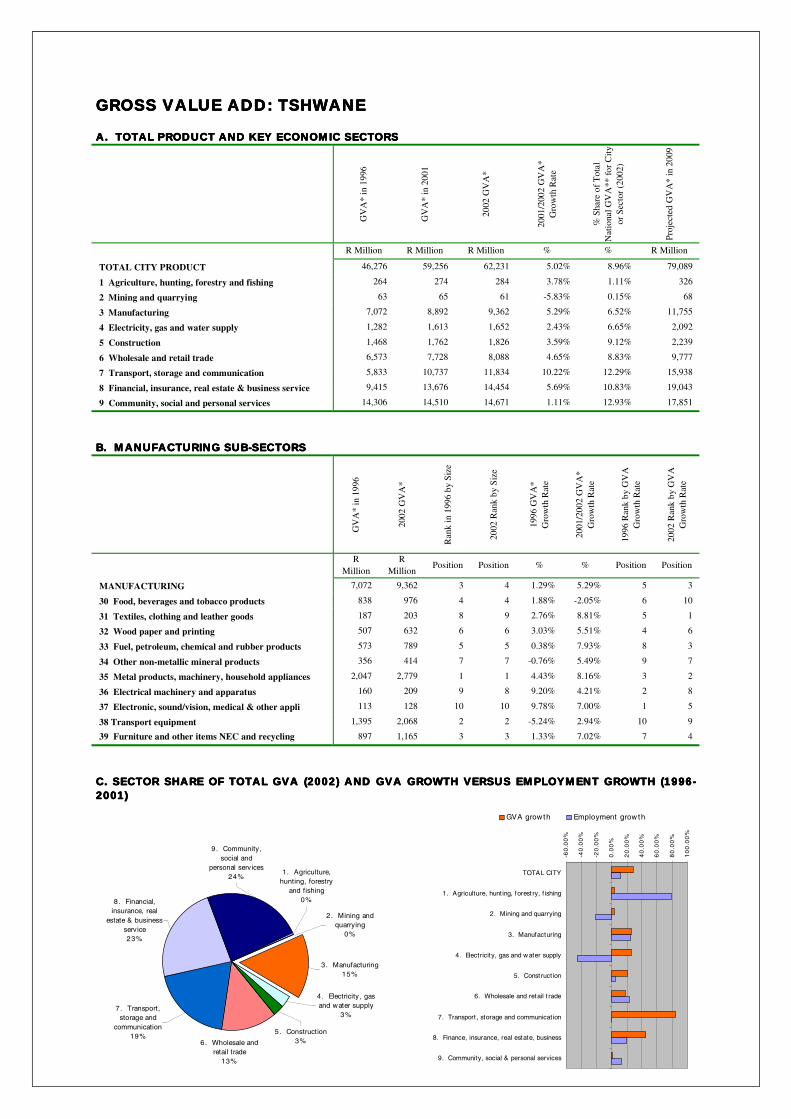
GROSS VALUE ADD: TSHWANEGROSS VALUE ADD: TSHWANEGROSS VALUE ADD: TSHWANEGROSS VALUE ADD: TSHWANE
A. TOTAL PRODUCT AND KEY ECONOMIC SECTORSA. TOTAL PRODUCT AND KEY ECONOMIC SECTORSA. TOTAL PRODUCT AND KEY ECONOMIC SECTORSA. TOTAL PRODUCT AND KEY ECONOMIC SECTORS
GV
A*
in 1
996
GV
A*
in 2
001
2002
GV
A*
2001
/200
2 G
VA
*G
row
th R
ate
% S
hare
of
Tot
alN
atio
nal G
VA
** f
or C
ityor
Sec
tor
(200
2)
Proj
ecte
d G
VA
* in
200
9
R Million R Million R Million % % R Million
TOTAL CITY PRODUCT 46,276 59,256 62,231 5.02% 8.96% 79,089
1 Agriculture, hunting, forestry and fishing 264 274 284 3.78% 1.11% 326
2 Mining and quarrying 63 65 61 -5.83% 0.15% 68
3 Manufacturing 7,072 8,892 9,362 5.29% 6.52% 11,755
4 Electricity, gas and water supply 1,282 1,613 1,652 2.43% 6.65% 2,092
5 Construction 1,468 1,762 1,826 3.59% 9.12% 2,239
6 Wholesale and retail trade 6,573 7,728 8,088 4.65% 8.83% 9,777
7 Transport, storage and communication 5,833 10,737 11,834 10.22% 12.29% 15,938
8 Financial, insurance, real estate & business service 9,415 13,676 14,454 5.69% 10.83% 19,043
9 Community, social and personal services 14,306 14,510 14,671 1.11% 12.93% 17,851
B. MANUFACTURING SUB-SECTORSB. MANUFACTURING SUB-SECTORSB. MANUFACTURING SUB-SECTORSB. MANUFACTURING SUB-SECTORS
GV
A*
in 1
996
2002
GV
A*
Ran
k in
199
6 by
Siz
e
2002
Ran
k by
Siz
e
1996
GV
A*
Gro
wth
Rat
e
2001
/200
2 G
VA
*G
row
th R
ate
1996
Ran
k by
GV
AG
row
th R
ate
2002
Ran
k by
GV
AG
row
th R
ate
RMillion
RMillion
Position Position % % Position Position
MANUFACTURING 7,072 9,362 3 4 1.29% 5.29% 5 3
30 Food, beverages and tobacco products 838 976 4 4 1.88% -2.05% 6 10
31 Textiles, clothing and leather goods 187 203 8 9 2.76% 8.81% 5 1
32 Wood paper and printing 507 632 6 6 3.03% 5.51% 4 6
33 Fuel, petroleum, chemical and rubber products 573 789 5 5 0.38% 7.93% 8 3
34 Other non-metallic mineral products 356 414 7 7 -0.76% 5.49% 9 7
35 Metal products, machinery, household appliances 2,047 2,779 1 1 4.43% 8.16% 3 2
36 Electrical machinery and apparatus 160 209 9 8 9.20% 4.21% 2 8
37 Electronic, sound/vision, medical & other appli 113 128 10 10 9.78% 7.00% 1 5
38 Transport equipment 1,395 2,068 2 2 -5.24% 2.94% 10 9
39 Furniture and other items NEC and recycling 897 1,165 3 3 1.33% 7.02% 7 4
C. SECTOR SHARE OF TOTAL GVA (2002) AND GVA GROWTH VERSUS EMPLOYMENT GROWTH (1996-C. SECTOR SHARE OF TOTAL GVA (2002) AND GVA GROWTH VERSUS EMPLOYMENT GROWTH (1996-C. SECTOR SHARE OF TOTAL GVA (2002) AND GVA GROWTH VERSUS EMPLOYMENT GROWTH (1996-C. SECTOR SHARE OF TOTAL GVA (2002) AND GVA GROWTH VERSUS EMPLOYMENT GROWTH (1996-2001)2001)2001)2001)
7. Transport, storage and
communication19%
3. Manufacturing15%
8. Financial, insurance, real
estate & business service23%
1. Agriculture, hunting, forestry
and fishing0%
9. Community, social and
personal services24%
2. Mining and quarrying
0%
5. Construction3%6. Wholesale and
retail trade13%
4. Electricity, gas and water supply
3%
-60
.00
%
-40
.00
%
-20
.00
%
0.0
0%
20
.00
%
40
.00
%
60
.00
%
80
.00
%
10
0.0
0%
TOTAL CITY
1. Agriculture, hunting, forest ry, f ishing
2. Mining and quarrying
3. Manufacturing
4. Electricity, gas and water supply
5. Const ruct ion
6. Wholesale and retail t rade
7. Transport , storage and communication
8. Finance, insurance, real estate, business
9. Community, social & personal services
GVA growth Employment growth

GROSS VALUE ADD: NELSON MANDELAGROSS VALUE ADD: NELSON MANDELAGROSS VALUE ADD: NELSON MANDELAGROSS VALUE ADD: NELSON MANDELA
A. TOTAL PRODUCT AND KEY ECONOMIC SECTORSA. TOTAL PRODUCT AND KEY ECONOMIC SECTORSA. TOTAL PRODUCT AND KEY ECONOMIC SECTORSA. TOTAL PRODUCT AND KEY ECONOMIC SECTORS
GV
A*
in 1
996
GV
A*
in 2
001
2002
GV
A*
2001
/200
2 G
VA
*G
row
th R
ate
% S
hare
of
Tot
alN
atio
nal G
VA
** f
or C
ityor
Sec
tor
(200
2)
Proj
ecte
d G
VA
* in
200
9
R Million R Million R Million % % R Million
TOTAL CITY PRODUCT 14,566 17,665 18,052 2.19% 2.80% 22,098
1 Agriculture, hunting, forestry and fishing 121 126 130 3.94% 0.52% 150
2 Mining and quarrying 9 10 9 -16.20% 0.02% 9
3 Manufacturing 4,870 5,817 5,894 1.32% 4.53% 7,160
4 Electricity, gas and water supply 289 356 353 -0.82% 1.50% 438
5 Construction 402 491 492 0.24% 2.50% 598
6 Wholesale and retail trade 1,958 2,275 2,348 3.20% 2.63% 2,814
7 Transport, storage and communication 1,459 2,247 2,371 5.52% 3.09% 2,995
8 Financial, insurance, real estate & business service 1,853 2,688 2,759 2.64% 2.10% 3,432
9 Community, social and personal services 3,604 3,655 3,696 1.11% 3.26% 4,503
B. MANUFACTURING SUB-SECTORSB. MANUFACTURING SUB-SECTORSB. MANUFACTURING SUB-SECTORSB. MANUFACTURING SUB-SECTORS
GV
A*
in 1
996
2002
GV
A*
Ran
k in
199
6 by
Siz
e
2002
Ran
k by
Siz
e
1996
GV
A*
Gro
wth
Rat
e
2001
/200
2 G
VA
*G
row
th R
ate
1996
Ran
k by
GV
AG
row
th R
ate
2002
Ran
k by
GV
AG
row
th R
ate
RMillion
RMillion
Position Position % % Position Position
MANUFACTURING 4,870 5,894 1 1 2.07% 1.32% 4 5
30 Food, beverages and tobacco products 461 483 3 3 3.84% -5.32% 6 10
31 Textiles, clothing and leather goods 283 288 6 7 5.05% 4.36% 5 3
32 Wood paper and printing 200 224 8 8 5.15% 2.00% 4 6
33 Fuel, petroleum, chemical and rubber products 1,029 1,265 2 2 2.37% 4.45% 8 2
34 Other non-metallic mineral products 176 189 9 9 0.36% 1.36% 9 7
35 Metal products, machinery, household appliances 375 451 4 4 5.66% 4.84% 3 1
36 Electrical machinery and apparatus 277 326 7 6 11.80% 0.73% 1 8
37 Electronic, sound/vision, medical & other appli 40 40 10 10 10.36% 3.78% 2 4
38 Transport equipment 1,678 2,211 1 1 -2.26% -0.27% 10 9
39 Furniture and other items NEC and recycling 350 415 5 5 3.76% 3.14% 7 5
C. SECTOR SHARE OF TOTAL GVA (2002) AND GVA GROWTH VERSUS EMPLOYMENT GROWTH (1996-C. SECTOR SHARE OF TOTAL GVA (2002) AND GVA GROWTH VERSUS EMPLOYMENT GROWTH (1996-C. SECTOR SHARE OF TOTAL GVA (2002) AND GVA GROWTH VERSUS EMPLOYMENT GROWTH (1996-C. SECTOR SHARE OF TOTAL GVA (2002) AND GVA GROWTH VERSUS EMPLOYMENT GROWTH (1996-2001)2001)2001)2001)
7. Transport, storage and
communication13%
3. Manufacturing33%
8. Financial, insurance, real
estate & business service15%
1. Agriculture, hunting, forestry
and fishing1%
9. Community, social and
personal services20% 2. Mining and
quarrying0%
5. Construction3%
6. Wholesale and retail trade
13%4. Electricity, gas and water supply
2%
-80
.00
%
-60
.00
%
-40
.00
%
-20
.00
%
0.0
0%
20
.00
%
40
.00
%
60
.00
%
80
.00
%
10
0.0
0%
TOTAL CITY
1. Agriculture, hunting, forest ry, f ishing
2. Mining and quarrying
3. Manufacturing
4. Electricity, gas and water supply
5. Const ruct ion
6. Wholesale and retail t rade
7. Transport , storage and communication
8. Finance, insurance, real estate, business
9. Community, social & personal services
GVA growth Employment growth

GROSS VALUE ADD: BUFFALO CITYGROSS VALUE ADD: BUFFALO CITYGROSS VALUE ADD: BUFFALO CITYGROSS VALUE ADD: BUFFALO CITY
A. TOTAL PRODUCT AND KEY ECONOMIC SECTORSA. TOTAL PRODUCT AND KEY ECONOMIC SECTORSA. TOTAL PRODUCT AND KEY ECONOMIC SECTORSA. TOTAL PRODUCT AND KEY ECONOMIC SECTORS
GV
A*
in 1
996
GV
A*
in 2
001
2002
GV
A*
2001
/200
2 G
VA
*G
row
th R
ate
% S
hare
of
Tot
alN
atio
nal G
VA
** f
or C
ityor
Sec
tor
(200
2)
Proj
ecte
d G
VA
* in
200
9
R Million R Million R Million % % R Million
TOTAL CITY PRODUCT 7,595 7,809 7,725 -1.07% 1.47% 8,836
1 Agriculture, hunting, forestry and fishing 119 125 130 4.12% 0.49% 150
2 Mining and quarrying 2 3 3 -9.67% 0.01% 3
3 Manufacturing 1,854 1,742 1,681 -3.46% 1.73% 1,857
4 Electricity, gas and water supply 126 121 114 -6.23% 0.65% 125
5 Construction 276 272 260 -4.29% 1.71% 285
6 Wholesale and retail trade 1,189 1,132 1,124 -0.76% 1.60% 1,226
7 Transport, storage and communication 580 682 680 -0.33% 1.23% 763
8 Financial, insurance, real estate & business service 1,148 1,397 1,373 -1.74% 1.30% 1,551
9 Community, social and personal services 2,301 2,334 2,360 1.11% 2.08% 2,875
B. MANUFACTURING SUB-SECTORSB. MANUFACTURING SUB-SECTORSB. MANUFACTURING SUB-SECTORSB. MANUFACTURING SUB-SECTORS
GV
A*
in 1
996
2002
GV
A*
Ran
k in
199
6 by
Siz
e
2002
Ran
k by
Siz
e
1996
GV
A*
Gro
wth
Rat
e
2001
/200
2 G
VA
*G
row
th R
ate
1996
Ran
k by
GV
AG
row
th R
ate
2002
Ran
k by
GV
AG
row
th R
ate
RMillion
RMillion
Position Position % % Position Position
MANUFACTURING 1,854 1,681 2 2 3.36% -3.46% 5 6
30 Food, beverages and tobacco products 367 292 2 2 3.80% -9.83% 7 10
31 Textiles, clothing and leather goods 294 255 3 3 5.20% 1.32% 4 2
32 Wood paper and printing 100 85 7 7 4.90% -2.69% 5 7
33 Fuel, petroleum, chemical and rubber products 170 159 6 6 2.58% -0.73% 8 3
34 Other non-metallic mineral products 50 43 9 9 0.27% -2.60% 9 6
35 Metal products, machinery, household appliances 213 213 4 4 5.87% 1.34% 3 1
36 Electrical machinery and apparatus 61 55 8 8 11.68% -3.89% 1 8
37 Electronic, sound/vision, medical & other appli 27 20 10 10 10.05% -1.15% 2 4
38 Transport equipment 391 398 1 1 -1.42% -5.69% 10 9
39 Furniture and other items NEC and recycling 182 162 5 5 3.82% -2.09% 6 5
C. SECTOR SHARE OF TOTAL GVA (2002) AND GVA GROWTH VERSUS EMPLOYMENT GROWTH (1996-C. SECTOR SHARE OF TOTAL GVA (2002) AND GVA GROWTH VERSUS EMPLOYMENT GROWTH (1996-C. SECTOR SHARE OF TOTAL GVA (2002) AND GVA GROWTH VERSUS EMPLOYMENT GROWTH (1996-C. SECTOR SHARE OF TOTAL GVA (2002) AND GVA GROWTH VERSUS EMPLOYMENT GROWTH (1996-2001)2001)2001)2001)
7. Transport, storage and
communication9%
3. Manufacturing22%
8. Financial, insurance, real
estate & business service18%
1. Agriculture, hunting, forestry
and fishing2%
9. Community, social and
personal services30%
2. Mining and quarrying
0%
5. Construction3%
6. Wholesale and retail trade
15%
4. Electricity, gas and water supply
1%
-10
0.0
0%
-80
.00
%
-60
.00
%
-40
.00
%
-20
.00
%
0.0
0%
20
.00
%
40
.00
%
60
.00
%
80
.00
%
10
0.0
0%
TOTAL CITY
1. Agriculture, hunting, forest ry, f ishing
2. Mining and quarrying
3. Manufacturing
4. Electricity, gas and water supply
5. Const ruct ion
6. Wholesale and retail t rade
7. Transport , storage and communication
8. Finance, insurance, real estate, business
9. Community, social & personal services
GVA growth Employment growth

GROSS VALUE ADD: MANGAUNGGROSS VALUE ADD: MANGAUNGGROSS VALUE ADD: MANGAUNGGROSS VALUE ADD: MANGAUNG
A. TOTAL PRODUCT AND KEY ECONOMIC SECTORSA. TOTAL PRODUCT AND KEY ECONOMIC SECTORSA. TOTAL PRODUCT AND KEY ECONOMIC SECTORSA. TOTAL PRODUCT AND KEY ECONOMIC SECTORS
GV
A*
in 1
996
GV
A*
in 2
001
2002
GV
A*
2001
/200
2 G
VA
*G
row
th R
ate
% S
hare
of
Tot
alN
atio
nal G
VA
** f
or C
ityor
Sec
tor
(200
2)
Proj
ecte
d G
VA
* in
200
9
R Million R Million R Million % % R Million
TOTAL CITY PRODUCT 8,314 8,760 8,805 0.51% 1.60% 10,174
1 Agriculture, hunting, forestry and fishing 353 374 390 4.28% 1.45% 447
2 Mining and quarrying 37 46 42 -7.85% 0.08% 44
3 Manufacturing 724 691 672 -2.76% 0.67% 748
4 Electricity, gas and water supply 306 305 290 -4.95% 1.59% 325
5 Construction 267 210 203 -3.31% 1.66% 204
6 Wholesale and retail trade 1,462 1,385 1,428 3.06% 1.96% 1,567
7 Transport, storage and communication 952 1,201 1,215 1.16% 2.02% 1,398
8 Financial, insurance, real estate & business service 1,302 1,596 1,580 -0.96% 1.47% 1,804
9 Community, social and personal services 2,911 2,952 2,985 1.11% 2.63% 3,637
B. MANUFACTURING SUB-SECTORSB. MANUFACTURING SUB-SECTORSB. MANUFACTURING SUB-SECTORSB. MANUFACTURING SUB-SECTORS
GV
A*
in 1
996
2002
GV
A*
Ran
k in
199
6 by
Siz
e
2002
Ran
k by
Siz
e
1996
GV
A*
Gro
wth
Rat
e
2001
/200
2 G
VA
*G
row
th R
ate
1996
Ran
k by
GV
AG
row
th R
ate
2002
Ran
k by
GV
AG
row
th R
ate
RMillion
RMillion
Position Position % % Position Position
MANUFACTURING 724 672 5 5 3.21% -2.76% 5 6
30 Food, beverages and tobacco products 195 165 1 1 2.67% -8.61% 7 10
31 Textiles, clothing and leather goods 67 56 4 6 4.89% 1.92% 3 1
32 Wood paper and printing 56 50 6 8 3.89% -1.22% 5 6
33 Fuel, petroleum, chemical and rubber products 71 71 3 3 1.50% 0.75% 8 3
34 Other non-metallic mineral products 16 14 9 9 -0.86% -2.19% 9 7
35 Metal products, machinery, household appliances 60 59 5 5 4.78% 1.30% 4 2
36 Electrical machinery and apparatus 53 50 8 7 10.44% -2.78% 1 8
37 Electronic, sound/vision, medical & other appli 7 6 10 10 8.80% 0.15% 2 4
38 Transport equipment 55 61 7 4 -2.56% -4.31% 10 9
39 Furniture and other items NEC and recycling 145 140 2 2 2.80% -0.57% 6 5
C. SECTOR SHARE OF TOTAL GVA (2002) AND GVA GROWTH VERSUS EMPLOYMENT GROWTH (1996-C. SECTOR SHARE OF TOTAL GVA (2002) AND GVA GROWTH VERSUS EMPLOYMENT GROWTH (1996-C. SECTOR SHARE OF TOTAL GVA (2002) AND GVA GROWTH VERSUS EMPLOYMENT GROWTH (1996-C. SECTOR SHARE OF TOTAL GVA (2002) AND GVA GROWTH VERSUS EMPLOYMENT GROWTH (1996-2001)2001)2001)2001)
7. Transport, storage and
communication14%
3. Manufacturing8%
8. Financial, insurance, real
estate & business service18%
1. Agriculture, hunting, forestry
and fishing4%
9. Community, social and
personal services35%
2. Mining and quarrying
0%
5. Construction2%
6. Wholesale and retail trade
16%
4. Electricity, gas and water supply
3%
-80
.00
%
-60
.00
%
-40
.00
%
-20
.00
%
0.0
0%
20
.00
%
40
.00
%
60
.00
%
80
.00
%
10
0.0
0%
TOTAL CITY
1. Agriculture, hunting, forest ry, f ishing
2. Mining and quarrying
3. Manufacturing
4. Electricity, gas and water supply
5. Const ruct ion
6. Wholesale and retail t rade
7. Transport , storage and communication
8. Finance, insurance, real estate, business
9. Community, social & personal services
GVA growth Employment growth

GROSS VALUE ADD: MSUNDUZIGROSS VALUE ADD: MSUNDUZIGROSS VALUE ADD: MSUNDUZIGROSS VALUE ADD: MSUNDUZI
A. TOTAL PRODUCT AND KEY ECONOMIC SECTORSA. TOTAL PRODUCT AND KEY ECONOMIC SECTORSA. TOTAL PRODUCT AND KEY ECONOMIC SECTORSA. TOTAL PRODUCT AND KEY ECONOMIC SECTORS
GV
A*
in 1
996
GV
A*
in 2
001
2002
GV
A*
2001
/200
2 G
VA
*G
row
th R
ate
% S
hare
of
Tot
alN
atio
nal G
VA
** f
or C
ityor
Sec
tor
(200
2)
Proj
ecte
d G
VA
* in
200
9
R Million R Million R Million % % R Million
TOTAL CITY PRODUCT 4,955 4,900 5,050 3.07% 0.95% 5,805
1 Agriculture, hunting, forestry and fishing 156 158 163 3.22% 0.67% 188
2 Mining and quarrying 12 9 7 -16.18% 0.03% 8
3 Manufacturing 1,028 918 946 3.09% 0.96% 1,052
4 Electricity, gas and water supply 180 180 181 1.00% 0.93% 208
5 Construction 183 153 156 1.85% 1.14% 164
6 Wholesale and retail trade 629 558 579 3.76% 0.84% 619
7 Transport, storage and communication 538 645 687 6.56% 1.14% 790
8 Financial, insurance, real estate & business service 774 803 837 4.24% 0.88% 958
9 Community, social and personal services 1,455 1,476 1,492 1.11% 1.31% 1,818
B. MANUFACTURING SUB-SECTORSB. MANUFACTURING SUB-SECTORSB. MANUFACTURING SUB-SECTORSB. MANUFACTURING SUB-SECTORS
GV
A*
in 1
996
2002
GV
A*
Ran
k in
199
6 by
Siz
e
2002
Ran
k by
Siz
e
1996
GV
A*
Gro
wth
Rat
e
2001
/200
2 G
VA
*G
row
th R
ate
1996
Ran
k by
GV
AG
row
th R
ate
2002
Ran
k by
GV
AG
row
th R
ate
RMillion
RMillion
Position Position % % Position Position
MANUFACTURING 1,028 946 2 2 0.18% 3.09% 6 5
30 Food, beverages and tobacco products 219 185 1 2 -0.47% -3.80% 7 10
31 Textiles, clothing and leather goods 127 105 5 5 0.73% 6.01% 4 2
32 Wood paper and printing 137 123 3 4 0.56% 3.76% 5 6
33 Fuel, petroleum, chemical and rubber products 129 129 4 3 -1.64% 5.99% 8 3
34 Other non-metallic mineral products 19 17 9 9 -3.91% 3.04% 9 7
35 Metal products, machinery, household appliances 197 192 2 1 1.41% 6.45% 3 1
36 Electrical machinery and apparatus 56 54 7 7 7.08% 2.38% 1 8
37 Electronic, sound/vision, medical & other appli 4 3 10 10 5.53% 5.58% 2 4
38 Transport equipment 46 50 8 8 -5.46% 0.83% 10 9
39 Furniture and other items NEC and recycling 93 89 6 6 -0.45% 4.74% 6 5
C. SECTOR SHARE OF TOTAL GVA (2002) AND GVA GROWTH VERSUS EMPLOYMENT GROWTH (1996-C. SECTOR SHARE OF TOTAL GVA (2002) AND GVA GROWTH VERSUS EMPLOYMENT GROWTH (1996-C. SECTOR SHARE OF TOTAL GVA (2002) AND GVA GROWTH VERSUS EMPLOYMENT GROWTH (1996-C. SECTOR SHARE OF TOTAL GVA (2002) AND GVA GROWTH VERSUS EMPLOYMENT GROWTH (1996-2001)2001)2001)2001)
7. Transport, storage and
communication14%
3. Manufacturing19%
8. Financial, insurance, real
estate & business service17%
1. Agriculture, hunting, forestry
and fishing3%
9. Community, social and
personal services29%
2. Mining and quarrying
0%
5. Construction3%
6. Wholesale and retail trade
11%
4. Electricity, gas and water supply
4%
-60
.00
%
-40
.00
%
-20
.00
%
0.0
0%
20
.00
%
40
.00
%
60
.00
%
80
.00
%
10
0.0
0%
TOTAL CITY
1. Agriculture, hunting, forest ry, f ishing
2. Mining and quarrying
3. Manufacturing
4. Electricity, gas and water supply
5. Const ruct ion
6. Wholesale and retail t rade
7. Transport , storage and communication
8. Finance, insurance, real estate, business
9. Community, social & personal services
GVA growth Employment growth