Chapter 9 – Lecture 1 The limits of correlational research and the logic of experimentation.
33
Chapter 9 – Lecture 1 The limits of correlational research and the logic of experimentation.
-
date post
21-Dec-2015 -
Category
Documents
-
view
224 -
download
3
Transcript of Chapter 9 – Lecture 1 The limits of correlational research and the logic of experimentation.

Chapter 9 – Lecture 1
The limits of correlational research and the logic of experimentation.
Concepts
• The limits of correlation
• The experimental method
• Comparing Mean Squares between groups to Mean Squares within groups
The limits of correlational research• Correlational research tells us that variables
are related.
• It does not tell us what causes that relationship.
• The relationship could be caused by some other, unstudied variable.
The “3rd” variable problem.• In correlational research we started with participants
who were different from each other in at least 2 ways.
• Participants who differ in 2 ways will differ in 3 ways, in 3000 ways, in an almost infinite number of ways and combinations of ways.
• Any of these other ways in which participants differ from each other may be responsible for the relationship between X and Y you find in a correlational study
So
• There are an infinite number of such unstudied “3rd” variables and combinations of variables
• So even though you can predict one thing from another, you don’t know what causes either or what to change to get either X or Y to change
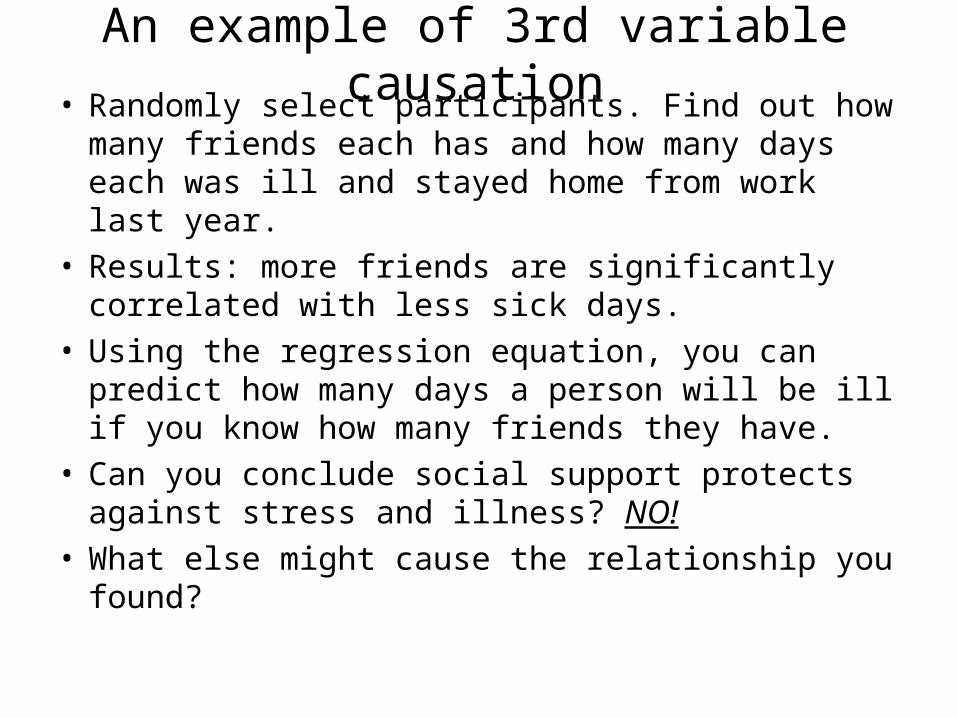
An example of 3rd variable causation• Randomly select participants. Find out how many
friends each has and how many days each was ill and stayed home from work last year.
• Results: more friends are significantly correlated with less sick days.
• Using the regression equation, you can predict how many days a person will be ill if you know how many friends they have.
• Can you conclude social support protects against stress and illness? NO!
• What else might cause the relationship you found?
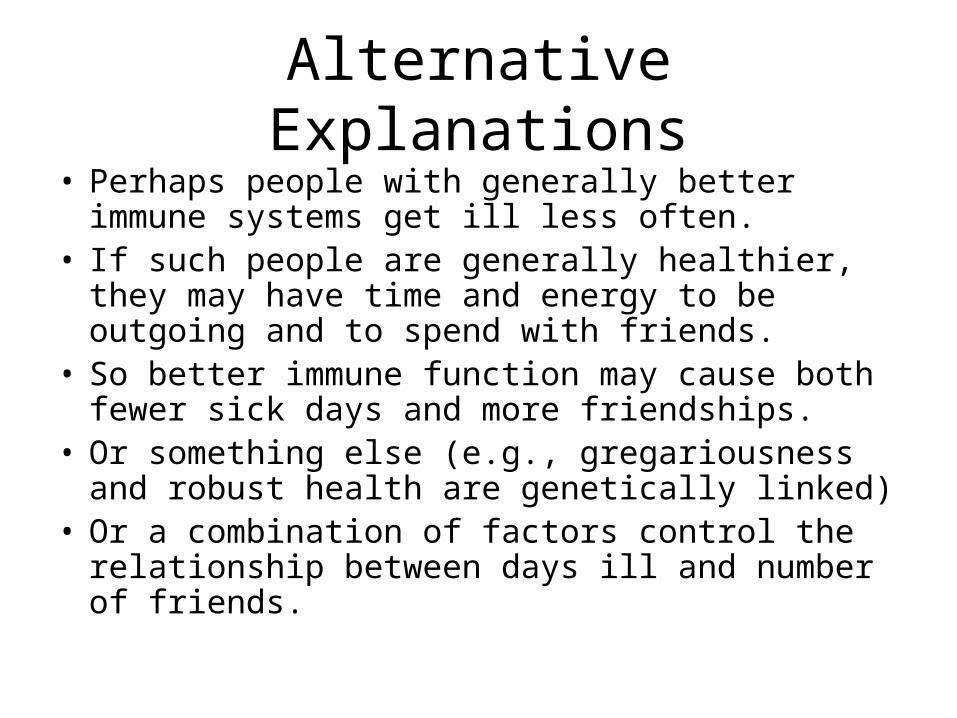
Alternative Explanations• Perhaps people with generally better immune
systems get ill less often.• If such people are generally healthier, they may have
time and energy to be outgoing and to spend with friends.
• So better immune function may cause both fewer sick days and more friendships.
• Or something else (e.g., gregariousness and robust health are genetically linked)
• Or a combination of factors control the relationship between days ill and number of friends.
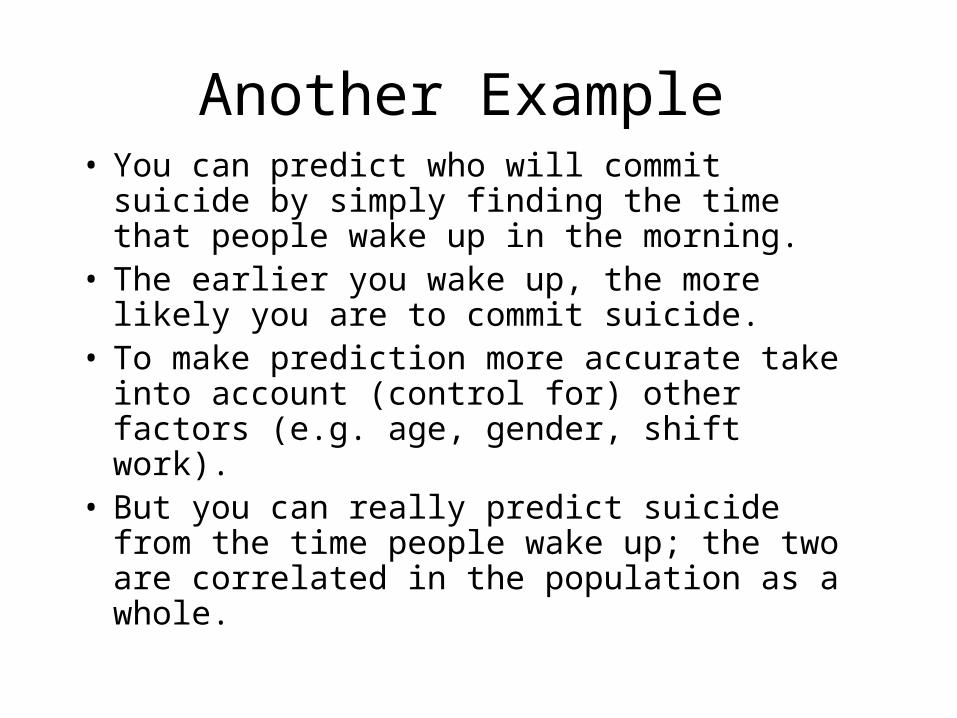
Another Example • You can predict who will commit suicide by
simply finding the time that people wake up in the morning.
• The earlier you wake up, the more likely you are to commit suicide.
• To make prediction more accurate take into account (control for) other factors (e.g. age, gender, shift work).
• But you can really predict suicide from the time people wake up; the two are correlated in the population as a whole.
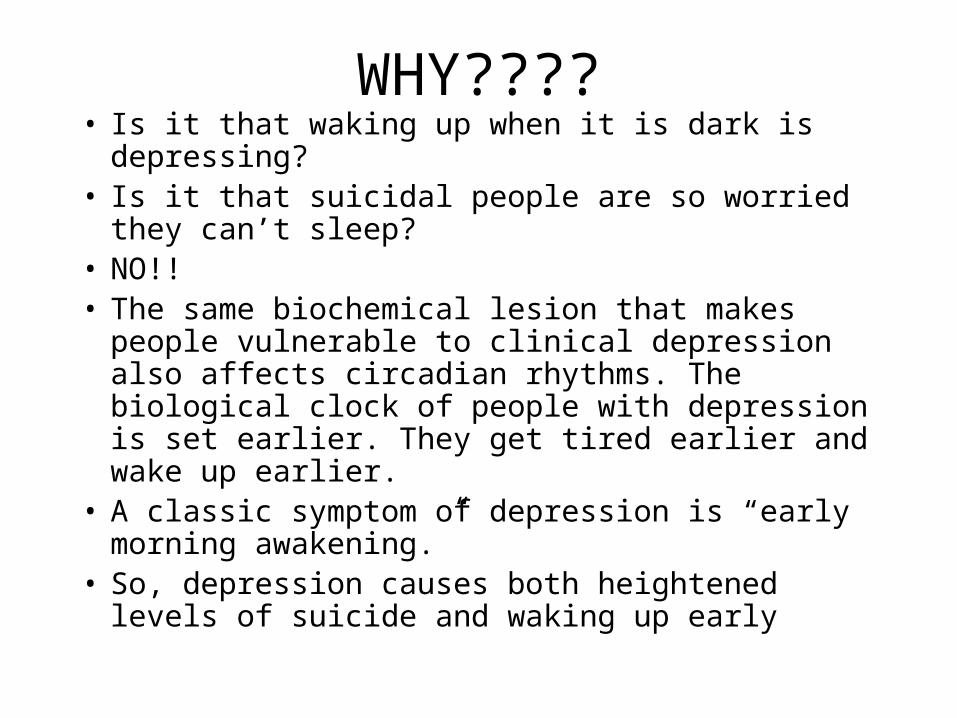
WHY????• Is it that waking up when it is dark is depressing?• Is it that suicidal people are so worried they can’t
sleep?• NO!!• The same biochemical lesion that makes people
vulnerable to clinical depression also affects circadian rhythms. The biological clock of people with depression is set earlier. They get tired earlier and wake up earlier.
• A classic symptom of depression is “early morning awakening.”
• So, depression causes both heightened levels of suicide and waking up early
You can write “prescriptions” for change only if you know causes
• If waking up early directly causes suicide, you should give people sleeping pills.
• Give depressed people sleeping pills and you get more suicide, not less.
• Instead you must treat the cause, depression, with psychotherapy and/or antidepressant medication
If you want to change things, you need experiments
• The lesson is that correlational research can never tell you how to cause a change in Y.
• Experimental research can isolate causal factors.
• Then, you can change things by altering what causes them.
• Like curing depression gets rid of both the desire to commit suicide and waking early.
Remember, there is no way to know what causes what on the basis of correlational studies.
Only experimentation can provide causal information.
SO WE NEED EXPERIMENTAL
RESEARCH IF WE ARE TO HELP PEOPLE KNOW HOW TO
CHANGE THINGS

How and why experiments can find causal relationships
The Key: Start with groups that are the same, not different
• In an experiment, you start off with a random sample of participants drawn from the population of interest.
• Then you randomly assign participants to experimental groups.
• Each experimental group is therefore a random sample of the population.
Since each group is a random sample of the same population:
• The typical score in each group, the group mean, will be similar to the population mean.
• The spread of scores around the group mean will be similar to the spread of scores around the population mean.
• So, the mean and variance of each group is similar to that of the population.
• Things that are similar to a third thing (mu and sigma) are similar to each other.
• That is, the average score and spread of scores will be similar in all the groups.

ON WHAT MEASURE(S) ARE THE GROUPS THE SAME??
ON EVERY POSSIBLE MEASURE!!!
Hairs on heads, size of great aunt’s backyard, your self-confidence multiplied
by your grandmother’s self confidence, the size of your mother’s left thumb, how
nice your third grade teacher was
ETCETERA, ETCETERA, ETCETERA.
If the groups are similar in every way, no pre-existing differences can account for
differences after the experimental treatments.
• That is: the groups all start off the same in every way.
• The ways the groups are the same include all the preexisting differences (and combination of differences) that underlie the 3rd variable explanation in correlational research.

Since the groups all start off the same, the only thing about them that will systematically differ is
how we treat themIf, after we treat them differently, they respond differently, it will be because of the different ways
they were treated.
During an experiment
• Groups start off the same
• Groups are TREATED DIFFERENTLY
• Responses thought to be effected by the different treatments are measured
• If the average response in the groups is now different from each other, the differences may well have been caused by the different ways the groups were treated.
In the simplest experiments• The groups are exposed to treatments that vary on a single
dimension.
• The dimension that differs is called the independent variable (because, given that who gets which treatment is random, differences in treatment during the experiment are unrelated to or “independent of” pre-existing differences).
• Relevant responses (called dependent variables) are then measured to see whether the independent variable caused differences among the treatment conditions beyond those expected given ordinary sampling fluctuation.
Analysing data from an experiment• Of course the groups will always differ somewhat
from each other on anything you measure due to sampling fluctuation.
• These are just random difference, you can afford those
• In 3 groups, one will score highest, one lowest and one in the middle just by chance.
• So the simple fact that the groups differ somewhat is not enough to determine that the independent variable, the different ways the groups were treated, caused the differences.
• We have to determine whether the groups are more different than they should be if only sampling fluctuation is at work.
Example: ECT, Pills or Psychotherapy?• We know that for severe, psychotic depression,
electroconvulsive therapy (ECT) is the most effective treatment.
• A managed care company wants everyone hospitalized for depression to be given ECT, even those with only moderately severe depression.
• They say that antidepressant medication and cognitive therapy take longer to work, require maintenance treatment and are ultimately more expensive, so everyone should get shock.
What can you do about it?
• Just because they can plausibly say that ECT is better, doesn’t mean it is so.
• Would you like to be given a choice if the treatments are equally effective, though one costs your insurance company less than the others.
• How about running an experiment meant to show that medication and psychotherapy work as well or better than ECT with moderately depressed patients, that there are no differences in the effectiveness of the differing forms of treatment.
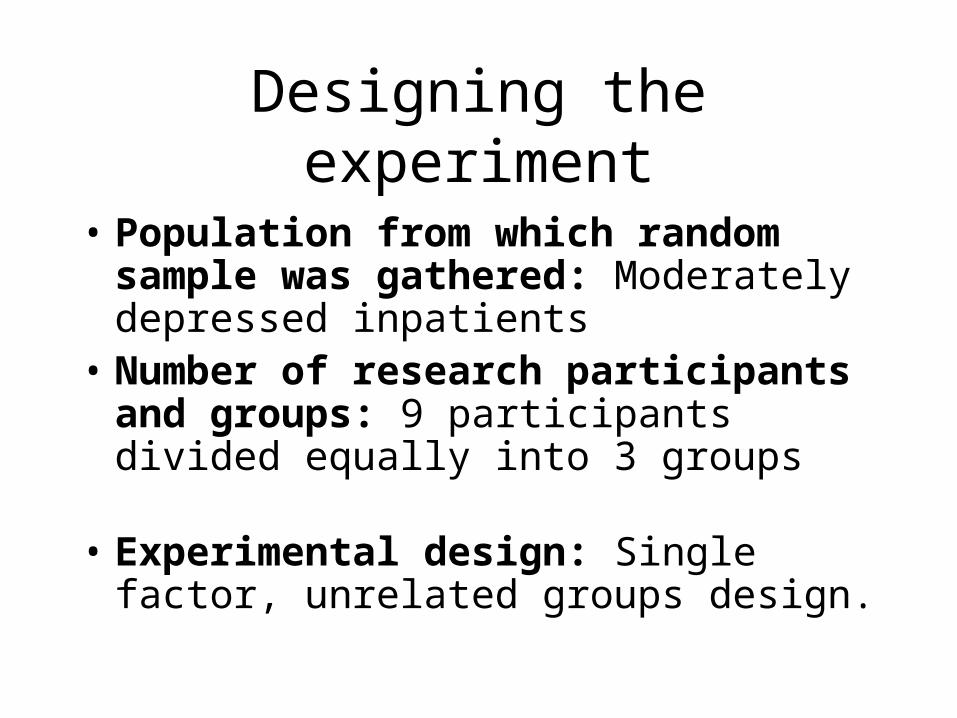
Designing the experiment
• Population from which random sample was gathered: Moderately depressed inpatients
• Number of research participants and groups: 9 participants divided equally into 3 groups
• Experimental design: Single factor, unrelated groups design.
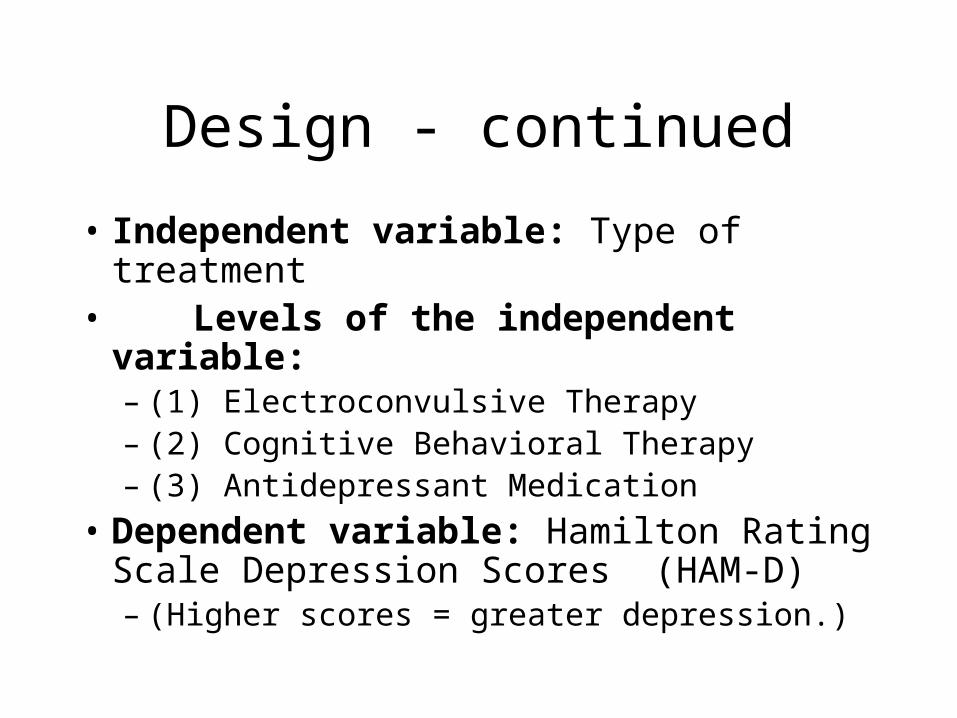
Design - continued
• Independent variable: Type of treatment • Levels of the independent variable:
– (1) Electroconvulsive Therapy– (2) Cognitive Behavioral Therapy– (3) Antidepressant Medication
• Dependent variable: Hamilton Rating Scale Depression Scores (HAM-D) – (Higher scores = greater depression.)
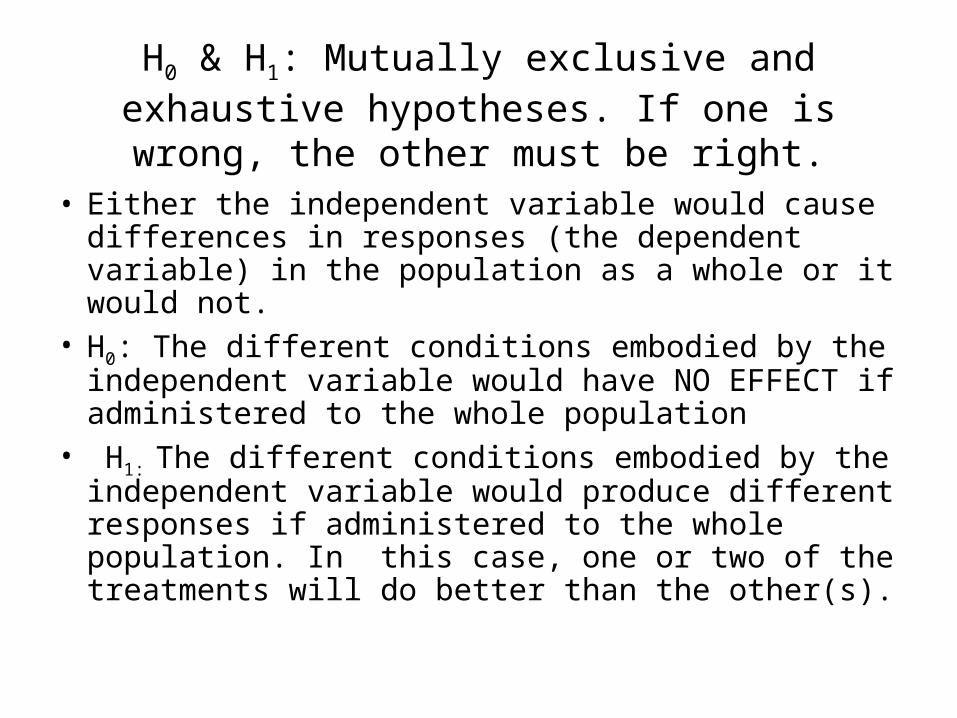
H0 & H1: Mutually exclusive and exhaustive hypotheses. If one is wrong, the other must be right.
• Either the independent variable would cause differences in responses (the dependent variable) in the population as a whole or it would not.
• H0: The different conditions embodied by the independent variable would have NO EFFECT if administered to the whole population
• H1: The different conditions embodied by the independent variable would produce different responses if administered to the whole population. In this case, one or two of the treatments will do better than the other(s).
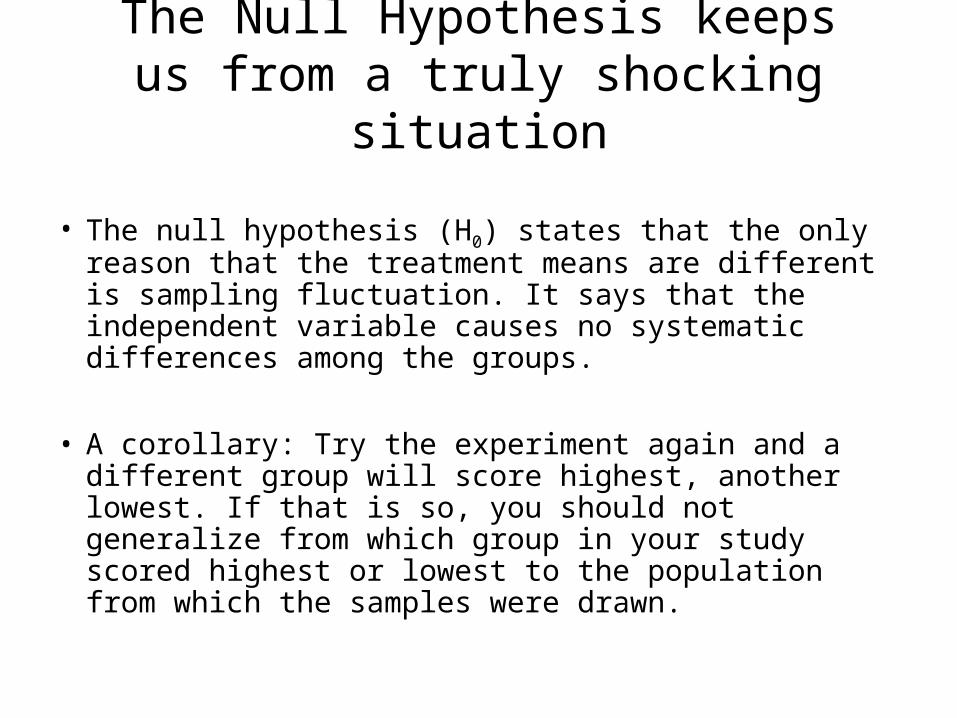
The Null Hypothesis keeps us from a truly shocking situation
• The null hypothesis (H0) states that the only reason that the treatment means are different is sampling fluctuation. It says that the independent variable causes no systematic differences among the groups.
• A corollary: Try the experiment again and a different group will score highest, another lowest. If that is so, you should not generalize from which group in your study scored highest or lowest to the population from which the samples were drawn.

The null hypothesis must be retained or rejected
• The way we do statistical tests on experimental data is the same way we did it in Ch. 6 and Ch.8
• H0 make a prediction of what our sample statistic will be.
• We establish a 95% confidence interval for that prediction.
• We see whether the sample statistic falls inside or outside the confidence interval.
• Inside = retain H0
• Outside = reject H0, look around for another possible explanation, probably accept H1.
THE ONLY HYPOTHESIS TESTED STATISTICALLY IS THE NULL HYPOTHESIS.
• Therefore: any statistical statements made can only be about the null hypothesis.
• In analyzing the results of an experiment, you must either find that your results are statistically significant and (because H0 has predicted badly) declare the null false and reject it.
• Or you can get nonsignificant results, fail to reject the null, and be unable to extrapolate from the differences among your experimental (treatment) groups to the population.
The Experimental Hypothesis• The experimental hypothesis (H1) states that
between group differences on the dependent variable are caused by the independent variable as well as by sampling fluctuation.
• Unlike the null, H1 is different in each experiment.
• The experimental hypothesis tells us the way(s) we must treat the groups differently and what to measure.
• Therefore the experimental hypothesis tells us (in broad terms) how to design the experiment.
YOU NEVER TEST THE EXPERIMENTAL HYPOTHESIS
STATISTICALLY.• You can only examine the data in light of the
experimental hypothesis after rejecting the null.
• Good research design makes the experimental hypothesis the only reasonable alternative to the null.
• Accepting the experimental hypothesis is based on good research design and logic, not statistical tests.
Remember:• If the groups start off the same, then the
subsequent differences in measured responses may be due to the differing treatments the groups receive as well as to sampling fluctuation.
• The independent variable (IV) consists of the treatment conditions. Note that since participants are randomly assigned to groups, who gets a treatment is unrelated to (independent of) pre-existing differences
• The dependent variable consists of relevant responses that are observed.


![Correlational Research - Article[1]](https://static.fdocuments.net/doc/165x107/577d2ba41a28ab4e1eaaf991/correlational-research-article1.jpg)